1. Introduction
Disease mapping has been historically considered as one of the most important public health issues, derived from an understanding of the relationship between health and location. Understanding this relationship has attracted the attention of scientists and researchers for decades [
1,
2]. The actual start of using the disease mapping method was in 1854, when Dr. Snow mapped a cholera outbreak that hit the city of London, England [
1,
3,
4]. However, one of the most useful functions of GIS in public health is its mapping outputs [
5]. Disease mapping technology, has been evolving remarkably, is one of the most important GIS technologies [
6]. Nowadays, this technology is increasingly being used as an effective tool in disease surveillance by GIS [
7].
Studies on the geographical distribution of diseases can be categorized into three main classes: disease mapping, disease clustering and ecological analysis. GIS-based disease mapping depends on identifying a number of aspects, the most important of which are locations of disease occurrence, patterns of disease spread, environmental risk factors that lead to disease spread and socio-economic data, in order to analyze spatial relationships within the affected area [
8,
9]. GIS-based disease clustering studies aim to evaluate whether a disease is clustered geographically, and, if so, the locations of the clusters. Moreover, these types of studies are based on an examination of potential environmental risk factors that may appear at a specific location and represent a potential hazard, such as the risk of pollution [
10]. Ecological analysis studies are relevant within epidemiological research, as they focus on analyzing the geographical distribution of disease in relation to explanatory covariates, usually at an aggregated spatial level [
11].
Healthcare studies rely heavily on GIS-based mapping and clustering technologies to draw a general visualization that aims to control a spread of diseases and identify disadvantaged populations at a geographical level [
12,
13]. Several studies have shown that GIS is a useful tool for the mapping and clustering of disease. For example, Gould and Wallace [
14] used GIS to map cases of HIV/AIDS in the United States in the 1980s. They mapped the locations of disease occurrence and patterns of potential spread. They also tried to control the disease using the clustering method. In another example, Braga et al. [
15] mapped lung cancer disease in two Italian cities to determine disease rates at the level of urban clusters using Kernel and Bayesian methods. Eisen and Eisen [
16] discussed how to use GIS to prevent and control diseases such as malaria and West Nile virus. In addition, Rasam et al. [
17] used GIS-based cholera disease mapping to identify patterns of disease spread in the Sabah area of Malaysia. The disease mapping relied on the use of the cohort technique to determine the pattern of disease spread. As a result, it became clear that the disease was spreading from person to person through contaminated water. Photis [
18] investigated GISs that can deal with healthcare issues by using disease mapping technology that can improve planning policies and assess possible intervention scenarios. Furthermore, in the United States, a GIS-based measles disease mapping method was used to detect the locations of disease occurrence and determine the spread patterns. As a result, it became clear that disease rates were high in areas with children who had not received vaccination against the disease. The disease mapping method contributed to identifying areas lacking health services and finding the best locations for these services, especially after the maps showed the locations and number of disease cases, as well as the time period related to the disease spread [
19].
At the analysis level, to obtain the precise outputs for disease mapping, the quality of the spatial data used in the analysis should be evaluated based on a number of elements, i.e., (1) positional accuracy, (2) thematic accuracy, (3) temporal accuracy, (4) completeness, (5) logical consistency, and (6) usability [
20]. Disease incidence data may be represented differently when mapping disease cases or counts within tracts, compared to mapping disease structures based mainly on estimates of complex models [
11]. The geographical incidence of disease uses, as its fundamental unit of observation, the locations of cases of the disease being studied. Important data and information about environmental risks and potential exposure can be identified through residential addresses [
21]. The simplest possible mapping form is the depiction of disease rates at specific sets of locations. For events, the locations of case events should be mapped. To count within tracts, there should be a representation of the number of events within the tracts of arbitrary areas with the locations and numbers of cases events [
22].
A set of analytical and statistical methods may be performed by GIS software for disease mapping and clustering. These methods can support research investigations of the spatial distribution of diseases and its spread by integrating and modeling spatial data in a way that helps pinpoint cases and exposures, characterize spatial trends, identify disease clusters, correlate different sets of spatial data, and test statistical hypotheses [
23]. The most important analytical and statistical methods of disease mapping and clustering within the GIS software are: (1) a kernel density estimation method that is used to produce spatial distribution maps of epidemic diseases by modeling disease risk prediction [
24], (2) a weighted standard deviational ellipses method that can compare the spatial distributions of the diseases and identify their possible spatial directions, and (3) a hotspot analysis method that is used to calculate the Getis–Ord Gi* statistic to identify where the selected health conditions will be more concentrated [
25,
26].
Some analytical and statistical methods have been applied to analyses of health services using GIS in Jeddah, Saudi Arabia. For example, Murad [
27] discussed the application of GIS for the catchment area of health centers in Jeddah using the straight-line allocation (SLA) technique, which defines health center catchment areas based on a closest proximity approach. Murad [
28] measured the accessibility to public health centers in Jeddah by using the Euclidean distance and drive-time methods. A cumulative model was created to determine the level of accessibility in each district of the city depending on estimating distance from a road and from health centers. Furthermore, Murad [
9] used GIS mapping for hospital planning in Jeddah and produced several thematic maps related to hospital location and analysis, including classifications of health supply and accessibility to hospitals locations. All previous GIS applications for health in Jeddah only covered the supply side of health services. No study has mapped health disparities based on the location of diseases in Jeddah. To fill this gap, we outline new research focusing on patient distribution and disease disparities in Jeddah. The paper seeks to answer the questions of how GIS can be used to map disease locations in Jeddah city, and how this technology can be applied to analyze spatial clustering and determine whether any unusual clusters of health conditions exist in Jeddah, and to identify which places have unusually high or low prevalences of diseases.
2. Materials and Methods
2.1. Study Area
Jeddah is located on the west shore of Saudi Arabia, 12 m above sea level. It is approximately 949 km from the capital city Riyadh and 79 km from the holy city of Makkah. The area of Jeddah is approximately 1765 km2. Over time, the city has expanded its services, including transportation, communication, and health projects, as well as public utilities like water, electricity, and other infrastructure projects. Demographically, Jeddah is populated by approximately 4.1 million people (2015), which makes it the second largest city after the capital city, Riyadh. The average household size is 5.2, and 41% of the population are aged 23 and below, while 3% are aged 65 or older. Health services in Jeddah city are provided through three main sectors: the Ministry Of Health network of hospitals and primary healthcare centers that are distributed throughout the city, other governmental institutions, and the private sector. This paper covers only primary healthcare centers that are operated by the Ministry of Health.
2.2. Methods for Disease Mapping and Clustering in Jeddah City
This study seeks to create a GIS application to produce mapping and cluster modeling of three diseases in Jeddah, Saudi Arabia: diabetes, asthma, and hypertension. To build this application, we firstly captured three GIS coverages: the road network, health center locations, and population districts. The nonspatial data linked to those coverages included the health capacity, number of patients (diabetes, asthma, and blood-pressure), number of people living in each district of the city, and the population density of the district. Data concerning the three diseases were collected from the records of registered patients at the health centers in Jeddah. Secondly, several analytical and statistical models were used to map and cluster the three diseases in order to detect their various spatial patterns and identify the trend of their prevalence in Jeddah. An initial spatial analysis of the data was based on the use of classification tools provided by ESRI (Redlands, CA, USA), within the ArcGIS Software. These analytical tools clarified the spatial distribution patterns of diseases at the level of Jeddah districts. Several data classification methods can be used for GIS applications. These include defined interval, manual interval, equal interval, geometrical interval, Quantile, natural breaks, and standard deviation. The created data was classified using the natural breaks method, which is based on the Jenks Natural Breaks algorithm. The natural break method produces Class breaks that identify the best group similar values and maximize the differences between classes. Based on this classification method, the features are divided into classes whose boundaries are set where there are relatively big differences in the data values.
Moreover, we used an analytical function called standard deviational ellipses. This function can compare the spatial distributions of the three diseases and identify their possible spatial directions in a location such as Jeddah. A weighted standard deviational ellipse was selected based on the number of patients in each health center location. This tool provides a way of measuring the trend for a set of points or areas by calculating the standard distance separately in the x-, y- and z-directions. These measurements define the axes of an ellipse (or ellipsoid) encompassing the distribution of features. The ellipse is referred to as the standard deviational ellipse, since the method calculates the standard deviation of the x- and y-coordinates from the mean center to define the axes of the ellipse. This tool is useful for various GIS applications and studies including, for example, the mapping of distributional trends for a set of crimes, groundwater well samples for a particular contaminant, comparing the size, shape, and overlap of ellipses for various racial or ethnic groups, plotting ellipses for a disease outbreak over time, and examining the distribution of elevations for storms of a certain category.
For further investigation, this study used the Kernel model in the ArcGIS Software to determine clusters of health conditions at the level of Jeddah districts. The Kernel estimation can identify the spatial disparities of the three diseases. Finally, we used a statistical model called Getis–Ord Gi* to model the spatial diffusion of the selected diseases. The application of this model was based on the datasets available for each disease within each health center in Jeddah. The hotspot analysis tool in ArcGIS was used to calculate the Getis–Ord Gi* statistic for each feature in a dataset. The resulting z-scores and p-values defined where features with either high or low values clustered spatially. For statistically significant positive z-scores, the larger the z-score, the more intense the clustering of the high values (hot spots). For statistically significant negative z-scores, the lower the z-score, the more intense the clustering of the low values (cold spots). The hotspot analysis results are useful for determining where the selected health conditions will be more concentrated, and, eventually, which and where health services should be available.
3. Results
3.1. Spatial Distribution of Diseases
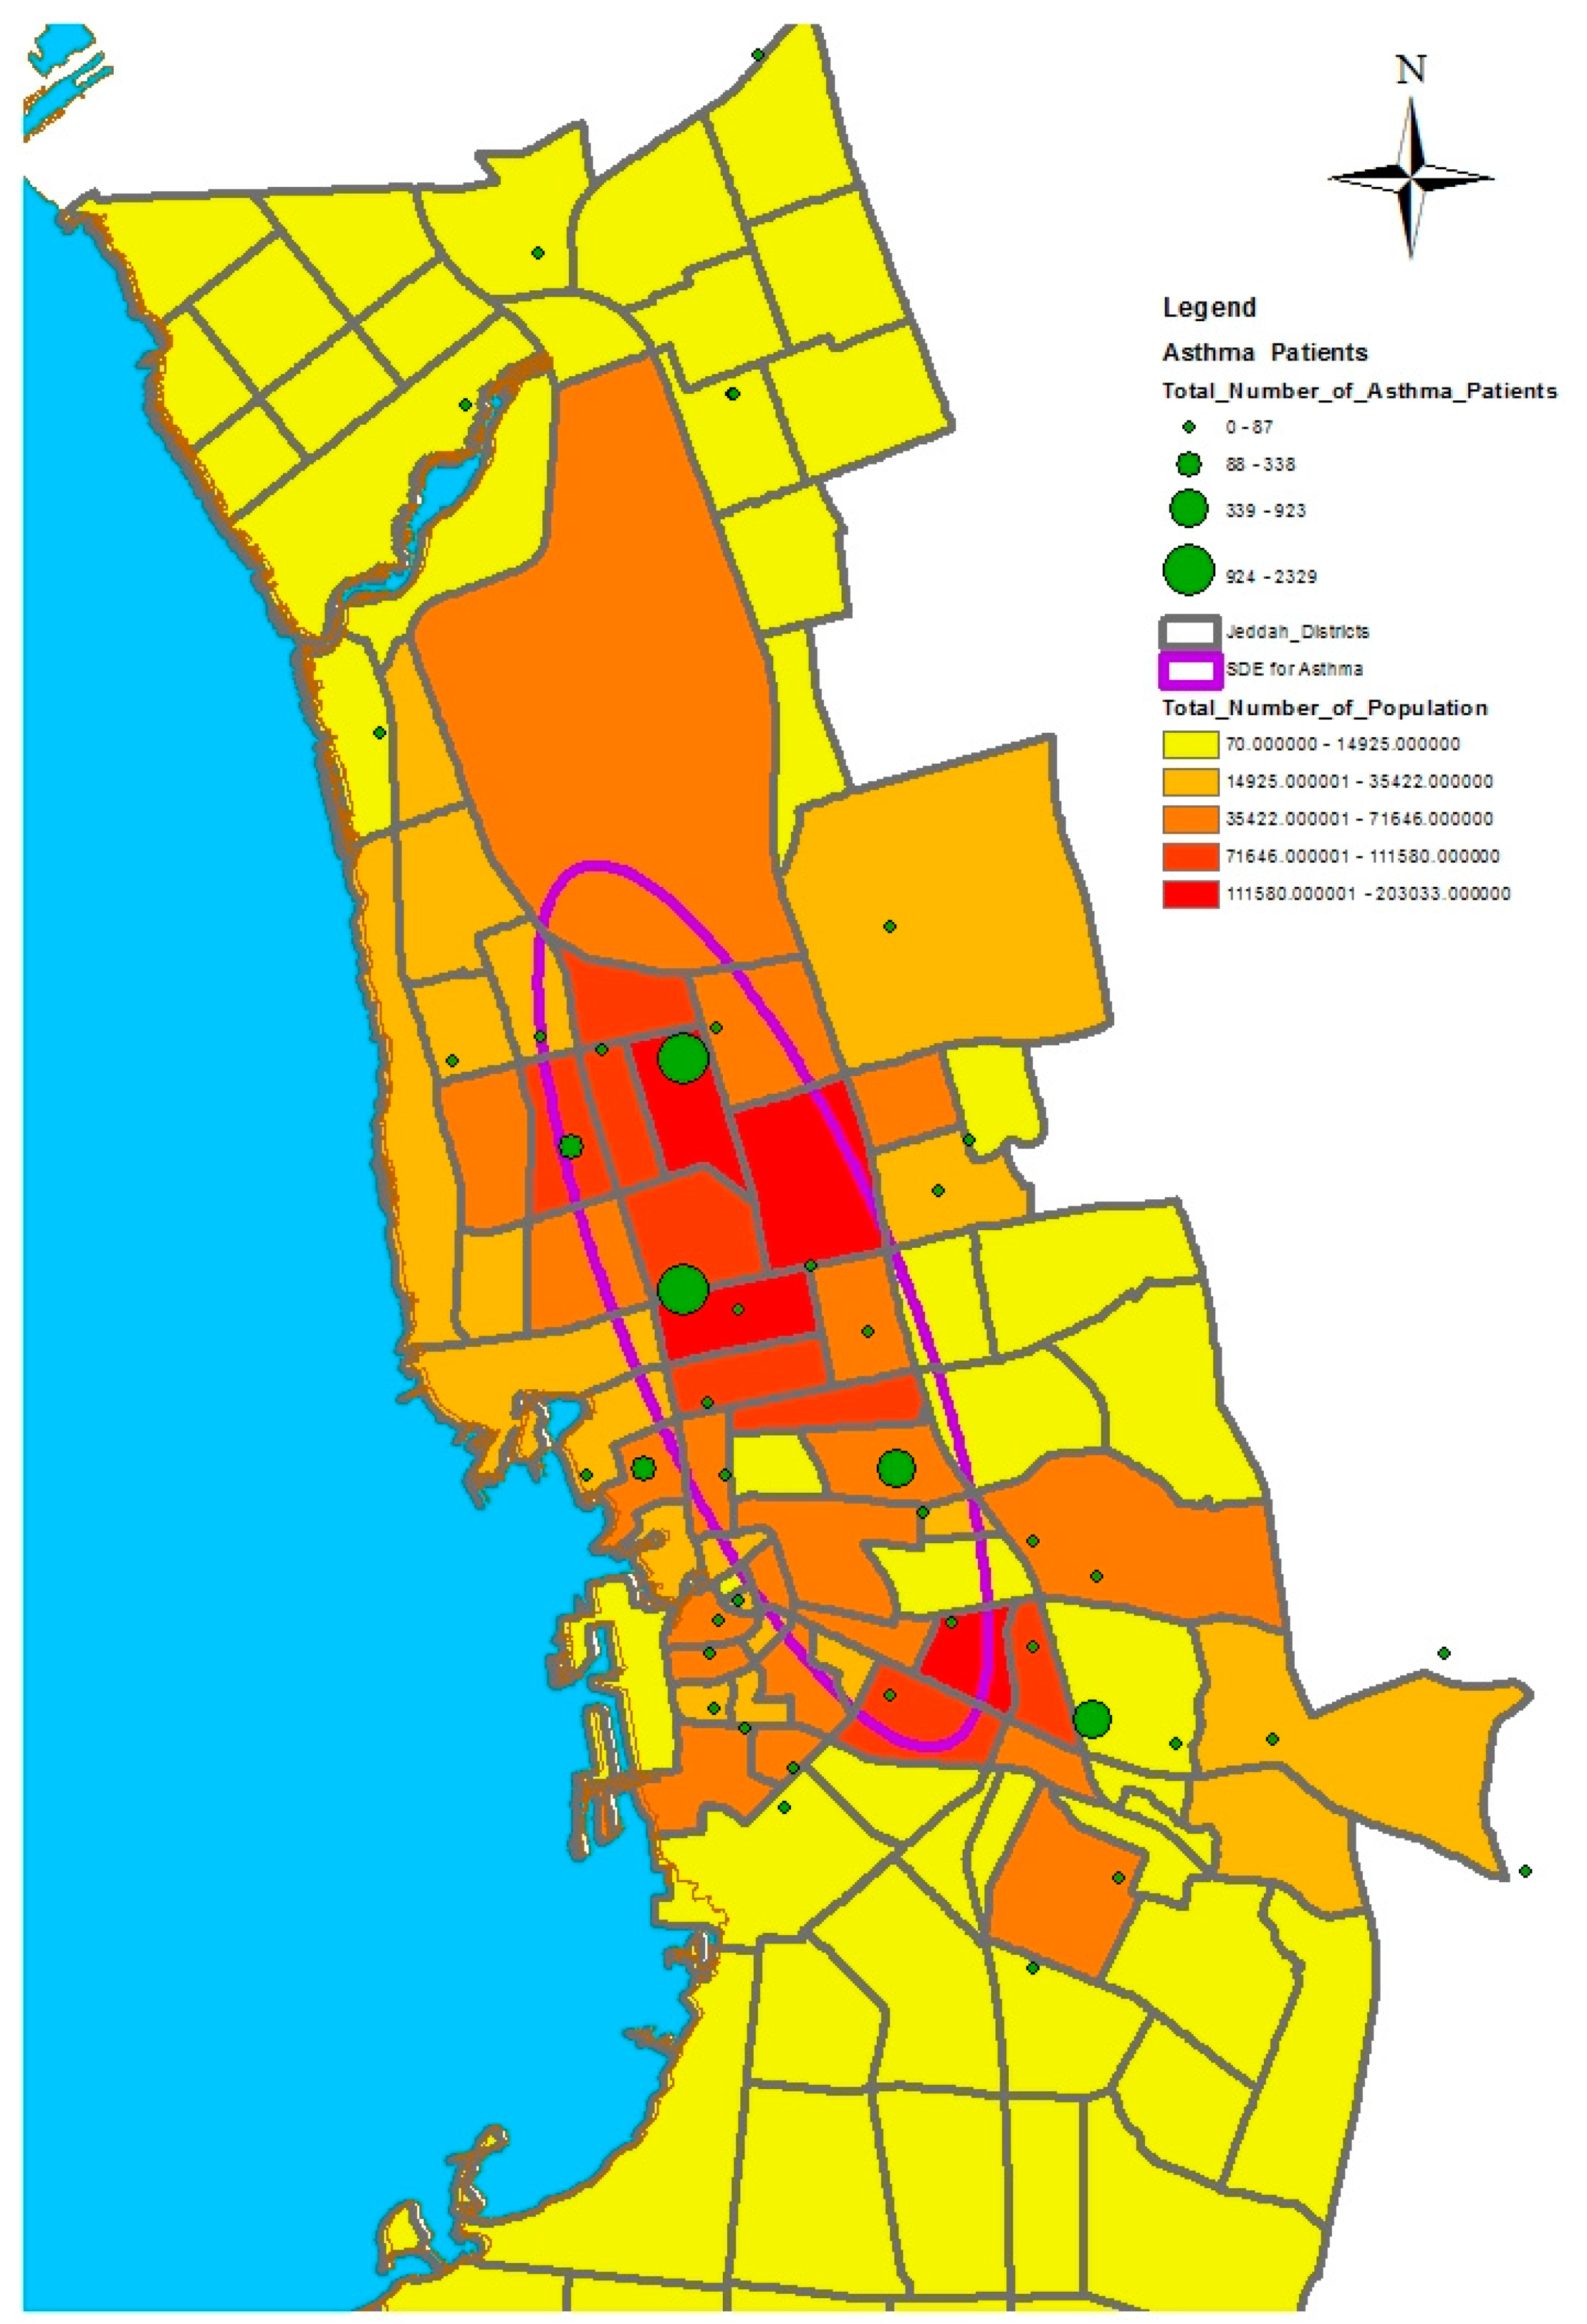
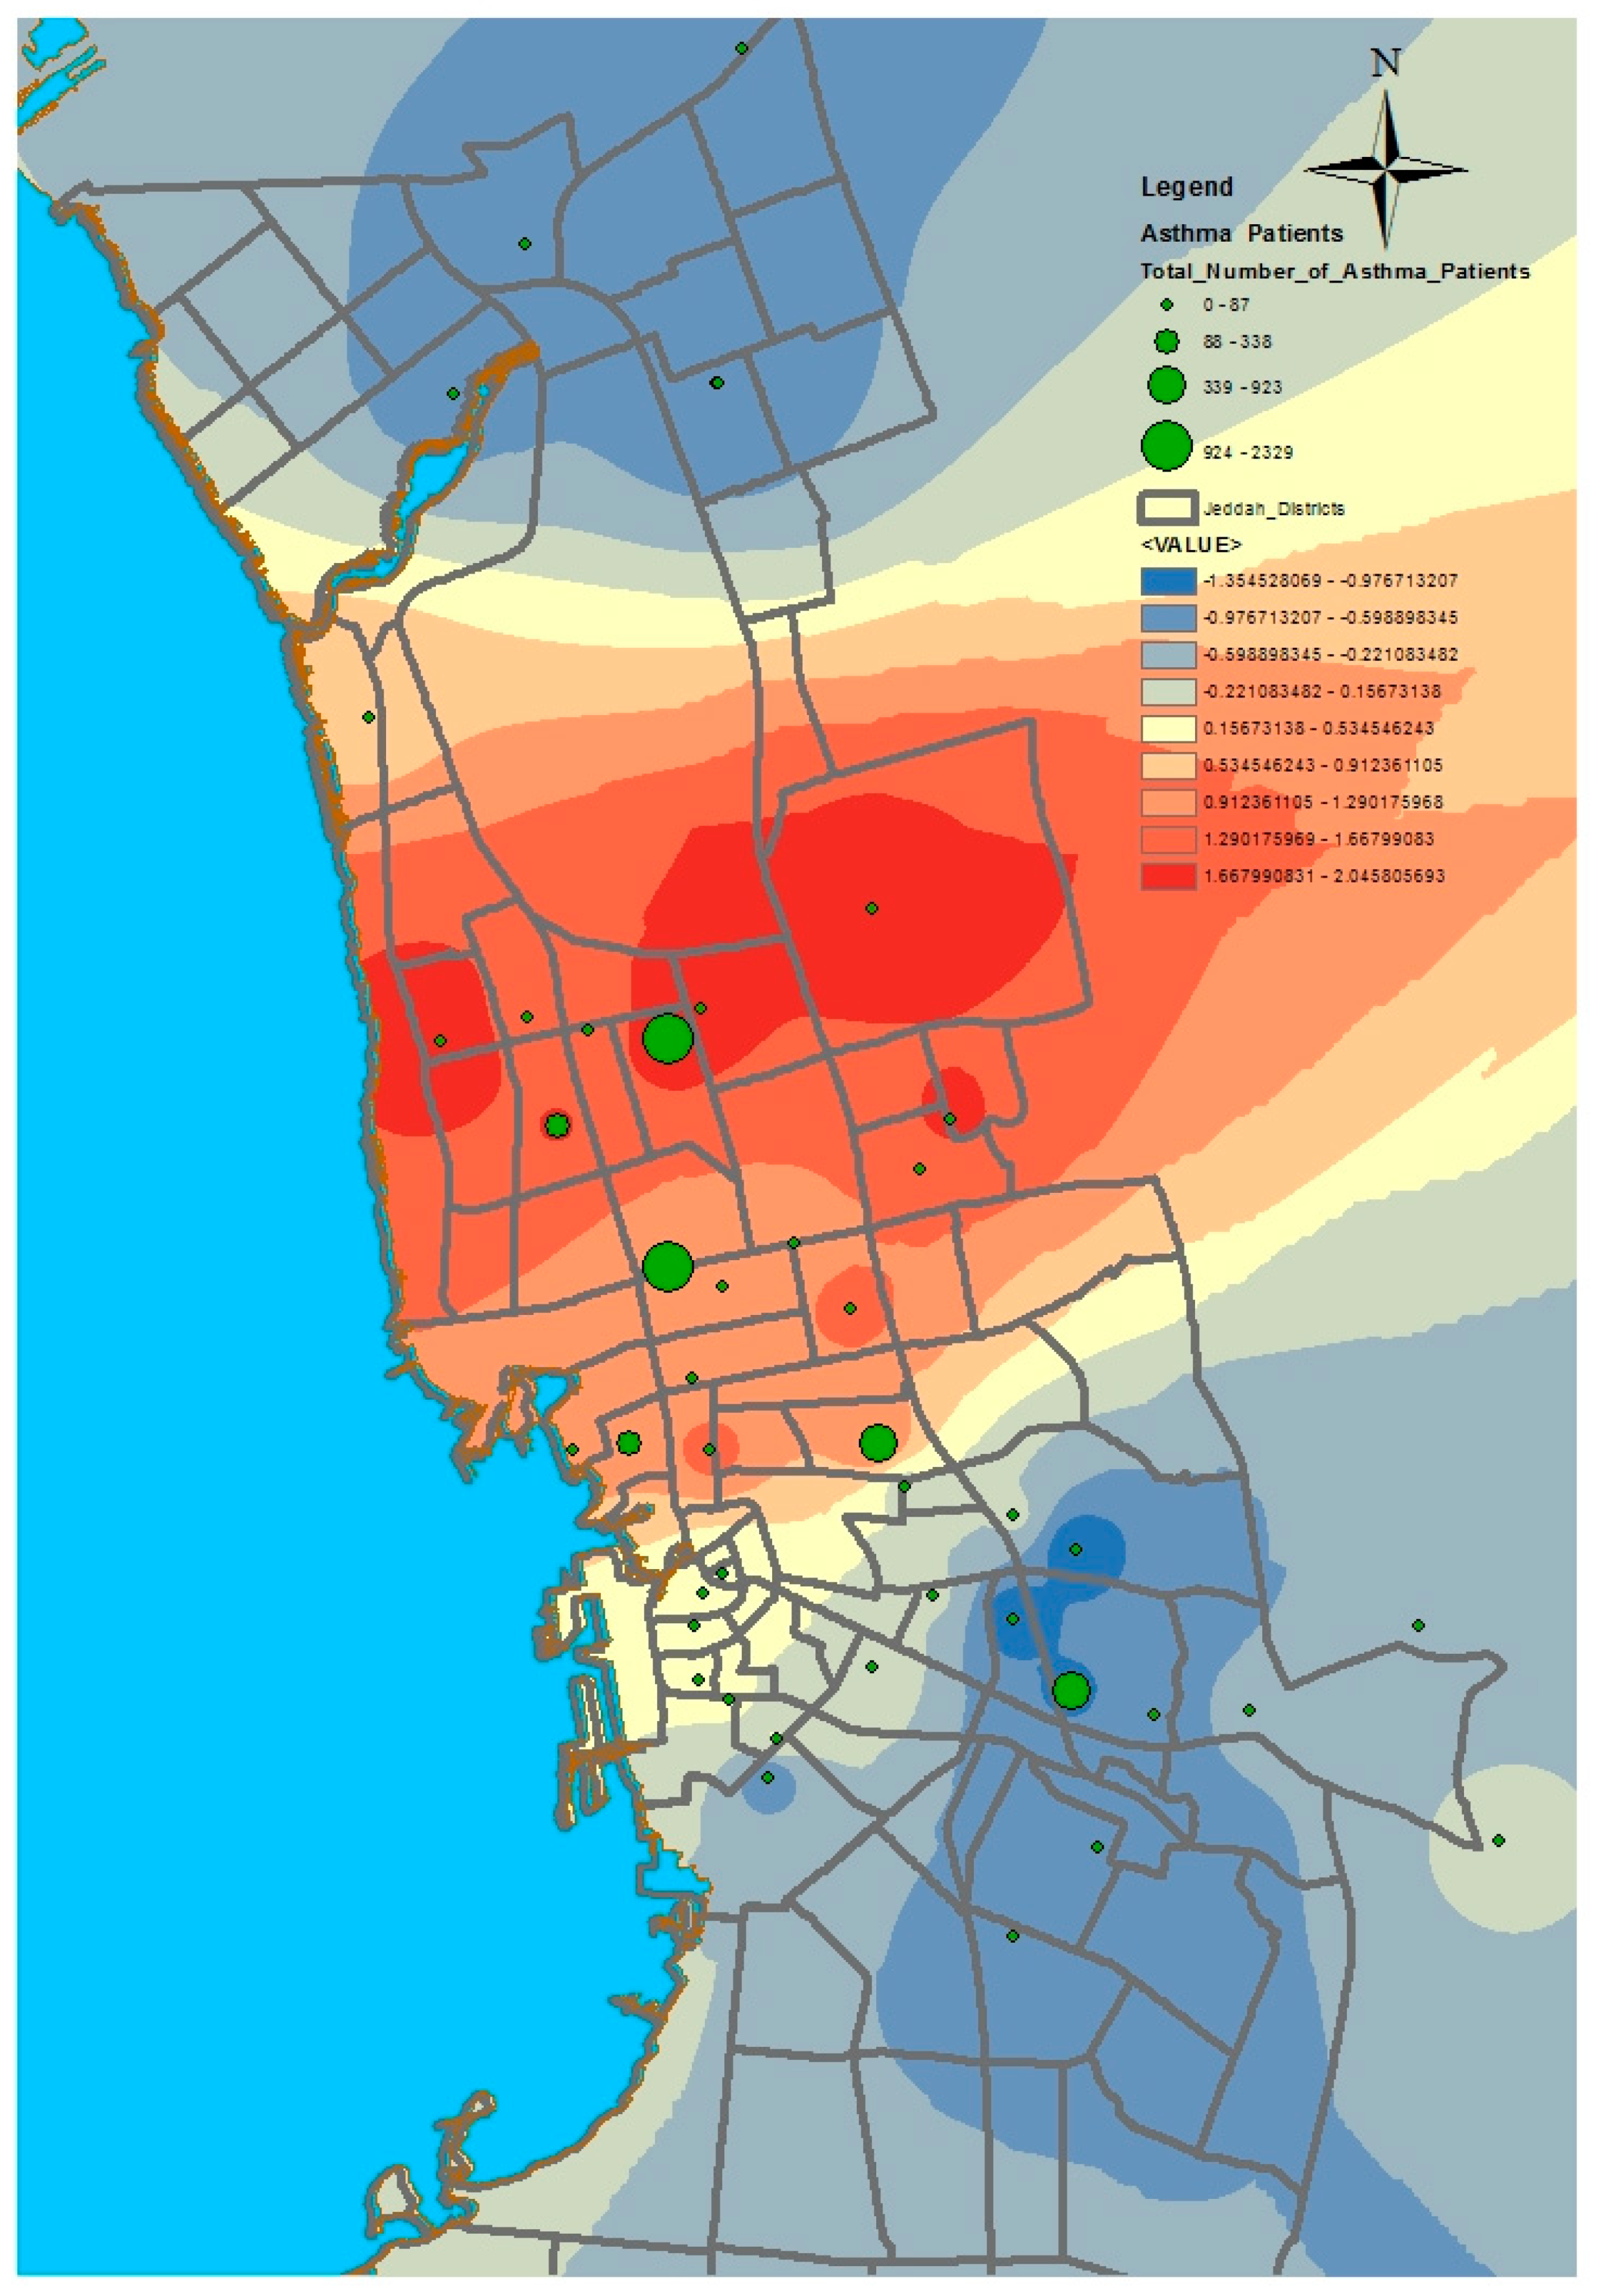
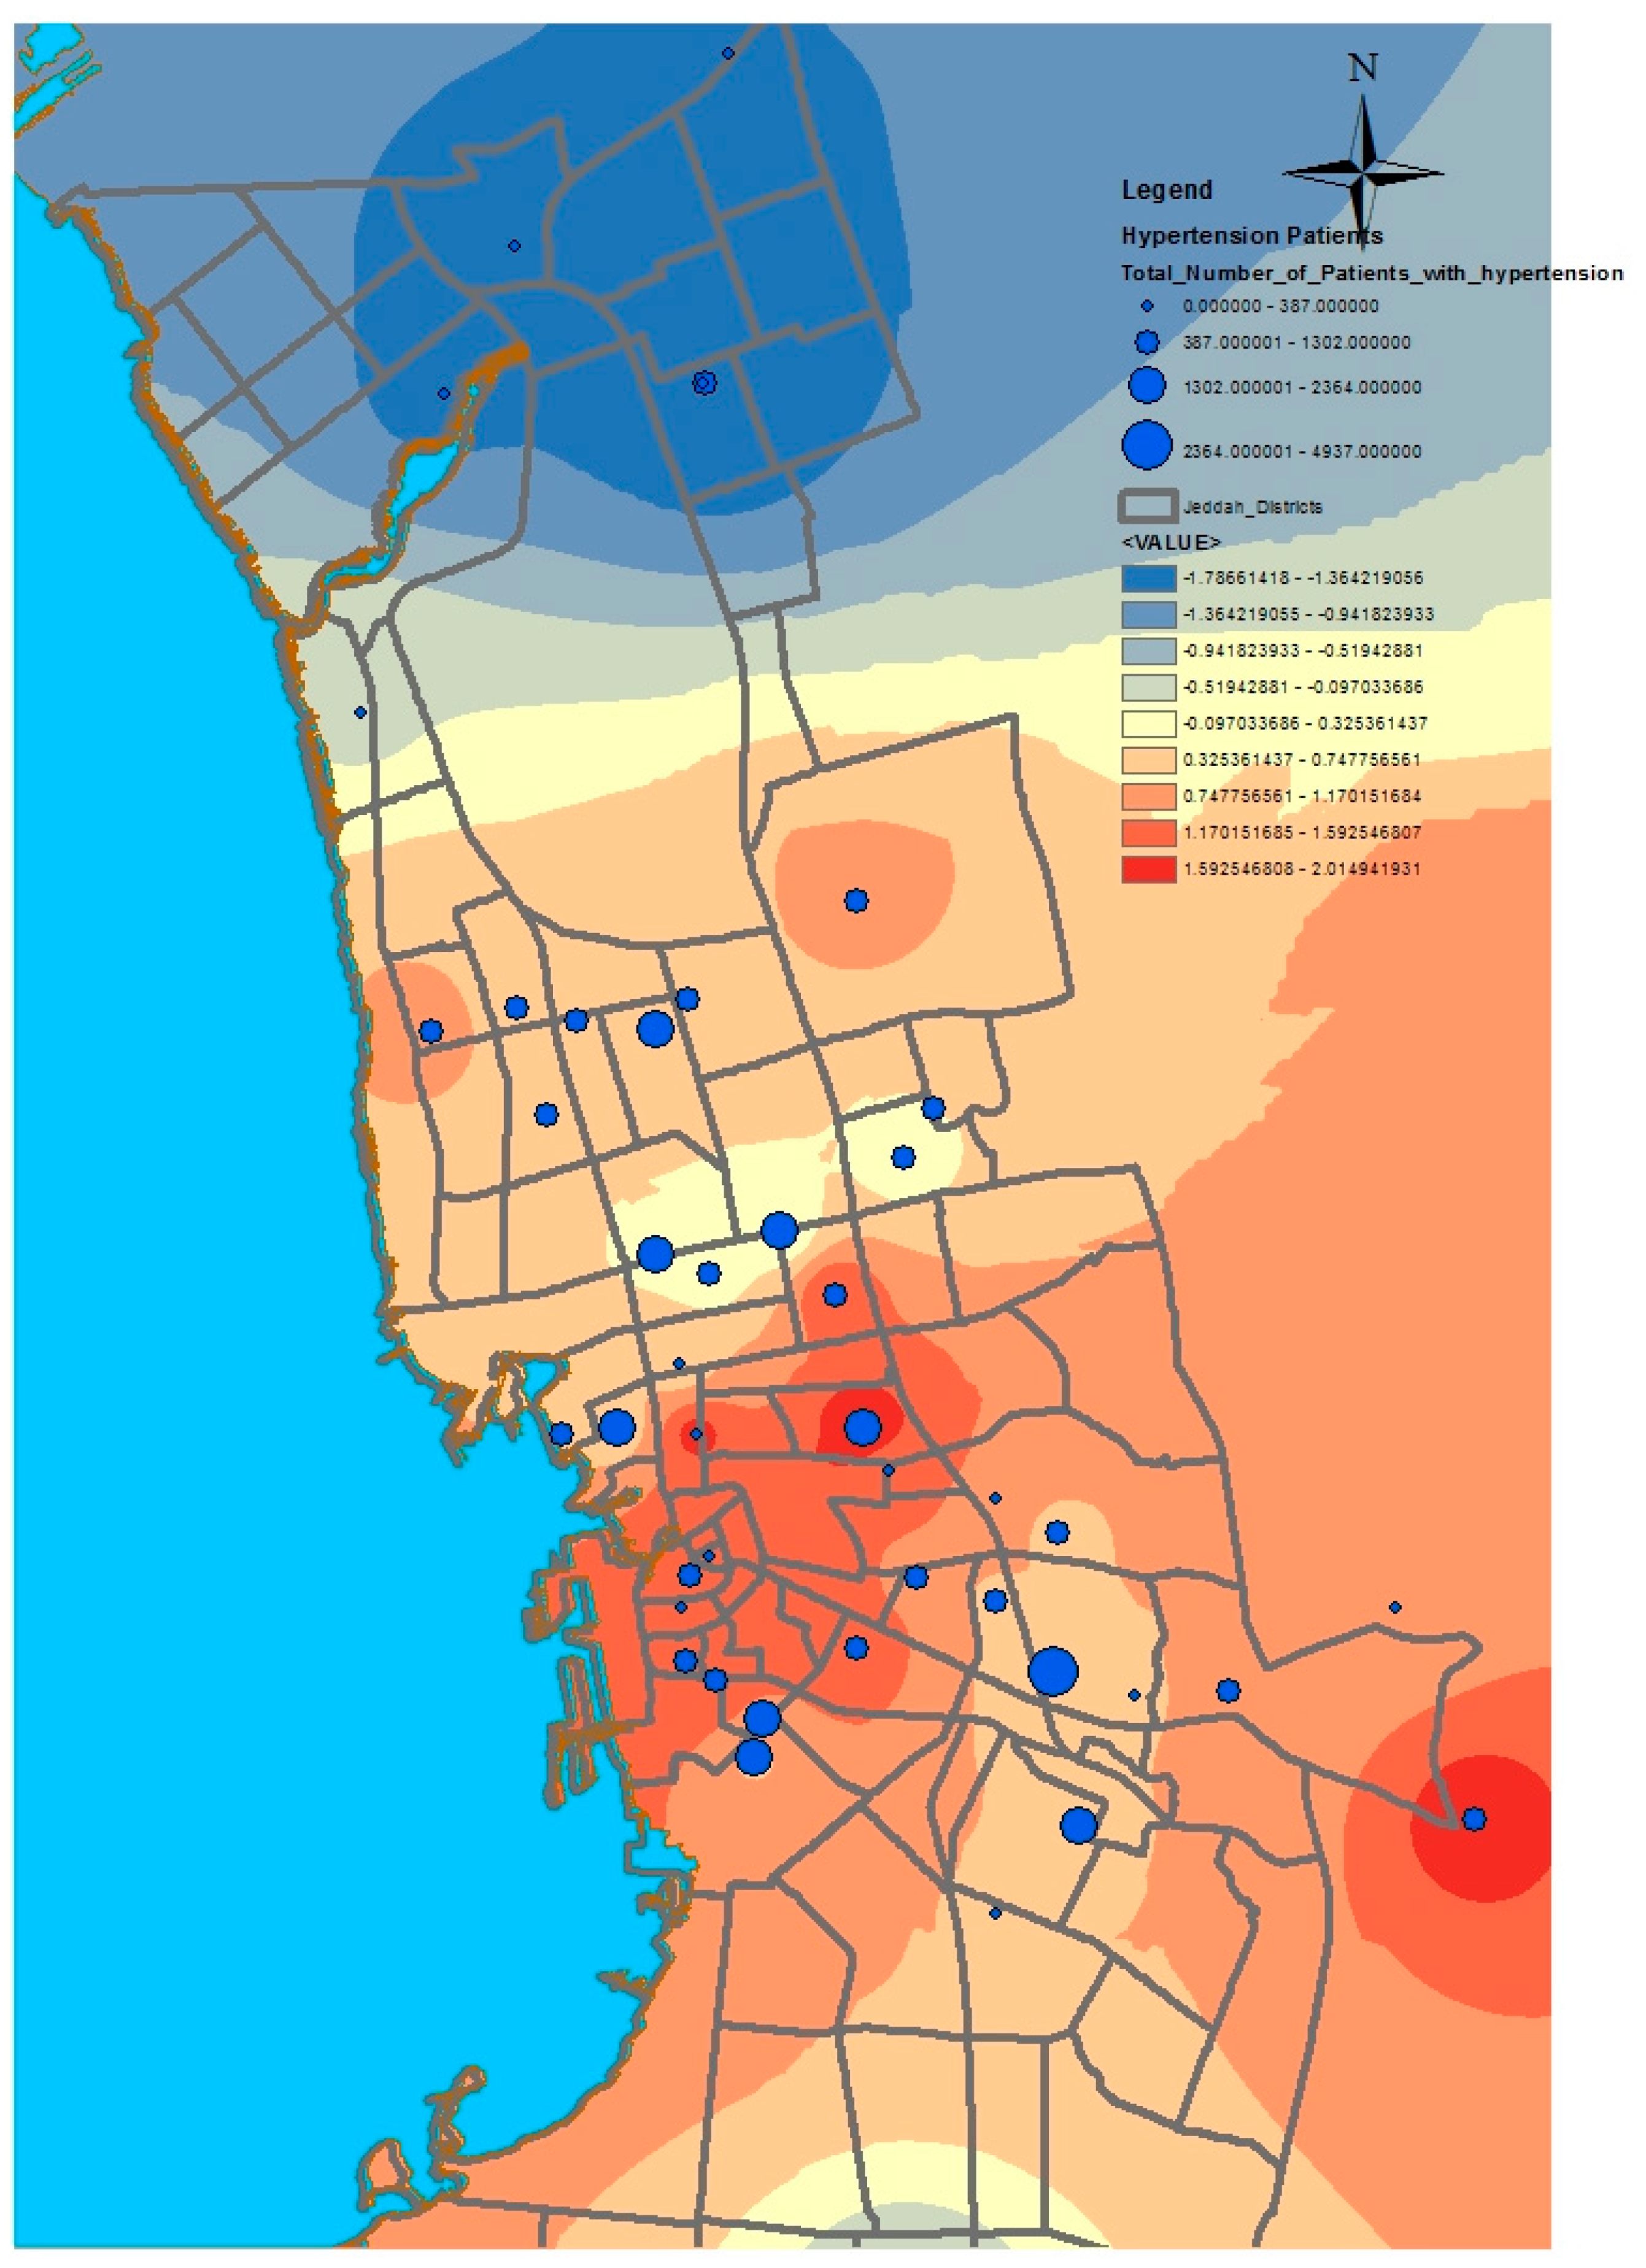
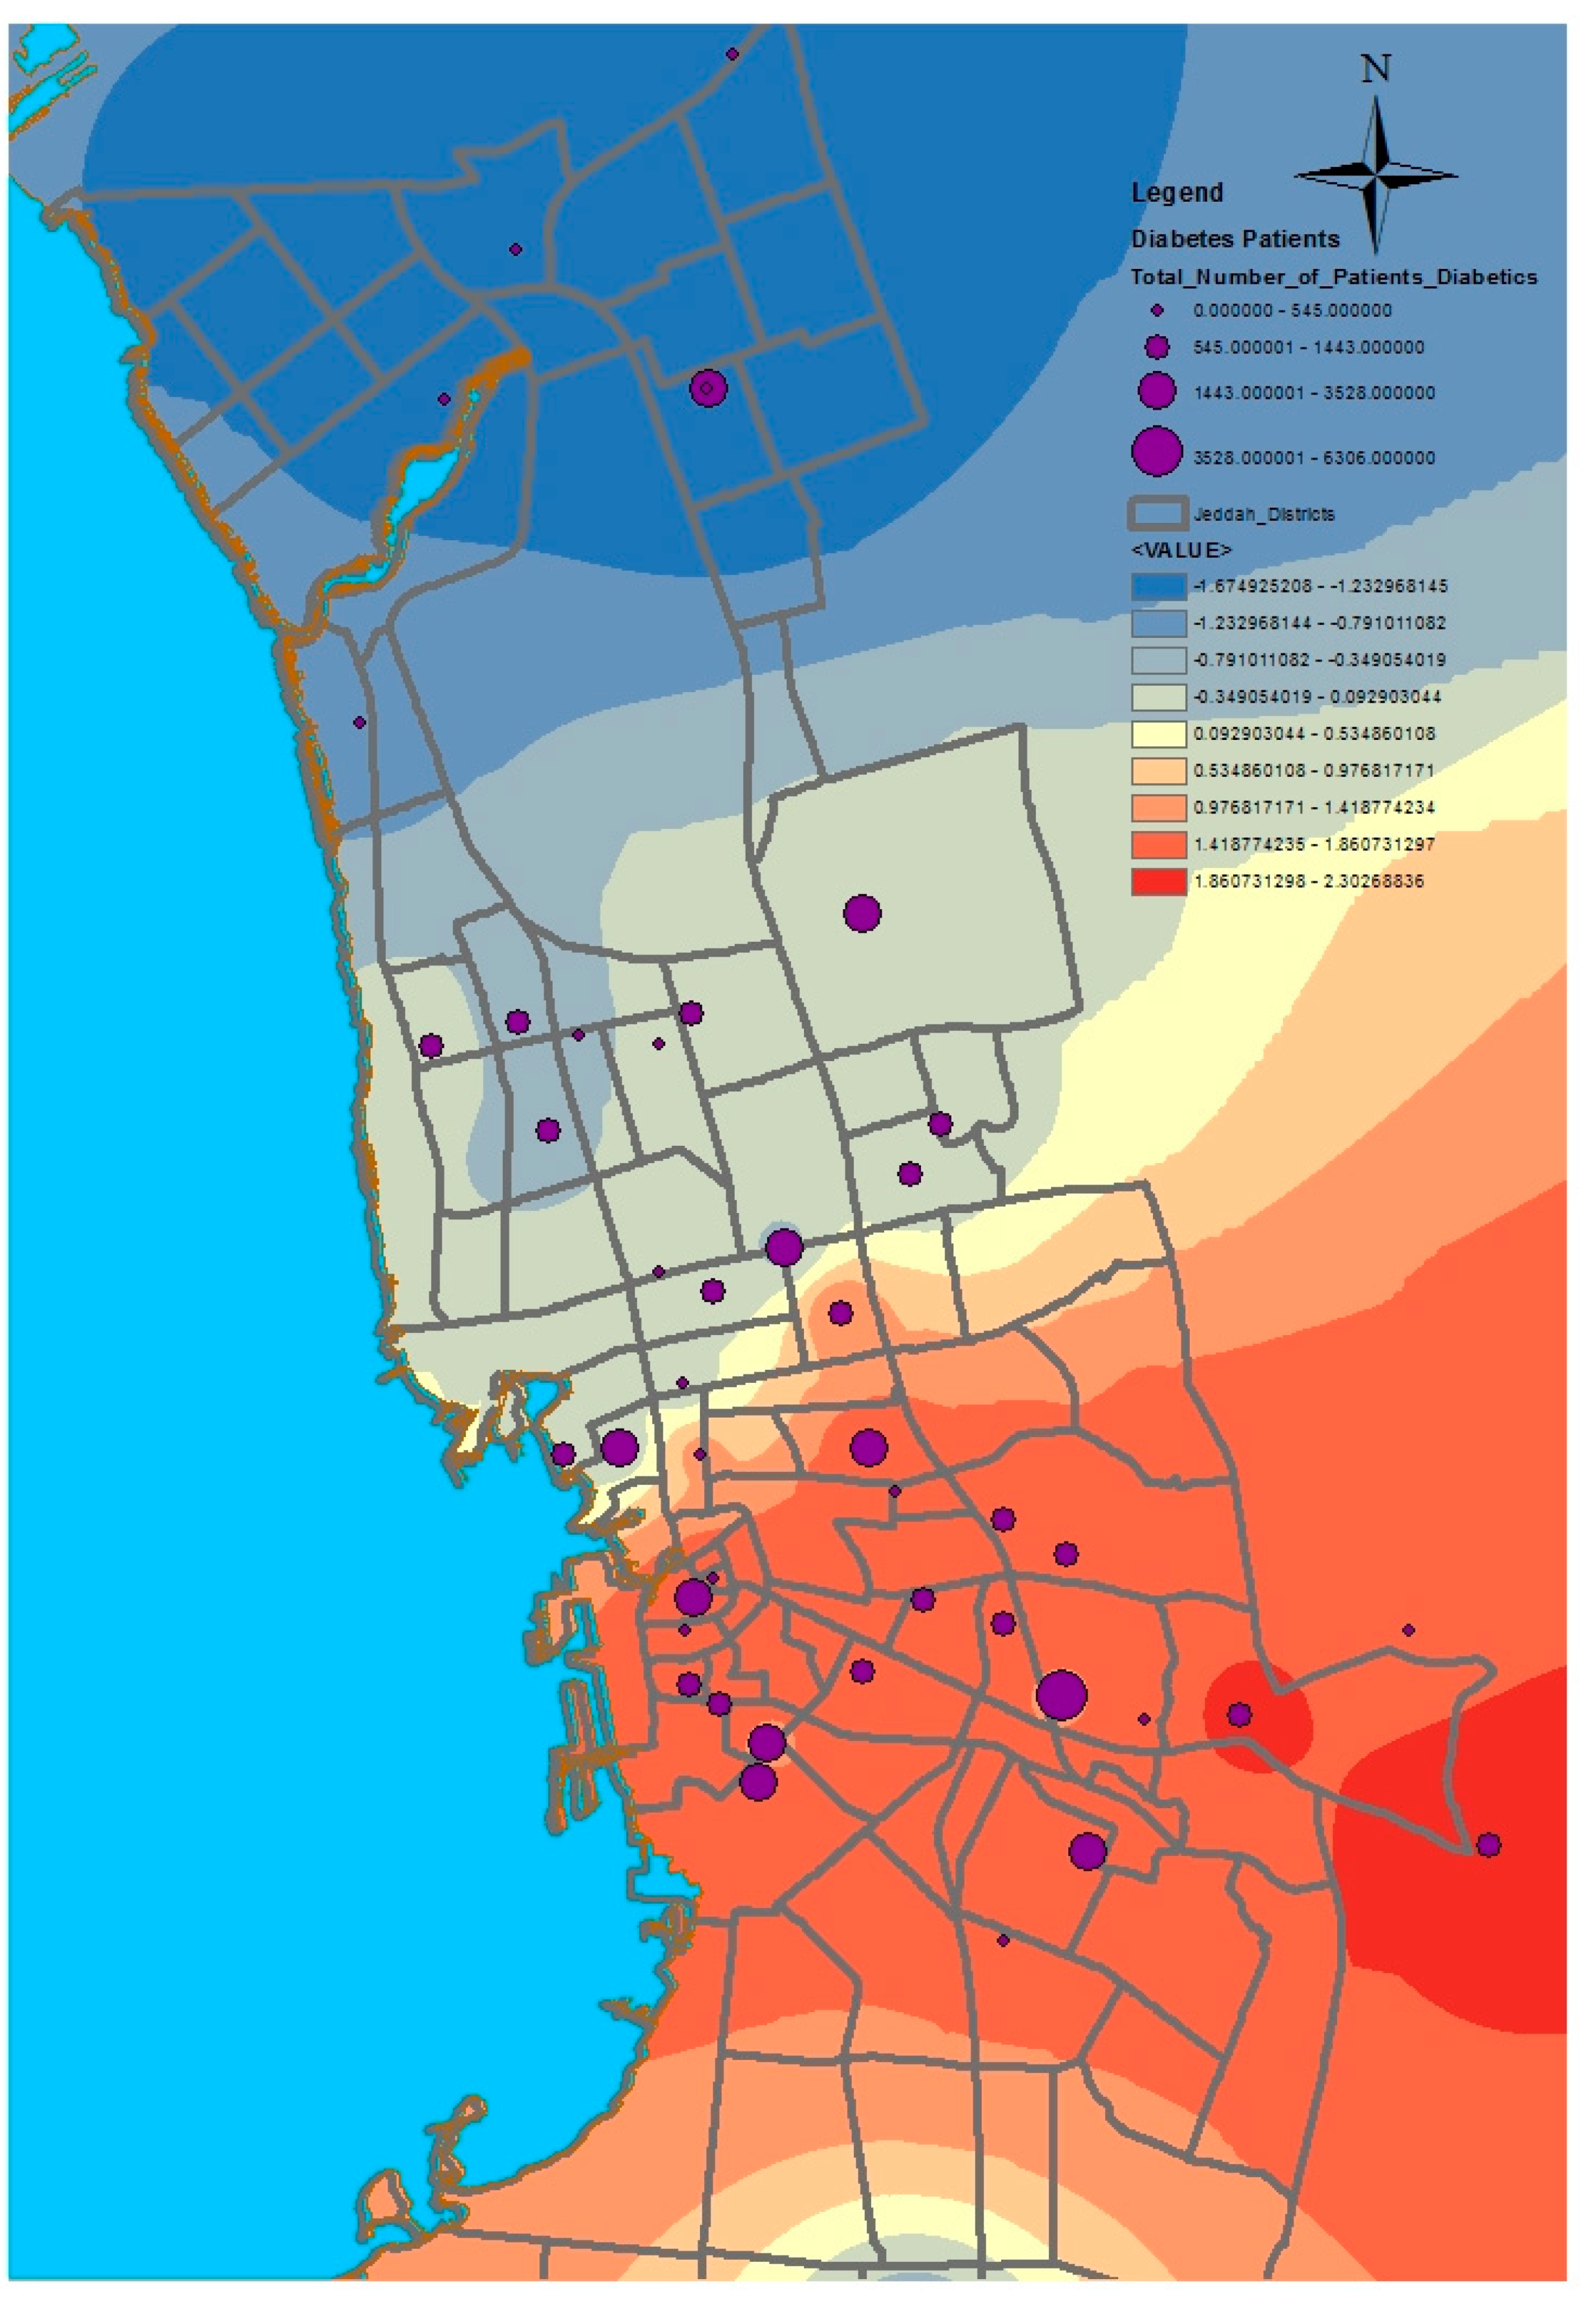
GIS can assist with updating and mapping health event prevalence, and is used as a supporting tool for surveillance and as a decision-making tool by which to control health conditions and disease. GIS can be used to map the geographical distribution of the prevalence of a disease, the trends of disease transmission, and spatially model the environmental aspects of disease occurrence. The created geo-database of health in Jeddah incorporates three types of health conditions: diabetes, asthma, and blood-pressure. For the first type of spatial analysis of these data, ArcGIS (produced by ESRI) data classification tools were used. These tools can help researchers understand the spatial distribution and classification of health conditions. Looking at the output of health event classification in
Figure 1,
Figure 2 and
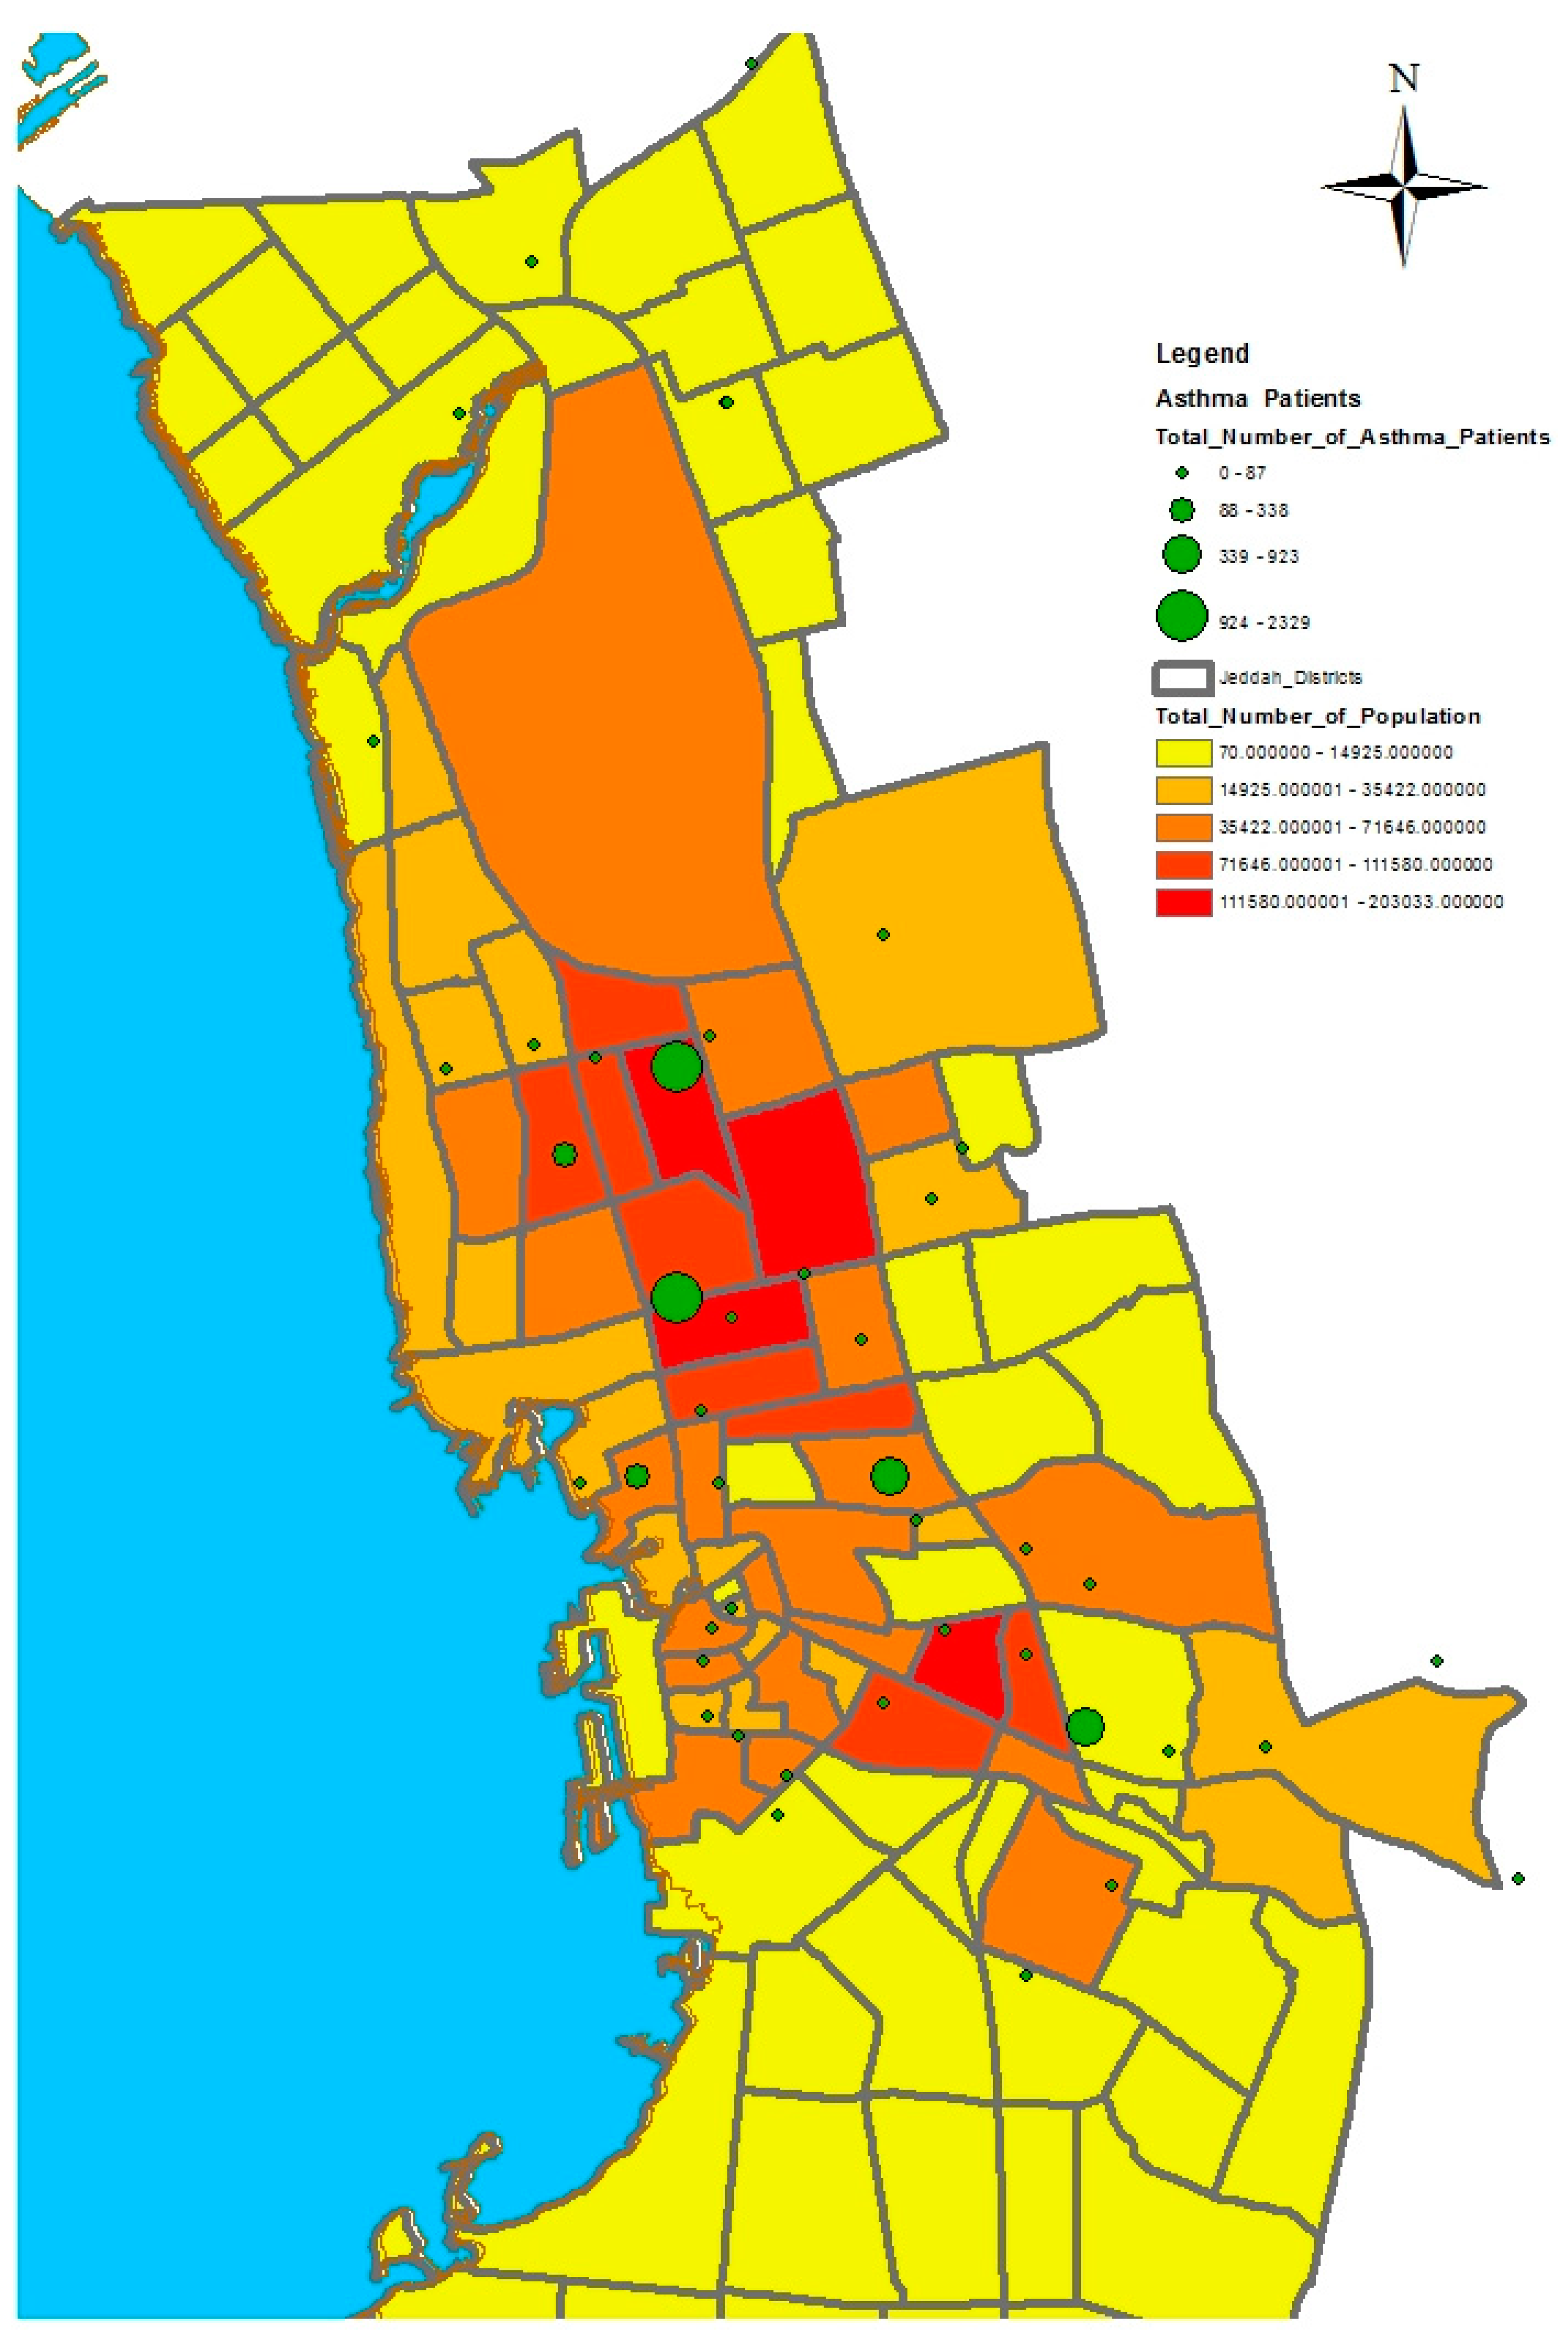
Figure 3, asthma patients are highly concentrated in the north east of the city. These parts of the city are considered highly urban developed locations, producing large number of asthma patients, as confirmed in studies that have suggested that there is more asthma in urban than in rural areas in many parts of the world. Early studies from Africa (South Africa, Ethiopia, Kenya, and Ghana) reported that populations living in rural areas (i.e., those not exposed to the effects of an urban or western lifestyle) experienced a very low burden of allergic disease, with a traditional, rural way of living providing a possible protective cover. Similar studies from Asia (China, Japan, Korea, India, and Saudi Arabia) confirmed the urban–rural gradient due to exposure to different allergens, air pollution, affluence, and diet in the development of asthma and allergy [
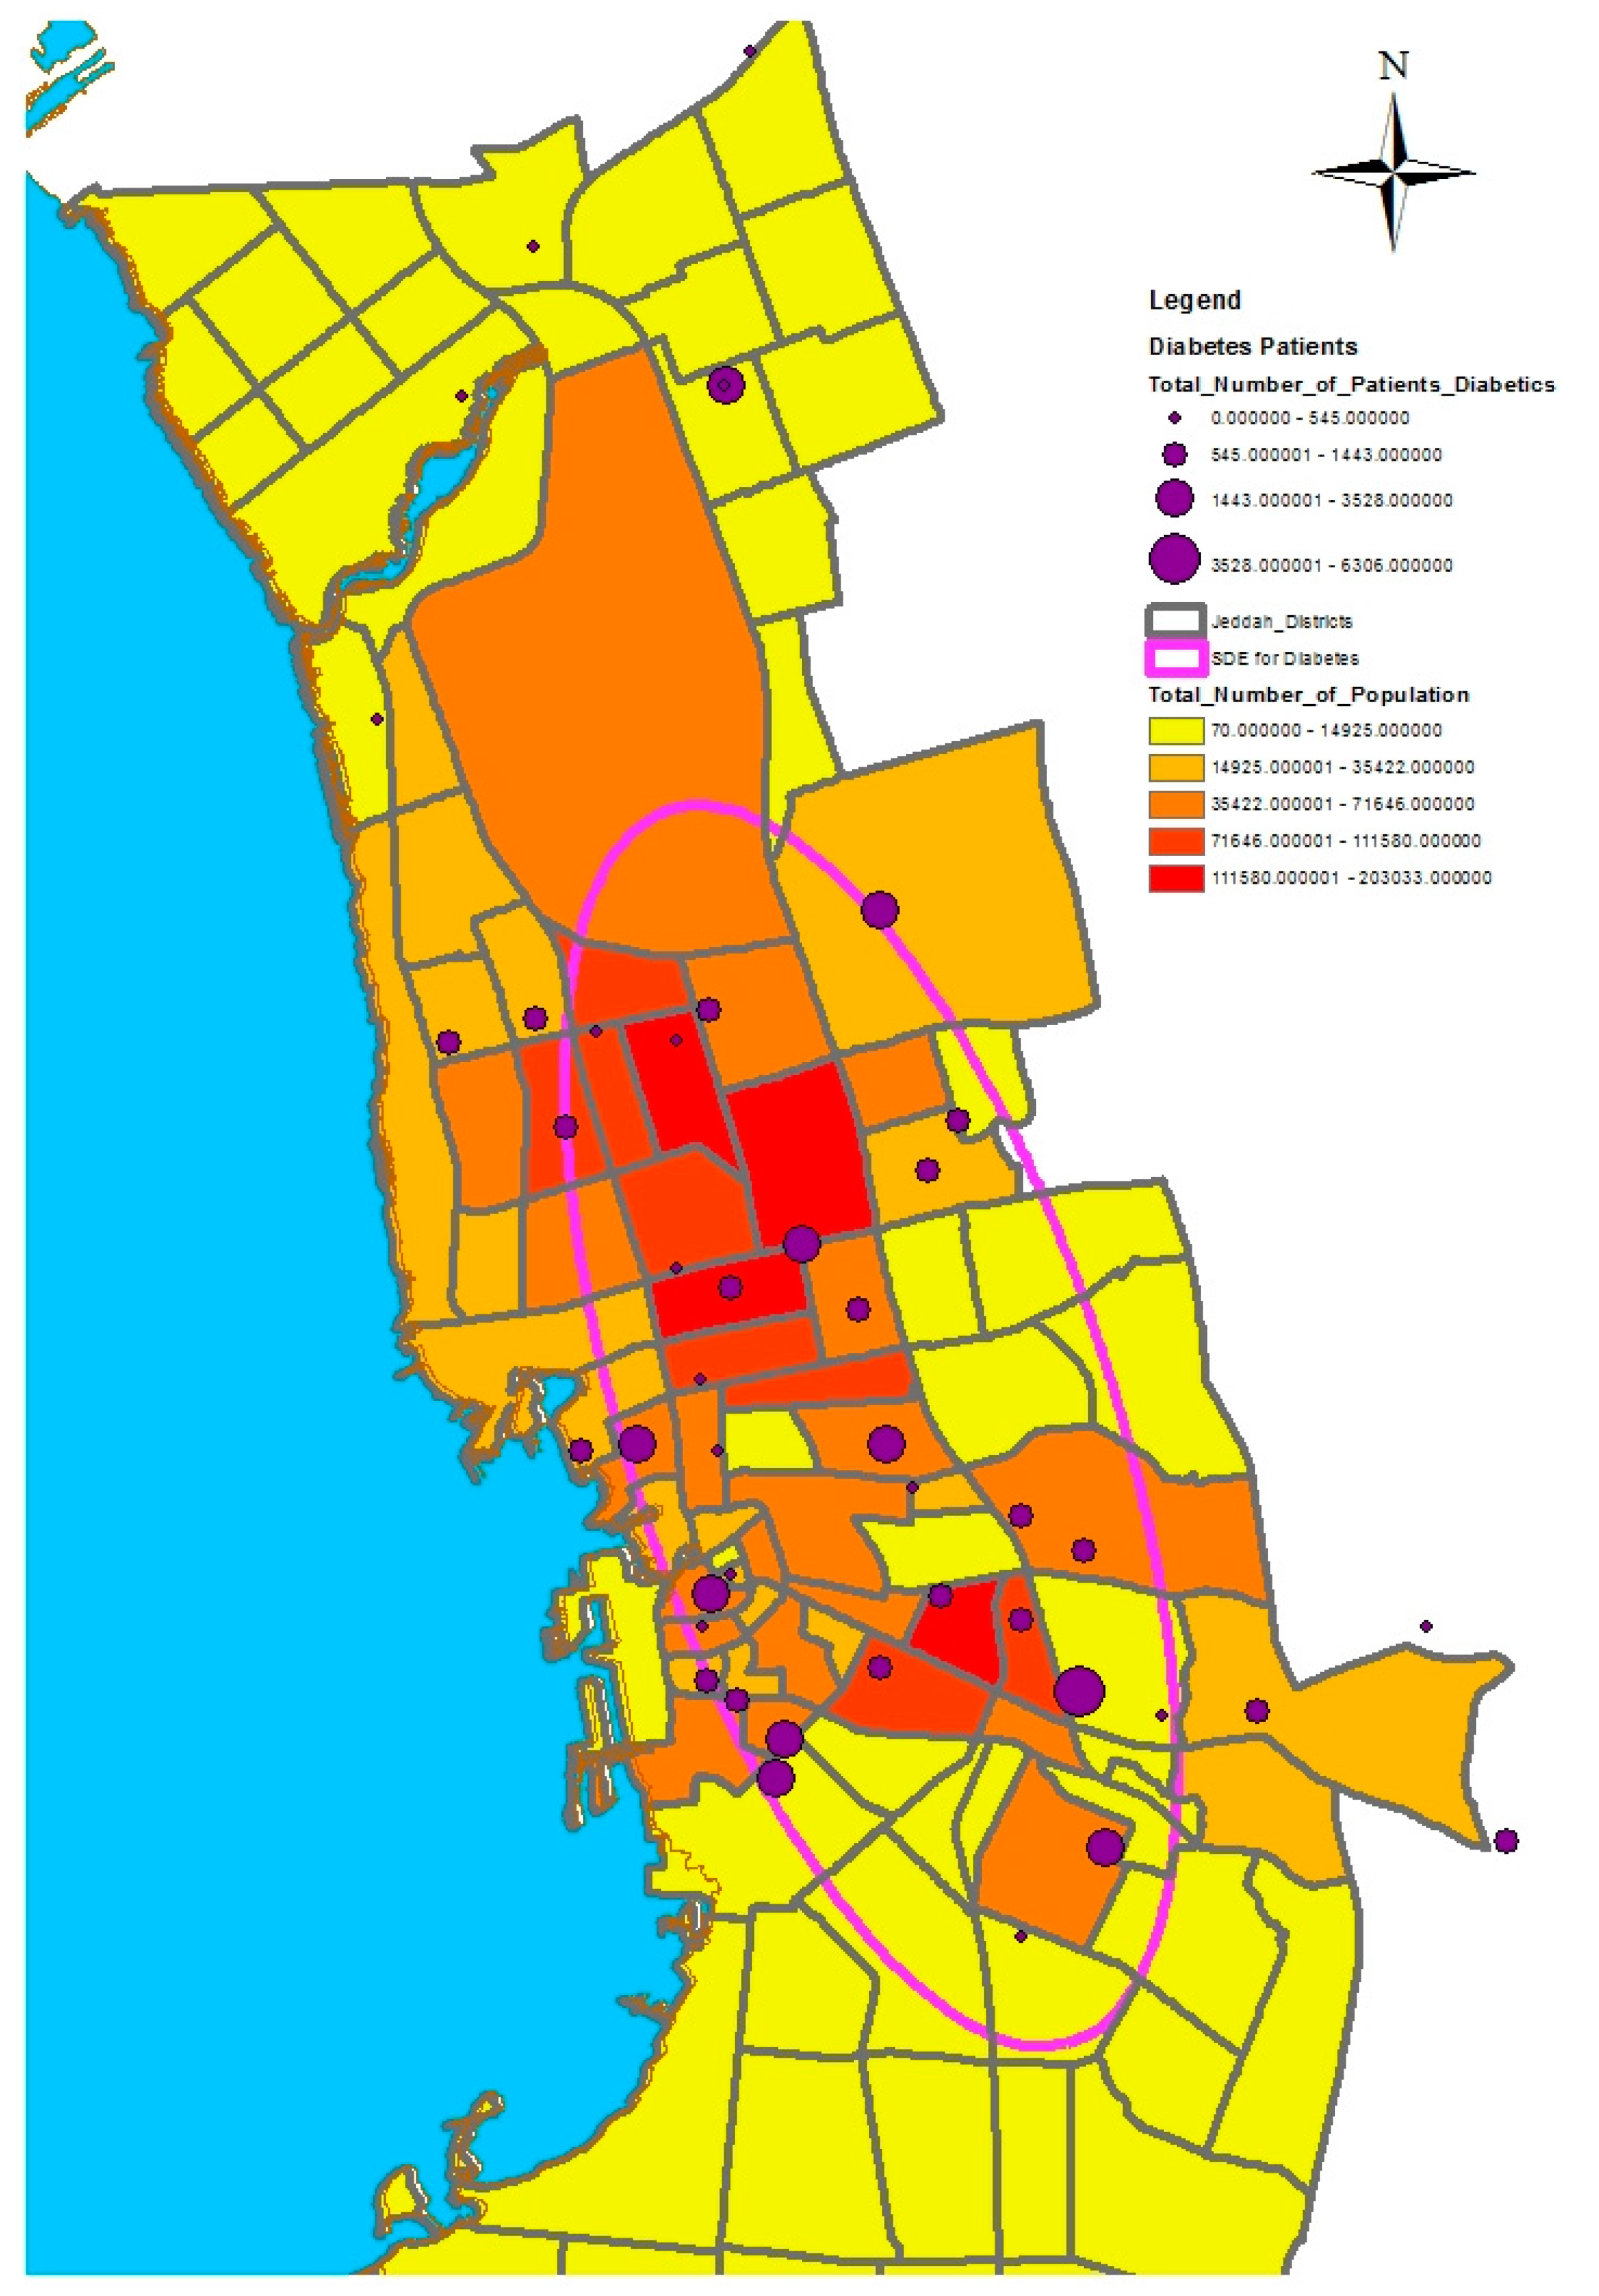
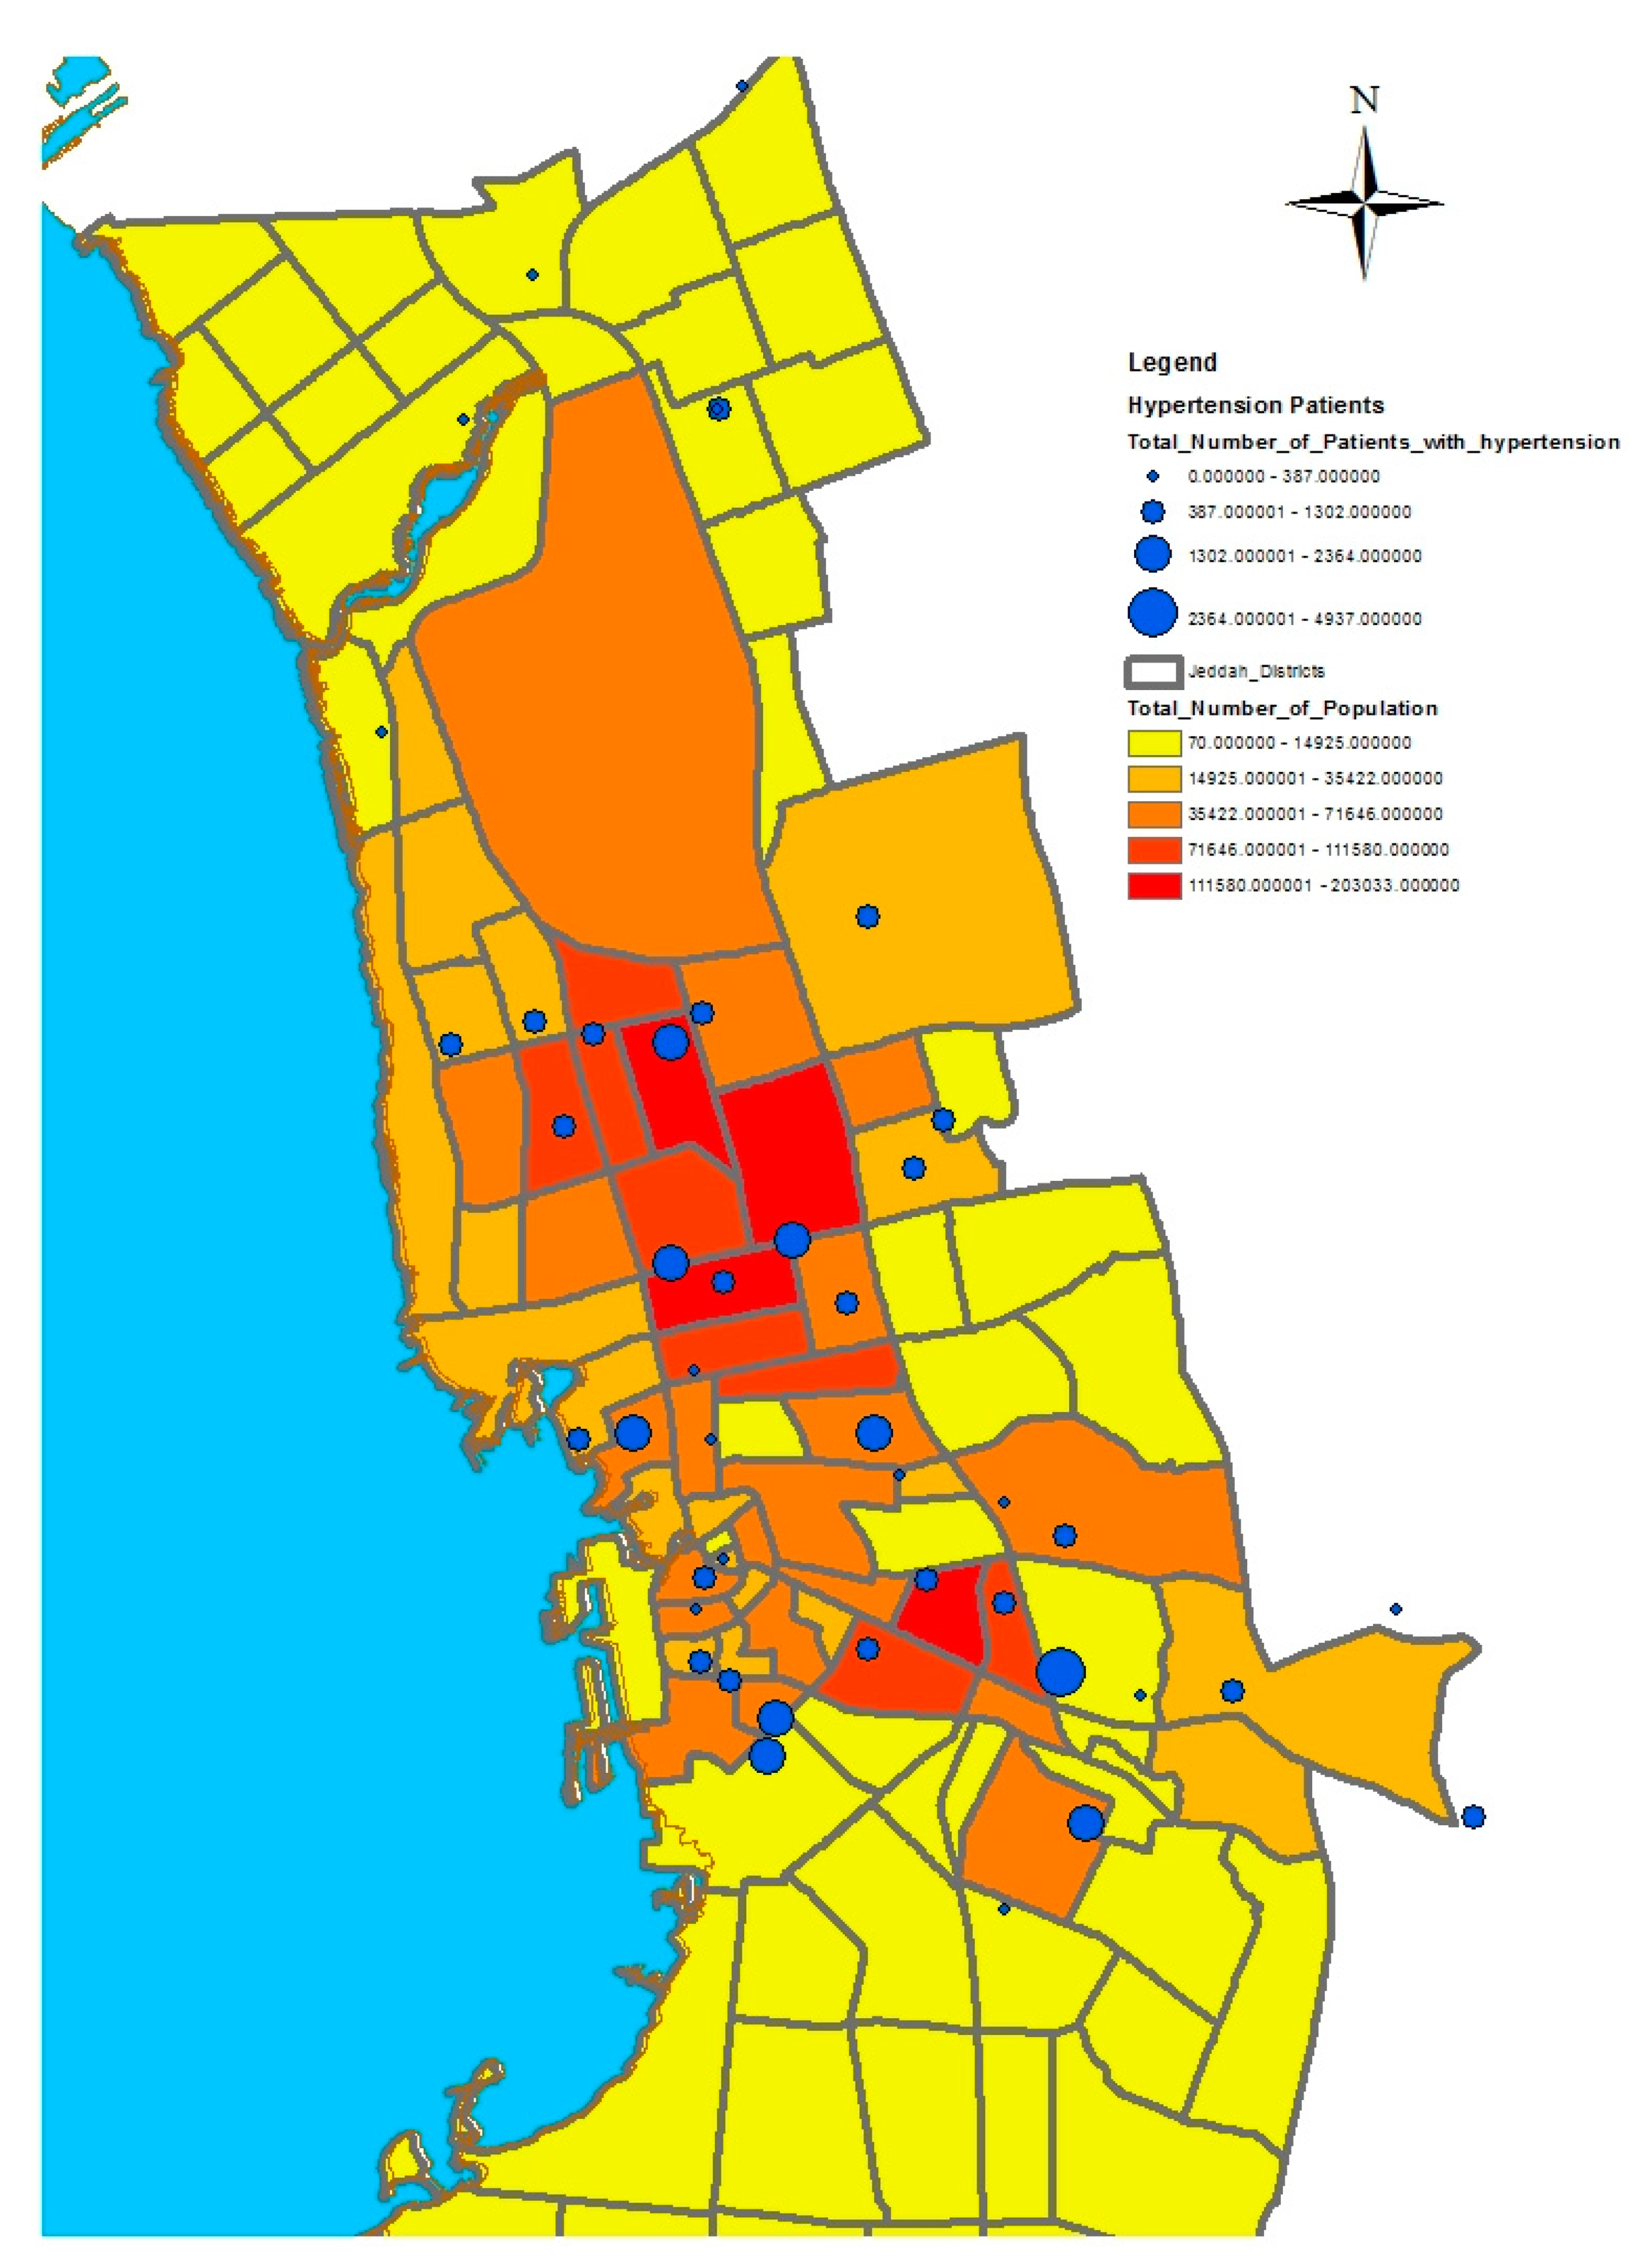
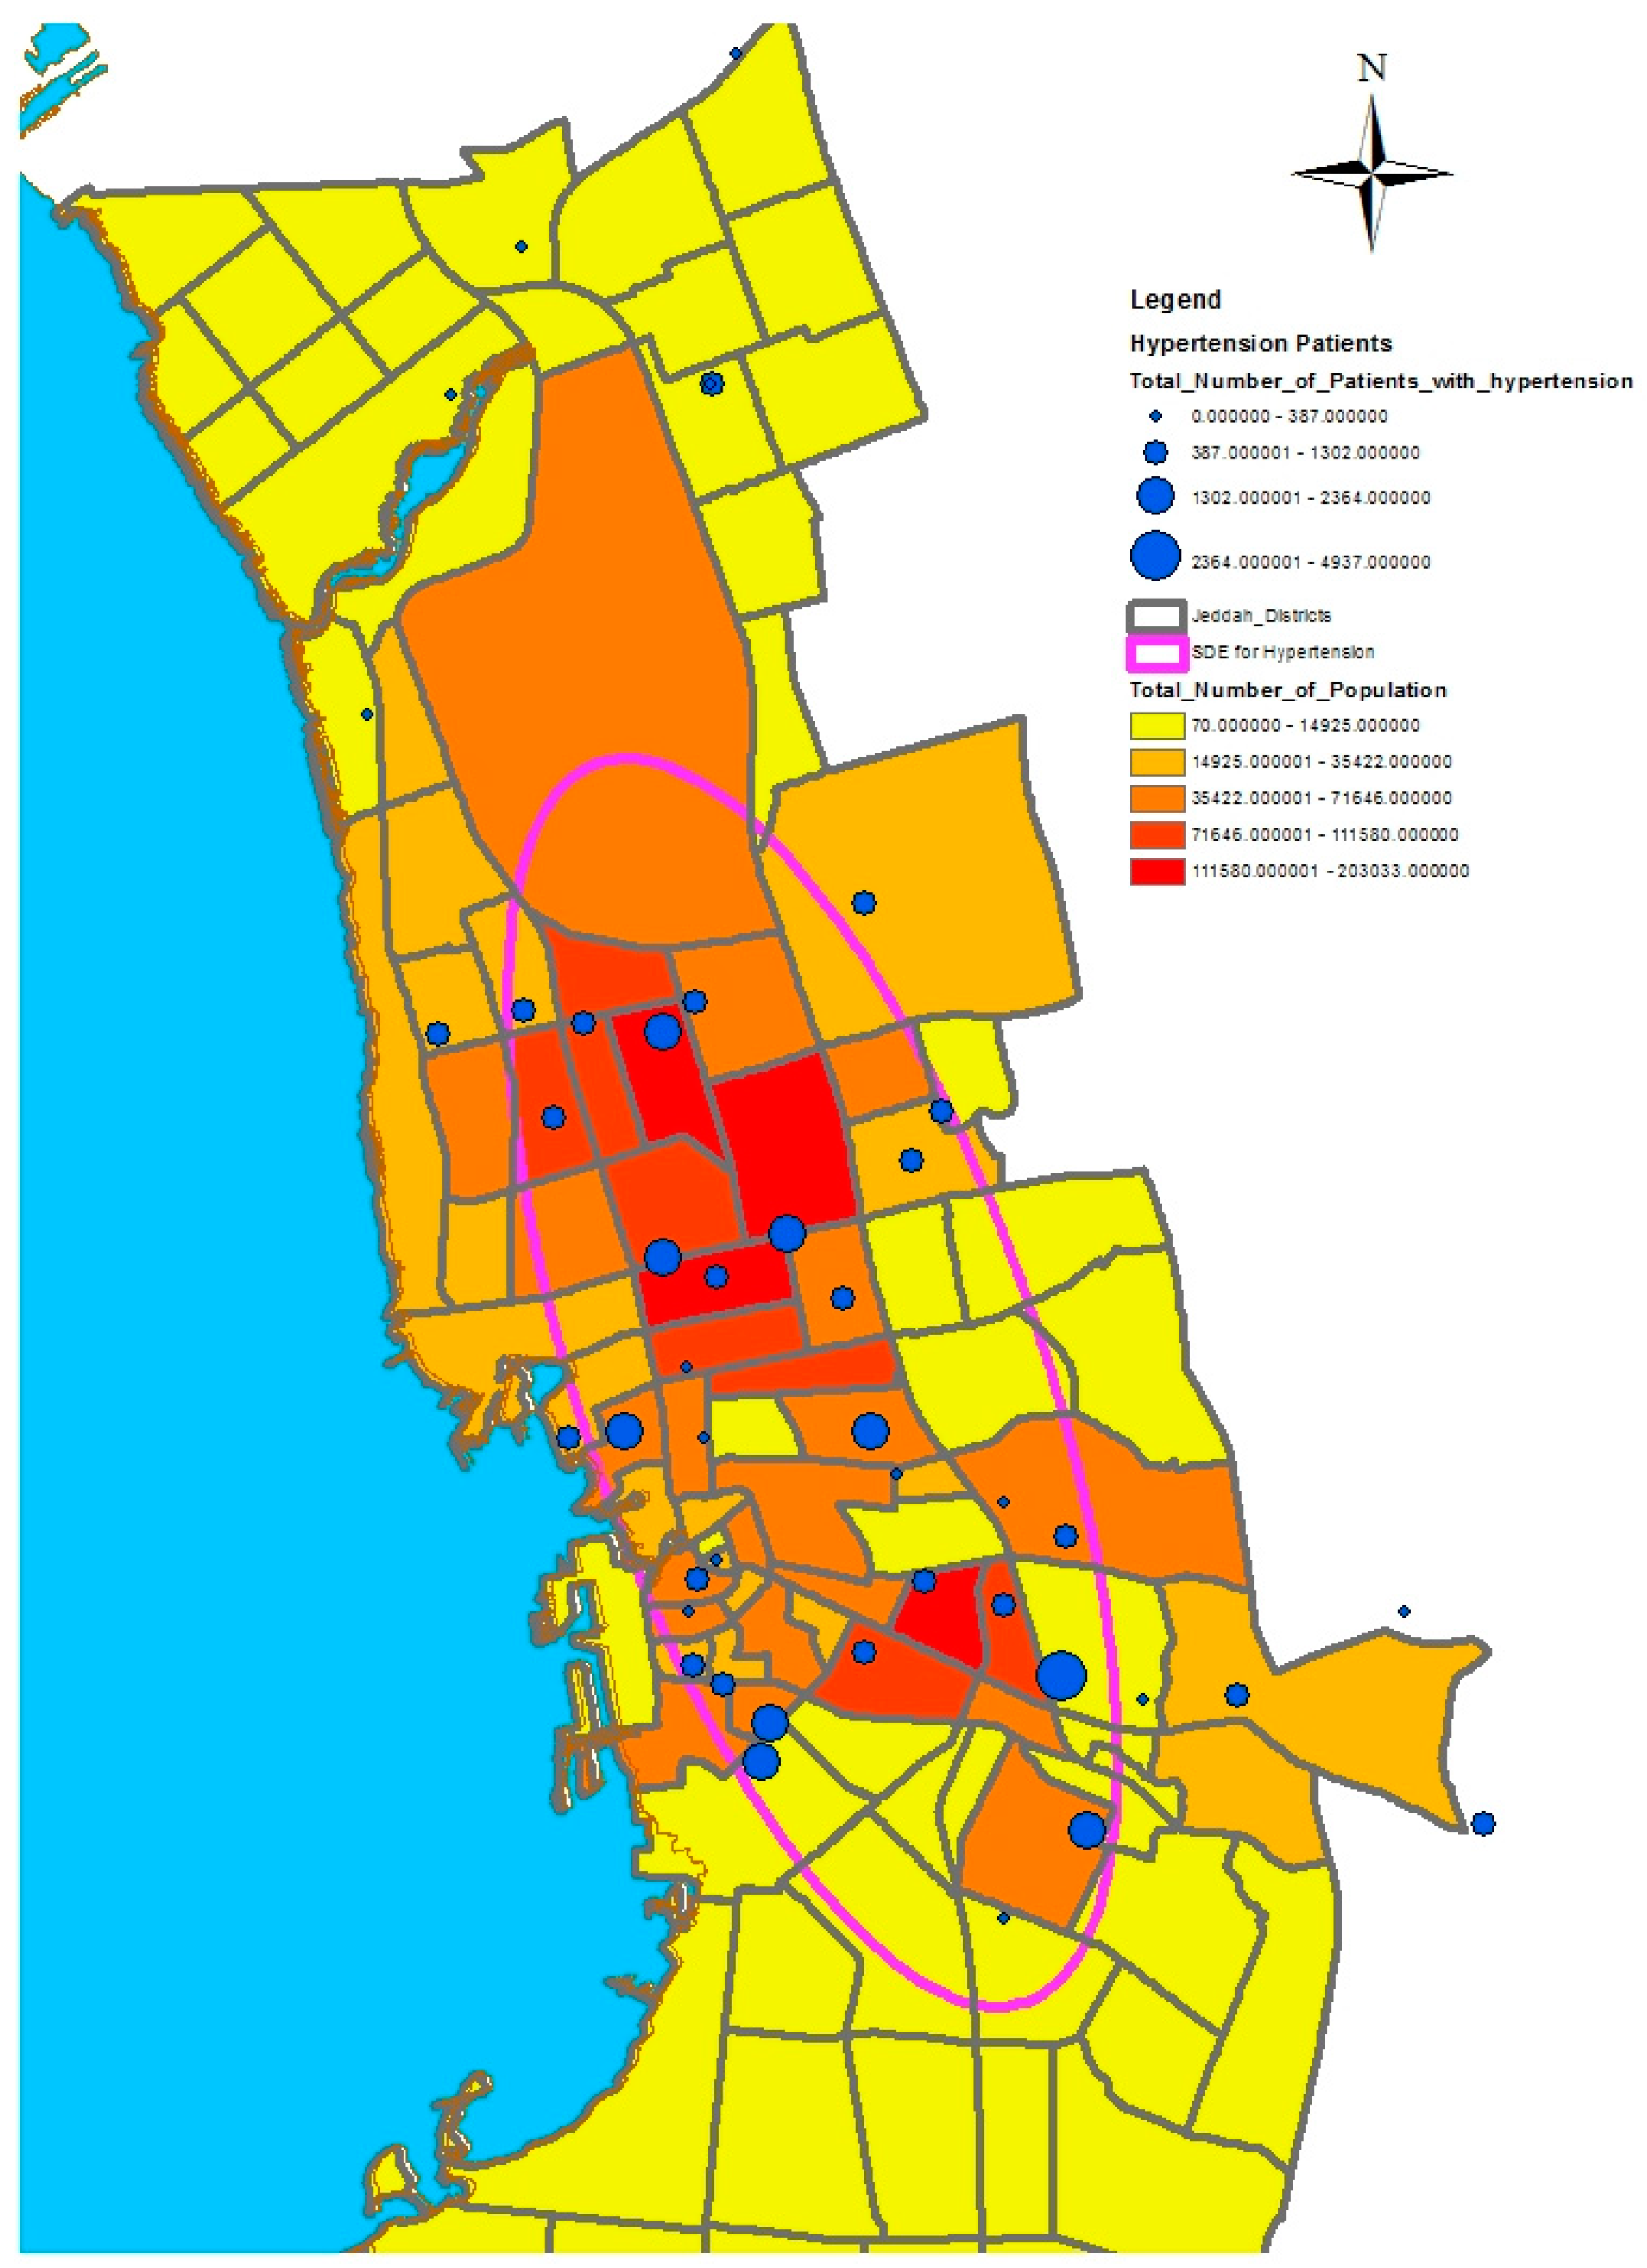
29]. Meanwhile, hypertension and diabetes patients are located more in the central and northern city districts. These city districts are considered as high-density locations, confirming that patterns of diabetes and hypertension patients follow the population density pattern in Jeddah. These are the results of the initial analysis for defining the spatial distribution of health conditions.
A further analysis was applied to these data using a spatial statistic function called the standard deviational ellipses, which measures the orientation and direction of features, providing a tool for abstracting spatial trends. This type of analysis is useful for comparing the distributions of categories of health conditions. Although GIS analysis can provide a sense of orientation by drawing features on a map, calculating the standard deviational ellipse clarifies the trend. This tool can be used to calculate the standard deviational ellipse using either the locations of the features or the locations influenced by an attribute value associated with the features. The latter is termed a “weighted standard deviational ellipse” [
25]. Much research has emphasized the importance of using the function of standard deviational ellipses in analyzing the spatial distribution of health conditions categories. For example, Eryando et al. [
30] used the standard deviational ellipse function, statistical analysis, overlap analysis, and environment variables to map the spatial distribution of malaria in the district of Sukabumi, Indonesia, where a malaria outbreak occurred from 2004 to 2012. The study relied on data collection through Global Positioning System (GPS) plotting and field surveys based on data of positive malaria cases (2011–2012) derived from healthcare centers in the district of Sukabumi. The axis of standard deviation ellipses showed a skewed distribution towards the northwest southeast. Environmental factors such as an anomaly of rainfall and temperatures led to the outbreak of malaria, particularly in warm and high areas. The development and metabolism of vectors were supported by the physical environment in the Sukabumi District. Mapping the spatial distribution of malaria provides an initial visualization that can help in formulating possible intervention priorities. As a result, the use of the standard deviational ellipse function contributed to understanding the geographical factors that led to the occurrence of malaria, and determining prevalence trends based on specific geographical patterns. In another example, Dong et al. [
31] used the standard deviational ellipse function to investigate the directional trend and determine the presence of spatial-temporal clustering of influenza A(H7N9) in China from March 2013 to December 2014. The study relied on identifying three phases characterized by a high epidemic infection. The standard deviational ellipse was used at each phase to investigate the directional trend of epidemic spread using statistical scans to identify patterns of spatial-temporal clusters of the epidemic spread. It appeared that the directional trend of the epidemic was from the eastern coast to the southeast, with a future directional trend of transmitting the epidemic to the central and western areas of China. As a result, defining the spatial-temporal patterns of the epidemic A(H7N9) provided general insights into understanding the dynamics of the epidemic’s spread in China.
In this study, we selected a weighted standard deviational ellipse based on the number of patients with diabetes, asthma, and blood pressure at each health center in Jeddah city. This tool creates a new feature class containing an elliptical polygon centered on the mean center for all features. The attribute values for these output ellipse polygons include two standard distances (long and short axes), the orientation of the ellipse, and the case field. The orientation represents the rotation of the long axis measured clockwise from noon.
Figure 4,
Figure 5 and
Figure 6 show the output of the standard deviational ellipses for the three health conditions in Jeddah. The directional orientation for asthma patients is less than that for hypertension and diabetes patients. In other words, asthma patients are more concentrated in the northeast of the city, while hypertension and diabetes patients are spread most widely over the north, south, and southeast.
3.2. Identifying the Spatial Disparities of Diseases
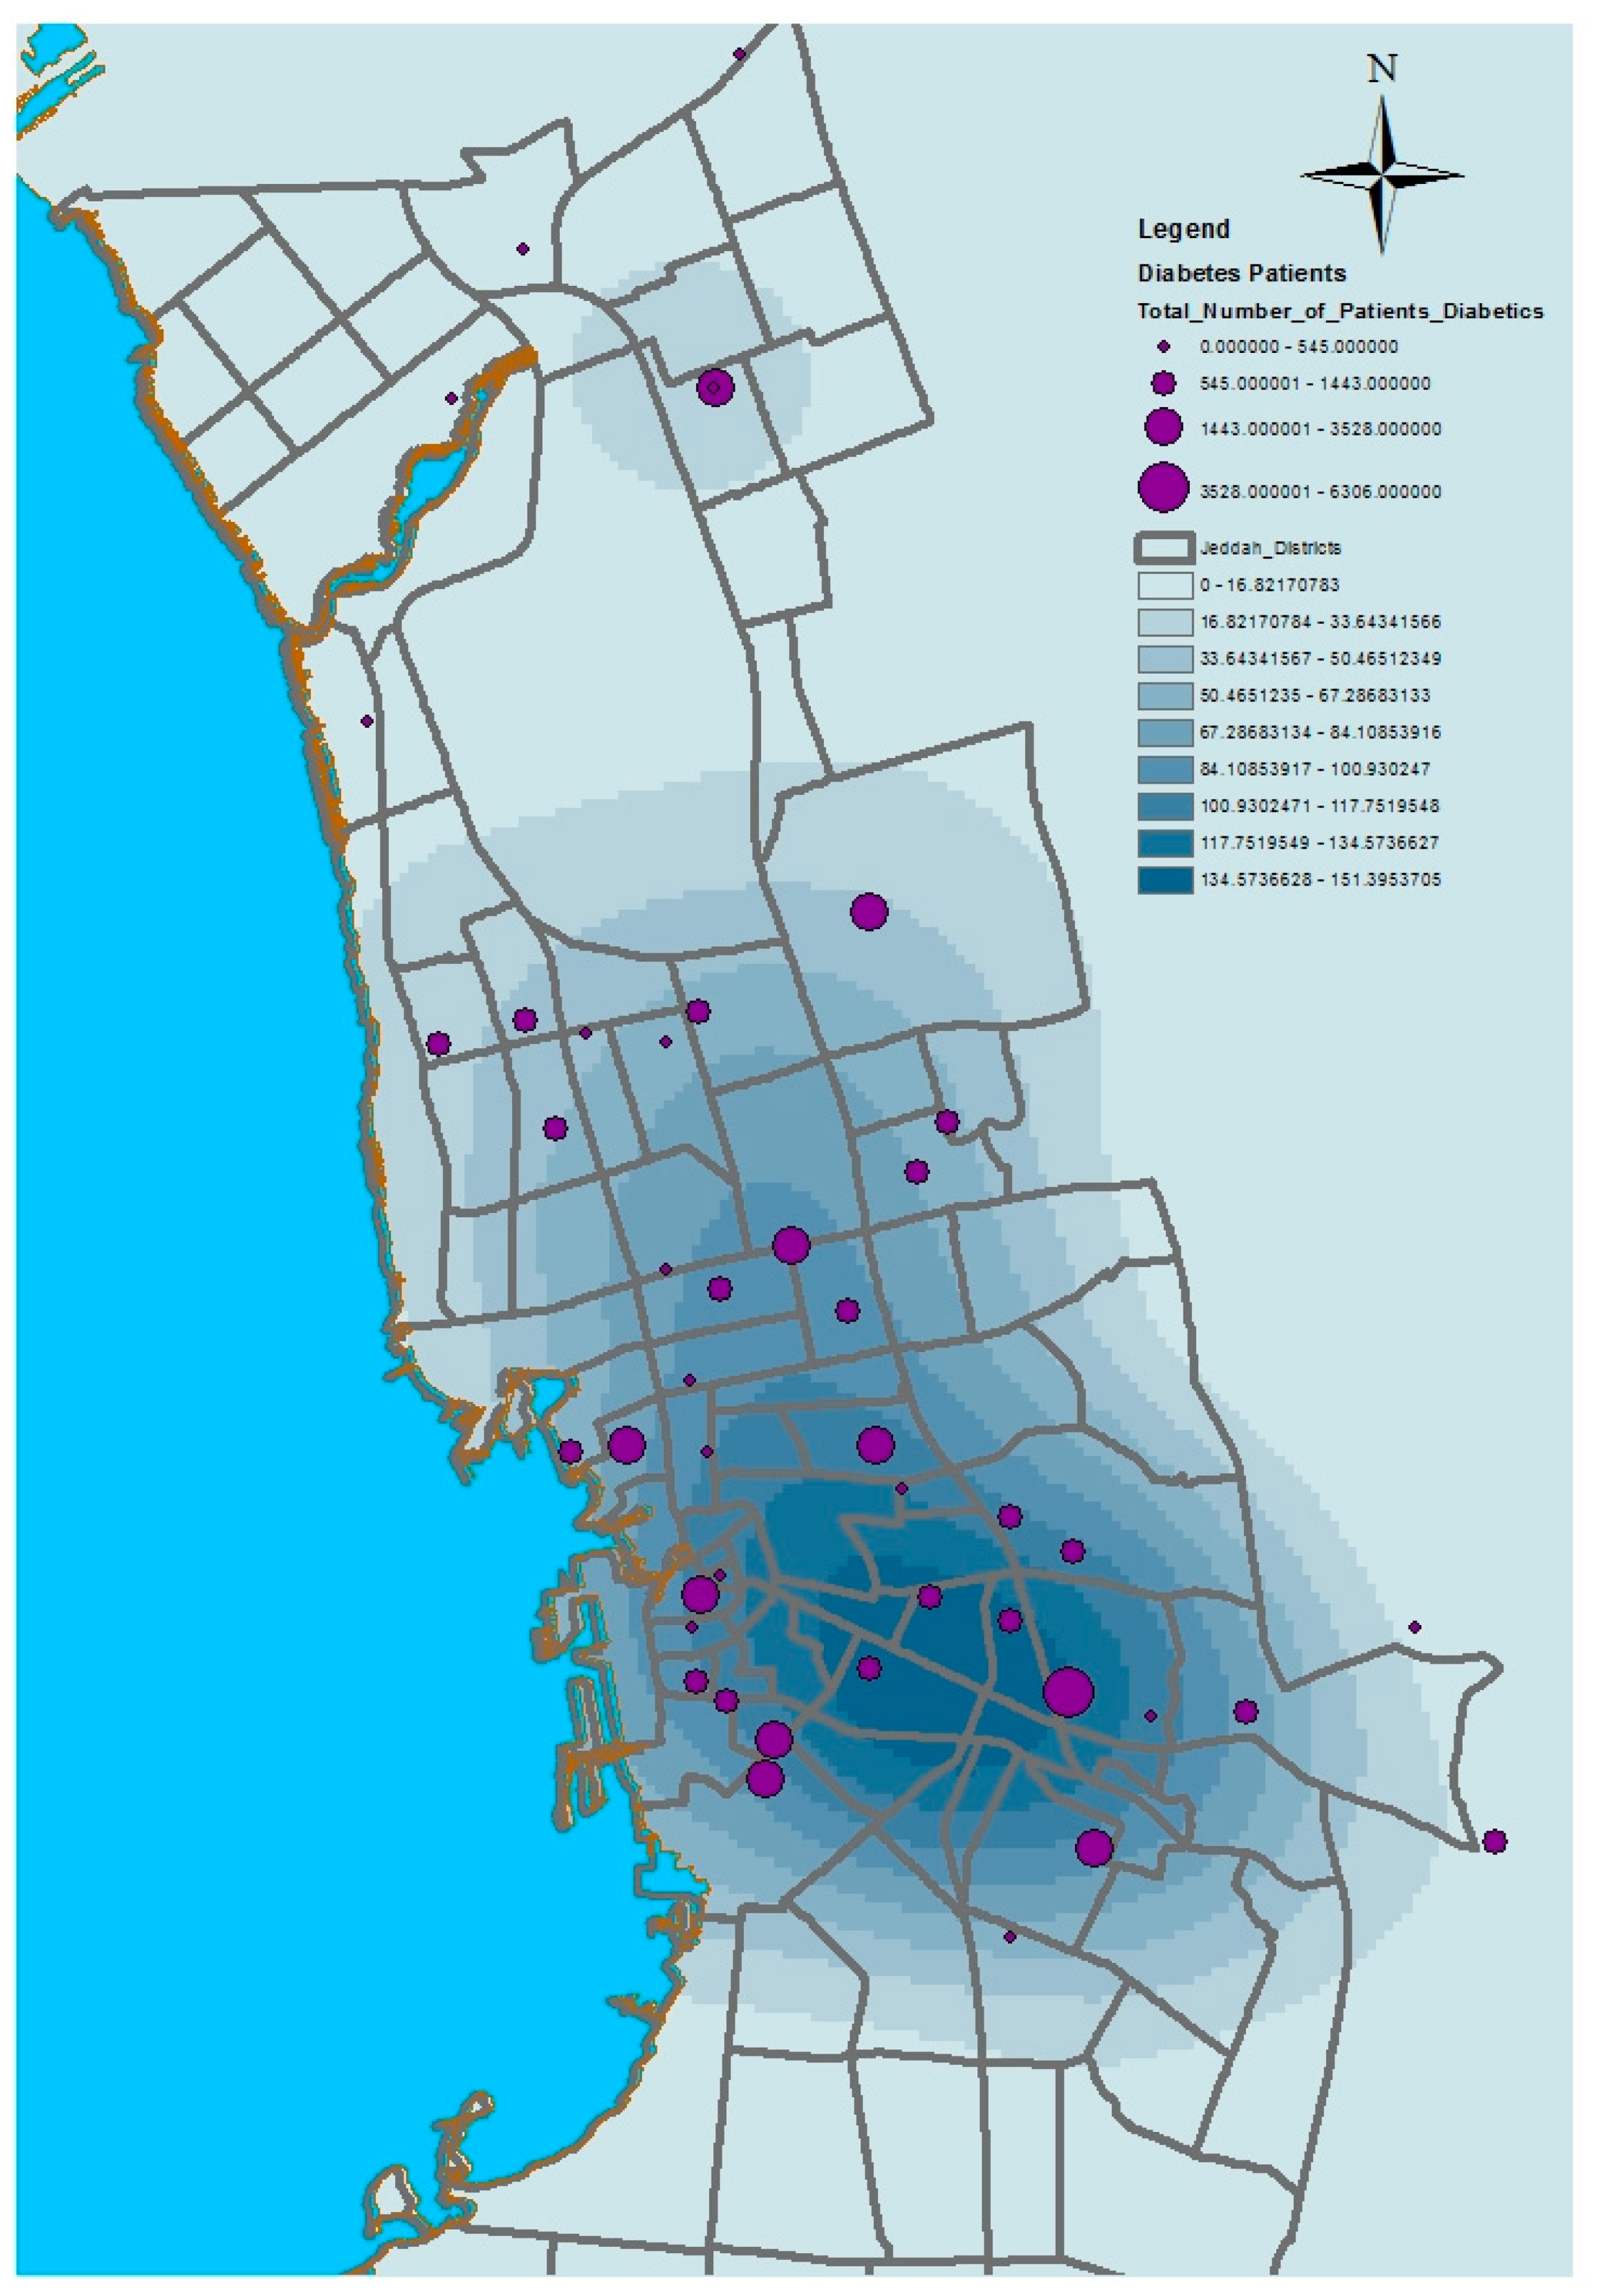
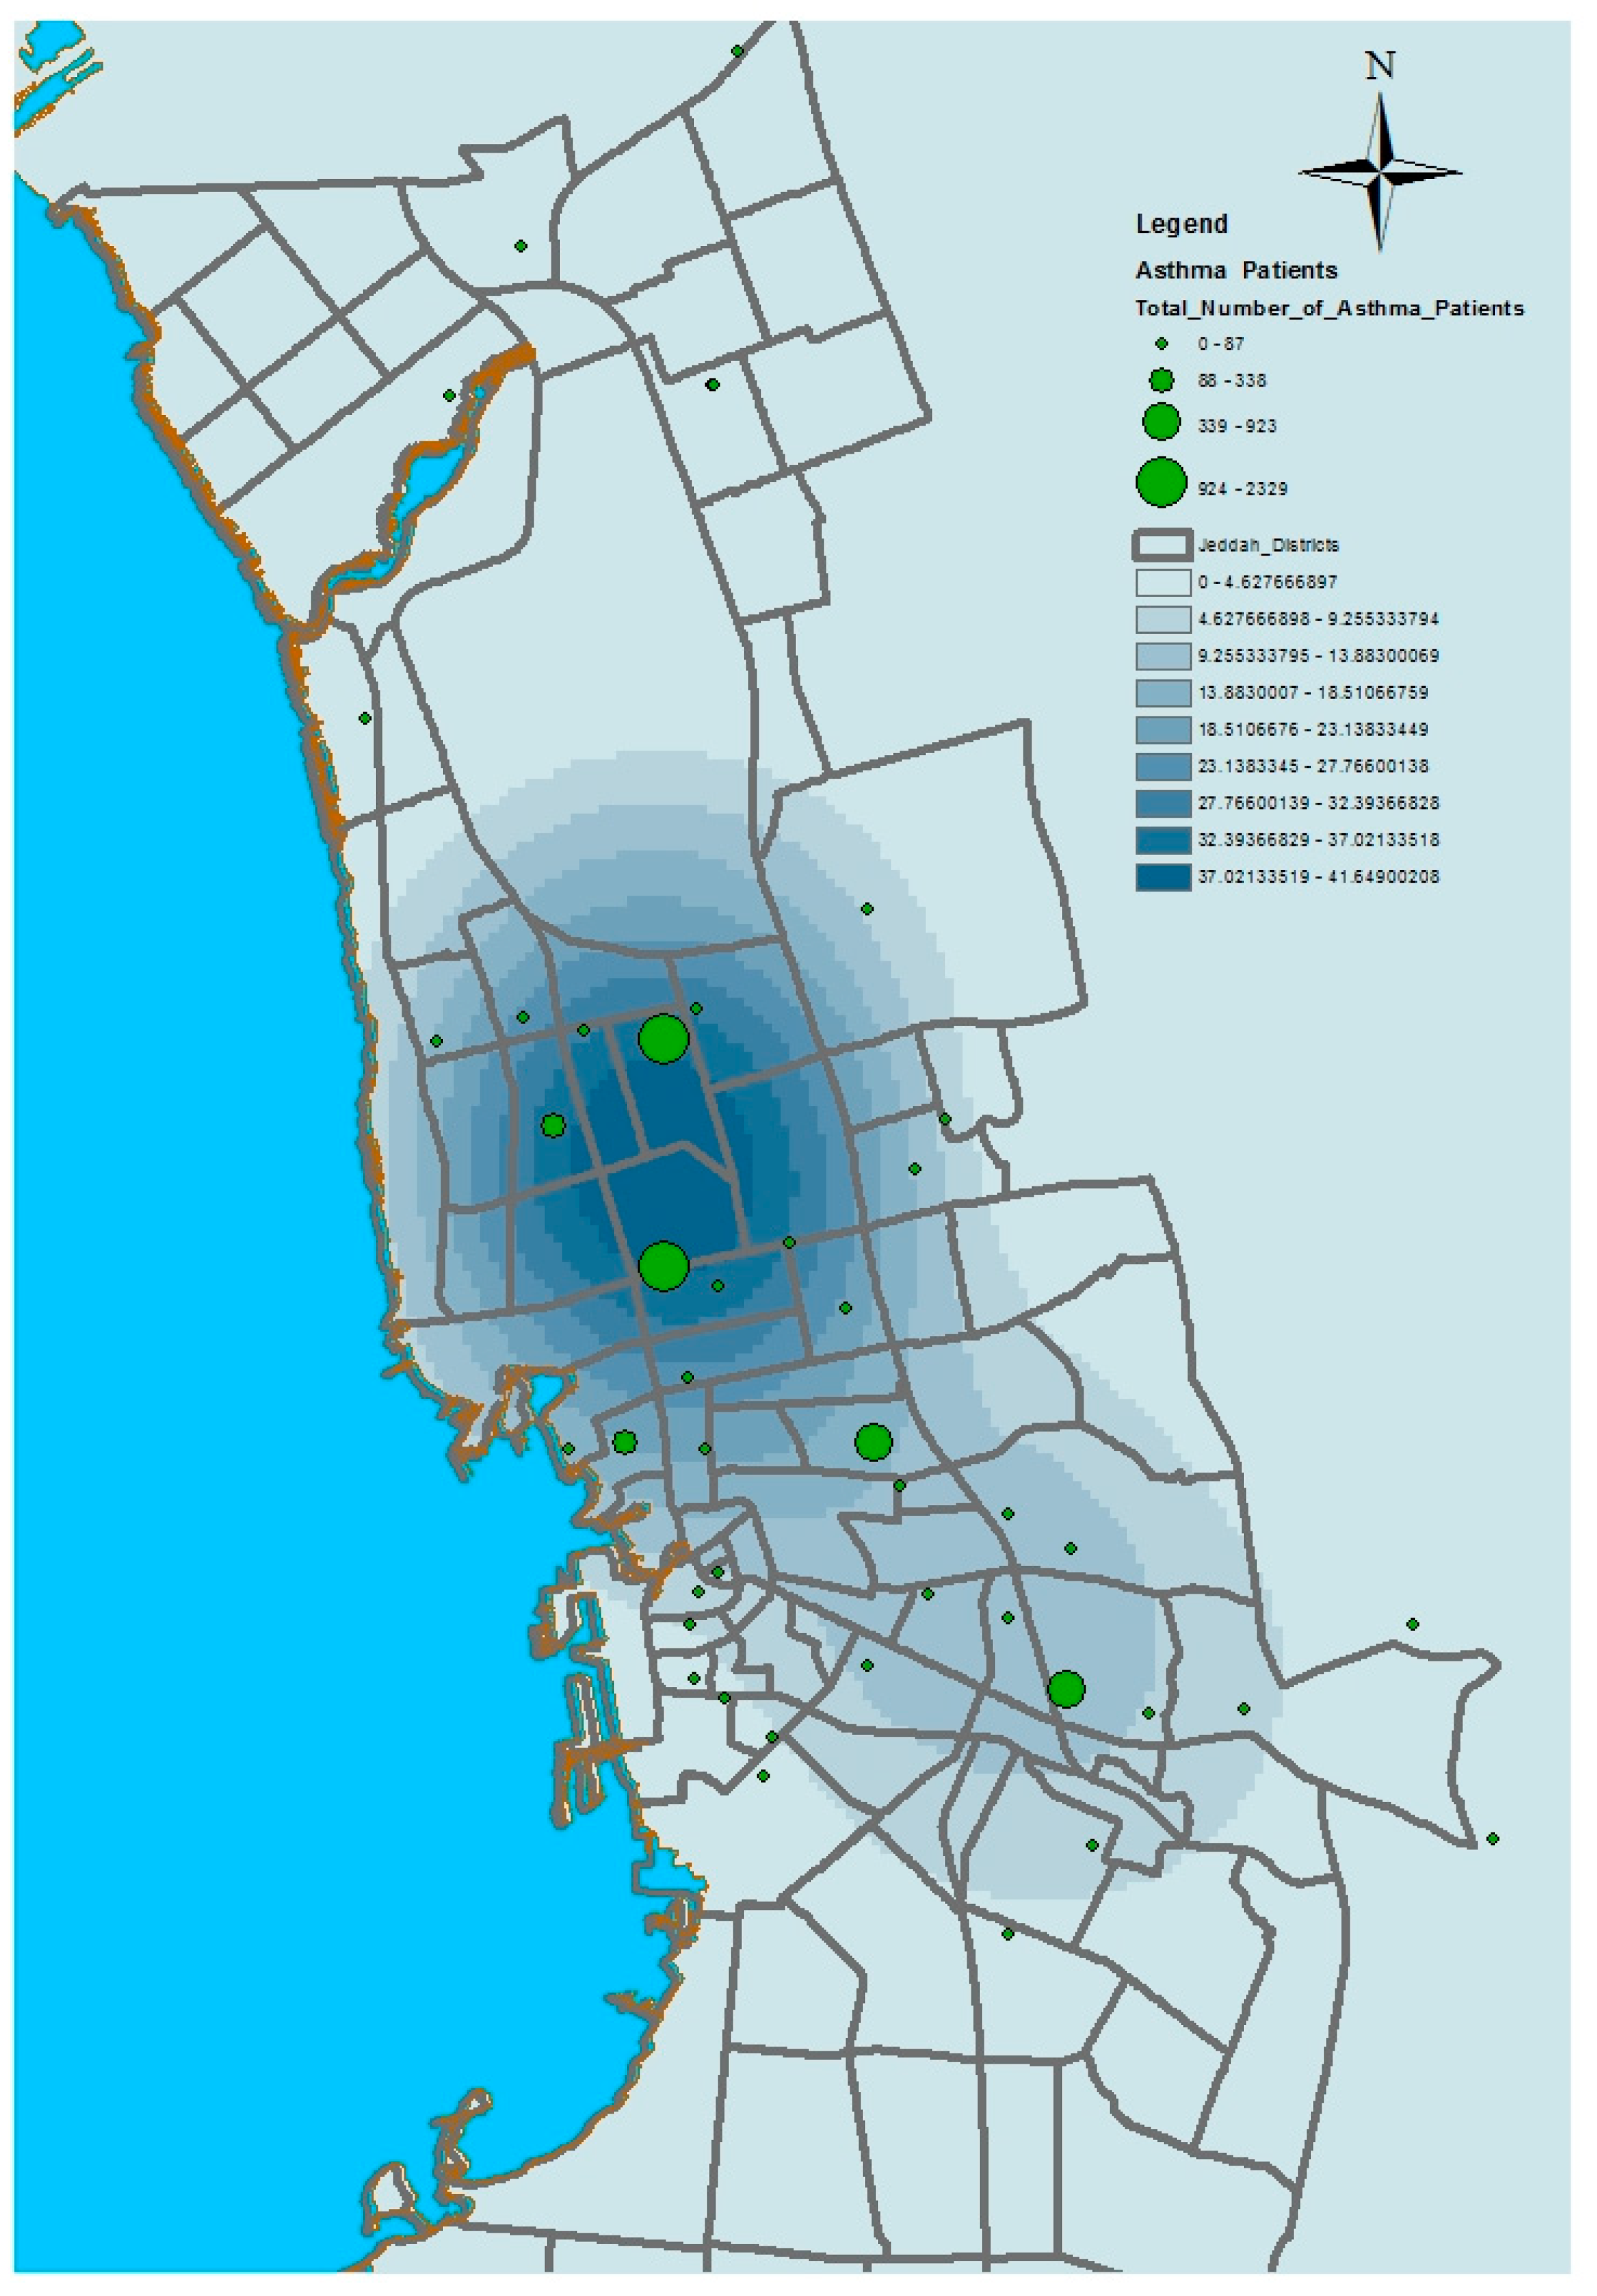
This paper has used kernel density estimation in the ArcGIS software (produced by ESRI) to identify clusters based on the spatial disparities of the aforementioned health conditions in Jeddah. This tool is also useful in identifying high-risk areas and visualizing transmission directions of diseases; thus, it contributes to formulating possible intervention priorities related to the provision of health service resources. The kernel density estimation was used to depict the density of service providers (number per unit area) as a continuous spatial variable, with peaks representing areas of with good access and valleys indicating areas with poor access. The kernel density estimation calculates the magnitude per unit area from the point or polyline features using a kernel function to fit a smoothly tapered surface to each point or polyline. Possible uses of Kernel density include analyzing the density of houses or crimes for community planning, or exploring how roads or utility lines influence wildlife habitat. The population field could be used to weight some features more heavily than others, or to allow one point to represent several observations. For the presented application, point features (health centers location) were used as the input data of this model. The population field is the number of patients with asthma, diabetes, or hypertension. The search radius value was selected as 10,000 square kilometers.
The algorithm used to determine the default search radius of the kernel model, also known as the bandwidth, is as follows:
- (1)
Calculate the mean center of the input points. If a population field other than 0 was selected, this and all following calculations will be weighted by the values in that field.
- (2)
Calculate the distance from the (weighted) mean center for all points.
- (3)
Calculate the (weighted) median of these distances (Dm).
- (4)
Calculate the (weighted) standard distance (SD).
- (5)
Apply the following formula to calculate the bandwidth:
where
n is the number of points if no population field is used or if a population field is supplied, and
n is the sum of the population field values.
Many studies have emphasized the importance of using kernel density estimation to identify spatial disparities and risk areas of diseases. For example, Z. A. Latif [
32] used Kernel density estimation to map a dengue outbreak in order to produce a risk map in Selangor, Malaysia. The aim of this method was to locate hotspots. The results showed that eight areas could be classified as high-risk. In addition, Chaikaew, Tripathi, and Souris [
33] used GIS-based spatial analyses to identify patterns of diarrhea disease prevalence in Chiang Mai province, Northern Thailand. The analysis relied on using a set of analytical and statistical methods such as quadrant analysis (QA), nearest neighbor analysis (NNA), and spatial autocorrelation analysis (SAA) to visualize the spatial patterns of the disease in the province. Moreover, kernel density estimation was used to determine hotspots of diarrhea based on the collection of patient data at the village level and population censuses from 2001 to 2006. Hotspot maps based on kernel density estimation revealed cluster patterns and the spatial direction of the prevalence of the disease. As a result, the method can contribute to developing a system to monitor and prevent disease outbreak.
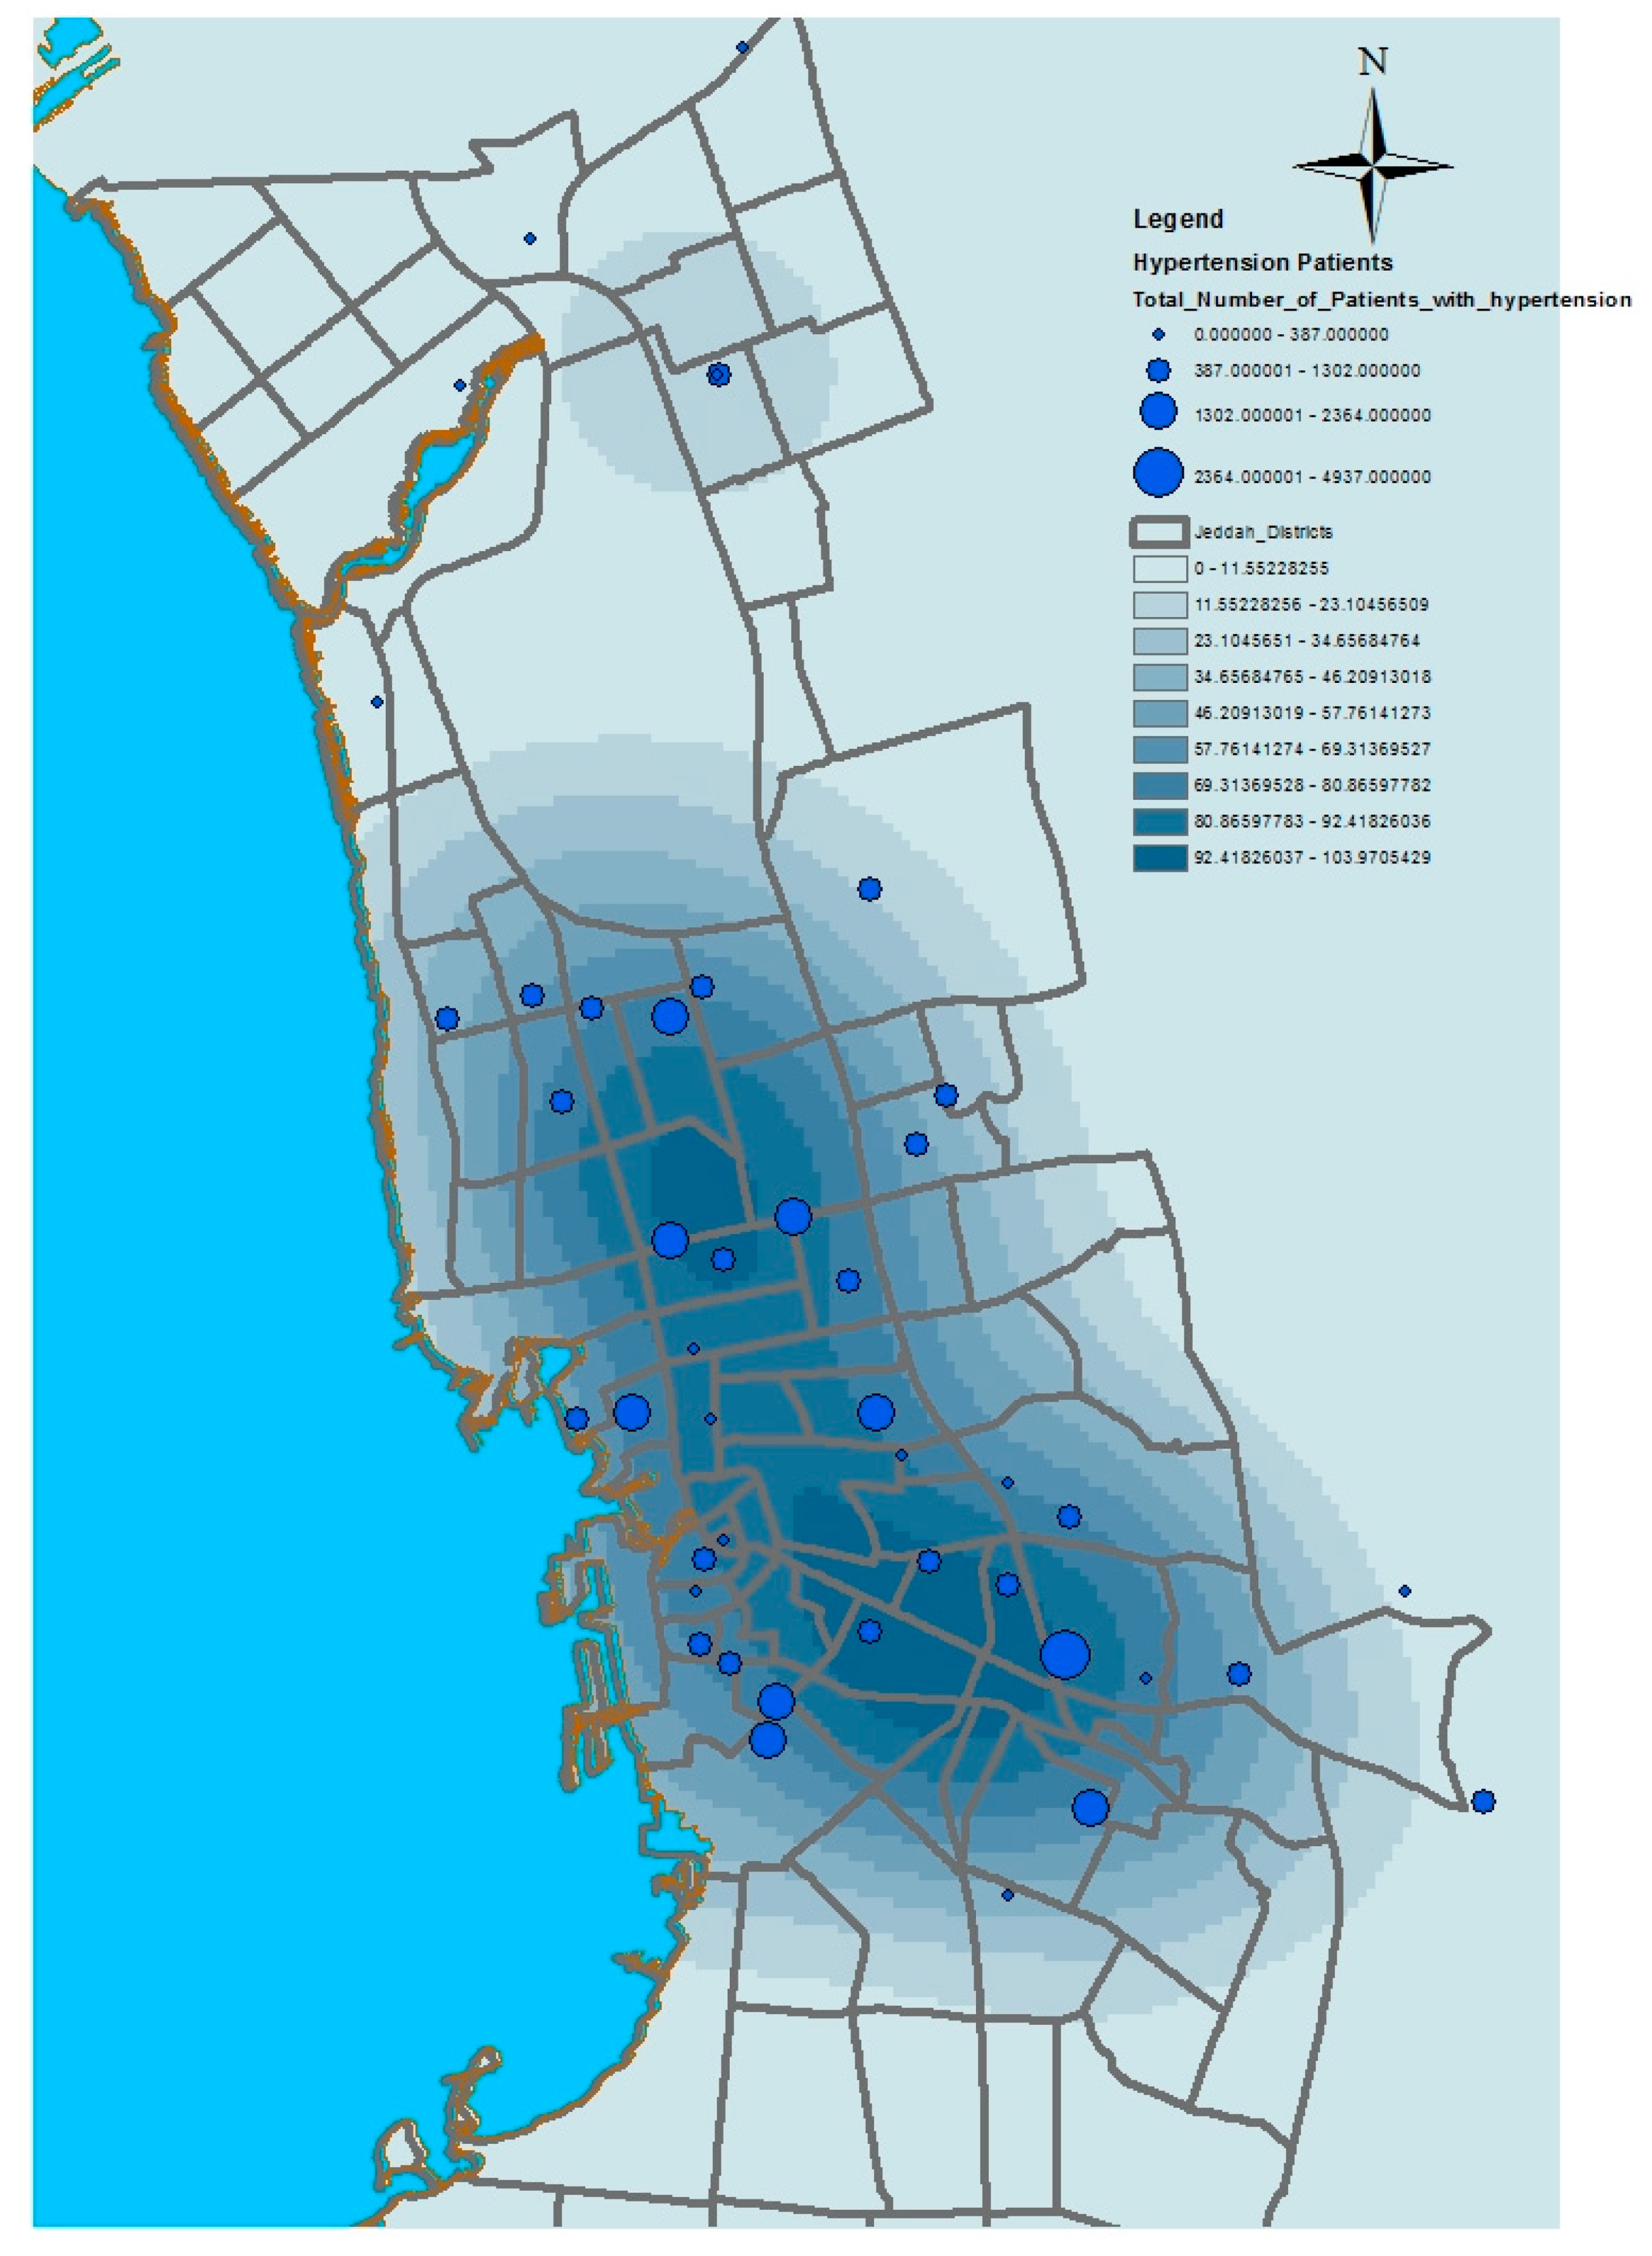
Figure 6,
Figure 7,
Figure 8 and
Figure 9 show the results of the kernel density services for the selected types of patients in Jeddah. The density for asthma patients shows a high concentration in the northeast city districts, while hypertension and diabetes patients were concentrated in the central and northern city districts. These results therefore identify the spatial clusters of the selected health conditions in Jeddah.
3.3. Modeling the Spatial Diffusion of Diseases
GIS software can be used by health professionals to predict the spatial location and diffusion of health conditions. The geographical patterns of interactions between infected and susceptible individuals are crucial for understanding how and where infectious diseases spread. Spatial diffusion describes the movement of phenomena, people, goods, ideas, innovations, and diseases through space and time. Sometimes, diseases follow a pattern of contagious diffusion, spreading gradually outward from a point of origin to nearby locations. In hierarchical diffusion, diseases spread via the urban hierarchy, starting in large cities and spreading over time to medium-sized cities, before arriving in smaller cities and towns. Network diffusion refers to the spread of disease through transportation or networks. As with the other types of diffusion, network diffusion reflects the geographical and social structuring of human interactions. Today, the emerging trend in epidemic modeling is to focus on individuals rather than larger populations or nodes through the use of agent-based modeling. Agent-based models simulate the behavior and interactions of individuals to generate insights about populations and communities.
One of the analytical tools used to identify the spatial diffusion of diseases is the Getis-Ord Gi* statistic based on hotspot analyses. For example, Saxena et al. [
34] used the methods of Getis-Ord Gi* and Standard Deviational Ellipse to define a spatial distribution pattern, identify hotspots, and map a directional distribution trend of Plasmodium vivax (Pv) and Plasmodium falciparum (Pf) occurrences in Ranchi, India. The study relied on malaria epidemiological data from 2007–2009, derived from 328 subcenters of the 14 primary health centers (PHCs) in the district. The results showed that there was randomness in the pattern of spatial distribution (Pv); in contrast, the spatial distribution of occurrence (Pf) was significantly clustered. During the period of 2007–2009, there was a downward trend in the number of subcenters associated with the (Pv) hotspot category; in contrast, there was an upward trend in the high (Pf) risk subcenters. Moreover, from 2008 onwards, a shifting trend in (Pf) diffusion was noted from the north-west to western direction. In another example, Carnes and Ogneva-Himmelberger [
35] used a set of analytical and statistical tools, including the Getis-Ord-Gi* statistic (hot spot analysis), to analyze the distributional trends of West Nile Virus in the United States from 2000 to 2008. The maps revealed that the directional trend of the virus cases was from east to west. Moreover, the analysis of hotspots revealed that metro areas in large cities and rural areas had high rates of virus cases. As a result, the outputs of this study assisted in formulating strategies to overcome West Nile Virus diffusion. The application of hotspot analysis can be found in crime analysis, epidemiology, voting pattern analysis, economic geography, retail analysis, traffic incident analysis, and demographics.
In this study, a GIS was used to model the prevalence of the three selected diseases based on data that were available from health centers in Jeddah. The Getis–Ord Gi* statistic model was applied to the collected data to model the spatial diffusion of the health conditions in Jeddah. The hotspot analysis tool in ArcGIS was used to calculate the Getis–Ord Gi* statistic for each feature in each dataset. The results of a hotspot analysis are shown in
Figure 10,
Figure 11 and
Figure 12. The asthma analysis showed hotspot locations in the central city districts and coldspot locations in the north and south. This means that asthma patients are more concentrated in the central city districts. The modeling of hypertension patients shows that coldspot locations are only located in the north of the city, whereas the remaining city districts have a high number of hotspots. In other words, hypertension patients are spread over several city districts, except for the northern parts of the city, where few suffer from hypertension. The results of the diabetes modeling showed that hotspot locations are grouped in the central and southern city districts, and coldspots are grouped in the northern city districts. The hotspot analysis results are useful for determining where the selected health conditions are more concentrated, and, eventually, which and where health services should be made available.
4. Discussion
The use of GIS in health care studies has increased, and its applications have become more sophisticated. For example, GIS can be used for exposure modeling as a tool to study cancer incidence in a population exposed to airborne dioxins. An assessment of the relationship between the environment and health needs to develop statistical methods and epidemiological techniques capable of broad analyses and visualization. Nevertheless, recent GIS technologies have contributed to disease control and related decision-making through the effective updating, mapping, and monitoring of disease. In addition, GIS can map trends of disease spread and provide a visualization of how the diseases occur by modeling the environmental risk factors causing the disease.
The traditional method of disease control, based on empirical observations, is laborious, expensive, and time-consuming. However, by applying GIS techniques to map disease presence, density, and spatial diffusion, the root causes of diseases and sources of infection can be determined. For example, Srinath et al. [
36] analyzed and mapped the spread of disease in the US state of Texas using GIS, and also investigated the environmental factors that contribute to promoting the spread of diseases. In their study, they emphasized that there is a strong relationship between disease spread and environmental factors which requires the development of new spatial methods to enhance epidemiological research. According to Geanuracos [
37], public health researchers are increasingly shifting their attention from models of disease etiology, which focus exclusively on individual risk factors, to models that also consider the complex and powerful effects of the socio-physical environment. It has been observed that many diseases are spread excessively within endemic areas or cores, for example, sexually transmitted infections (STIs) and (HIV/AIDS). These areas are often characterized by high levels of racial/ethnic segregation, low socioeconomic status, and high rates of homicide and other criminal activities. One of the most important foundations for epidemiology is the investigation of the possible clustering of diseases in order to consider whether such clusters need further investigation, whether they are likely to be chance occurrences, or whether they reflect a rational interpretation of the spatial distribution of the at risk population. Spatial clustering methods are exploratory tools that help researchers and policymakers to understand complex geographic patterns. Knowing whether clusters exist and where they are located provides an important foundation for health research and policy formulation. Responding to community concerns, however, only addresses a fraction of potential clusters and is likely to miss clusters in communities that lack political and economic strength. Spatial clustering analysis is an effective tool in the surveillance of public health, especially when spatial clustering methods are integrated; this will inevitably contribute to discovering the factors and causes of health issues through conducting more exploratory and investigative analyses. We used a GIS to define and model the spatial clusters of three diseases in Jeddah (diabetes, hypertension, and asthma). This was achieved using the kernel model and the Getis–Ord Gi* statistic model.

