Article

Evaluating Responses of Temperature Regulating Service to Landscape Pattern Based on ‘Source-Sink’ Theory

1
College of Land Science and Technology, China Agricultural University, Beijing 100083, China
2
School of Land Science and Technology, China University of Geosciences (Beijing), Beijing 100083, China
3
Key Laboratory of Agricultural Land Quality, Ministry of Natural Resources, Beijing 100035, China
*
Author to whom correspondence should be addressed.
ISPRS Int. J. Geo-Inf. 2020, 9(5), 295; https://doi.org/10.3390/ijgi9050295
Submission received: 16 March 2020 / Revised: 17 April 2020 / Accepted: 22 April 2020 / Published: 1 May 2020

Abstract

:
Thermal remote sensing provides a method to describe spatial heterogeneity of the “urban heat island” effect and to evaluate the function of temperature regulation. Rapid urbanization and heatwave events with increasing frequencies need a quantitative analysis on the supply and demand for an urban temperature regulating service, which is a gap in urban heat island (UHI) studies in rapidly urbanizing cities. In order to study the quantitative relationship between landscape metrics (including area index and shape index) and temperature regulating service, this study applied a temperature regulating service in an urban thermal environment study based on the “source–sink” landscape theory in western Shenzhen in different periods. The identification of source and sink landscapes is based on the spatial relationship of unusual surface features derived from Landsat-5 and -8 and the consideration of the temperature difference. We found that the source landscapes at different periods provide temperature regulating services for different distances, which directly lead to the difference between the theoretical service value based on the Alternative Cost Method and the actual service value considering demand, changing in the same trend. The results show that the supply distance of temperature regulating services in 2005, 2010, and 2013 is 150 m, 180 m, and 210 m, respectively. The temperature regulating service value is 3.043, 3.273, and 4.308 billion yuan in 2005, 2010, and 2013, which is lower than the estimation value without considering supply and demand (16.638, 23.728, and 37.495 billion yuan, respectively). The value of the temperature regulating service has a positive correlation with the increase of the patch area index. With the gradual complexity of the shape, the service value increases first and then decreases. Moreover, the landscapes with the smallest shape index and area index have the shortest distance for service supplying. The assessment of the temperature regulating service needs to consider the presence of demand landscapes. Furthermore, the interaction of landscapes under different conditions requires further consideration. The setting of the cooling landscape shape and area for mitigating the “urban heat island” effect can provide references to urban planners and policymakers in the practice of urban climate adaptation and regulation.

1. Introduction

The urban temperature regulating service is an important part of the well-being of urban residents. It is also an essential characterization indicator of urban landscape structure, process, and function [1], and one of the research directions to alleviate the “urban heat island” effect [2]. The urban area has become the most intense and concentrated area of human activity. It is estimated that by 2050, the world’s urban population will exceed 68% [3]. The urbanization process transformed a large number of natural land surfaces into artificially constructed land surfaces [4], changing the physical properties of the earth’s surface. Meanwhile, this process brings a lot of ecological and environmental problems, and the urban heat island effect is particularly prominent, which seriously affects the urban resident’s access to welfare, including more energy consumption and causing some illness and even some deaths. Depending on estimates by the US Department of Energy, the United States spends as much as $10 billion annually on energy costs to alleviate the heat island effect [5]. Akbari et al. [6] found that for each 1 °C increase in temperature, the electricity demand increases between 2% and 4%. It is estimated that by 2050, the loss of labor time due to high temperatures will reach 2% in 10 regions around the world, and in severely hot regions, such as South Asia and West Africa, this loss will be as high as 12%, meaning billions of dollars in economic losses, an equivalent of 6% of the annual GDP [7]. Hundreds of people went to the emergency room due to heat-related illnesses during 2005–2010 in Los Angeles. In recent years, heatwaves in the city cause thousands of deaths in the United States [8] and Europe [9]. McPherson et al. [10] found that adding 10% of vegetation cover in Chicago, or planting about three trees per plot of land, would reduce fuel costs by about $50–90 per year per house. Cities are places where populations gather, and their ecosystems are required to be deeply disturbed by humans. Temperature regulation is an essential ecosystem service, especially in urban areas. An in-depth study of urban ecosystem services helps the sustainable development of cities and populations. We need to explore how many temperature regulating source landscapes there are in the existing urban landscape, how much benefit they can provide, and how these benefits respond to the landscape pattern, for a better city plan decision making.
The “urban heat island” phenomenon exists in almost every town in the world [11]. The higher the degree of urbanization, the stronger the heat island [12]. The main influence factors of the urban heat island (UHI) are land cover, human activity, and landscape pattern [13]. Human activities directly result in changes in land cover and landscape patterns. Land use and land cover types have a significant impact on the urban heat island. Construction sites such as residential, industrial land, and bare cement land [14,15] have higher land surface temperature (LST) and corresponding heat island effects; urban forests [14], grassland, farmland, and other land-use types with vegetation cover have lower temperatures and have a mitigating effect on urban heat island. However, the types of land use cannot fully reflect the spatial differentiation of urban heat island [13,16]. Continuous surface characteristics of vegetation cover, artificial building cover, and water distribution are better to delineate the different characteristics of the urban heat island [13,17,18] with the use of Normalized Difference Vegetation Index (NDVI) [19], Normalized Difference Moisture Index (NDMI) [20], and Impervious Surface Area (ISA) [21]. The land surface temperature on impervious surfaces is generally higher, while the land surface temperature on vegetation (urban forests, grasslands, etc.) or water is relatively low [22]. Weng et al. [19], Goward et al. [23], Chen et al., [15], and Carlson et al. [24] believe that the NDVI has a definite correlation with LST, but it differs due to environmental conditions [25]. ISA refers to the proportion of the surface area of the impervious surface in the unit area [26], which is part of the important driving factors for the increase of land surface temperature in urban landscapes. Yuan and Bauer [21] and Xu [27] found that ISA has a positive correlation with LST. The relationship between the impermeable surface and the urban heat island is a piecewise linear relationship, and the regional differences are obvious [28]. Streutker [14] found that water evaporation is another important factor in the intensity of urban heat islands. Li et al. [29] and Mallick et al. [30] analyzed the correlation between the NDMI and LST. The heat released by human life and production activities such as housing, industry, and transportation is another important source of urban heat islands [19]. In fact, urban heat island and influencing factors are not simply one-dimensional linear relationships [31]. The correlation analysis or regression model of a single factor cannot be that accurate without considering the interactive effects of factors [32].
An urban landscape pattern is the direct result of the change of the underlying surface. Transmission way and the efficiency of surface energy are mainly affected by landscape spatial patterns [13,33]. Therefore, the change of landscape pattern is regarded as the direct cause of urban heat island formation [34]. Research on the urban heat island and landscape pattern is generally transformed into researches on the relationship between land use and land cover (LULC) and LST [35]. The existing research on the landscape pattern is calculated by the pattern index [13]. Weng and Liu et al. investigated the spatial [36], time [37], and scale effect [38] of the relationship between the landscape indexes of LULC and LST. Chen et al. [35] analyzed the correlational relationship between landscape pattern indexes and LST in different seasons and different landscapes. Chen et al. [39] introduced the “source–sink” theory of air pollution into the landscape ecology field and studied and proposed the concept and theory of “source–sink” based on landscape. The “source–sink” landscape pattern theory can be exploited by integrating landscape categories, area sizes, and spatial patterns. The existing studies of source and sink landscapes are mostly based on land use types or land cover [40,41], but ignore the transmission of energy between the “source” and “sink” landscapes. Compared to the temperature characteristics inside the patch, the effect on the land surface temperature from the surrounding landscape is more complex, and this effect is mostly determined by the edge staggering characteristics of adjacent patches [13]. The relationship between the absorption and release of urban surface radiation and land use/land cover is the basis for the classification of “source–sink” landscape types in traditional urban thermal environmental research. However, the radiance, heat, humidity, and aerodynamic characteristics of urban landscapes are not the same and are closely linked to the surrounding environment [4]. It is not accurate to use traditional landscape types to identify “source” and “sink” landscapes. Therefore, the energy exchange between the landscape type and the surrounding environment should be fully considered, and the “source” and “sink” landscape of the temperature regulating service should consider the relationship between the landscape and the surrounding environment.
In this study, the “source–sink” landscape was defined based on the research object of the temperature regulating service. In order to obtain the response difference of the temperature regulating service under different landscape patterns, this paper mainly studies the following three steps: (1) identify the supply (source) and consumption (sink) landscapes of the temperature regulating service, based on the different urban land surface characters; (2) evaluate the value of the temperature regulating service provided by different landscapes; and (3) analyze and discuss the response of the temperature regulating service to the different landscape patterns (area and shape).

2. Materials and Methods

2.1. Overview

Different landscape patterns have distinct impacts on the temperature regulating service. A temperature regulating service is the result of the landscape pattern, while it is the feedback of the landscape pattern. The temperature regulating service reflects the consequence of the land pattern under the influence of rapid urbanization in a clearer perspective. Based on the response of the temperature regulating service to the landscape pattern, information can be obtained for the planning designer or decision-maker to improve the landscape pattern in urban planning. Thus, it is very important for the analysis of the response of service to the landscape pattern, especially for the pattern between the supply and demand at a local scale. Consistent with the research objectives, our method was mainly divided into three parts: (1) Using the four surface attributes of the NDVI, NDMI, ISA, and LST as the input data, the landscape of the western Shenzhen was divided into 16 landscape types. For the identification of the “source–sink” landscape of a temperature regulating service, a buffer analysis was performed for each landscape type to establish the relationship between the land surface temperature of each landscape type and the surrounding environment. Comparative analysis was used to identify the “source” landscape and “sink” landscape of the temperature regulating service in western Shenzhen; (2) The theoretical value of the temperature regulating service and the value of demand-oriented actual temperature regulating service were estimated based on the Alternative Cost Method; and (3) the relationship between the landscape pattern (area and shape) of the “source” landscape and “sink” landscape and the value of a temperature regulating service was quantitatively analyzed.

2.2. Study Area

Shenzhen is located in the coastal area in the south-central of the Guangdong Province (Figure 1). The total area is 1996.85 square kilometers. It is part of the Pearl River Delta. The elevation is higher in the southeast and lower in the northwest. The western region is a coastal plain. The plain area accounts for 78% of the total area. It is a subtropical maritime monsoon climate with a mild climate and abundant sunshine. The summer lasts for 6 months. The weather in spring, autumn, and winter is warm, the annual average temperature is 22.4 °C, annual sunshine hours are 1975.0 h, and the annual precipitation is 1948 mm. The vegetation resources are abundant, and the natural vegetation is mainly subtropical evergreen monsoon forest. However, due to the rapid urbanization process, the native vegetation is largely destroyed, and the existing vegetation is mostly secondary forest, plantation, and economic crops. The land within the basic ecological control line of Shenzhen is close to half of the city’s area, mainly for leisure land or ecological land. The greening rate of urban built-up areas accounts for 45.08%. In 2014, Shenzhen had 889 parks, and the urban park green area was 181 km2. The urban green space rate was 19.18%, the road greening penetration rate was as high as 100%, and the per capita park green area was 16.84 m2.
The study area is the western part of Shenzhen (Figure 1), including Futian District, Baoan District, Nanshan District, Luohu District, Guangming New District, and Longhua New District, and the western region of Longgang District. Compared to the eastern part, the western part of Shenzhen has a denser urban built-up area. Industrial areas and residential areas are relatively concentrated. According to statistics of the sixth population census in 2010, the population of the study area accounted for 85.31% of the total population of Shenzhen. Therefore, the study of urban thermal environment and urban ecosystem services in this region is of greater significance. In addition, the uncertainty in the acquisition and processing of remote sensing image data is also one of the considerations for choosing this area.

2.3. Data Processing

Based on the consideration of time consistency, time continuity, and quality of remote sensing data and the stage characteristics of land policy development in Shenzhen [42], this study used Landsat-5 (obtained on 23 November, 2005, 23 December, 2010) and Landsat-8 (obtained on 26 November, 2013) remote sensing images in western Shenzhen, and the weather data in Shenzhen on the same days. The image quality was good in the study area. The weather in the three periods consisted of very clear atmospheric conditions and no wind. The autumn and winter in Shenzhen is warm and dry, and heat island is obvious [43,44]. That is why we chose these three days.
After pre-processing of reflectance correction and radiation correction, the indexes of NDVI, DNMI, and MNDWI (Modified Normalized Difference Water Index) were calculated separately in the different periods.
The Normalized Difference Vegetation Index (NDVI) is an index that characterizes vegetation coverage [45]. The formula is:
N D V I = ( N I R R ) / ( N I R + R )
where NIR is the near infrared band of the image, R is the red band of the image.
The Normalized Difference Moisture Index (NDMI) is an index used to describe the moisture content of vegetation [46]. The formula is:
N D M I = ( N I R M I R ) / ( N I R + M I R )
where NIR is the near infrared band of the image, MIR is the mid infrared band of the image.
The Modified Normalized Difference Water Index (MNDWI) was proposed by Xu [47] based on the study on Normalized Difference Water Index (NDWI) from Mcfeeters [48]. The formula is:
M N D W I = ( G r e e n M I R ) / ( G r e e n + M I R )
where the green and MIR are the green band and the mid infrared band of the image, respectively.
The land surface temperature of Landsat-5 image was calculated using a single-channel algorithm [49], and the improved single-channel algorithm [50] was used to calculate the land surface temperature of the Landsat-8 image; the sub-pixel decomposition method [51] was used to extract the ISA data for the three periods.

2.4. The Identification of Source and Sink Landscapes

For the temperature regulating service, different landscapes play distinct roles in the city, which may be the source landscape of the heat island effect or the sink landscape of the heat island effect. Diverse landscapes have different effects and different processes on the temperature regulating service, or the pattern will also produce different services. The source and sink theory can solve the relationship between the landscapes well and can express the supply and demand of temperature regulating service better. The pattern and the process interact, and it starts a new cycle to integrate the pattern into the process. The object of this study is the urban landscape temperature regulating service. Therefore, the landscape that provides the temperature regulating service in the urban landscape is the “source” landscape, while the landscape that consumes the temperature regulating service is the “sink” landscape.
Based on the result images of NDVI, NDMI, ISA, and LST, the mean value (Table 1) of each image was determined as the threshold value of each index for separating the high values and low values. For simple expression, here we use “L” to represent the low-value part, and “H” to represent the high-value part. A total of 16 landscape types (Table 2) were generated after the superposition of these indexes. We used the combination of characteristic values to name landscape types (Table 2). For example, LLLL represents landscape type with low LST value, low NDVI value, low NDMI value and low ISA value.
The “source–sink” landscape identification is based on the above urban landscape classification. To identify the “source–sink” landscapes, the relationship of land surface temperature between the landscapes and the surrounding environment was established and equidistant buffer analysis was utilized in this study. As the selected data resolution was 30 m, the buffer distance was set to 30 m and extended from the boundary of each landscape for the convenience of calculation. The gradient buffers of 30 m, 60 m, 90 m, 120 m, 150 m, 180 m, 210 m, 240 m, 270 m, and 300 m were, respectively, compared and used to analyze the average temperature in the landscapes and the average temperature of the landscape in each gradient buffer. In order to reduce the influence of uncertainty from single-channel algorithm [52] and mean temperature of landscapes in landscape identification, we assumed that the temperature difference between two adjacent buffers was above 0.2 °C, which is a significant cooling effect. No cooling effect appeared when the temperature difference between two adjacent buffers was less than 0.1 °C. Landscapes with significant cooling effects were designated as the “source” landscape for the temperature regulating service. We extracted the landscapes with the highest temperature value in the landscape type and set them as the “sink” landscape of the temperature regulating service.
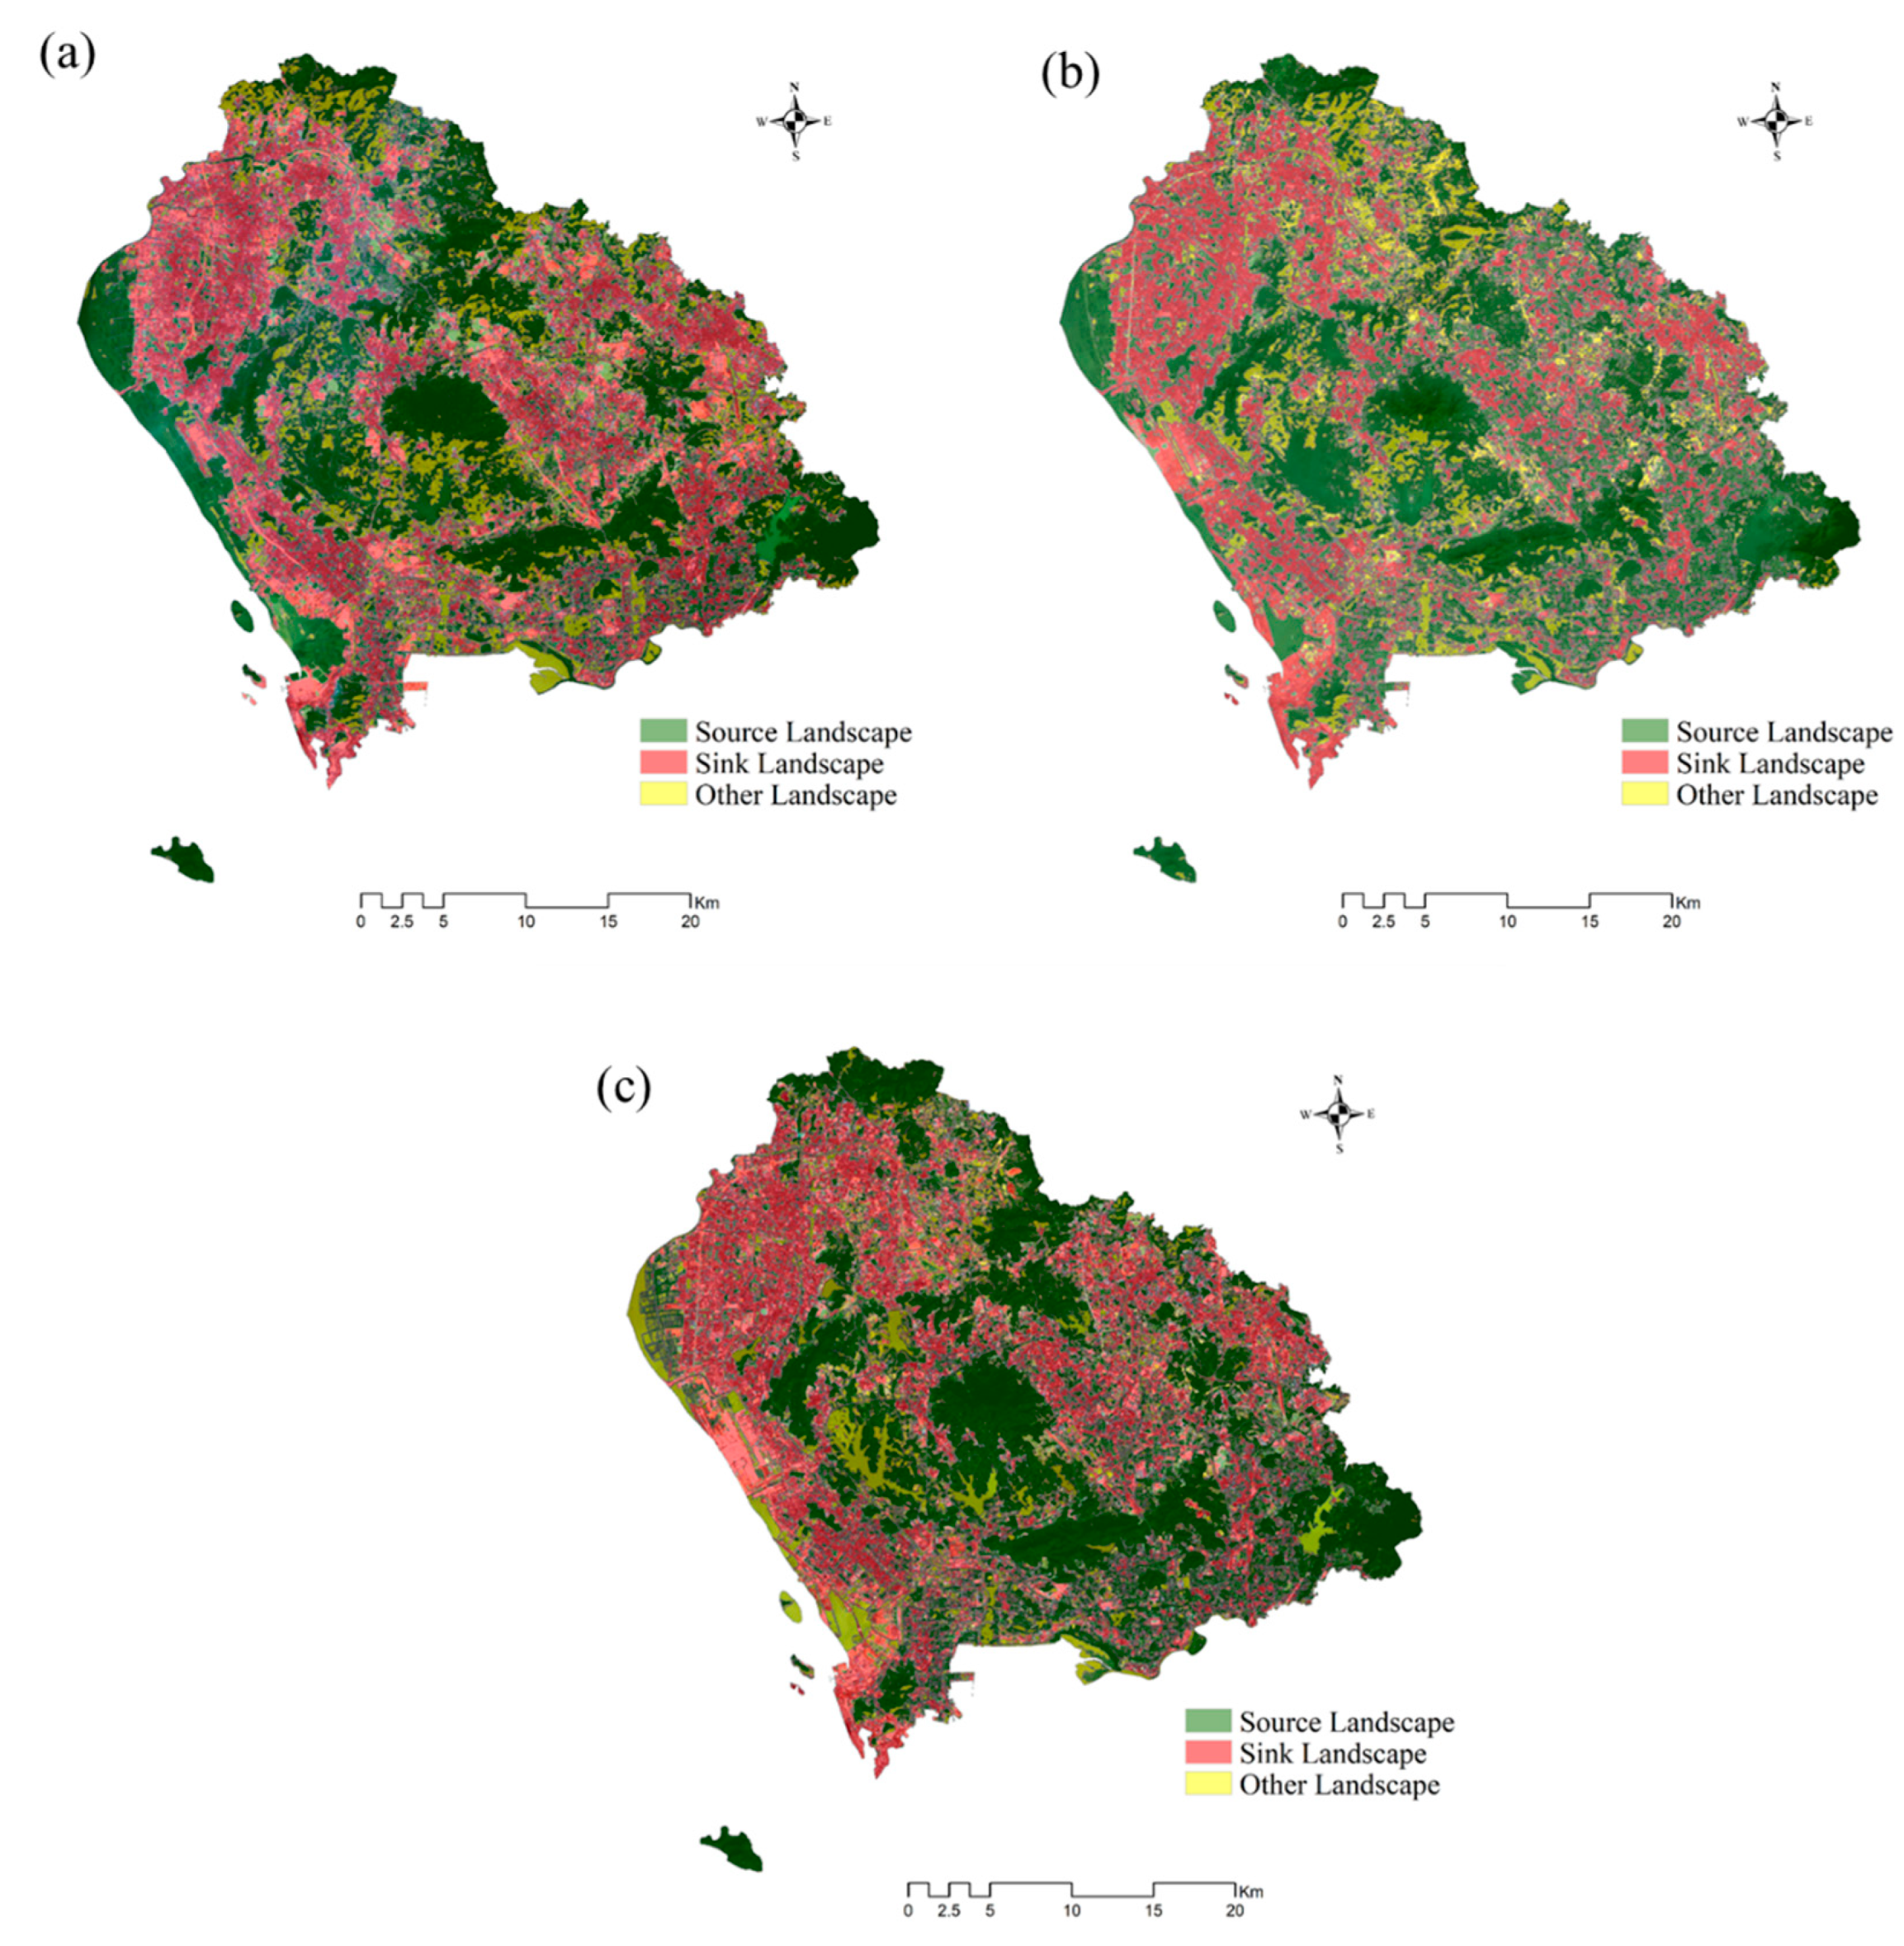
With statistical analysis, we found that the landscape types with significant temperature differences in 2005 were LLLL, LLLH, LLHL, LLHH, and LHHL. Among them, the LLLL type landscape had only 260 pixels, and the area was too small. The impact on the thermal environment and temperature regulation in the western part of Shenzhen was negligible, thus, it was discarded. Therefore, in 2005, the “source” landscapes of the temperature regulating service in western Shenzhen were LLLH, LLHL, LLHH, and LHHL, accounting for 40% of the total area of the study area, about 379 km2. Compared with the original image, LLLH was mostly distributed in the shrub planting area or grassland in Shenzhen and the shadow area of dense buildings; LLHL was the water body; LLHH was the boundary landscape around the water body; LHHL was a large area of green space. In 2010, the “source” landscape of the temperature regulating service in western Shenzhen was LLLH, LLHL, LLHH, LHHL, and LHHH, accounting for 45.5% of the total area of the study area of 533 km2. LHHH was the landscape that was mostly positioned in the shaded area inside the green space, and the cooling effect of this kind of landscape was obvious, thus, it was seen as the “source” landscape. In 2013, the “source” landscape of the western temperature regulating service in Shenzhen was LLLH, LLHH, LHHL, and LHHH, accounting for 43.8% of the total area of the study area, about 525 km2. The “source” landscape area in 2013 differed from that in 2010. The decrease was due to the fact that in 2013 the water body landscape temperature was higher overall and there was no obvious cooling effect on the surrounding environment, thus, it was not classified into the “source” landscape, resulting in a decrease in area. Because the image time was winter, the temperature of the water in winter was higher than the ambient temperature, which was the same with previous research results.
We concluded that the highest temperature in the results was the HLLH landscape, which was the area with high temperatures, low NDVI, low NDMI, and high ISA. Compared with the original influence, this kind of landscape can be utilized to characterize the urban built-up area. Furthermore, its distribution area was also the area of temperature regulating service demand, thus, we set the landscape HLLH as the “sink” landscape with an area of 454.1 km2 (2005), 365.3 km2 (2010), and 432.9 km2 (2013). Figure 2a–c indicates the landscape distribution of “source–sink” in western Shenzhen in 2005, 2010, and 2013, respectively.

2.5. The Valuation Method of Temperature Regulating Service

The current ecosystem value assessment has not already formed a systematic and complete theoretical framework. According to the contemporary comparative evaluation system, the ecosystem service value assessment methods are mainly divided into three categories: direct market assessment, indirect market assessment, and hypothetical market assessment.
This study used the Alternative Cost Method to evaluate the temperature regulating service; Xiao et al. [53] used this method to calculate the value of a forest cooling service in Guangzhou. It was replaced by the value of urban source temperature regulating the “source” landscape cooling effect by the value of energy consumed by air-conditioning cooling. We still used their parameters for cooling space calculation. In civil housing with an area of 14.4 m2 and a space of 43.2 m3, the average temperature of the air conditioner is lowered by 1 °C, and the power consumption is about 1 kWh. By taking a height of 5 m as the cooling space for the “source” landscape of urban temperature regulation, and taking the area of the “source” landscape of Shenzhen’s temperature regulation, the total cooling space is obtained. The number of air-conditioning days in Shenzhen is about 150 days a year. The electricity price is based on the current average price of electricity in Shenzhen, 0.797 yuan/kWh. The formula is:
V = R D T A C ,
where V refers to the total value of the temperature regulating service value, in yuan; R refers to the urban landscape temperature regulating space of Shenzhen, generally obtained by multiplying 5 m by the cooling landscape area, in m3; D refers to the number of days of air-conditioning used in Shenzhen every year, in days; T is the degree of temperature drop, that is, the temperature difference, in °C; A refers to the cooling capacity of the air conditioner, that is, the average daily power consumption per unit volume of the air conditioner, which is about 0.02315, in kWh/(m3·°C·d); C is the unit electricity fee for air-conditioning cooling, in yuan/kWh.

2.6. Landscape Pattern Analysis

The landscape pattern is the characteristic of the landscape spatial structure. The landscape pattern index is a quantitative indicator describing the spatial organization structure of the landscape and represents the landscape composition, spatial distribution, and configuration characteristics. Quantitative description and analysis of landscape patterns are the basic way to reveal the relationship between landscape structure and function and to reveal the dynamic changes of the landscape [54]. The landscape pattern interacts with the ecological process. Ecosystem services are influenced and restricted by the landscape pattern. The structure and function of ecosystems vary with the type of landscape. Landscape patterns also affect the exchange of energy and matter between landscapes, thus affecting the regulation of the microclimate in urban areas. Therefore, ecosystem structure configuration directly affects the value of services provided by ecosystems.
This paper studies the impact of landscape pattern on the value of regional temperature regulating service. Therefore, it is relatively more meaningful to analyze the landscape pattern at the type level and patch level—especially at the patch level, which can better reflect the pattern in the process and the impact of the process on the value of the service. A large number of studies has shown that the area of the urban landscape [55,56,57], geometric shapes [58], and pattern characteristics of temperature regulating have a certain effect. Therefore, this study selected the area and shape index for analysis. Because the landscape pattern responds differently to different scales, the area and shape index is analyzed at the patch level. Fragstats 3.4 and Arcgis 10.1 were utilized to analyze the identified “source–sink” landscape.
The shape index is an indicator of the complexity of the patch shape by calculating the relationship between the shape and area of the patch and comparing it with a standard reference shape (circle or square, formula (5) and (6)). There are two common patch shape indices:
S = P 2 π A ,
S = 0.25 P A ,
where P is the patch circumference and A is the patch area. This study chooses the formula (6) to calculate the shape index.

3. Results

3.1. Temperature Regulating Service Value

The value of the temperature regulating service is a monetized representation of the urban landscape temperature regulating service function. In this study, there are two different temperature regulating service values, according to the service supply and demand. The first one is the theoretical service value, which refers to the value of the temperature regulating service provided by the “source” landscape to all the landscapes within the service supply scope; the second one is the actual service value. This refers to the value of the temperature regulating service provided by the “source” landscape to the “sink” landscape within the service supply scope. The actual service value is more practical in the analysis of the “source–sink” landscape pattern.
The “source” landscape produces a cooling effect by exchanging energy with the surrounding environment, but the range of cooling effects is a specified distance. In order to obtain the cooling range, this study extracted the “source” landscape of the temperature regulating service in western Shenzhen on the Arcgis10.1 platform and also used 30 m as buffer distance. The service was established by analyzing the relationship between the average temperatures in each buffer.
Through the comparison of the average temperature in the “source” landscape and the buffer zone, we can find that the supply distance of the temperature regulating service. Through the analysis, the temperature was lower than 0.1 °C at the distance farther than 150 m in 2005. Therefore, the service supply distance of the “source” landscape in 2005 was 150 m. In the same way, the service supply distances of the “source” landscape in 2010 and 2013 were 180 m and 210 m.
Ecosystem services are public goods or social capital that are difficult to trade directly in the market and have strong external economic characteristics. Therefore, the assessment of the value of ecosystem services faces great difficulties [59]. At present, the assessment of the value of ecosystem services is built on ecological economics and environmental science. However, as different scholars have different understandings of ecological value accounting, the value of ecosystem services derived from the same ecosystem is not the same. This study used the Alternative Cost Method and replaced the cooling value of urban temperature regulation of the “source” landscape with the value of energy consumed by air-conditioning cooling. According to the formula, the theoretical value of the temperature regulating service for the “source” landscape of the temperature regulating service in western Shenzhen in 2005, 2010, and 2013 was calculated to be 16.638 billion yuan/year, 23.728 billion yuan/year, and 37.495 billion yuan/ year.
The “source” landscape and the “sink” landscape are interdependent. They are interacting with each other. There is no “sink” landscape, and the meaning of the “source” landscape cannot be discussed. The temperature regulating service should be demand-oriented, and it is more practical to calculate the number of affected “sink” landscapes in the “source” landscape buffer and the value of the temperature regulating service that exists. In this study, the value is described as the actual temperature regulating service value. By still using the above temperature regulating service value calculation method, the actual temperature regulating service values in 2005, 2010, and 2013 in western Shenzhen were calculated to be 3.043 billion yuan/year (2005), 3.273 billion yuan/year (2010), and 4.308 billion yuan/year, indicating that the theoretical value of temperature regulating service is estimated to be high—compared with the actual value of this study and the value of predecessors [60,61], it is too high.

3.2. Pattern Response of Temperature Regulating Service

3.2.1. Area Index Analysis

At the patch level, we calculated two indicators: area index and shape index. The calculation results show that the smallest “source” landscape area of the temperature regulating service in western Shenzhen in 2005, 2010, and 2013 were 0.09 ha, and the maximum area was 11,277.99 ha, 34,613.37 ha, and 27,794.97 ha. The patch area was under a profound effect on temperature regulation. Therefore, we divided the patch sizes into five levels and compared the cooling effect of each level of patches.
Depending on the theory of landscape ecology, the size of the patch affects the aggregation of energy in the patch. Su et al. [58] found that the green area of urban parks in Guangzhou has a significant positive correlation with the average cooling range of the park. In this study, patch classifications of different sizes were analyzed and divided into five categories based on the order of magnitude increase of the number of pixels: single pixel area size (0.09 ha), 2–10 pixels (0.18–0.9 ha), and 11–100 pixels (0.99–9 ha), 101–1000 pixels (9.09–90 ha), and more than 1000 pixels (an area more than 90 ha). Based on the classification data, buffer analysis was performed separately, and the temperature variation in different buffers was still analyzed at intervals of 30 m.
Through calculation and analysis, we found that with the gradual increase of patch area, the distance of supply of the “source” landscape temperature regulating service gradually increased within the range of 0.09 ha–9 ha patch area and the “source” landscape with patch area greater than 9 ha. The distance supplied by the temperature regulating service (i.e., the maximum supply distance) was the same, 150 m (2005), 120 m (2010), and 150 m (2013), as shown in Figure 3.
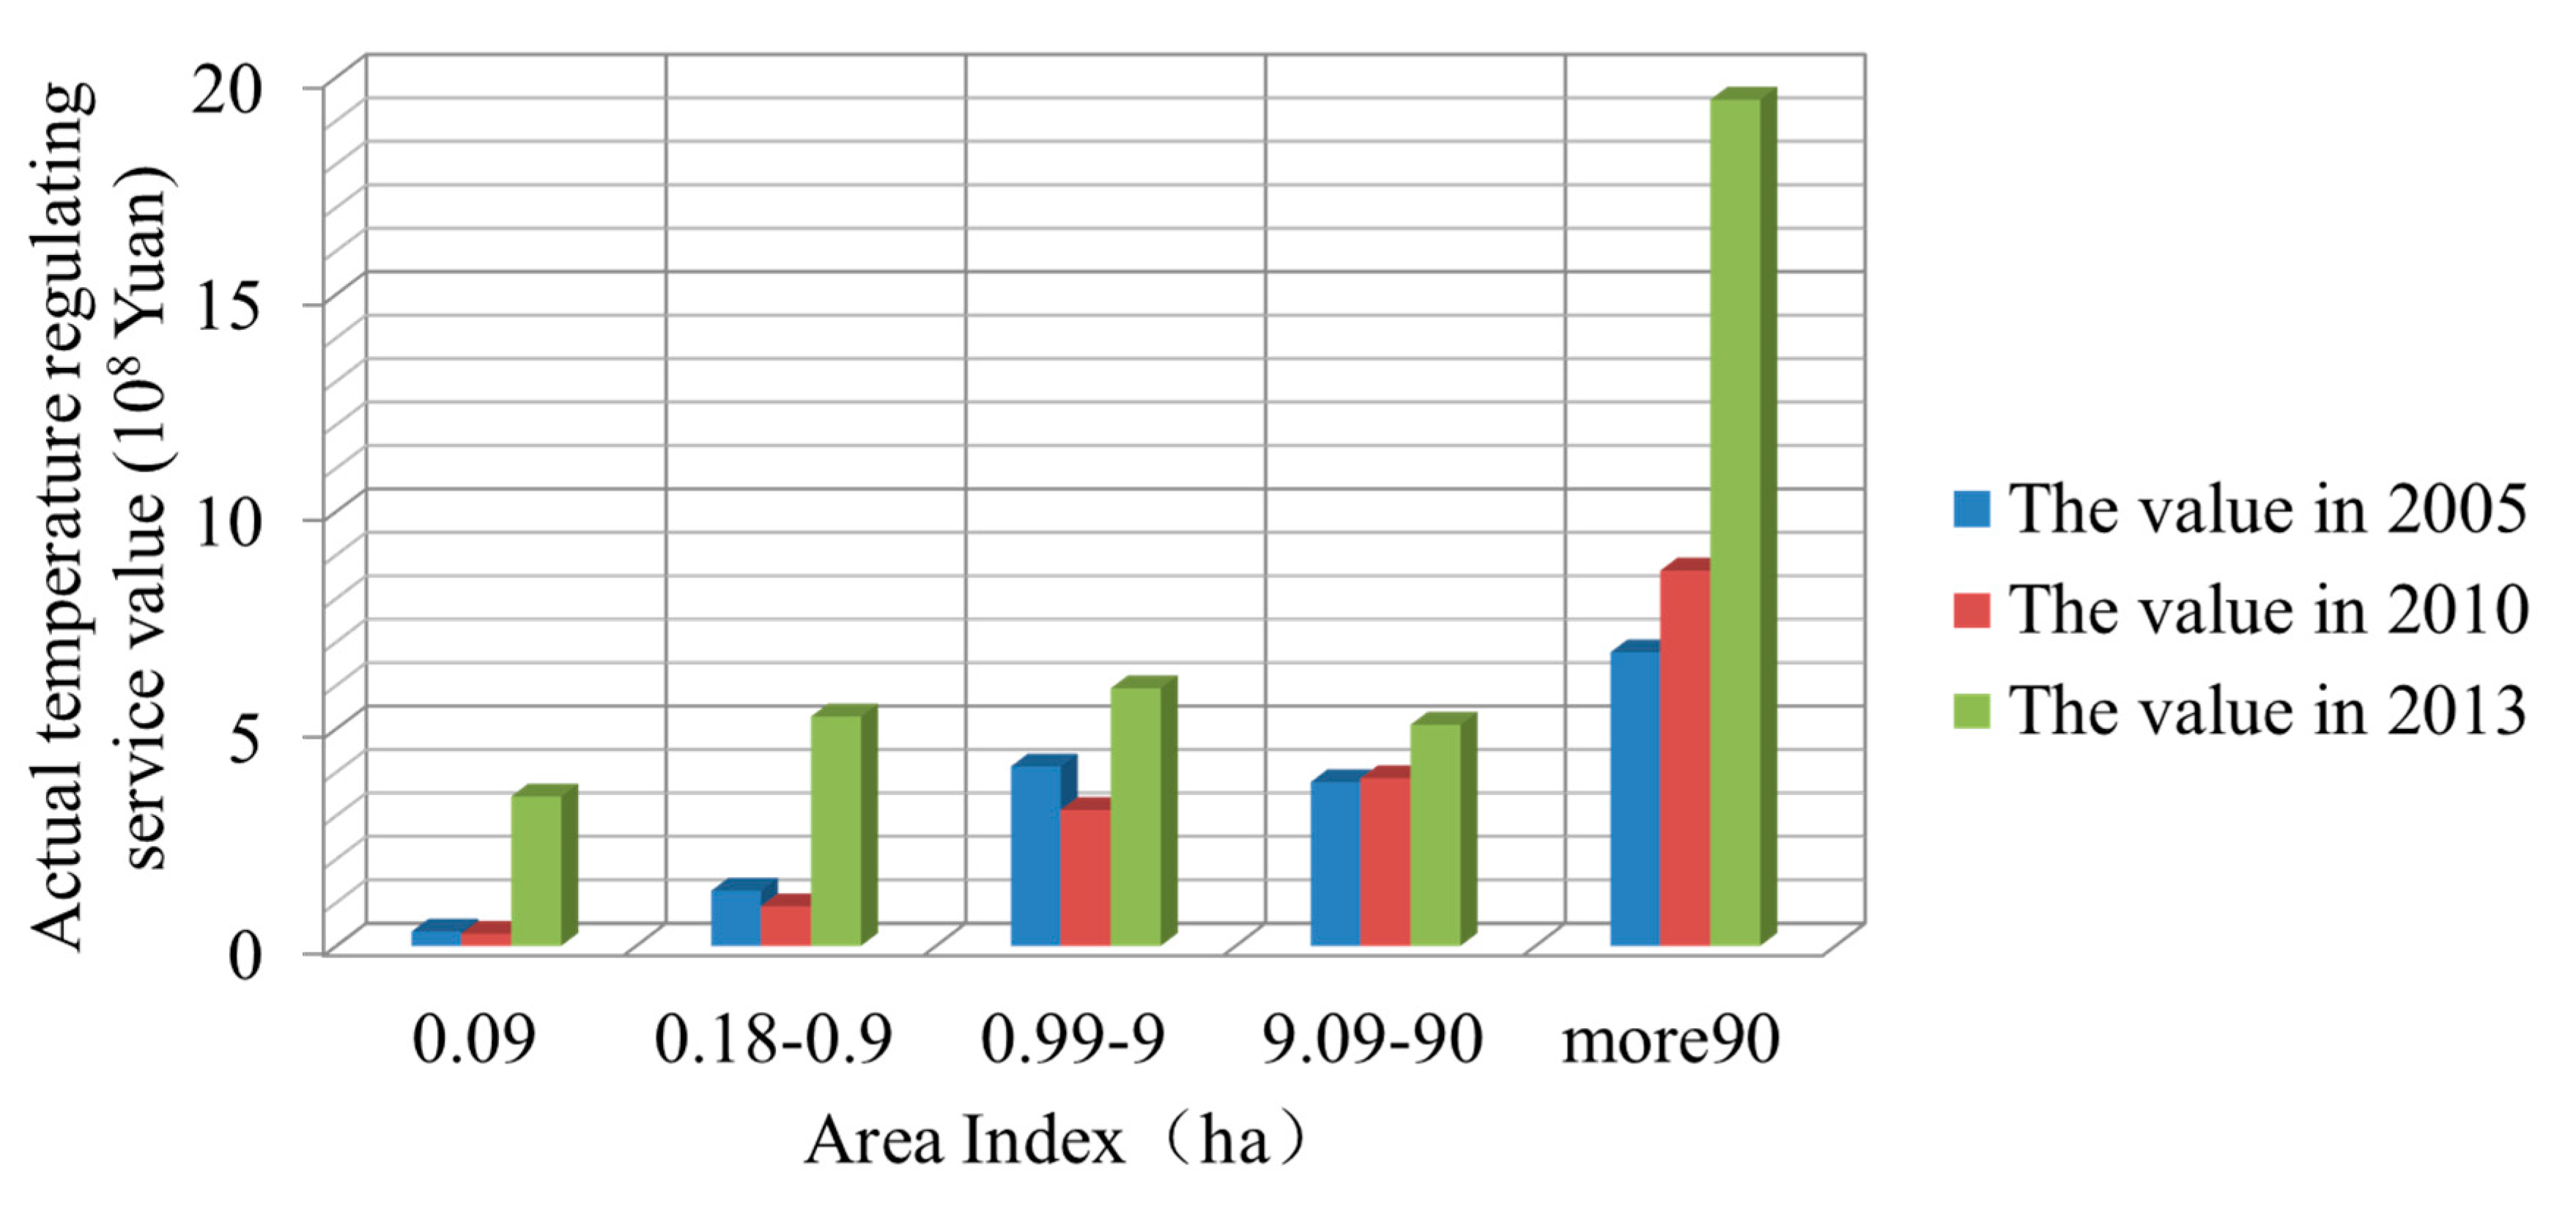
In the same buffer zone, the temperature gradually increased with the increase of the area, while in the “source” landscape of the matching patch area, the temperature gradually decreased with the increase of the supply distance. In the buffer zone closest to the “source” landscape, the temperature cooling effect was the most obvious, with the highest values being 1.3 °C (2005), 1.3 °C (2010), and 1.9 °C (2013). Under different area indexes, the actual temperature regulating service value is presented in Figure 4. In the figure, we can see that as the area increases, the value of service generally increases. Among them, in 2005 and 2013, the actual temperature regulating service value of the patch area of 0.99–9 ha was higher than the actual temperature regulating service value of 9.09–90 ha. The reason is that the total patch area is smaller in a larger area. The area affected by the cooling effect in the buffer zone is less than the area affected by the patch of the smaller area of 0.99–9 ha.

3.2.2. Analysis of Shape Index

The shape is one of the significant features of the landscape. Due to its complexity and dynamics, patch shape is hard to describe accurately, and it is often expressed by the landscape index. Patch shape and boundary characteristics affect the expression of ecosystem functions and the transmission of services by influencing the exchange of matter and energy between patches. The “source” landscape patch shape index in western Shenzhen in 2005 ranged from 1 to 22.84. In 2010, the “source” landscape patch shape index ranged from 1 to 45.53. In 2013, the “source” landscape patch shape index from 1 to 46.46. The calculation results indicate that the larger the shape index, the smaller the number of patches. Therefore, this study divided the shape index into five levels: 1, 2–4, 5–7, 8–10, and greater than 10. A buffer analysis was conducted on the "source" landscape of each level shape index, separated by a distance of 30 m.
The results show (Figure 5), the supply distance of the “source” landscape for the temperature regulating service is the shortest with the shape index of 1, respectively, 120 m (2005), 90 m (2010), and 90 m (2013). There is no definite rule for the supply distance of the “source” landscape service with a shape index greater than 1. In 2005, the biggest distance was 150 m with a shape index of 2–4 and more than 10. In 2010, the supply distances of all the “source” landscapes with a different shape index were the same with a shape index of more than 1 (120 m), while in the “source” landscape of 2013, the distance with a shape index of 5–7 was the longest with 150 m.
In terms of the degree of cooling, the degree of cooling gradually decreases in the same shape index as the buffer distance increases; and with the increase of the shape index, the cooling of the “source” landscape in 2013 gradually increased (maximum 2.0 °C). In 2005 and 2010, the “source” landscape cooling degree mostly appeared in the shape index of 8–10 parts, 1.6 °C and 1.3 °C, respectively.
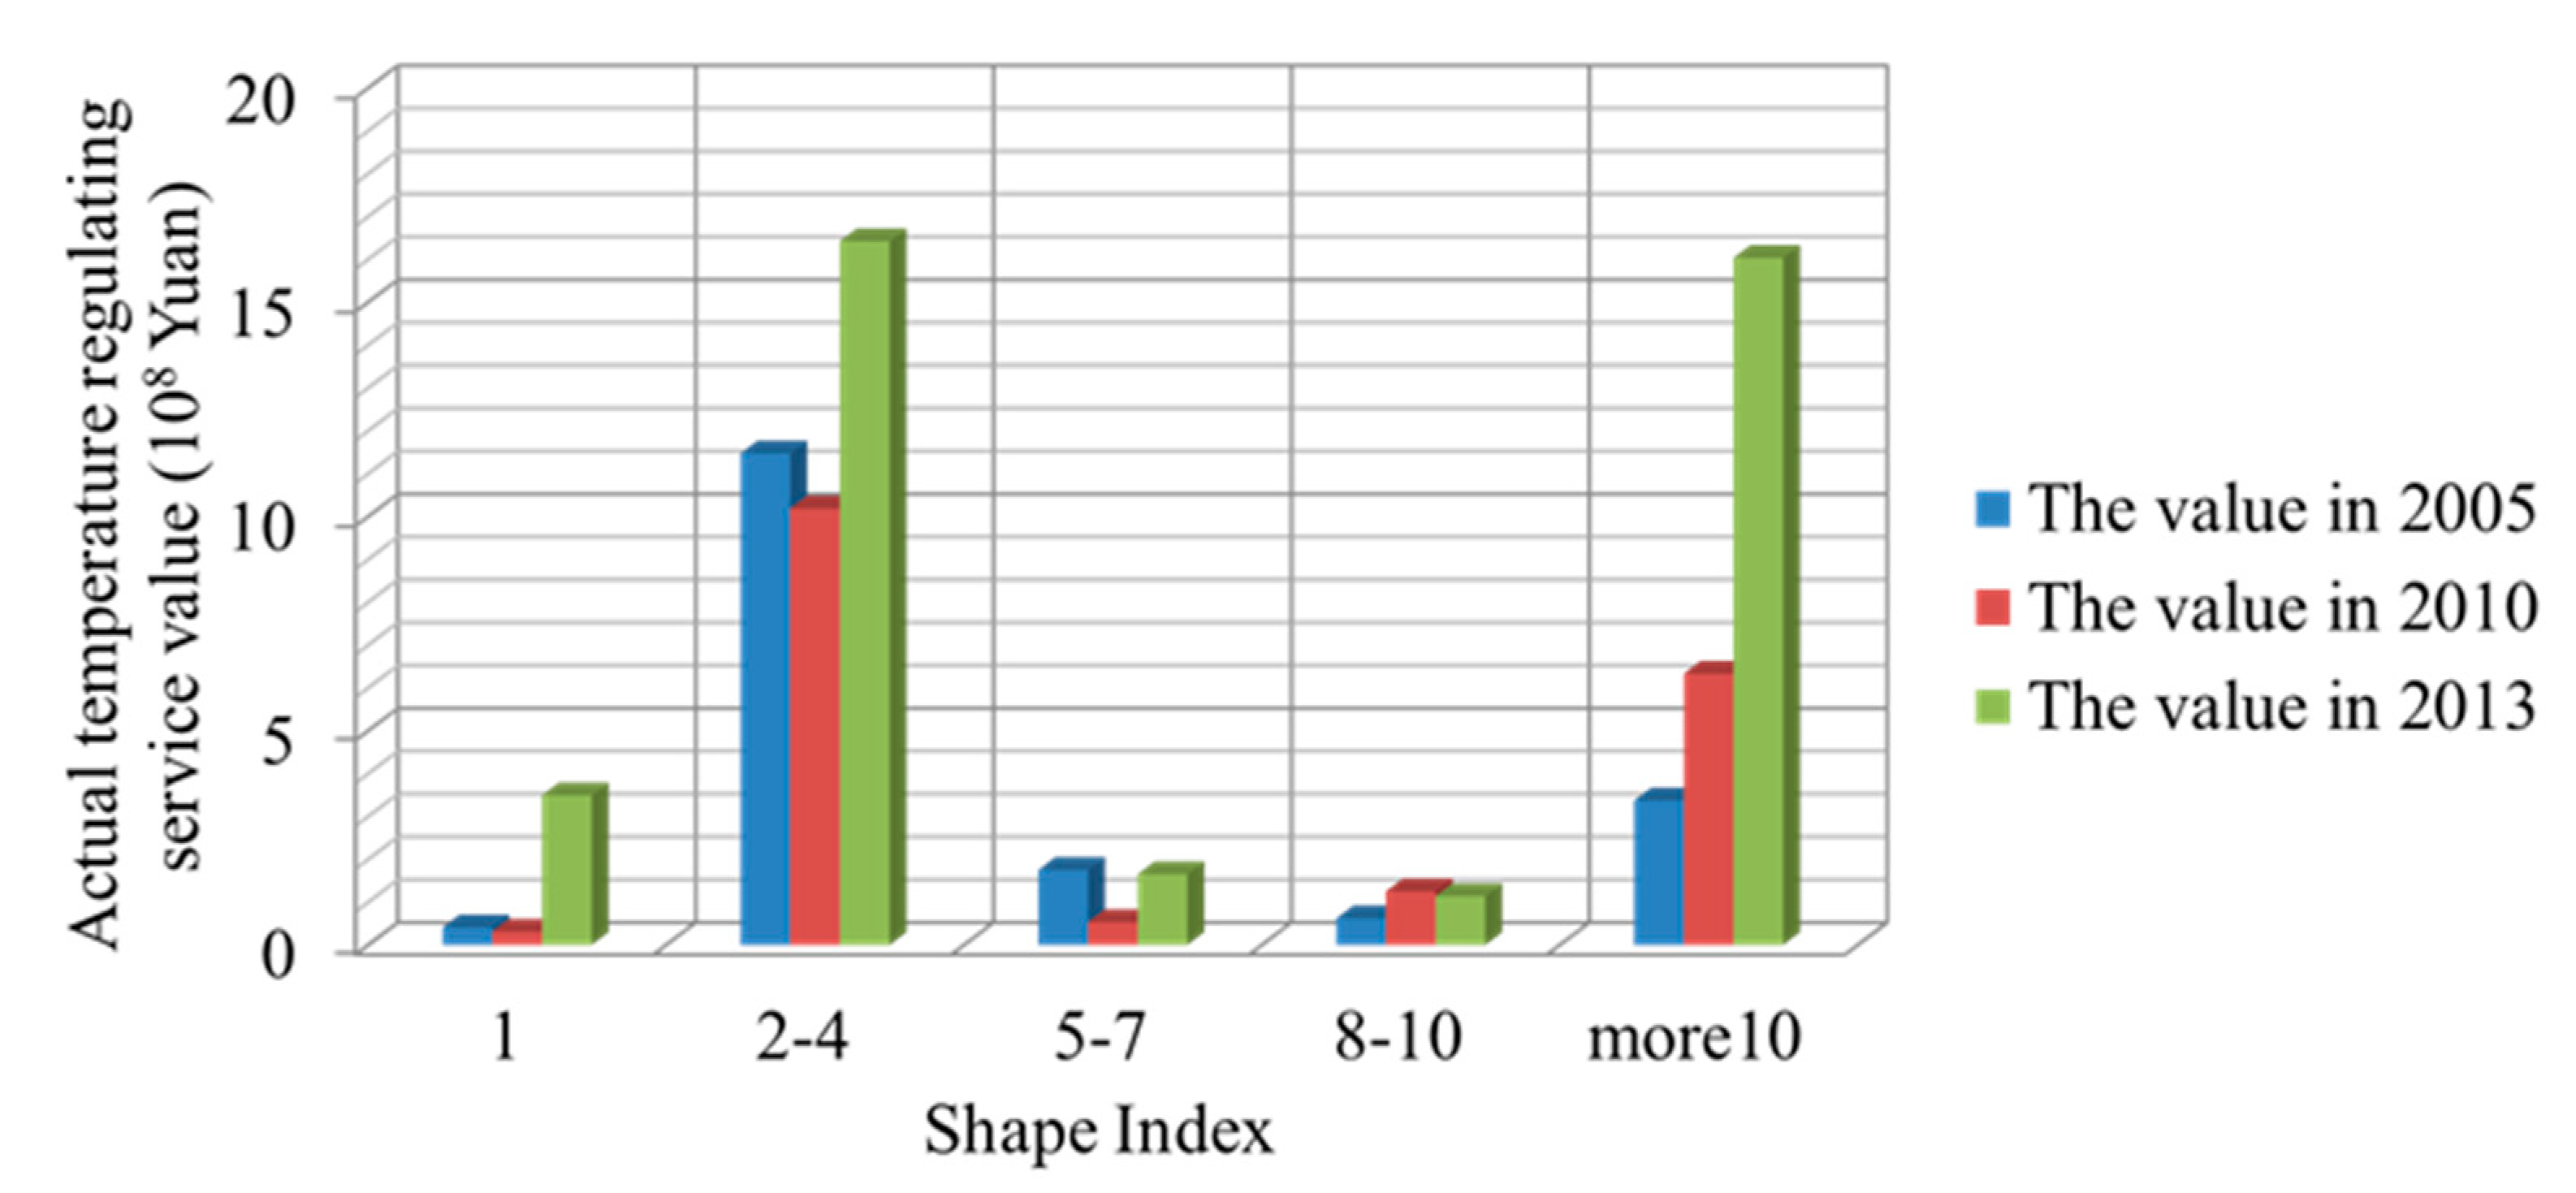
Figure 6 shows the actual temperature regulating service value of the “source” landscape in 2005, 2010, and 2013 under the shape index. It can be observed that the maximum value of the temperature regulating service supply under different shape indexes of the three periods is in the shape index of 2–4. Therefore, the “source” landscape of the temperature regulating service is not as large as the shape index, and the “source” landscape of a single square shape cannot achieve the best cooling effect.

4. Discussion

4.1. Beyond the Pixel Perspective in the Application of Thermal Remote Sensing

With the rapid development of sensors, thermal remote sensing has become increasingly widely used in many aspects [60,61], especially in describing the spatial heterogeneity of land surface temperature [62,63,64,65], which is the basis of urban thermal environment studies. Recent studies have focused on the retrieval methods of land surface temperature [65,66,67], and the correlation between land surface temperature, land use [68,69], and land cover [70,71]. For the city-scale, this study helps the thermal remote sensing study beyond just focusing on a pixel by introducing the concept of the temperature regulating service. The application of service supply and demand landscapes in thermal remote sensing will provide necessary information for the location selection and setting of cooling landscapes in urban planning. Landscape-level information will be more efficient than information that is continuously analyzed at the pixel level for thermal remote sensing [72]. Thermal remote sensing data can provide critical measurements for understanding landscape processes and responses [73]. The landscape classification method combines energy balance and coverage characters, while traditional landscape classification cannot obtain this part of the information from the obtained landscape. The application of a "source–sink" landscape theory combined with the application of remote sensing data can be used for process-based landscape classification in the future and increase our understanding of landscape categories [68], especially the research on urban heat islands that are particularly dependent on energy transfer.
Ecosystem services research has grown rapidly in the past two decades [74], which is also an important field for remote sensing applications. The understanding of ecosystem services has been widely accepted, that is, ecosystem services are mostly directed at human well-being, closely related to human life, and directly affect the quality of human life [75,76,77]. The application of remote sensing in this field is still developing, but there is still a definite knowledge gap. In the existing research, it is rare that the temperature regulating service is studied separately at the regional scale or the local scale, and they are mostly included in climate ecosystem services (e.g., [78]) and not discussed in detail [79]. The impact of climate change on people’s lives has become more and more obvious, especially the increasing frequency and intensity of heatwaves [80,81,82] in urban areas, which led to a lot of properties loss, worsening of health, and deaths. Urban residents are exposed to diverse landscapes, and the outdoor temperature characteristics at the landscape scale are not like the temperature characteristics at home, where they can be controlled by the residents. Considering the demand and supply of residents for a temperature regulating service in the urban environment under the framework of supply and demand landscapes can better reflect the need of urban residents for the welfare related to cooling services, and is used for urban planning and managerial decision making.

4.2. Combination of Ecosystem Services and Landscape ‘Pattern-Process’ Paradigm

In general, in the responses of a temperature regulating service on landscape patterns in western Shenzhen, we found that the supply distance and value of temperature regulating service are positively correlated with the area, and the correlation with the shape index is non-linear. With the gradual complexity of the shape, the service value increases first and then decreases. Furthermore, the landscapes with the smallest shape index and area index have the shortest distance for service supplying. The result is based on our innovative “source–sink” landscape identification method constructed by different surface features and energy transfer relationships between adjacent landscapes.
In landscape ecology, there is a close relationship between landscape patterns and ecological processes. This is a major basis for landscape ecology. The coupling relationship between the two is a key paradigm for landscape ecology [83]. The process emphasizes the dynamic characteristics of the occurrence and development of events or phenomena and is the usual term for the flow, transfer, and transformation of materials, energy, and information within the ecosystem and between different ecosystems in the landscape. The spatial pattern generally involves the type, number, and spatial arrangement and configuration of landscape constituent units; it is not simply a reflection of landscape heterogeneity but also the result of various ecological processes at different scales [84]. The number, shape [85], size [86], and boundary characteristics of patches have specific ecological significance. The pattern relationship [87,88] of the supply landscape of the temperature regulating function is an important consideration that affects the ecological process of temperature regulation, thus affecting the expression of the temperature regulating service at the city-scale [84]. The research on the response of the temperature regulating service on the landscape pattern is, to a certain extent, an innovation of the landscape “pattern–process” paradigm.

4.3. Limitations

There are still some limitations of this study, such as the estimation and response analysis of the temperature regulating service and the interaction between source landscapes of different areas and different shape indexes—especially for the landscape type in the same area or shape index, the limitations were not fully considered. This will more or less have an impact on the results. Even though the influence of some landscapes has been eliminated by considering service demand when calculating the temperature regulating service, in the pattern response part, it is still necessary to consider the interaction between the source landscapes. That means that the pattern analysis of patch level is more detailed and more accurate compared with the pattern analysis of landscape types, which need further study. Relatively speaking, each landscape patch is influenced by the surrounding landscape environment. The existing research [89,90,91] mostly focuses on the scope and intensity and does not perform the calculation and analysis of the service supply efficiency of a single patch level, and the supply efficiency of the temperature regulating service. The efficiency of service providing of landscape patches is important for city planning. Especially for a rapid urbanization area such as Shenzhen, the contradiction of land demand between urban development [42] and ecological service clearly clarifies that it is not realistic to develop a large-scale cooling landscape in Shenzhen to alleviate the urban heat island effect.

5. Conclusions

In summary, this paper argues that landscape identification considering the surface characteristics of the landscapes and the temperature relationship between the surrounding landscapes is useful to the identification of the “source–sink” landscapes for urban cooling of the city. This can provide reasonable support for the supply and demand analysis for heat island mitigation in urban planning. For this aim, we proposed an innovative approach of analyzing the relationship between the “source” landscape for decreasing temperature and the “sink” landscape for increasing temperature, which is beyond the recent studies that have focused on pixels. It is an important attempt in the application of thermal remote sensing. Importantly, our results provide evidence for landscape patterns affecting the provision of urban ecosystem services. With the frequent occurrence of urban heat waves, the supply and demand of temperature regulating services at the city-scale should be valued. In particular, the characteristics of the landscape pattern of supply and demand of cooling services are the major factors affecting the benefits of urban residents’ temperature regulating service. We believe that landscape identification based on temperature relationships can better characterize landscape features for the purpose of a temperature regulating service. Future studies could fruitfully explore this issue further by exploring the pattern response at site-scale and cooling efficiency. At the same time, it is necessary to pay attention to the interaction between landscapes of different shapes and area characteristics. Therefore, in urban planning, both the shape and area of the source and sink landscapes should be considered, and the proximity between the source and sink landscapes should also be considered to achieve optimal service delivery, especially in fast urbanized areas.

Author Contributions

All authors have read and agreed to the published version of the manuscript. Conceptualization, Miaomiao Xie and Ruiming Ma; Formal analysis, Ruiming Ma; Methodology, Ruiming Ma and Miaomiao Xie; Resources, Miaomiao Xie; Writing—original draft preparation, Ruiming Ma; Writing—review and editing, Miaomiao Xie and Wenju Yun; Supervision, Dehai Zhu; Funding acquisition, Miaomiao Xie.

Funding

This research was funded by the National Natural Science Foundation of China, No.41771204.

Conflicts of Interest

The authors declare no conflict of interest.

References

  1. Bolund, P.; Hunhammar, S. Ecosystem services in urban areas. Ecol. Econ. 1999, 29, 293–301. [Google Scholar] [CrossRef]
  2. Fernández, I.C. A multiple-class distance-decaying approach for mapping temperature reduction ecosystem services provided by urban vegetation in Santiago de Chile. Ecol. Econ. 2019, 161, 193–201. [Google Scholar] [CrossRef]
  3. 2018 Revision of World Urbanization Prospects; United Nations: New York, NY, USA, 2018.
  4. Oke, T.R. The energetic basis of the urban heat island. Q. J. R. Meteorol. Soc. 1982, 108, 1–24. [Google Scholar] [CrossRef]
  5. Rosenfeld, A.H.; Romm, J.J.; Akbari, H.; Pomerantz, M.; Taha, H.G. Policies to Reduce Heat Islands: Magnitudes of Benefits and Incentives to Achieve Them; Lawrence Berkeley National Lab, United States: Berkeley, CA, USA, 1996. [Google Scholar]
  6. Akbari, H.; Pomerantz, M.; Taha, H. Cool surfaces and shade trees to reduce energy use and improve air quality in urban areas. Sol. Energy 2001, 70, 295–310. [Google Scholar] [CrossRef]
  7. Chilling Prospects: Providing Sustainable Cooling for All; SEforALL: Vienna, Austria, 2018.
  8. Kochanek, K.D.; Xu, J.; Murphy, S.L.; Miniño, A.M.; Kung, H.C. Deaths: Final data for 2009. National Vital Statistics Reports: From the Centers for Disease Control and Prevention, National Center for Health Statistics. Natl. Vital Stat. Rep. 2011, 60, 1–116. [Google Scholar]
  9. De Bono, A.; Giuliani, G.; Kluser, S.; Peduzzi, P. Impacts of summer 2003 heat wave in Europe. UNEP/DEWA/GRID-Europe. Environ. Alert Bull. 2004, 2, 1–4. [Google Scholar]
  10. McPherson, E.G.; Nowak, D.; Heisler, G.; Grimmond, S.; Souch, C.; Grant, R.; Rowntree, R. Quantifying urban forest structure, function, and value: The Chicago Urban Forest Climate Project. Urban Ecosyst. 1997, 1, 49–61. [Google Scholar] [CrossRef]
  11. Hare, F.K.; Landsberg, H.E. The Urban Climate. Geogr. Rev. 1983, 73, 242. [Google Scholar] [CrossRef]
  12. Oke, T. City size and the urban heat island. Atmos. Environ. 1973, 7, 769–779. [Google Scholar] [CrossRef]
  13. Xie, M.; Wang, Y.; Fu, M. An overview and perspective about causative factors of surface urban heat island effects. Prog. Geogr. 2011, 30, 35–41. [Google Scholar]
  14. Streutker, D.R. A remote sensing study of the urban heat island of Houston, Texas. Int. J. Remote. Sens. 2002, 23, 2595–2608. [Google Scholar] [CrossRef]
  15. Chen, X.; Zhao, H.-M.; Li, P.-X.; Yin, Z.-Y. Remote sensing image-based analysis of the relationship between urban heat island and land use/cover changes. Remote. Sens. Environ. 2006, 104, 133–146. [Google Scholar] [CrossRef]
  16. Amiri, R.; Weng, Q.; Alimohammadi, A.; Alavipanah, S.K. Spatial–temporal dynamics of land surface temperature in relation to fractional vegetation cover and land use/cover in the Tabriz urban area, Iran. Remote. Sens. Environ. 2009, 113, 2606–2617. [Google Scholar] [CrossRef]
  17. Sailor, D.J. Simulated Urban Climate Response to Modifications in Surface Albedo and Vegetative Cover. J. Appl. Meteorol. 1995, 34, 1694–1704. [Google Scholar] [CrossRef] [Green Version]
  18. Arnfield, A.J. Two decades of urban climate research: A review of turbulence, exchanges of energy and water, and the urban heat island. Int. J. Clim. 2003, 23, 1–26. [Google Scholar] [CrossRef]
  19. Weng, Q.; Lu, D.; Schubring, J. Estimation of land surface temperature–vegetation abundance relationship for urban heat island studies. Remote. Sens. Environ. 2004, 89, 467–483. [Google Scholar] [CrossRef]
  20. Zhang, Y.; Odeh, I.O.; Han, C. Bi-temporal characterization of land surface temperature in relation to impervious surface area, NDVI and NDBI, using a sub-pixel image analysis. Int. J. Appl. Earth Obs. Geoinf. 2009, 11, 256–264. [Google Scholar] [CrossRef]
  21. Yuan, F.; Bauer, M.E. Comparison of impervious surface area and normalized difference vegetation index as indicators of surface urban heat island effects in Landsat imagery. Remote. Sens. Environ. 2007, 106, 375–386. [Google Scholar] [CrossRef]
  22. Roth, M.; Oke, T.R.; Emery, W.J. Satellite-derived urban heat islands from three coastal cities and the utilization of such data in urban climatology. Int. J. Remote. Sens. 1989, 10, 1699–1720. [Google Scholar] [CrossRef]
  23. Goward, S.N.; Xue, Y.; Czajkowski, K.P. Evaluating land surface moisture conditions from the remotely sensed temperature/vegetation index measurements. Remote. Sens. Environ. 2002, 79, 225–242. [Google Scholar] [CrossRef]
  24. Carlson, T.N.; Gillies, R.R.; Perry, E.M. A method to make use of thermal infrared temperature and NDVI measurements to infer surface soil water content and fractional vegetation cover. Remote. Sens. Rev. 1994, 9, 161–173. [Google Scholar] [CrossRef]
  25. Sandholt, I.; Rasmussen, K.; Andersen, J. A simple interpretation of the surface temperature/vegetation index space for assessment of surface moisture status. Remote. Sens. Environ. 2002, 79, 213–224. [Google Scholar] [CrossRef]
  26. Arnold, C.L.; Gibbons, C.J. Impervious Surface Coverage: The Emergence of a Key Environmental Indicator. J. Am. Plan. Assoc. 1996, 62, 243–258. [Google Scholar] [CrossRef]
  27. Xu, H. Quantitative analysis on the relationship of urban impervious surface with other components of the urban ecosystem. Acta Ecol. Sin. 2009, 29, 2456–2462. [Google Scholar]
  28. Peng, J.; Hu, Y.; Liu, Y.; Ma, J.; Zhao, S. A new approach for urban-rural fringe identification: Integrating impervious surface area and spatial continuous wavelet transform. Landsc. Urban Plan. 2018, 175, 72–79. [Google Scholar] [CrossRef]
  29. Li, B.; Wang, H.; Qin, M.; Zhang, P. Comparative study on the correlations between NDVI, NDMI and LST. Prog. Geogr. 2017, 36, 585–596. [Google Scholar]
  30. Mallick, J.; Singh, C.K.; Shashtri, S.; Rahman, A.; Mukherjee, S. Land surface emissivity retrieval based on moisture index from LANDSAT TM satellite data over heterogeneous surfaces of Delhi city. Int. J. Appl. Earth Obs. Geoinf. 2012, 19, 348–358. [Google Scholar] [CrossRef]
  31. Alonso, L.; Renard, F. Integrating Satellite-Derived Data as Spatial Predictors in Multiple Regression Models to Enhance the Knowledge of Air Temperature Patterns. Urban Sci. 2019, 3, 101. [Google Scholar] [CrossRef] [Green Version]
  32. Lin, R.; Qi, X.; Ye, S. Spatial-temporal characteristics of urban heat islands and driving mechanisms in a coastal valley-basin city: A case study of Fuzhou City. Acta Ecol. Sin. 2017, 37, 294–304. [Google Scholar] [CrossRef] [Green Version]
  33. Liu, Y.; Peng, J.; Wang, Y. Efficiency of landscape metrics characterizing urban land surface temperature. Landsc. Urban Plan. 2018, 180, 36–53. [Google Scholar] [CrossRef]
  34. Liu, Y.; Peng, J.; Wang, Y. Relationship between urban heat island and landscape patterns:From city size and landscape composition to spatial configuration. Acta Ecol. Sin. 2017, 37, 7769–7780. [Google Scholar] [CrossRef]
  35. Chen, A.; Sun, R.; Chen, L. Studies on urban heat island from a landscape pattern view: A review. Acta Ecol. Sin. 2012, 32, 4553–4565. [Google Scholar] [CrossRef] [Green Version]
  36. Weng, Q.; Liu, H.; Lu, D. Assessing the effects of land use and land cover patterns on thermal conditions using landscape metrics in city of Indianapolis, United States. Urban Ecosyst. 2007, 10, 203–219. [Google Scholar] [CrossRef]
  37. Liu, H.; Weng, Q. Seasonal variations in the relationship between landscape pattern and land surface temperature in Indianapolis, USA. Environ. Monit. Assess. 2007, 144, 199–219. [Google Scholar] [CrossRef]
  38. Liu, H.; Weng, Q. Scaling Effect on the Relationship between Landscape Pattern and Land Surface Temperature. Photogramm. Eng. Remote. Sens. 2009, 75, 291–304. [Google Scholar] [CrossRef] [Green Version]
  39. Chen, L.; Fu, B.; Xu, J.; Gong, J. Location-weighted landscape contrast index: A scale independent approach for landscape pattern evaluation based on source-sink ecological processes. Acta Ecol. Sin. 2003, 23, 2406–2413. [Google Scholar]
  40. Li, L.-G.; Wang, H.-B.; Zhao, Z.-Q.; Cai, F.; Zhao, X.-L.; Xu, S.-L. Characteristics of urban heat island (UHI) source and sink areas in urban region of Shenyang. In Proceedings of the 2014 Third International Workshop on Earth Observation and Remote Sensing Applications (EORSA), Changsha, China, 11–14 June 2014; pp. 62–66. [Google Scholar] [CrossRef]
  41. Li, W.; Cao, Q.; Lang, K.; Wu, J. Linking potential heat source and sink to urban heat island: Heterogeneous effects of landscape pattern on land surface temperature. Sci. Total. Environ. 2017, 586, 457–465. [Google Scholar] [CrossRef]
  42. Qian, J.; Peng, Y.; Luo, C.; Wu, C.; Du, Q. Urban Land Expansion and Sustainable Land Use Policy in Shenzhen: A Case Study of China’s Rapid Urbanization. Sustainability 2015, 8, 16. [Google Scholar] [CrossRef] [Green Version]
  43. Xie, M.; Chen, J.; Zhang, Q.; Li, H.; Fu, M.; Breuste, J. Dominant landscape indicators and their dominant areas influencing urban thermal environment based on structural equation model. Ecol. Indic. 2020, 111, 105992. [Google Scholar] [CrossRef]
  44. Peng, J.; Jia, J.; Liu, Y.; Li, H.; Wu, J. Seasonal contrast of the dominant factors for spatial distribution of land surface temperature in urban areas. Remote. Sens. Environ. 2018, 215, 255–267. [Google Scholar] [CrossRef]
  45. Lyon, J.G.; Yuan, D.; Lunetta, R.S.; Elvidge, D.C. A change detection experiment using vegetation indices. Photogramm. Eng. Remote Sens. 1998, 64, 143–150. [Google Scholar]
  46. Wilson, E.H.; Sader, S.A. Detection of forest harvest type using multiple dates of Landsat TM imagery. Remote. Sens. Environ. 2002, 80, 385–396. [Google Scholar] [CrossRef]
  47. Xu, H.Q. A study on information extraction of water body with the modified normalized difference water index(MNDWI). J. Remote. Sens. 2005, 9, 589–595. [Google Scholar]
  48. McFeeters, S.K. The use of the Normalized Difference Water Index (NDWI) in the delineation of open water features. Int. J. Remote. Sens. 1996, 17, 1425–1432. [Google Scholar] [CrossRef]
  49. Jiménez-Muñoz, J.-C.; Sobrino, J.A. A generalized single-channel method for retrieving land surface temperature from remote sensing data. J. Geophys. Res. Space Phys. 2003, 108, 2015–2023. [Google Scholar] [CrossRef] [Green Version]
  50. Jiménez-Muñoz, J.-C.; Sobrino, J.A.; Skoković, D.; Mattar, C.; Cristóbal, J. Land Surface Temperature Retrieval Methods From Landsat-8 Thermal Infrared Sensor Data. IEEE Geosci. Remote. Sens. Lett. 2014, 11, 1840–1843. [Google Scholar] [CrossRef]
  51. Phinn, S.R.; Stanford, M.; Scarth, P.; Shyy, T.; Murray, A. Monitoring the Composition and Form of Urban Environments Based on the Vegetation-Impervious Surface-Soil (VIS) Model by Sub-Pixel Analysis Techniques. Int. J. Remote Sens. 2002, 23, 4131–4153. [Google Scholar] [CrossRef]
  52. Sobrino, J.A.; Jiménez-Muñoz, J.-C.; Paolini, L. Land surface temperature retrieval from LANDSAT TM 5. Remote. Sens. Environ. 2004, 90, 434–440. [Google Scholar] [CrossRef]
  53. Xiao, J.; Kang, W.; Yin, S.; Yao, L.; Guo, Q.; Wang, W. Evaluation for service functions of urban forest ecosystem in Guangzhou. Chin. Agric. Sci. Bull. 2011, 27, 27–35. [Google Scholar]
  54. Wu, J. Landscape ecology-concepts and theories. Chin. J. Ecol. 2000, 19, 42–52. [Google Scholar]
  55. Zhou, D.; Zhang, L.; Zhang, L.; Fan, H.; Liu, D. The effect of Landscape Park on urban heat island: A case study of Harbin city. Areal Res. Dev. 2011, 30, 73–78. [Google Scholar]
  56. Luan, Q.; Ye, C.; Liu, Y.; Li, S.; Gao, Y. Effect of urban green land on thermal environment of surroundings based on remote sensing: A case study in Beijing, China. Ecol. Environ. Sci. 2014, 23, 252–261. [Google Scholar]
  57. Chang, C.-R.; Li, M.-H.; Chang, S.-D. A preliminary study on the local cool-island intensity of Taipei city parks. Landsc. Urban Plan. 2007, 80, 386–395. [Google Scholar] [CrossRef]
  58. Su, Y.; Huang, G.; Chen, X.; Chen, S. The cooling effect of Guangzhou City parks to surrounding environments. Acta Ecol. Sin. 2010, 30, 4905–4918. [Google Scholar]
  59. Xie, G.; Zhang, Y.; Lu, C.; Zheng, D.; Cheng, S. Study on valuation of rangeland ecosystem services of China. J. Nat. Resour. 2001, 16, 47–53. [Google Scholar]
  60. Khanal, S.; Fulton, J.; Shearer, S. An overview of current and potential applications of thermal remote sensing in precision agriculture. Comput. Electron. Agric. 2017, 139, 22–32. [Google Scholar] [CrossRef]
  61. Wang, L.; Qu, J.J. Satellite remote sensing applications for surface soil moisture monitoring: A review. Front. Earth Sci. China 2009, 3, 237–247. [Google Scholar] [CrossRef]
  62. Chakraborty, S.D.; Kant, Y.; Mitra, D. Assessment of land surface temperature and heat fluxes over Delhi using remote sensing data. J. Environ. Manag. 2015, 148, 143–152. [Google Scholar] [CrossRef]
  63. Azevedo, J.A.; Chapman, L.; Muller, C.L. Quantifying the Daytime and Night-Time Urban Heat Island in Birmingham, UK: A Comparison of Satellite Derived Land Surface Temperature and High Resolution Air Temperature Observations. Remote. Sens. 2016, 8, 153. [Google Scholar] [CrossRef] [Green Version]
  64. Fu, P.; Weng, Q. A time series analysis of urbanization induced land use and land cover change and its impact on land surface temperature with Landsat imagery. Remote. Sens. Environ. 2016, 175, 205–214. [Google Scholar] [CrossRef]
  65. Bechtel, B. A New Global Climatology of Annual Land Surface Temperature. Remote. Sens. 2015, 7, 2850–2870. [Google Scholar] [CrossRef] [Green Version]
  66. Wang, F.; Qin, Z.; Song, C.; Tu, L.; Karnieli, A.; Zhao, S. An Improved Mono-Window Algorithm for Land Surface Temperature Retrieval from Landsat 8 Thermal Infrared Sensor Data. Remote. Sens. 2015, 7, 4268–4289. [Google Scholar] [CrossRef] [Green Version]
  67. Duan, S.-B.; Li, Z.-L.; Leng, P. A framework for the retrieval of all-weather land surface temperature at a high spatial resolution from polar-orbiting thermal infrared and passive microwave data. Remote. Sens. Environ. 2017, 195, 107–117. [Google Scholar] [CrossRef]
  68. Sinha, S.; Sharma, L.K.; Nathawat, M.S. Improved Land-use/Land-cover classification of semi-arid deciduous forest landscape using thermal remote sensing. Egypt. J. Remote. Sens. Space Sci. 2015, 18, 217–233. [Google Scholar] [CrossRef] [Green Version]
  69. Bokaie, M.; Zarkesh, M.K.; Arasteh, P.D.; Hosseini, A. Assessment of Urban Heat Island based on the relationship between land surface temperature and Land Use/ Land Cover in Tehran. Sustain. Cities Soc. 2016, 23, 94–104. [Google Scholar] [CrossRef]
  70. Kumar, D.; Shekhar, S. Statistical analysis of land surface temperature–vegetation indexes relationship through thermal remote sensing. Ecotoxicol. Environ. Saf. 2015, 121, 39–44. [Google Scholar] [CrossRef]
  71. Tran, D.X.; Pla, F.; Latorre-Carmona, P.; Myint, S.W.; Caetano, M.; Kieu, H.V. Characterizing the relationship between land use land cover change and land surface temperature. ISPRS J. Photogramm. Remote. Sens. 2017, 124, 119–132. [Google Scholar] [CrossRef] [Green Version]
  72. Shen, H.; Huang, L.; Zhang, L.; Wu, P.; Zeng, C. Long-term and fine-scale satellite monitoring of the urban heat island effect by the fusion of multi-temporal and multi-sensor remote sensed data: A 26-year case study of the city of Wuhan in China. Remote. Sens. Environ. 2016, 172, 109–125. [Google Scholar] [CrossRef]
  73. Quattrochi, D.; Luvall, J. Thermal infrared remote sensing for analysis of landscape ecological processes: Methods and applications. Landsc. Ecol. 1999, 14, 577–598. [Google Scholar] [CrossRef]
  74. Costanza, R.; De Groot, R.; Braat, L.; Kubiszewski, I.; Kubiszewski, I.; Sutton, P.; Farber, S.; Grasso, M. Twenty years of ecosystem services: How far have we come and how far do we still need to go? Ecosyst. Serv. 2017, 28, 1–16. [Google Scholar] [CrossRef]
  75. MEA. Ecosystems and Human Well-Being: Synthesis; Island Press: Washington, DC, USA, 2005. [Google Scholar]
  76. TEEB (The Economics of Ecosystems and Biodiversity). The Economics of Ecosystems and Biodiversity: Ecological and Economic Foundations; Earthscan: London, UK, 2010. [Google Scholar]
  77. Díaz, S.; Demissew, S.; Carabias, J.; Joly, C.; Lonsdale, M.; Ash, N.; Larigauderie, A.; Adhikari, J.R.; Aricò, S.; Báldi, A.; et al. The IPBES Conceptual Framework — connecting nature and people. Curr. Opin. Environ. Sustain. 2015, 14, 1–16. [Google Scholar] [CrossRef] [Green Version]
  78. Parsa, V.A.; Salehi, E.; Yavari, A.R.; Van Bodegom, P.M. Evaluating the potential contribution of urban ecosystem service to climate change mitigation. Urban Ecosyst. 2019, 22, 989–1006. [Google Scholar] [CrossRef]
  79. Farrugia, S.; Hudson, M.D.; McCulloch, L. An evaluation of flood control and urban cooling ecosystem services delivered by urban green infrastructure. Int. J. Biodivers. Sci. Ecosyst. Serv. Manag. 2013, 9, 136–145. [Google Scholar] [CrossRef]
  80. Teskey, R.O.; Wertin, T.; Bauweraerts, I.; Ameye, M.; McGuire, M.A.; Steppe, K. Responses of tree species to heat waves and extreme heat events. Plant Cell Environ. 2014, 38, 1699–1712. [Google Scholar] [CrossRef]
  81. Ward, K.; Lauf, S.; Kleinschmit, B.; Endlicher, W. Heat waves and urban heat islands in Europe: A review of relevant drivers. Sci. Total. Environ. 2016, 569, 527–539. [Google Scholar] [CrossRef]
  82. Mitchell, D.; Heaviside, C.; Vardoulakis, S.; Huntingford, C.; Masato, G.; Guillod, B.P.; Frumhoff, P.; Bowery, A.; Wallom, D.; Allen, M. Attributing human mortality during extreme heat waves to anthropogenic climate change. Environ. Res. Lett. 2016, 11, 74006. [Google Scholar] [CrossRef]
  83. Turner, M.G. Landscape ecology: What is the state of the science? Annu. Rev. Ecol. Evol. Syst. 2005, 36, 319–344. [Google Scholar] [CrossRef]
  84. Zhou, W.; Huang, G.; Cadenasso, M. Does spatial configuration matter? Understanding the effects of land cover pattern on land surface temperature in urban landscapes. Landsc. Urban Plan. 2011, 102, 54–63. [Google Scholar] [CrossRef]
  85. Cao, X.; Onishi, A.; Chen, J.; Imura, H. Quantifying the cool island intensity of urban parks using ASTER and IKONOS data. Landsc. Urban Plan. 2010, 96, 224–231. [Google Scholar] [CrossRef]
  86. Cheng, X.; Wei, B.; Chen, G.; Li, J.; Song, C. Influence of Park Size and Its Surrounding Urban Landscape Patterns on the Park Cooling Effect. J. Urban Plan. Dev. 2015, 141. [Google Scholar] [CrossRef]
  87. Li, J.; Song, C.; Cao, L.; Zhu, F.; Meng, X.; Wu, J. Impacts of landscape structure on surface urban heat islands: A case study of Shanghai, China. Remote. Sens. Environ. 2011, 115, 3249–3263. [Google Scholar] [CrossRef]
  88. Huang, G.; Zhou, W.; Cadenasso, M. Is everyone hot in the city? Spatial pattern of land surface temperatures, land cover and neighborhood socioeconomic characteristics in Baltimore, MD. J. Environ. Manag. 2011, 92, 1753–1759. [Google Scholar] [CrossRef] [PubMed]
  89. Yu, Z.; Guo, X.; Jørgensen, G.; Vejre, H. How can urban green spaces be planned for climate adaptation in subtropical cities? Ecol. Indic. 2017, 82, 152–162. [Google Scholar] [CrossRef]
  90. Doick, K.; Peace, A.; Hutchings, T.R. The role of one large greenspace in mitigating London’s nocturnal urban heat island. Sci. Total Environ. 2014, 493, 662–671. [Google Scholar] [CrossRef]
  91. Bowler, D.E.; Buyung-Ali, L.; Knight, T.M.; Pullin, A. Urban greening to cool towns and cities: A systematic review of the empirical evidence. Landsc. Urban Plan. 2010, 97, 147–155. [Google Scholar] [CrossRef]
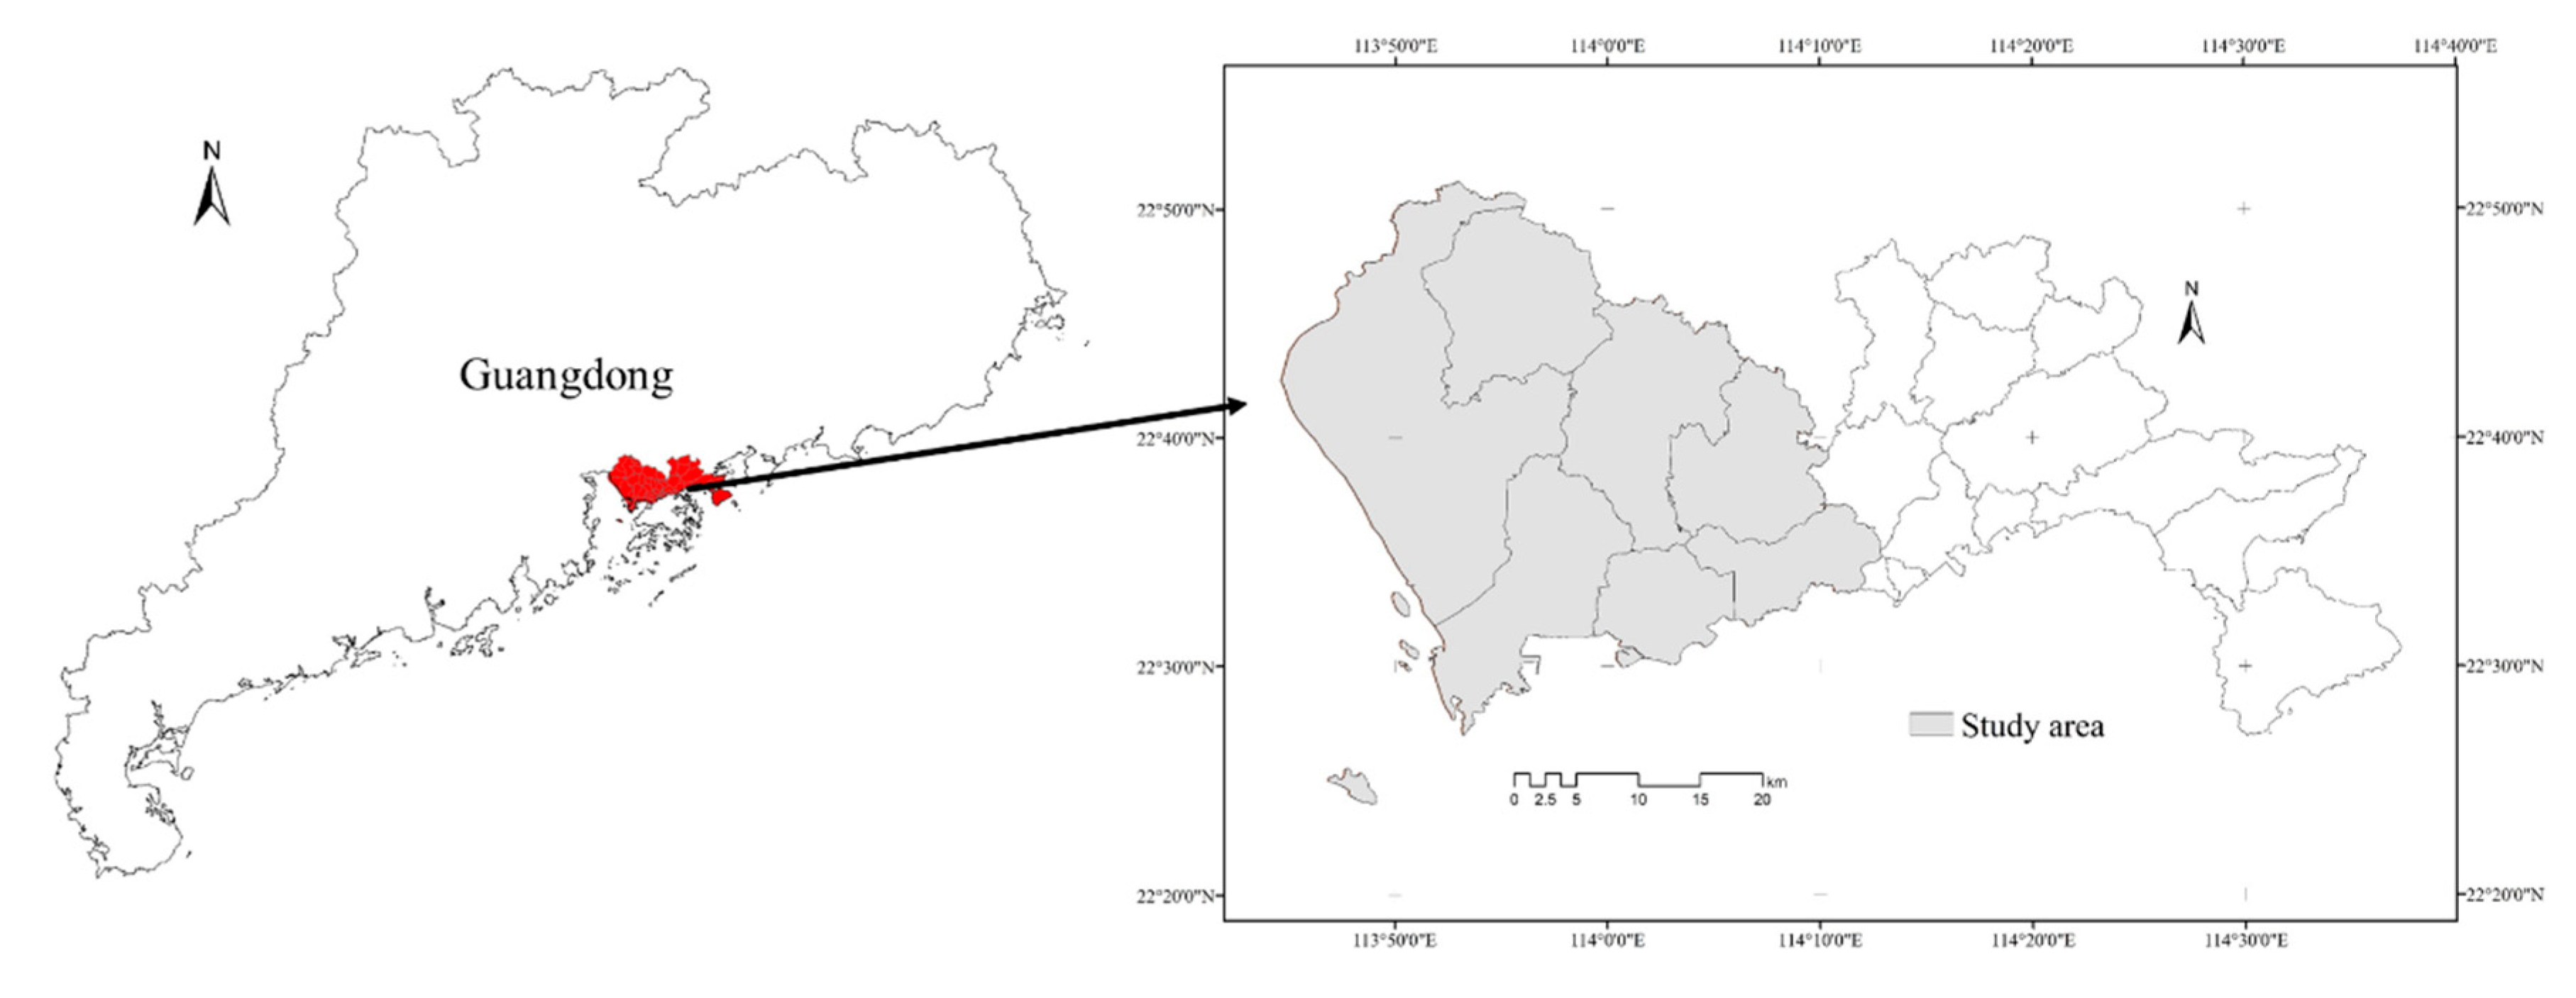
Figure 1. The location of the study area.
Ijgi 09 00295 g001
Figure 2. The distribution of source and sink landscapes in the western of Shenzhen in 2005 (a), 2010 (b), and 2013 (c).
Ijgi 09 00295 g002
Figure 3. Radar diagram of the supply distance of the “source” landscape on the temperature regulating service in (a) 2005, (b) 2010, and (c) 2013 under different patch sizes.
Ijgi 09 00295 g003
Figure 4. Actual temperature regulating service value of “source” landscape in 2005, 2010, and 2013 with different patch areas.
Ijgi 09 00295 g004
Figure 5. Radar diagram of the supply distance of the “source” landscape for temperature regulating service in (a) 2005, (b) 2010, and (c) 2013 under different shape indexes.
Ijgi 09 00295 g005
Figure 6. Actual temperature regulating service value of “source” landscape in 2005, 2010, and 2013 with different shape indexes.
Ijgi 09 00295 g006
Table 1. The mean value of NDVI, NDMI, ISA, and LST in the three periods.
200520102015
NDVI0.220.200.32
NDMI0.330.330.34
ISA0.590.420.63
LST (°C)19.7317.718.13
Table 2. Landscape classification in western Shenzhen.
Landscape TypesLST ValueNDVI ValueNDMI ValueISA Value
LLLLLowLowLowLow
LLLHLowLowLowHigh
LLHLLowLowHighLow
LLHHLowLowHighHigh
LHLLLowHighLowLow
LHLHLowHighLowHigh
LHHLLowHighHighLow
LHHHLowHighHighHigh
HLLLHighLowLowLow
HLLHHighLowLowHigh
HLHLHighLowHighLow
HLHHHighLowHighHigh
HHLLHighHighLowLow
HHLHHighHighLowHigh
HHHLHighHighHighLow
HHHHHighHighHighHigh