Abstract
Malaysia’s heritage structures are facing challenges due to rapid local development and societal challenges that threaten their cultural and artistic values. Improving conservation approaches in this context is an urgent and crucial task. The application of geo-information technologies in laser scanning, photogrammetry, and geographic information systems (GISs) has significantly improved these conservation approaches. In this study, we fused drone images and range data from a laser scanner to construct a high-resolution three-dimensional GIS city model for one traditional Malay settlement located in Malaysia. The results showed that fusing photogrammetry and laser scanning can effectively capture the architectural uniqueness of Malay buildings, including specific façade geometries on walls, roofs, and motifs. The findings show that the development of various geoinformation approaches can assist with the conservation of Malay city heritage in this region.
1. Introduction
Data fusion is commonly applied in many cultural heritage aspects. There are many related studies that have fused the data and information in cultural heritage studies [1,2,3,4,5,6,7,8,9,10]. In principle, fusion purposely exploits intrinsic advantages and overcomes the weaknesses of sensors [11,12,13], and it is a powerful solution in cultural heritage for certain countries. Malay cities can be defined as traditional settlements of indigenous ethnic Malay with highly unique architecture that still preserves Malay culture in its decorative elements and principles of construction [14,15,16,17]. However, Malay cities have recently required significant solutions due to the development pressure that replaces these areas in order to catalyze future modernization. Hence, documenting information and conservation efforts is significant to ensuring the sustainability of cultural heritage in this country.
The fusion of laser scanning and unmanned aerial vehicles (UAVs or drones) is an efficient research technique in terms of device efficiency, with the potential to generate high-frequency visual and radiometric performances [18,19,20]. Rapid, accurate, and high-resolution three-dimensional (3D) data can be acquired using laser scanning methods, particularly mobile laser scanners (MLSs), including specific building façades and ground data from a site. UAVs use a gridded flight plan over an entire site to gather information from above, providing alternative and complementary data to laser scanning. The incorporation of various types of sensor data improves spatial data accuracy, minimizes data processing complexities, and enables automated operations. Combining UAVs and MLSs provide the innovative advantage of automated operations through UAV outputs, permitting identification and the ability to focus on Earth objects from different heights and directions [5,7,21,22]. This increases flexibility so that any type of photo or lens can be used. The integration of UAVs and MLSs produces top-quality outcomes through group action mechanisms that enable the management of the accuracy and reliability of the output. UAVs and laser scanner platforms provide effective analysis and visualization techniques [23].
In this study, we used a multirotor UAV that was low-cost when compared to the other commercial UAVs available on the market, particularly fixed-wing. Multirotor-type UAVs are the most common type of UAV used by professionals, researchers, and hobbyists due to their ability to perform aerial mapping and produce 3D images of specific areas. The data acquired from the newest UAV model can be merged with various data platforms, including MLS datasets, as UAVs are ideal devices for capturing land and roof landscape images, and the laser scanning point clouds can capture areas underneath trees and reflect the interior and exterior façades of building [24,25,26]. If these two datasets are processed effectively, the basic information required to construct an entire 3D city model can be provided [27,28]. Given their low-cost and versatility, rotary wing aircrafts are the most common UAV platform used for aerial photogrammetry. These are classified based on the number of rotors on the platform: tricopters (three rotors), quadcopters (four rotors), hexacopters (six rotors), and octocopters (eight rotors) [29,30,31]. UAVs are inexpensive tools that can be used to conserve cultural heritage and provide fast and easy surveying capabilities for a wide range of data collection tasks. A variety of UAV approaches have been applied in rural or suburban environmental studies, site analyses of cultural heritage, peripheral visualizations, and farming and forest surveillance [10,32,33,34,35].
Laser scanning is a well-established approach for collecting data for various geoinformation applications, such as built environments. It is able to provide precise measurements with accurate visualizations [2,36]. A few types of laser scanners have been based on platforms, including airborne, mobile, and phased-based scanners. Each type has its own limitations, advantages, and costs. However, data from the mobile-based platform, known as a mobile laser scanner (MLSs), have been widely used in urban planning and applications with certain advantages, including urban land cover analysis, digital 3D city modeling, urban environment monitoring, and autonomous vehicle driving [19,37,38,39]. MLS data are collected by using laser scanners positioned in mobile vehicles. Two laser scanners mounted on a vehicle roof scan the scene horizontally and vertically. In the case of a 3D model, horizontal and vertical scans are repeated, using the flat terrain theory to effectively abstract and restore data through specific techniques such as edge detection and MLS point cloud relationships. The use of these data has involved techniques such as data fusion and classification (e.g., using machine learning approaches) developed from remote sensing, computer visualizations, and robotics techniques. The ability of MLSs to extract object features in city components has been used in many urban applications. Based on these tools, many techniques have been introduced and used for many analyses by merging tools to produce outputs such as roof segmentation, urban environment reconstruction, and modeling. MLS data have also been used to identify building shapes, structures, boundaries, façades, roofs, and outdoor/indoor environments, as well as street-level building changes [6,39,40].
For many applications, 3D city models are the essential base dataset. In principle, 3D structures are composed of urban ground morphology and textures, supporting projects such as physical planning and computerized culture safeguarding. The main benefit of 3D modeling is its quality and ability to be converted for future processes. The default technique is used to produce large-scale urban guides, either automatically or semi-automatically, via stereoscopic vision on aerial or satellite imagery. Improvements in resolution and precision have made UAVs ideal for the assembly of digital surface models (DSMs) and 3D models. Compared with the traditional methods, the application of 3D modeling based on data integration is more intuitive and accurate, quickly integrating a large amount of information. Integrating datasets by merging close-range and photogrammetry information sources can be used for building recognition and the restoration of designs [27,41], and has received attention from the fields of architecture, engineering, heritage, and urban planning. Automatically restoring partitions, floors, and ceilings using a process combining primitive extraction features and graph-cut formulations is an important task for curators and urban planners.
Although MLSs and UAVs have conventionally been used for mapping buildings and roofs, new approaches have begun to integrate applications that generate building models with multiple levels of detail for diagnosing accessibility. Quality correlation between the two details can be helpful for achieving objectives through the use of compatible data sources. The current scenario is still evolving in Malaysia, with specific attempts to incorporate information from airborne and ground-based sensors [9,42,43]. The goal of the current study was to fuse UAVs and laser scanner point cloud data to rebuild a selected Malay settlement in Malaysia using high-resolution 3D Geoinformation System (GIS) urban design. Information on Malay façades was associated with each building in the model to support municipality decision-making for conserving cultural heritage. Since the majority of Malay settlements were ignored during mainstream development, we attempted to prove that fusing data from photogrammetry can benefit various applications, including the protection and conservation of national heritage.
2. Materials and Methods
2.1. Study Area
Kota Bharu is located in the state of Kelantan in East Malaysia (6°8′23.5392″ N, 102°14′31.9308″ E), approximately 500 km from the capital city of Kuala Lumpur. The city is important, given its traditional society and influence on Malay heritage, and the growth here is slow compared with other states in the country. This site is important because it is one of two states that have been able to preserve traditional Malay settlements with their unique architectural forms for over 100 years. These traditional Malay towns have clear civic boundaries, with the king’s palace designated as the central administrative area (Figure 1).
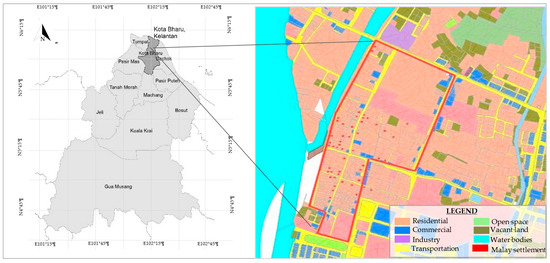
Figure 1.
The location of the Malay settlement within the Malay city boundary (red line) in the study area.
The landscape is characterized by farming fields and Malay settlements along the coast and rivers. The native Malays on our site live in the lowlands and coastal area, supporting themselves with a subsistence rural economy. This has influenced the architecture and settlement: there is no main street, plaza, or main square, only arbitrary systems of winding footpaths exist from one house to another. Chinese scholars have indicated that evidence of historic trading and maritime activities near the study area existed. The study area has long been considered an important center of the state. Before the town was established, early small riverine settlements based primarily on trade and organized into a number of chiefdoms constantly battled for ascendancy over one another. Three groups of social classes could be discerned: sultan (king), lesser nobility, and the agrarian peasants, artisans, and merchants who represented the majority of the population.
2.2. Methods
The general modelling process shown in Figure 2 outlines the main stages in our study and the process of fusing and further reconstructing the traditional Malay city in the study area. The three main stages consisted of data preparation, data pre-processing, and main processing. Further explanations for each stage will be discussed in the following section.
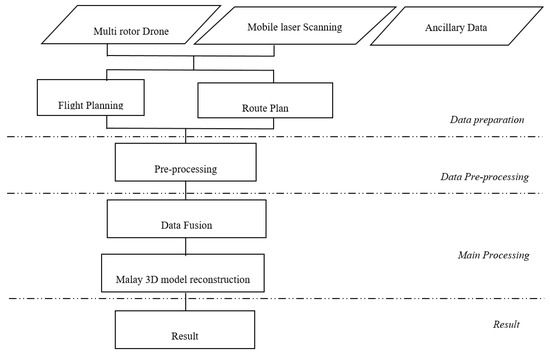
Figure 2.
Workflow for data processing in this study.
We collected and used three types of data in this study: multirotor drones, terrestrial laser scanning, and additional existing GIS land-use vector data. We used ancillary data to support the process of reconstruction, including time series data consisting of historical data on the study area. We used the professional DJI Phantom 3 multirotor UAV and a laser system (Table 1). The UAV required four revolving wings to provide high-resolution imagery for balanced flight at low altitudes; the mobile laser scanning device chosen was the Topcon IP-S3 HD, Japan.

Table 1.
Specifications of drone and Mobile Laser Scanning (MLS) approaches used in this study.
The UAV flight planning was configured using the waypoints for the flight path. The specific altitude, overlaps, and flight speed specifications were determined in this stage. The altitude was set to approximately 80–100 m over an area within a 500-m radius from the King Palace, which was centered in the study area. The flight take-off and direction were set from the west of study area. There were up to 793 images registered by the flight with an overlap of 80% and 60% for longitudinal and side-direction, respectively [44,45,46,47]. Numerous building dimensions were determined from these aerial photos, with the largest height appraisal error being 0.2 m. The data of the overall ground façades of the traditional Malay settlements were collected using MLSs. The mobile mapping system was used to capture the external façade of Malay houses along a 15 km road. The three main stages of our study included selecting the area and routes (trajectory), kinetic calibration, and data capturing. We used the Magnet Master Field, Topcon for capturing the data and the Magnet Collage, Topcon for further point cloud processing. We identified 18 ground control points (GCPs) to ensure the site was accurately georeferenced, with all GCPs being well-distributed throughout the study area.
MLSs consisting of inertial measurement units (IMU) and global navigation satellite system (GNSS) laser scanners, a distance-measuring indicator, and calibrated optical cameras were used for the georeferenced and adjustment data. The unit was produced with time-screened, dense clouds up to 700,000 point per second. The MLS also captured 360˚ horizontal and 30˚ vertical views, increasing the visibility of the collected data and reducing laser shadows. Figure 3a,b depicts the trajectory taken by the system installed on a car to study the 30-ha area. Trajectory and segments were colored by time. The different color of the reflected surface and nearby trajectory caused by the time difference. A distance of 15 km was covered in half a day, with the respective point clouds measured at a point spacing of approximately 4 cm.
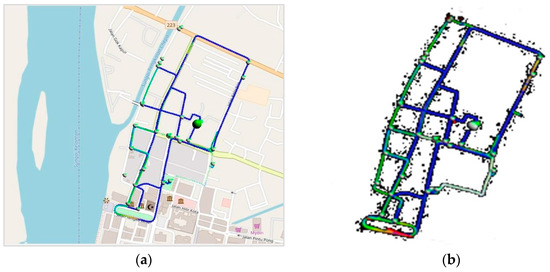
Figure 3.
(a) The formation of the trajectory shown in a point cloud captured by a mobile laser scanner (MLS) in study area; (b) different colors reflecting surface and nearby trajectories as a result of time difference.
2.2.1. Pre-Processing
The data from both systems were validated to increase accuracy during the collection stages. Errors in building height, façade, and typology in the study area within the georeferenced data must be avoided. The UAV post-processing methods had a relatively acceptable 0.7 m root mean square (RMS) error for the accuracy assessment of the flight geolocation details. Images that were collected from the UAV were further processed to create orthophotos and the digital surface model (DSM) in Agisoft photoscan software. In a few hours, the stereo street photograph sequences produced the rudimentary cloud data from the MLS network (Figure 4). The color-coded vertical distances of the measured 3D point cloud were used to detail the external façade of a Malay building consisting of a wall structure, traditional motifs, and half a roof. At the stage of façade modeling, two datasets were registered based on their point clouds, and the roof model from the drone images functioned as a contour to facilitate the construction of the façade of the overall Malay building to compensate for missing MLS point cloud data. The photogrammetric roof design of the same building was imported to suit the point cloud mesh model of the drone.
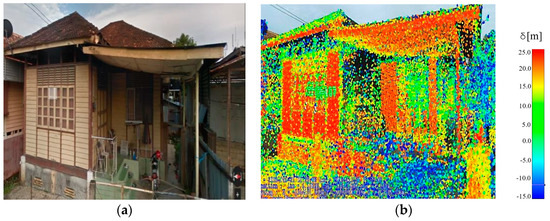
Figure 4.
(a) Highlighting the surface of a Malay building façade in study area; (b) color-coded 3D point cloud indicating overlapping point clouds.
The preparation process for the 3D reconstruction model from the UAV and MLS inputs involved creating 3D models based on the orthophoto from the UAV, supplemented by the MLS. This process allowed us to generate spatially classified and engineering-ready meshes for the entire Malay city. The exposure cluster properties (and therefore the source of each input image) were well known. The accuracy of the photo group was automatically estimated using a process called aero triangulation. Through computer processing, this process considered current camera positions from control points for georeferencing with contiguous and densifying ground controls. The RMS of the re-projection error and distance to rays showed a good indicator with a number less than 1 in pixel and meter.
2.2.2. D Modeling Reconstruction
The 3D model construction further involved a general stage for creating a project, importing the city engine datasets, and setting up Computer Generated Architecture (CGA) rules in City Engine, ESRI software. All data were assigned the same projection as the WGS 1984 UTM Zone 48N (EPSG: 32648) to ensure their accurate overlay. The detailed steps for 3D GIS model reconstruction were: importing databases, assigning the rule file to the objects, scripting a special rule file for the identified or specific objects (building) to obtain the shape of the 3D models, and finally applying a rendering process. The aim of the first step of importing the existing database was to reconstruct the existing city into a 3D GIS model, which required additional data of building height and building footprint as the guides and base construction process. The importing file step started with importing height map data obtained from the DSM, along with texture data (aerial images) and building footprints (polygon file). The height information was the basis of the project; the other data, such as building footprint polygons and texture, were aligned with the height map file. In the second step, CGA script was used to define the rules for creating core 3D content for City Engine, ESRI. The Malay city modeling procedure required user definitions for attributes in order to generate a 3D model based on the CGA rule script. This system scripted a unique language and offered users a generic and flexible tool for creating 3D models of Malay cities. This study demonstrated a CGA of an urban 3D model based on the existing shape of the city as captured from the UAV. During the entire development and reconstruction of 3D GIS modeling, the CGA scripting procedure was applied during the reconstruction stages (Figure 5).
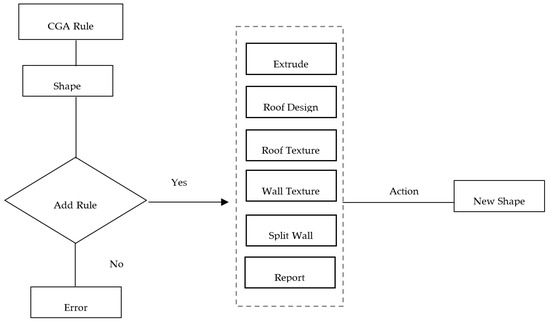
Figure 5.
Process of assigning rules using Computer Generated Architecture (CGA) in 3D model construction.
The third step involved scripting the rules for the identified elements—building height, roof texture, and façade—which were determined based on the existing Malay building forms captured by aerial images and 3D pre-model data during the pre-processing stages. To determine building height, DSM data were used to set the main parameter for height selection. The Malay building footprints were determined based on the building and land-use classifications. To determine the 3D model rule in CGA, the type of file was assigned to the building footprint, and the 3D block model was automatically generated according to the rule script. The rule script consisted of attributes and parameters defined by the user such as elevation height, roof type, building material, roof height, and others attributes related to the study. By applying the CGA rule file, the building footprint or spatial shape data were converted into a 3D model file, and the attributes were automatically generated according to the CGA rule file attribute.
In this study, the building height parameter was changed from the rule definition to the layer attribute, where the building height automatically followed the elevation of the DSM data. The automatically projected building height was aligned with the DSM data. The CGA rule applied to the height of the roof was identified and set up either based on a user-defined value or a DSM layer attribute value. The Malay roof type was selected based on gable, hip, flat, and dome type. The rule scripts and creation for the roof, façade, and building heights generated the information in the report for the 3D model. The final process involved 3D model rendering and output. This process demonstrated the rendering quality and model detailing interoperability with other platforms for viewing and analysis, which was the main aim of this research.
3. Results and Discussion
The final stage of this work consisted of texturing the reconstructed Malay building structures. We used observation and ground inventory to achieve the best possible result for the intended purposes. The results of modeling a Malay city in Kota Bahru by fusing UAVs and MLSs are described in the following sections.
3.1. Result of Pre-Processing
The digital aerial images were processed using Agisoft photoscan. The triangulation was performed, then the digital surface models (DSM) and orthophoto were generated. The orthophoto image in Figure 6 shows the 3D modelling that resulted from the data captured by the drone. The image also contains the point cloud information that can be fused with MLS data. The orthophoto captured the building footprint of the city, which was used as a base for the 3D building models that were later generated. The orthophoto successfully generated roof and wall faces based on photogrammetry stereo measurement, which also reduced the processing time for constructing the building models. The image was processed for the final output considering specified parameters to ensure the quality of the result. During the image processing, the parameters of tie points were produced, representing pairs of pixels that corresponded to the same locations where the images overlapped, and creating thousands of key points for each image. The connecting points that reflected the same area were compared in different images to evaluate where the images intersected. We used the matching image pair variables to sort the image pairs related to the key points. The aerial grid technique was used to organize an image along a grid or corridor (straight line) flight path. The point cloud densification was completed in the next stage with a textured mesh process. The output of the 3D mesh clearly illustrated the buildings as shown in the original UAV images.
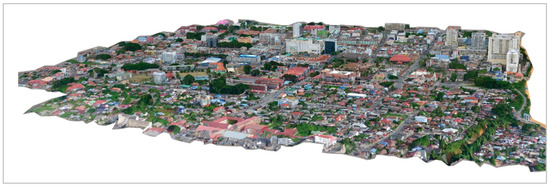
Figure 6.
Three-dimensional images obtained from the georeferenced multirotor UAV.
The MLS results showed that the method successfully captured the building features and Malay motifs including walls, roofs, and windows. Figure 7 indicates that urban façades were loosely captured from the more-accurate MLS point clouds; ground restoration should be disbursed to ascertain a piece-by-piece linear approximation of the object surface. The cloud was triangulated in 3D because the structure of the object was essentially 3D. The 2.5D Delaunay triangulation offered a partial result, but the associated topological surface style was incorrect. As a result, we usually applied 3D Delaunay triangulation ground imitation by eliminating the volumetric convex hull layer. The point cloud must be cleaned from the outside before the surface is recovered. The results show an ability to extract house architecture using MLSs. MLS point clouds produced a significant improvement in the area measured.
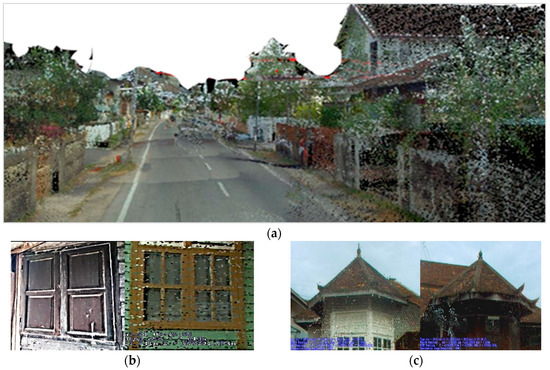
Figure 7.
Urban scene mapping and modeling based on MLSs. The Malay urban façades were captured using the more detailed MLS point clouds; (a) overall Malay settlement, (b) wall, and (c) roof.
3.2. Integration of MLS and UAV Data
By fusing MLS and UAV data, we automatically generated ground- and aerial-based mesh from the DSM. Due to the differences in sensor scanning angle, time, and pose, different data sources were combined to complement each other. The registration of MLSs with drone point clouds was essential because enrollment and entity transitions were matched in a growing international coordination process using the overlapping point clouds in establishing a link between MLS and UAV data. In this case, the orthophoto captured using the UAV system was combined with the semantic segmentation of large-scale urban scenes, obstacle recognition, road detection, and specific forms of Malay buildings for 3D construction. The result for the individual buildings extracted by both systems is shown in Figure 8.
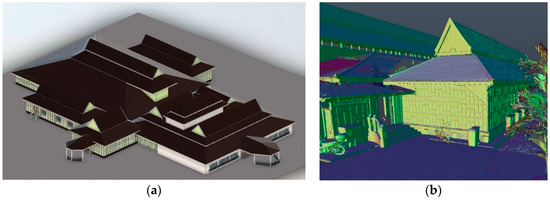
Figure 8.
Results of photo texture: (a) single Malay building geometry reconstruction from combined UAV and MLS data detailing the specific overall architecture of Malay cities, and (b) correctly positioned details of some Malay motifs on the wall, roof, and façade.
The visual analysis showed that the building roof forms were more commonly obtained from the laser point cloud textured by laser scanner images. This result produced two levels of details (LODs), LOD1 and LOD2, which were labelled on the thematic information of Malay settlement buildings along with the semantic information about roof surface, wall surface, and ground surface.
3.3. Malay City Heritage 3D Modeling Reconstruction
The 3D city model for a Malay settlement was developed by combining software, starting by fusing the UAV and laser data, then creating a GIS city engine using a grammar-based or procedural approach for modeling. The results showed that the 3D building structure of this simulated building was successfully produced using the MLS approach fused with the images captured using a photogrammetry from a rotary wing UAV. The result in Figure 9 shows that the elements of Malay cities are accurately visually replicated. Malay roofs were visualized in brown and correctly spotted, accurately representing the Malay settlement in Kota Bahru.
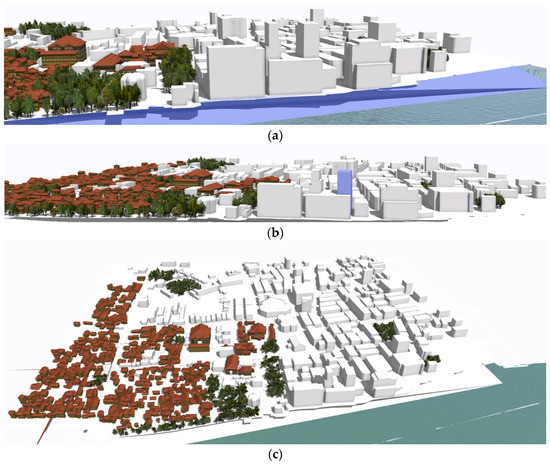
Figure 9.
Block massing results of different perspectives on the Kota Bharu Malay heritage city 3D scene obtained by fusing drone and MLS data (a). (b) East side and (c) North side.
The overall results suggest that these 3D city models identified the spatial and thematic dimensions of the most general aspects of Malay cities and ecosystems by modeling and classifying them in conjunction with the linguistic information model. The final base map contained the buildings, and a land-use footprint was produced. The block massing was generated from the City Engine, ESRI based on existing building heights. This 3D model was also able to store semantic information regarding the Malay buildings.
4. Conclusions
With developments in sensing technology, fusing close range laser scanning and photogrammetry data has provided new opportunities for various applications. In this paper, we presented an approach to 3D city modeling, demonstrating the efficacy of combining laser scanner and drone photogrammetric information for a cultural city in Malaysia. The results showed that the latest property information approach system coupled with advanced geospatial technologies could quickly achieve 3D modeling to help preserve cultural heritage. This interdisciplinary aspect has influenced and been adopted by decision-makers in combination with geospatial technology. Heritage implementations from UAV and laser scanning were originally used to plan material usage and have been modified to meet the needs of field researchers. This implementation and modification should be supported by works from other fields to determine whether current information and preservation methodologies can be extended to cultural heritage applications. These two techniques can be applied for quickly creating 3D models and displays. In some UAV-created models, buildings have an erroneous field due to the building roof having no 3D points from the UAV information; these limitations can be attributed to an incorrect combination of aerial objects with a multi-stereo picture. Optimization of the aerial 3D mapping system involves using UAV photogrammetry and laser scanning with better technical characteristics and capacities for more frequently recorded scans in each flight, thus improving the error in the calculation of artifact measurements. In future works, automated methods for enhancing UAVs and MLSs should be developed to reduce the required time and cost, and to improve the efficacy of the fused dataset. Since this fusion is attracting more attention and is being increasingly used in various applications, particularly heritage architecture, further studies should attempt to enhance the quality of both the UAV and MLS datasets to help achieve certain global sustainable development goals and preserve national heritage at the country level.
Author Contributions
Investigation, Norzailawati Mohd Noor; Methodology, Norzailawati Mohd Noor and Illyani Ibrahim; Writing - original draft, Norzailawati Mohd Noor; Writing - reviewing and editing, Illyani Ibrahim; Validation, Illyani Ibrahim; Resources, Alias Abdullah; Data curation, Ahmad Afiq Aiman Abdullah; Software, Ahmad Afiq Aiman Abdullah. All authors have read and agree to the published version of the manuscript.
Funding
This research was funded by Ministry of Higher Education (MOHE) on Trans-Disciplinary Research Grant Scheme (TRGS16-03-002-00002).
Acknowledgments
We also gratefully acknowledge the anonymous reviewers for their valuable comments that helped to considerably improve the manuscript.
Conflicts of Interest
The authors declare no conflict of interest.
References
- Atheicardi, I.; Chiabrando, F.; Maria Lingua, A.; Noardo, F. Recent trends in cultural heritage 3D survey: The photogrammetric computer vision approach. J. Cult. Herit. 2018, 32, 257–266. [Google Scholar] [CrossRef]
- Barrile, V.; Nunnari, A.; Ponterio, R.C. Laser Scanner for the Architectural and Cultural Heritage and Applications for the Dissemination of the 3D Model. Procedia-Soc. Behav. Sci. 2016, 223, 555–560. [Google Scholar]
- Campanaro, D.M.; Landeschi, G.; Dell’Unto, N.; Touati, A.M.L. 3D GIS for cultural heritage restoration: A ‘white box’ workflow. J. Cult. Herit. 2016, 18, 321–332. [Google Scholar] [CrossRef]
- Verhoeven, G.J.J. Providing an archaeological bird’s-eye view-An overall pictureof ground-based meansto execute low-altitude aerial photography (LAAP) in archaeology. Archaeol. Prospect. 2019, 16, 233–249. [Google Scholar]
- Andrés, A.N.; Pozuelo, F.B.; Marimón, J.R.; Gisbert, A.d. Generation of virtual models of cultural heritage. J. Cult. Herit. 2012, 13, 103–106. [Google Scholar] [CrossRef]
- Gruen, A.; Huang, X.; Qin, R.; Du, T.; Fang, W.; Boavida, J.; Oliveira, A. Joint processing of UAV imagery and terrestrial mobile mapping system data for very high resolution city modeling. Int. Arch. Photogramm. Remote Sens. Spat. Inf. Sci. 2013, 175–182. [Google Scholar] [CrossRef]
- Guarnieri, A.; Remondino, F.; Vettore, A. Digital photogrammetry and TLS data fusion applied to Cultural Heritage 3D modeling. Int. Arch. Photogramm. Remote Sens. Spat. Inf. Sci. 2006, 36, 1–6. [Google Scholar]
- Rodríguez-Gonzálvez, P.; Muñoz-Nieto, A.L.; del Pozo, S.; Sanchez-Aparicio, L.J.; Gonzalez-Aguilera, D.; Micoli, L.; Barsanti, S.G.; Guidi, G.; Mills, J.; Fieber, K. 4D reconstruction and visualization of cultural heritage: Analyzing our legacy through time. Int. Arch. Photogramm. Remote Sens. Spat. Inf. Sci. 2017, 42, 609–616. [Google Scholar]
- Abdullah, A.A.A.; Noor, N.M.; Abdullah, A. Drone 3D mapping in identifying Malay urban form: Case study of Kota Bharu. In Proceedings of the IOP Conference Series: Earth and Environmental Science, 9th IGRSM International Conference and Exhibition on Geospatial & Remote Sensing (IGRSM 2018), Kuala Lumpur, Malaysia, 24–25 April 2018. [Google Scholar]
- Ramos, M.M.; Remondino, F. Data fusion in cultural heritage—A review. Int. Arch. Photogramm. Remote Sens. Spat. Inf. Sci. -Isprs Arch. 2015, 40, 359–363. [Google Scholar] [CrossRef]
- Van Genderen, J. Perspectives on the nature of geospatial information. Geo-Spat. Inf. Sci. 2017, 20, 57–58. [Google Scholar] [CrossRef]
- Hollick, J.; Helmholz, P.; Belton, D. Non-parametric belief propagation for mobile mapping sensor fusion. Geo-Spat. Inf. Sci. 2016, 19, 195–201. [Google Scholar]
- Dold, J.; Groopman, J. The future of geospatial intelligence. Geo-Spat. Inf. Sci. 2017, 20, 151–162. [Google Scholar] [CrossRef]
- Kamarudin, Z. Long-roofed Houses of Northeastern Peninsular Malaysia: Sustainability of Its Identity in the Built Environment. Procedia Environ. Sci. 2015, 28, 698–707. [Google Scholar] [CrossRef][Green Version]
- Hassan, Z.; Harun, S.N. Preservation of Malay Singgora Roof. Procedia Environ. Sci. 2013, 17, 729–738. [Google Scholar] [CrossRef]
- Ismail, Z.; Ahmad, A.S. Modularity Concept in Traditional Malay House (TMH) in Malaysia. Int. Conf. Constr. Ind. 2006, 1–12. [Google Scholar]
- Thompson, E.C. Rural villages as socially urban spaces in Malaysia. Urban Stud. 2004, 41, 2357–2376. [Google Scholar] [CrossRef]
- Murtiyoso, A.; Grussenmeyer, P. Documentation of heritage buildings using close-range UAV images: Dense matching issues, comparison and case studies. Photogramm. Rec. 2017, 32, 206–229. [Google Scholar] [CrossRef]
- Murtiyoso, A.; Koehl, M.; Grussenmeyer, P.; Freville, T. Acquisition and processing protocols for UAV images: 3D modeling of historical buildings using photogrammetry. ISPRS Ann. Photogramm. Remote Sens. Spat. Inf. Sci. 2017, 4, 163–170. [Google Scholar] [CrossRef]
- Guisado-Pintado, E.; Jackson, D.W.T.; Rogers, D. 3D mapping efficacy of a drone and terrestrial laser scanner over a temperate beach-dune zone. Geomorphology 2019, 328, 157–172. [Google Scholar] [CrossRef]
- Wang, Y.; Chen, Q.; Zhu, Q.; Liu, L.; Li, C.; Zheng, D. A survey of mobile laser scanning applications and key techniques over urban areas. Remote Sens. 2019, 11, 1540. [Google Scholar] [CrossRef]
- Bastonero, P.; Donadio, E.; Chiabrando, F.; Spanò, A. Fusion of 3D models derived from TLS and image-based techniques for CH enhanced documentation. ISPRS Ann. Photogramm. Remote Sens. Spat. Inf. Sci. 2014, 2, 73–80. [Google Scholar] [CrossRef]
- Rodríguez-Gonzálvez, P.; Campo, Á.G.; Muñoz-Nieto, Á.L. Sánchez-Aparicio, L.J.; González-Aguilera, D.; Diachronic reconstruction and visualization of lost cultural heritage sites. ISPRS Int. J. Geo-Inf. 2019, 8, 61. [Google Scholar]
- Balado, J.; Díaz-Vilariño, L.; Arias, P.; González-Jorge, H. Automatic classification of urban ground elements from mobile laser scanning data. Autom. Constr. 2018, 86, 226–239. [Google Scholar] [CrossRef]
- Gong, F.Y.; Zeng, Z.C.; Zhang, F.; Li, X.; Ng, E.; Norford, L.K. Mapping sky, tree, and building view factors of street canyons in a high-density urban environment. Build. Environ. 2018, 134, 155–167. [Google Scholar] [CrossRef]
- Haala, N.; Cefalu, A.; Kremer, J.; Peter, M. Mobile lidar mapping for urban data capture. In Proceedings of the 14th International Conference on Virtual Systems and Multimedia, Limassol, Cyprus, 20–25 October 2008. [Google Scholar]
- Früh, C.; Zakhor, A. Constructing 3D City Models by Merging Aerial and Ground Views. IEEE Comput. Graph. Appl. 2003, 23, 52–61. [Google Scholar] [CrossRef]
- Lambers, K.; Eisenbeiss, H.; Sauerbier, M.; Kupferschmidt, D.; Gaisecker, T.; Sotoodeh, S.; Hanusch, T. Combining photogrammetry and laser scanning for the recording and modelling of the Late Intermediate Period site of Pinchango Alto, Palpa, Peru. J. Archaeol. Sci. 2007, 34, 1702–1712. [Google Scholar] [CrossRef]
- Hassanalian, M.; Abdelkefi, A. Classifications, applications, and design challenges of drones: A review. Prog. Aerosp. Sci. 2017, 91, 99–131. [Google Scholar] [CrossRef]
- Oczipka, M.; Bemmann, J.; Piezonka, H.; Munkabayar, J.; Ahrens, B.; Achtelik, M.; Lehmann, F. Small drones for geo-archaeology in the steppe: Locating and documenting the archaeological heritage of the Orkhon Valley in Mongolia. In Proceedings of the Remote Sensing for Environmental Monitoring, GIS Applications, and Geology IX, Berlin, Germany, 31 August–3 September 2009. [Google Scholar]
- Chen, C.; Zou, X.; Tian, M.; Li, J.; Wu, W.; Song, Y.; Dai, W.; Yang, B. Low cost multi-sensor robot laser scanning system and its accuracy investigations for indoor mapping application. Int. Arch. Photogramm. Remote Sens. Spat. Inf. Sci. -Isprs Arch. 2017, 42, 83–85. [Google Scholar] [CrossRef]
- Ismail, N.; Tahar, K.N. Extraction of building footprints from different Unmanned Aerial Vehicle (UAV) platforms. Int. J. Eng. Technol. 2018, 7, 67–71. [Google Scholar]
- Noor, N.M.; Abdullah, A.; Hashim, M. Remote sensing UAV/drones and its applications for urban areas: A review. In Proceedings of the IOP Conference Series: Earth and Environmental Science, 9th IGRSM International Conference and Exhibition on Geospatial & Remote Sensing (IGRSM 2018), Kuala Lumpur, Malaysia, 24–25 April 2018. [Google Scholar]
- Menna, F.; Nocerino, E.; Remondino, F.; Dellepiane, M.; Callieri, M.; Scopigno, R. 3D Digitization of an heritage masterpiece-A critical analysis on quality assessment. Int. Arch. Photogramm. Remote Sens. Spat. Inf. Sci. -ISPRS Arch. 2016, 41, 675–683. [Google Scholar] [CrossRef]
- Roca, D.; Martínez-Sánchez, J.; Lagüela, S.; Arias, P. Novel Aerial 3D Mapping System Based on UAV Platforms and 2D Laser Scanners. J. Sens. 2016, 2016. [Google Scholar] [CrossRef]
- Al-Manasir, K.; Fraser, C.S. registration of terrestrial laser scanner data using imagery. Photogramm. Rec. 2006, 21, 255–268. [Google Scholar] [CrossRef]
- Guan, H.; Li, J.; Yu, Y.; Liu, Y. Geometric validation of a mobile laser scanning system for urban applications. In Proceedings of the 2nd ISPRS International Conference on Computer Vision in Remote Sensing (CVRS 2015), Xiamen, China, 28–30 April 2015. [Google Scholar]
- Molnar, A. 3D Reconstruction of Monuments from Drone Photographs Based on the Spatial Reconstruction of the Photogrammetric Method. Adv. Sci. Technol. Eng. Syst. J. 2018, 3, 252–258. [Google Scholar] [CrossRef]
- Qin, R.; Gruen, A. 3D change detection at street level using mobile laser scanning point clouds and terrestrial images. ISPRS J. Photogramm. Remote Sens. 2014, 90, 23–35. [Google Scholar] [CrossRef]
- Hong, S.; Jung, J.; Kim, S.; Cho, H.; Lee, J.; Heo, J. Semi-automated approach to indoor mapping for 3D as-built building information modeling. Comput. Environ. Urban Syst. 2015, 51, 34–46. [Google Scholar] [CrossRef]
- Luhmann, T.; Chizhova, M.; Gorkovchuk, D.; Hastedt, H.; Chachava, N.; Lekveishvili, N. Combination of terrestrial laserscanning, uav and close-range photogrammetry for 3D reconstruction of complex churches in Georgia. ISPRS Ann. Photogramm. Remote Sens. Spat. Inf. Sci. 2019, 42, 753–761. [Google Scholar] [CrossRef]
- Noor, N.M.; Afiq, A.; Abdullah, A.; Abdullah, A.; Ibrahim, I.; Sabeek, S. 3D city modeling using multirotor drone for city heritage conservation. Plan. Malays. 2019, 17, 338–349. [Google Scholar]
- Aiman, A.A.; Noor, N.M.; Abdullah, A. 3D GIS modeling techniques for documentation and preservation of cultural heritage for Southeast Asian. In Proceedings of the 39th Asian Conference on Remote Sensing (ACRS) 2018, Kuala Lumpur, Malaysia, 15–19 October 2018. [Google Scholar]
- Seifert, E.; Seifert, S.; Vogt, H.; Drew, D.; Van Aardt, J.; Kunneke, A.; Seifert, T. Influence of drone altitude, image overlap, and optical sensor resolution on multi-view reconstruction of forest images. Remote Sens. 2019, 11, 1252. [Google Scholar] [CrossRef]
- Jarzabek-Rychard, M.; Karpina, M. Quality analysis on 3d buidling models reconstructed from uav imagery. Int. Arch. Photogramm. Remote Sens. Spat. Inf. Sci. -ISPRS Arch. 2016, 41, 1121–1126. [Google Scholar] [CrossRef]
- Gallacher, D. Drone Applications for Environmental Management in Urban Spaces: A Review. Int. J. Sustain. Land Use Urban Plan. 2017, 3, 1–14. [Google Scholar] [CrossRef]
- Hawkins, S. Using a drone and photogrammetry software to create orthomosaic images and 3D models of aircraft accident sites. In Proceedings of the ISASI 2016 Seminar, Reykjavik, Iceland, 17–20 October 2016. [Google Scholar]
© 2020 by the authors. Licensee MDPI, Basel, Switzerland. This article is an open access article distributed under the terms and conditions of the Creative Commons Attribution (CC BY) license (http://creativecommons.org/licenses/by/4.0/).