LionVu 2.0 Usability Assessment for Pennsylvania, United States
Abstract
1. Introduction
1.1. Literature Review
1.2. Objectives
2. Materials and Methods
2.1. Survey Question Development
2.2. REDCap and Ethical Considerations
2.3. Sample Population and Procedures
2.4. Analyses Performed
3. Results
3.1. Demographic Characteristics
3.2. Employment Characteristics
3.3. United States Cancer Statistics (USCS) Web Map
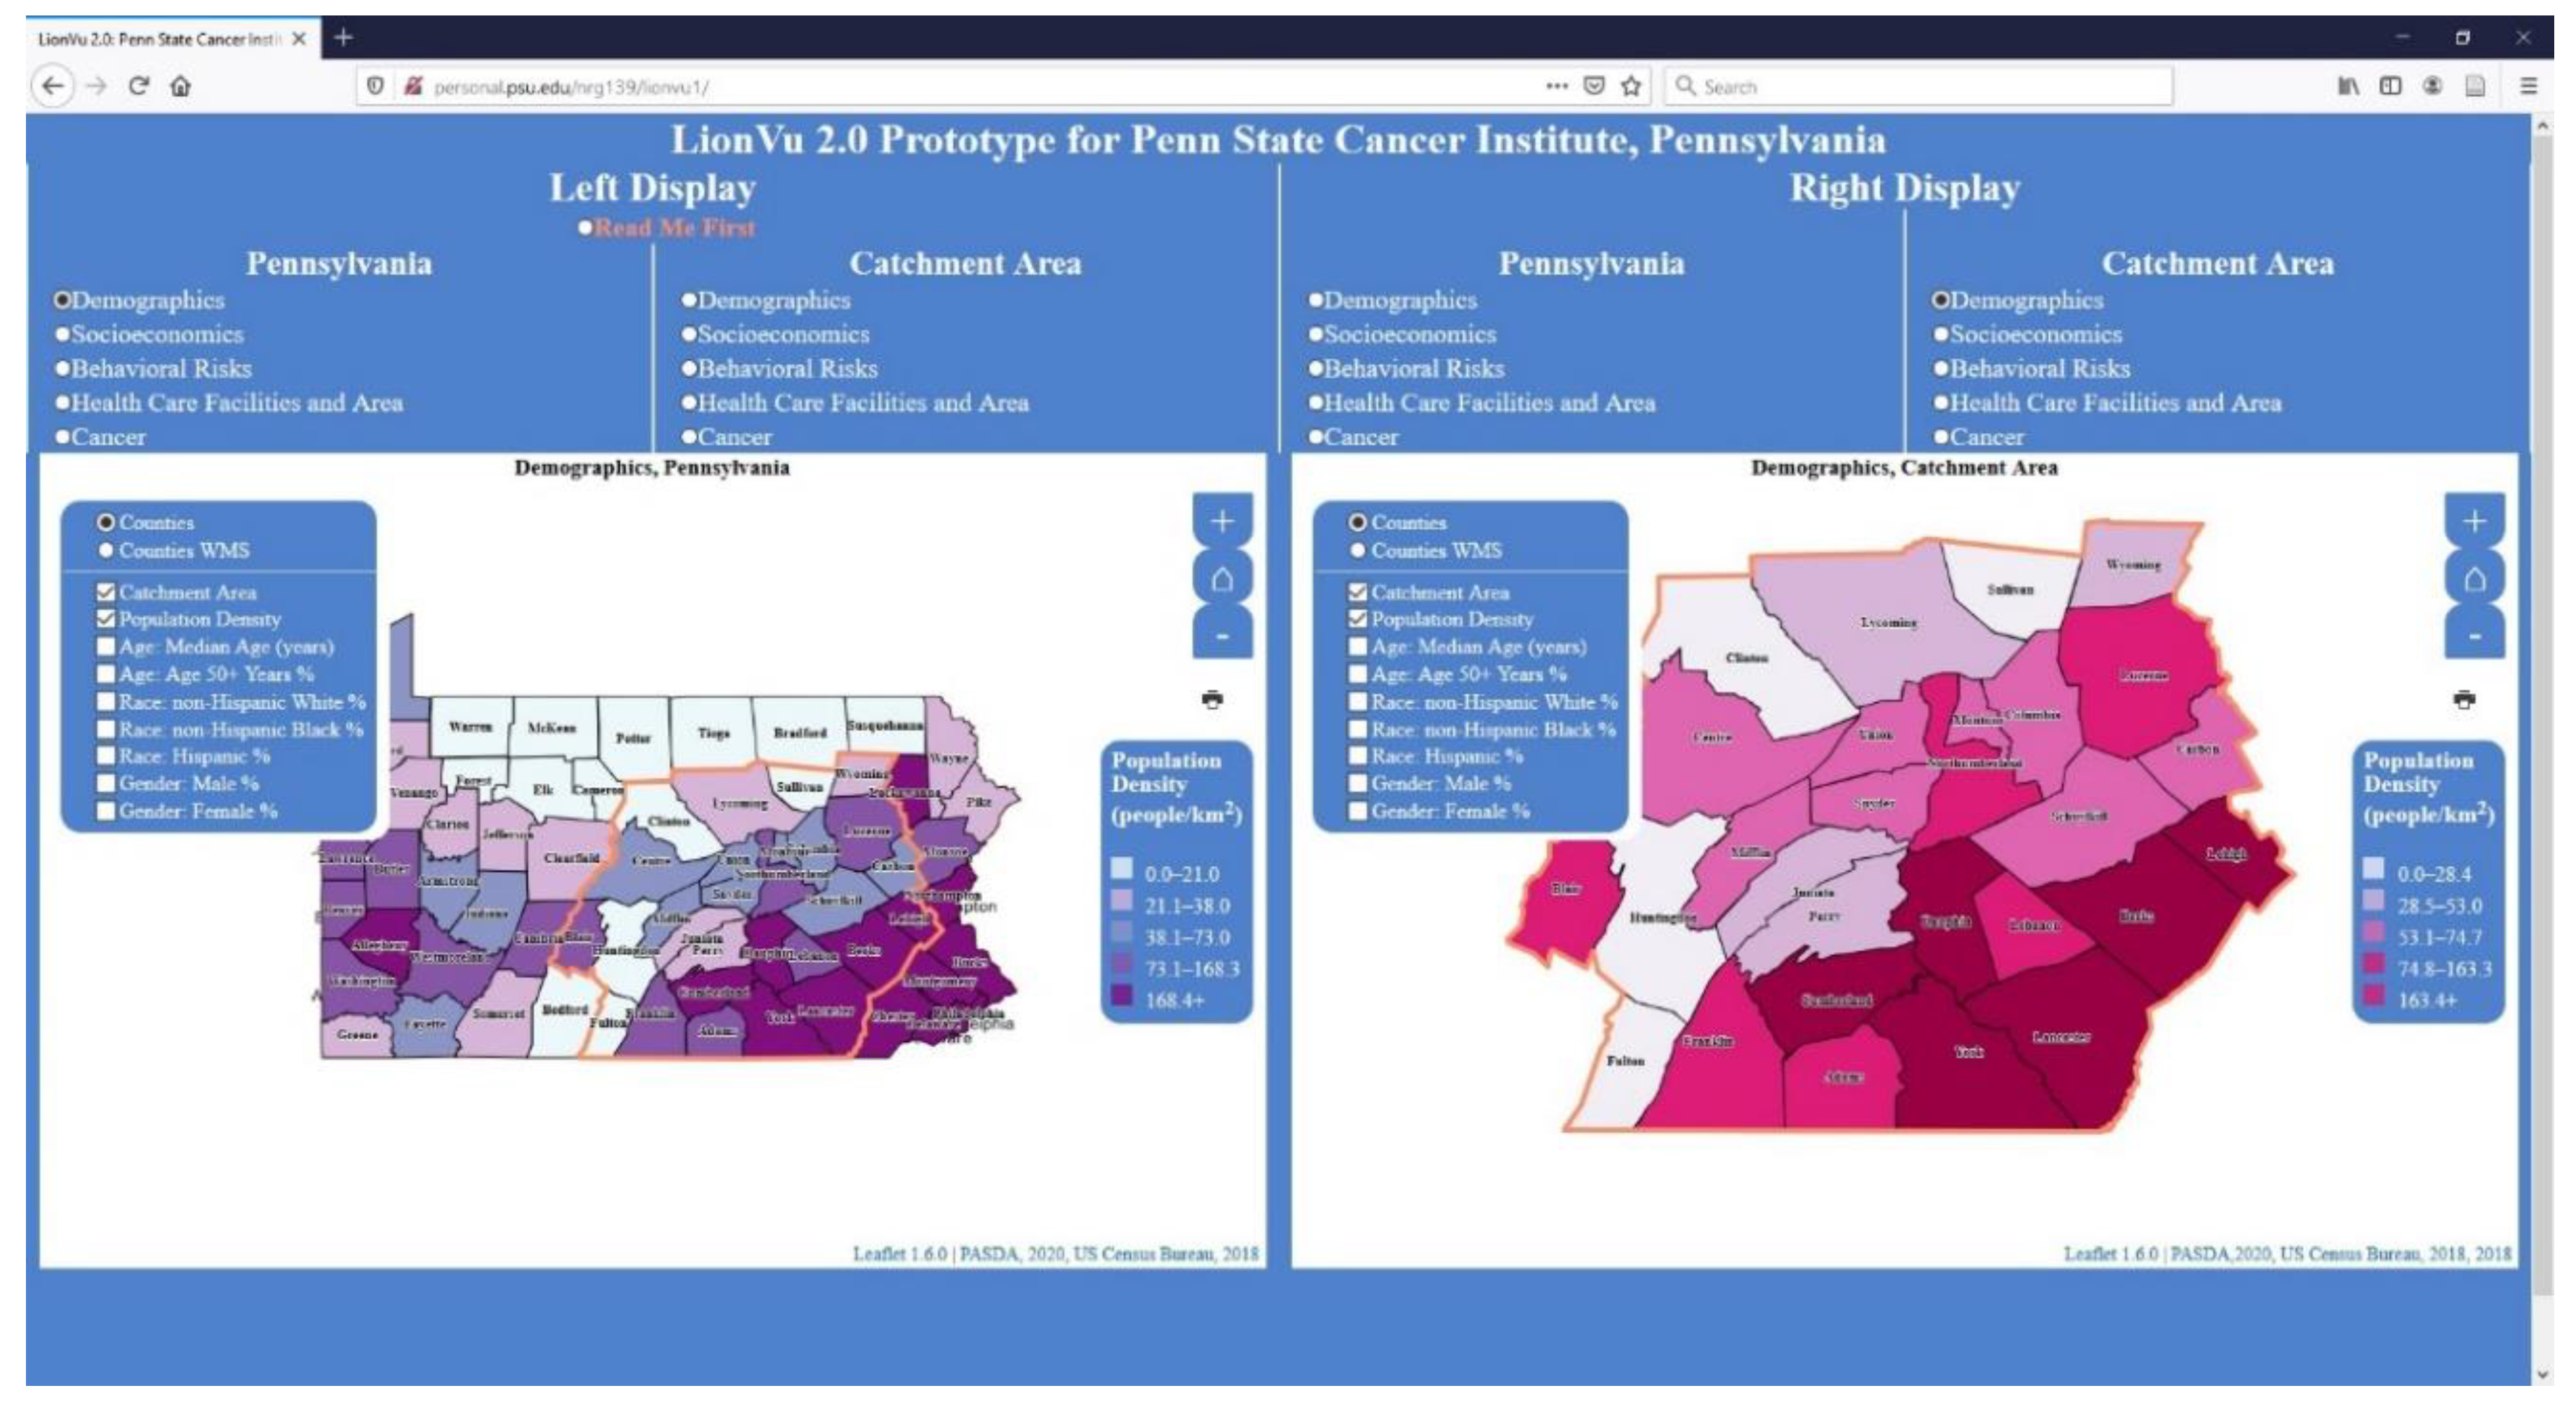
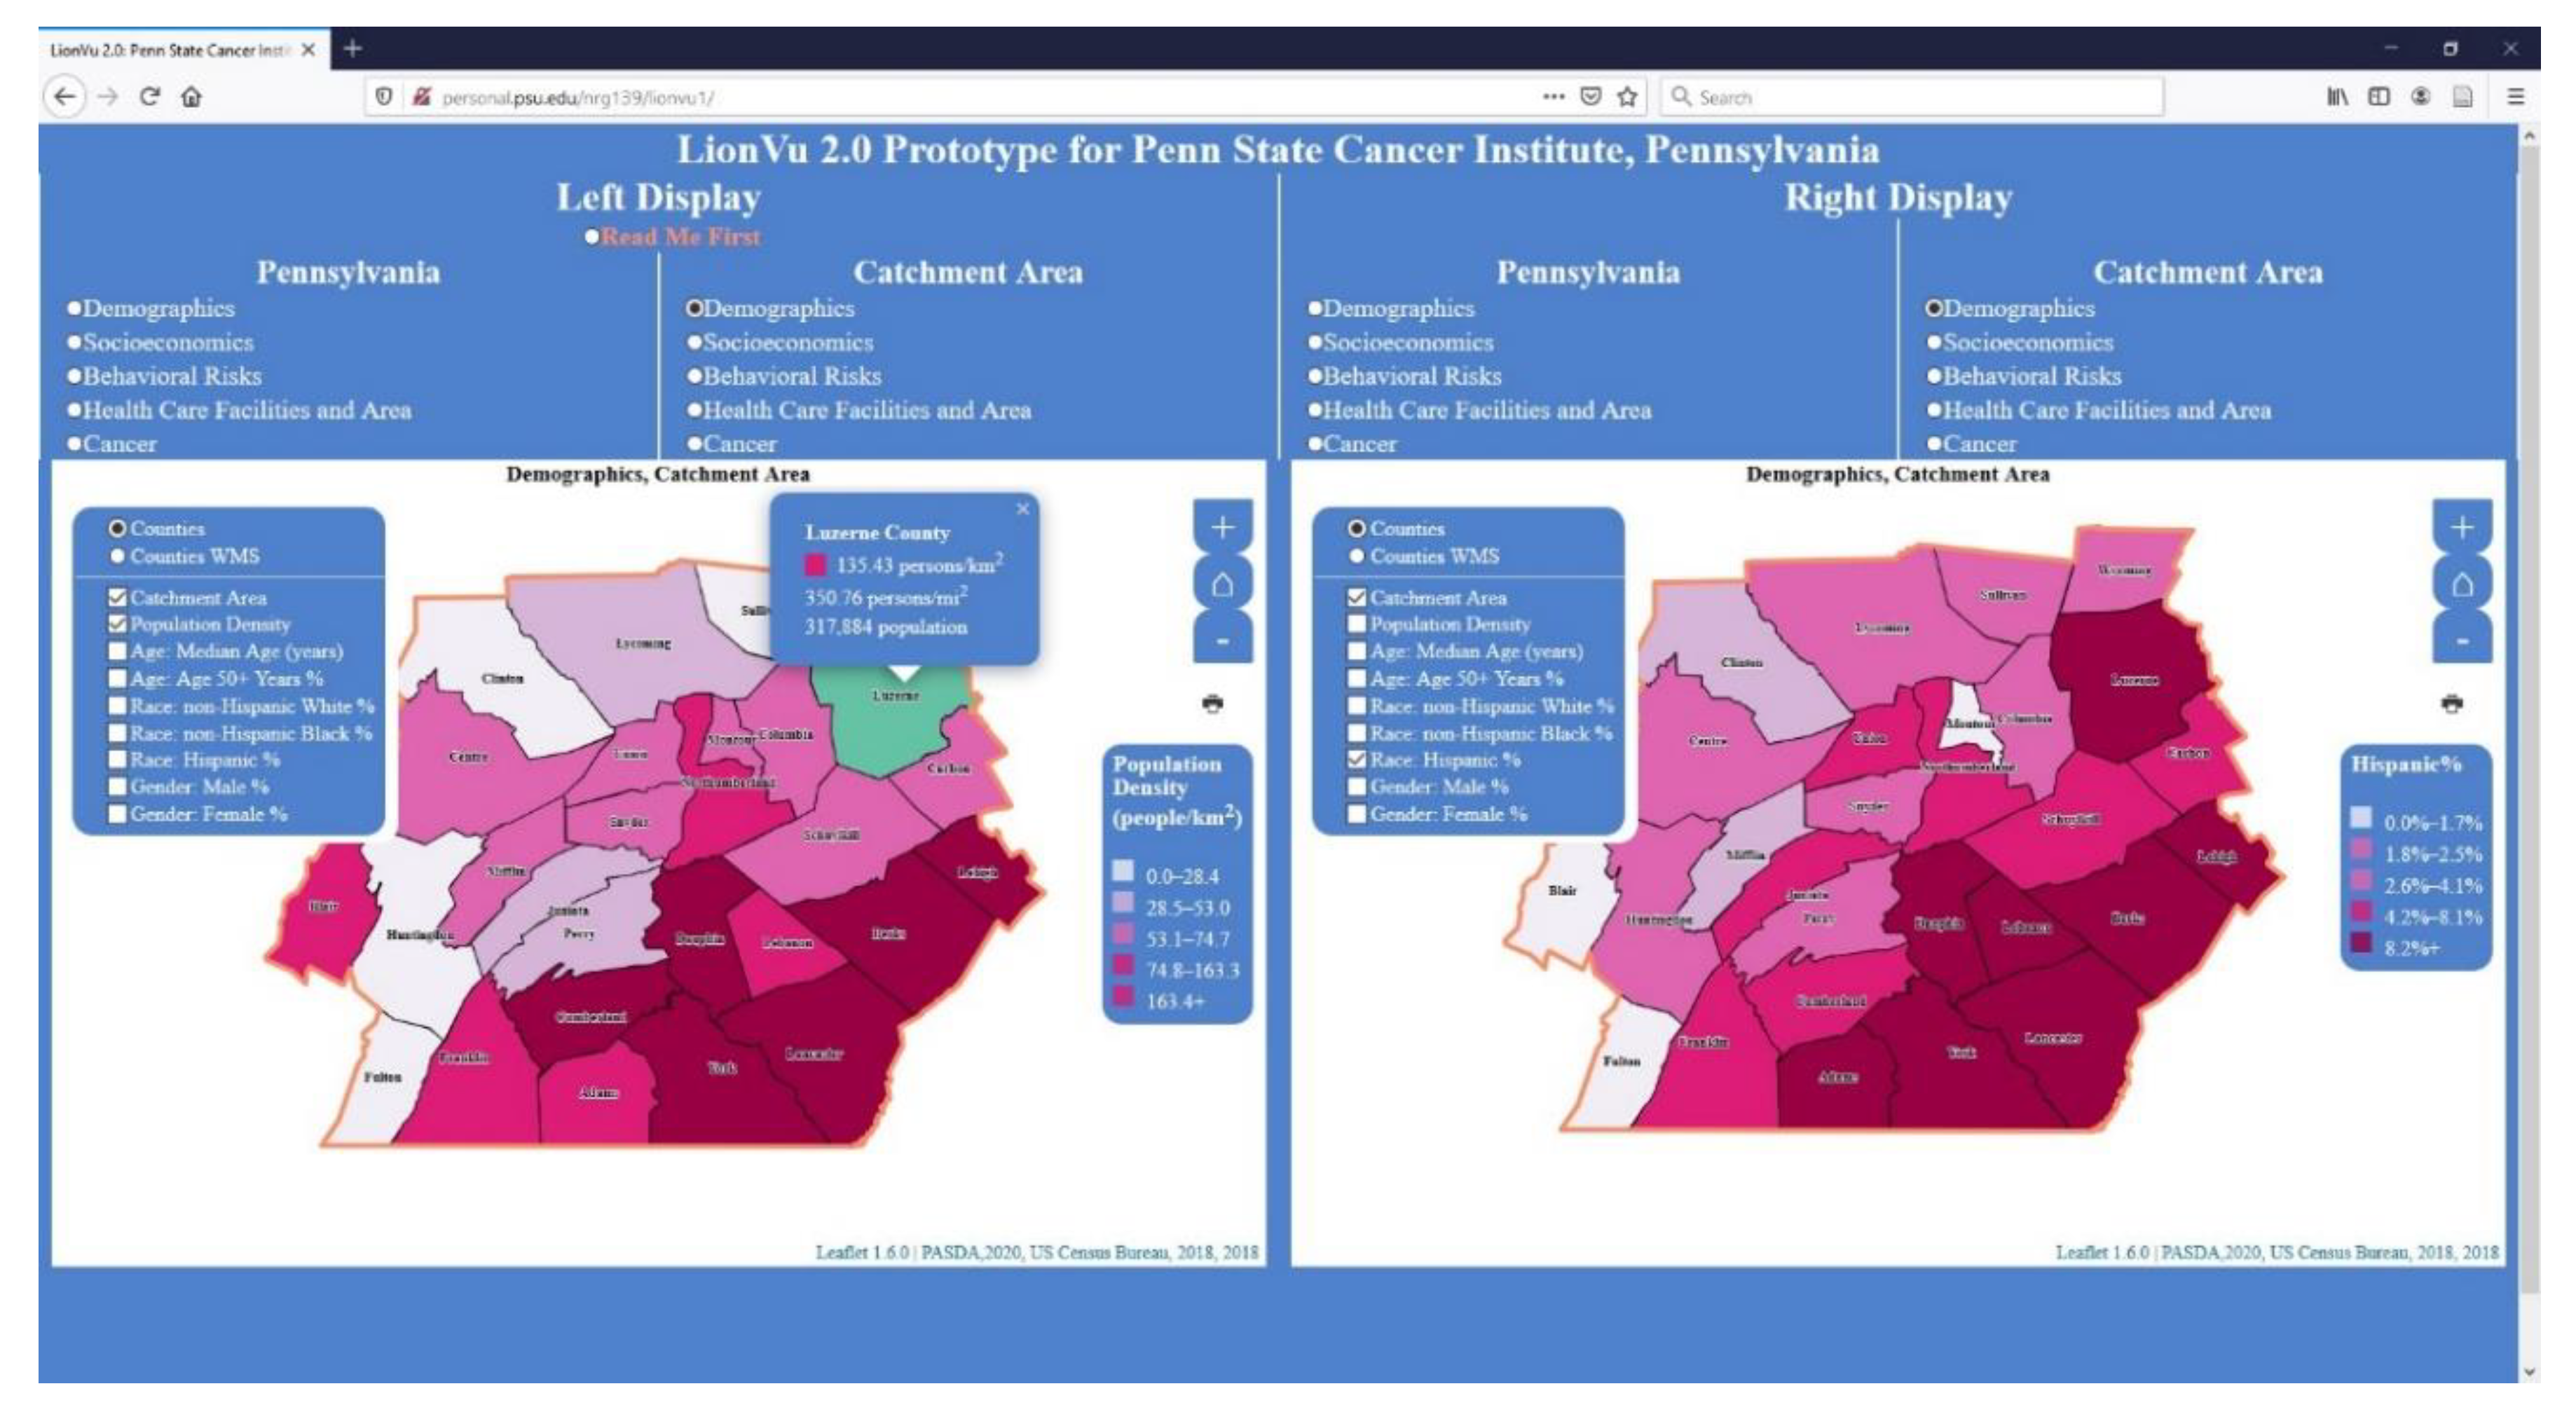
3.4. Task 1: Population Densities and Hispanic Populations within Luzerne County
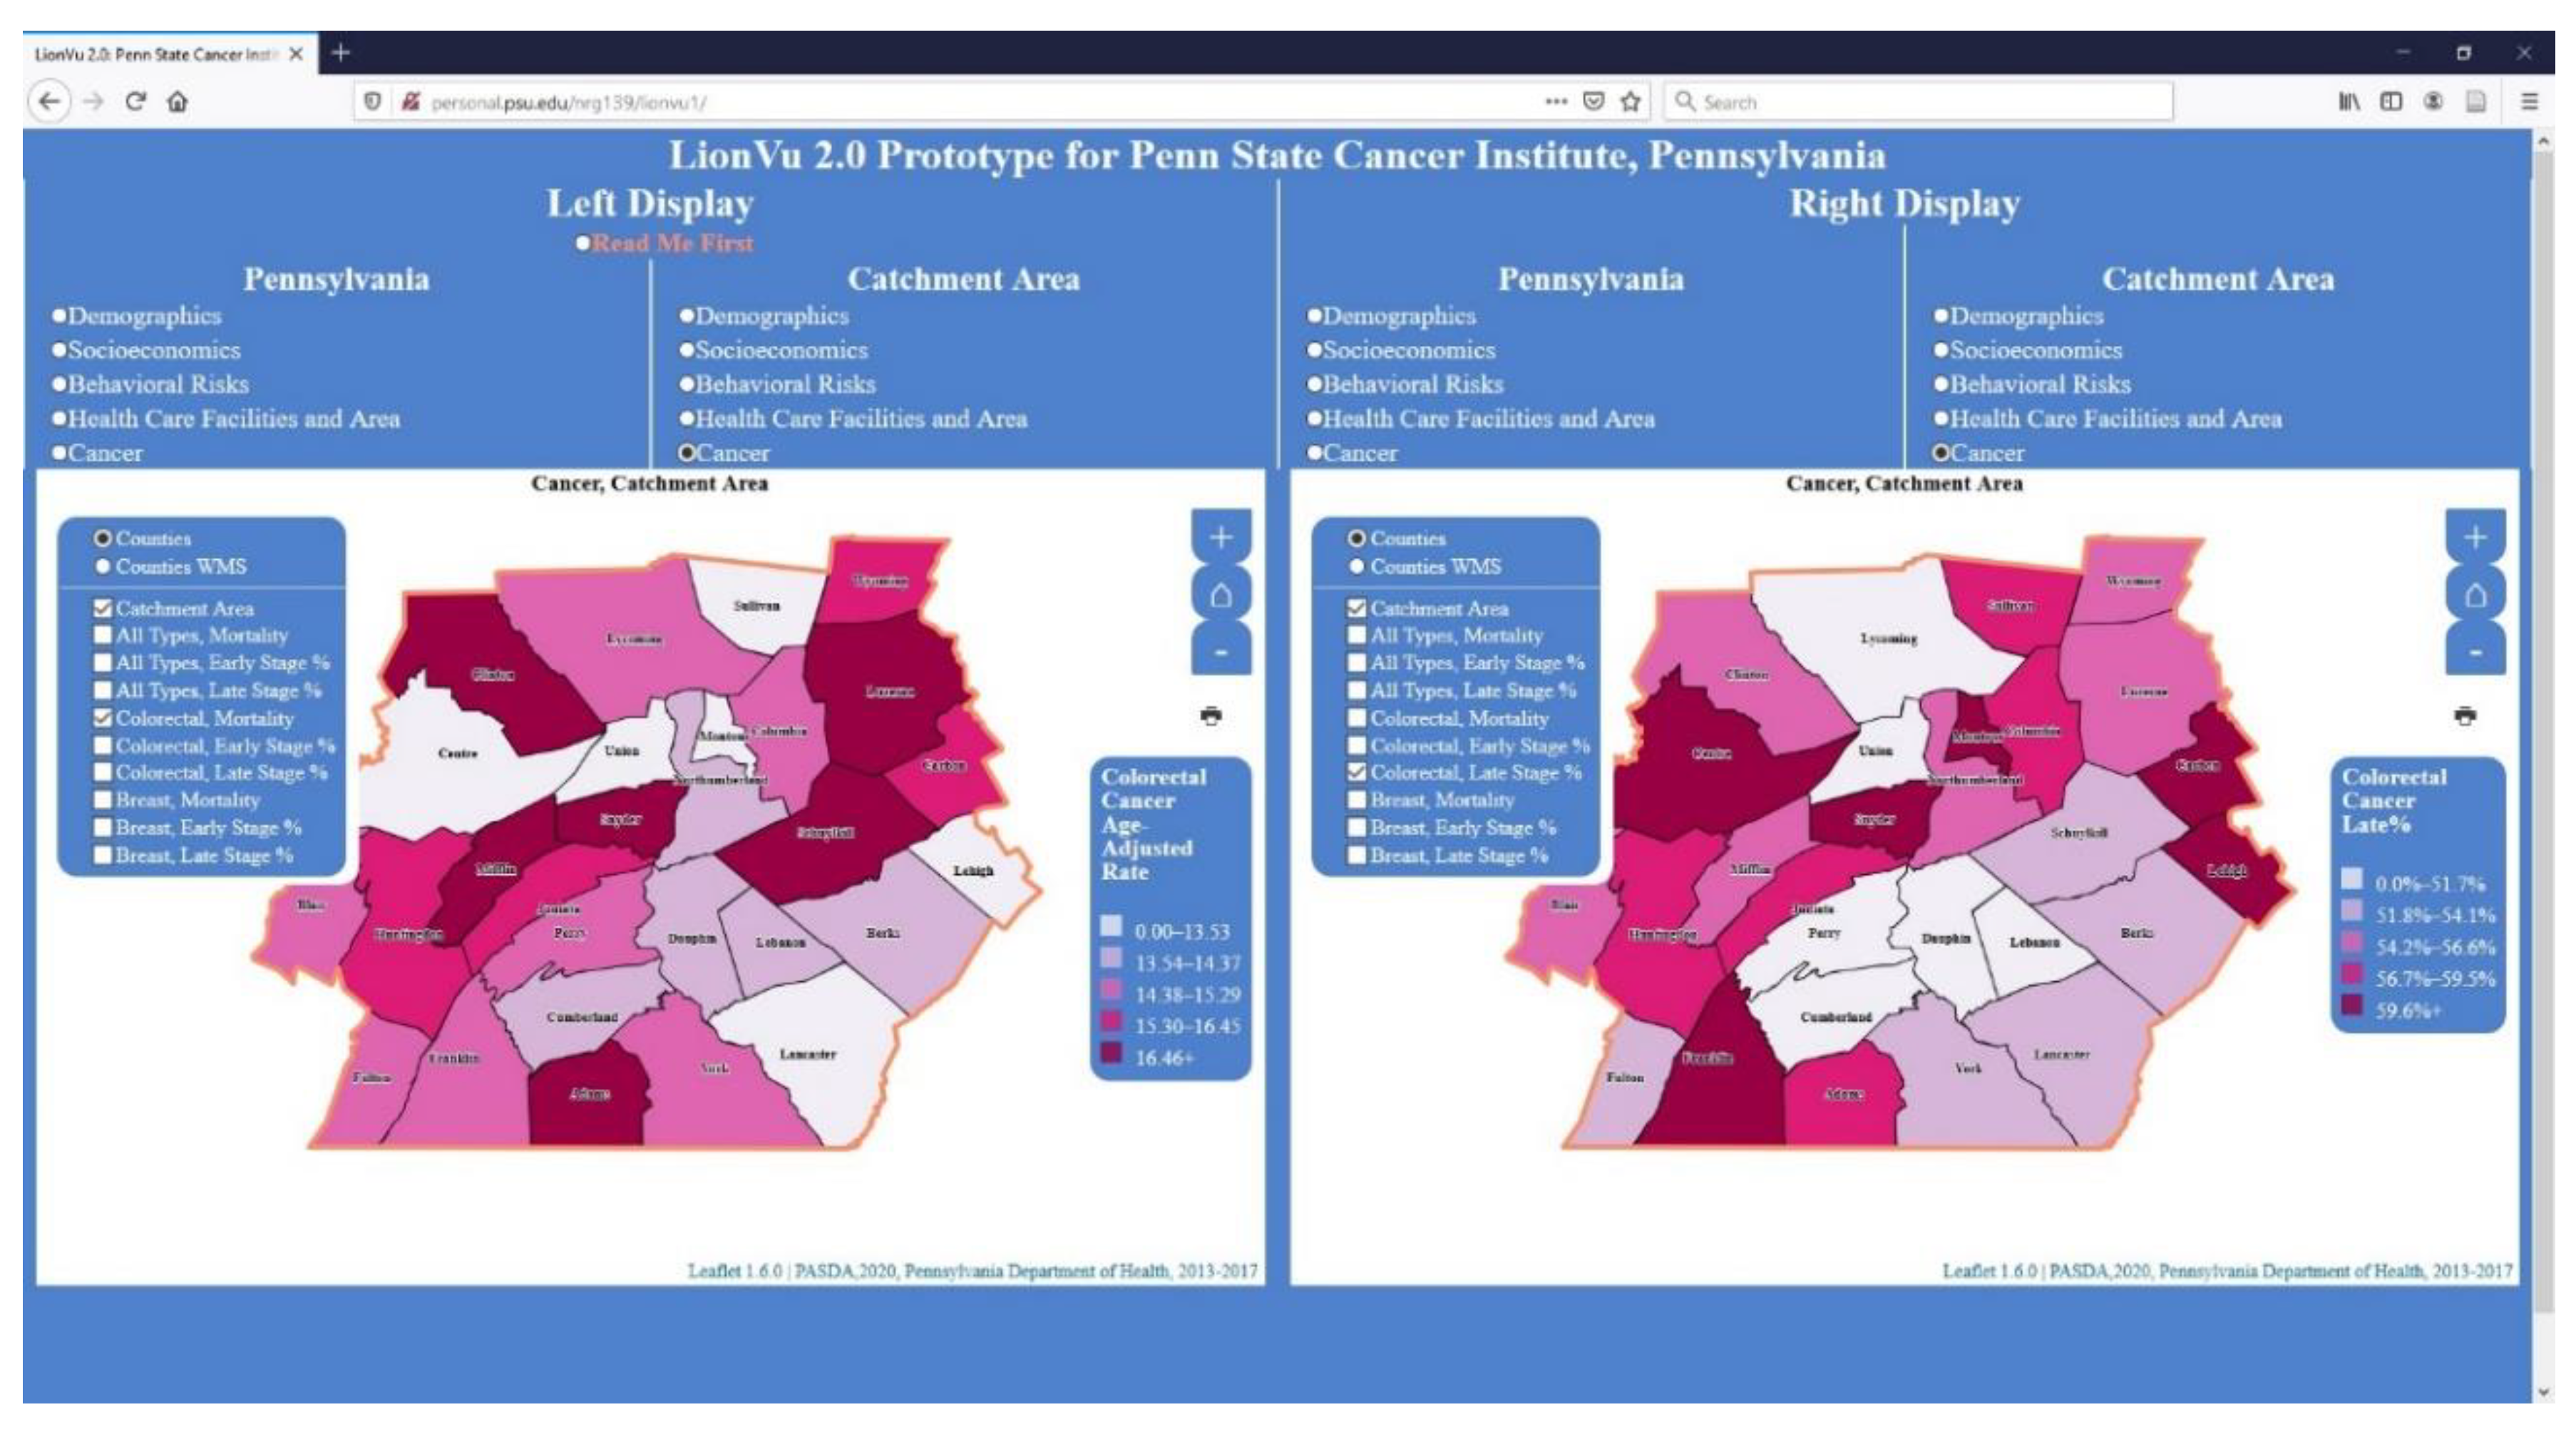
3.5. Task 2: Assessing Cancer Patterns
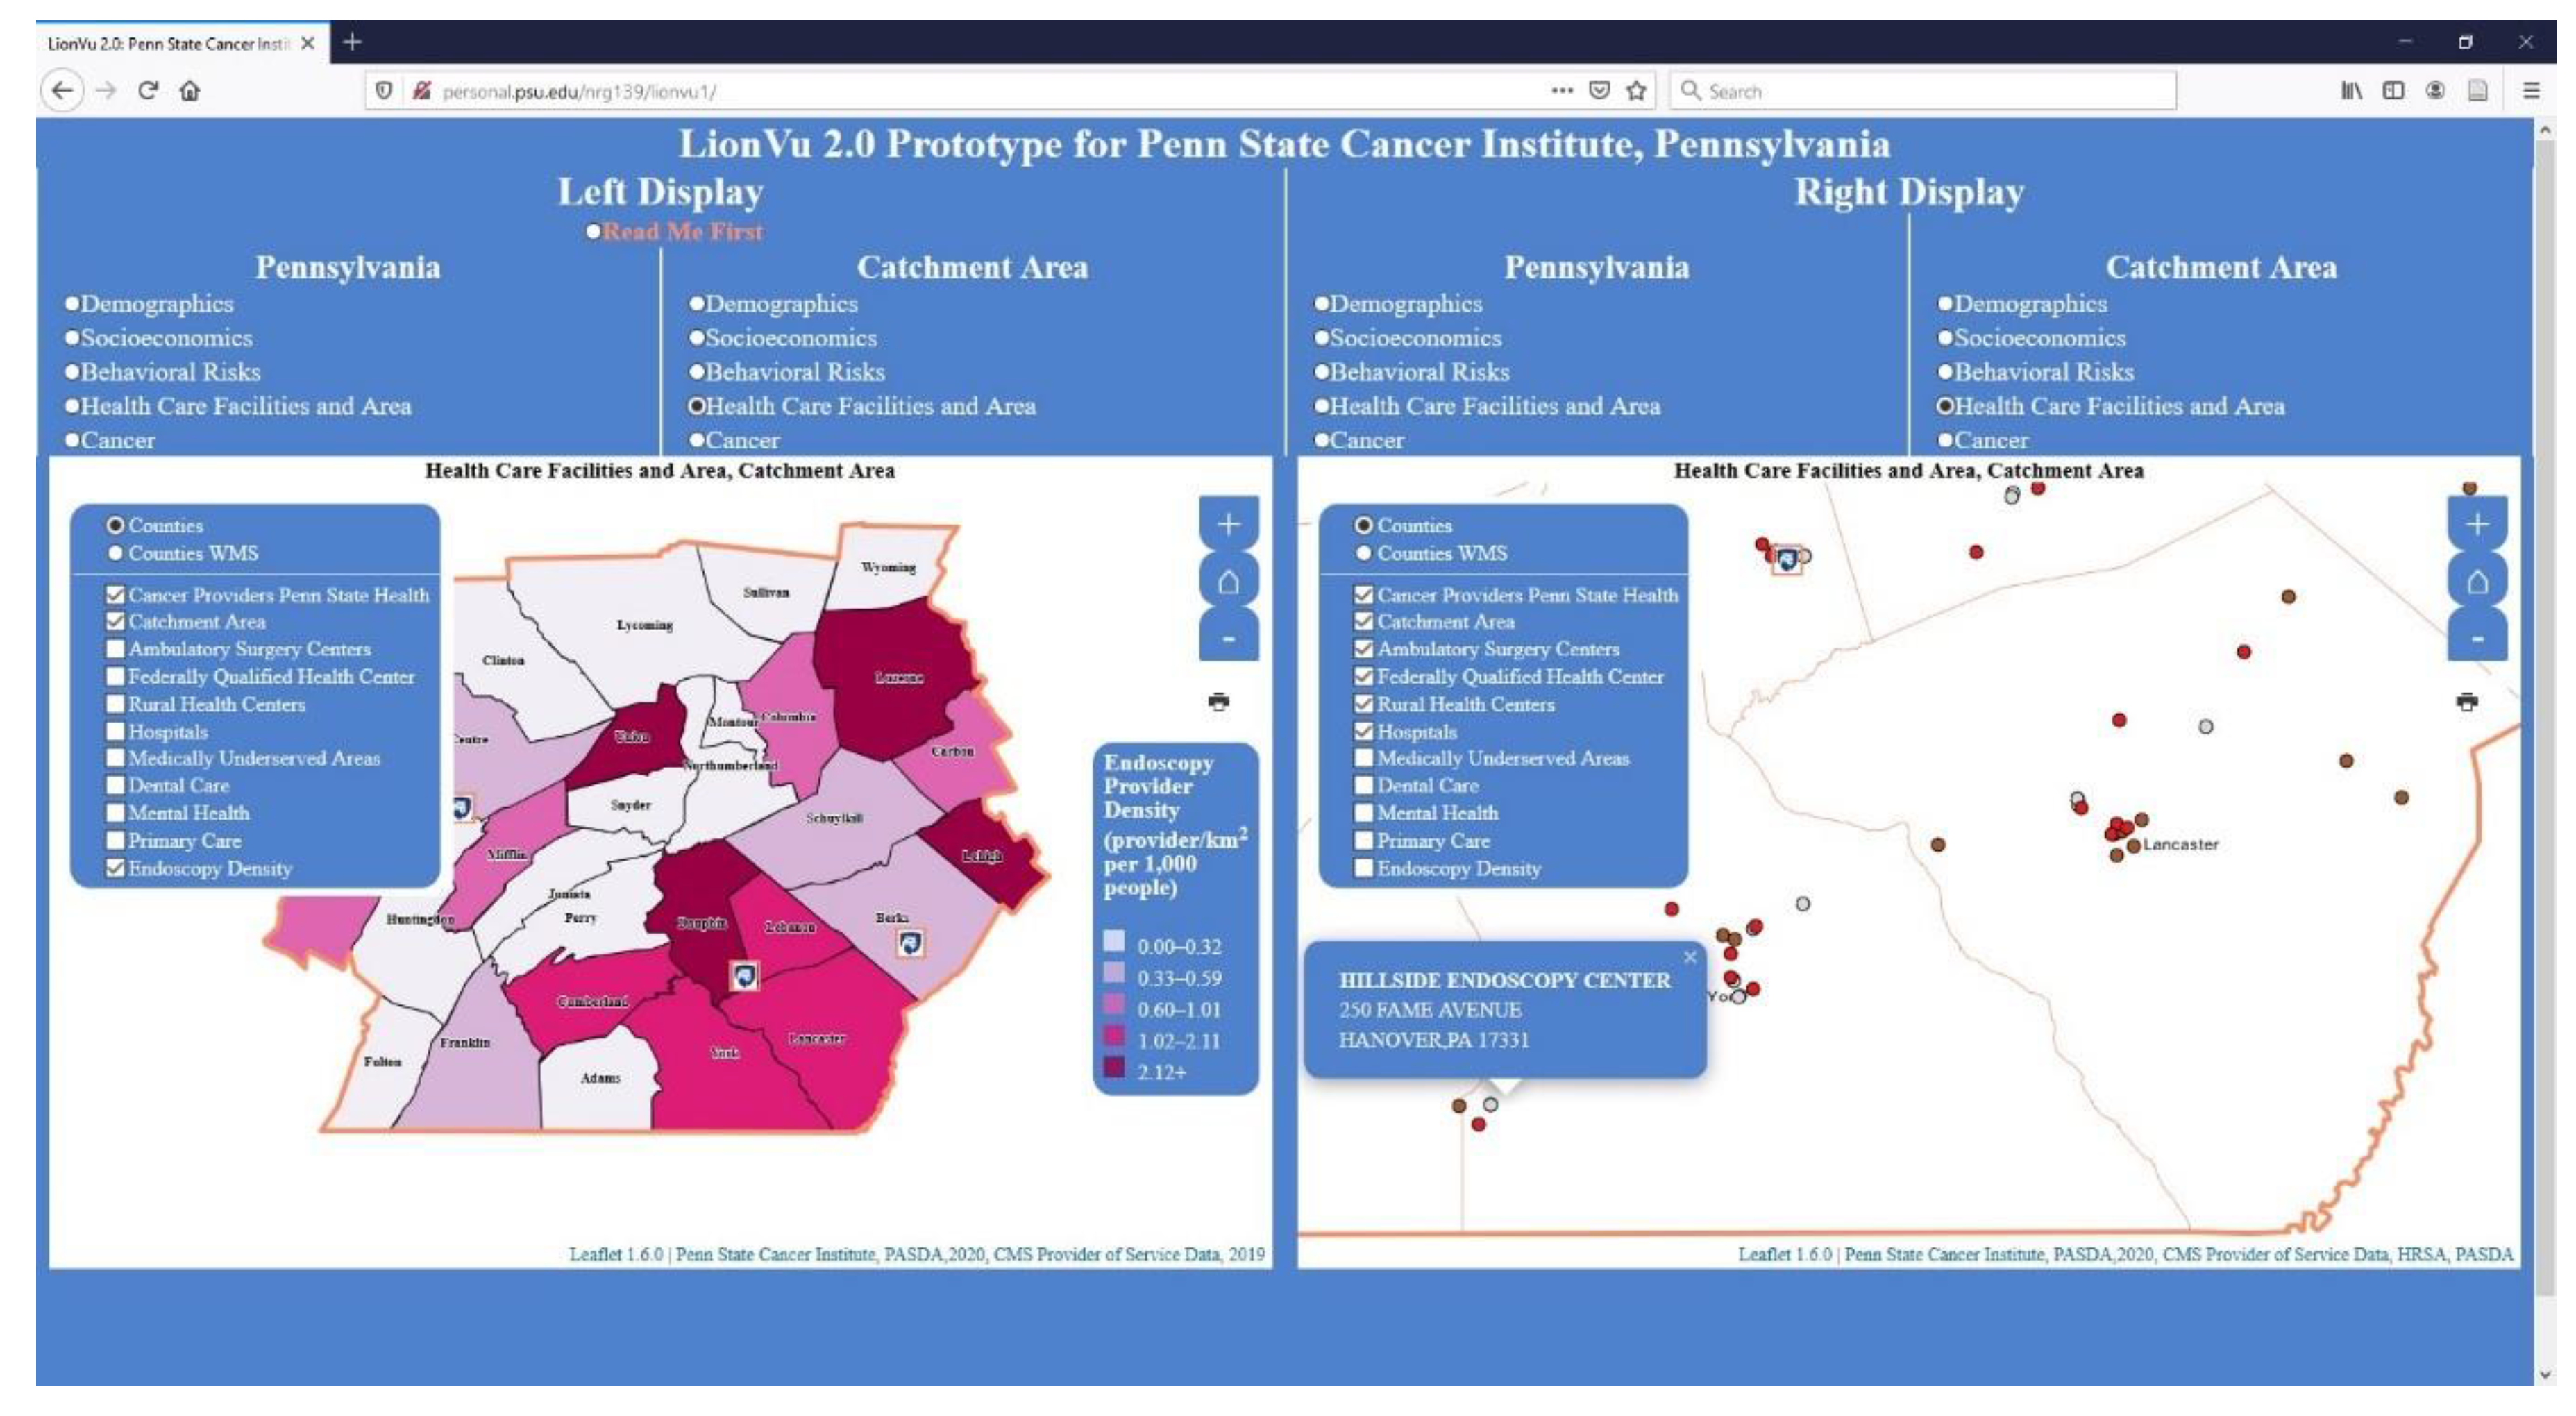
3.6. Task 3: Health Care Facility and Area
3.7. Task 4: Behavioral Risk and Socioeconomics
3.8. Likert Scale Questions
3.9. Purpose, Data, Help Documentation, and Functionality Feedback Questions
3.10. General Feedback
3.11. Usability Comparison
4. Discussion
4.1. Limitations
4.2. Recommendations
5. Conclusions
Author Contributions
Funding
Acknowledgments
Conflicts of Interest
Appendix A
| Section | Question |
|---|---|
| A. Demographic Questions: | 1. Please provide your current age in years. |
| 2. Please provide your racial identify. | |
| 3. Please provide your ethnic identity. | |
| 4. Please provide your current gender. | |
| 5. What is your highest level of education? | |
| B. Employment Characteristics, Prior to the COVID-19 Outbreak: | 6. Please specify the locations where you were employed, prior to the COVID-19 outbreak. |
| 7. Please specify employee classifications, prior to the COVID-19 outbreak. | |
| 8. Please specify official job title, prior to the COVID-19 outbreak (i.e., Research support technologist). | |
| 9. What was your primary organization of employment, prior to the COVID-19 outbreak (i.e., Penn State, Pennsylvania Department of Health, etc.)? | |
| 10. Please rate your proficiency (e.g., NIH competencies proficiency scale) with using any web mapping tools. | |
| C. Web Mapping Comparison to United States Cancer Statistics: | 11. From the rate of new cancers in the United States web map, what was the age-adjusted rate of new cancers within Pennsylvania, 2012–2016? |
| 12. What are some limitations of the United States web map? | |
| 13. What are some strengths of the United States web map? | |
| 14. What information do expect to see with the web mapping tools, like the United States web map? | |
| 15. What capabilities of the United States web map are important to you? | |
| D. Task 1: Using LionVu 2.0 prototype, determine Population Densities and Hispanic Populations within Luzerne County (hint: use catchment area: Demographics thematic layers, legend, and county popups, except where noted). | 16. What is the population density (catchment area: Demographics) of Luzerne County (person/km2)? |
| 17. What bin or color value is Luzerne County Hispanics (catchment area: Demographics)? | |
| 18. How did you determine the population density and color value? | |
| 19. What are your interpretations of population density across Pennsylvania (Pennsylvania: Demographics)? | |
| 20. How could the map interface in LionVu 2.0 be improved to help illustrate the demographic characteristics across Pennsylvania (Pennsylvania: Demographics)? | |
| E. Task 2: Using LionVu 2.0 prototype, determine colorectal cancer mortality and late stage percentage within Centre County (hint: use catchment area: Cancer thematic layers, legend, and county popups, except where noted). | 21. What is the age-adjusted mortality rate (per 100,000 people) of colorectal cancer (catchment area: Cancer) in Centre County? |
| 22. What is the percentage of late stage colorectal cancer (catchment area: Cancer) in Centre County? | |
| 23. How did you determine the colorectal cancer mortality rate and late stage percentage? | |
| 24. What are your interpretations of colorectal cancer mortality across Pennsylvania (Pennsylvania: Cancer)? | |
| 25. How could the map interface in LionVu 2.0 be improved to help illustrate the cancer characteristics across Pennsylvania (Pennsylvania: Cancer)? | |
| F. Task 3: Using LionVu 2.0 prototype, determine provider characteristics, within Lancaster County (hint: use catchment area: Cancer thematic layers, legend, and county popups, except where noted). | 26. What is the density of endoscopy providers (catchment area: Health care facility and area) within Lancaster County (providers/km2 per 1000 people)? |
| 27. From the catchment area: Health care facility and area layers, what provider is not found within Lancaster County? | |
| 28. How did you determine the selected provider characteristics? | |
| 29. How could the map interface in LionVu 2.0 be improved to help illustrate the health care facilities and area characteristics across Pennsylvania (Pennsylvania: Health care facilities and area)? | |
| 30. What are your interpretations of the density of endoscopy providers (Pennsylvania: Health care facilities and area—left display) relative to colorectal cancer mortality rates (Pennsylvania: Cancer—right display) across Pennsylvania? | |
| G. Task 4: Using LionVu 2.0 prototype, determine selected characteristics using the side-by-side functionality, within Centre and Luzerne Counties (hint: use both catchment area: Behavioral risks—left display and catchment area: Socioeconomics—right display thematic layers and county popups, except where noted). | 31. Using the side-by-side functionality, what is the adult obesity (catchment area: Behavioral risks—left display) and poverty percentages (catchment area: Socioeconomics—right display) in Luzerne County? |
| 32. Using the side-by-side functionality, what is the mammogram screening (catchment area: Behavioral risks—left display) and rurality percentages (Catchment area: Socioeconomics—right display) in Centre County? | |
| 33. How did you determine the selected behavioral risks and socioeconomic characteristics? | |
| 34. How could the map interface in LionVu 2.0 be improved to help illustrate the behavioral risk characteristics across Pennsylvania (Pennsylvania: Behavioral risks)? | |
| 35. How could the map interface in LionVu 2.0 be improved to help illustrate the socioeconomic characteristics across Pennsylvania (Pennsylvania: Socioeconomics)? | |
| H. Rate on your experience using the LionVu 2.0 Prototype (scale: Strongly disagree—strongly agree), based on the participatory GIS usability scale. | 36. It is easy to move through different parts of the user interface (Domain: User interface). |
| 37. I can easily access information displayed in the map (Domain: Interaction with the web maps). | |
| 38. It is easy to remember how to perform tasks (Domain: Learnability). | |
| 39. The system is reliable (Domain: Reliability). | |
| 40. The maps are easy to understand (Domain: Communication). | |
| I. Purpose, Data, Documentation, and Functionality Feedback Questions. | 41. What do you see as the primary purpose of the LionVu 2.0 prototype? |
| 42. Please specify, what data would you want to remove from the LionVu 2.0 prototype? | |
| 43. Please specify, what data would you want to add to the LionVu 2.0 prototype? | |
| 44. How can the documentation (read me first), in the LionVu 2.0 prototype, be revised and improved for better comprehension? | |
| 45. Please elaborate on your thoughts about what kind of functionality do you consider to be essential for LionVu 2.0. | |
| J. Strengths, Limitations, and General Comments. | 46. Other than data, documentation, and functionality, please provide some limitations about the LionVu 2.0 prototype. |
| 47. Other than data, documentation, and functionality, please provide some strengths about the LionVu 2.0 prototype. | |
| 48. Please elaborate, whether the LionVu 2.0 Prototype provides you the tools you need to do your job well. | |
| 49. Do you have any other feedback, about the LionVu 2.0 Prototype, which was not covered in this usability assessment? | |
| 50. Do you have any other comments about this questionnaire or REDCap? |
References
- Brewer, C.A.; Pickle, L. Evaluation of Methods for Classifying Epidemiological Data on Choropleth Maps in Series. Ann. Assoc. Am. Geogr. 2002, 92, 662–681. [Google Scholar] [CrossRef]
- Zelmer, J.; van Hoof, K.; Notarianni, M.; van Mierlo, T.; Schellenberg, M.; Tannenbaum, C. An assessment framework for e-mental health apps in Canada: Results of a modified Delphi process. JMIR Mhealth Uhealth 2018, 6. [Google Scholar] [CrossRef] [PubMed]
- Birken, S.A.; Rohweder, C.L.; Powell, B.J.; Shea, C.M.; Scott, J.; Leeman, J.; Grewe, M.E.; Kirk, M.A.; Damschroder, L.; Aldridge, W.A.; et al. T-CaST: An implementation theory comparison and selection tool. Implement. Sci. 2018, 13. [Google Scholar] [CrossRef] [PubMed]
- Smith, F.; Wallengren, C.; Ohlen, J. Participatory design in education materials in a health care context. Action Res. 2017, 15, 310–336. [Google Scholar] [CrossRef]
- Avila, J.; Sostmann, K.; Breckwoldt, J.; Peters, H. Evaluation of the free, open source software WordPress as electronic portfolio system in undergraduate medical education. BMC Med. Educ. 2016, 16. [Google Scholar] [CrossRef] [PubMed]
- Bourla, A.; Ferreri, F.; Ogorzelec, L.; Peretti, C.S.; Guinchard, C.; Mouchabac, S. Psychiatrists’ attitudes toward disruptive new technologies: Mixed-methods study. JMIR Ment. Health 2018, 5. [Google Scholar] [CrossRef] [PubMed]
- Milward, J.; Deluca, P.; Drummond, C.; Watson, R.; Dunne, J.; Kimergård, A. Usability Testing of the BRANCH Smartphone App Designed to Reduce Harmful Drinking in Young Adults. JMIR MHealth UHealth 2017, 5, e109. [Google Scholar] [CrossRef]
- He, X.; Zhang, R.; Rizvi, R.; Vasilakes, J.; Yang, X.; Guo, Y.; He, Z.; Prosperi, M.; Huo, J.H.; Alpert, J.; et al. ALOHA: Developing an interactive graph-based visualization for dietary supplement knowledge graph through user-centered design. BMC Med. Inform. Decis. Mak. 2019, 19. [Google Scholar] [CrossRef]
- Ben Ramadan, A.A.; Jackson-Thompson, J.; Schmaltz, C.L. Usability Assessment of the Missouri Cancer Registry’s Published Interactive Mapping Reports: Round One. JMIR Hum. Factors 2017, 4, e19. [Google Scholar] [CrossRef]
- Ben Ramadan, A.A.; Jackson-Thompson, J.; Schmaltz, C.L. Usability Assessment of the Missouri Cancer Registry’s Published Interactive Mapping Reports: Round Two. Online J. Public Health Inform. 2019, 11, e3. [Google Scholar] [CrossRef]
- Rzeszewski, M.; Kotus, J. Usability and usefulness of internet mapping platforms in participatory spatial planning. Appl. Geogr. 2019, 103, 56–69. [Google Scholar] [CrossRef]
- Horbinski, T.; Cybulski, P. Similarities of global web mapping services functionality in the context of responsive web design. Geod. Cartogr. 2018, 67, 159–177. [Google Scholar] [CrossRef]
- System Usability Scale (SUS). Available online: https://www.usability.gov/how-to-and-tools/methods/system-usability-scale.html (accessed on 28 April 2020).
- Ballatore, A.; McClintock, W.; Goldberg, G.; Kuhn, W. Towards a usability scale for participatory GIS. Cartogr. Maps Connect. World 2020, 327–348. [Google Scholar] [CrossRef]
- Çöltekin, A.; Heil, B.; Garlandini, S.; Fabrikant, S.I. Evaluating the Effectiveness of Interactive Map Interface Designs: A Case Study Integrating Usability Metrics with Eye-Movement Analysis. Cartogr. Geogr. Inf. Sci. 2009, 36, 5–17. [Google Scholar] [CrossRef]
- Gómez Solórzano, L.S.; Sancho Comíns, J.; Bosque Sendra, J. Atlas Design: A Usability Approach for the Development and Evaluation of Cartographic Products. Cartogr. J. 2017, 54, 343–357. [Google Scholar] [CrossRef]
- Competencies Proficiency Scale. Available online: https://hr.nih.gov/working-nih/competencies/competencies-proficiency-scale (accessed on 15 July 2020).
- USCS Data Visualizations. Available online: https://gis.cdc.gov/grasp/USCS/DataViz.html (accessed on 15 July 2020).
- Harris, P.A.; Taylor, R.; Thielke, R.; Payne, J.; Gonzalez, N.; Conde, J.G. Research Electronic Data Capture (REDCap)—A metadata-driven methodology and workflow process for providing translational research informatics support. J. Biomed. Inform. 2009, 42, 377–381. [Google Scholar] [CrossRef]
- MeasuringU: Graph and Calculator for Confidence Intervals for Task Times. Available online: https://measuringu.com/time_intervals/ (accessed on 18 September 2020).
- Appalachian Counties Served by ARC. Available online: https://www.arc.gov/appalachian-counties-served-by-arc/ (accessed on 18 September 2020).
- Cao, Y.H.; Boruff, B.J.; McNeill, I.M. The smoke is rising but where is the fire? Exploring effective online map design for wildfire warnings. Nat. Hazards 2017, 88, 1473–1501. [Google Scholar] [CrossRef]
- Hennig, S.; Vogler, R. User-Centred Map Applications Through Participatory Design: Experiences Gained During the “YouthMap 5020” Project. Cartogr. J. 2016, 53, 213–229. [Google Scholar] [CrossRef]
- Unrau, R.; Kray, C. Usability evaluation for geographic information systems: A systematic literature review. Int. J. Geogr. Inf. Sci. 2019, 33, 645–665. [Google Scholar] [CrossRef]
- Leaflet.Legend. Available online: https://github.com/ptma/Leaflet.Legend (accessed on 23 October 2020).
- Rushton, G. Public Health, GIS, and Spatial Analytic Tools. Annu. Rev. Public Health 2003, 24, 43–56. [Google Scholar] [CrossRef]
- Simkin, J.; Erickson, A.C.; Otterstatter, M.C.; Dummer, T.J.B.; Ogilvie, G. Current State of Geospatial Methodologic Approaches in Canadian Population Oncology Research. Cancer Epidemiol. Biomark. Prev. 2020, 29, 1294–1303. [Google Scholar] [CrossRef] [PubMed]



| User Interface | Interaction with the Web Maps | Learnability | Reliability | Communication | |
|---|---|---|---|---|---|
| Total (10) | 3 | 3 | 4 | 4 | 3 |
| Professionals (4) | 2.5 | 3 | 3.5 | 3.5 | 3 |
| Academics (6) | 3 | 3.5 | 4 | 4 | 3.5 |
| Overall Performance | USCS | Task 1 | Task 2 | Task 3 | Task 4 |
|---|---|---|---|---|---|
| Time (s) | 340 | 343 | 293 | 618.5 | 410.5 |
| Success | 13% | 92% | 92% | 90% | 90% |
| Sample | 15 | 12 | 12 | 10 | 10 |
| Professionals | |||||
| Time (s) | 402.5 | 369 | 266 | 532 | 410.5 |
| Success | 30% | 90% | 90% | 50% | 100% |
| Sample | 7 | 5 | 5 | 4 | 4 |
| Academics | |||||
| Time (s) | 325 | 325 | 320 | 1,098 | 428.5 |
| Success | 0% | 80% | 100% | 50% | 75% |
| Sample | 9 | 7 | 7 | 6 | 6 |
| Professionals | Academics | |||||
|---|---|---|---|---|---|---|
| Task | Success (%) | Errors | Effectiveness (%) | Success (%) | Errors | Effectiveness (%) |
| USCS | 30% | 6 | 5 | 0% | 9 | 0 |
| 1 | 90% | 1 | 90 | 80% | 2 | 40 |
| 2 | 90% | 1 | 90 | 100% | 1 | 100 |
| 3 | 50% | 4 | 12.5 | 50% | 7 | 7.14 |
| 4 | 100% | 1 | 100 | 75% | 4 | 18.75 |
| Total | 59.5 | 33.18 | ||||
| Professionals | Academics | |||||
|---|---|---|---|---|---|---|
| Task | Success (%) | Time (min) | Efficiency (%) | Success (%) | Time (min) | Efficiency (%) |
| USCS | 30% | 6.70 | 4.48 | 0% | 5.42 | 0 |
| 1 | 90% | 6.15 | 14.63 | 80% | 5.42 | 14.76 |
| 2 | 90% | 4.43 | 20.31 | 100% | 5.33 | 18.76 |
| 3 | 50% | 8.89 | 5.62 | 50% | 18.3 | 2.73 |
| 4 | 100% | 6.84 | 14.61 | 75% | 7.14 | 10.48 |
| Total | 11.93 | 6.42 | ||||
Publisher’s Note: MDPI stays neutral with regard to jurisdictional claims in published maps and institutional affiliations. |
© 2020 by the authors. Licensee MDPI, Basel, Switzerland. This article is an open access article distributed under the terms and conditions of the Creative Commons Attribution (CC BY) license (http://creativecommons.org/licenses/by/4.0/).
Share and Cite
Geyer, N.R.; Kessler, F.C.; Lengerich, E.J. LionVu 2.0 Usability Assessment for Pennsylvania, United States. ISPRS Int. J. Geo-Inf. 2020, 9, 619. https://doi.org/10.3390/ijgi9110619
Geyer NR, Kessler FC, Lengerich EJ. LionVu 2.0 Usability Assessment for Pennsylvania, United States. ISPRS International Journal of Geo-Information. 2020; 9(11):619. https://doi.org/10.3390/ijgi9110619
Chicago/Turabian StyleGeyer, Nathaniel R., Fritz C. Kessler, and Eugene J. Lengerich. 2020. "LionVu 2.0 Usability Assessment for Pennsylvania, United States" ISPRS International Journal of Geo-Information 9, no. 11: 619. https://doi.org/10.3390/ijgi9110619
APA StyleGeyer, N. R., Kessler, F. C., & Lengerich, E. J. (2020). LionVu 2.0 Usability Assessment for Pennsylvania, United States. ISPRS International Journal of Geo-Information, 9(11), 619. https://doi.org/10.3390/ijgi9110619


