Shoreline Changes Along the Coast of Mainland China—Time to Pause and Reflect?
by
 , and
, and
Hongzhen Tian
1,* ,
,
Kai Xu
1,
Joaquim I. Goes
2,
Qinping Liu
1,
Helga do Rosario Gomes
2 and
Mengmeng Yang
3 1
School of Economics and Management, Tiangong University, Tianjin 300387, China
2
Lamont Doherty Earth Observatory, Columbia University, New York, NY 10964, USA
3
Institute for Space-Earth Environmental Research (ISEE), Nagoya University, Nagoya 464-8601, Japan
*
Author to whom correspondence should be addressed.
ISPRS Int. J. Geo-Inf. 2020, 9(10), 572; https://doi.org/10.3390/ijgi9100572
Submission received: 19 August 2020
/
Revised: 23 September 2020
/
Accepted: 28 September 2020
/
Published: 29 September 2020
Abstract
:Shoreline changes are of great importance for evaluating the interaction between humans and ecosystems in coastal areas. They serve as a useful metric for assessing the ecological costs of socioeconomic developmental activities along the coast. In this paper, we present an assessment of shoreline changes along the eastern coast of mainland China from ~1990 to 2019 by applying a novel method recently developed by us. This method which we call the Nearest Distance Method (NDM) is used to make a detailed assessment of shorelines delineated from Landsat Thematic Mapper (TM) and Operational Land Imager (OLI) images. The results indicate a dramatic decline in natural shorelines that correspond to the rapid increase in the construction of artificial shorelines, driven by China’s economic growth. Of the entire coast of mainland China, the biggest change occurred along the Bohai Sea, where artificial shorelines expanded from 42.4% in ~1990 to 81.5% in 2019. Over this period, this study indicates that China lost > 60% of its biological shorelines, a trend that is especially worrisome because these include areas that were once biologically diverse and extremely rich. As anticipated, shoreline losses were greatest where regions of low economic value had been transformed to areas of higher economic value. Overall, this influence of human activities on shorelines in China is unprecedented. The repercussions of these changes on ecosystems, and the susceptibility of new shoreline developments to population growth and sea-level rise, need to be assessed urgently before additional changes are effected.
1. Introduction
Shorelines are the interface where land, ocean, and atmosphere interact with each other [1]. The International Geographic Data Committee (IGDC) has designated the shoreline as one of 27 key distinct features of the earth’s surface [2]. Shorelines vary constantly, under the influence of two driving forces, namely natural processes and anthropogenic activities [3,4]. Shorelines change due to natural processes, include river deposition, sediment accretion, sea-level rise, waves, tides, wind erosion, etc., and often a priori knowledge of these processes is crucial for planning anthropogenic changes to the shorelines, and for understanding both short- and long-term human impacts on the coastal environment and ecosystems [5,6].
The importance and gravity of shoreline changes have prompted a wide variety of studies worldwide. These include studies of shoreline changes in the Beaufort–Mackenzie region in Canada [7], along the coastal Ramsar wetlands in Turkey [8], along the North Sinai coast in Egypt [9], and in the Boushehr Province in Iran [10]. Remote sensing images are widely used by researchers along with geographic information systems (GIS) such as the Digital Shoreline Analysis System (DSAS) [11] to analyze the spatial and temporal changes in shorelines.
During the past several decades, China’s economy has grown rapidly, resulting in increased human activities that include land reclamation, aquaculture development, and quay construction along its long coastline [12,13]. Numerous research programs have been carried out to investigate the characteristics of changes in shorelines along the coast of China, and a large fraction [4,12,13,14,15,16,17,18,19,20,21] of which have focused on localized areas. For example, Chu et al. [14] used Landsat data to study the temporal and spatial changes in shorelines of the Yangtze Delta during 1974–2010 and concluded that an important reason for rapid shoreline progradation has been innovations in coastal engineering. In another study, Wu et al. [22] also used Landsat images to study shoreline changes in Shenzhen and found that changes varied temporally and spatially. A few other satellite-based studies [5,23,24] have investigated changes that encompass the entire coast of mainland China. One example is the study of Wu et al. [25], who used topographic maps and remote sensing data from the 1940s to 2012 to delineate and classify mainland shorelines. They found that the human impacts on mainland shorelines had increased steadily over the period of study. Another study by Xu et al. [24] relied on Landsat imagery to obtain annual shoreline changes over the period from 1991 to 2015. They found that shoreline expansions, mostly outwards into the ocean, had accelerated tremendously over the last 10 years.
Although some studies have investigated the structural change of shoreline types, none of these have been all-encompassing, offering no details of transformations of shoreline nor of changes within them because of a lack of proper methodology. For example, we do not have clear information regarding the length and percentage of muddy shorelines that have been converted into construction shorelines. This lack of detailed information as well as other factors including rapid economic growth has hindered policymakers from effectively managing and protecting shorelines. This study addresses this shortcoming with a comprehensive study designed (1) to obtain the locations and types of shorelines along the coast of mainland China, (2) to develop a method to calculate changes between shoreline types, and (3) to analyze and quantify the characteristics of these changes.
2. Data and Methods
2.1. Data
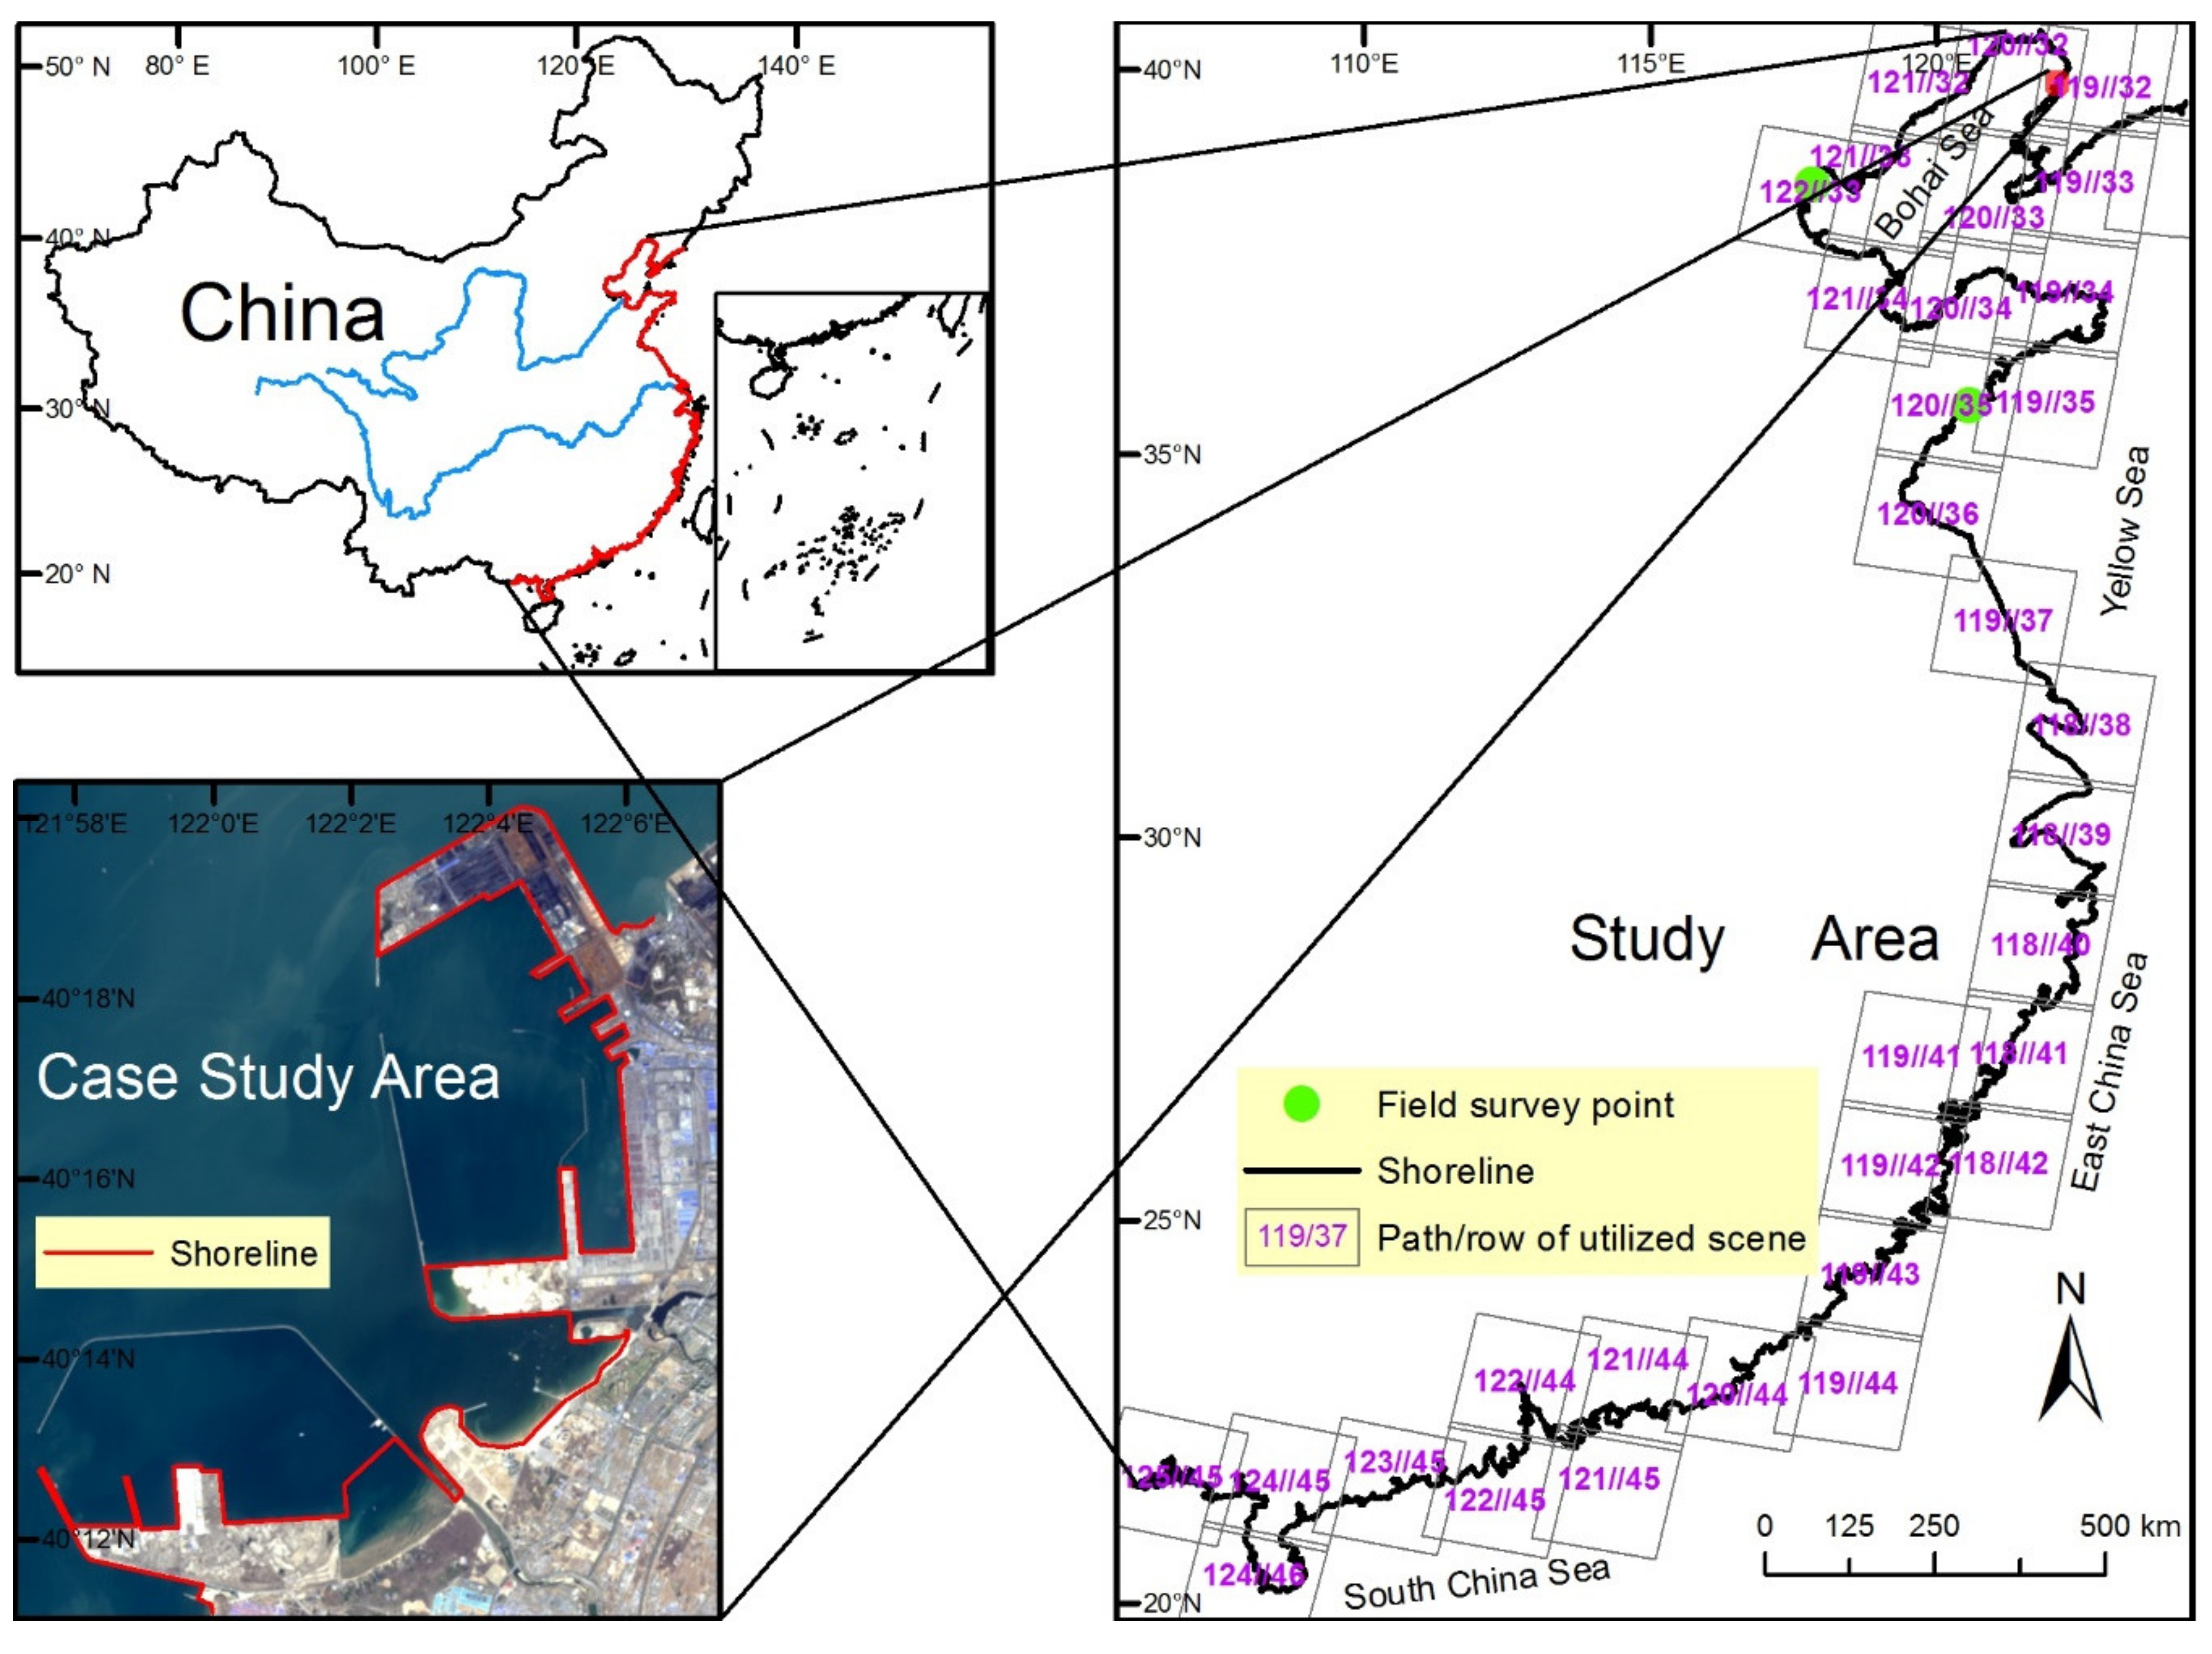
The study area is located on the eastern coast of mainland China (between 20°7′–41°4′ N and 107°57′–124°20′ E) (Figure 1). Landsat Thematic Mapper (TM) and Operational Land Imager (OLI) images for ~1990 and 2019 were used to delineate shorelines along the entire coast of mainland China, covering a length of 14,611.7 km in 2019. Two additional images, an Enhanced Thematic Mapper (ETM+) image from 2000 and a TM image from 2010, were used for a more detailed case study (Figure 1). The two images cover the entire case study area. This area was chosen because it has undergone substantial shoreline transformation mainly due to human activities, a situation typical of many coastal areas in China. Furthermore, the images from the two sensors were chosen because they both have bands in the same spatial resolution (30 m), essential to keep the analysis consistent.
The Landsat images used in this study were downloaded from the United States Geological Survey (USGS) website. The images have been radiometrically calibrated and orthorectified by USGS using ground control points and digital elevation model data [26]. The results of orthorectification are products which have been corrected for terrain distortions. The number of GCPs, their distribution, and the number of GCPs used as checkpoints can be found on the website: https://landsat.usgs.gov/gcp. Landsat processing DTM (digital terrain model) sources include the Shuttle Radar Topography Mission (SRTM), the National Elevation Dataset (NED), Canadian Digital Elevation Data (CDED), Digital Terrain Elevation Data (DTED), the Global 30 Arc-Second Elevation Data Set (GTOPO30), and the Greenland Ice Sheet Mapping Project (GIMP). The root mean square error (RMSE) of the product is less than 12 m. The processing level of the images is terrain precision correction (L1TP), with more processing details available at https://www.usgs.gov. Thirty-three images were chosen for each period. Though some images were partly covered by clouds, this did not influence the shoreline area. Additional details of the selected images can be found in Table 1.
2.2. Methods
2.2.1. Delineation and Classification of Shorelines
Various methods [27], such as the manual method [25], the water index method [28,29,30], the object-oriented method [22], the band ratio method [31], and the object-based region growing integrating edge detection method [32], have been previously used for shoreline extraction from Landsat images. We have tested these various automatic and semi-automatic methods, but numerous corrections are needed to obtain accurate results. Thus, we chose to use the manual method, which is especially reliable and has also been widely used [4,13,19].
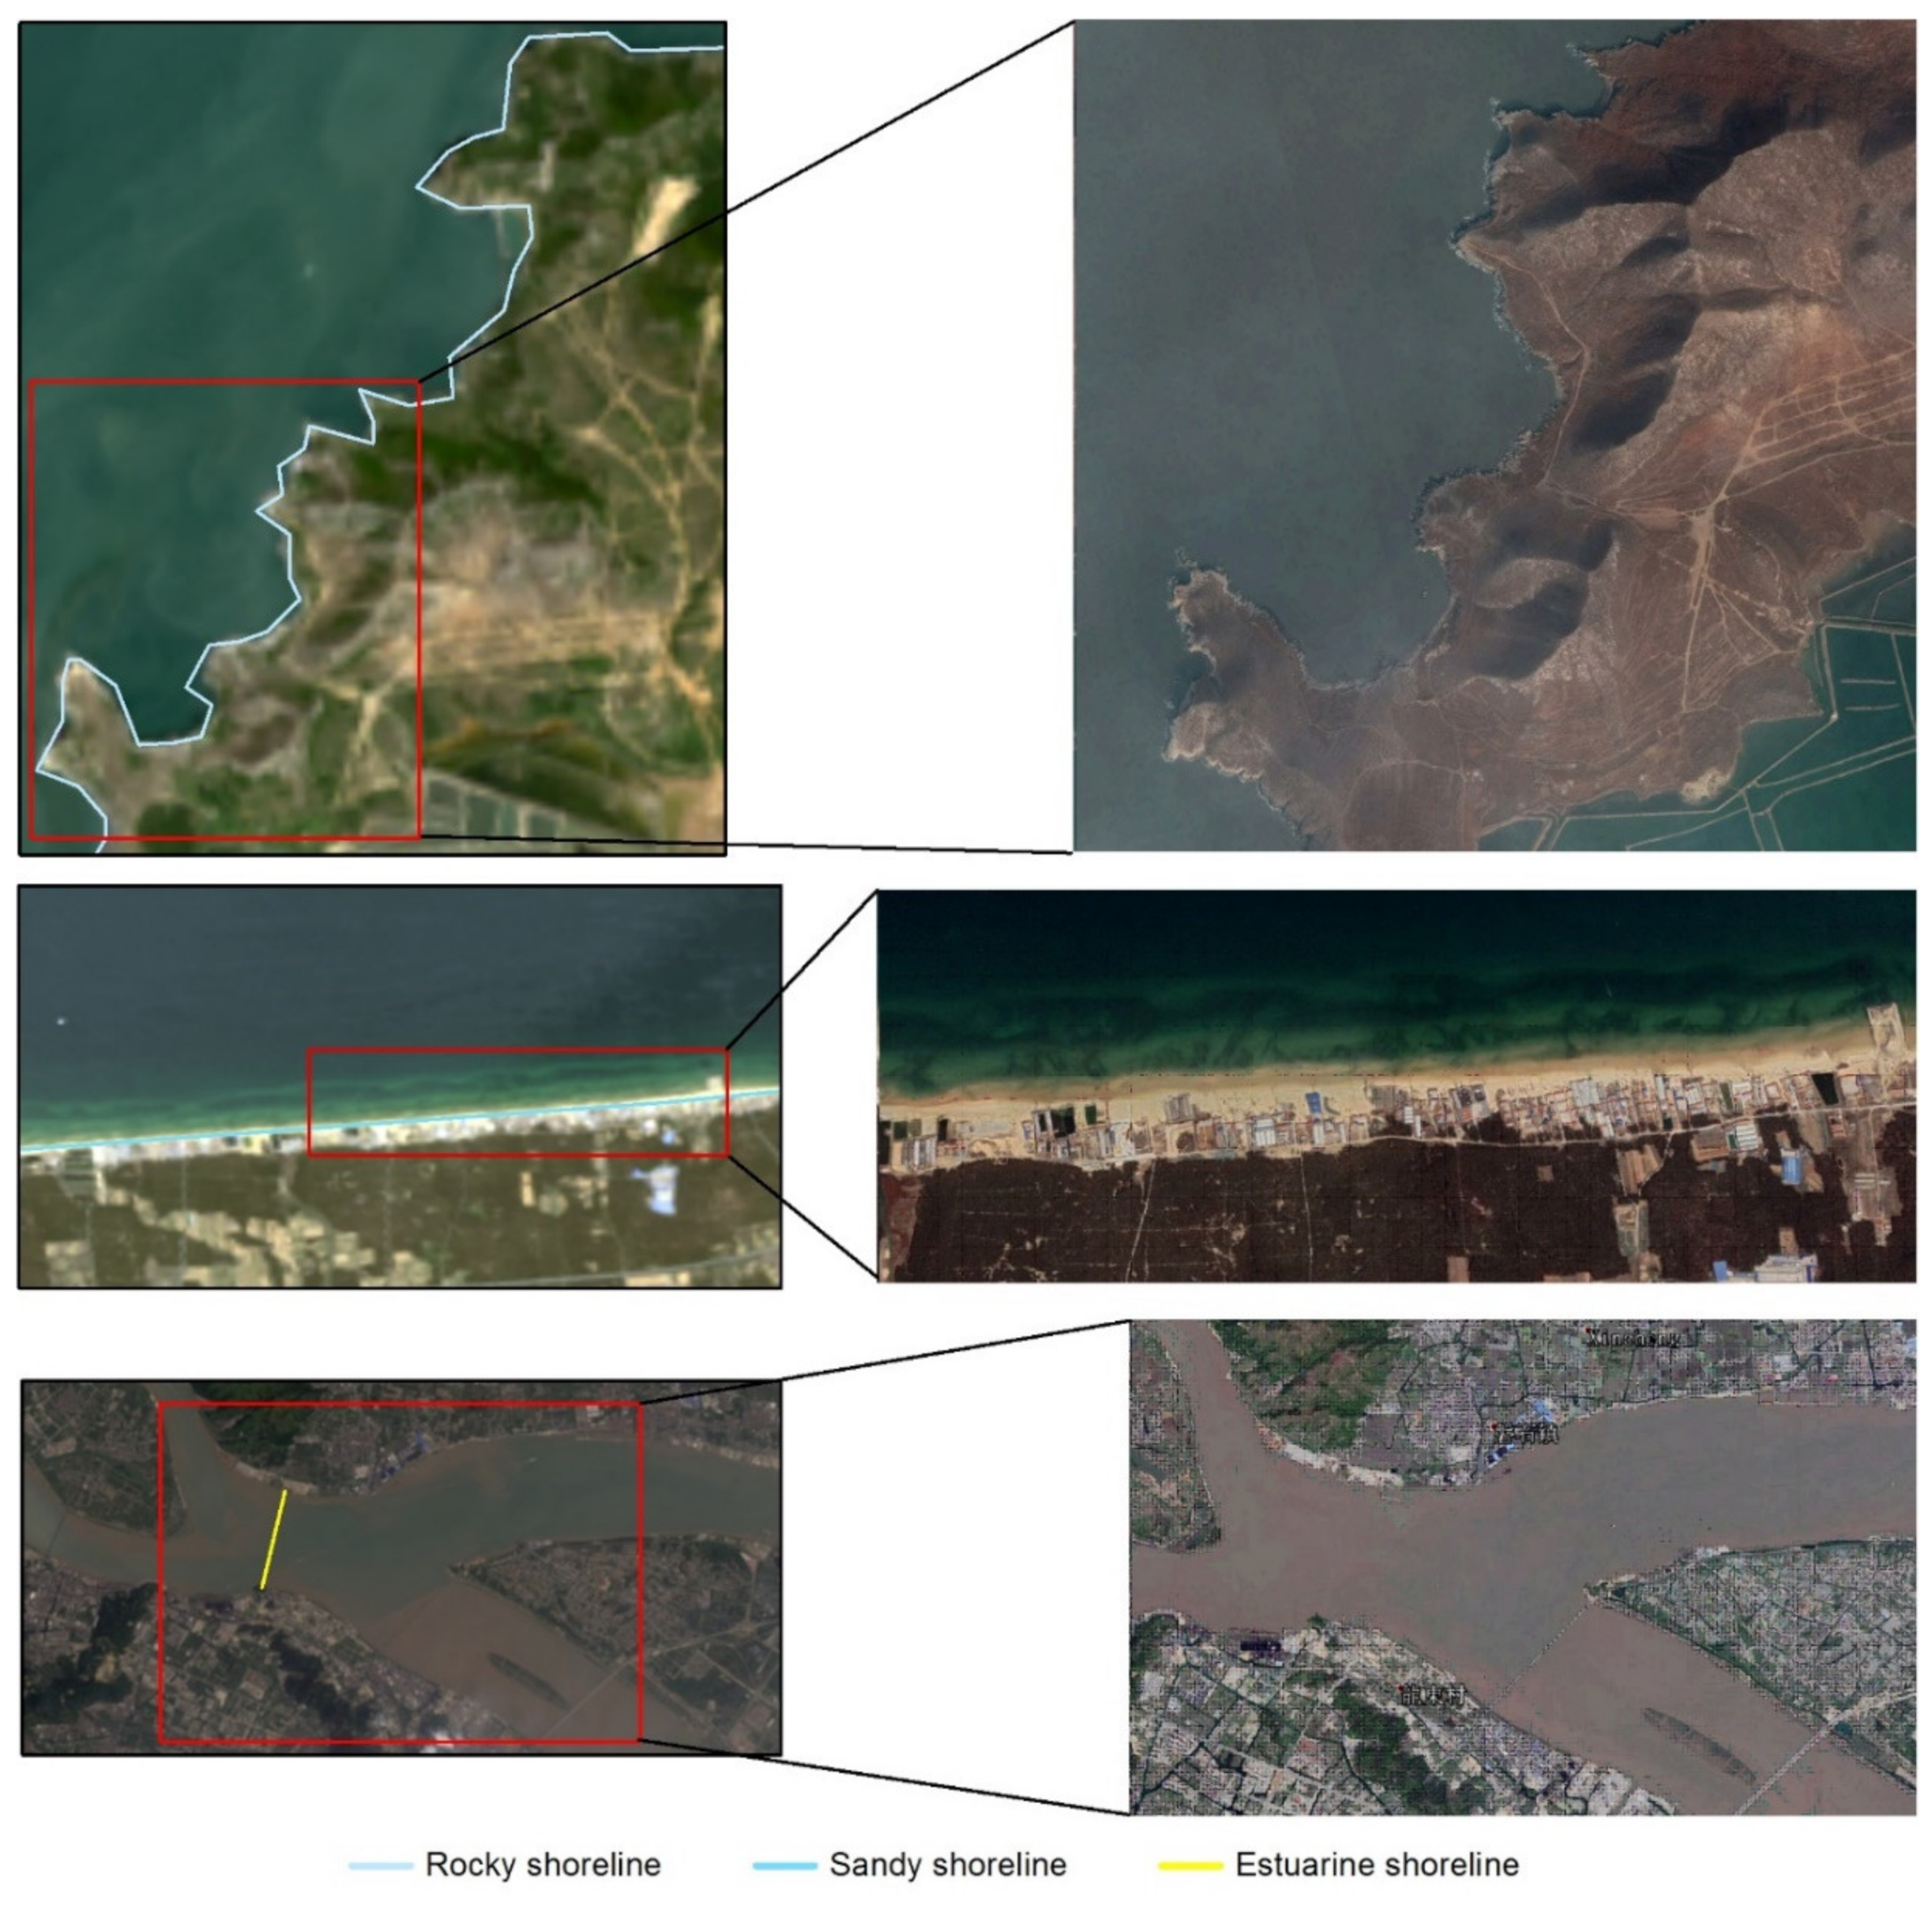
Shorelines were delineated manually using ArcGIS 10.5 and their types were identified with the help of high-resolution imagery from Google Earth. Band combinations 5-4-3, 3-2-1, 4-3-2, and 7-6-5 (the first, second, and third bands as red, green, and blue, respectively) were used as background images when digitizing the shorelines and identifying their types. The classification of shorelines was based on the systems used by Xu [33] and Hou et al. [23]. Shorelines were categorized at two levels. At level one, there were three types, namely, natural, artificial, and estuarine shorelines, while at level Ⅱ, they comprised of thirteen types (details in Table 2). We mainly followed the principles and interpretation standards adopted by Xu [33] to delineate shorelines. For example, locations where ocean capes and upright cliffs directly contact with seawater are regarded as rocky shorelines, and locations where rivers become narrow are considered as estuarine shorelines (Figure 2). For more information about delineation of shorelines, please refer to Xu’s thesis [33]. In order to keep the delineation and classification consistent, crucial for subsequent analysis, all analysis was undertaken by the same researcher, thus minimizing human to human errors. It took one person approximately a little over 6 months to delineate the shorelines in the two time periods using this method.
2.2.2. Calculation of Changes in Shoreline Types
In order to calculate the changes in shoreline types, the key is to couple the appropriate shorelines between the two time periods. In this new Nearest Distance Method (NDM) developed by us to couple shorelines, we first find the end points (points that mark the end of a line) of each shoreline. Secondly, the nearest point to each end point is located on the corresponding shoreline. In the third step, the nearest point is used to split the shoreline. After all the shorelines with one or more nearest points on them have been split, the centroids (geometric center) of both end points of each split shoreline are calculated. In the fifth step, the centroids are coupled based on the nearest distance, that is, if one centroid from the first time period is closest to one centroid from the second time period, the two centroids are regarded as a couple. Finally, the relationship between the coupled centroids is used to couple the shorelines.
To illustrate the NDM, we present an example of shorelines for two years: 1990 and 2019 (Figure 3). First, we obtained the end points (green points for shorelines in 1990 and red points for 2019) of each shoreline. The nearest points (red and green triangles) of the end points are then found on the corresponding shorelines. The triangles were used to split the shorelines. The centroids (green and red stars) of both end points of each split shoreline were calculated and coupled based on the nearest distance. The coupled centroids are shown in purple ellipses in Figure 3. All calculations were done with ArcGIS 10.5. We processed 15,522 and 14,962 end points in ~1990 and 2019, respectively. We also processed 7761 and 7481 centroids in ~1990 and 2019, respectively.
After the relationship between shorelines in the two periods was established, the calculation of changes in shoreline types could be carried out using various database software. We calculated all the changes with Visual Foxpro 9.0.
2.2.3. Error Estimation
High-resolution images from Google Earth have sufficient accuracy for assessing moderate-resolution remote sensing products [34,35]. They are frequently used to estimate the accuracy of shorelines derived from Landsat images [27,36]. One thousand and twenty-five random points were independently digitized along the shorelines using high-resolution imagery from Google Earth as background. The points were then used to evaluate the accuracy of the shorelines derived from Landsat images. The average distance between the points and the shorelines is 26.5 m, and the root mean square error (RMSE) is 31.7 m. Additionally, the accuracy of shoreline classification was visually evaluated with high-resolution imagery from Google Earth and in situ investigations at two sites: the Yellow Sea coast in 2017 and the Bohai Sea coast in 2019. The classifications of coastlines from both of these methods showed a good fit.
3. Results
3.1. Changes in Shoreline Types
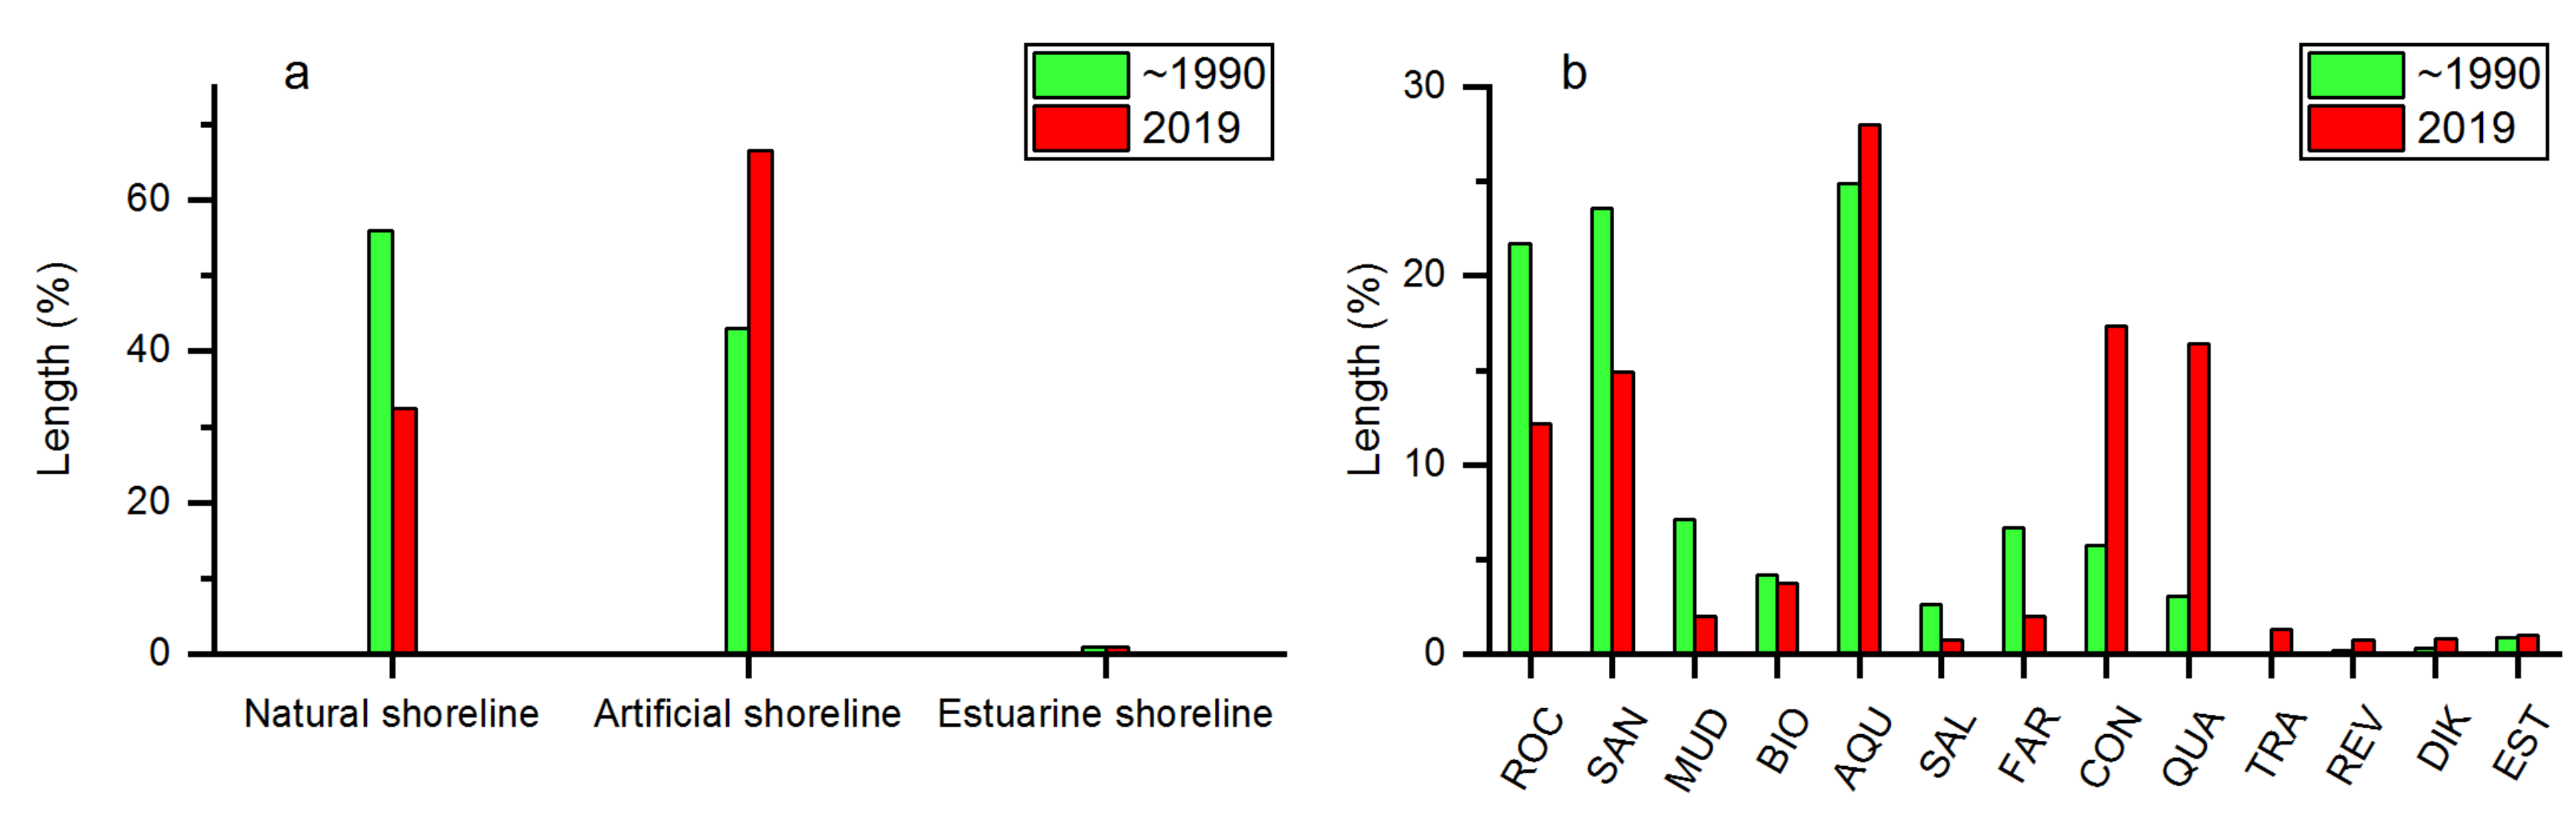
The total length of shorelines along the coast of mainland China increased by 6.9%, from 13,663.1 km to 14,611.7 km over the ~1990–2019 period primarily due to land reclamation and quay construction. The shorelines witnessed dramatic changes in types and locations over the past three decades (Figure 4a,b and Figure 5a,b). In ~1990, most of the shorelines (56.0%) were natural, however, in 2019, two-thirds of them had been transformed to artificial (Figure 5a). The same pattern was seen along shorelines of all the seas, with the biggest change observed along the Bohai Sea where artificial shorelines expanded from 42.4% in ~1990 to 81.5% in 2019 (Table 3). The length of natural shorelines of each subtype decreased over the past decades, while construction and quay shorelines of the artificial type increased dramatically (Figure 5b).
3.2. Changes between Shoreline Types
From ~1990 to 2019, about half of the natural shorelines (4,000.2 km, 48%) changed into artificial shorelines, while the majority of artificial shorelines (5806.5 km, 92.6%) remained the same (Table 4).
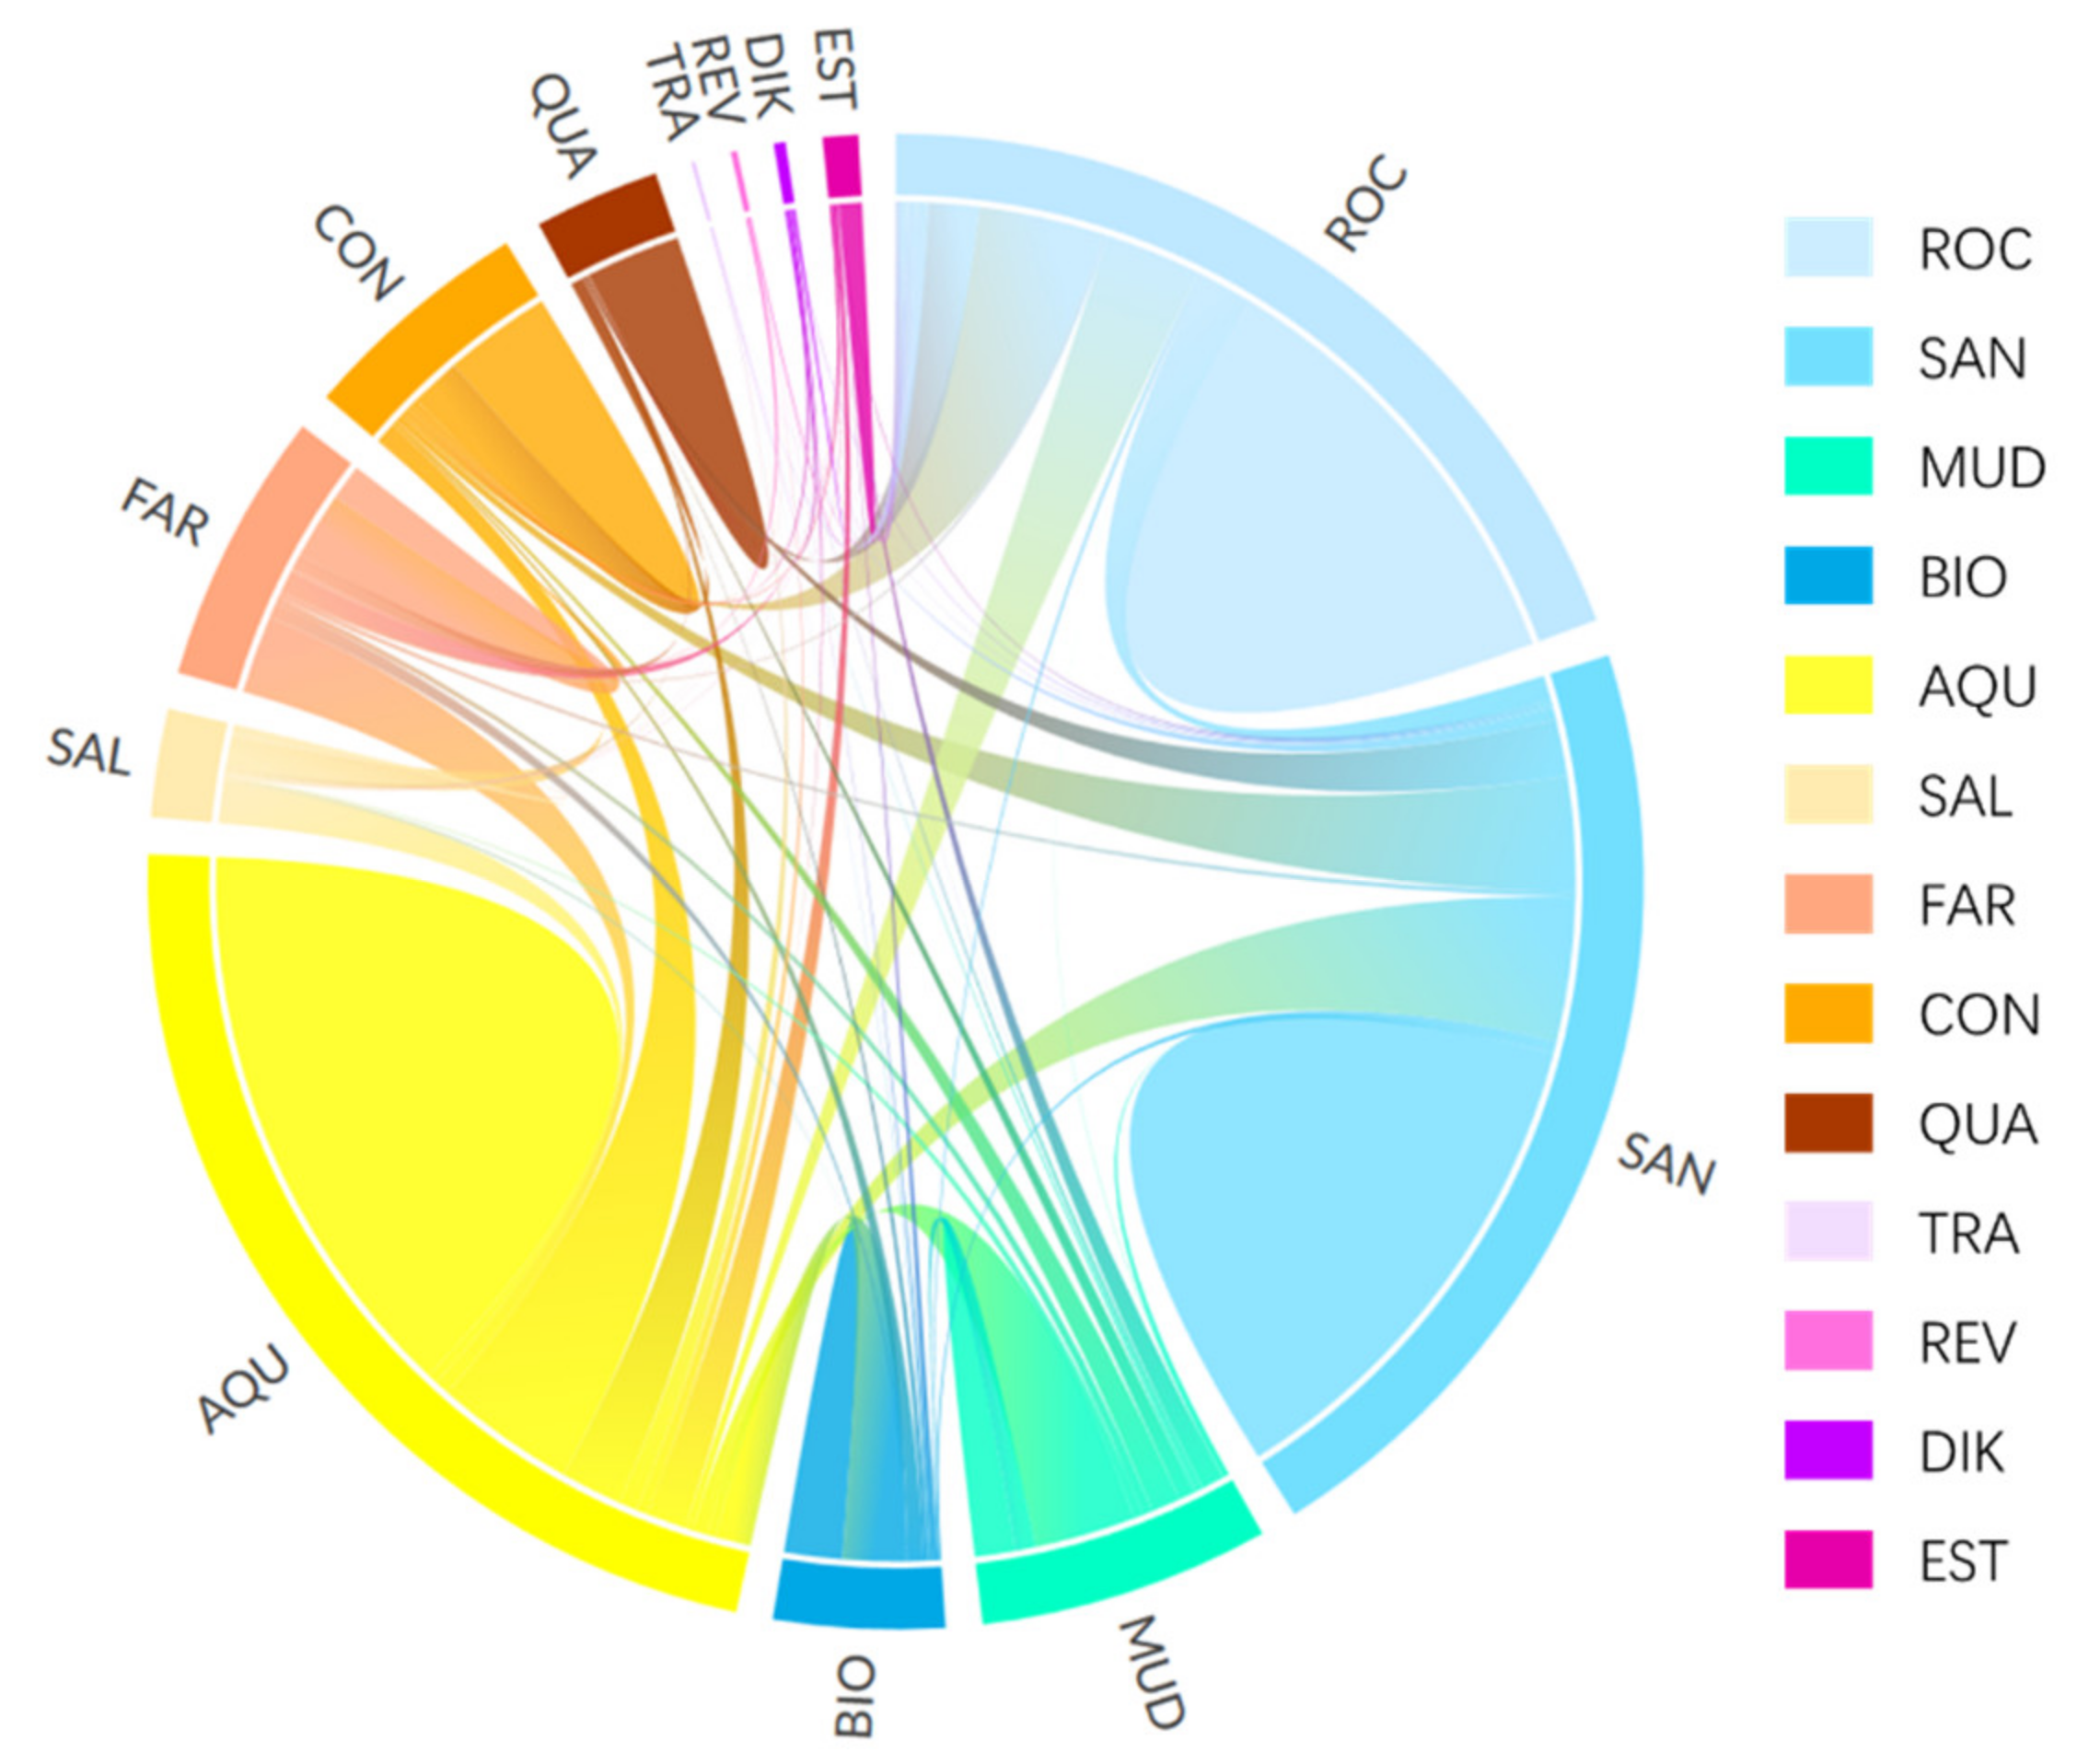
Quay shorelines were the most stable type with 82.5% remaining unchanged. Estuarine shorelines lost one-third of their length with 12.7% and 9.1% changing into aquaculture and construction shorelines, respectively. Sandy, aquaculture, and traffic shorelines were all lost by about 40%. Both rocky and construction shorelines lost about 50% while biological shorelines lost more than 60% of their length. The rest of shoreline types lost more than three-quarters of their length, with revetment and seawall shorelines losing about 95% of their length (Table 5, Figure 6).
Many shorelines changed into aquaculture, construction, and quay shorelines while only a small percentage of shorelines changed into rocky, muddy, biological, salt pan, traffic, revetment and seawall, and dike and jetty shorelines (Table 5, Figure 6).
More than half of the natural shorelines in the Bohai Sea and the Yellow Sea changed into artificial shorelines from ~1990 to 2019, while the majority of artificial shorelines did not change during the same period. Estuarine shorelines gained more than they lost along all the seas in China (Table 6).
3.3. A Case Study
A case study is presented here to give more details about how socioeconomic development has transformed shorelines. The location chosen for our case study is situated in the Bayuquan District in Liaoning Province, located in the northeastern rim of the Bohai Sea (Figure 1). This is the location of one of the ten biggest ports in China and the second biggest port in northeastern China. In 1989, the port had a handling capacity of 1 million tons, which increased 230-fold to 0.23 billion tons in 2019. At the end of 1987, the district had only 56,000 residents and a built-up area of 4.1 km2. In 2017, the number of residents increased to half a million, and the built-up area expanded to 143.8 km2. The gross domestic product of this region increased from about CNY 0.1 billion in 1990 to CNY 40 billion in 2019. The beautiful sandy beaches and other tourist attractions in the area attracted only one million visitors in 1988, however, the number of visitors skyrocketed to 13 million in 2019.
In 1990, the coastal area was characterized by sandy beaches (15.2 km, 55.7%) with a small port in the north (Figure 7a,e). In 2000, the port was earmarked for expansion (Figure 7b,e) and by 2010, the northern part turned into a large port area while the southwestern part underwent construction of a quay (Figure 7c,e). By 2019, 92.5% of the shorelines were quay shorelines, and only 7.5% (5.1km) were reserved as sandy shorelines which served as a park for recreation (Figure 7d,e). The total length of shorelines increased from 27.3 km in 1990 to 68.4 km in 2019.
4. Discussion
4.1. The Length of the Shorelines
Our results show that the total lengths of shorelines along the coast of mainland China were 13,663.1 km and 14,611.7 km in ~1990 and 2019, respectively, lower than the results of Hou et al. [23]. In their study, they used 30 m Landsat images to compare the shorelines of China in 1990 and 2014 and obtained total shoreline lengths of 16,500 km (RMSE: 23.46 m) and 19,700 km (RMSE: 19.36 m), respectively. The length of shorelines is generally ill-defined [37] and depends on the methodology of measurement, which is one of the reasons that the reported length of shorelines of China over time varies from 8000 km to 18,000 km [38]. Hou et al. [23] digitized shorelines pixel by pixel, resulting in sawtooth lines which could have resulted in larger lengths than obtained by us. Generally, if the RMSE is close to the spatial resolution of the images utilized to delineate the shorelines, it is considered reasonable. However, when the RMSE is much smaller than the spatial resolution, more noise will be introduced into the results elongating the lines. This is one of the reasons that our results are not consistent with those of Hou et al. [23] in terms of absolute values. Other factors could have played a role in the inconsistency such as the different definitions of estuarine shorelines and human bias because digitization was performed by different people. Our results was tested independently by one of the authors of the Hou et al. [23], who confirmed that our definition of estuarine shoreline was different from the one used by Hou et al. [23]. Moreover, since we mainly focused on the relative changes in shoreline types in this study, the accuracy of our results is adequate for the analysis.
4.2. Changes in Shoreline Types
Our study shows that natural shorelines, which were the majority type in ~1990, became the minority type in 2019 along the entire coast of mainland China and along the shores of each adjacent sea (Figure 5a, Table 3), suggesting that fundamental changes have occurred to the entire country’s long coastline. In the last several decades, China’s economy has grown at an unprecedented rate, concurrent with the exploitation of coastal zones. Consistent with previous studies [5,23], human activities, including land reclamation [12,13,39], aquaculture development [40], and quay construction [41], were the main driving force behind these shoreline changes.
More than 60 percent of biological shorelines composed of mangroves, reeds, etc., have been transformed into other types. Some changes that have taken place are extremely worrisome, because they include some of the most biodiverse areas of China’s coastal zones. This finding is supported by the work of Ma et al. [42]. According to their results, one-third of the total area (0.67 million ha) of national nature reserves along the coast of the Yellow Sea, a global biodiversity hotspot, was lost from 2006 to 2015, even though they are the most strictly protected nature reserves in China.
Two-third of the sandy shorelines were lost in the case study area to quay construction. This case study clearly demonstrates how anthropogenic modifications that are often insensitive to local ecology can destroy natural habitats and prevent the accessibility of future generations from enjoying these dynamic, living landscapes. It also mirrors the global trend reported by Vousdoukas et al. [43] who showed that ambient trends in shoreline dynamics, combined with coastal recession driven by sea-level rise, could result in the near extinction of almost half of the world’s sandy beaches by the end of the century.
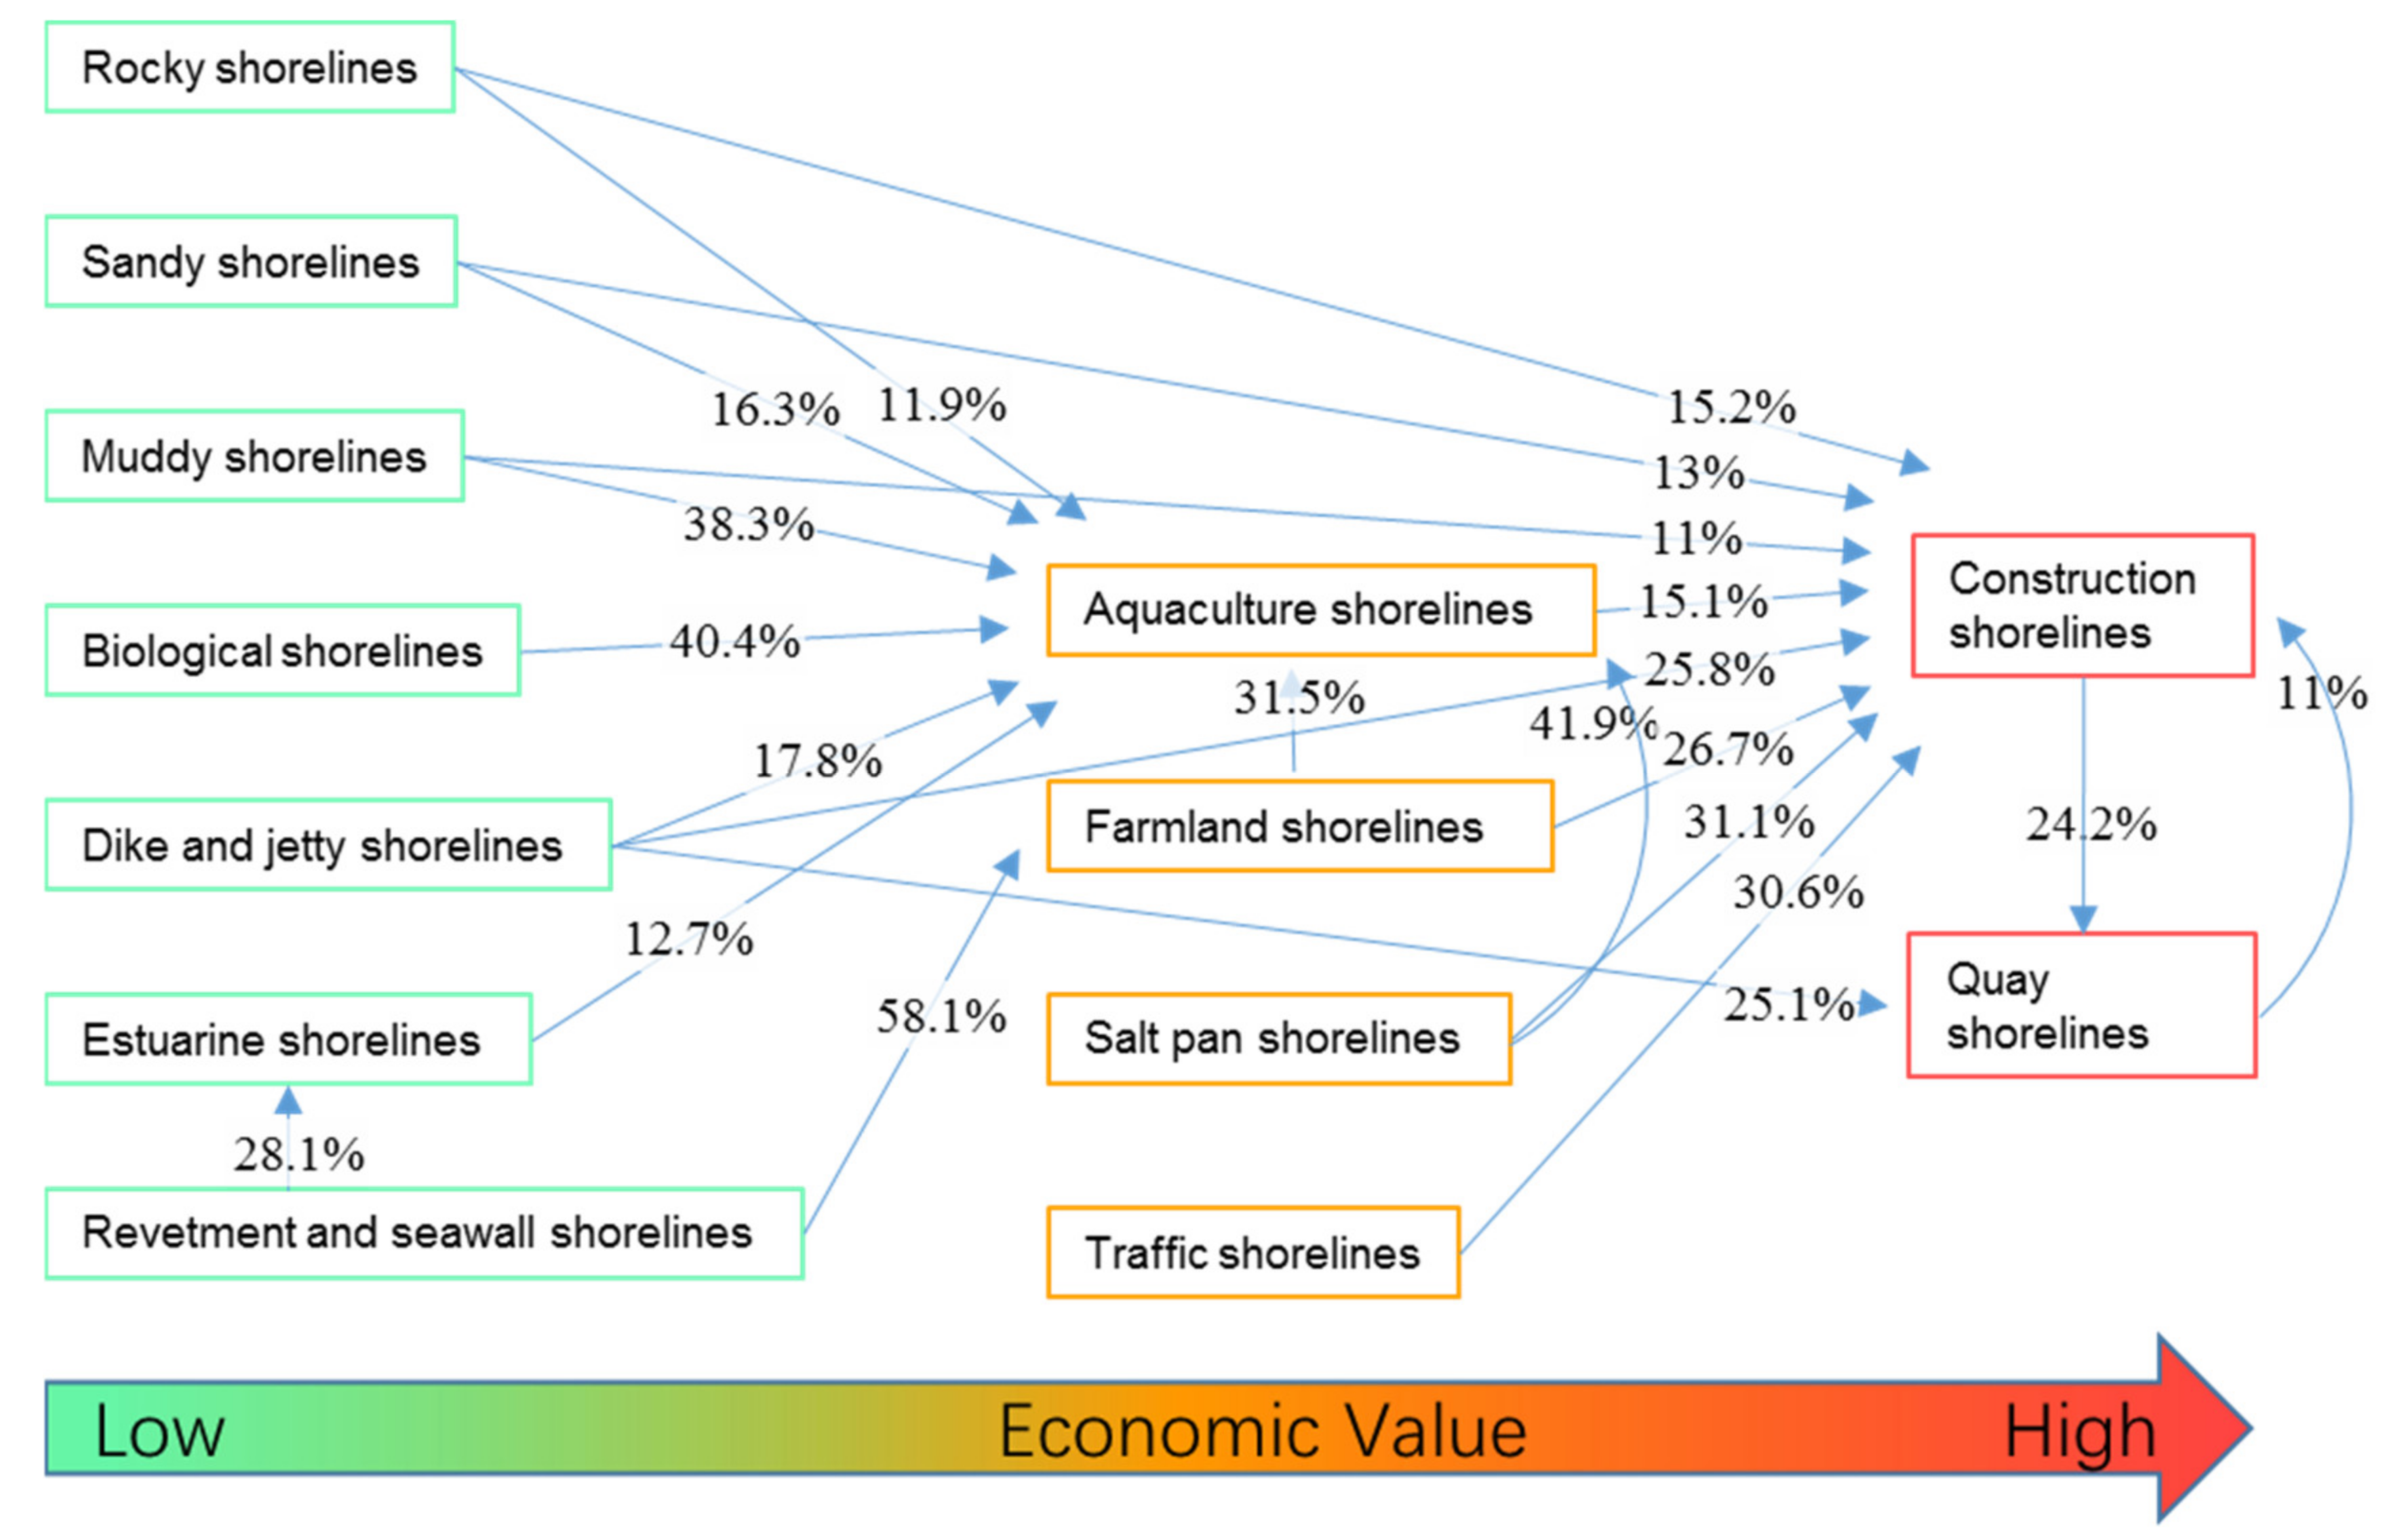
One of the most salient observations from our study is that a major driver of shoreline changes in China has been economic interests. Shorelines changed from low economic value types into high economic value types because natural shorelines generally have lower economic value than artificial shorelines. Almost half of the natural shorelines changed into artificial shorelines (Table 4). Meanwhile, artificial shorelines of low economic value were transformed into those of high economic value. This is illustrated in Figure 8, which uses data from Table 5 after retaining only values greater than 10%. In this figure, the shoreline types were grouped based on their economic value. The change in shorelines of low economic value to high value is easily discernible in this figure. Shorelines of low economic value, such as rocky, sandy, muddy, biological, and estuarine shorelines, were converted into shorelines of high economic value, such as aquaculture, which were converted into shorelines of even more economic value, such as construction and quay shorelines. No backward transformation could be observed in Figure 8. This pattern is also visible in the case study area (Figure 7), whose economic value has increased dramatically. Case studies such as these could be important for assessing how much environmental ecological damage accompanies anthropogenic changes to the coastline.
Thus, it is clear that economy-oriented human activities have significantly and fundamentally changed the shorelines along the coast of mainland China. More and more people now live in coastal areas in China, and the existence and well-being of these large coastal populations are now significantly intertwined with coastal ecosystems because of the goods and services these ecosystems provide. As shoreline changes continue to occur, and infrastructure changes and populations along the coasts continue to increase, it will make these populations and areas also more vulnerable to hazards, such as storms, sea-level rise, and coastal erosion. Changing shorelines from low to high economic values has increasingly reduced people’s accessibility to coastal regions for recreation. In addition to being important tourist destinations, sandy beaches are valuable environments that dissipate wave energy, protect inland areas, and serve as marine and coastal habitats for many species, including some that are endangered and/or threatened. They are highly dynamic zones where sediments are constantly moving, generating new morphological features, and changing shoreline positions.
Shorelines are undergoing substantial changes not only in China but also worldwide, especially in regions experiencing rapid economic growth [44]. Growing populations and development along the coasts put unprecedented pressure on the coastal ecosystems. Meanwhile, ongoing manifestations of climate change such as the sea-level rise, and intensity of storm surges, significantly enhance the risks to the ecosystems, natural resources, infrastructure, and well-being of coastal populations [45,46].
5. Conclusions
Landsat TM images for ~1990 and Landsat OLI images for 2019 were utilized to delineate and classify the shorelines along the coast of mainland China. A new method, the Nearest Distance Method, was developed to analyze changes between shoreline types. This method can be adapted for management, conservation, and sustainable development of shorelines in countries that are undergoing rapid economic growth. We report that significant shoreline changes have occurred over a short span of ~30 years. Our results indicate that the proportion of the natural shorelines over the period has changed from majority to minority, while the proportion of artificial shorelines shows a reverse trend. More than 60% of the biological shorelines were lost, indicating alarming changes in areas that included the most biodiverse areas of China’s coastal zones. The changing pattern of shoreline types followed an obvious pattern where shorelines of low economic value were converted into those of higher economic value. We contend that the main driving force behind these shoreline changes was economy-oriented human activities. The influence of human activities on shorelines is unprecedented, and the repercussion of these shoreline changes could be extensive, especially because more populations have been attracted to living along the coast, underscoring the need for the design and implementation of effective adaptive measures. Growing populations and development along the coasts increase the vulnerability of coastal ecosystems to human activities in addition to escalating the loss of coastal infrastructure and natural resources to sea-level rise and storm surges.
Author Contributions
Conceptualization, Hongzhen Tian; methodology, Kai Xu and Hongzhen Tian; software, Kai Xu and Hongzhen Tian; validation, Kai Xu and Hongzhen Tian; formal analysis, Kai Xu and Hongzhen Tian; investigation, Kai Xu and Hongzhen Tian; resources, Kai Xu and Hongzhen Tian; data curation, Kai Xu and Hongzhen Tian; writing—original draft preparation, Hongzhen Tian; writing—review and editing, Hongzhen Tian, Kai Xu, Joaquim I. Goes, Qinping Liu, Helga do Rosario Gomes, and Mengmeng Yang; visualization, Hongzhen Tian; Supervision, Hongzhen Tian; project administration, Hongzhen Tian; funding acquisition, Hongzhen Tian. All authors have read and agreed to the published version of the manuscript.
Funding
This research was funded by Tianjin Municipal Education Commission (grant number: TD13-5038), Tianjin Philosophy and Social Science Planning Project (grant number: TJGL20-012), and Humanities and Social Sciences Research Project of Higher Education in Tianjin (grant number: 20142111).
Acknowledgments
We thank the United States Geological Survey (USGS) for providing Landsat imagery. We also thank Gilbert R. Bossé for helping with the language. We are grateful to the three anonymous reviewers whose invaluable comments and suggestions substantially improved the quality of this paper.
Conflicts of Interest
The authors declare no conflict of interest.
References
- Pernetta, J.C.; Milliman, J.D. Land-ocean interactions in the coastal zone: Implementation plan. Oceanogr. Lit. 1995, 9, 801. [Google Scholar]
- Bartlett, D.; Smith, J. GIS for Coastal Zone Management; CRC Press: New York, NY, USA, 2004; p. 27. [Google Scholar]
- Fu, Y.; Guo, Q.; Wu, X.; Fang, H.; Pan, Y. Analysis and prediction of changes in coastline morphology in the Bohai Sea, China, using remote sensing. Sustainability 2017, 9, 900. [Google Scholar] [CrossRef] [Green Version]
- Qiao, G.; Mi, H.; Wang, W.; Tong, X.; Li, Z.; Li, T.; Liu, S.; Hong, Y. 55-year (1960–2015) spatiotemporal shoreline change analysis using historical DISP and Landsat time series data in Shanghai. Int. J. Appl. Earth Obs. 2018, 68, 238–251. [Google Scholar] [CrossRef]
- Fan, Q.; Liang, L.; Liang, F.; Sun, X. Research progress on coastline change in China. J. Coast. Res. 2020, 99, 289–295. [Google Scholar] [CrossRef]
- Valderrama-Landeros, L.H.; Martell-Dubois, R.; Ressl, R.; Silva-Casarín, R.; Cruz-Ramírez, C.J.; Muñoz-Pérez, J.J. Dynamics of coastline changes in Mexico. J. Geogr. Sci. 2019, 29, 1637–1654. [Google Scholar] [CrossRef] [Green Version]
- Solomon, S.M. Spatial and temporal variability of shoreline change in the Beaufort-Mackenzie region, northwest territories, Canada. Geo-Mar. Lett. 2005, 25, 127–137. [Google Scholar] [CrossRef]
- Kuleli, T.; Guneroglu, A.; Karsli, F.; Dihkan, M. Automatic detection of shoreline change on coastal Ramsar wetlands of Turkey. Ocean Eng. 2011, 38, 1141–1149. [Google Scholar] [CrossRef]
- Nassar, K.; Fath, H.; Mahmod, W.E.; Masria, A.; Nadaoka, K.; Negm, A. Automatic detection of shoreline change: Case of North Sinai coast, Egypt. J. Coast. Conserv. 2018, 22, 1057–1083. [Google Scholar] [CrossRef]
- Zeinali, S.; Talebbeydokhti, N.; Dehghani, M. Spatiotemporal shoreline change in Boushehr Province coasts, Iran. J. Oceanol. Limnol. 2020, 38, 707–721. [Google Scholar] [CrossRef]
- Nassar, K.; Mahmod, W.E.; Fath, H.; Masria, A.; Nadaoka, K.; Negm, A. Shoreline change detection using DSAS technique: Case of North Sinai coast, Egypt. Mar. Georesour. Geotechnol. 2019, 37, 81–95. [Google Scholar] [CrossRef]
- Ai, B.; Zhang, R.; Zhang, H.; Ma, C.; Gu, F. Dynamic process and artificial mechanism of coastline change in the Pearl River Estuary. Reg. Stud. Mar. Sci. 2019, 30, 100715. [Google Scholar] [CrossRef]
- Ding, X.; Shan, X.; Chen, Y.; Jin, X.; Muhammed, F.R. Dynamics of shoreline and land reclamation from 1985 to 2015 in the Bohai Sea, China. J. Geogr. Sci. 2019, 29, 2031–2046. [Google Scholar] [CrossRef] [Green Version]
- Chu, Z.; Yang, X.; Feng, X.; Fan, D.; Li, Y.; Shen, X.; Miao, A. Temporal and spatial changes in coastline movement of the Yangtze delta during 1974–2010. J. Asian Earth Sci. 2013, 66, 166–174. [Google Scholar] [CrossRef]
- Feng, Y.; Liu, Y.; Liu, D. Shoreline mapping with cellular automata and the shoreline progradation analysis in Shanghai, China from 1979 to 2008. Arab. J. Geosci. 2015, 8, 4337–4351. [Google Scholar] [CrossRef]
- Li, J.; Ye, M.; Pu, R.; Liu, Y.; Guo, Q.; Feng, B.; Huang, R.; He, G. Spatiotemporal change patterns of coastlines in Zhejiang Province, China, over the last twenty-five years. Sustainability 2018, 10, 477. [Google Scholar] [CrossRef] [Green Version]
- Liu, C.; Wu, X.; Cao, X.; Wu, G. Analysis of coastline changes and the socio-economic driving mechanisms in Shenzhen, China. Mar. Geod. 2017, 40, 378–403. [Google Scholar] [CrossRef] [Green Version]
- Wang, K. Evolution of Yellow River Delta coastline based on remote sensing from 1976 to 2014, China. Chinese Geogr. Sci. 2019, 29, 181–191. [Google Scholar] [CrossRef] [Green Version]
- Wang, X.; Liu, Y.; Ling, F.; Liu, Y.; Fang, F. Spatio-temporal change detection of Ningbo coastline using Landsat time-series images during 1976–2015. ISPRS Int. J. Geo-Inf. 2017, 6, 68. [Google Scholar] [CrossRef] [Green Version]
- Zhang, X.; Yang, Z.; Zhang, Y.; Ji, Y.; Wang, H.; Lv, K.; Lu, Z. Spatial and temporal shoreline changes of the southern Yellow River (Huanghe) Delta in 1976–2016. Mar. Geol. 2018, 395, 188–197. [Google Scholar] [CrossRef]
- Li, J.; Pu, R.; Yuan, Q.; Liu, Y.; Feng, B.; Guo, Q.; Jiang, Y.; Ye, M. Spatiotemporal change patterns of coastlines in Xiangshan Harbor (Zhejiang, China) during the past 40 years. J. Coast. Res. 2018, 34, 1418–1428. [Google Scholar] [CrossRef]
- Wu, X.; Liu, C.; Wu, G. Spatial-temporal analysis and stability investigation of coastline changes: A case study in Shenzhen, China. IEEE J.-STARS 2018, 11, 45–56. [Google Scholar] [CrossRef]
- Hou, X.; Wu, T.; Hou, W.; Chen, Q.; Wang, Y.; Yu, L. Characteristics of coastline changes in mainland China since the early 1940s. Sci. China Earth Sci. 2016, 59, 1791–1802. [Google Scholar] [CrossRef]
- Xu, N.; Gong, P. Significant coastline changes in China during 1991–2015 tracked by Landsat data. Sci. Bull. 2018, 63, 883–886. [Google Scholar] [CrossRef] [Green Version]
- Wu, T.; Hou, X.; Xu, X. Spatio-temporal characteristics of the mainland coastline utilization degree over the last 70 years in China. Ocean Coast. Manag. 2014, 98, 150–157. [Google Scholar] [CrossRef]
- Wulder, M.A.; Loveland, T.R.; Roy, D.P.; Crawford, C.J.; Masek, J.G.; Woodcock, C.E.; Allen, R.G.; Anderson, M.C.; Belward, A.S.; Cohen, W.B.; et al. Current status of Landsat program, science, and applications. Remote Sens. Environ. 2019, 225, 127–147. [Google Scholar] [CrossRef]
- Mitra, S.S.; Mitra, D.; Santra, A. Performance testing of selected automated coastline detection techniques applied on multispectral satellite imageries. Earth Sci. Inform. 2017, 10, 321–330. [Google Scholar] [CrossRef]
- Ghosh, M.K.; Kumar, L.; Roy, C. Monitoring the coastline change of Hatiya Island in Bangladesh using remote sensing techniques. ISPRS J. Photogramm. 2015, 101, 137–144. [Google Scholar] [CrossRef]
- Li, W.; Gong, P. Continuous monitoring of coastline dynamics in western Florida with a 30-year time series of Landsat imagery. Remote Sens. Environ. 2016, 179, 196–209. [Google Scholar] [CrossRef]
- Viaña-Borja, S.; Ortega-Sánchez, M. Automatic methodology to detect the coastline from Landsat images with a new water index assessed on three different Spanish Mediterranean Deltas. Remote Sens. 2019, 11, 2186. [Google Scholar] [CrossRef] [Green Version]
- Masria, A.; Nadaoka, K.; Negm, A.; Iskander, M. Detection of shoreline and land cover changes around Rosetta Promontory, Egypt, based on remote sensing analysis. Land 2015, 4, 216–230. [Google Scholar] [CrossRef] [Green Version]
- Zhang, T.; Yang, X.; Hu, S.; Su, F. Extraction of coastline in aquaculture coast from multispectral remote sensing images: Object-based region growing integrating edge detection. Remote Sens. 2013, 5, 4470–4487. [Google Scholar] [CrossRef] [Green Version]
- Xu, N. Research on Spatial and Temporal Variation of China Mainland Coastline and Coastal Engineering; Yantai Insititute of Coastal Zone Research CAS: Yantai, China, 2016. [Google Scholar]
- Potere, D. Horizontal positional accuracy of Google Earth’s high-resolution imagery archive. Sensors 2008, 8, 7973–7981. [Google Scholar] [CrossRef] [PubMed]
- Pulighe, G.; Baiocchi, V.; Lupia, F. Horizontal accuracy assessment of very high resolution Google Earth images in the city of Rome, Italy. Int. J. Digit. Earth 2015, 9, 342–362. [Google Scholar] [CrossRef]
- Sunder, S.; Ramsankaran, R.; Ramakrishnan, B. Inter-comparison of remote sensing sensing-based shoreline mapping techniques at different coastal stretches of India. Environ. Monit. Assess. 2017, 189, 290. [Google Scholar] [CrossRef] [PubMed]
- Mandelbrot, B. How long is the coast of Britain? Statistical self-similarity and fractional dimension. Science 1967, 156, 636–638. [Google Scholar] [CrossRef] [Green Version]
- Ma, J.; Liu, D.; Chen, Y. Random fractal characters and length uncertainty of the continental coastline of China. J. Earth. Syst. Sci. 2016, 125, 1615–1621. [Google Scholar] [CrossRef] [Green Version]
- Zhu, M.S.; Sun, T.; Shao, D.D. Impact of land reclamation on the evolution of shoreline change and nearshore vegetation distribution in Yangtze River Estuary. Wetlands 2016, 36, 11–17. [Google Scholar] [CrossRef]
- Xu, N.; Gao, Z.; Ning, J. Analysis of the characteristics and causes of coastline variation in the Bohai Rim (1980–2010). Environ. Earth Sci. 2016, 75, 719. [Google Scholar] [CrossRef]
- Zhang, X.; Pan, D.; Chen, J.; Zhao, J.; Zhu, Q.; Huang, H. Evaluation of coastline changes under human intervention using multi-temporal high-resolution images: A case study of the Zhoushan Islands, China. Remote Sens. 2014, 6, 9930–9950. [Google Scholar] [CrossRef] [Green Version]
- Ma, Z.; Chen, Y.; Melville, D.S.; Fan, J.; Liu, J.; Dong, J.; Tan, K.; Cheng, X.; Fuller, R.A.; Xiao, X.; et al. Changes in area and number of nature reserves in China. Conserv. Biol. 2019, 33, 1066–1075. [Google Scholar] [CrossRef]
- Vousdoukas, M.I.; Ranasinghe, R.; Mentaschi, L.; Plomaritis, T.A.; Athanasiou, P.; Luijendijk, A.; Feyen, L. Sandy coastlines under threat of erosion. Nat. Clim. Chang. 2020, 10, 260–263. [Google Scholar] [CrossRef]
- Selvan, S.C.; Kankara, R.S.; Prabhu, K.; Rajan, B. Shoreline change along Kerala, south-west coast of India, using geo-spatial techniques and field measurement. Nat. Hazards 2020, 100, 17–38. [Google Scholar] [CrossRef]
- Neumann, B.; Vafeidis, A.T.; Zimmermann, J.; Nicholls, R.J. Future coastal population growth and exposure to sea-level rise and coastal flooding a global assessment. PLoS ONE 2015, 10, e118571. [Google Scholar] [CrossRef] [PubMed]
- Nicholls, R.J.; Cazenave, A. Sea-level rise and its impact on coastal zones. Science 2010, 328, 1517–1520. [Google Scholar] [CrossRef] [PubMed]
Figure 1.
Location of the entire study area and the case study area showing the path and row of the Landsat scenes utilized and field survey points. Shorelines in the case study area are superimposed on the Landsat Operational Land Imager (OLI) image of 1 May 2019.
Figure 1.
Location of the entire study area and the case study area showing the path and row of the Landsat scenes utilized and field survey points. Shorelines in the case study area are superimposed on the Landsat Operational Land Imager (OLI) image of 1 May 2019.

Figure 2.
Examples of rocky, sandy and estuarine shorelines superimposed on Landsat OLI images. The images on the right side are high-resolution images from Google Earth.
Figure 2.
Examples of rocky, sandy and estuarine shorelines superimposed on Landsat OLI images. The images on the right side are high-resolution images from Google Earth.

Figure 3.
Illustration of the Nearest Distance Method.
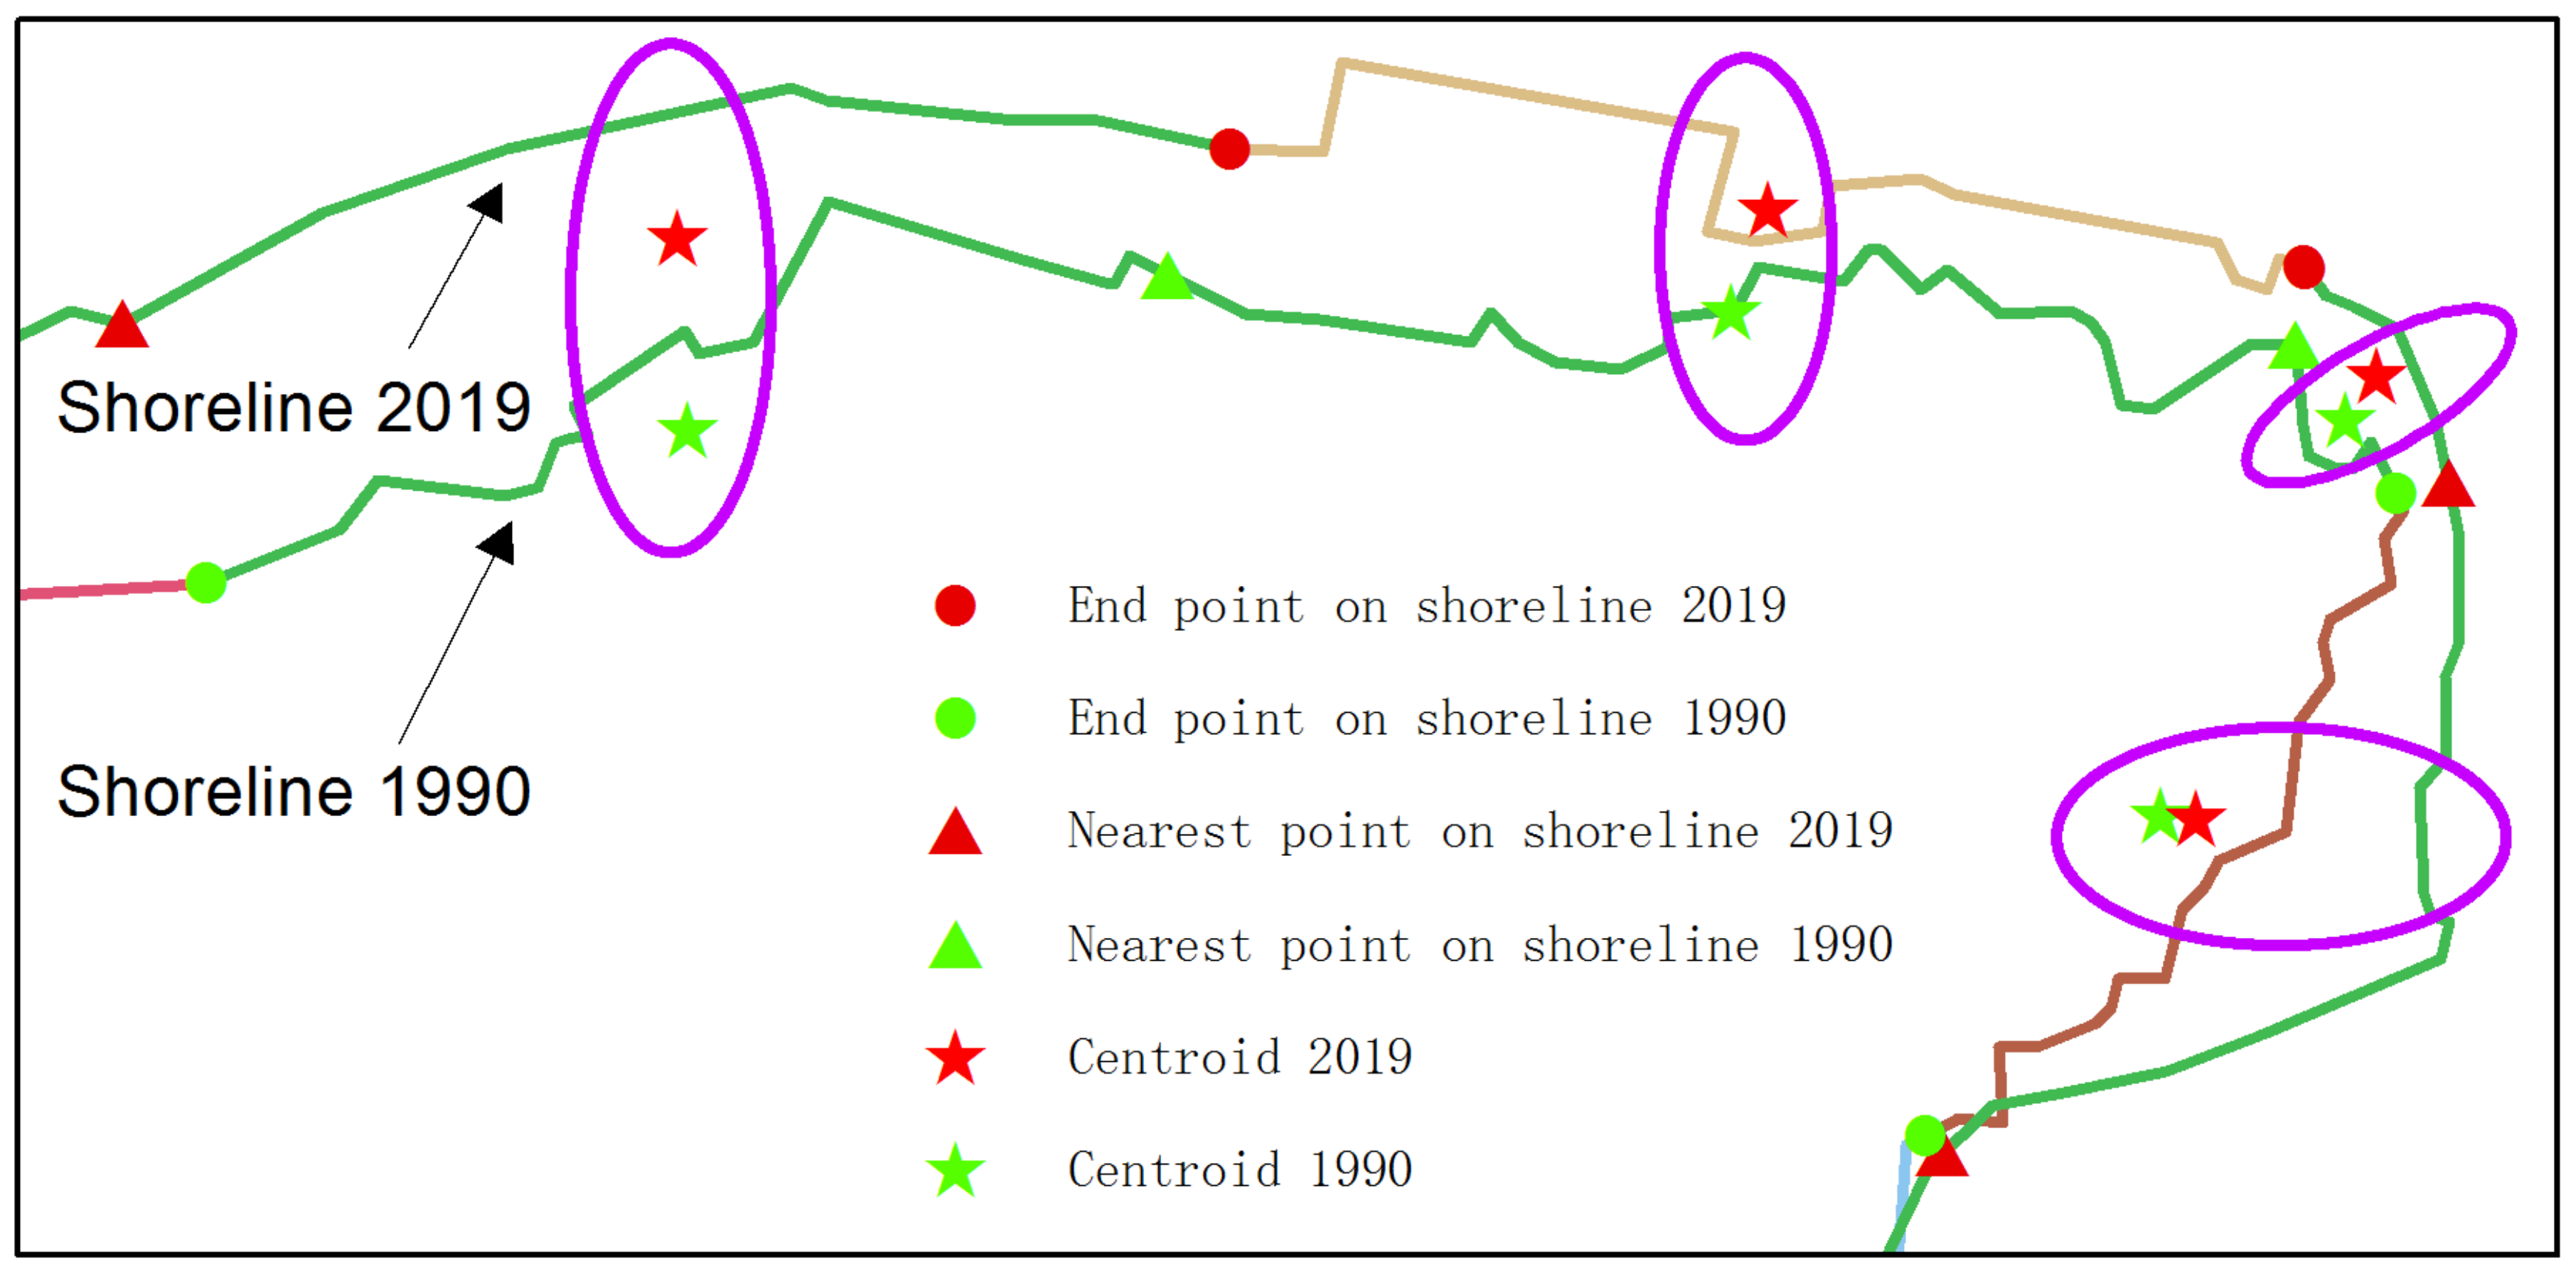
Figure 4.
Shorelines along the coast of mainland China in ~1990 (a) and 2019 (b). The insets show dramatic changes in shorelines in terms of types and locations from ~1990 to 2019.
Figure 4.
Shorelines along the coast of mainland China in ~1990 (a) and 2019 (b). The insets show dramatic changes in shorelines in terms of types and locations from ~1990 to 2019.
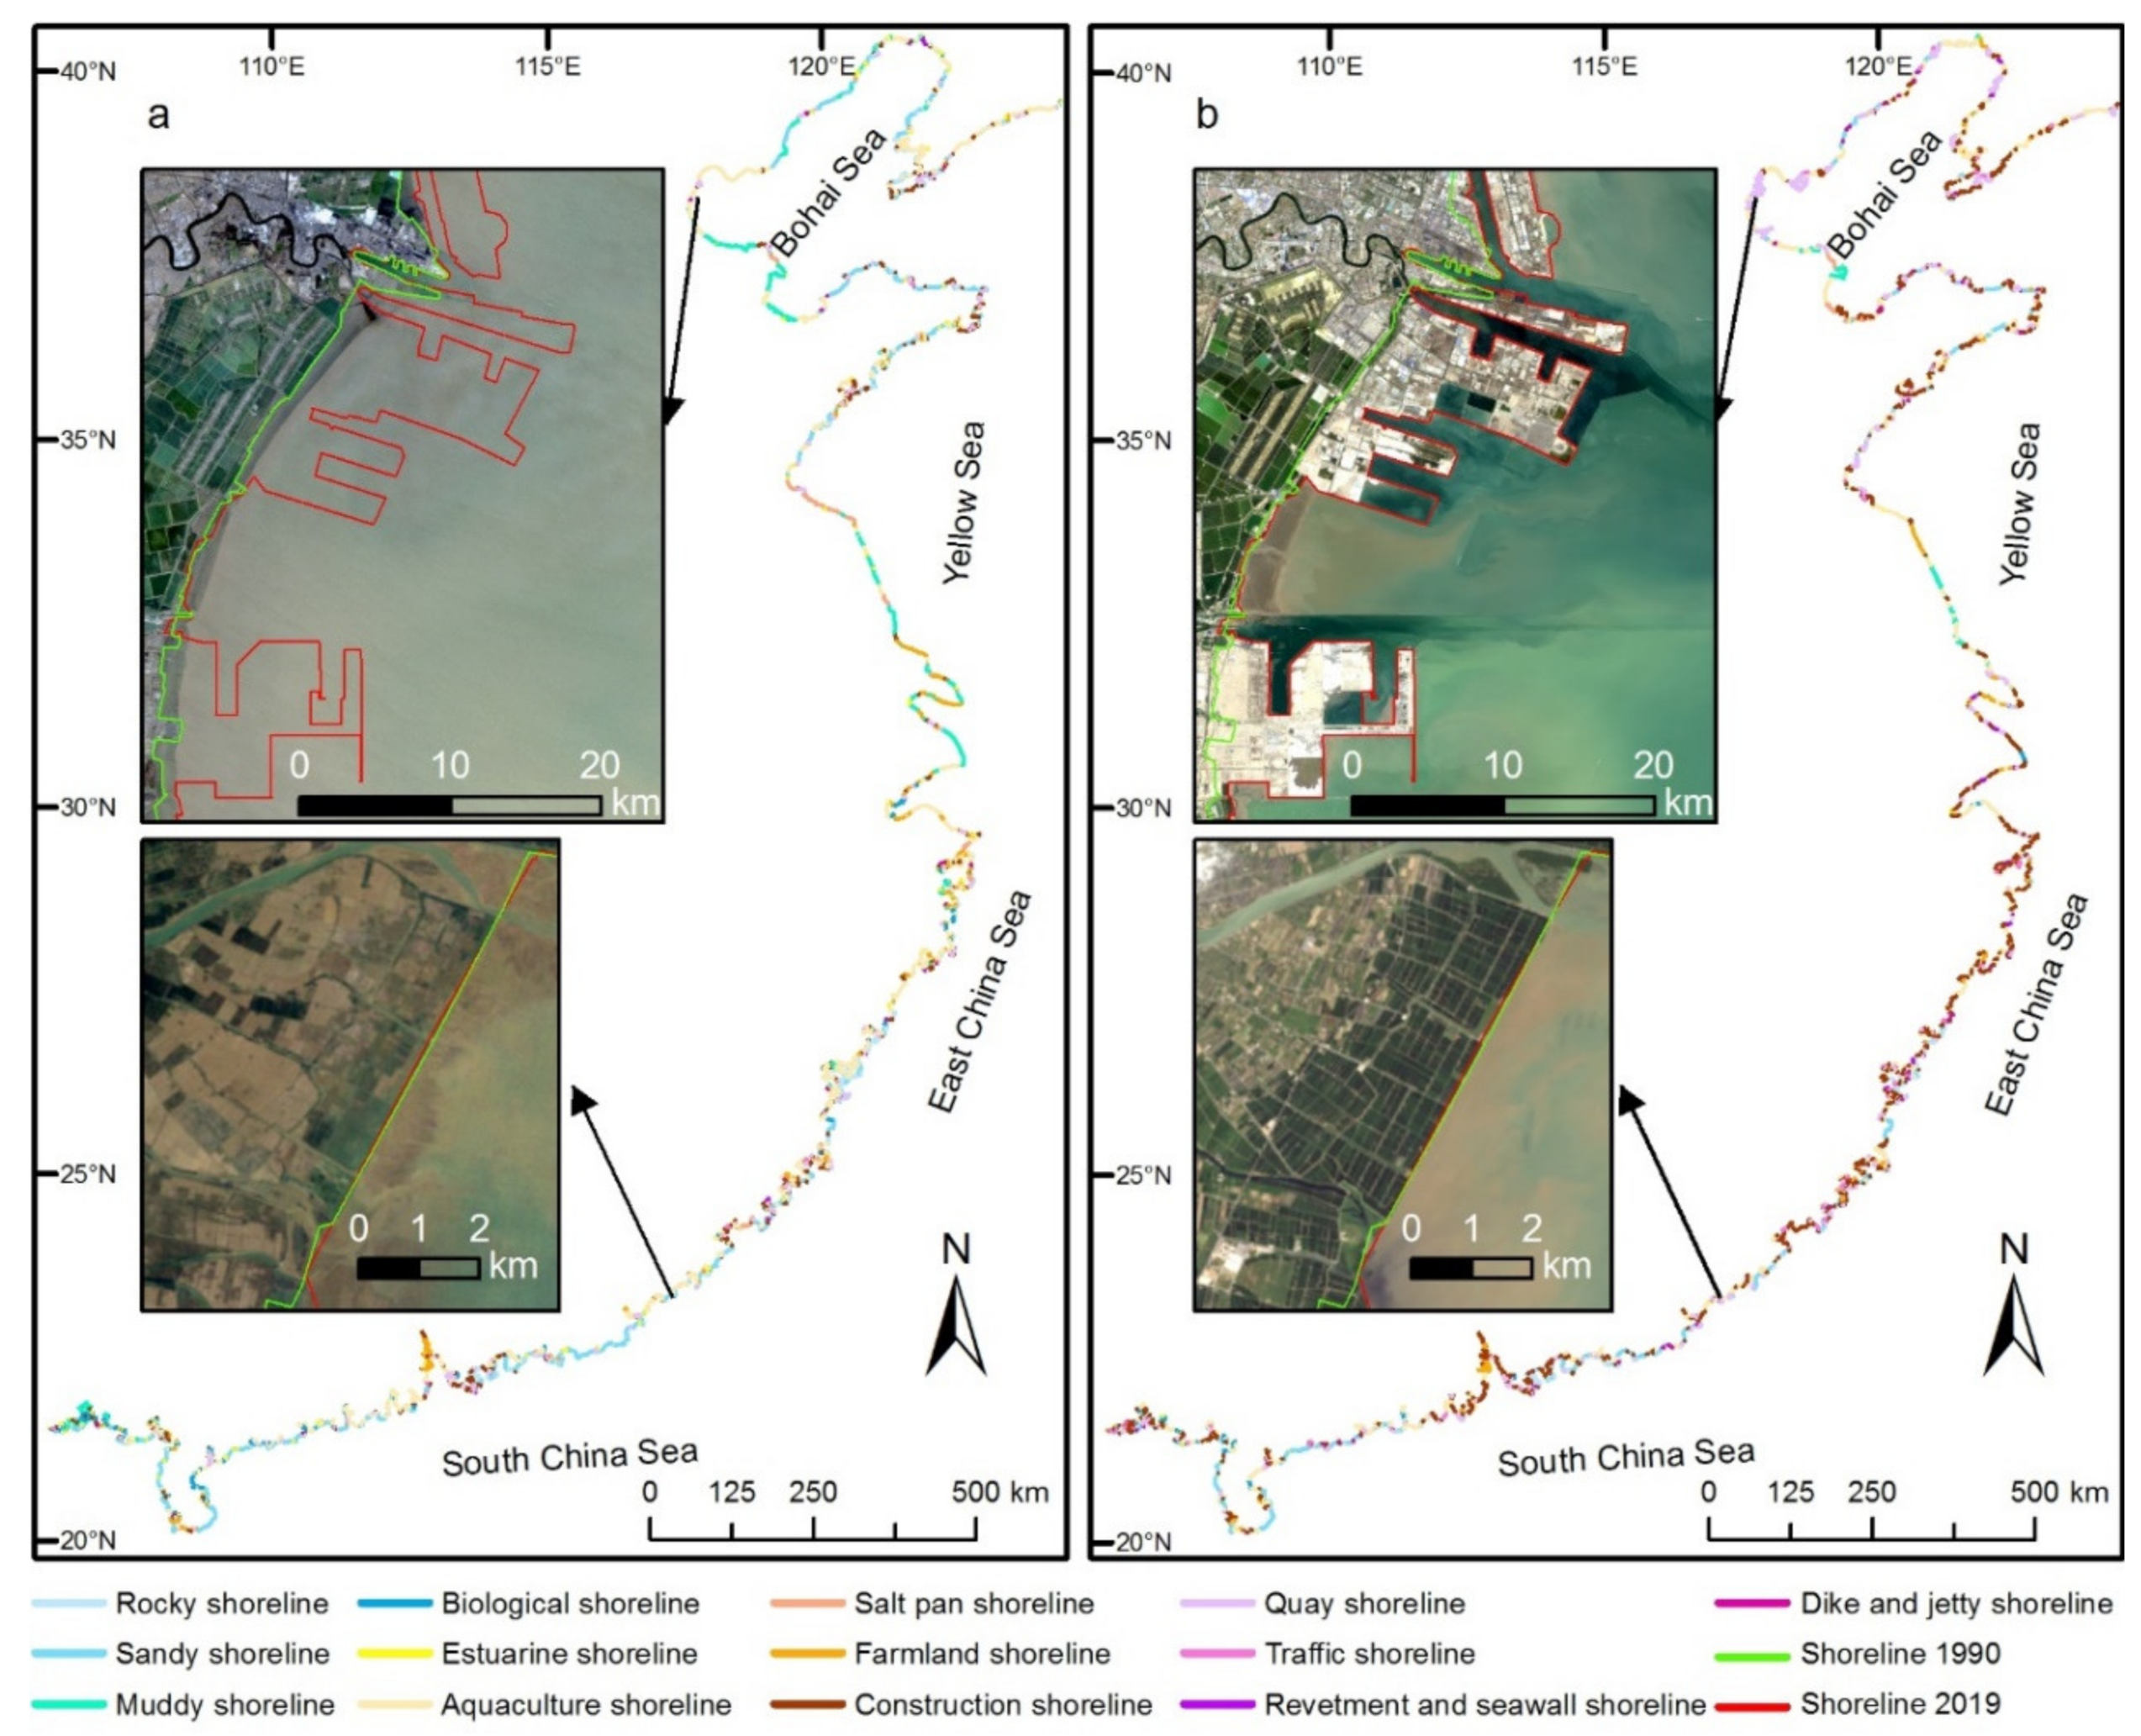
Figure 5.
Relative shoreline length at level Ⅰ (a) and level Ⅱ (b) in ~1990 and 2019. Symbols and full names of types at level Ⅱ are in Table 2. The length of each type is a summary of all the shorelines of the same type. The percentage was calculated by dividing the length of each type by the total length of all types.

Figure 6.
Chord diagram of changes in shoreline length at level Ⅱ from ~1990 to 2019. Each fragment along the circumference of the circle represents a type of shoreline. The length of each fragment is proportional to the length of the corresponding type of shorelines. The thickness of the ends of each arc is proportional to the percentage that has changed. The colors correspond to Figure 4. Symbols and full names of types at level Ⅱ are in Table 2.

Figure 7.
Landsat images for the case study area in 1990 (a), 2000 (b), 2010 (c), and 2019 (d) and shorelines in these four years (e).
Figure 7.
Landsat images for the case study area in 1990 (a), 2000 (b), 2010 (c), and 2019 (d) and shorelines in these four years (e).
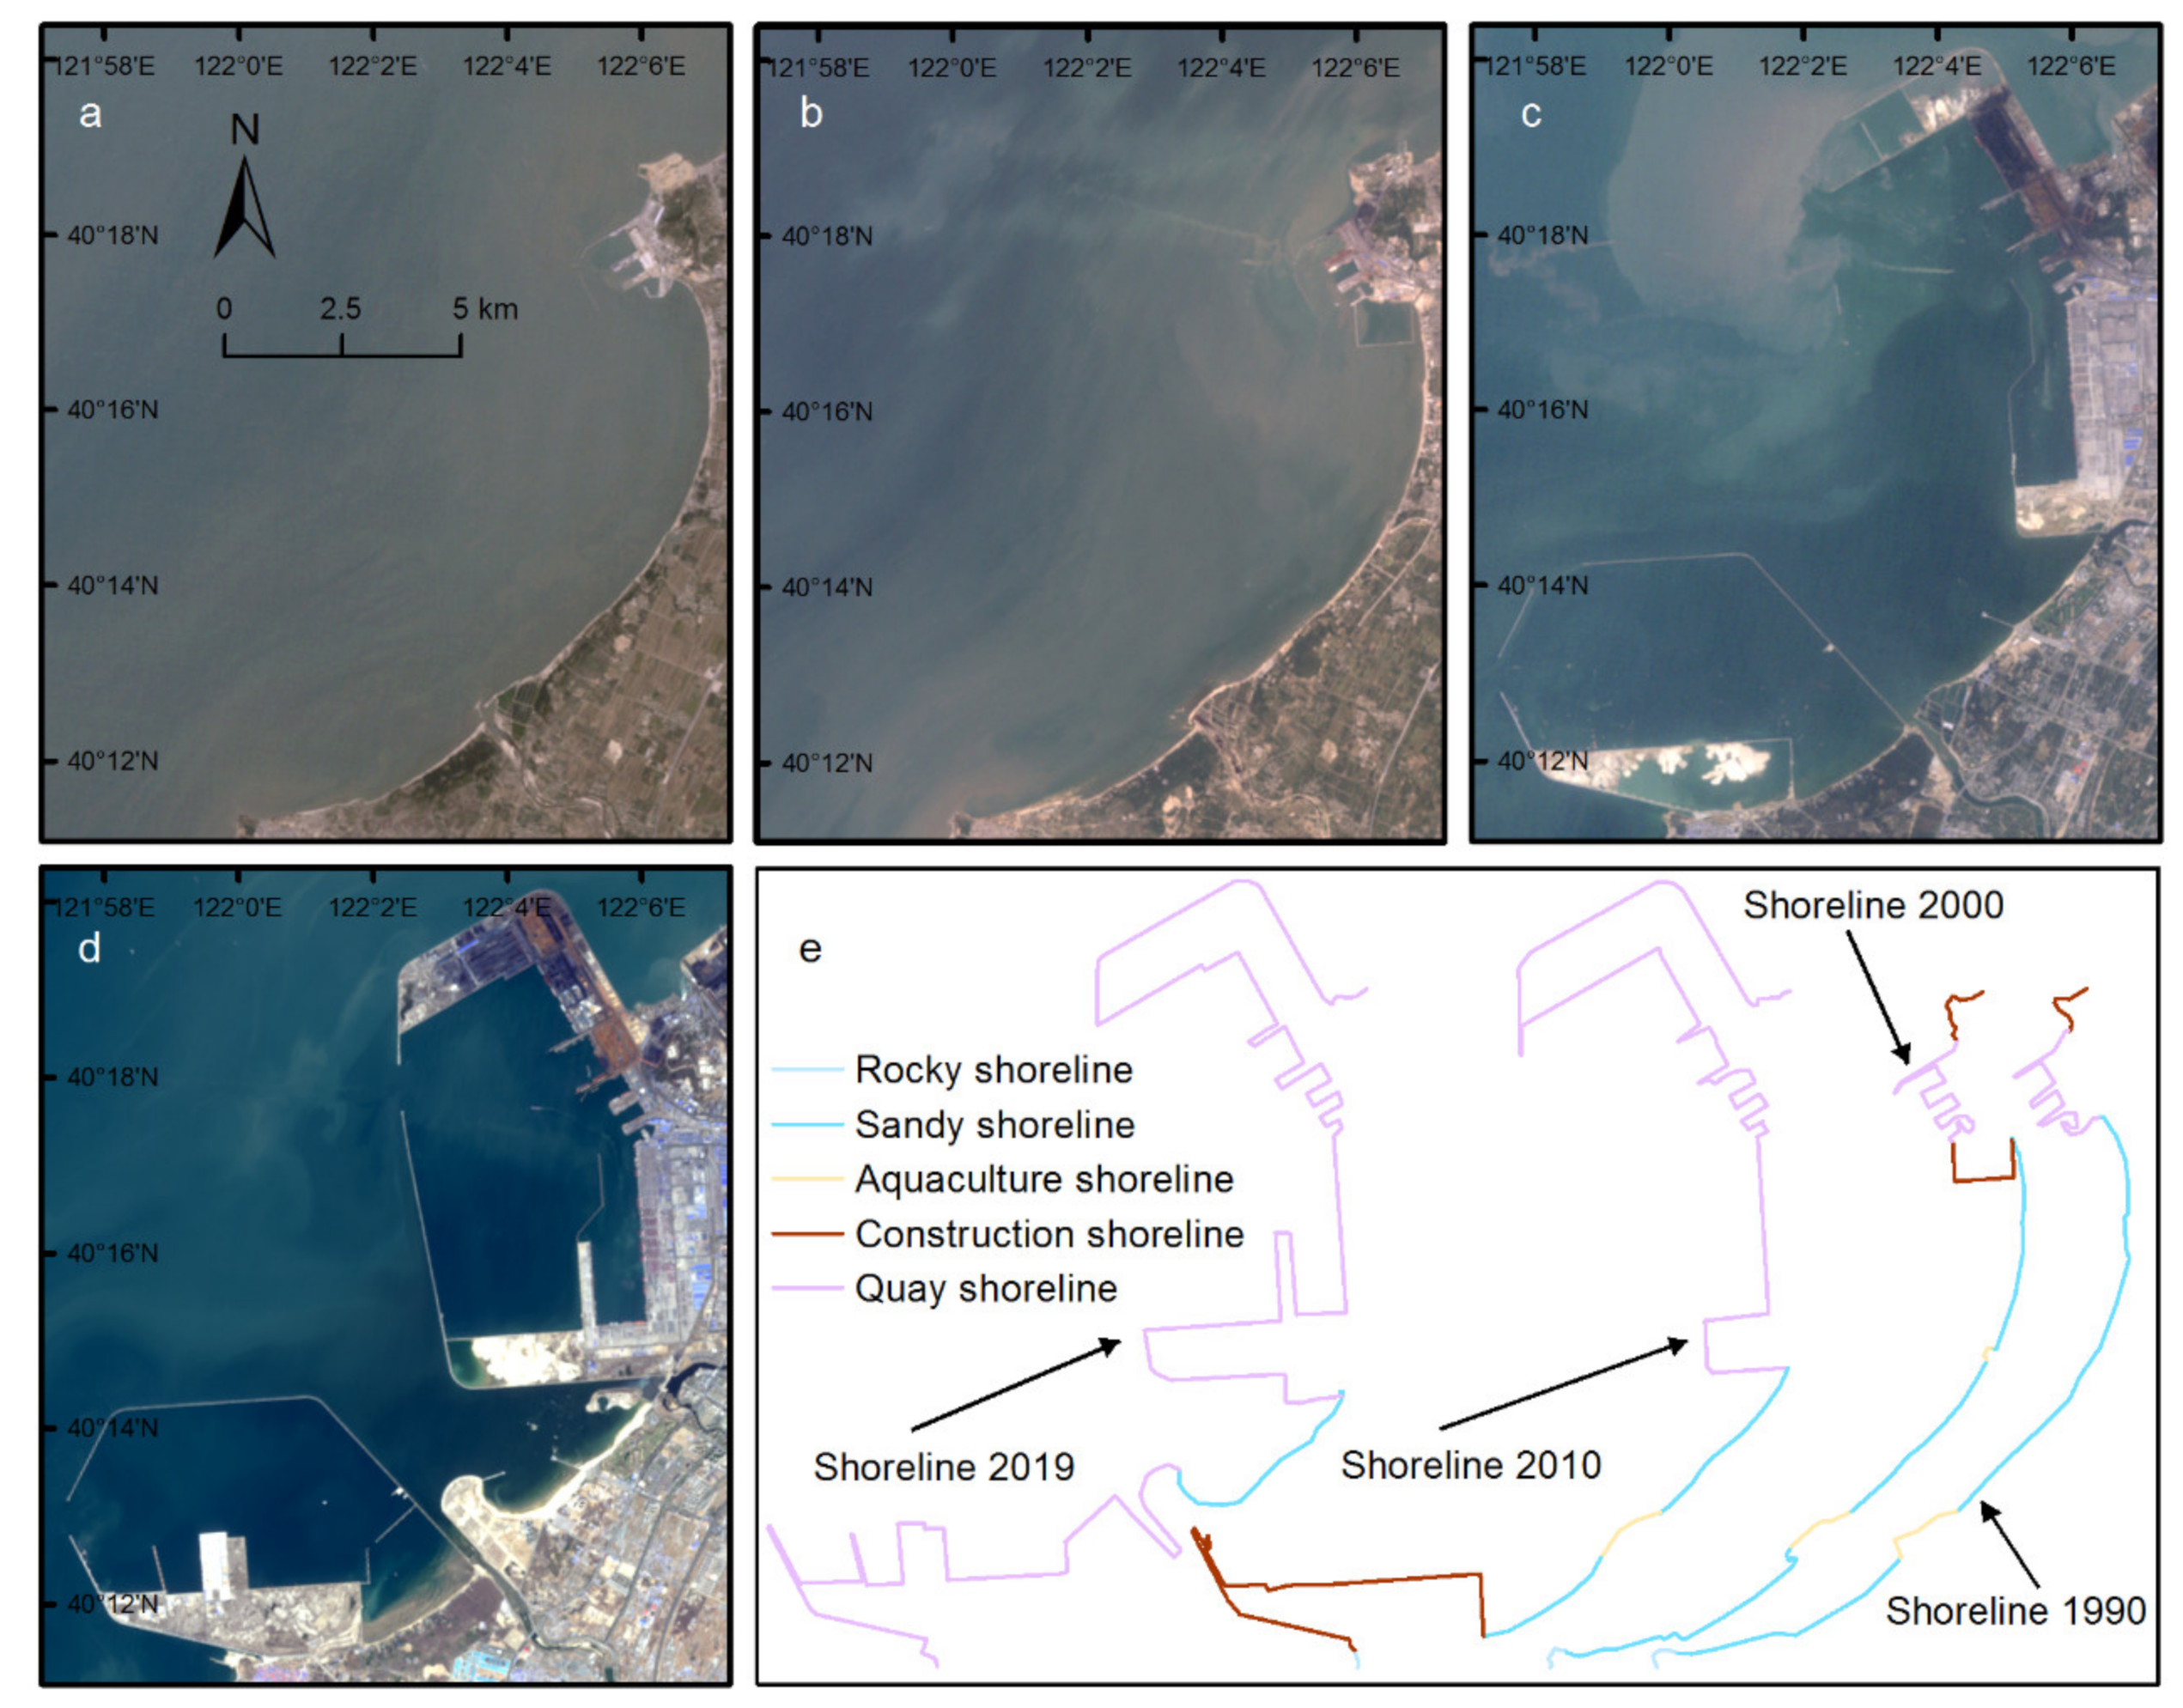
Figure 8.
Schematic diagram of the changing pattern of shorelines driven by economic interests. This figure was generated using data in Table 5 after retaining only values greater than 10%, while the shoreline types were arranged according to their economic value.
Figure 8.
Schematic diagram of the changing pattern of shorelines driven by economic interests. This figure was generated using data in Table 5 after retaining only values greater than 10%, while the shoreline types were arranged according to their economic value.

Table 1.
Landsat scenes used in this study. The path and row numbers of images for the case study are shown in bold.
Table 1.
Landsat scenes used in this study. The path and row numbers of images for the case study are shown in bold.
| Path/Row | Satellite/Sensor | Resolution (m) | Acquisition Date | Path/Row | Satellite/Sensor | Resolution (m) | Acquisition Date |
|---|---|---|---|---|---|---|---|
| 118/032 | Landsat5/TM | 30 | 15 September 1990 | 118/032 | Landsat8/OLI | 30 | 27 June 2019 |
| 118/033 | Landsat5/TM | 30 | 20 October 1991 | 119/032 | Landsat5/TM | 30 | 13 September 2010 |
| 119/032 | Landsat7/ETM+ | 30 | 09 September 2000 | 119/032 | Landsat8/OLI | 30 | 01 May 2019 |
| 119/033 | Landsat5/TM | 30 | 12 November 1991 | 119/033 | Landsat8/OLI | 30 | 21 August 2019 |
| 120/032 | Landsat5/TM | 30 | 13 September 1990 | 120/032 | Landsat8/OLI | 30 | 28 August 2019 |
| 120/033 | Landsat5/TM | 30 | 13 September 1990 | 120/033 | Landsat8/OLI | 30 | 28 August 2019 |
| 121/032 | Landsat5/TM | 30 | 19 August 1990 | 121/032 | Landsat8/OLI | 30 | 31 May 2019 |
| 121/033 | Landsat5/TM | 30 | 15 May 1990 | 121/033 | Landsat8/OLI | 30 | 22 October 2019 |
| 122/033 | Landsat5/TM | 30 | 13 September 1990 | 122/033 | Landsat8/OLI | 30 | 06 May 2019 |
| 121/034 | Landsat5/TM | 30 | 15 May 1991 | 121/034 | Landsat8/OLI | 30 | 19 August 2019 |
| 120/034 | Landsat5/TM | 30 | 13 September 1990 | 120/034 | Landsat8/OLI | 30 | 28 August 2019 |
| 119/034 | Landsat5/TM | 30 | 02 June 1990 | 119/034 | Landsat8/OLI | 30 | 01 May 2019 |
| 119/035 | Landsat5/TM | 30 | 28 December 1991 | 119/035 | Landsat8/OLI | 30 | 08 October 2019 |
| 120/035 | Landsat5/TM | 30 | 15 October 1990 | 120/035 | Landsat8/OLI | 30 | 28 August 2019 |
| 120/036 | Landsat5/TM | 30 | 08 May 1990 | 120/036 | Landsat8/OLI | 30 | 28 August 2019 |
| 119/037 | Landsat5/TM | 30 | 15 April 1990 | 119/037 | Landsat8/OLI | 30 | 21 August 2019 |
| 118/038 | Landsat5/TM | 30 | 04 December 1990 | 118/038 | Landsat8/OLI | 30 | 29 July 2019 |
| 118/039 | Landsat5/TM | 30 | 14 August 1990 | 118/039 | Landsat8/OLI | 30 | 14 August 2019 |
| 118/040 | Landsat5/TM | 30 | 11 June 1990 | 118/040 | Landsat8/OLI | 30 | 14 August 2019 |
| 118/041 | Landsat5/TM | 30 | 13 July 1990 | 118/041 | Landsat8/OLI | 30 | 14 August 2019 |
| 118/042 | Landsat5/TM | 30 | 22 February 1991 | 118/042 | Landsat8/OLI | 30 | 15 September 2019 |
| 119/041 | Landsat5/TM | 30 | 27 October 1991 | 119/041 | Landsat8/OLI | 30 | 30 March 2019 |
| 119/042 | Landsat5/TM | 30 | 30 July 1990 | 119/042 | Landsat8/OLI | 30 | 06 September 2019 |
| 119/043 | Landsat5/TM | 30 | 20 July 1990 | 119/043 | Landsat8/OLI | 30 | 06 September 2019 |
| 119/044 | Landsat5/TM | 30 | 24 August 1991 | 119/044 | Landsat8/OLI | 30 | 22 September 2019 |
| 120/044 | Landsat5/TM | 30 | 04 February 1991 | 120/044 | Landsat8/OLI | 30 | 15 October 2019 |
| 121/044 | Landsat5/TM | 30 | 19 October 1989 | 121/044 | Landsat8/OLI | 30 | 18 July 2019 |
| 121/045 | Landsat5/TM | 30 | 09 October 1991 | 121/045 | Landsat8/OLI | 30 | 20 September 2019 |
| 122/044 | Landsat5/TM | 30 | 13 October 1990 | 122/044 | Landsat8/OLI | 30 | 29 October 2019 |
| 122/045 | Landsat5/TM | 30 | 14 September 1991 | 122/045 | Landsat8/OLI | 30 | 19 March 2019 |
| 123/045 | Landsat5/TM | 30 | 02 September 1990 | 123/045 | Landsat8/OLI | 30 | 08 April 2019 |
| 124/045 | Landsat5/TM | 30 | 11 October 1990 | 124/045 | Landsat8/OLI | 30 | 25 September 2019 |
| 124/046 | Landsat5/TM | 30 | 08 August 1990 | 124/046 | Landsat8/OLI | 30 | 09 September 2019 |
| 125/045 | Landsat5/TM | 30 | 19 September 1991 | 125/045 | Landsat8/OLI | 30 | 15 August 2019 |
Table 2.
Description of the shoreline classification system used in this study.
| Level Ⅰ | Level Ⅱ | Symbol | Description |
|---|---|---|---|
| Natural shoreline | Rocky shoreline | ROC | Composed of gravel or cliffs |
| Sandy shoreline | SAN | Composed of different kinds of sands | |
| Muddy shoreline | MUD | Composed of mud | |
| Biological shoreline | BIO | Composed of mangroves, reeds, etc. | |
| Artificial shoreline | Aquaculture shoreline | AQU | Composed of aquaculture facilities |
| Salt pan shoreline | SAL | Composed of salt pans | |
| Farmland shoreline | FAR | Composed of farmland | |
| Construction shoreline | CON | Composed of build-up area for settlement or factories | |
| Quay shoreline | QUA | Composed of harbors, shipping wharves, etc. | |
| Traffic shoreline | TRA | Composed of embankments for traffic facilities | |
| Revetment and seawall shoreline | REV | Composed of revetments or seawalls | |
| Dike and jetty shoreline | DIK | Composed of dikes or jetties | |
| Estuarine shoreline | Estuarine shoreline | EST | Composed of estuaries |
Table 3.
Shoreline lengths along different seas in ~1990 and 2019.
| Sea | Type at Level Ⅰ | Length (km) in ~1990 | Length (%) in ~1990 | Length (km) in 2019 | Length (%) in 2019 |
|---|---|---|---|---|---|
| Bohai Sea | Natural shoreline | 1202.8 | 56.9 | 537.4 | 18.1 |
| Artificial shoreline | 896.7 | 42.4 | 2423.1 | 81.5 | |
| Estuarine shoreline | 14.6 | 0.7 | 14.3 | 0.5 | |
| Yellow Sea | Natural shoreline | 1425.1 | 52.5 | 788.6 | 25.3 |
| Artificial shoreline | 1272.3 | 46.8 | 2303.9 | 73.9 | |
| Estuarine shoreline | 18.5 | 0.7 | 24.0 | 0.8 | |
| East China Sea | Natural shoreline | 2470.8 | 55.1 | 1596.3 | 39.0 |
| Artificial shoreline | 1975.4 | 44.0 | 2442.1 | 59.7 | |
| Estuarine shoreline | 40.3 | 0.9 | 53.9 | 1.3 | |
| South China Sea | Natural shoreline | 2558.7 | 58.9 | 1816.6 | 41.0 |
| Artificial shoreline | 1744.2 | 40.1 | 2565.1 | 57.9 | |
| Estuarine shoreline | 43.6 | 1.0 | 46.5 | 1.0 |
Table 4.
Transition matrix of shoreline length at level Ⅰ from ~1990 to 2019 (in km(in percent)).
| In 2019 | ||||
|---|---|---|---|---|
| Natural Shoreline | Artificial Shoreline | Estuarine Shoreline | ||
| In ~1990 | Natural shoreline | 4290.2 (51.5%) | 4000.2 (48.0%) | 37.1 (0.4%) |
| Artificial shoreline | 411.7 (6.6%) | 5806.5 (92.6%) | 55.3 (0.9%) | |
| Estuarine shoreline | 18.0 (11.7%) | 66.4 (43.2%) | 69.2 (45.0%) | |
Table 5.
Transition matrix of shoreline length at level Ⅱ from ~1990 to 2019 (in percent). Symbols and full names of types at level Ⅱ are in Table 2.
Table 5.
Transition matrix of shoreline length at level Ⅱ from ~1990 to 2019 (in percent). Symbols and full names of types at level Ⅱ are in Table 2.
| In 2019 | ||||||||||||||
|---|---|---|---|---|---|---|---|---|---|---|---|---|---|---|
| ROC | SAN | MUD | BIO | AQU | SAL | FAR | CON | QUA | TRA | REV | DIK | EST | ||
| In ~1990 | ROC | 54.7 | 6.6 | 0.0 | 0.6 | 11.9 | 0.0 | 0.7 | 15.2 | 6.2 | 1.5 | 1.0 | 0.3 | 1.2 |
| SAN | 2.8 | 57.2 | 0.0 | 1.4 | 16.3 | 0.0 | 0.6 | 13.0 | 6.4 | 1.3 | 0.3 | 0.3 | 0.4 | |
| MUD | 0.3 | 2.3 | 15.4 | 7.5 | 38.3 | 3.5 | 3.8 | 11.0 | 6.1 | 1.3 | 1.9 | 0.2 | 8.6 | |
| BIO | 0.9 | 1.2 | 0.0 | 37.3 | 40.4 | 0.0 | 1.0 | 10.0 | 3.1 | 0.6 | 1.8 | 0.0 | 3.6 | |
| AQU | 0.7 | 1.7 | 0.9 | 3.9 | 61.1 | 1.0 | 1.6 | 15.1 | 6.6 | 2.0 | 1.2 | 0.0 | 4.3 | |
| SAL | 0.5 | 0.0 | 1.5 | 3.9 | 41.9 | 9.5 | 2.7 | 31.1 | 4.5 | 1.9 | 1.5 | 0.0 | 1.1 | |
| FAR | 1.3 | 1.7 | 2.3 | 6.0 | 31.5 | 0.0 | 14.5 | 26.7 | 6.0 | 0.7 | 0.9 | 0.0 | 8.5 | |
| CON | 2.2 | 3.3 | 1.5 | 1.3 | 9.5 | 0.0 | 0.5 | 50.1 | 24.2 | 2.8 | 2.2 | 0.2 | 2.1 | |
| QUA | 0.8 | 1.8 | 0.0 | 0.1 | 1.1 | 0.0 | 0.0 | 11.0 | 82.5 | 0.4 | 1.0 | 0.7 | 0.5 | |
| TRA | 0.0 | 1.8 | 0.0 | 4.1 | 2.2 | 0.0 | 0.0 | 30.6 | 0.0 | 61.3 | 0.0 | 0.0 | 0.0 | |
| REV | 0.3 | 0.0 | 2.3 | 0.0 | 0.0 | 0.0 | 58.1 | 2.0 | 0.0 | 4.2 | 5.1 | 0.0 | 28.1 | |
| DIK | 0.0 | 5.4 | 0.0 | 0.0 | 17.8 | 0.0 | 0.0 | 25.8 | 25.1 | 0.0 | 0.0 | 23.9 | 1.9 | |
| EST | 0.1 | 3.4 | 1.7 | 1.5 | 12.7 | 1.1 | 0.0 | 9.1 | 1.6 | 0.0 | 0.0 | 0.2 | 68.6 | |
Table 6.
Transition matrix of shoreline length at level Ⅰ for different seas from ~1990 to 2019 (in km).
Table 6.
Transition matrix of shoreline length at level Ⅰ for different seas from ~1990 to 2019 (in km).
| In 2019 | |||||
|---|---|---|---|---|---|
| Natural Shoreline | Artificial Shoreline | Estuarine Shoreline | |||
| In ~1990 | Bohai Sea | Natural shoreline | 459.6 | 728.1 | 15.2 |
| Artificial shoreline | 27.1 | 859.9 | 9.8 | ||
| Estuarine shoreline | 2.2 | 6.2 | 6.2 | ||
| Yellow Sea | Natural shoreline | 687.2 | 720.7 | 17.2 | |
| Artificial shoreline | 90.2 | 1172.6 | 9.5 | ||
| Estuarine shoreline | 0.0 | 1.5 | 16.9 | ||
| East China Sea | Natural shoreline | 1443.7 | 961.4 | 65.7 | |
| Artificial shoreline | 145.5 | 1667.2 | 162.8 | ||
| Estuarine shoreline | 0.5 | 11.1 | 28.7 | ||
| South China Sea | Natural shoreline | 1658.2 | 845.8 | 54.7 | |
| Artificial shoreline | 179.6 | 1495.9 | 68.7 | ||
| Estuarine shoreline | 5.2 | 10.0 | 28.4 |
Publisher’s Note: MDPI stays neutral with regard to jurisdictional claims in published maps and institutional affiliations. |
© 2020 by the authors. Licensee MDPI, Basel, Switzerland. This article is an open access article distributed under the terms and conditions of the Creative Commons Attribution (CC BY) license (http://creativecommons.org/licenses/by/4.0/).
Share and Cite
MDPI and ACS Style
Tian, H.; Xu, K.; Goes, J.I.; Liu, Q.; Gomes, H.d.R.; Yang, M. Shoreline Changes Along the Coast of Mainland China—Time to Pause and Reflect? ISPRS Int. J. Geo-Inf. 2020, 9, 572. https://doi.org/10.3390/ijgi9100572
AMA Style
Tian H, Xu K, Goes JI, Liu Q, Gomes HdR, Yang M. Shoreline Changes Along the Coast of Mainland China—Time to Pause and Reflect? ISPRS International Journal of Geo-Information. 2020; 9(10):572. https://doi.org/10.3390/ijgi9100572
Chicago/Turabian StyleTian, Hongzhen, Kai Xu, Joaquim I. Goes, Qinping Liu, Helga do Rosario Gomes, and Mengmeng Yang. 2020. "Shoreline Changes Along the Coast of Mainland China—Time to Pause and Reflect?" ISPRS International Journal of Geo-Information 9, no. 10: 572. https://doi.org/10.3390/ijgi9100572
Note that from the first issue of 2016, this journal uses article numbers instead of page numbers. See further details here.