1. Introduction
Geographic information processing is closely integrated with the user-specific geographic information system (GIS) business process. It includes two elements: spatial data and processing algorithms [
1]. The relationship between these elements is formed through input, output, processing and processed. The GIS business process is complex and diverse, and the parameters of the processing algorithm are varied [
2]. The construction of the process must consider various processing parameters and conditional dependencies between the algorithms, among other elements, which complicate the construction of the geographic information processing method [
3].
In the development of traditional GIS business systems, a certain geographic information processing module must be developed for a specific application, and the implementation of the related software is complicated. To modify a business process or add a new business process, a new program, with a long development cycle, that can make use of the existing geographic information processing module must often be developed [
4]. In order to adapt to the needs of the big data era, a cloud-based GIS is needed. The business process of a cloud GIS is more complicated, and the scalability of its business process is more important than with a traditional GIS [
5,
6].
Many scholars have carried out useful explorations on the problem of business process expansion in GIS systems. Some researchers have studied how to use workflow technology to combine algorithm functions in existing GIS software to solve complex problems in environmental research [
7,
8,
9]. Some have studied how to combine geographic information services on the internet to obtain more powerful geographic information services [
10,
11,
12]. However, these methods do not adequately address business process extensions in a cloud GIS environment. At the same time, most GIS platform software vendors have realized the importance of business process expansion problems and gradually added business expansion functions to new versions of their software, allowing users to conveniently customize their business processes; however, these functions are not perfect [
13,
14]. For example, the desktop products of MapGIS and ArcGIS can use existing modules to build business processes, but they need to use existing algorithms in their platforms, and it is not easy to add new algorithms to them [
15]. SuperMap GIS 8C, released by SuperMap, provides custom plug-in functions, but the dependence of these plug-ins on the platform is strong, and business processes cannot be arbitrarily formed [
16,
17]. In addition, in some research on distributed geospatial model services based on open interoperability standards, the standard release of spatial data and computational models is usually the core, and the data is closely integrated with the model, while the interface is standardized. Participation puts further constraints on the release of the model [
18,
19,
20]. Overall, cloud GIS business process extensions have significant deficiencies in versatility and flexibility.
This paper proposes an on-demand and extended model for the GIS data processing procedure that starts from the essence of GIS business processes. The model considers the three-way separation of algorithm development, business processes, and the operational interface. With this model, we can implement on-demand expansions by process modeling the business, and task scheduling the workflow engine. This can expand the scope and improve the efficiency of constructing business systems. The rest of this paper is organized as follows. First, we introduce the mechanism of the proposed model in
Section 2. Then, in
Section 3, the modeling of the geographic information processing is discussed, and we include the definitions of functional modules and business process, and the modeling of business processes. The geographic information processing execution engine is discussed in
Section 4. In
Section 5, we give the experimental results and discussion. In
Section 6, we conclude the research and make suggestions for future improvement.
2. The On-Demand Extended Model for GIS Data Processing
Various GIS business systems are essentially combinations of geographic information and a series of processing algorithms with a specific order. The basic algorithm, data management process, visualization technique, and operational interface they use are common to all GIS. The same algorithms and data can be applied to different systems [
21]. Therefore, as long as the algorithm combination problem, business parameter input, and task scheduling are solved, the establishment and execution of new business processes can be completed quickly, the coupling degree of the geographic information service platform and the business system is improved, and the difficulty of developing a GIS business system is reduced [
22]. In general, through the expansion of business processes, platform software meets the objective requirements and has the technical feasibility for multi-industry applications.
The cloud-based geological information service model proposed in this study inherits general cloud computing features. All spatial data and programs run on the cloud computing center, and users from different regions and levels access the model through simple terminals. Starting with the introduction of the functions and the objects of its components, we first analyze the composition of each role in the model, and then we discuss the data flow and the service process of this framework.
In light of the lack of flexibility of the geographic information processing method, this paper builds an on-demand geographic information business processing approach extension model (EMBP) based on the cloud service framework through the extension of the algorithm processing layer, the process management and task scheduling layer, the access layer, and the interface layer. The on-demand extended model for GIS Data Processing enables the on-demand scaling of geographic information service processes.
The EMBP adopts workflow-based task execution and process management solutions. The processing algorithms involved in each step of the flow are designed as relatively independent software modules that are combined as required by workflow tools. The data processing improves the scalability of spatial data processing services at the business process level.
With this model, developers and operators can use process modeling tools to design data analysis processes for various industry applications by combining different spatial analysis algorithms and loading and execution processes to obtain the required industry application results.
This processing method realizes the three-way separation of algorithm development, business process, and operation interface so that developers need only concentrate on researching basic algorithms and developing algorithm programs according to the outlined specifications, without developing common artificial interaction interfaces or considering the industry specific business processes. This method enables business managers to extend new business functions through modifying the flow of the algorithms by simply dragging and dropping operations (without modifying the system itself).
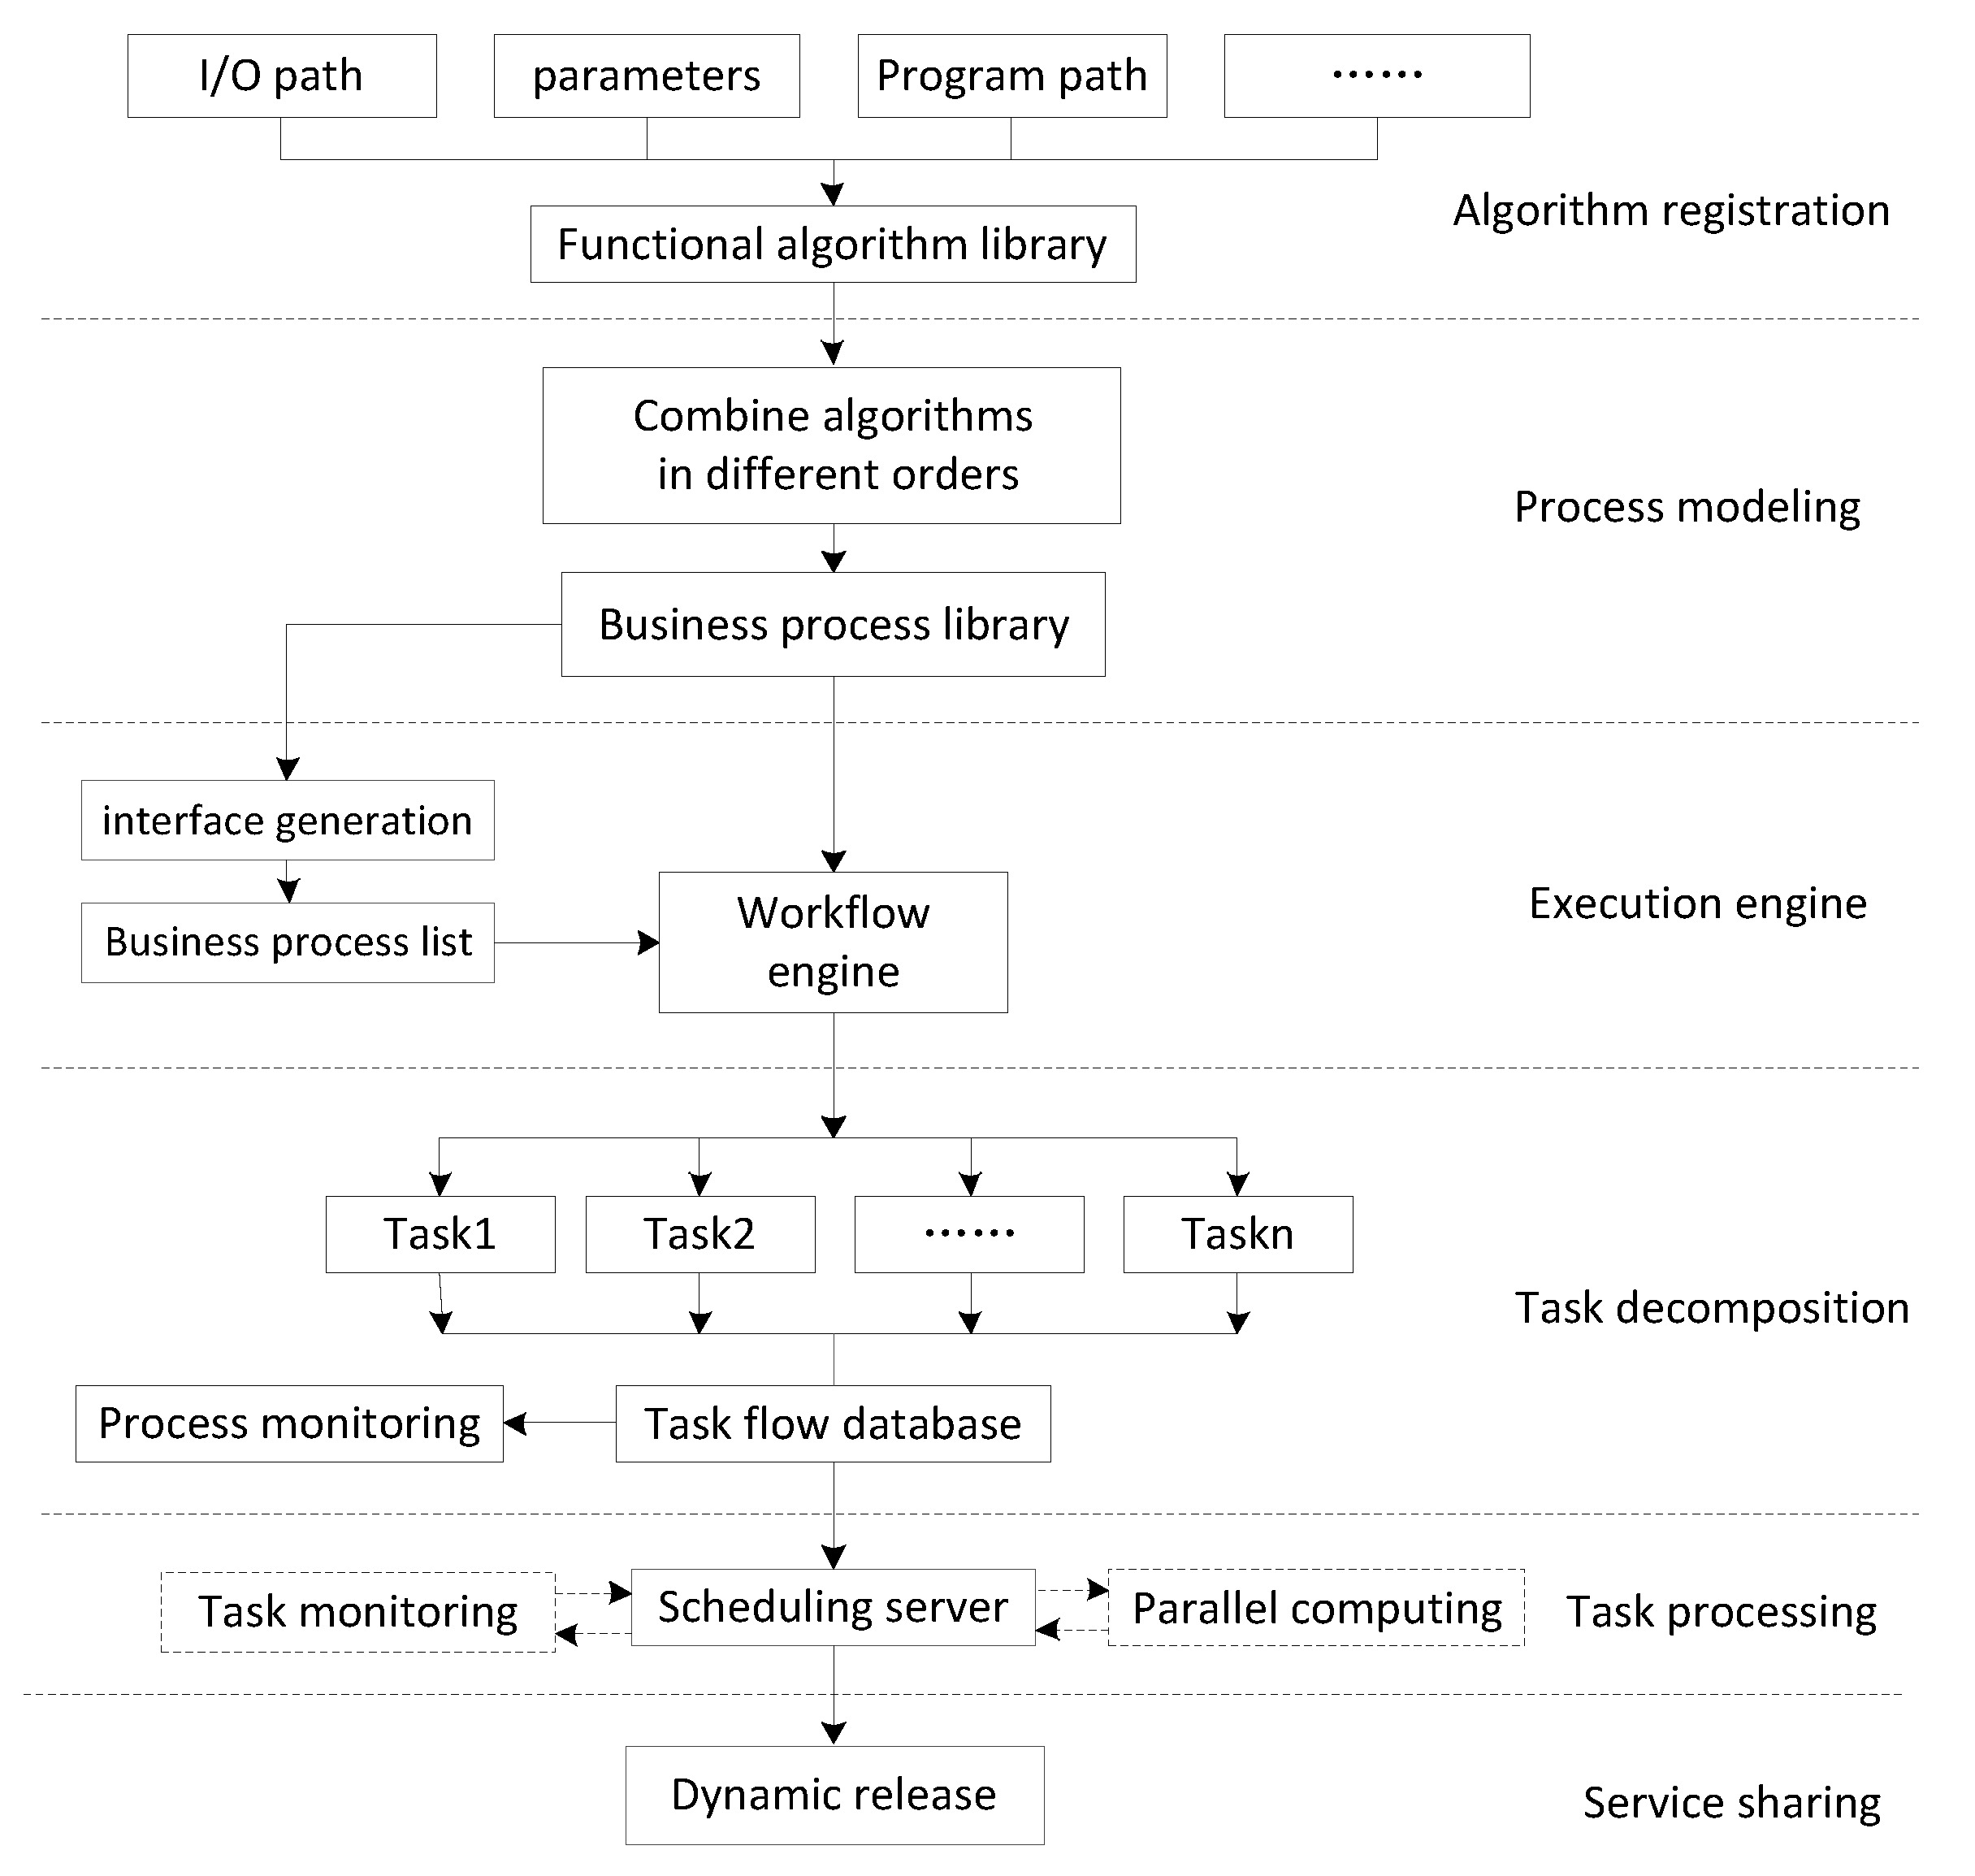
The operating mechanism of the on-demand extension model for spatial data processing flows based on the cloud service framework is shown in
Figure 1. The on-demand geographic information processing expansion model involves features including algorithm registration, process modeling, an on-demand interface, a workflow engine, process monitoring, large-scale task scheduling, and task processing. The interaction between the different links is realized through a web service. In this way, algorithm development, business processes, and the operation interface are separated in the on-demand expansion of the geographic information service process, and the parallel geographic information processing is flexibly expanded.
3. Geographic Information Processing Modeling
The key stages of geographic information processing modeling are algorithm registration, algorithm combination, submission to the server for storage, generation of the parameter interface, submission of tasks to the workflow engine, task decomposition, and task processing [
23]. The following sections provide a detailed introduction to the modeling process.
3.1. Functional Modules and Business Process Definitions
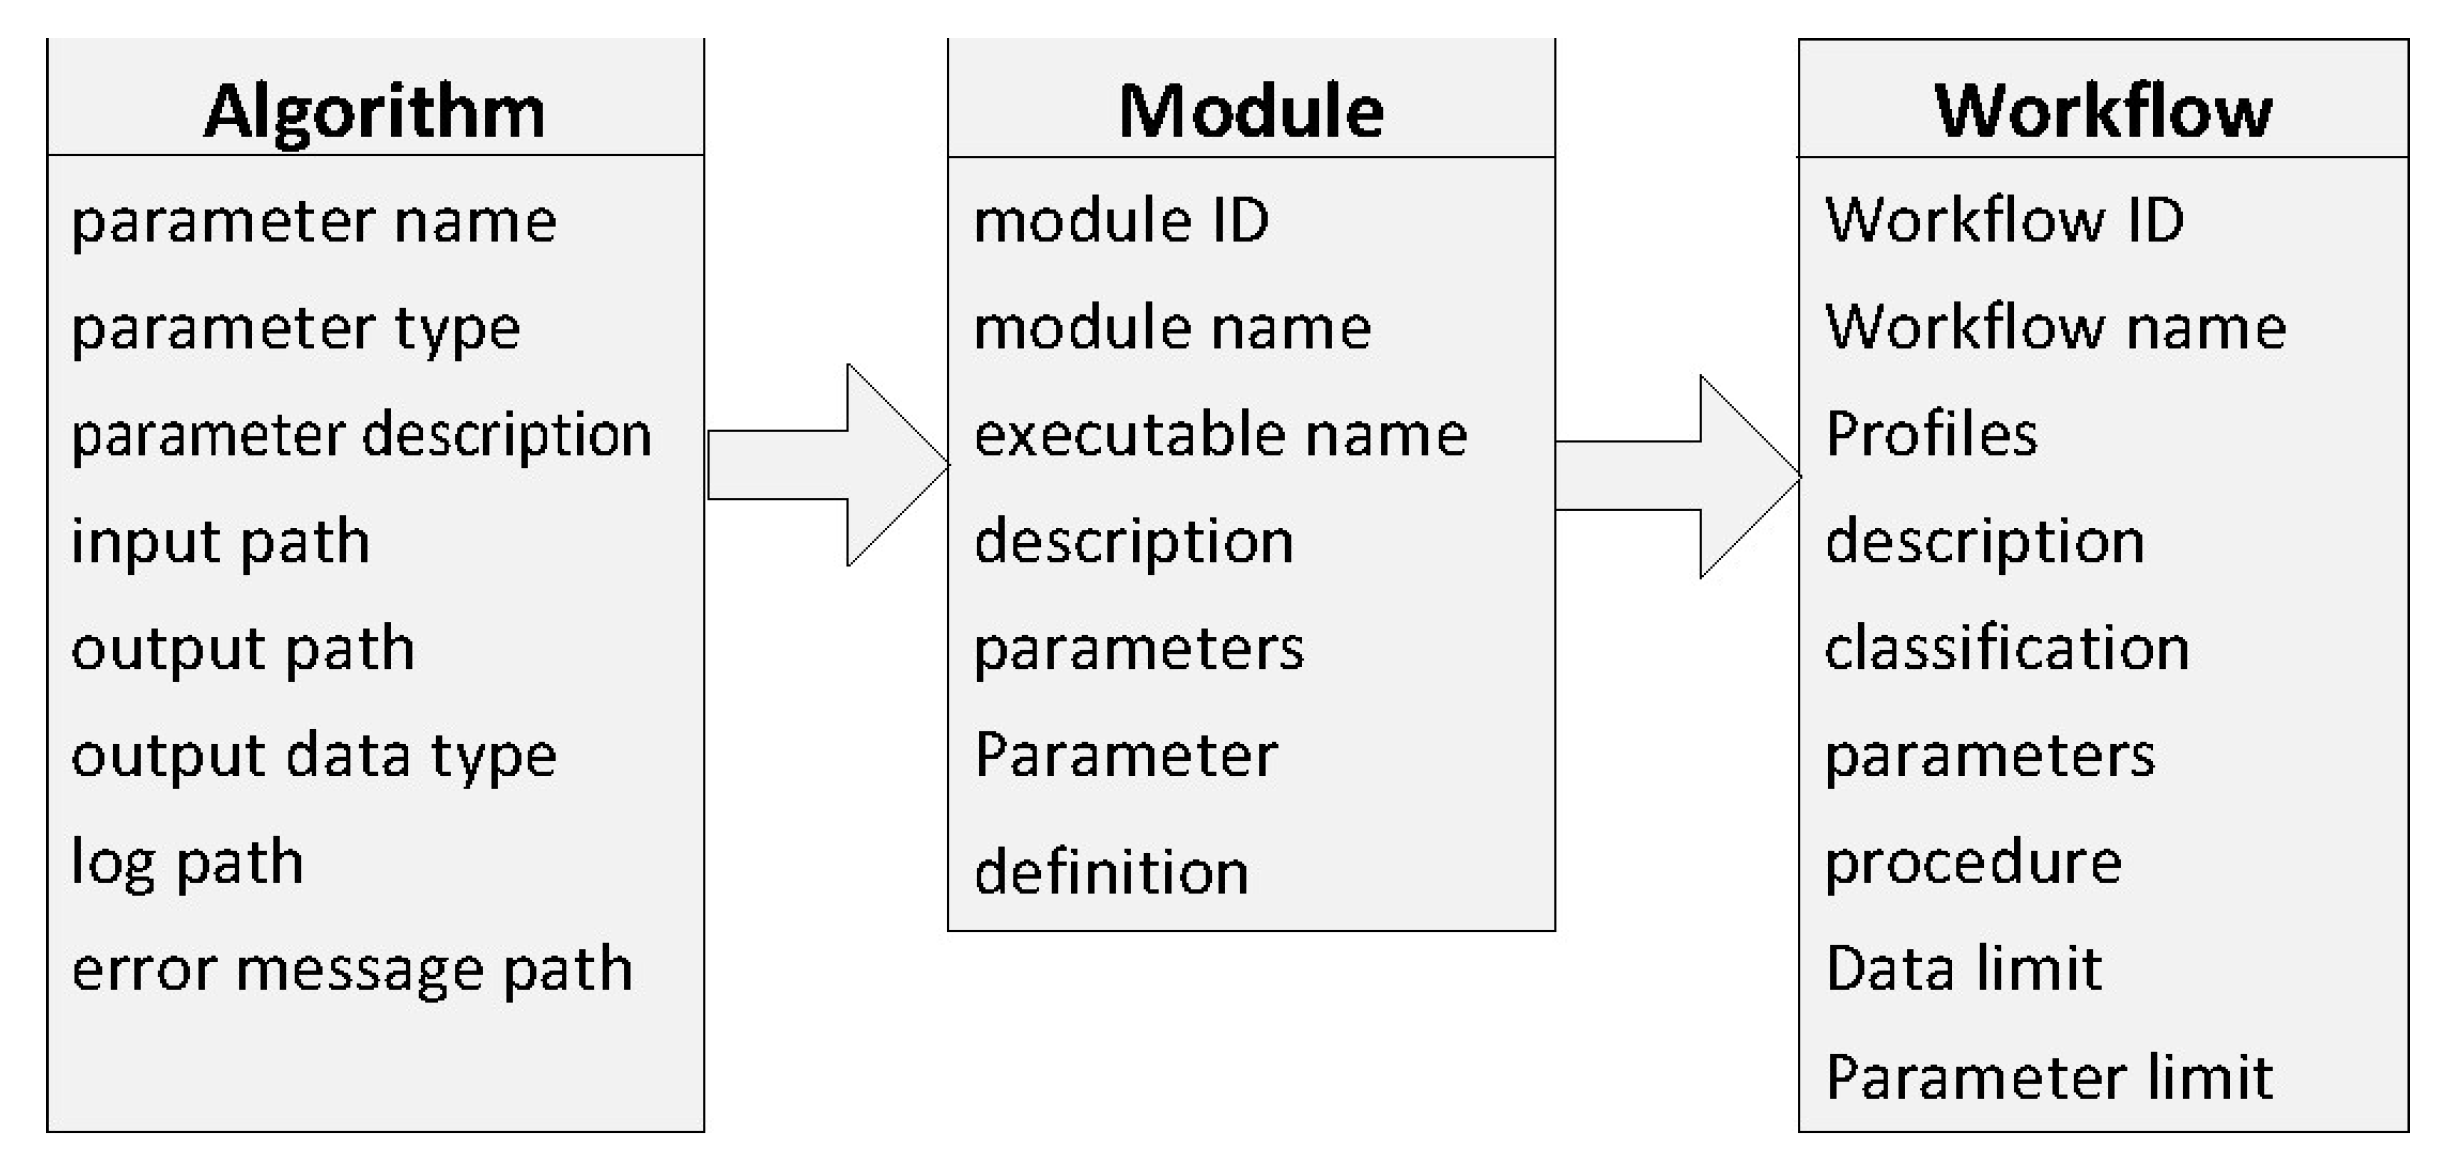
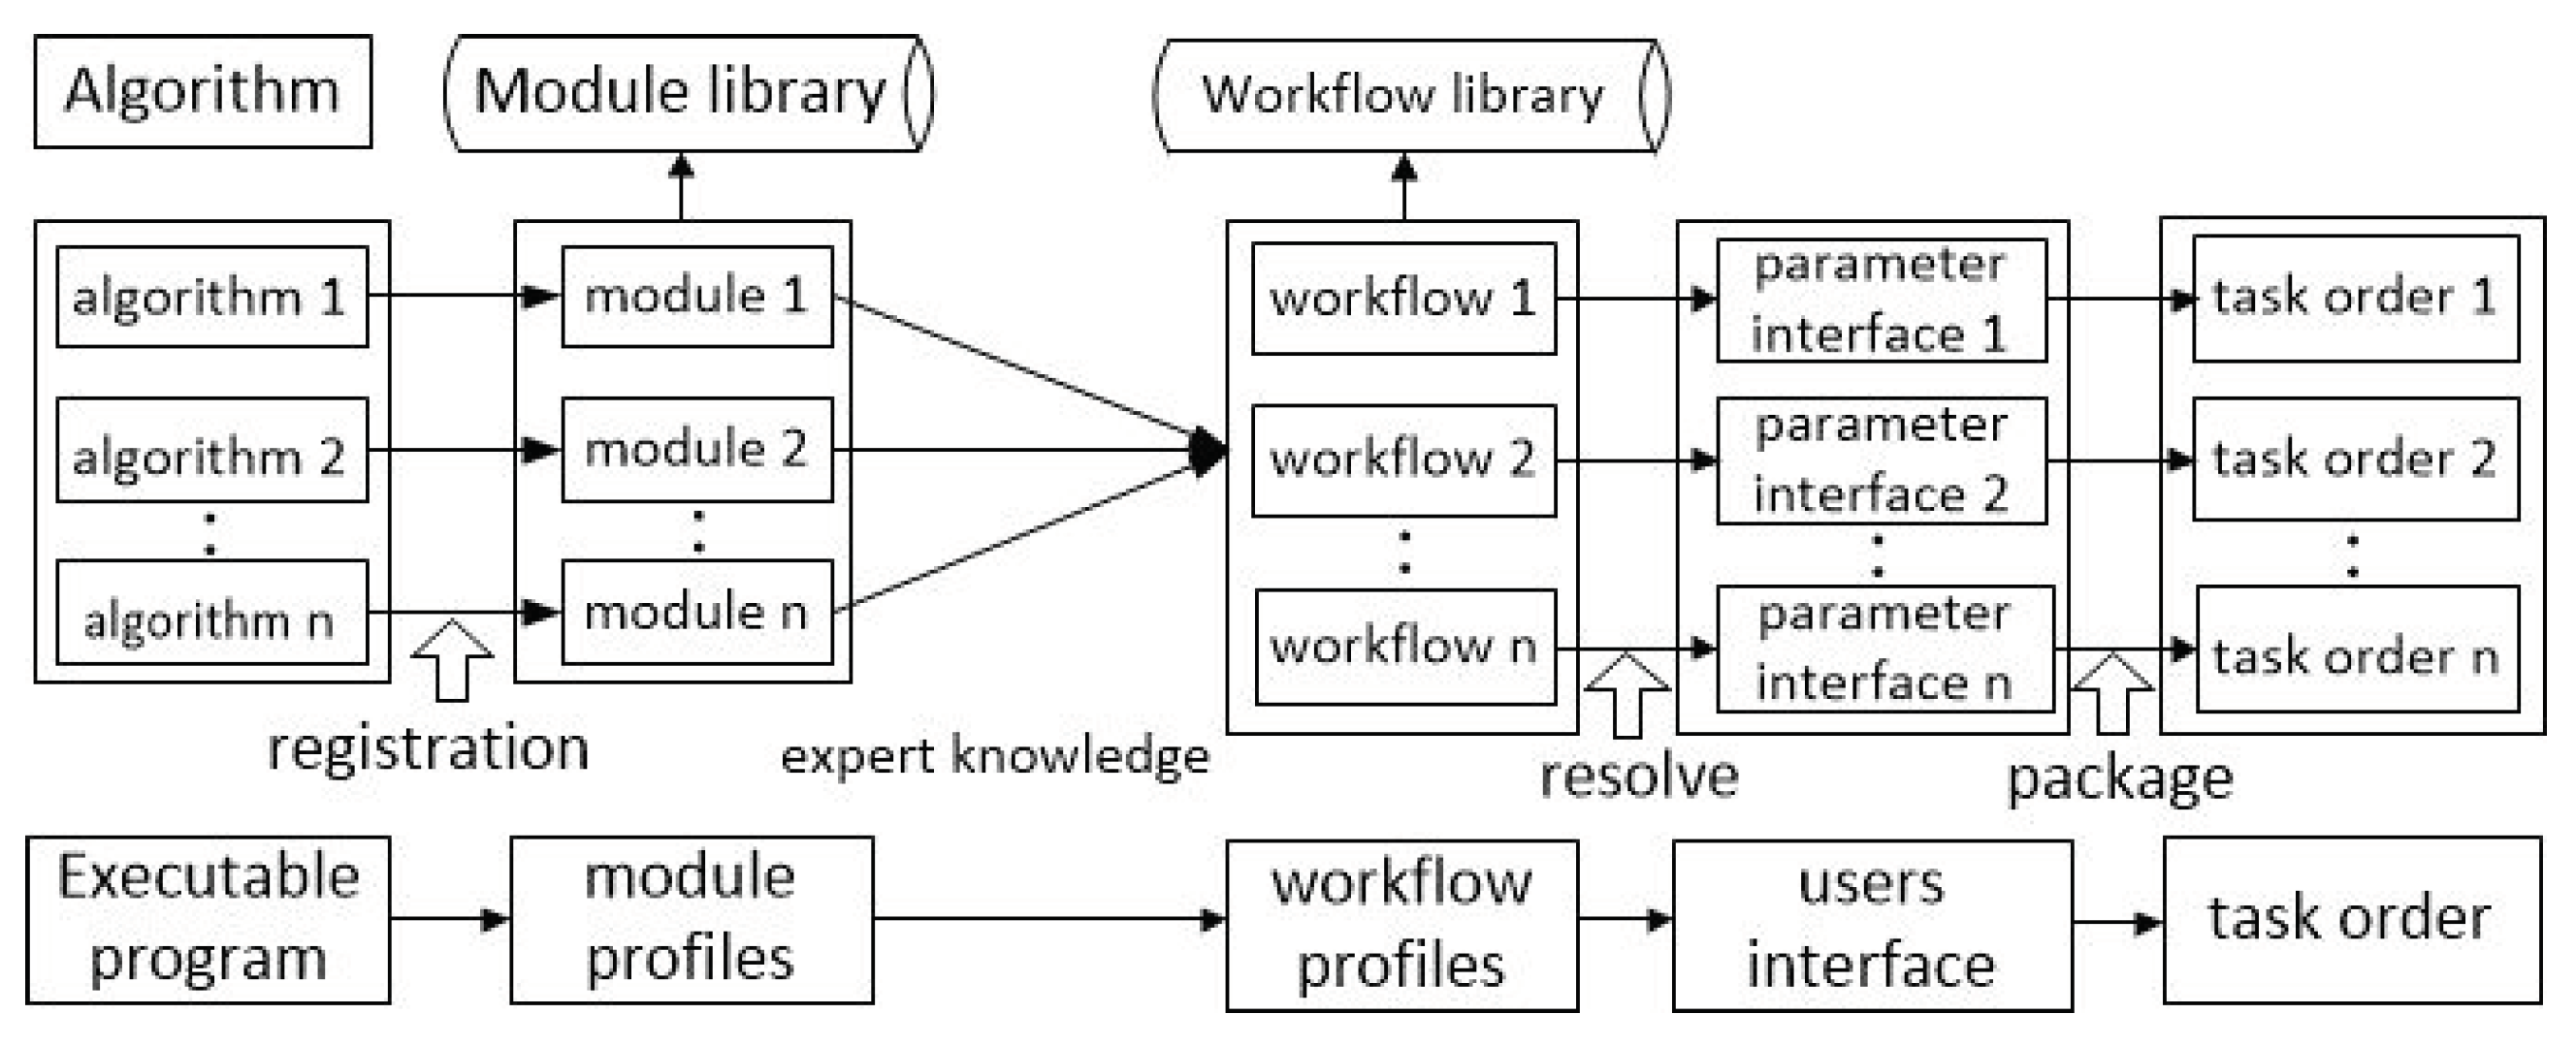
At the beginning of the modeling process, the algorithm parameters, function module descriptions, and business process descriptions are defined (as shown in
Figure 2).
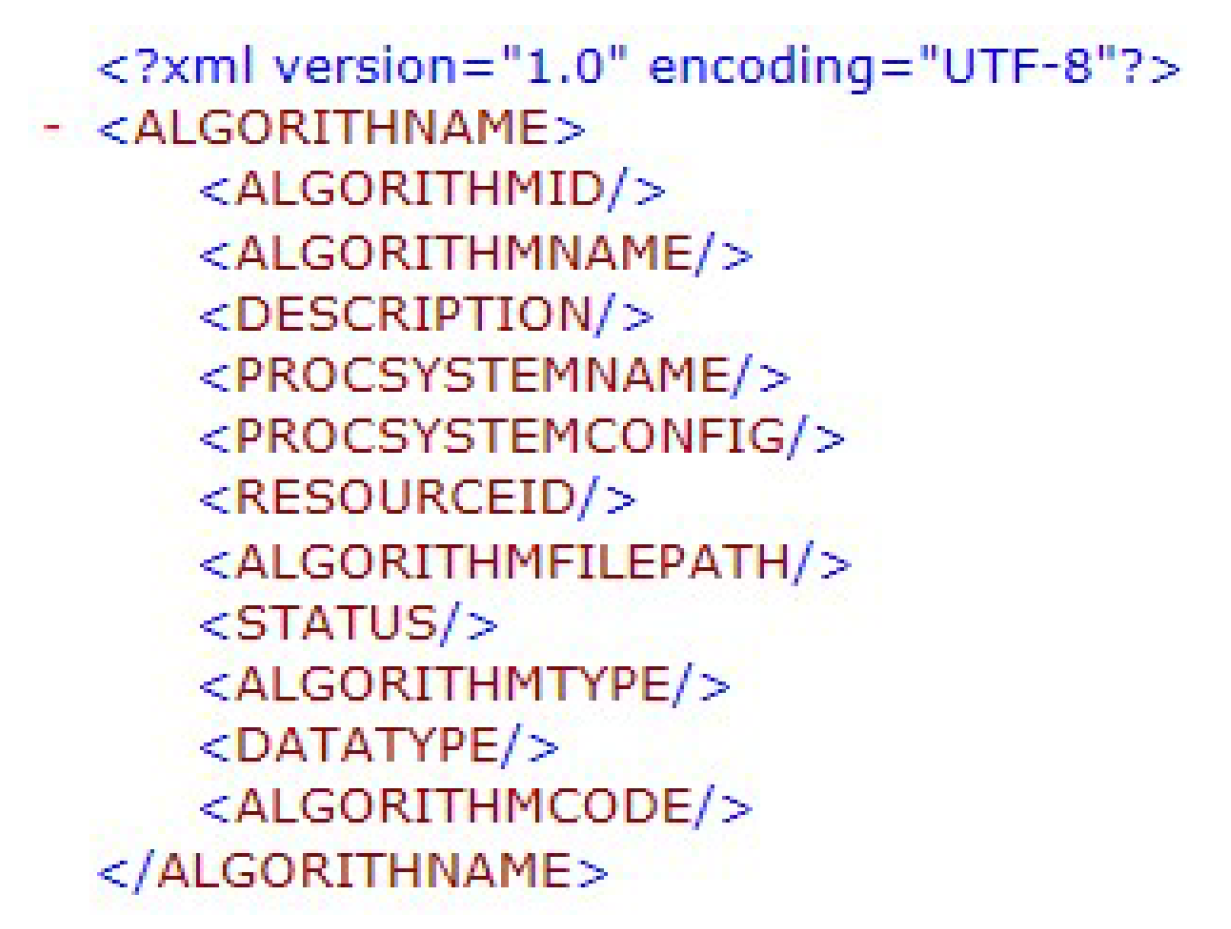
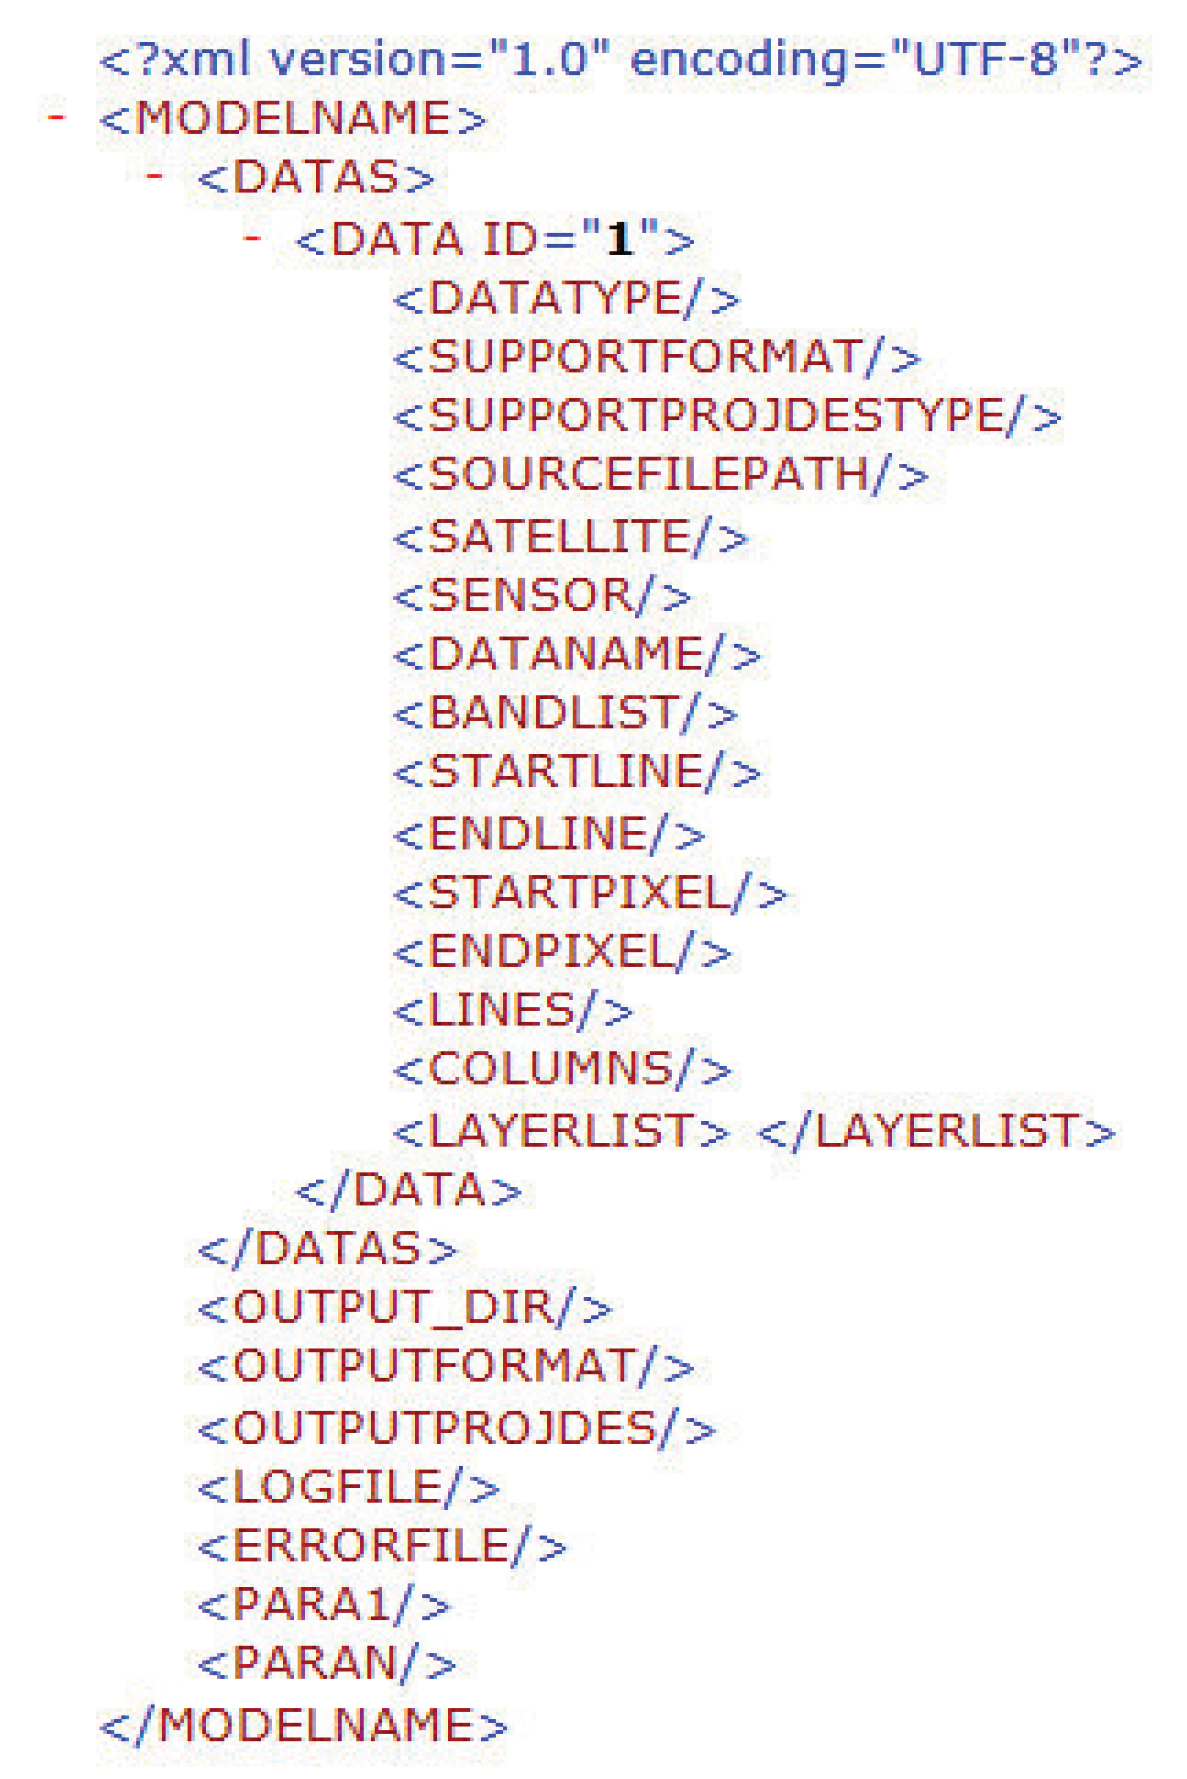
Figure 2 illustrates the process of workflow modeling, including the definition of algorithms, modules and workflows, the relationship between these three elements, how the algorithm forms the module, and how the module constitutes the workflow.The geographic information processing algorithm forms a functional module after it is registered. A series of functional modules form a workflow that corresponds to a specific geographic information processing service. In this study, workflow and function module information is saved to a database to form a business process library and a function module library, and thereby facilitate management of the algorithms, modules, and workflows. The algorithm input parameters are managed by an Extensible Markup Language (XML) file, and all new data processing algorithms must be developed according to this format. The XML file that manages the algorithm parameters is shown in
Figure 3. The input data type (grid, vector, or other), supported file format, and projection representation (EPSG, PROJ4, WKT)–private parameters on which the algorithm depends–are specified in the parameters, data result storage path, file format, projection expression, and so on.
The XML file that manages the function module parameters is shown in
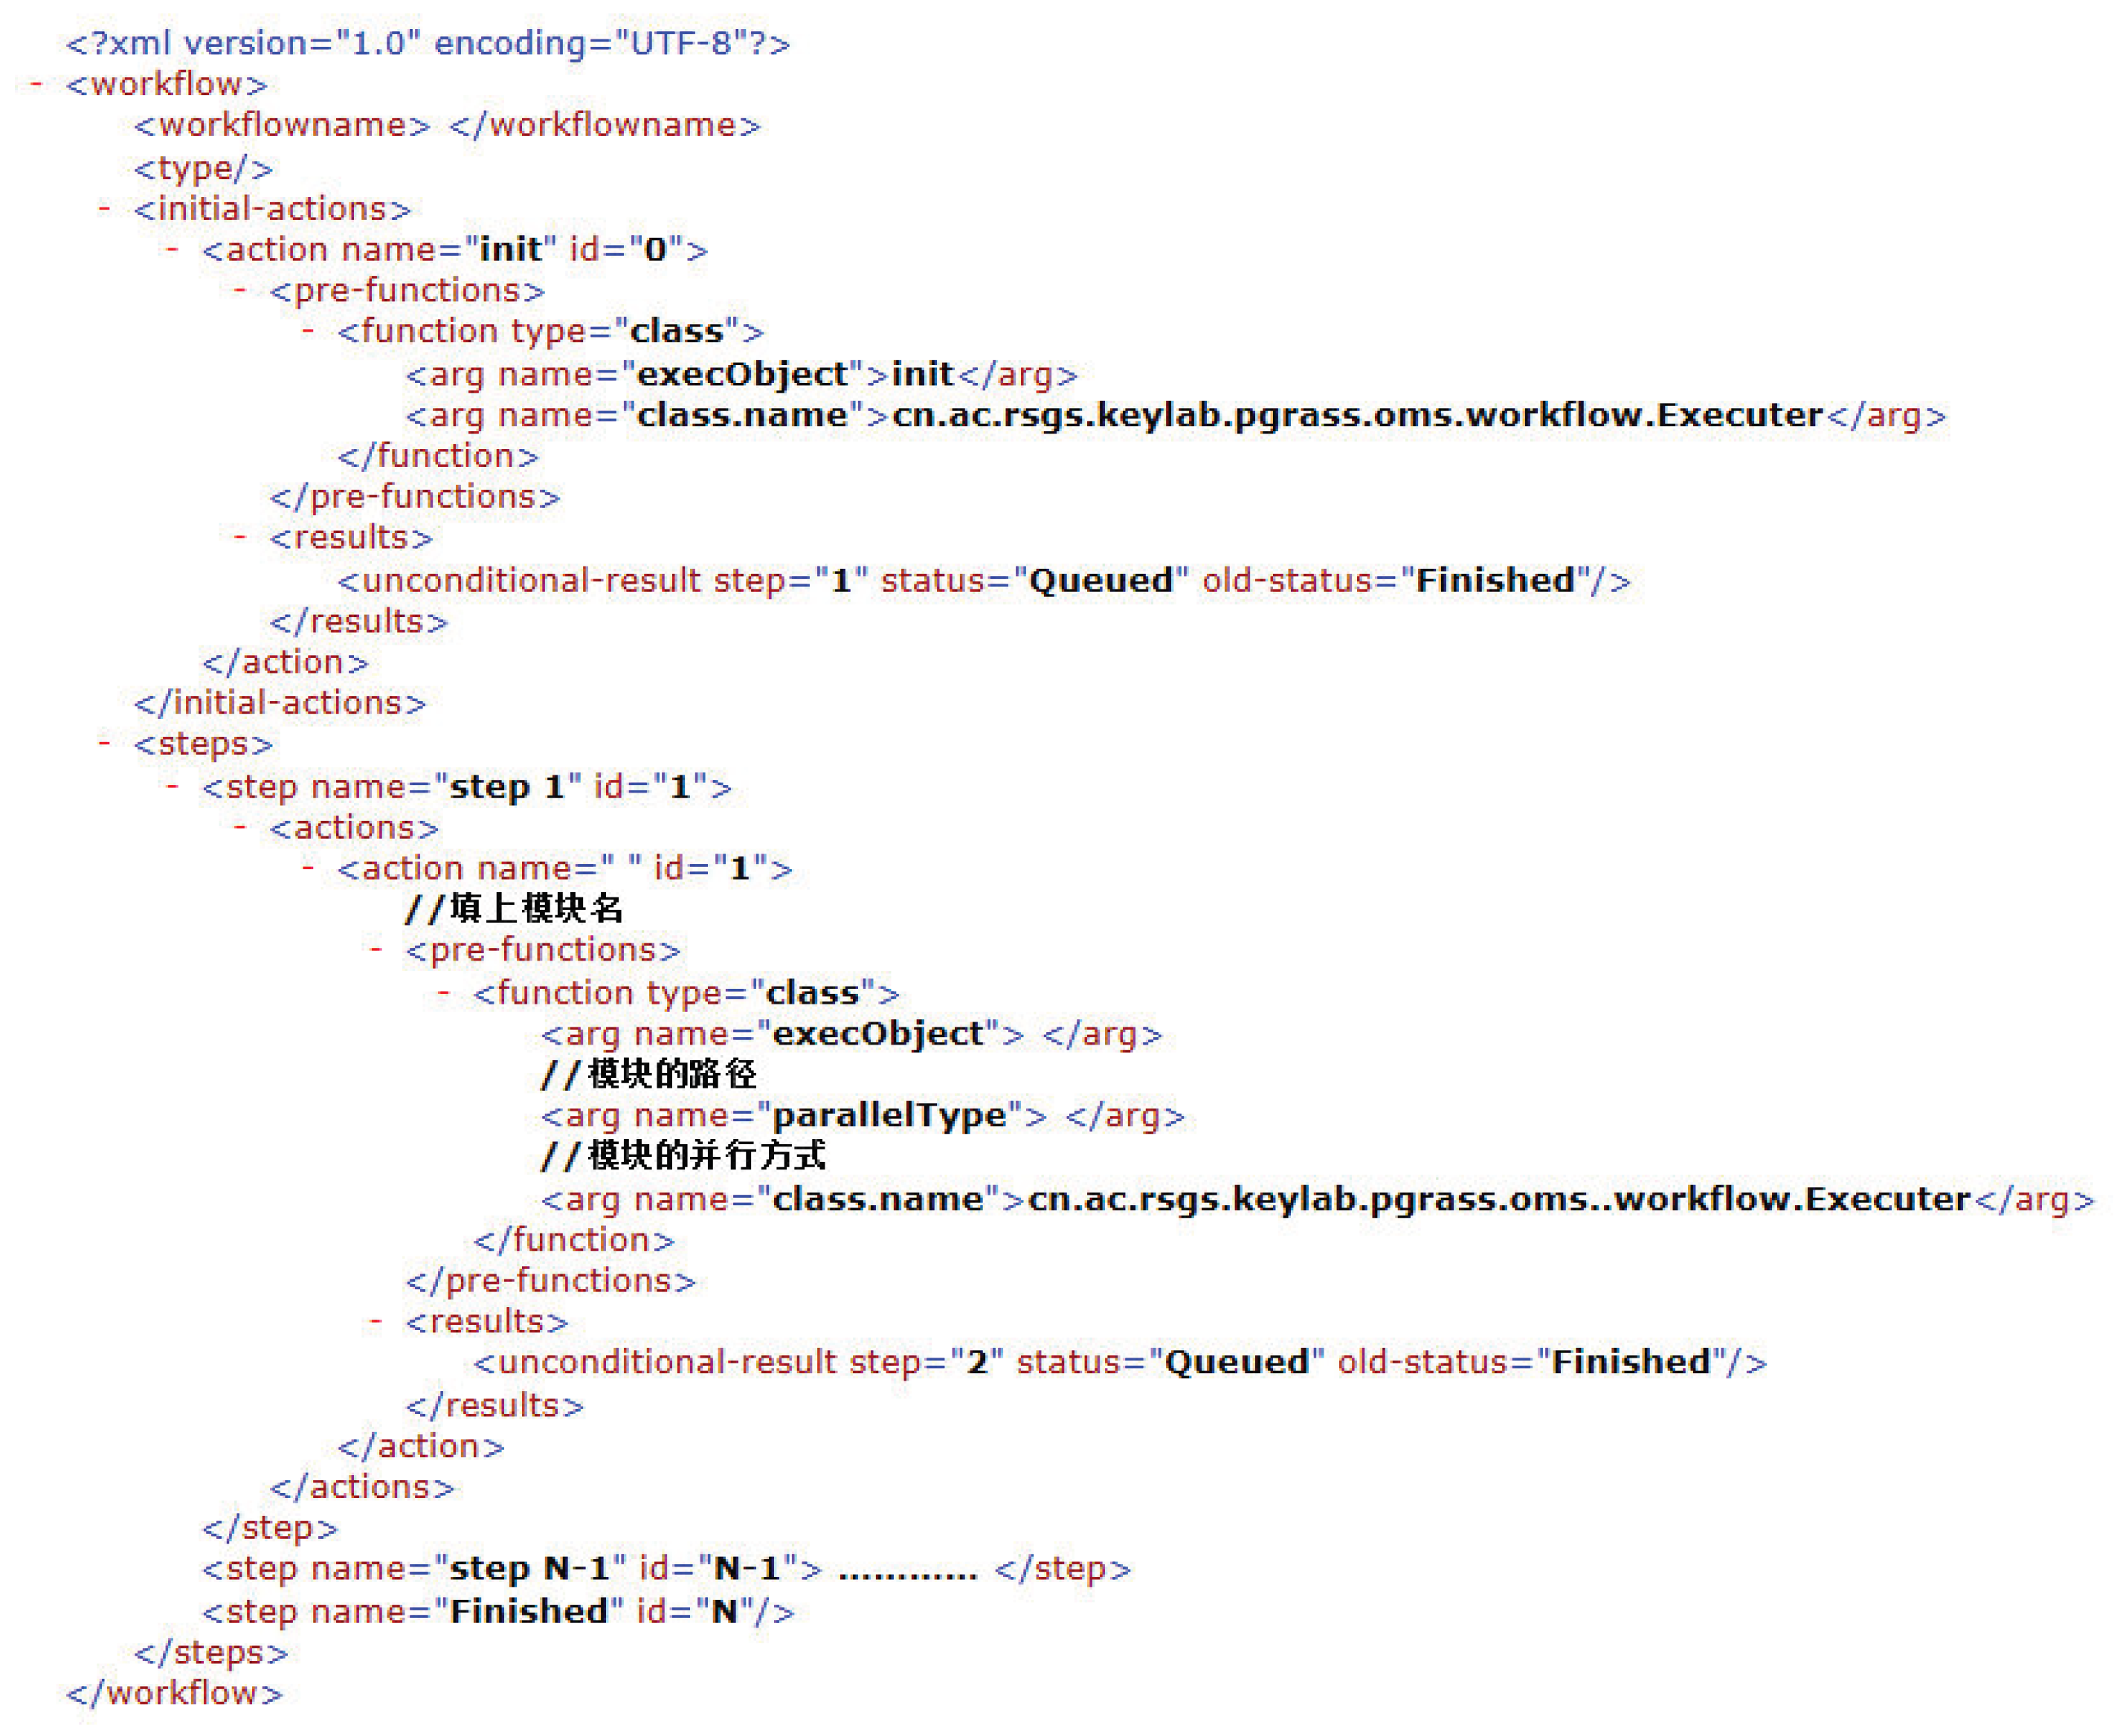
Figure 4. The parameters and storage path of the module, the algorithm of the component module, the execution order of the algorithm, the data result storage path, and the file format are specified in the parameters. The workflow information file follows the standard definition of OSWorkflow, shown in
Figure 5, in which the order of the combinations between modules is specified.
3.2. Business Process Modeling
This study achieves automatic construction and order submission of the geographic information processing procedure through reasonable application of the workflow engine. Construction is divided into five steps: algorithm development or encapsulation, algorithm registration, function combination, on-demand parameter generation, and task order submission.
3.2.1. Algorithm Development or Packaging
In the algorithm development phase, the algorithm parameters need to be set according to the outlined specifications. Algorithm parameters include both public and private parameters. Public parameters refer to the input and output data descriptions processed by the algorithm, and private parameters are various processing parameters and the parameter files of the algorithm. For the existing algorithm module, it can be in the form of a package to conform to input parameter conventions.
3.2.2. Algorithm Registration
When the algorithm program is visually registered, the algorithm program’s path, the name, the private parameters, and the way the private parameters will be obtained, including manual filling and obtaining from the interface, must be specified. It is not necessary to fill in the public parameters when the algorithm is being registered. The registered algorithm is kept in the algorithm library. When an algorithm is registered, the constraints of its private parameters are described in detail. This paper provides such constraints as data types, data fields, enumerations, and data dictionaries.
3.2.3. Process Combination
The user selects an algorithm program from the algorithm library through a manual interaction interface and combines it into a business function by dragging. The remote sensing image processing system stores the description information of previously registered business processes in a business process library (
Figure 6).
In the process combination procedure, a matching judgment is first performed to determine whether or not the inputs and outputs of the two algorithm modules in the sequential relationship are consistent. Process combination can only be performed if the output of the previous module satisfies the input of the next module.
3.2.4. Parameter Interface Generation
The user selects a processing task. The processing platform obtains a data processing operation process definition (
Figure 7) result according to the parameter setting of the algorithm registration and dynamically generates a parameter interface according to the data processing operation process definition result. When the algorithm is registered, the private parameter constraints will be reflected in the interface, and different constraint forms will generate different interface elements.
3.2.5. Task Order Submission
The client generates a task order according to the parameter interface set by the user and submits it to the platform server for execution. The overall technical process is shown in
Figure 8. A number of registered algorithms form a module, and multiple modules form a workflow according to different execution orders, and a parameter input interface is automatically generated according to the workflow. After selecting the data source, the user inputs the parameters using the parameter input interface, and submits the data processing as a task.
3.3. The Drag-and-Drop Process Combination
The core is a link object. In order to achieve a free combination of algorithms on the interface, dynamic and static links can be used to connect algorithms, such as arrows, curves, and lines. Some web plugins can be used as a connection library [
24] on the hypertext markup language (HTML) interface, which is commonly used in the development of charts and modeling tools. In this paper we use jsPlumb and jQuery user interface for business process modeling purposes. Through a Java-based programming design, the workflow diagram is automatically generated, and the workflow configuration process and task execution state are clearly displayed in a graphic manner to meet the visual human interaction requirements. The workflow configuration editing process and drag-and-drop control technology are adopted for the workflow configuration process [
25]. The user drags each module into the canvas according to the requirements, and the system automatically combines these modules into a workflow; from here, the user can also modify the modules’ execution order by dragging and dropping between modules to complete the workflow configuration. The nodes represent the modules that make up the workflow, and the directed arcs represent the order in which the modules are executed. In unmatched algorithm modules, a mismatch will occur when dragging, and it will not be possible to form a process.
3.4. Automatic Interface Generation
The user selects a processing task, and the client parses the information in each functional module according to the detailed business process file, generates each control dynamically, and establishes a mapping relationship between the business process parameters and the control. The user selects the appropriate business process and obtains the workflow details from the web service interface. The user applies for an order serial number from the server through the web service interface. To view the workflow description information, controls (such as Label, Text, and ComBox) generate the process name, order number, priority, and so on. The relative position of each control must be calculated and then drawn into the web page to form a parameter submission interface.
4. The Geographic Information Processing Execution Engine
4.1. The Business Process Execution Engine Structure
The business process execution engine can be divided into three parts: the process-driven interface, the message parsing component, and the process-driven engine component. Its implementation process is given below:
The process-driven interface receives a business process task list and task completion notification;
The message parsing component parses the process task list into the parameters required by the process driver;
The process-driven engine decomposition process step is given as an executable task for the job scheduling engine to execute.
4.2. The Process-Driven Interface
The process-driven interface adopts the web service protocol to implement the receiving function of the business process task list and the task completion notification and provides process management interface options, such as those to pause, restart, and exit the process. Since process-driven software needs to receive all the task orders and task completion notifications in the system, it is necessary to design a robust buffer mechanism and an efficient response mechanism [
26]. The process-driven interface only provides the cache responsible for receiving messages and notifying the message interpretation component of these messages for processing, which ensures maximum acceptance of external messages and a quick response.
4.3. The Process-Driven Engine
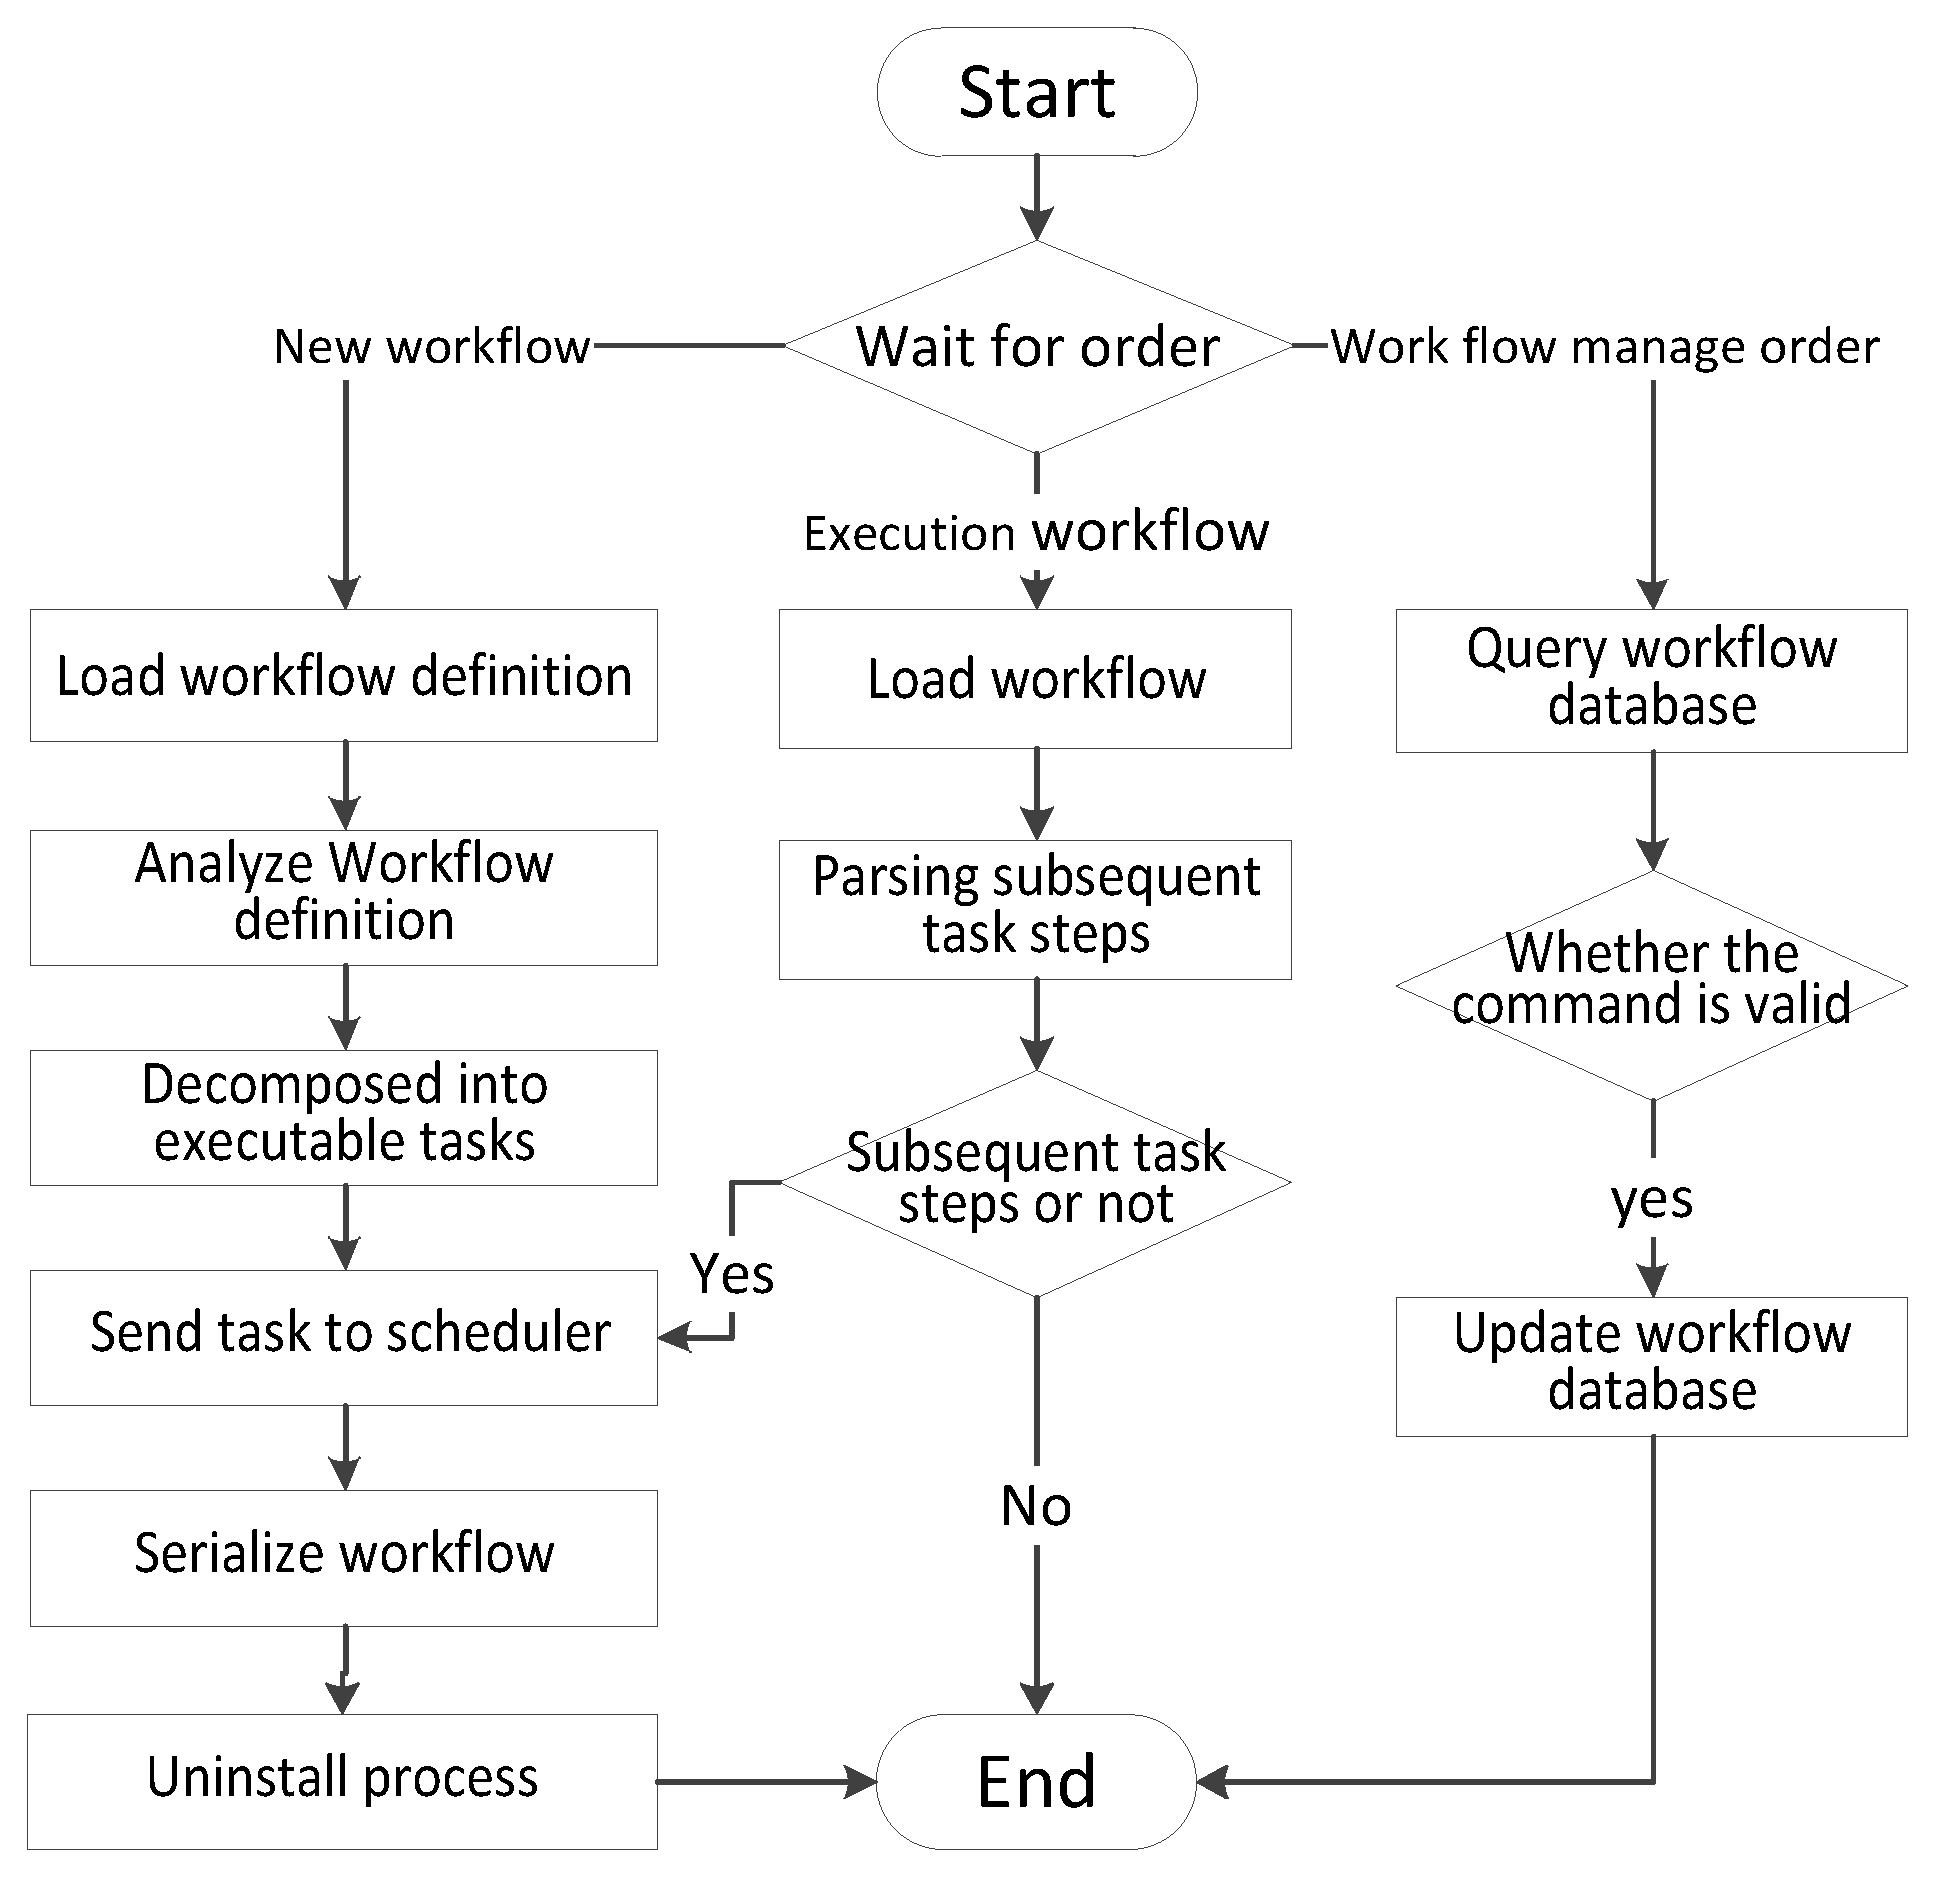
The process-driven engine uses a workflow mechanism to implement diverse business process-driven capabilities by loading standardized process definitions. In addition, while it is running, the process can be suspended, restarted, and exited in accordance with the requirements of the external management instructions. To support the concurrent execution of thousands of processes, the process-driven engine serializes the execution state of each process into the engine’s in-memory database to ensure the recoverability of process failures while meeting fast process-driven performance requirements. The operational flow of the process-driven engine is shown in
Figure 9.
5. Instance Verification
As a typical representative of spatial big data, spatio-temporal data provides ideal conditions for carrying out geographical research and is widely used in analyzing temporal and spatial variations and the development trends of geographic objects. However, due to many factors, such as data acquisition methods, data transmission, and data storage, time series data often has problems, including missing data, noise, and scale differences. However, there are few online services that address these problems, so new algorithms must be designed and combined into workflows to process such data. In this experiment, we designed a necessary algorithm through the spatio-temporal data processing method and composed a workflow to improve the quality of the time series data. The detailed implementation process is as follows:
5.1. Algorithm Ideas
The non-local means (NLM) algorithm is widely used for data denoising and missing value estimation. The main aim is to acquire a new image by weight-averaging the gray values of all pixels in the original image based on the weight coefficient of similarity. Since the algorithm calculates the filter weight based on the matching degree of the block, a better visual effect can be obtained. However, its computational complexity will be too great, and it is difficult to process large-scale high-resolution remote sensing in real time. In addition, the relevant time series variables are not taken into account in the calculation of the weight values. Therefore, the NLM algorithm must be improved to account for the redundancy of the data itself, the similarity of the data neighborhood, and the overall relevance of the time series.
5.2. Adding Modules
After an algorithm is developed, it needs to be added to the system as a module. To add a module, one must select the path in which the application is located, enter the parameter name, enter the default value required to execute the application, and identify whether or not the algorithm program supports parallel computing. After the module is added, the module information prompt will appear in the module list.
5.3. Build the Workflow
Through the workflow management module, the algorithms involved in missing value estimation, denoising processes, and scale transformation can be combined to form corresponding workflows. When adding a workflow, select the workflow classification and the required modules in the dialog box that appears and fill in the necessary information. In the new workflow’s module list, the module order shows the execution order of the module in the task; this order can be adjusted by moving the module up and down. When the new workflow is added, the workflow message appears in the workflow list.
5.4. Analysis and Application
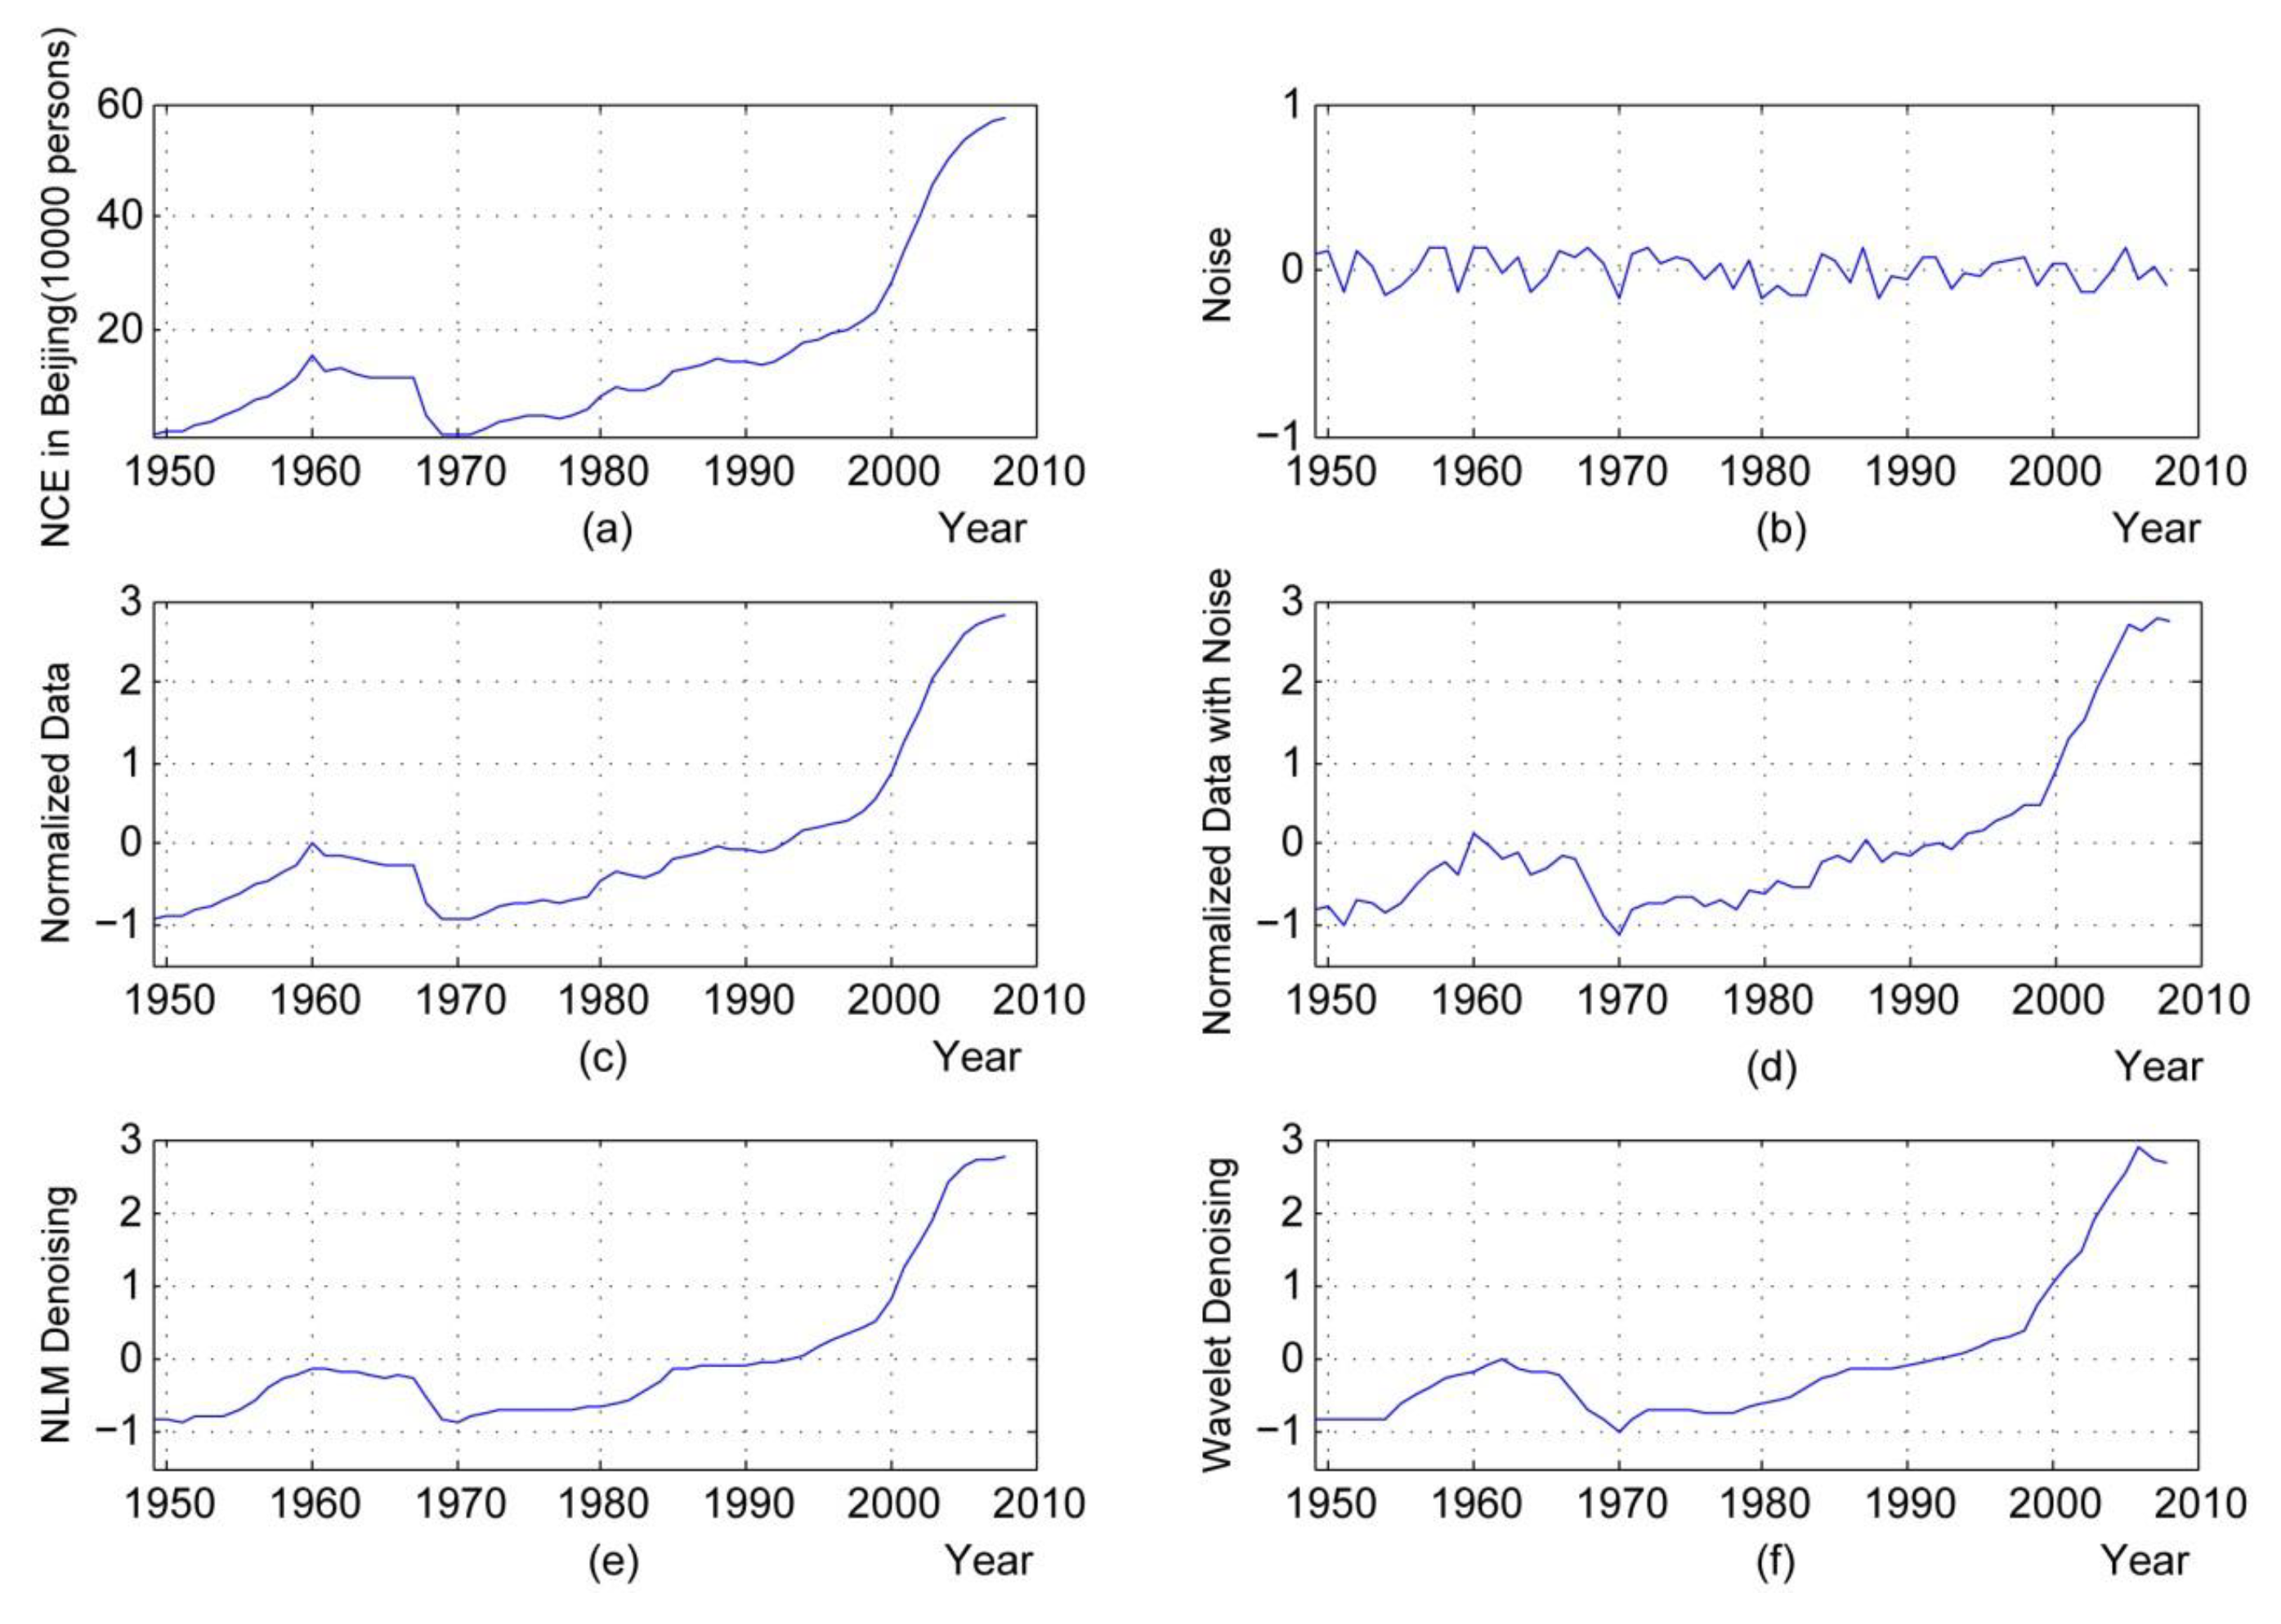
In order to evaluate the denoising abilities of the NLM algorithm on time series data, this experiment uses the number of students attending colleges and universities in Beijing (NCE) as experimental data. The improved NLM algorithm is compared with the classical wavelet threshold denoising method to assess the rationality of the results.
For the purpose of this study, the number of students attending Beijing colleges and universities was found on the official website of the National Bureau of Statistics of China. Random noise may exist throughout the data sorting process. This random noise is mostly caused by the omission of statistics, etc., and Gaussian white noise is also random. Therefore, we first assume that no systematic prior knowledge exists and that the noise model is additive Gaussian white noise; that is, Gaussian white noise with a signal-to-noise ratio of 20 dB is added to the data about the two groups of students. As the original sequence value is too large and the units are not uniform, the original data needs to be normalized before the Gaussian white noise is added. In order to obtain the best experimental results from the NLM algorithm for denoising the data on the number of college and university students in Beijing, we tested the Gaussian kernel parameters, h, with different values and obtained the corresponding evaluation indicators. The results are shown in
Table 1. In the table, RMSE is the abbreviation of Root Mean Square Error. SRMSE indicates the time series after denoising. NRMSE Indicates the RMSE after denoising. R is Mutual relationship. SNR is the abbreviation of Signal-to-Noise.
As can be seen in
Table 1, when the Gaussian kernel parameter of the NLM algorithm is h = 0.15 (NCE Beijing), the index results are optimal. SNR1 is the signal-to-noise ratio after noise with a signal-to-noise ratio of 20 dB was added, SNR2 is the signal-to-noise ratio of the time series after denoising was carried out, and SNR is the improved signal-to-noise ratio after denoising was carried out. In this paper, the wavelet threshold denoising method is compared with the NLM algorithm. In the simulation, the wavelet threshold method uses the symlet wavelet and the minimax threshold estimation criterion and is decomposed into the second layer.
Figure 10 shows the results of the simulation experiments on the Beijing student data.
Figure 10a presents the original time series data of students attending Beijing colleges and universities, and
Figure 10b presents the time series data of Gaussian white noise with a signal-to-noise ratio of 20 dB.
Figure 10c shows the normalized time series data of students attending the original college.
Figure 10d adds Gaussian white noise to the normalized number of students in colleges and universities, NCE. time series, and
Figure 10e reveals the NLM algorithm.
Figure 10f presents the time series diagram after denoising is accomplished through the wavelet threshold method. According to
Figure 10e,f, the NLM algorithm presented by this paper more effectively retains the fluctuation trend of the original time series. Its denoising result is closer to the original sequence data, proving its superiority over the wavelet threshold denoising method.
6. Discussion and Conclusions
This paper presents the construction of an EMBP to address the difficulty in expanding the business process of the cloud-based geographic information service model. The research-based process of establishing this EMBP includes analyzing the characteristics of geographic information processing and demonstrating the feasibility of business process expansion in a cloud-based geographic information service platform. The operational mechanism of the on-demand extension model of the geographic information processing procedure and the key technologies involved are also identified. We discuss the research on, and the implementation of, key technologies, such as business process modeling, on-demand interface generation, and business process execution engines.
The application examples show that the scalable business process model in the cloud GIS environment can effectively realize the registration of user-defined algorithms and the automatic construction of business flows. With this model, user-defined algorithms can be quickly applied to the cloud GIS environment. This model can improve the scalability and value of GIS systems and reduce construction costs. Of course, these operations are preconditions. User-defined algorithms must have robust stability, clear input, output, parameter descriptions, and application scenarios.
Author Contributions
Conceptualization, J.Z., L.X. and Y.Z.; data curation, formal analysis, methodology, and validation, J.Z. and L.Z.; formal analysis, L.X., Y.Z. and L.Z.; writing and reviewing original draft, J.Z., L.X. and Y.Z.; supervision, Y.W. and G.L.
Funding
This research was funded by National Natural Science Foundation of China (41801363, 61602477, U1711267), the Fundamental Research Funds for the Central Universities (CUGL180823), and Open Funding of Hubei Provincial Key Laboratory of Intelligent Geo-Information Processing.
Acknowledgments
This work was supported in part by the Open Research Project of the Key Laboratory of Geological Information Technology of Ministry of Natural Resources.
Conflicts of Interest
The authors declare no conflict of interest. The funders had no role in the design of the study; in the collection, analyses, or interpretation of data; in the writing of the manuscript, or in the decision to publish the results.
Abbreviations
The following abbreviations are used in this manuscript:
| GIS | Geographic information system |
| DOAJ | Directory of open access journals |
| TLA | Three letter acronym |
| LD | linear dichroism |
References
- Badea, A.C.; Badea, G. The advantages of creating compound GIS functions for automated workflow. In Proceedings of the 13th Sgem Geoconference on Informatics, Geoinformatics and Remote Sensing, Red Hook, NY, USA, 16–22 June 2013; Volume 1, p. 943. [Google Scholar]
- Swetnam, T.; Pelletier, J.; Rasmussen, C.; Callahan, N.; Merchant, N.; Lyons, E.; Rynge, M.; Liu, Y.; Nandigam, V.; Crosby, C. Scaling GIS analysis tasks from the desktop to the cloud utilizing contemporary distributed computing and data management approaches: A case study of project-based learning and cyberinfrastructure concepts. In Proceedings of the XSEDE16 Conference on Diversity, Big Data, and Science at Scale, Miami, FL, USA, 17–21 July 2016; p. 21. [Google Scholar]
- Breeze, P.S.; Drake, N.A.; Groucutt, H.S.; Parton, A.; Jennings, R.P.; White, T.S.; Clark-Balzan, L.; Shipton, C.; Scerri, E.M.; Stimpson, C.M.; et al. Remote sensing and GIS techniques for reconstructing Arabian palaeohydrology and identifying archaeological sites. Quat. Int. 2015, 382, 98–119. [Google Scholar] [CrossRef]
- Schaller, J.; Gnaedinger, J.; Reith, L.; Freller, S.; Mattos, C. GeoDesign: Concept for Integration of BIM and GIS in Landscape Planning. J. Digit. Landsc. Archit. 2017, 2, 102–112. [Google Scholar]
- Ng, G.H.; Wickert, A.D.; Somers, L.D.; Saberi, L.; Cronkite-Ratcliff, C.; Niswonger, R.G.; McKenzie, J.M. GSFLOW–GRASS v1. 0.0: GIS-enabled hydrologic modeling of coupled groundwater–surface-water systems. Geosci. Model Dev. 2018, 11, 4755–4777. [Google Scholar] [CrossRef]
- Chaudhuri, S. Application of web-based geographical information system (GIS) in e-business. In Digital Marketing and Consumer Engagement: Concepts, Methodologies, Tools, and Applications; IGI Global: Hershey, PA, USA, 2018; pp. 649–665. [Google Scholar]
- Zheng, G.; Bai, J.; Zhang, S.; Sun, J.; Wang, J.; Zhu, B. Technological solution for geographical information services composition based on workflow. In Proceedings of the 3rd International Conference of Electronic Engineering and Information Science (ICEEIS 2016), Harbin, China, 4–5 January 2016; pp. 221–226. [Google Scholar]
- Cowart, C.; Block, J.; Crawl, D.; Graham, J.; Gupta, A.; Nguyen, M.; de Callafon, R.; Smarr, L.; Altintas, I. geoKepler Workflow Module for Computationally Scalable and Reproducible Geoprocessing and Modeling. In AGU Fall Meeting Abstracts; AGU: San Francisco, CA, USA, 2015. [Google Scholar]
- Sharma, V.; Davies, J.; Vella, B.; Jiang, J.; Sugiarto, I.; Mazumder, S. Integrated Modelling Workflow for Life Cycle Development of a Large Scale Coal Seam Gas Field. In Proceedings of the SPE Asia Pacific Oil and Gas Conference and Exhibition, Brisbane, Australia, 23–25 October 2018. [Google Scholar]
- Song, W.; Jin, B.; Li, S.; Wei, X.; Li, D.; Hu, F. Building spatiotemporal cloud platform for supporting GIS application. ISPRS Ann. Photogramm. Remote Sens. Spat. Inf. Sci. 2015, 2, 55. [Google Scholar] [CrossRef]
- Sun, Y.; Li, S. Real-time collaborative GIS: A technological review. ISPRS J. Photogramm. Remote Sens. 2016, 115, 143–152. [Google Scholar] [CrossRef]
- Chaudhuri, S.; Ray, N. Geospatial Mashups in Web GIS for Tourism Infrastructure: Internet-Based Channel Perspective Promotional Measures. In Business Infrastructure for Sustainability in Developing Economies; IGI Global: Hershey, PA, USA, 2017; pp. 272–295. [Google Scholar]
- Knoth, L.; Mittlböck, M.; Vockner, B. Smart 3D building infrastructures: Linking GIS with other domains. ISPRS Ann. Photogramm. Remote Sens. Spat. Inf. Sci. 2016, 4, 187. [Google Scholar] [CrossRef]
- Wang, L.; Zhang, J.; Liu, P.; Choo, K.K.R.; Huang, F. Spectral–spatial multi-feature-based deep learning for hyperspectral remote sensing image classification. Soft Comput. 2017, 21, 213–221. [Google Scholar] [CrossRef]
- Ma, Y.; Wu, H.; Wang, L.; Huang, B.; Ranjan, R.; Zomaya, A.; Jie, W. Remote sensing big data computing: Challenges and opportunities. Future Gener. Comput. Syst. 2015, 51, 47–60. [Google Scholar] [CrossRef]
- Wang, L.; Ma, Y.; Yan, J.; Chang, V.; Zomaya, A.Y. pipsCloud: High performance cloud computing for remote sensing big data management and processing. Future Gener. Comput. Syst. 2018, 78, 353–368. [Google Scholar] [CrossRef] [Green Version]
- Wang, L.; Song, W.; Liu, P. Link the remote sensing big data to the image features via wavelet transformation. Clust. Comput. 2016, 19, 793–810. [Google Scholar] [CrossRef]
- Wu, J.; Hong, Z.; Pan, S.; Zhu, X.; Cai, Z.; Zhang, C. Multi-graph-view subgraph mining for graph classification. Knowl. Inf. Syst. 2016, 48, 29–54. [Google Scholar] [CrossRef]
- Ranjan, R.; Georgakopoulos, D.; Wang, L. A note on software tools and technologies for delivering smart media-optimized big data applications in the cloud. Computing 2016, 98, 1–5. [Google Scholar] [CrossRef]
- Chen, L.; Wang, L.; Ma, Y.; Liu, P. Overview of ecohydrological models and systems at the watershed scale. IEEE Syst. J. 2014, 9, 1091–1099. [Google Scholar] [CrossRef]
- Zeng, D.; Guo, S.; Barnawi, A.; Yu, S.; Stojmenovic, I. An improved stochastic modeling of opportunistic routing in vehicular CPS. IEEE Trans. Comput. 2014, 64, 1819–1829. [Google Scholar] [CrossRef]
- Shi, L.; Qiu, Y.; Shi, J.; Lemmetyinen, J.; Zhao, S. Estimation of microwave atmospheric transmittance over China. IEEE Geosci. Remote Sens. Lett. 2017, 14, 2210–2214. [Google Scholar] [CrossRef]
- Lv, Z.; Li, X.; Zhang, B.; Wang, W.; Zhu, Y.; Hu, J.; Feng, S. Managing big city information based on WebVRGIS. IEEE Access 2016, 4, 407–415. [Google Scholar] [CrossRef]
- Chen, B.; Gao, D.; Wang, L. Research of Multi-Information Integration for the Aircraft Ground Centralized Deicing Monitoring System Based on Wireless Data Transmission. IEEE Access 2018, 6, 52460–52470. [Google Scholar] [CrossRef]
- Campos-Taberner, M.; Romero-Soriano, A.; Gatta, C.; Camps-Valls, G.; Lagrange, A.; Le Saux, B.; Beaupere, A.; Boulch, A.; Chan-Hon-Tong, A.; Herbin, S.; et al. Processing of extremely high-resolution Lidar and RGB data: Outcome of the 2015 IEEE GRSS data fusion contest–part a: 2-D contest. IEEE J. Sel. Top. Appl. Earth Obs. Remote Sens. 2016, 9, 5547–5559. [Google Scholar] [CrossRef]
- Useya, J.; Chen, S. Comparative Performance Evaluation of Pixel-Level and Decision-Level Data Fusion of Landsat 8 OLI, Landsat 7 ETM+ and Sentinel-2 MSI for Crop Ensemble Classification. IEEE J. Sel. Top. Appl. Earth Obs. Remote Sens. 2018, 11, 4441–4451. [Google Scholar] [CrossRef]
© 2019 by the authors. Licensee MDPI, Basel, Switzerland. This article is an open access article distributed under the terms and conditions of the Creative Commons Attribution (CC BY) license (http://creativecommons.org/licenses/by/4.0/).


