1. Introduction
As a special form of language, maps are not only a tool for humans to recognize the world but also display the results of changes in the world [
1,
2,
3]. The internet enhances map usability and combines map printing and distribution. Web mapping can more rapidly and directly provide the user with map services [
4,
5,
6,
7]. All of the present mainstream web maps—such as Google Maps [
8], Apple Maps, Bing Maps, and OpenStreetMap (OSM) [
9]—provide map services by publishing images on the client side in the form of raster tiles. Raster tiles take image blocks as visualized representations of map data. As a result, amplification of raster tiles will result in fuzziness of map images, which cannot be clearly displayed. In practical applications, raster tiles of different resolutions can be obtained by rendering map data on different scales in order to continuously present maps of more elaborate resolutions. In consideration of the deficiencies of raster tiles, such as large total data size and lack of interaction ability with geographic elements, vector data-based web maps have gradually become a popular research subject, and vector tiles have consequently appeared [
10,
11]. MapBox promoted MapBox Streets in 2012, which provided vector tiles of the world and formed standards for MapBox vector tiles [
12]. Google started using vector tiles in Google Streets in 2010, and Apple Maps began in 2012. Both gained good results but used exclusive formats which could not be used by the general public.
Vector tile maps are currently generated based on geographic information. They use symbol mapping mechanisms supported by specific symbol libraries. Different types of cartographic software usually use different symbol libraries, different mapping mechanisms, and different map browsers [
13,
14]. Thus, web map services using vector tiles are run under their respective system platform, such as Apple Maps and Google Maps. Cartographic models determined that the mainstream use of vector tile maps is related to system software. Is it possible to use published digital symbolic maps as vector tiles if we do not need to consider the cartographic procedure? The development of PDF (portable document format) map technology makes this idea possible.
PDF mapping is a new type of map product that stores geospatial and multimedia information, such as graphics, images, and text, in PDF format. The main characteristics of PDF mapping are summarized as follows. First, PDF maps do not need to be associated with a map symbolic database, or the support of a complicated GIS (geographic information system) or cartographic system. There is no particular system requirement for PDF maps, thereby lowering the threshold for users. The users of PDF maps can use a PDF reader, such as Adobe Acrobat, Adobe Reader, and Foxit Reader, to read layered maps and image products that have a geographic reference. Second, compared to traditional vector maps, PDF maps can reduce data volume by about 80%, which provides a guarantee for its use on portable terminals. Third, PDF maps have the same display effect on any display screen. Furthermore, they can print as a clear and high-quality paper map product on a local printer. Thus, users can obtain a paper map that is the same as that displayed on the screen [
15].
In this paper, we adopt the PDF tiling method to realize logically the seamless organization of PDF maps up to the global area. Our PDF tile model is a new vector map tile between raster tiles and traditional vector tiles, which inherits the advantages of the PDF format. We take map publishing data as the data source and PDF map technology as the technical support, with the goal of establishing a new PDF vector tile map model that can be used for web map services. This model not only has the existing ability of the vector tiles, but also other advantages. First, PDF tile mapping provides a map browse function without the need for symbolization of geographic information, and thus needs no specific symbolic database. Second, since PDF tile mapping uses the final publishing-oriented map results, it can be directly used for paper map publishing. Finally, because of the high universality of the PDF format, PDF tile maps are easier to share and can be more easily used by the general public.
The remainder of this paper is structured as follows.
Section 2 briefly reviews previous related work.
Section 3 details the construction and establishment method of the PDF tile model.
Section 4 carefully designs experiments and discusses the experimental results, in which an offline map and online map are carried out to validate the performance of our PDF tile model and compare our PDF tile map with the current raster tiles and vector tiles. This paper ends with conclusions (
Section 5).
2. Related Work
The development of the internet has hastened the demand for the use of maps through browsers. The WMS (web map service) solution emerged in 1999, which greatly promoted the progress of web maps [
16]. The WMS renders a map into a large image on the server side according to browser window size, transmits the map image to the browser side through the network, and displays the map image directly using the browser. For WMS, back-end rendering and network transport are challenges and inefficiencies. Hence, WMS-C (cached) improves efficiency by caching map tiles. Google Maps appeared online in 2005, allowing global users to easily enjoy online maps through high-efficiency tile map technology, which generates raster tiles from the image. With the emergence of AJAX (asynchronous JavaScript and XML (extensible markup language)) and drawing APIs (application program interface), the application of web maps based on raster tiles has been extensively popularized, and most commercial and open-source public map services adopt a tile-based data transmission method [
17]. However, with in-depth application and mobile information of web maps, raster tiles have encountered at least two problems: first, images consume large bandwidth and storage, which is adverse to map applications on mobile devices; and second, users cannot interact with images. Therefore, a solution which uses vector tiles to replace raster tiles on the mobile side appeared. Similar to raster tiles in concept, vector tiles store the spatial position and other attribute data of geographic elements within the scope of the tiles. They constitute a vector representation of geographic elements rather than pre-generated raster images. With small volumes, vector tiles can be highly compressed, which not only reduces network bandwidth consumption but also makes offline mapping possible. Hence, vector tile maps have been praised as the future for the application of web maps and vector tiles have gradually become a very important technology for web maps on the browser side.
The URL (uniform resource locator) solution of vector tiles has always abided by raster tile patterns, such as those in Google XYZ [
18], Microsoft Quad Tree [
19] and open-source TMS (tile map service) [
20]. The vector tile encoding format determines the data size of vector tiles so as to directly influence transmission efficiency of vector tiles on the web. The traditional vector tile encoding format mainly concentrates on XML and GeoJSON (a geospatial data interchange format based on JavaScript object notation (JSON)) [
21]. As a text encoding format, GeoJSON has been extensively accepted in the field of geographic mapping. At present, most vector tile servers support GeoJSON-encoded vector tiles. TopoJSON (an extension of GeoJSON that encodes topology) [
22], which can be regarded as an extension of GeoJSON, is actually a delta-encoded version of GeoJSON that eliminates geometric coordinate redundancy. It transmits data differences between sequential data rather than complete files, which reduces data size of vector tiles. Compared with XML and JSON [
23], compact binary encoding formats, such as Google Protocol Buffers [
24], can greatly reduce data size and improve data transmission efficiency.
The various solutions applied to vector tiles are seen in
Table 1 including (i) the open-source programs TileStache, Mapzen, OpenLayers, Kartotherian, Tegola, and (ii) the commercial programs MapBox, Google, and Apple.
TileStache (
http://www.tilestache.org/) is a Python-based server application that can serve map tiles based on rendered geographic data. It supports vector tile encoding formats like GeoJSON, TopoJSON, ArcJSON and MVT (MapBox vector tile), however it does not support the Google Protocol Buffers vector tile encoding format. Mapzen (
https://www.mapzen.com/) focuses on the core components of map displays, such as search and navigation. Mapzen’s vector tile service delivers worldwide coverage of OpenStreetMap base layer data, and is available in GeoJSON, TopoJSON, and MVT binary format. OpenLayers (
https://openlayers.org/) makes it easy to put a dynamic map on any web page [
25,
26]. It can display map tiles, vector data, and markers loaded from any source, such as GeoJSON, TopoJSON, KML (keyhole markup language), GML (geography markup language), MapBox vector tiles, and other formats. Kartotherian (
https://github.com/kartotherian/kartotherian/) is a map tile service originally built for the Wikimedia projects. Its supported formats include PBF (protocolbuffer binary format) vectors, and JSON. Tegola (
https://tegola.io/) is an open source vector tile server written in Go. Tegola takes geospatial data and slices it into vector tiles that can be efficiently delivered to any client. It supports the MapBox vector tile encoding format. The MapBox (
https://www.mapbox.com/maps/) Tile Server supports the Google Protocol Buffers vector tile encoding format. As one of the largest providers customizing web maps, MapBox defines the standard for MapBox vector tiles.
With a lack of formal standards, studies of vector tiles still concentrate on aspects such as the application advantage analysis of web map vector tiles and correct loading and display of vector tiles [
27,
28,
29]. At present, both Google (
https://mashable.com/category/google-maps/) and Apple (
https://developer.apple.com/maps/web/) use exclusive vector tile encoding formats that cannot be used by the general public. In addition, vector tiles have problems such as non-refined rendering, dependence on a specific platform, and poor reading experience. In order to further study the vector tile encoding format, a vector tiles solution—namely tile mapping that uses PDF map technology—is proposed in this paper, with the aim of realizing goals that could not be achieved by existing vector tile technologies. Such goals include: convenient and fast generation, independence of specific platforms for real-time data rendering in map services, conformity with human visual reading effects, small data sizes, and a guarantee of the offline map quality. Moreover, the proposed approach can also use a reader with a high market share and improve the convenience of map usage.
PDF is a document recording format developed and designed by Adobe. PDF documents, which contain data encoding all of the information displayed on the screen and output to a printer, image setter, or computer-to-plate (CTP) imager, are entirely independent of the original application and computer platform that created them. Thus, they have become an ideal document format for electronic document transmission and digitized information communication. In 2004, Layton Graphics, Inc. (LGI, a company in the United States,
http://laytongraphics.com/) put forward the notion of using PDF documents to store maps and geographic information, and obtained GeoPDF products. Thereafter, it founded a subsidiary called TerraGo Technologies (a company in the United States founded in 2005,
https://terragotech.com/), which specialized in GeoPDF research [
30]. GeoPDF has expanded many functions based on the existing PDF format standard, provided free serviceable tools for application terminals, and become an important format for map distribution. Thus, it has gained trust from governmental agencies and business corporations on a global scale, and has been extensively applied in multiple countries, including the United States, Canada, and Japan [
31]. With continuous development and growth of the GeoPDF standard, OGC (Open Geospatial Consortium) has taken GeoPDF as a recommended PDF map encoding standard, and Adobe is designing PDF2.0 (ISO 32000-2) to manage geographic information based on the GeoPDF encoding standard [
32]. At the present time, mainstream GIS software, such as ArcGIS v10.x, FME2013, Intergraph GeoMedia, Erdas, MapInfo, and GDAL, support GeoPDF output. China has mainly carried out research to store maps and geographic information in PDF documents, such as a study of the data model of PDF maps, research on the conversion method from digital maps into PDF documents, and a study on PDF cartographic technology [
15,
33,
34]. In addition, China has undertaken a significant exploration into PDF map application patterns, including the development of a multimedia electronic atlas based on the PDF format [
35]. The team of which this paper’s authors are a part began the earliest research into PDF maps in China. This team has developed its own PDF map products with obvious advantages in aspects such as large-page map browsing, and is currently expanding towards the application and service of PDF maps.
For a long time, multiple countries have accumulated a large number of topographic maps oriented to print (such as China, we call this topographic map for printing as a digital publishing original) [
36,
37,
38]. These print-oriented digital topographic maps, although of high data quality, the main use of such maps today is to print paper maps. Because of the large amount of data, and the disconnection from the GIS database, high-quality topographic map results are difficult to use for map network sharing and various information systems. Geospatial PDF solutions such as GeoPDF have facilitated the use of this high-quality topographic map data. However, the area represented by a single GeoPDF file cannot be too large. It can be displayed using a PDF browser such as Adobe Reader, but the hardware requirements are extremely high. GeoPDF does not provide a regional usage model, such as the inability to provide seamless browsing and multi-scale presentation. This paper adopts the PDF tiling method to realize logically the seamless organization of PDF maps up to the global area, so that PDF tiles provide web map services like existing raster and vector tiles. In addition, PDF tiles make high-quality map products possible as an interactive interface for electronic maps and various information systems. The existing Web Map API can be extended to support PDF format, so that PDF vector tile can provide map services directly, like the vector tiles in GeoJSON format. Of course, the function of printing a paper map is certain.
3. Methodology
3.1. Portable Document Format (PDF) Tile Map Pyramid Model Structure
The PDF tile map pyramid model is a model of multiple scales. The relation of halving and doubling are used to establish a model while data continuity is maintained, so as to realize functions such as infinite zooming and seamless roaming of a PDF tile map. It is necessary to determine the tile size of a PDF tile map, the ranges of longitude and latitude, the number of layers in the pyramid model, and the corresponding map scale during the establishment process of the PDF tile map pyramid model.
3.1.1. Establishment of the Coordinate Transformation Object in Web Mercator Projection
For the convenience of calculation in the determination of a PDF tile map partitioning and index coding, a square region is taken for the PDF tile map pyramid model. Therefore, the Earth is regarded as a sphere rather than a spheroid during the Mercator projection process, also called web Mercator projection. This projection takes the equator as the standard parallel, the prime meridian as the central meridian, and their intersection point as the origin of coordinate system. Eastward is the forward direction of the X-axis and northward is the forward direction of the Y-axis. Its projection formula is shown in following equation:
where
R = 6,378,137 m (the Earth’s radius);
λ is longitude; and
φ is latitude (both in units of radians).
3.1.2. Establishment of the PDF Tile Map Pyramid Rules
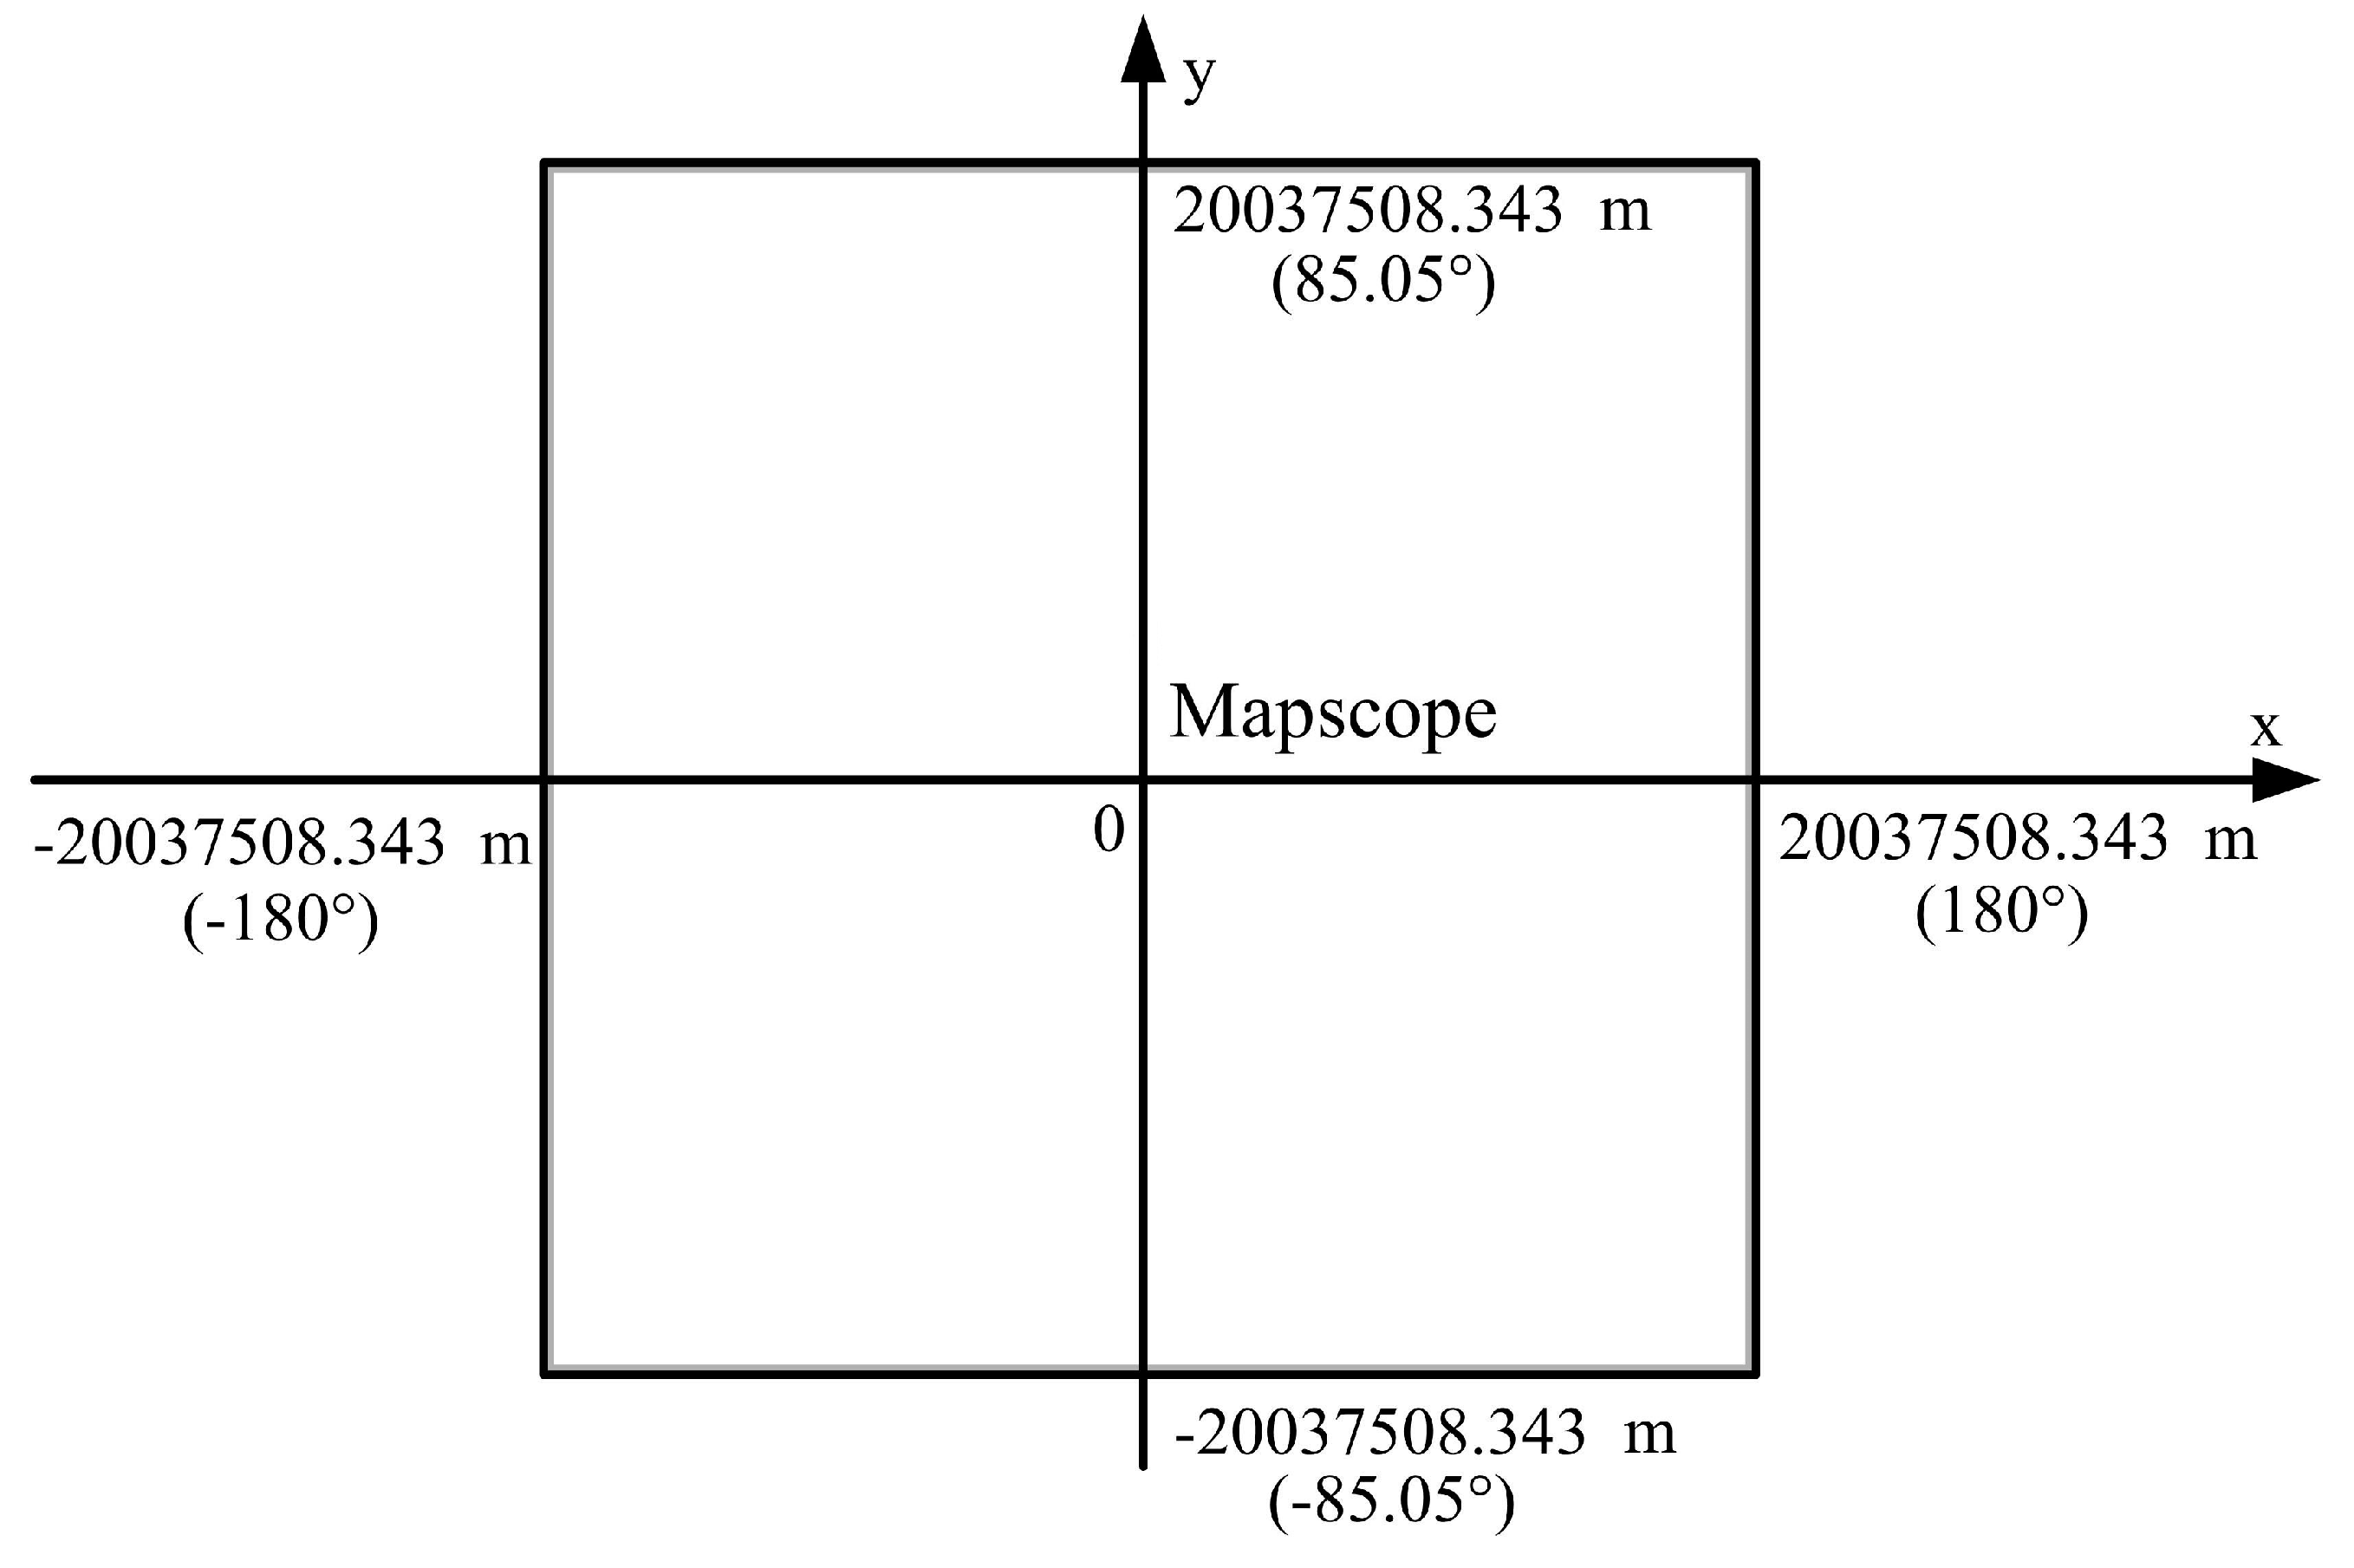
Web Mercator projection is adopted for the PDF tile map. The map scope is a square region with side length of 40,075,016.686 m (meter), corresponding to a latitude range of −85.05° to 85.05° and a longitude range of −180° to 180°, as shown in
Figure 1.
The PDF tile map pyramid rules for map data on five scales—1:1,000,000; 1:250,000; 1:50,000; 1:10,000; and 1:2,000—are shown in
Table 2. The method of tile partitioning is as follows:
(1) The map scope in
Figure 1 is equally divided into 4
9 blocks yielding level 1 of the PDF tile map, and the corresponding map scale is 1:1,000,000;
(2) Each block of level 1 is equally divided into 42 blocks yielding level 2 of the PDF tile map, and the corresponding map scale is 1:250,000;
(3) Each block of level 2 is equally divided into 43 blocks yielding level 3 of the PDF tile map, and the corresponding map scale is 1:50,000;
(4) Each block of level 3 is equally divided into 42 blocks yielding level 4 of the PDF tile map, and the corresponding map scale is 1:10,000;
(5) Each block of level 4 is equally divided into 42 blocks yielding level 5 of the PDF tile map, and the corresponding map scale is 1:2,000.
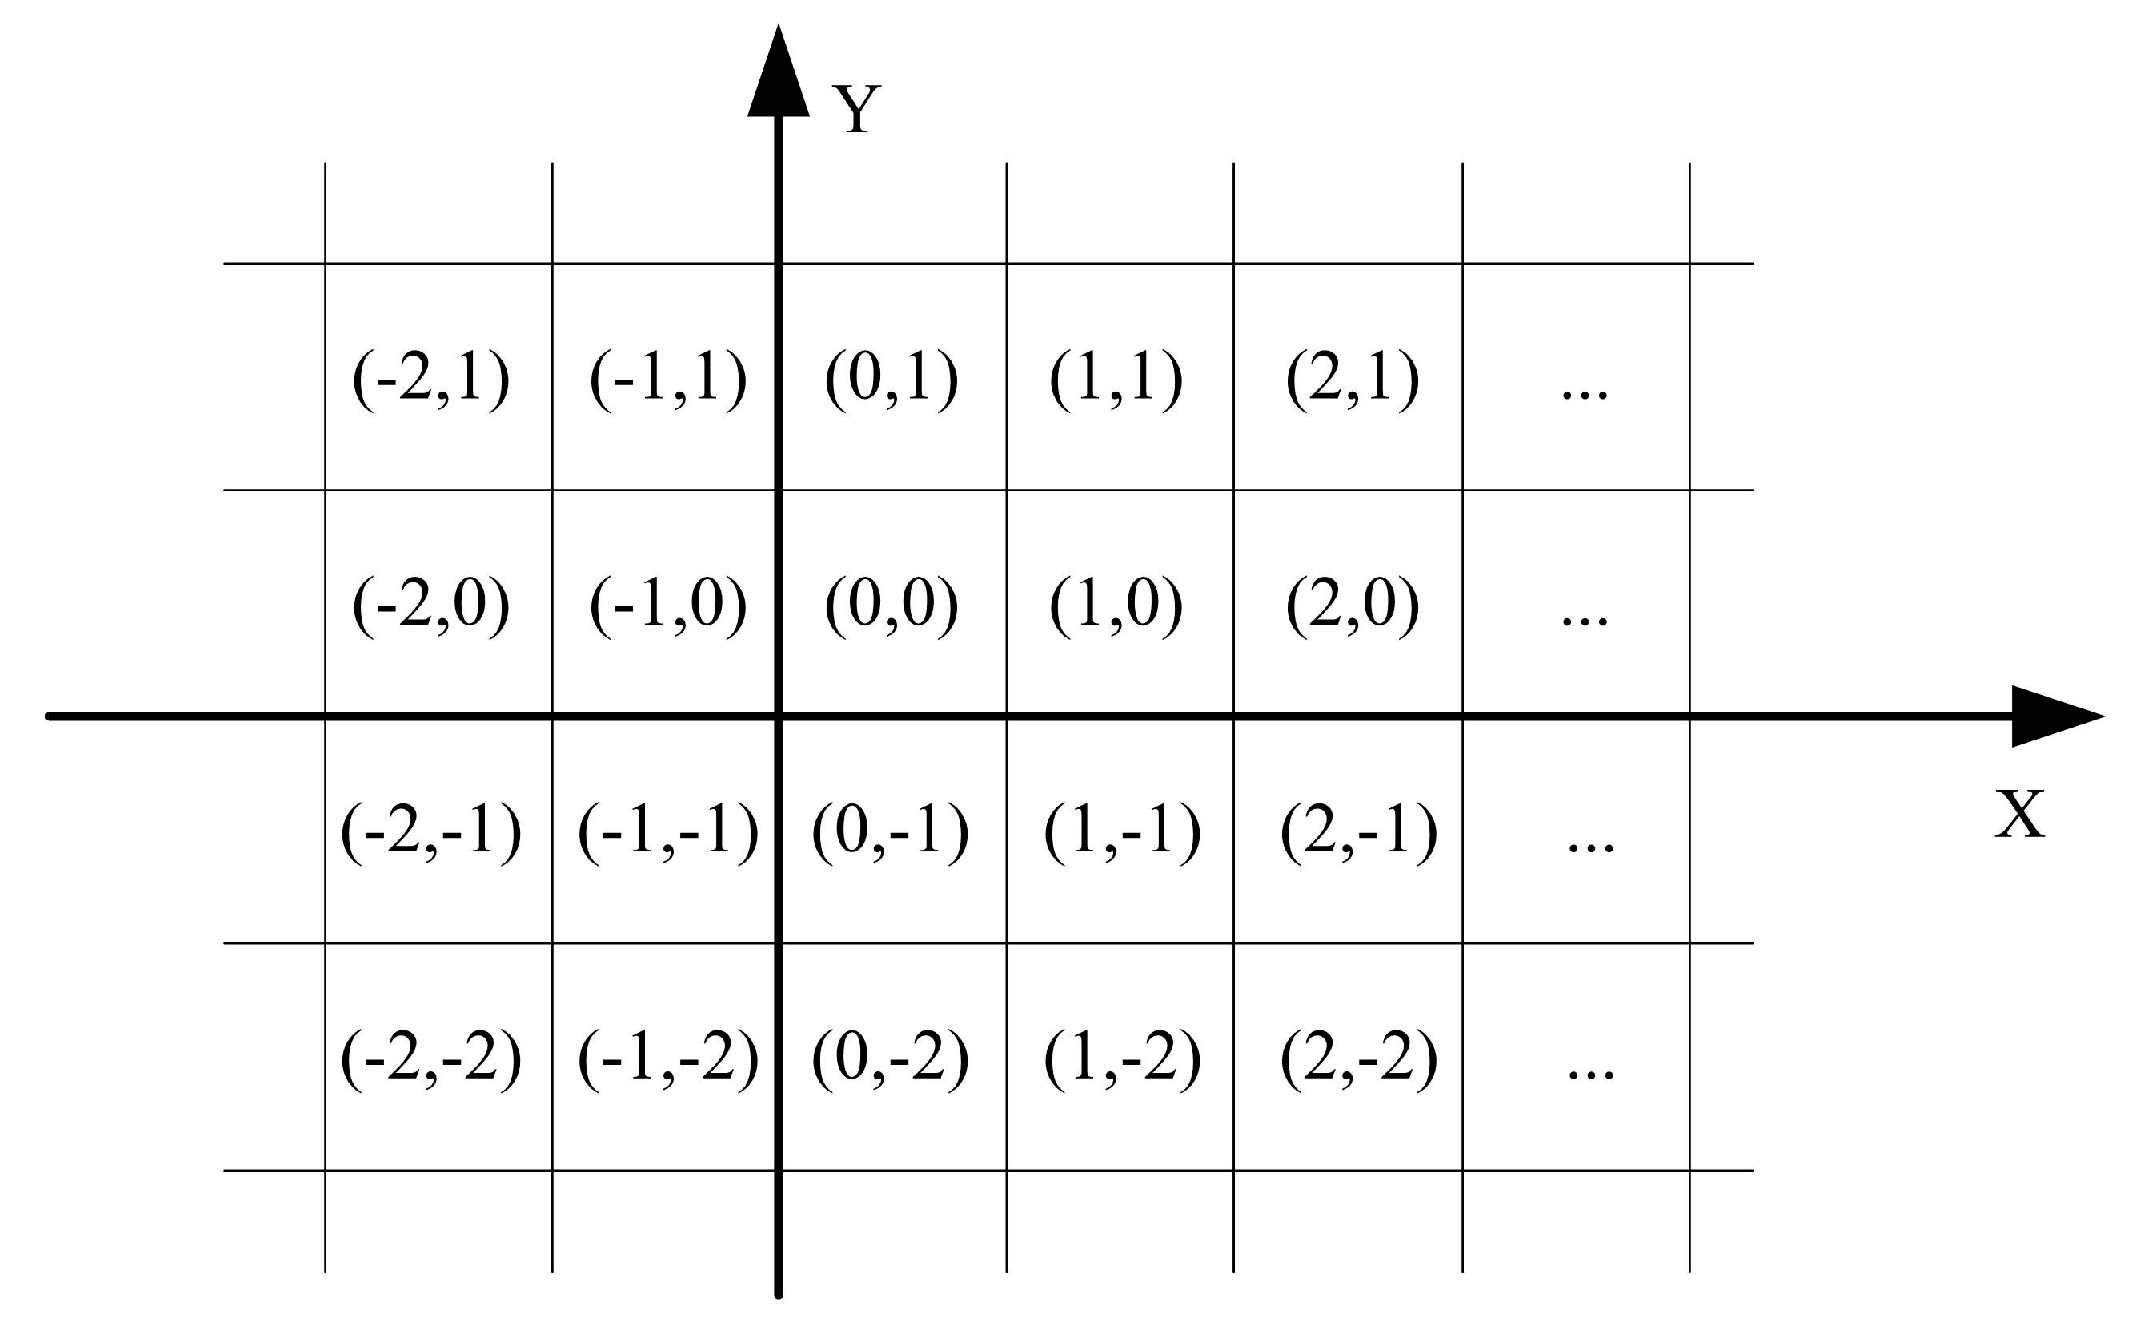
The origin of coordinates of the PDF tile map are located at the position with a longitude and latitude of 0, with the lower left point of the tile as the reference point, and a single tile is uniquely represented by the tile code [Z,X,Y], where Z is tile level, for levels 1–5, and X and Y are integers. As shown in
Figure 2, tile codes [Z,X,Y] are tile coordinates (X,Y) under a level Z map, where X is the horizontal coordinate and Y is the vertical coordinate. The values are positive when the tiles are upward and rightward with respect to the origin of coordinates and are negative when they are downward and leftward; that is, east longitudes (X) have positive values, west longitudes have negative values, north latitudes (Y) have positive values, and south latitudes have negative values.
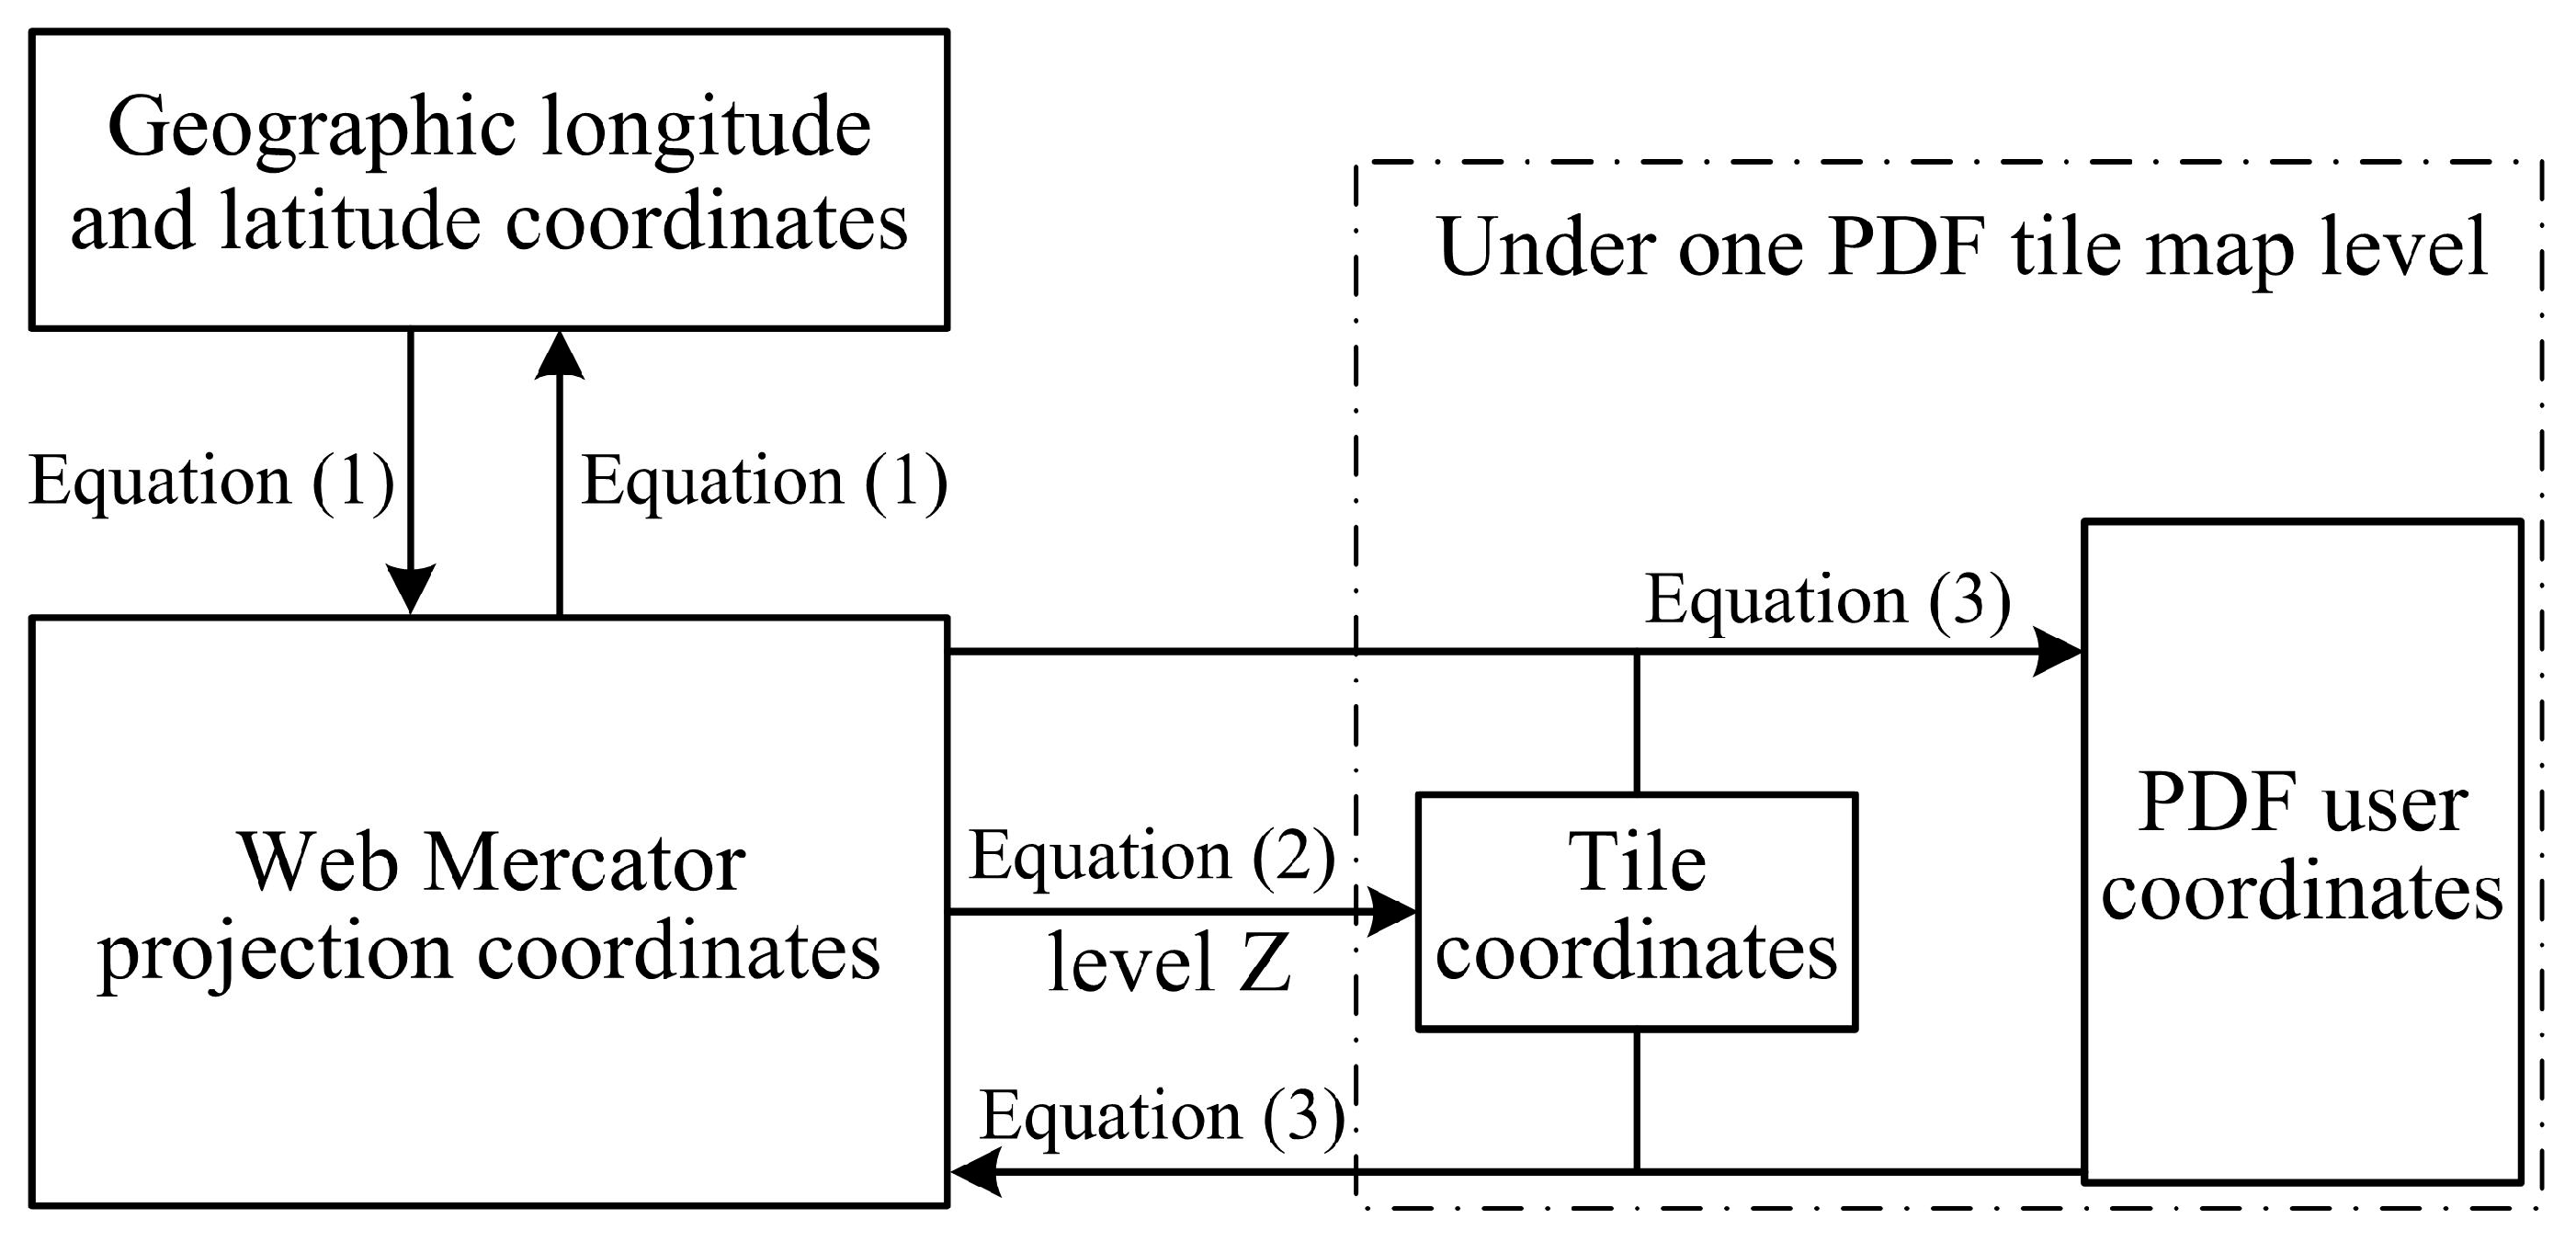
The coordinate transformation of the PDF tile map is shown in
Figure 3. The longitude and latitude coordinates and the web Mercator projection coordinates can be mutually transformed through Equation (1) and the relations are unaffected by the tile level. The web Mercator projection coordinates can be transformed into tile coordinates (Equation (2)) and PDF user coordinates (Equation (3)), which depends on the tile level. Meanwhile, the PDF user coordinates can be transformed into web Mercator projection coordinates (Equation (3)).
The Web Mercator projection coordinates (x, y) are transformed into tile coordinates (X, Y) for level Z via:
where
R is the Earth’s radius and
INT expresses taking the largest integer that does not exceed the numerical value in the bracket.
The web Mercator projection coordinates (x, y) and the tile coordinates (X, Y) for level Z correspond to PDF user coordinates (
Ux,
Uy) of the PDF tile map via
where
;
K is the map scale denominator for level Z (for example, the corresponding map scale is 1:50,000 when Z = 3, thus
K = 50,000); and
d is defined in Equation (2).
3.2. PDF Tile Map Storage
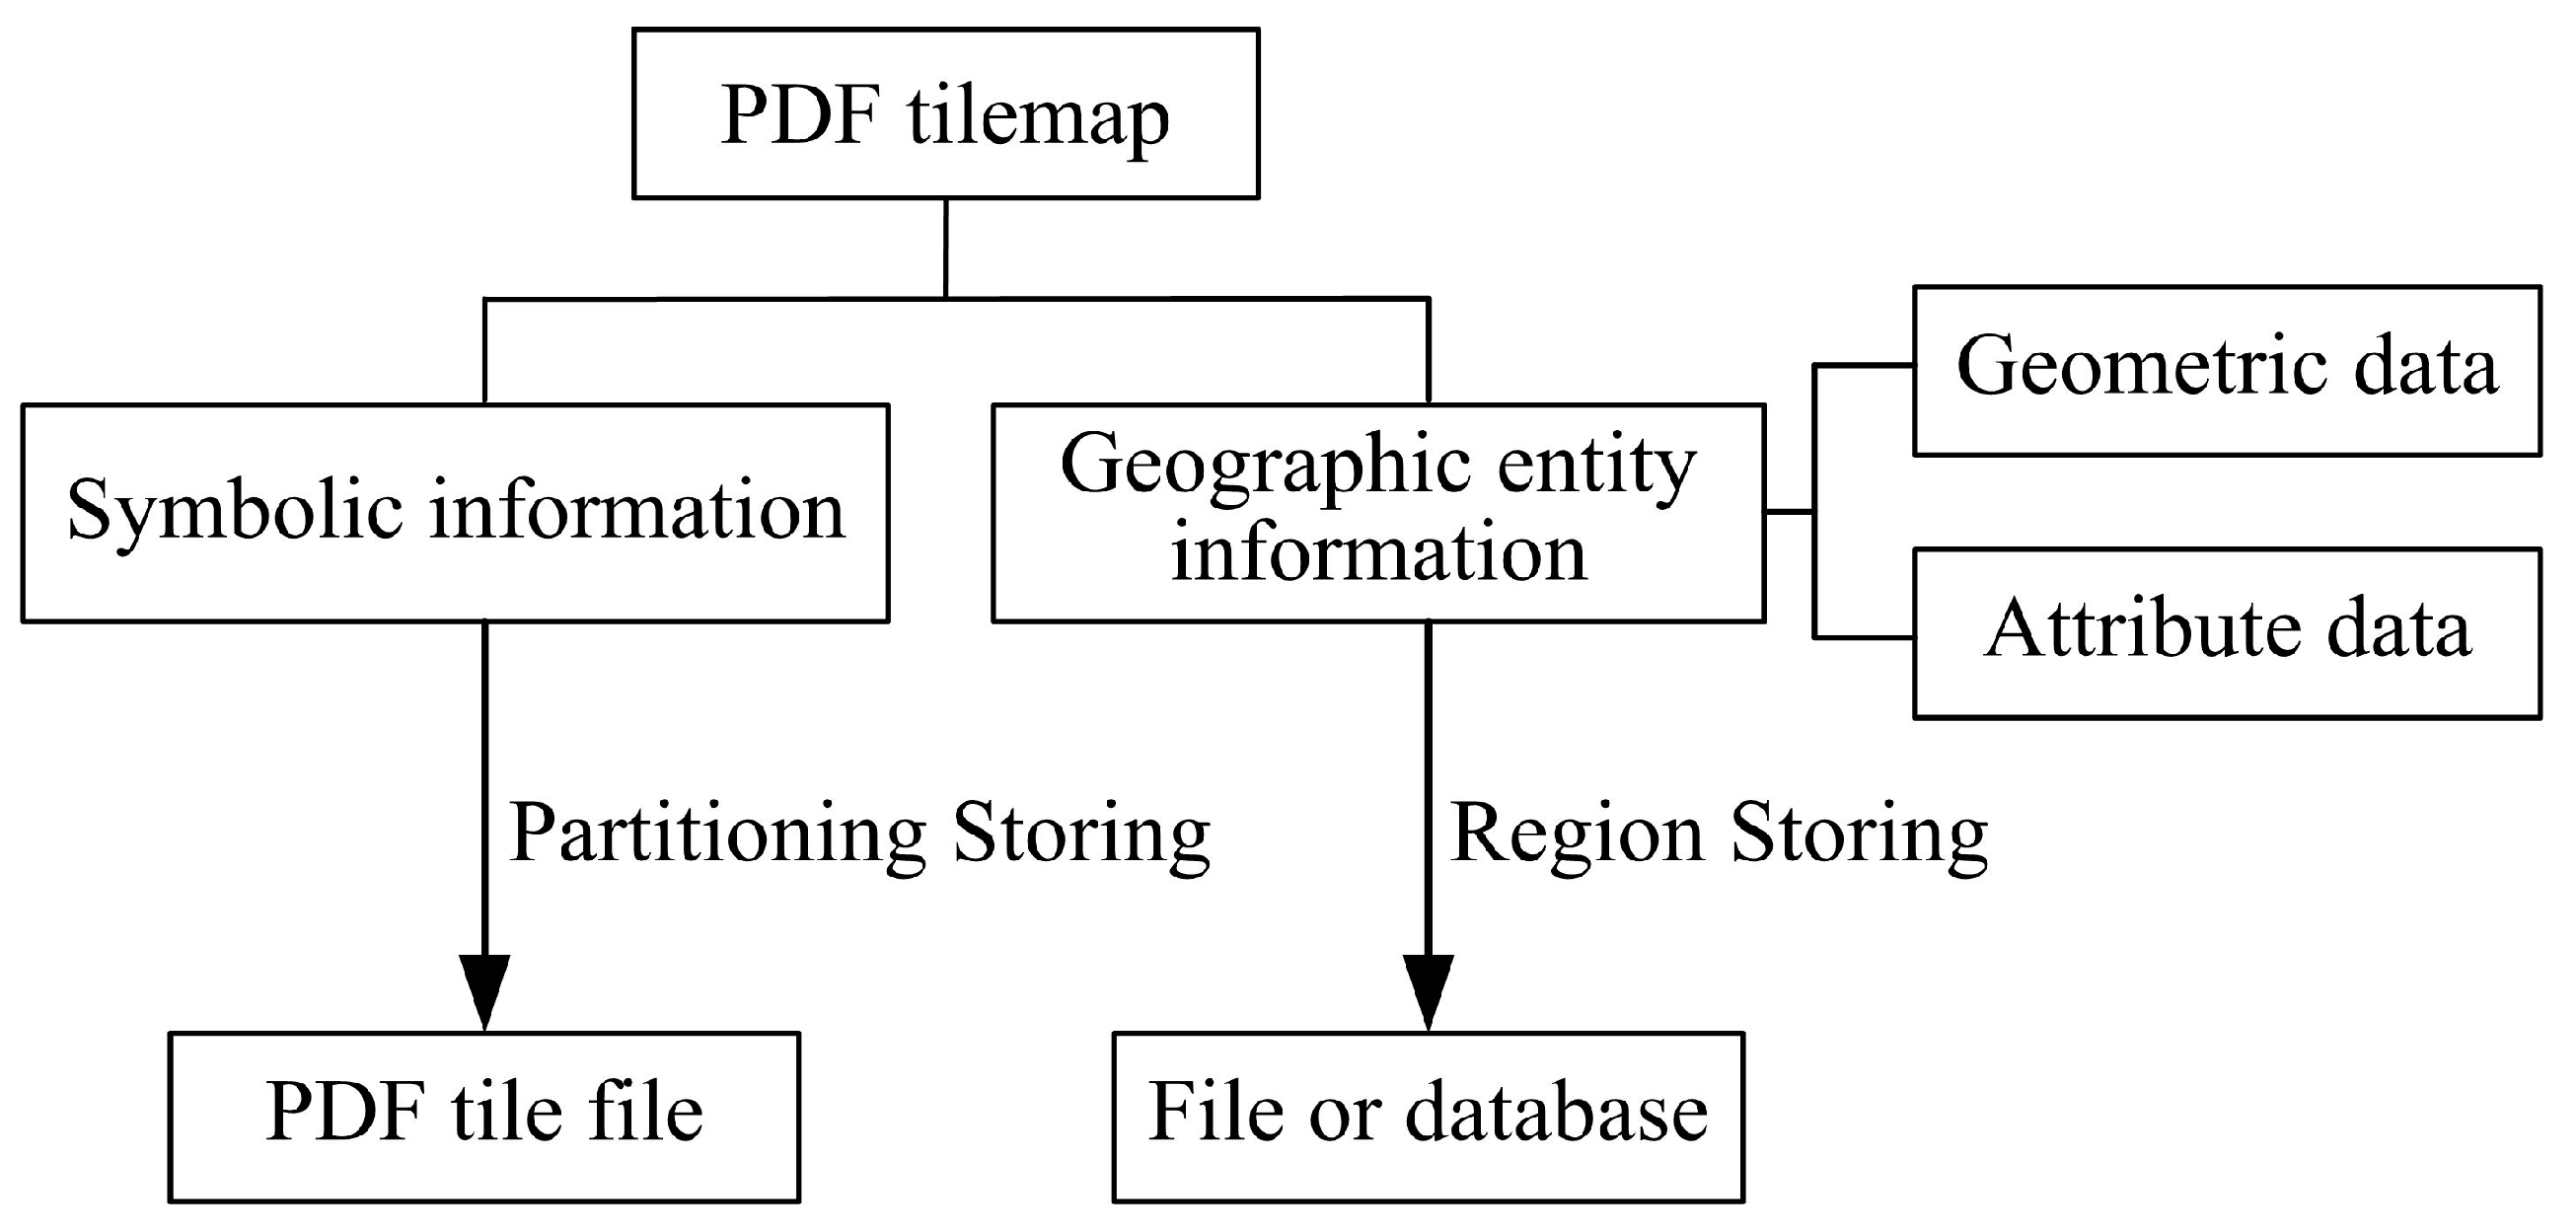
PDF tile maps consist of symbolic graphic information and geographic entity information, as shown in
Figure 4. Symbolic graphic information based on the digital cartographic model (DCM) is mainly composed of cartographic representation information for geographic features. Symbolic graphic information is stored in blocks according to the tile pyramid model and is mainly used for spatial cognitive representation. Each block is stored as a PDF tile file. Geographic entity information based on the digital landscape model (DLM) is mainly used for GIS spatial analysis. Geographic entity information includes geometric and attribute data of geographic features. Geographic entity information is stored for a region using object-oriented modeling technology. Geometric data is not restricted by the region of the PDF tile map pyramid partitioning.
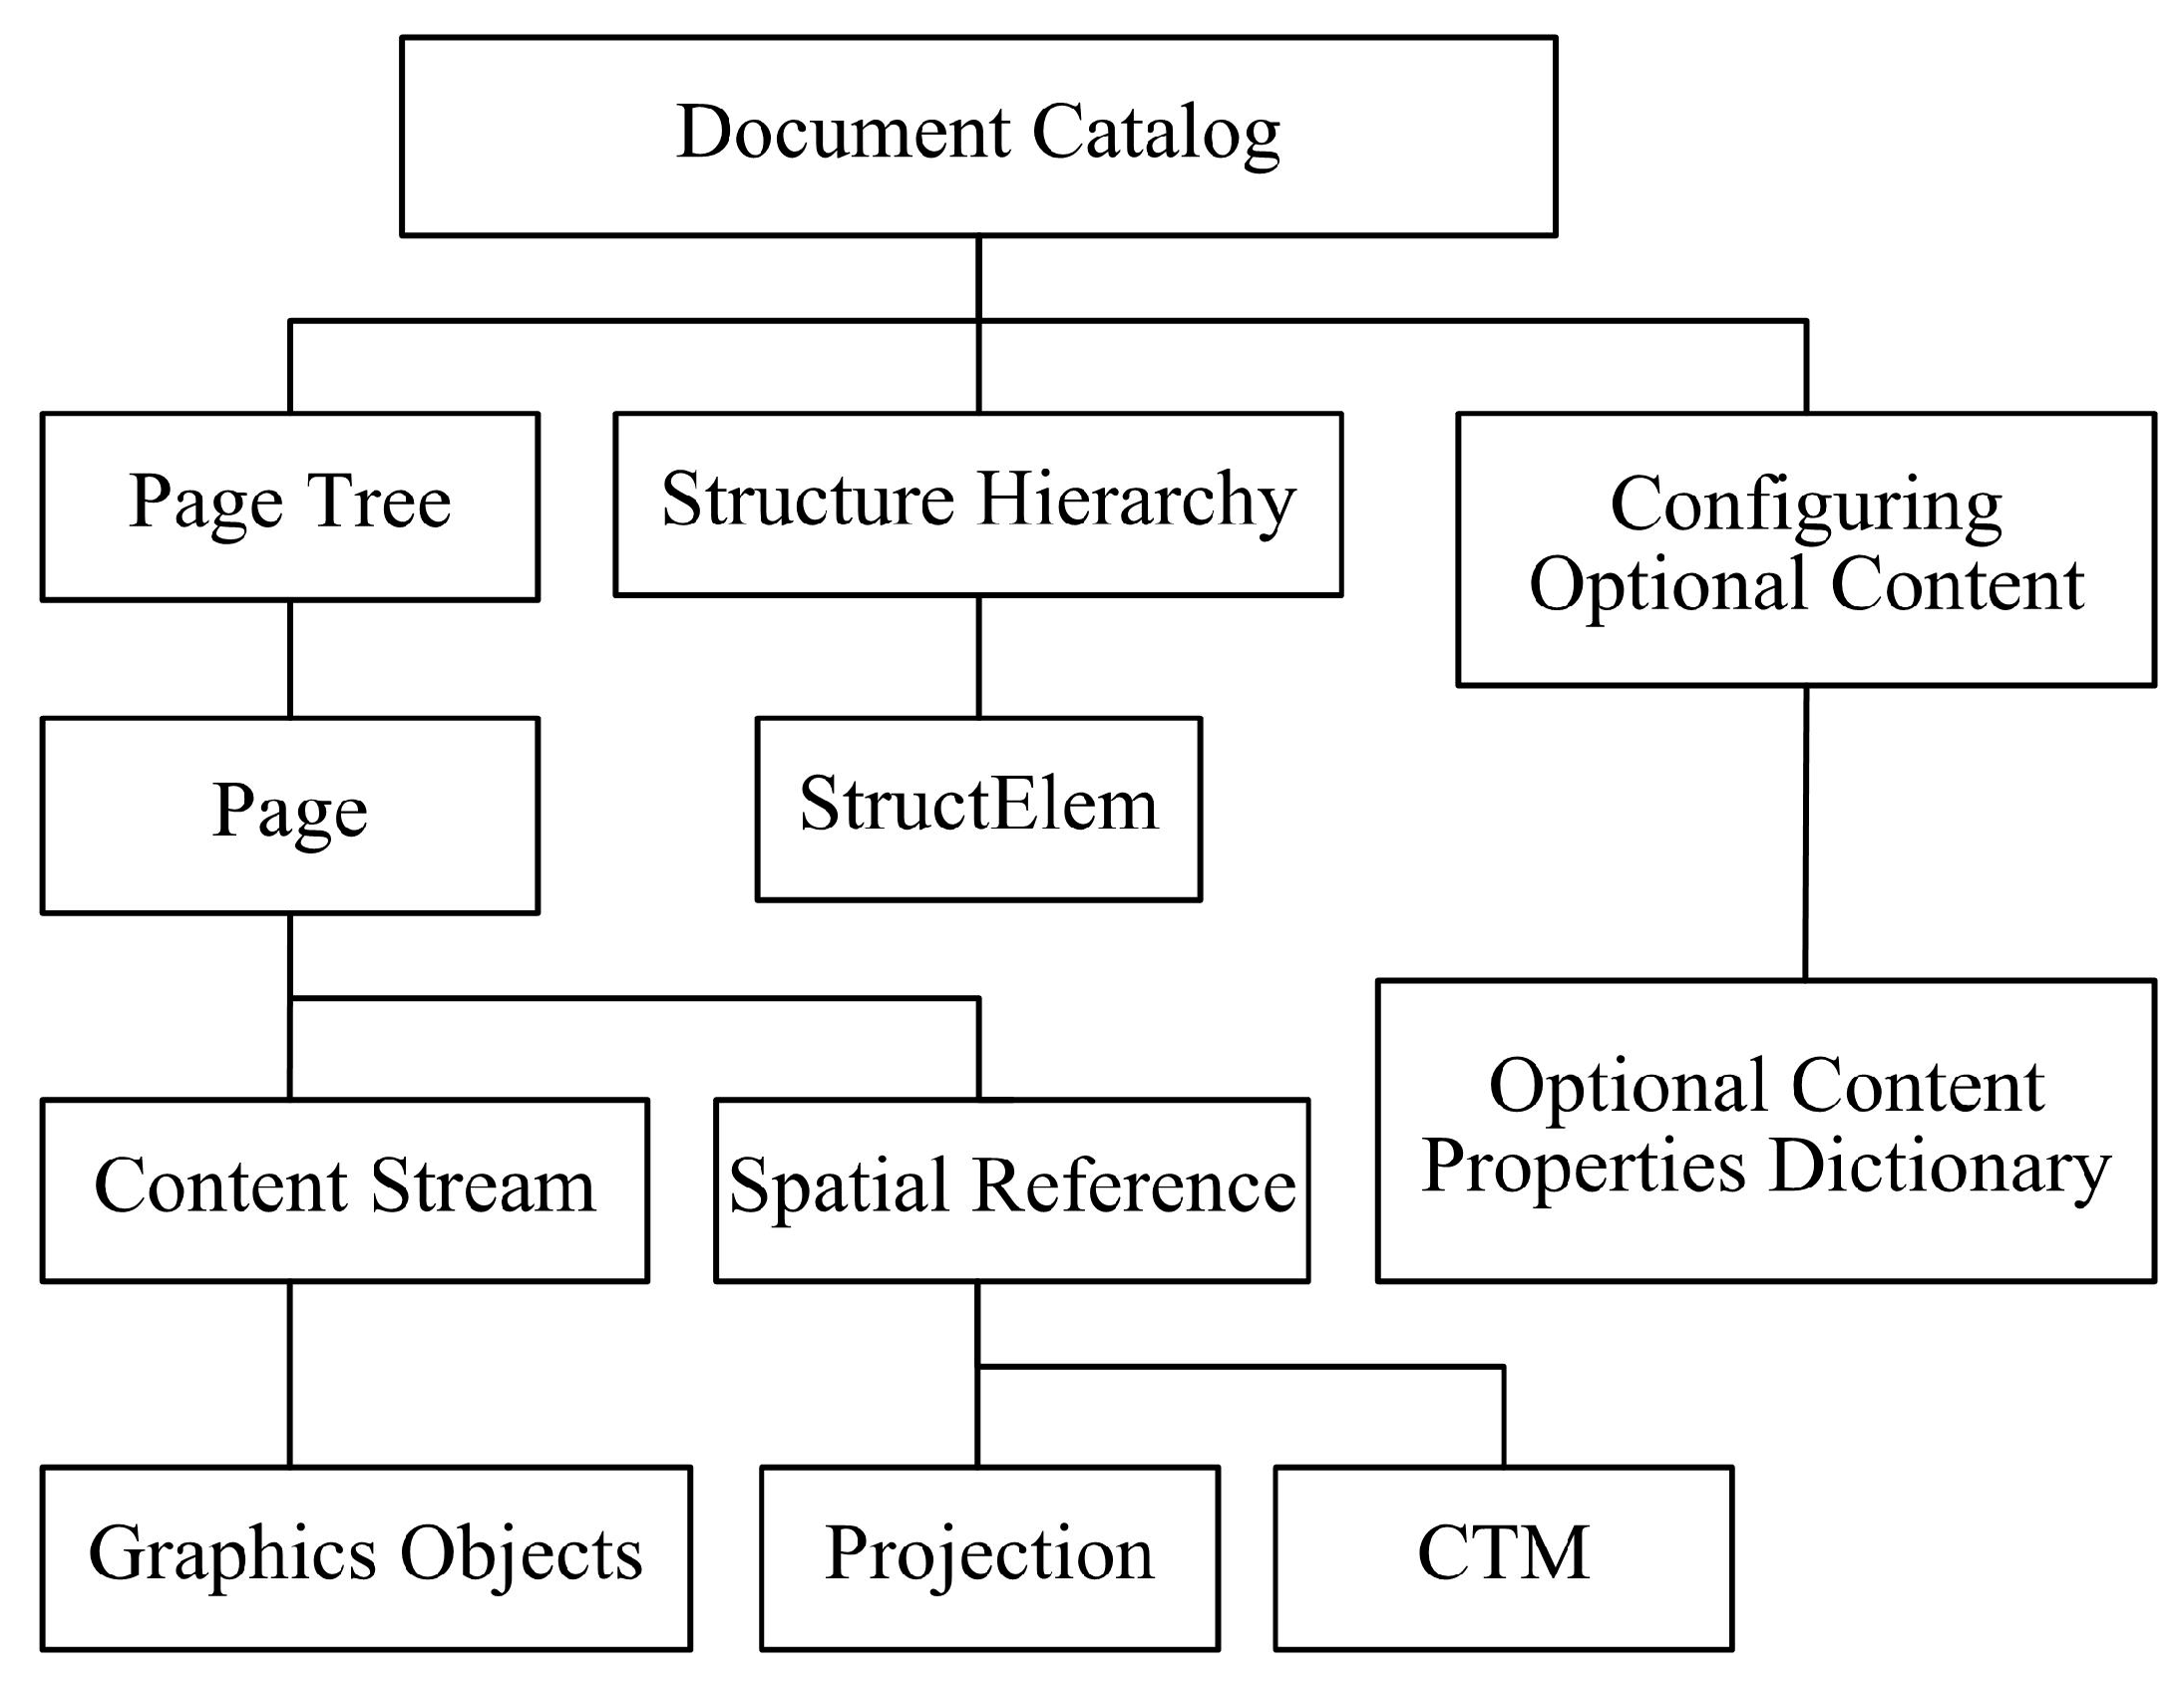
The PDF tile file for a single tile follows the PDF format standard, and its document presents a tree structure. The Document Catalog is taken as the root node, and its child nodes include the Page Tree, Structure Hierarchy, and Configuring Optional Content, as shown in
Figure 5.
The page tree only has one child node, page, which includes the content stream and spatial reference. All symbolic information is stored in the content stream, including a series of graphics objects. A graphics object is a command that draws a graphics element onto the page, including path, text, external, associated image, and shading objects. The spatial reference is used to store conversion parameters for spatial reference so as to realize transformation among geographic coordinates, projection coordinates, and page coordinates. The optional VP (Viewport) entry in a page dictionary, specifies an array of viewport dictionaries that allow different spatial references specified by a measure entry to be used in different areas of the page, if necessary. The main child nodes of spatial reference include the map projection (Projection) and coordinate transformation matrix (CTM).
The logical structure of a document is described by a hierarchy of objects called the structure hierarchy or structure tree. Structure hierarchy is used to store attribute information of geographic elements whose geometric information is stored in the content stream. The Kth entry specifies the immediate children of the structure tree root, which are the structure elements (StructElem). Any graphics object that corresponds to a structure element may have associated user properties, which can be used to contain the attribute information of geographic elements. The operators of the graphics object are bracketed as a marked-content sequence between BDC (Begin a Marked-content Sequence) and EMC (End a Marked-content Sequence) operators. The marked-content sequence contains a property list containing the MCID (Marked-content Identifier) entry, which is an integer that uniquely identifies the marked-content sequence within its content stream.
The configuring optional content node includes the optional content properties dictionary (OCProperties), which is used to store graphics layer information of maps and realize the layer display control of symbolic information. According to layer information of map elements, the OCProperties attribute values of the graphics layer resources are set, including graphics layer definition (names and property fields), graphics layer order, and the display switch.
3.3. Organization of PDF Tile Map Data
Although the PDF tile file of a single tile is small, the total data volume of the PDF tile map is very large. For example, the global data volume of a level-3 PDF tile map, with a corresponding map scale of 1:50,000, can reach 414 (268,435,456) PDF tile files, with a data size of 51.2 TB (based on an average of 200 KB for each PDF tile file). Similarly, the global data volume of a level-5 PDF tile map, with a corresponding map scale of 1:10,000, can reach 418 (68,719,476,736) PDF tile files, or a data size of about 12.8 PB. For such large data sizes, if each PDF tile file is independently stored, this will bring about a large quantity of small files. Since the sequential access capabilities of a computer hard disk are far greater than random access capabilities, and a large quantity of scattered PDF tile files will be discontinuously stored on the disk, the read–write operation is subject to random access, which results in very slow file transmission and greatly affects map serviceability when the PDF tile map is accessed, read, distributed, or copied.
In order to solve the above problems, a step-by-step partitioning model is used in this paper to implement data organization of the PDF tile map. This approach is specified as follows: the map scope in
Figure 1 is partitioned step by step, and the scope of each region corresponds to 4096 tiles. An SQLite (
https://www.sqlite.org/) light-duty database is used to package and store PDF tile files corresponding to tiles contained in each region, as shown in
Figure 6.
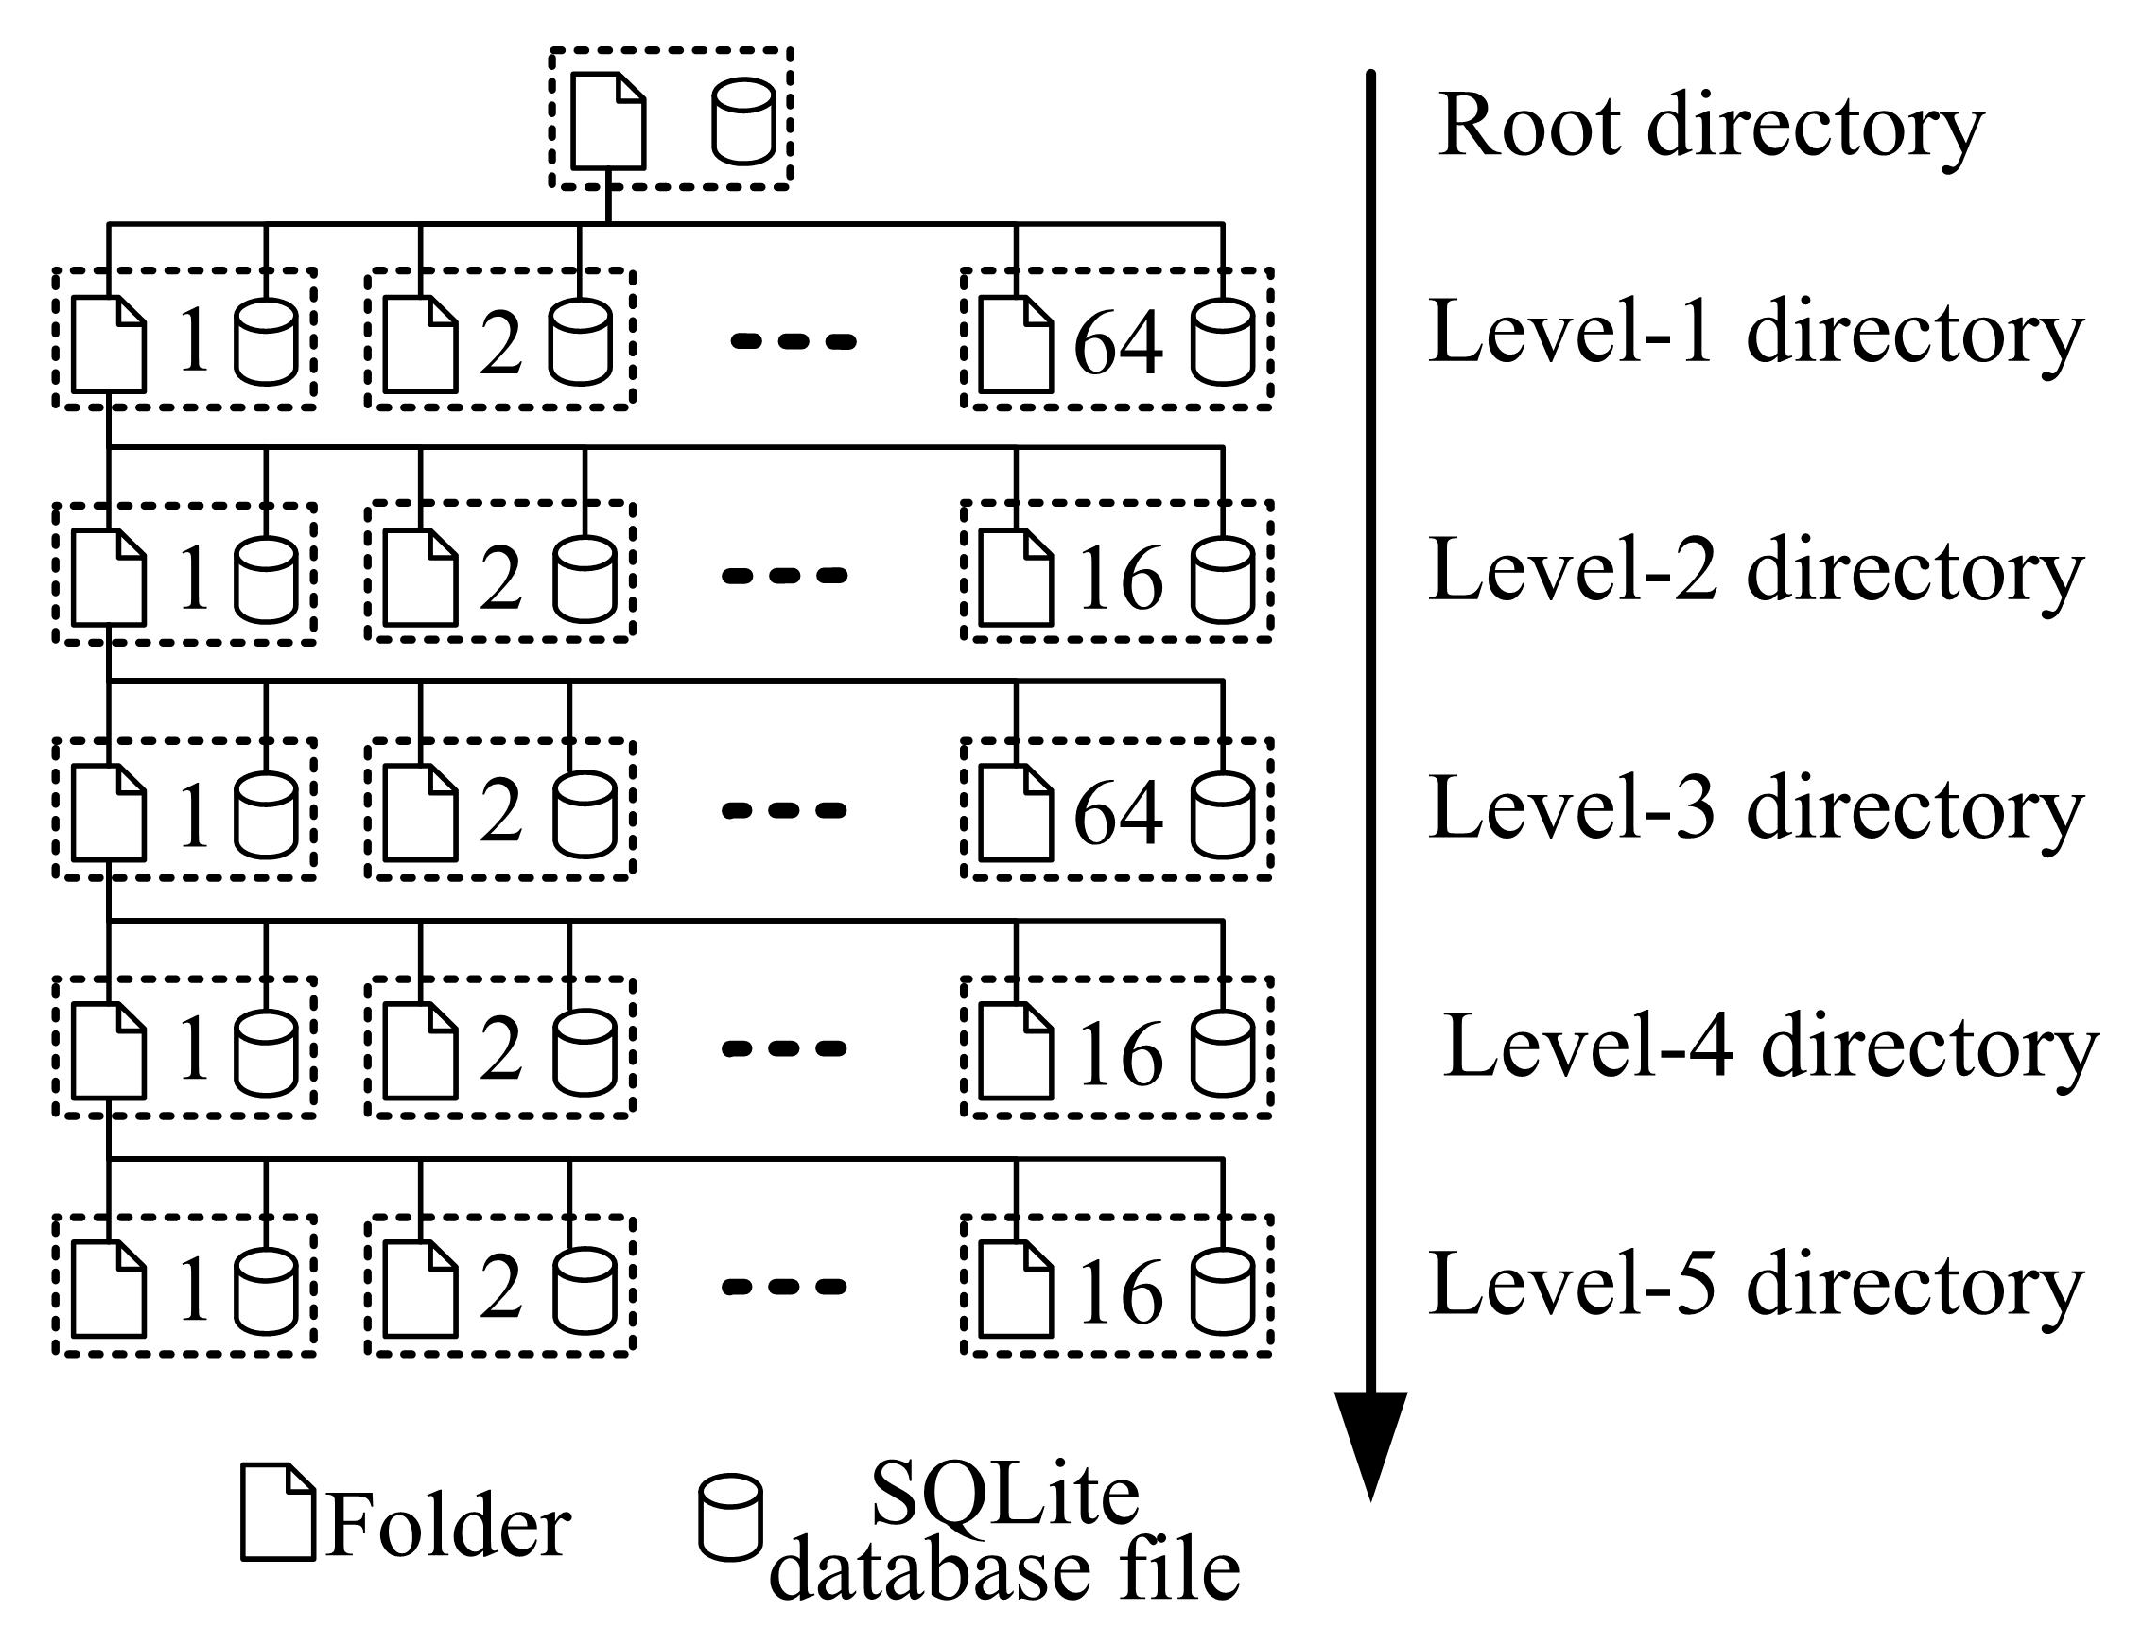
PDF tile map storage includes the storage of PDF tile file data corresponding to tiles at all levels and the storage of the SQLite database files for geographic entity information. SQLite database files include one PDF tile file list and one geographic entity list, where the PDF tile file list stores tile coordinates and the binary data flow of PDF file, while the geographic entity list stores the geometric and property data of the geographic entity. The file catalog organization model of a PDF tile map is shown in
Figure 7, and the implementation method of the file catalog organization is as follows:
(1) Establish a PDF tile map root directory, equally divide the map scope in
Figure 1 into 64 regions and establish the index as level-1 regions. For each level-1 region, establish a new folder and an SQLite database file, which are named according to the region, and store them in the root directory as the corresponding level-1 catalog and SQLite database file. Then, store the PDF tile files corresponding to the 4096 level-1 tiles contained in each region in the SQLite database file corresponding to this region.
(2) Equally divide each level-1 region into 16 regions and establish the index for the level-2 regions. For each level-2 region, establish a new folder and an SQLite database file, which are named according to the region, and store them in the level-1 catalog and SQLite database file corresponding to the region. Then, store PDF tile files corresponding to the 4096 level-2 tiles contained in each level-2 region in the SQLite database file corresponding to this region.
(3) Organize level-3, -4 and -5 PDF tile maps in the same way. Store the index information of all regions in the newly established SQLite database file and store them as index files of the PDF tile map in the file catalog.
(4) Divide geographic entity information into different regions step-by-step, and store geometric and property data of the geographic entity at the corresponding scale; at a certain level in the geographic entity data list of the SQLite database corresponding to the appropriate region.
3.4. Dynamic Generation and Updating of the PDF Tile Map
3.4.1. PDF Map Clipping
A PDF page includes five types of graphics objects: a text object (Text), path object (Path), embedded image object (Image), shading object (Shading), and external object (XObject). The path object consists of several linear segments and a cubic Bezier curve, and the path can be used to draw lines and determine the shape of the region to be filled. The main graphics object in the PDF map page is the path object, and a clipping rectangle is used for vector clipping of the path object. The method is as follows:
(1) Clipping of a path consisting of several linear segments.
If the graphic represented by the path is a polyline or polygon and the path only consists of several linear segments, classical algorithms can usually be used for the path clipping, such as the Cyrus–Beck line clipping algorithm [
39], the Liang–Barsky linear clipping algorithm [
40], the Nicholl–Lee–Nicholl linear clipping algorithm [
41], the Weiler–Atherton polygonal clipping algorithm [
42], and the Sutherland–Hodgman polygonal clipping algorithm [
43]. Schematic diagrams of the clipping of paths consisting of several linear segments are shown in
Figure 8.
The path in
Figure 8a is a polyline. From the starting point A and along the direction of the path, points 1, 3, and 5 of the polyline mark entry points into the clipping rectangular region, while points 2 and 4 mark exit points of the polyline out of the region. When the path is constructed after clipping, the entry point operator is “m” (path construction operators, begin a new subpath by moving the current point to the entry point), while the exit point operator is “1” (lowercase L, path construction operators, append a straight line segment from the current point to the exit point). The middle parts between the adjacent entry and exit point are reserved, and if the starting point is within the clipping rectangular region, then the starting point is taken as the first entry point. If the end point is inside the clipping rectangular region, then the end point is taken as the last exit point. Thus, the clipped path “1-2, 3-C-4, 5-E” is obtained. The path in
Figure 8b is a polygon. From the starting point A, entry points 2 and 4 and exit points 1 and 3 of the polygonal side line from the clipping rectangular region are obtained. If the starting point is inside the clipping rectangular region, it will be taken as the first entry point. With the first entry point as the starting point, one entry point and one exit point constitute one group along the direction of the broken line and the nodes in the middle are reserved. Thus, the polygon is constructed as “A-1-2-D-3-4-A”.
(2) Clipping of a path consisting of a cubic Bezier curve or consisting of linear segments and a cubic Bezier curve.
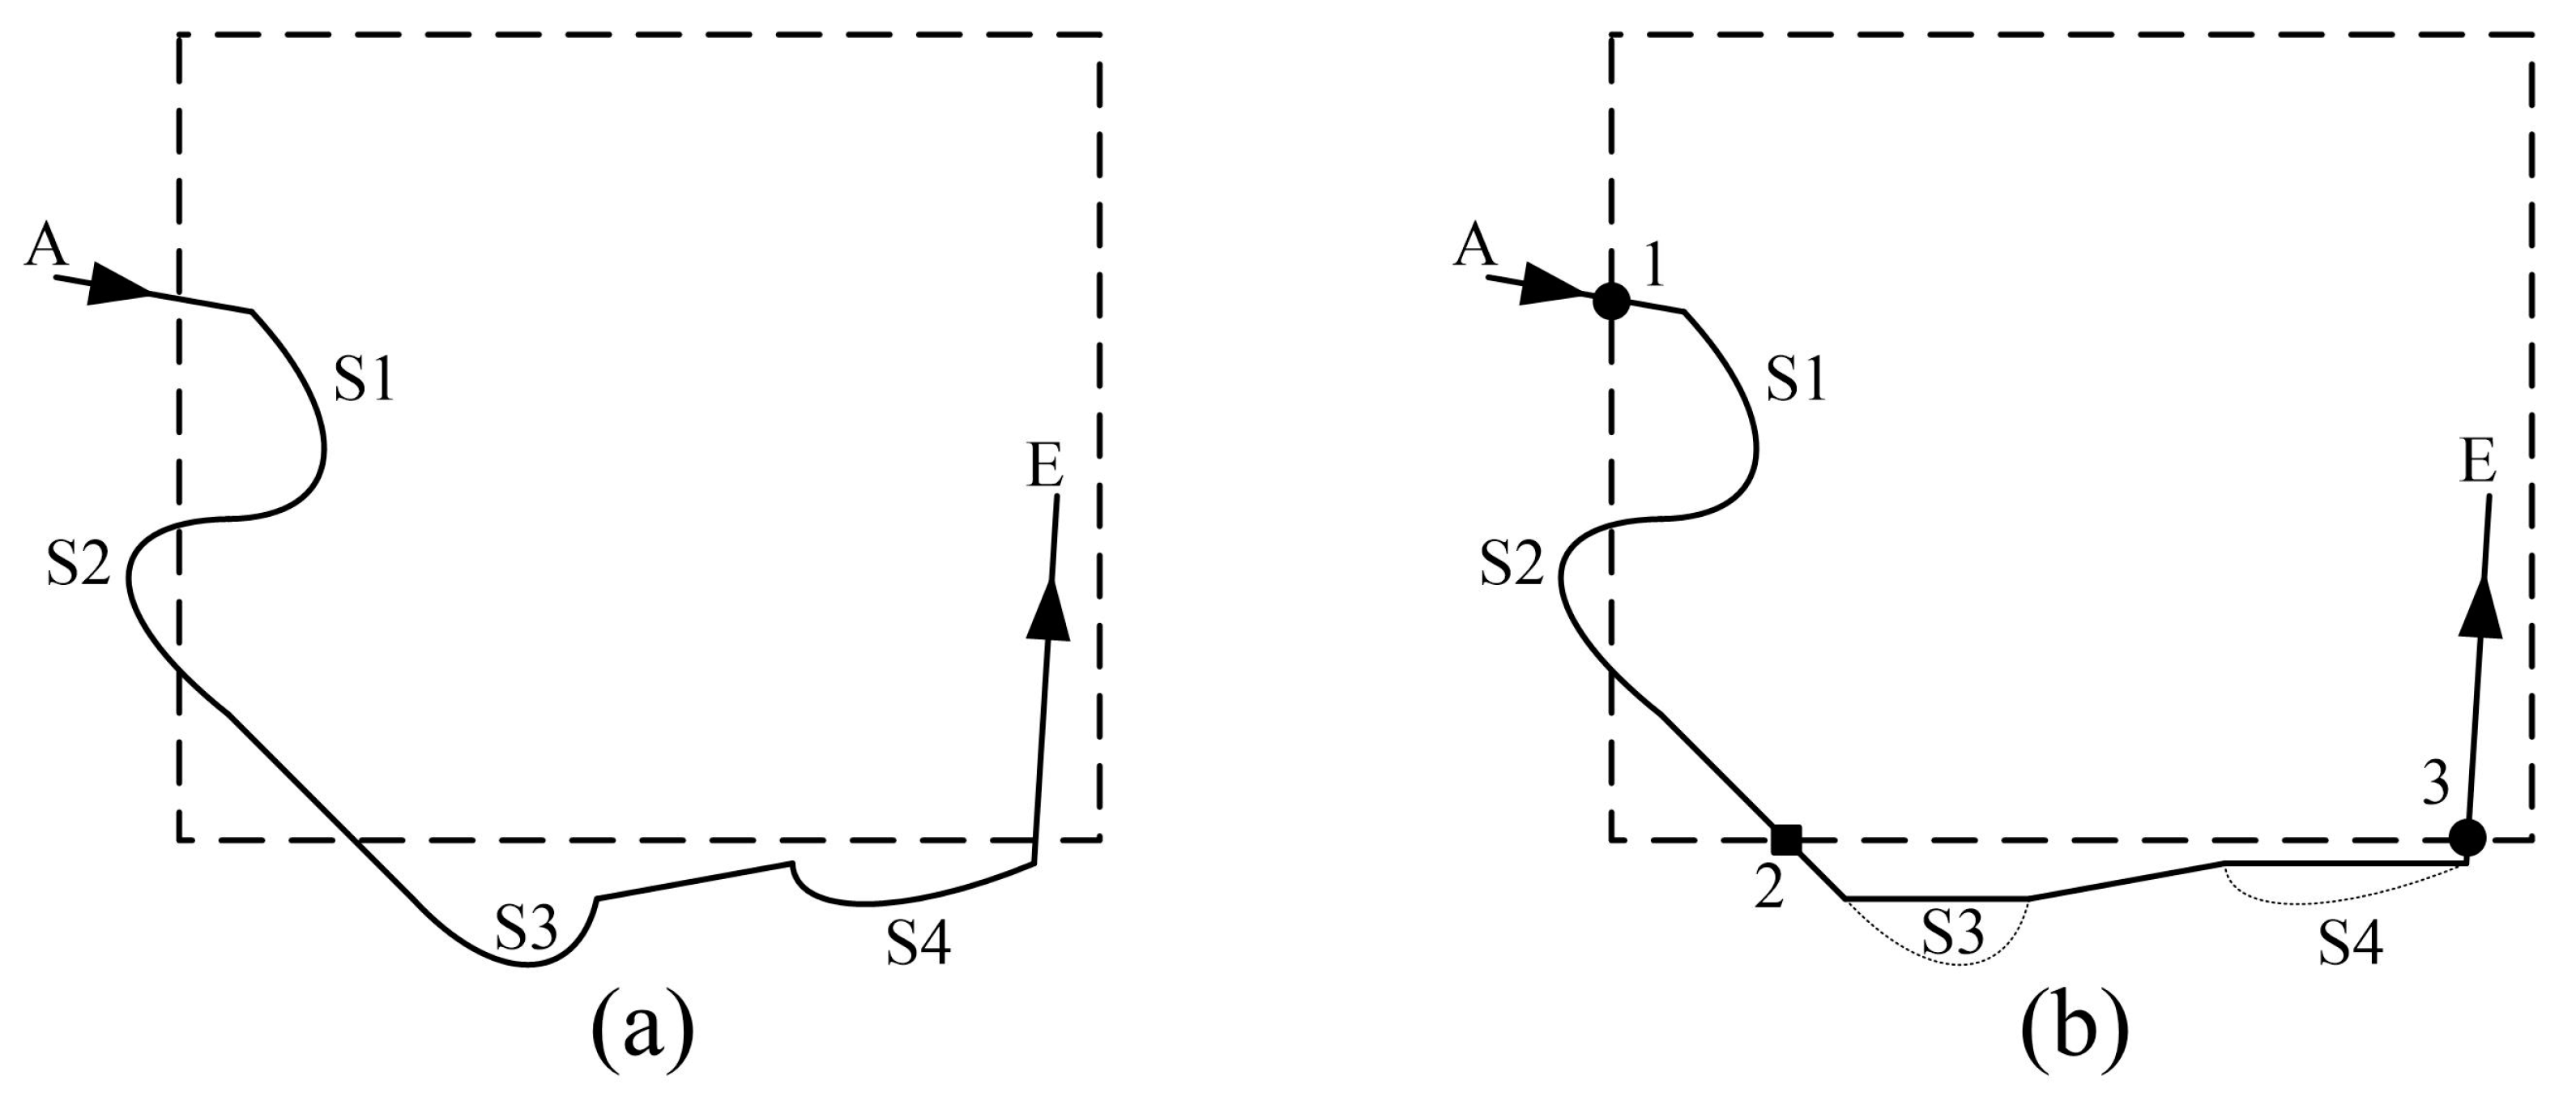
A cubic Bezier curve is taken as the unit path, and path clipping is implemented when there is no concrete calculation of the intersection point between the cubic Bezier curve and the clipping rectangle. Schematic diagrams of the clipping of paths consisting of a cubic Bezier curve or consisting of linear segments and a cubic Bezier curve are shown in
Figure 9.
In
Figure 9a, from the starting point A, the path consists of linear segments and cubic Bezier curve units S1–S4. First of all, for any cubic Bezier curve unit in the path, such as S1, its starting, ending, and control points are extracted and their minimum bounding rectangle (MBR) is calculated. If any part of the MBR is located inside the clipping rectangular region, this cubic Bezier curve unit is reserved. If the MBR is outside the clipping rectangular region, this cubic Bezier curve unit will be discarded, and its starting and end points are connected by a linear segment. In
Figure 9b, S1 and S2 are reserved, while S3 and S4 are discarded. Then from starting point A, the entry points (points 1 and 3) of the path that enter into the clipping rectangular region on a linear segment, and the exit points (point 2) that leave the region on a linear path are determined. Addition, if the end point of a reserved cubic Bezier curve unit is outside the clipping rectangular region and its next segment is a linear segment, then the end point of this cubic Bezier curve unit is taken as the exit point. If the starting point is inside the region, it will be the first entry point. If the end point is inside the region, it will be the last exit point. Finally, the entry point operator is “m” and the exit point operator is “1”, and the middle parts between the neighboring entry and exit point are reserved. Thus, the clipped path “1-S1-S2-2, 3-E” is obtained.
3.4.2. PDF Map Splicing
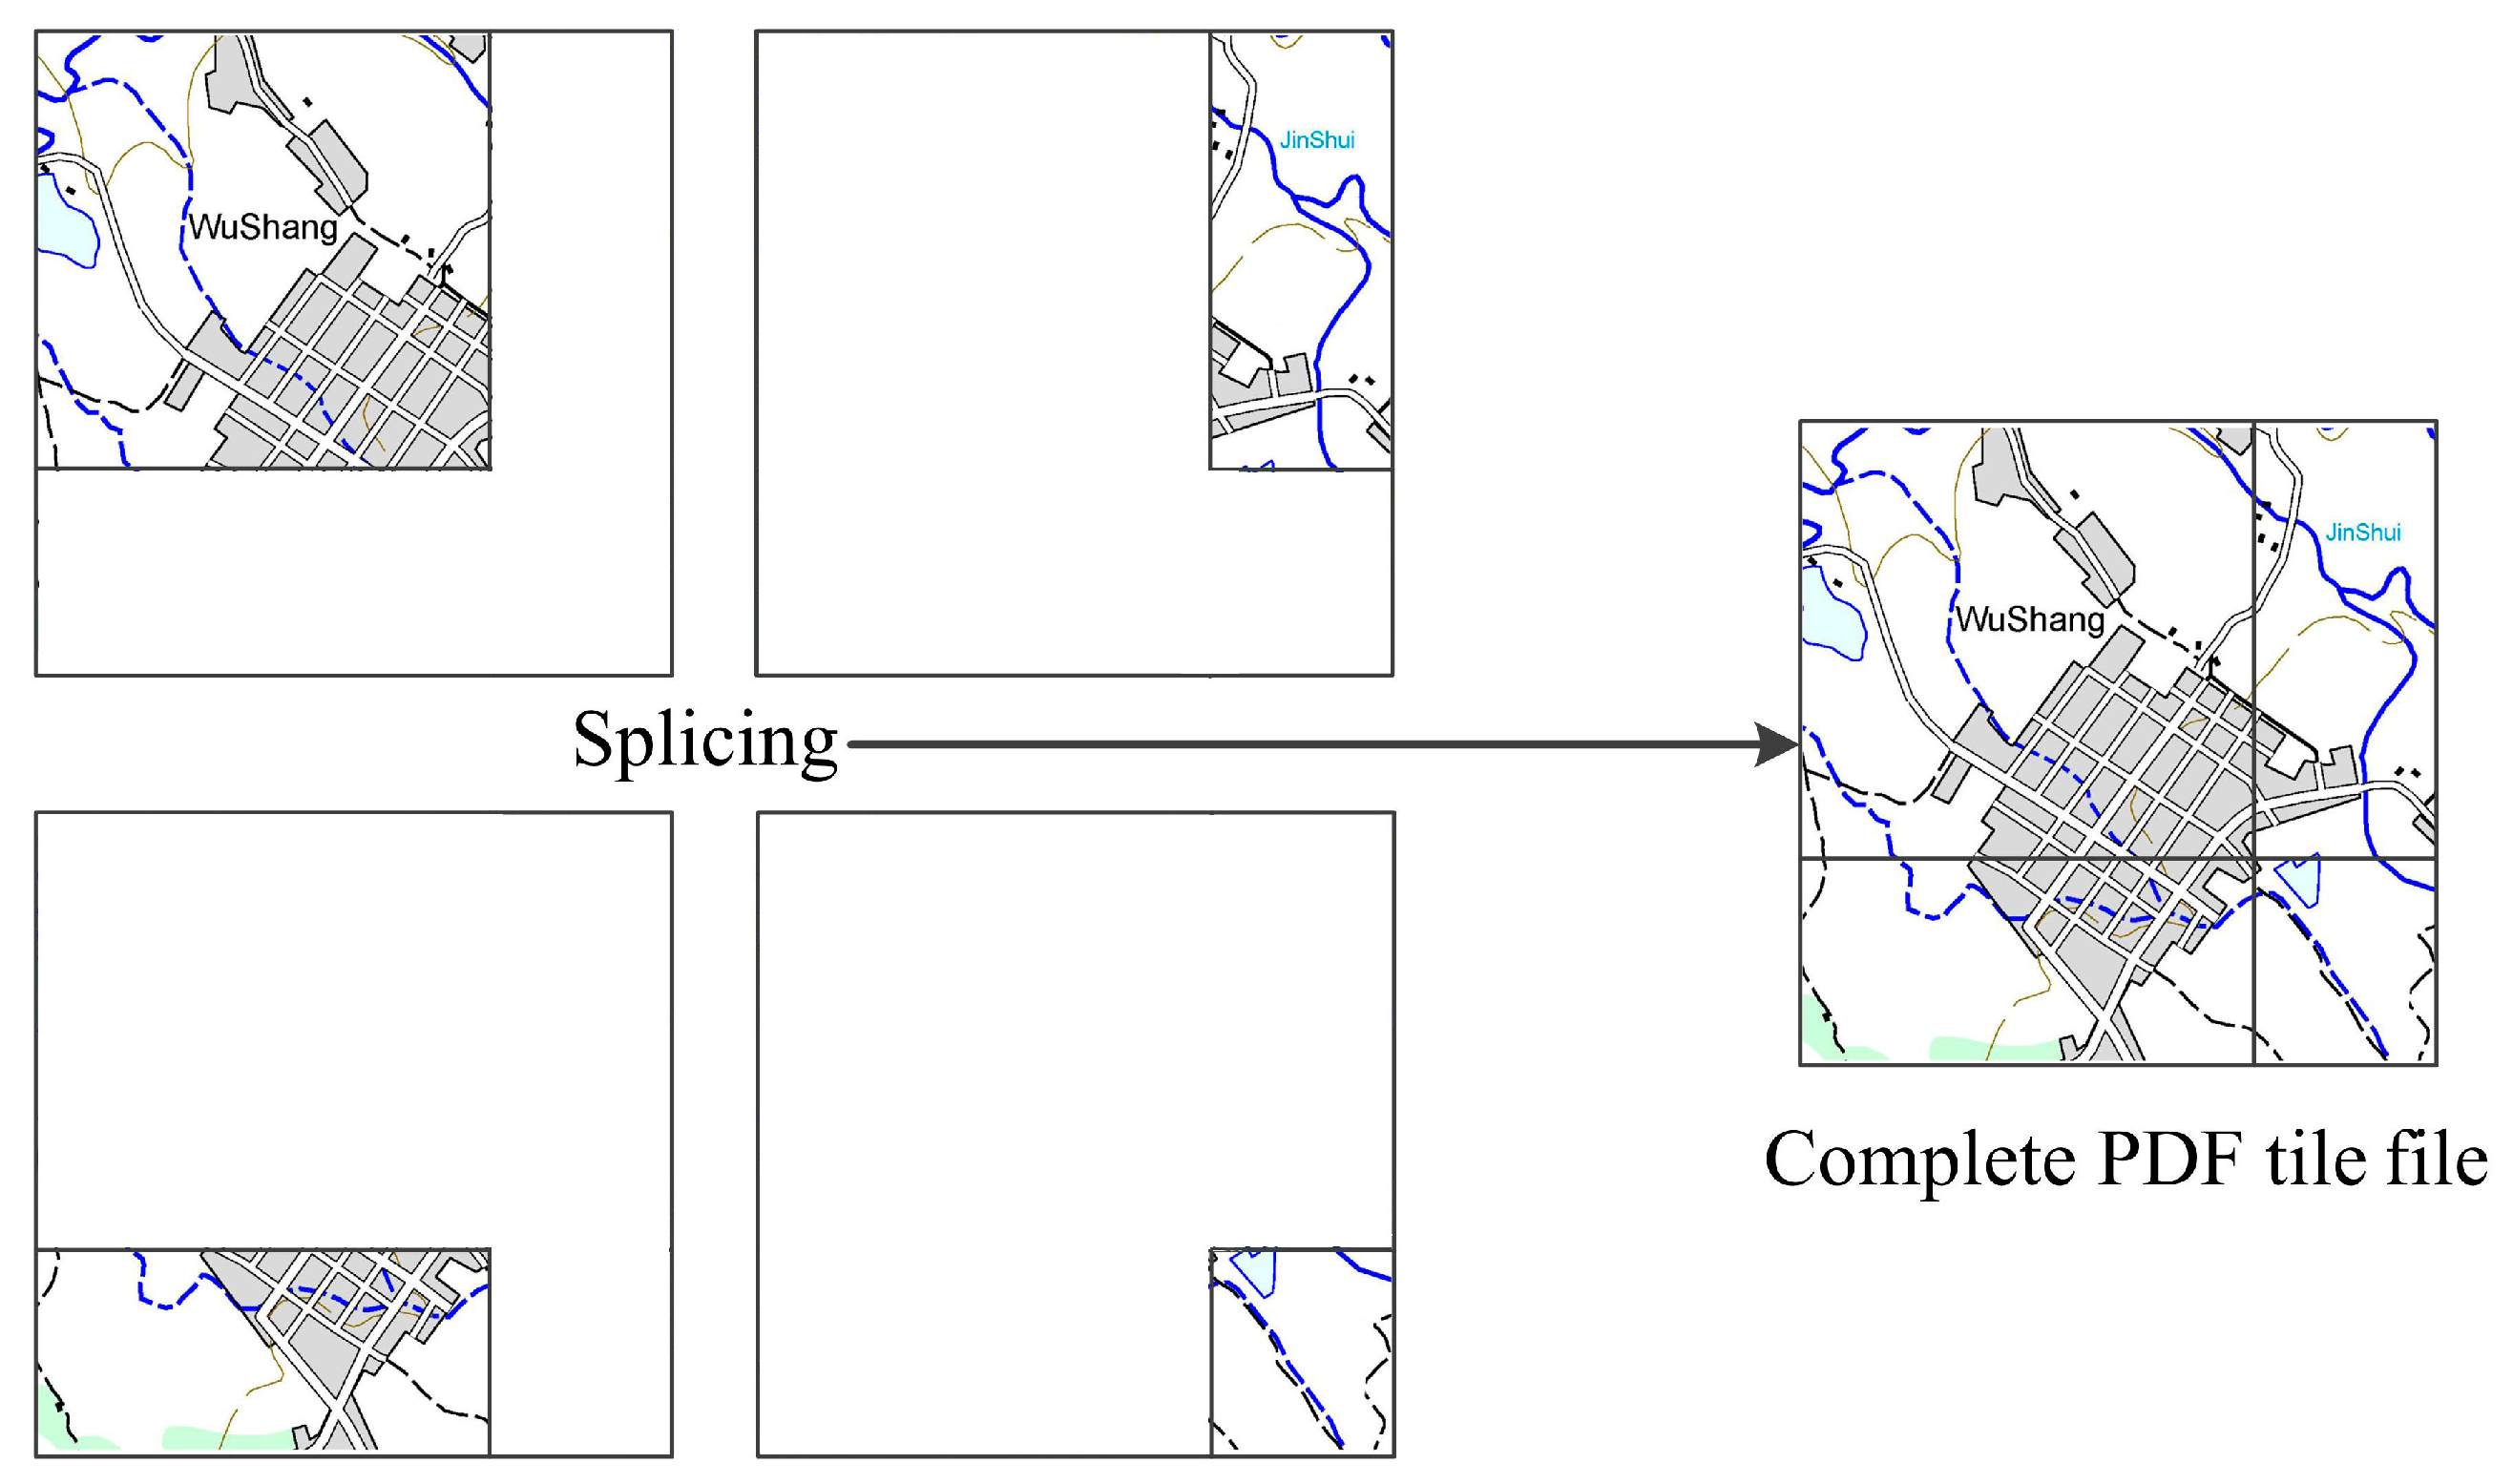
As graphic element contents in one PDF tile file may come from the neighboring two or four PDF maps which are obtained by clipping each PDF map, it is necessary to carry out splicing for same tile-encoded PDF tile files. For instance, as shown in
Figure 10, when a tile rectangle is intersected by inner border rectangles of four neighboring PDF maps, and four PDF tile files with the same tile coordinates are obtained after clipping, then splicing treatment will be needed to splice the four PDF tile files and obtain a complete PDF tile file.
3.4.3. The Process of Generation and Updating
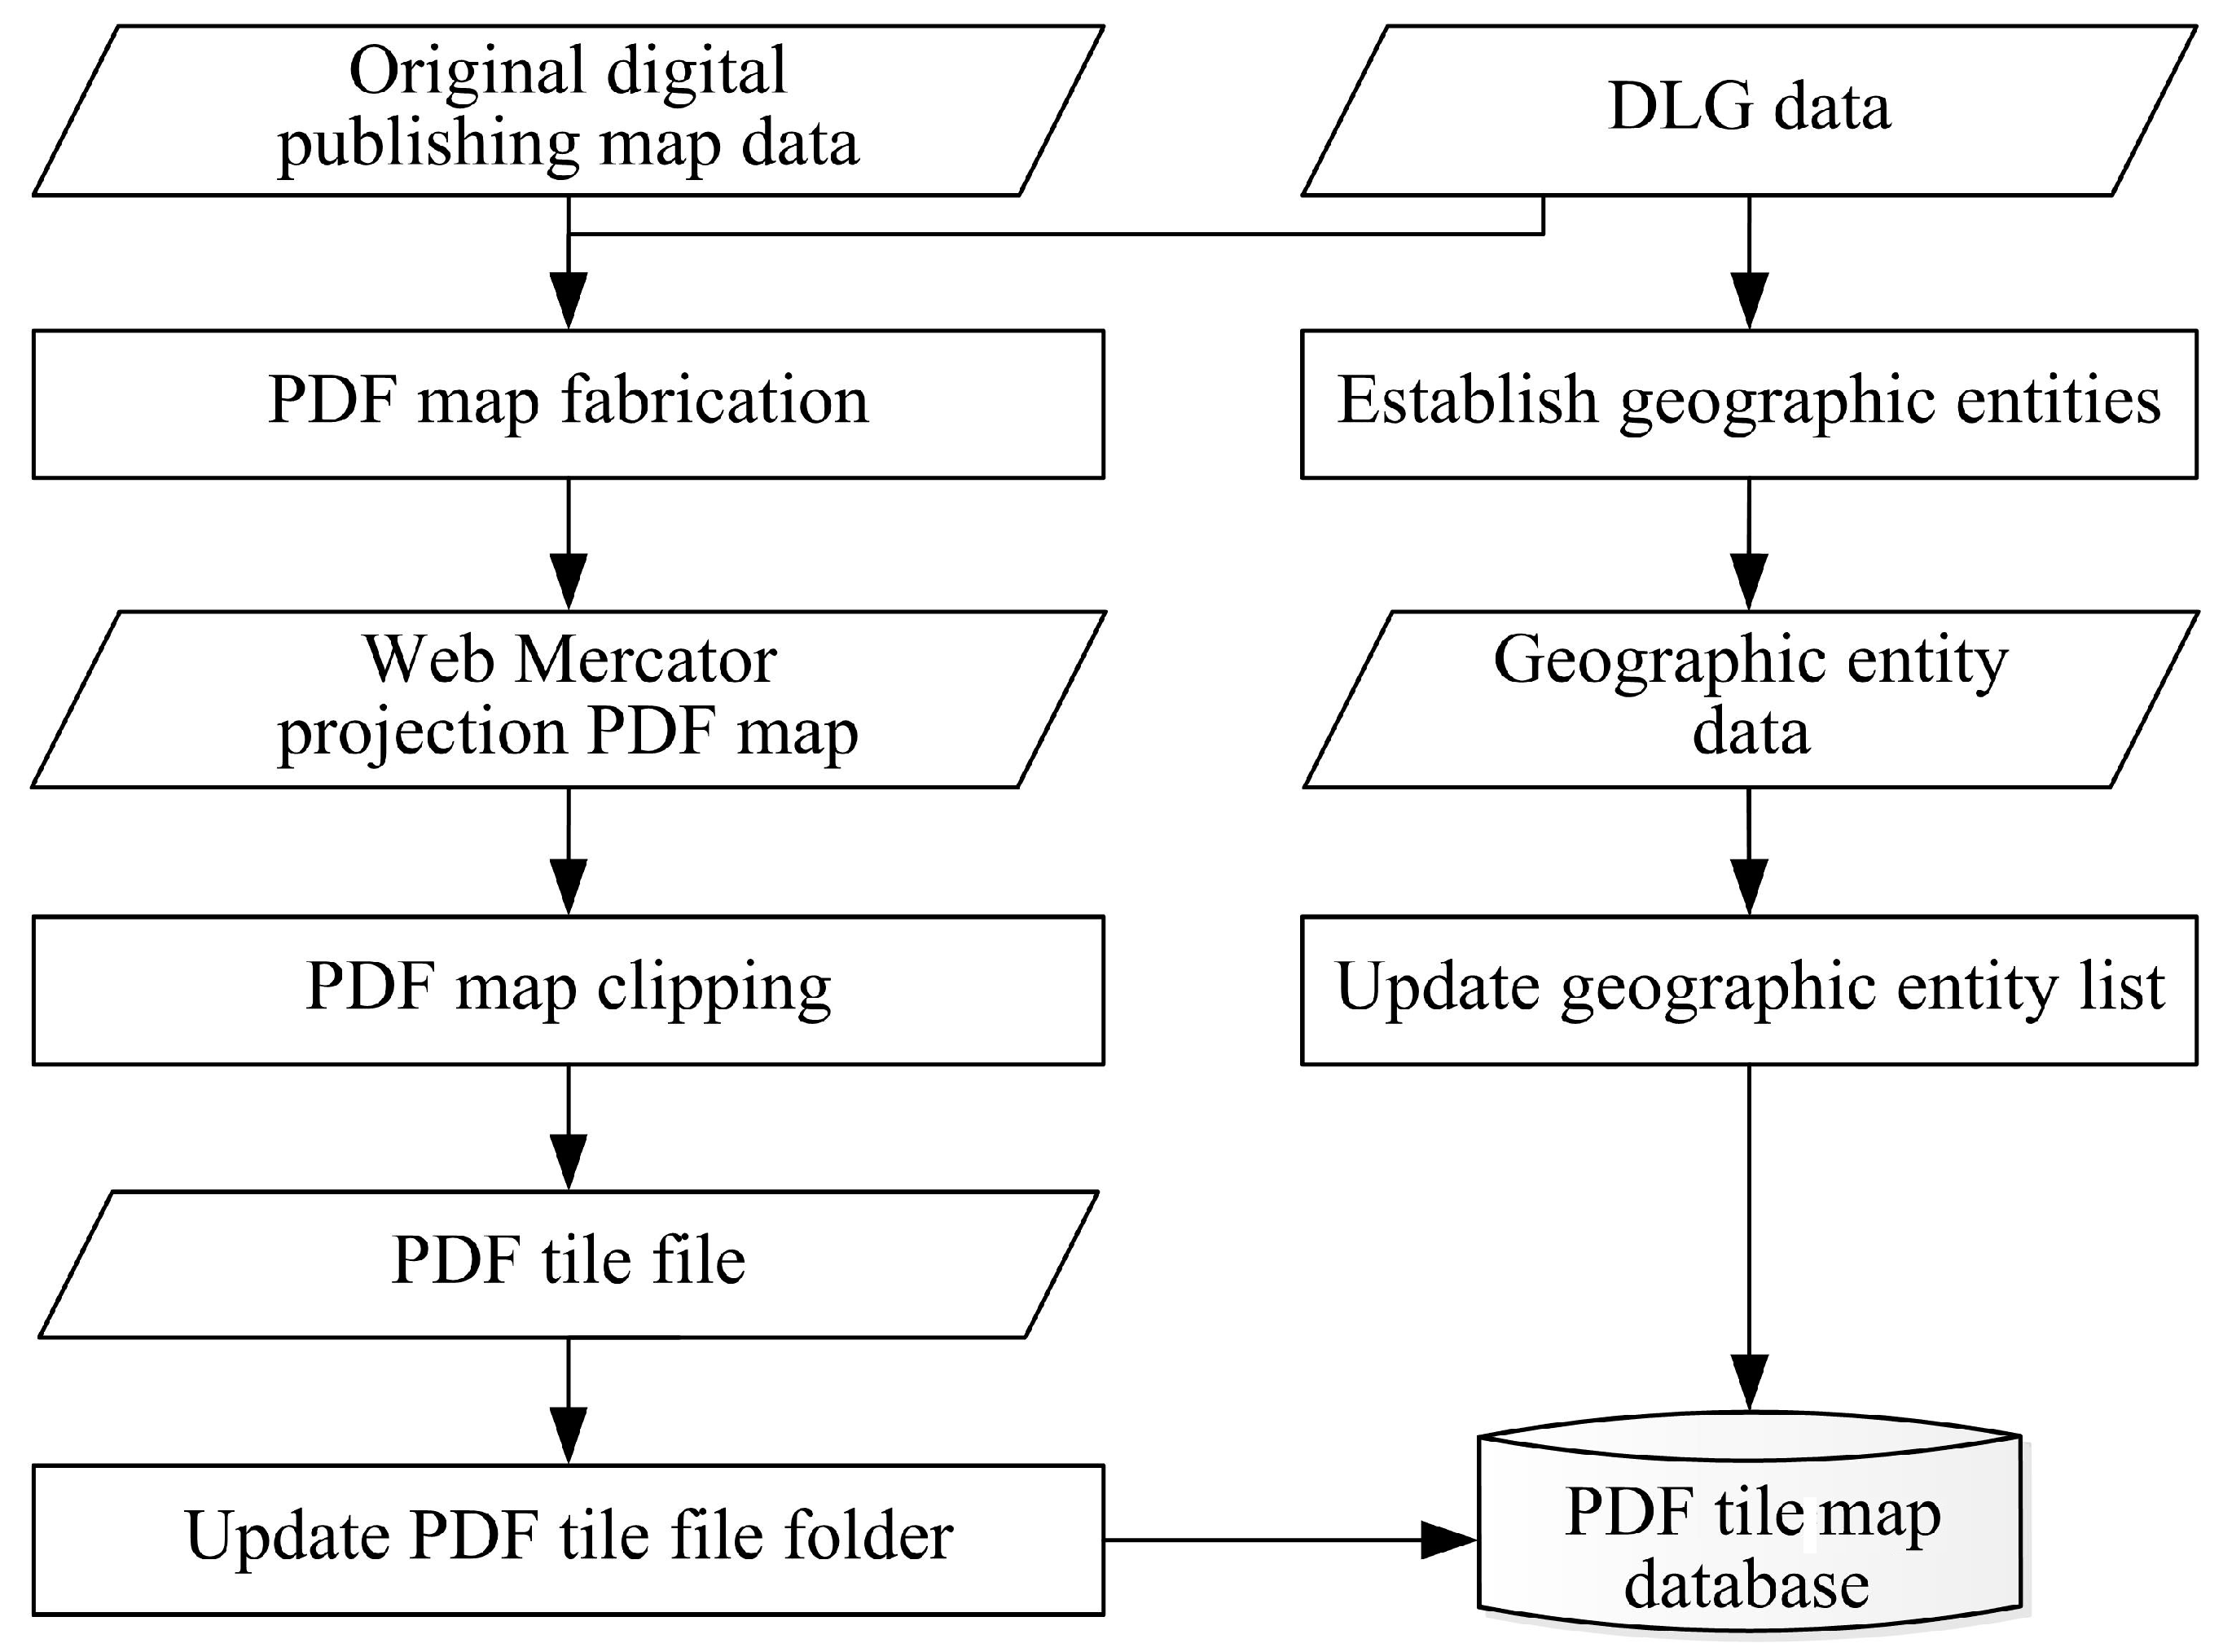
Topographic maps, projection drawings of surface relief forms with surface feature locations and shapes displayed on a horizontal plane, are indispensable tools for economic construction, national defense, and scientific research. Additionally, topographic maps contain fundamental data for compiling all kinds of ordinary maps, thematic maps, and atlases on small scales. The main data source used to fabricate a PDF tile map is the topographic map. According to the PDF tile map pyramid rules in
Table 1, original digitally published topographic maps of scales of 1:1,000,000; 1:250,000; 1:50,000; 1:10,000; and 1:2,000, as well as DLG (digital line graphic) result data are used to realize dynamic generation and updating of the PDF tile map. A schematic of the generation and updating is shown in
Figure 11.
(1) Original digitally published topographic maps and DLG result data are used to fabricate the web Mercator projection PDF maps. EPS-format (encapsulated postscript) data of the composite digitally published maps is transformed into PDF-format data, and map orientation is determined from the DLG data, in order to generate a PDF map with spatial reference. The web Mercator projection transformation of graphics objects on the PDF map page is carried out and PDF maps of other map projections are transformed into web Mercator projection PDF maps.
(2) The web Mercator projection PDF map is clipped to generate a PDF tile file. Based on the map scale and sheet range of the PDF maps in the web Mercator projection, the tile level and tiles covered in the map sheet are calculated. For any of these tiles, the tile rectangle is used to clip the web Mercator projection PDF map and to obtain the PDF tile file corresponding to this tile.
(3) PDF tile files are used to update the PDF tile file list in the SQLite database for the PDF tile map catalog. Comparing the positional relationship between the tile rectangle corresponding to the PDF tile file and the rectangle of the web Mercator projection PDF map, allows for the generation of this PDF tile file within the map scope. If the tile rectangle is located inside the rectangle of the map sheet, tile coordinates are used to retrieve the PDF tile file list in the SQLite database and the PDF tile map catalog. Furthermore if the PDF tile file list exists, then the PDF file tile will be used to update the binary data flow of the PDF file in the PDF tile file list. If it does not exist, the PDF file will be stored in the PDF tile file list in the form of a binary data flow. The PDF tile files generated by the neighboring two or four web Mercator projection PDF maps that intersect with this tile rectangle are subjected to splicing to obtain a complete PDF tile file after clipping. This PDF tile file is then used to update the PDF tile file list.
(4) DLG data are used to establish geographic entities and update the geographic entity list in the SQLite database of the PDF tile map catalog.
Geographic entities, such as integrated realms, administrative regions, roads, settlement places, and rivers, are extracted from the DLG data, including unique identification numbers, geometric position information, and element property information of geographic entities. Coordinated relationships between geographic entities on the same scale and consistency relationships for the same geographic entity on different scales are coordinated; and geographic entity data are used to update the geographic entity list in the SQLite database of the PDF tile map catalog.
5. Conclusions
This paper proposed a PDF tile map model combined with PDF mapping technology that is suitable for a web map service with the aim of providing a new solution for vector tiles. During the methodology description, this paper introduced a PDF tile map pyramid structure, designed an organization model of PDF tile map data, and elaborated on a dynamic generation and updating method of PDF tile maps. Then, we verified the accuracy, feasibility, and properties of the map services using the proposed model through a series of experiments.
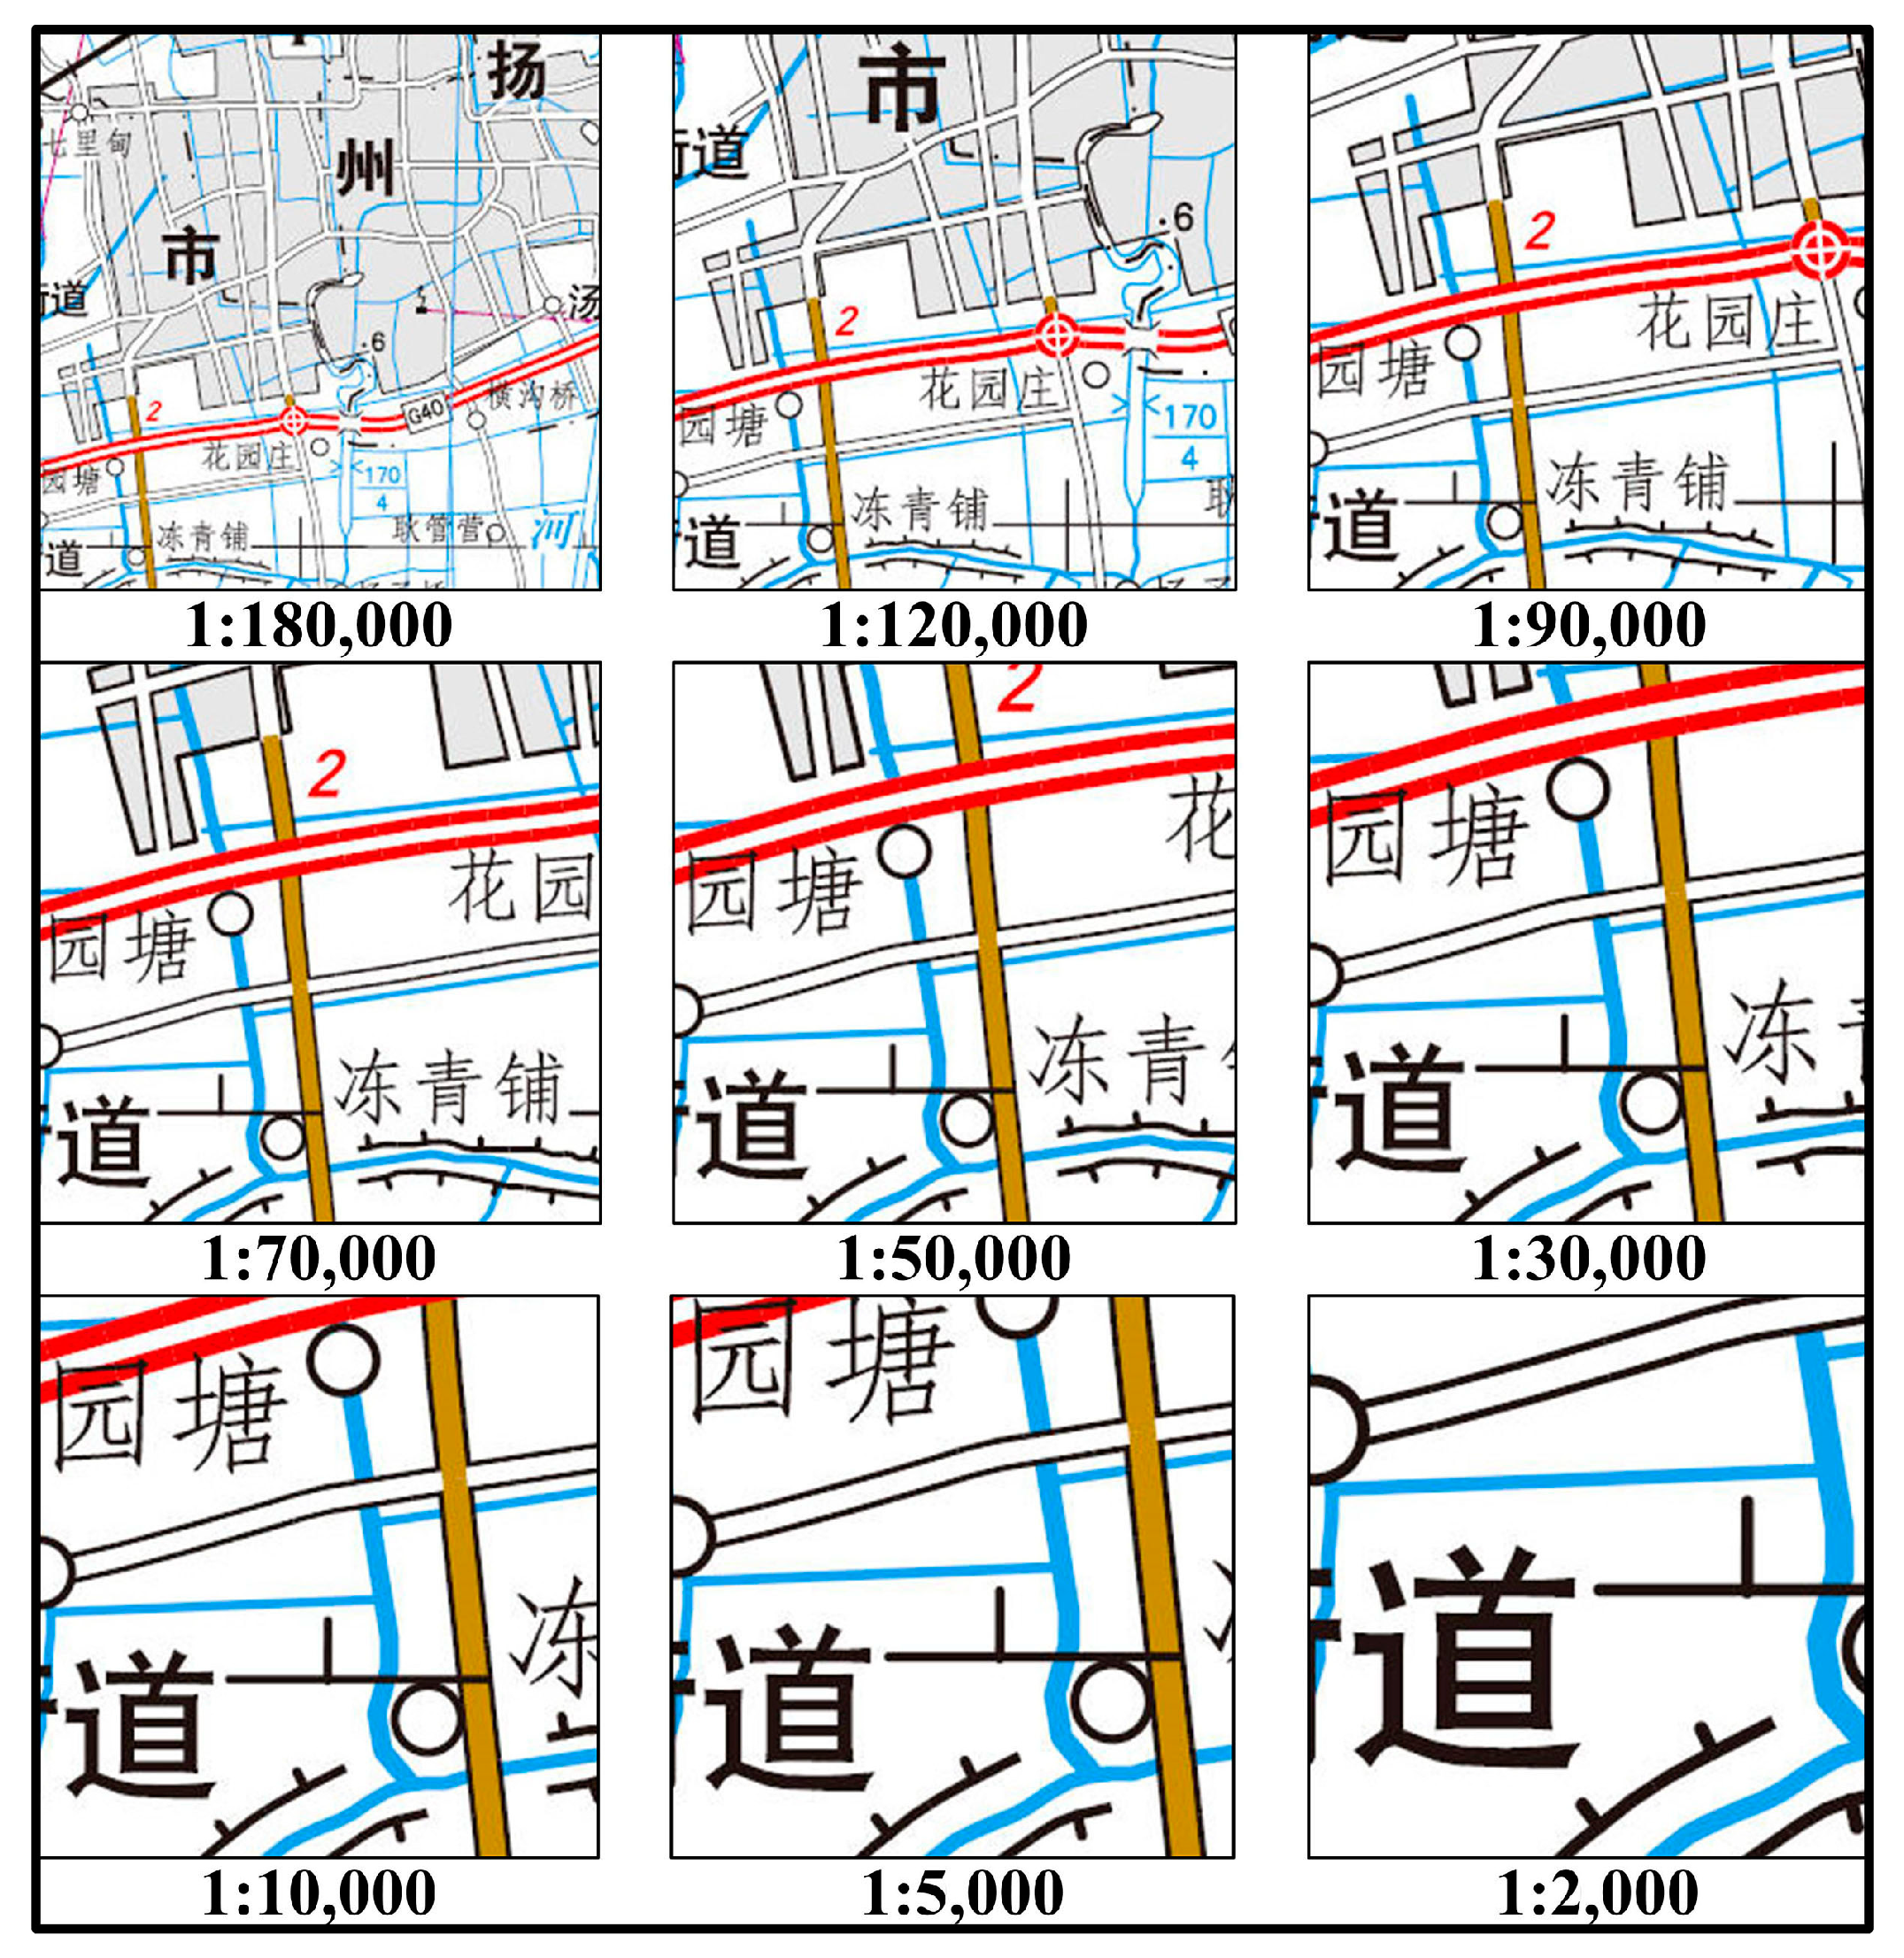
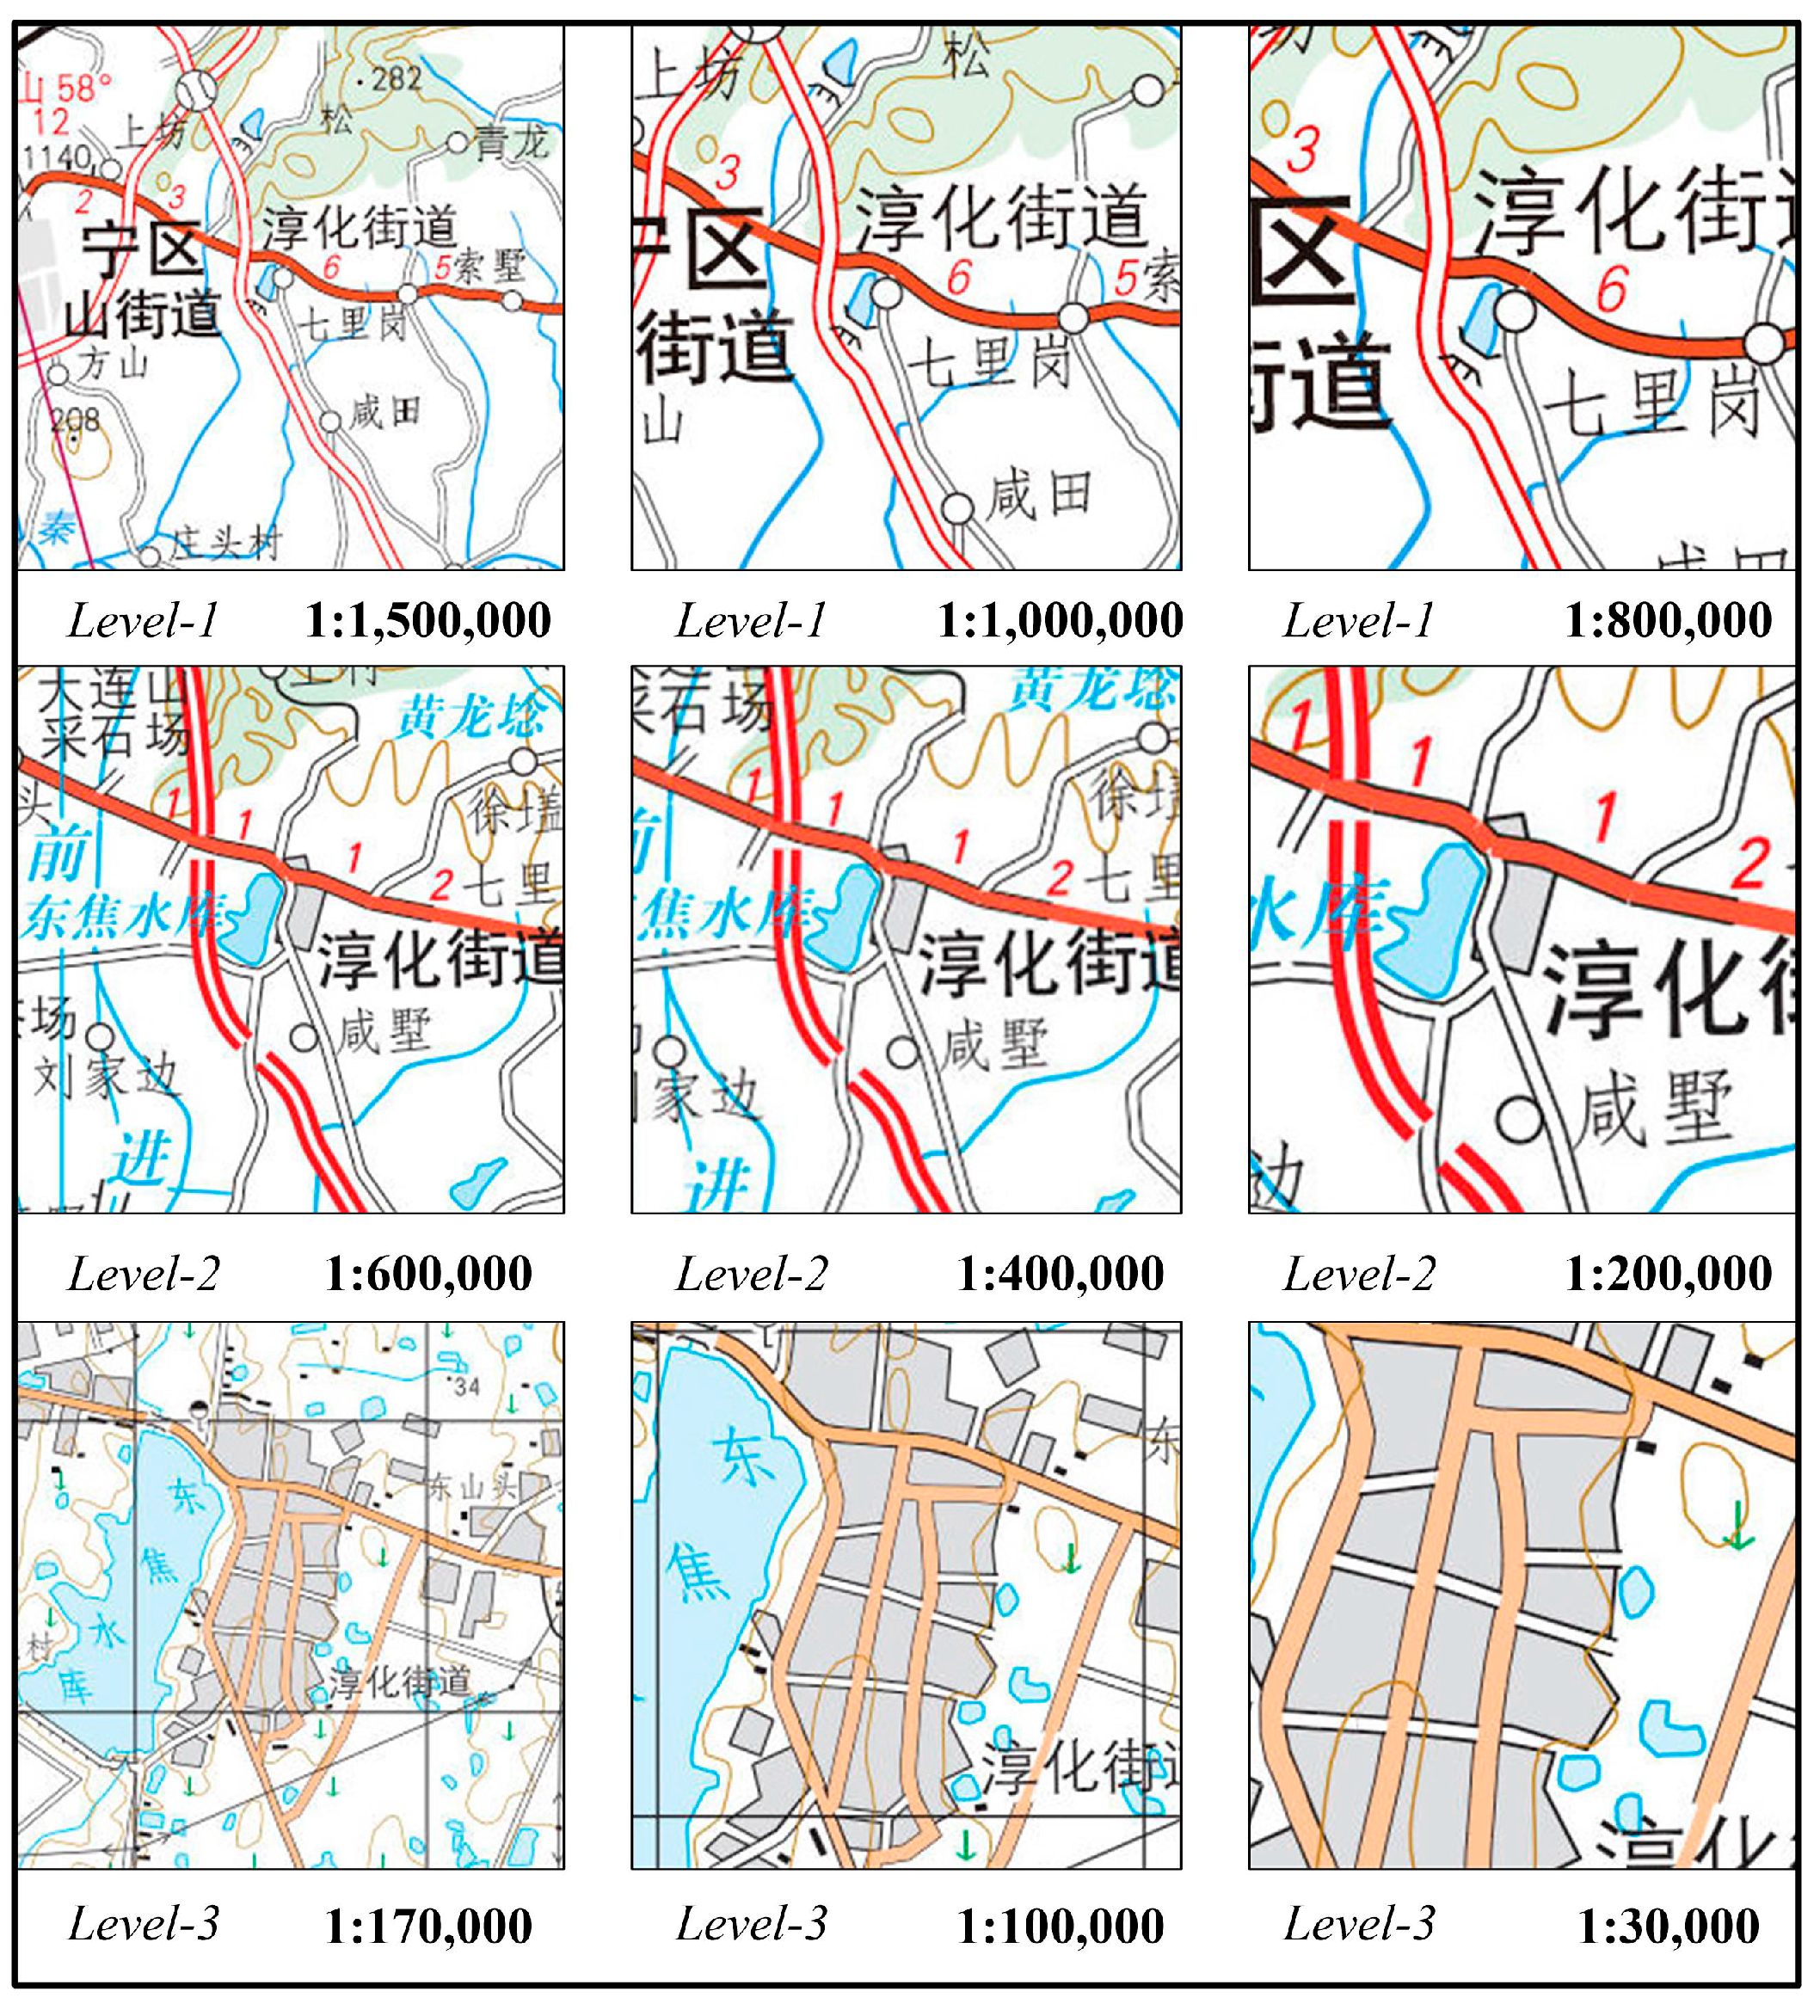
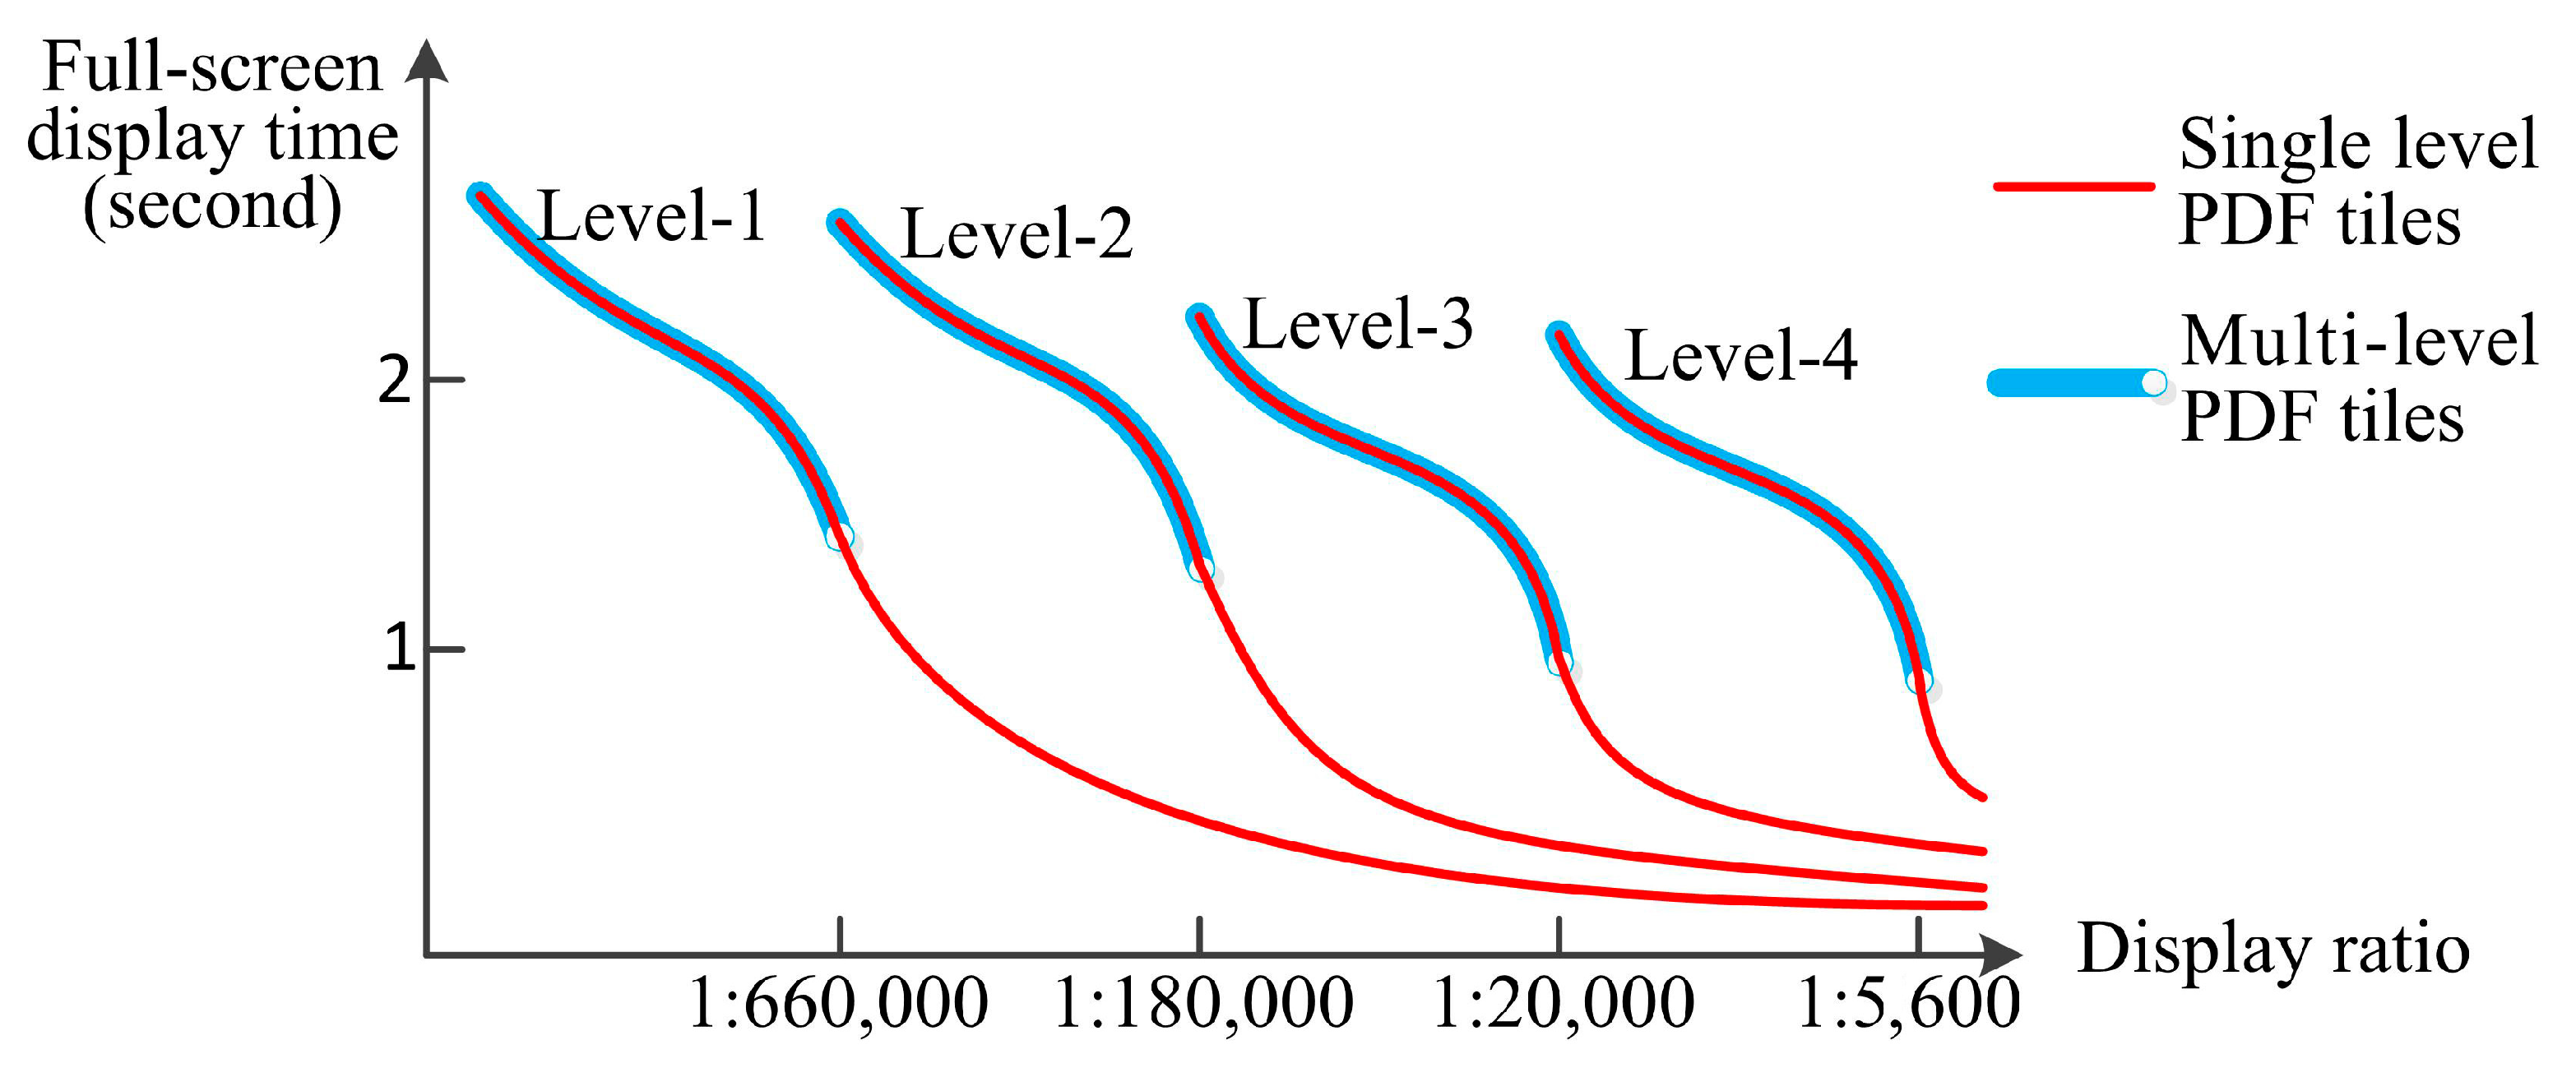
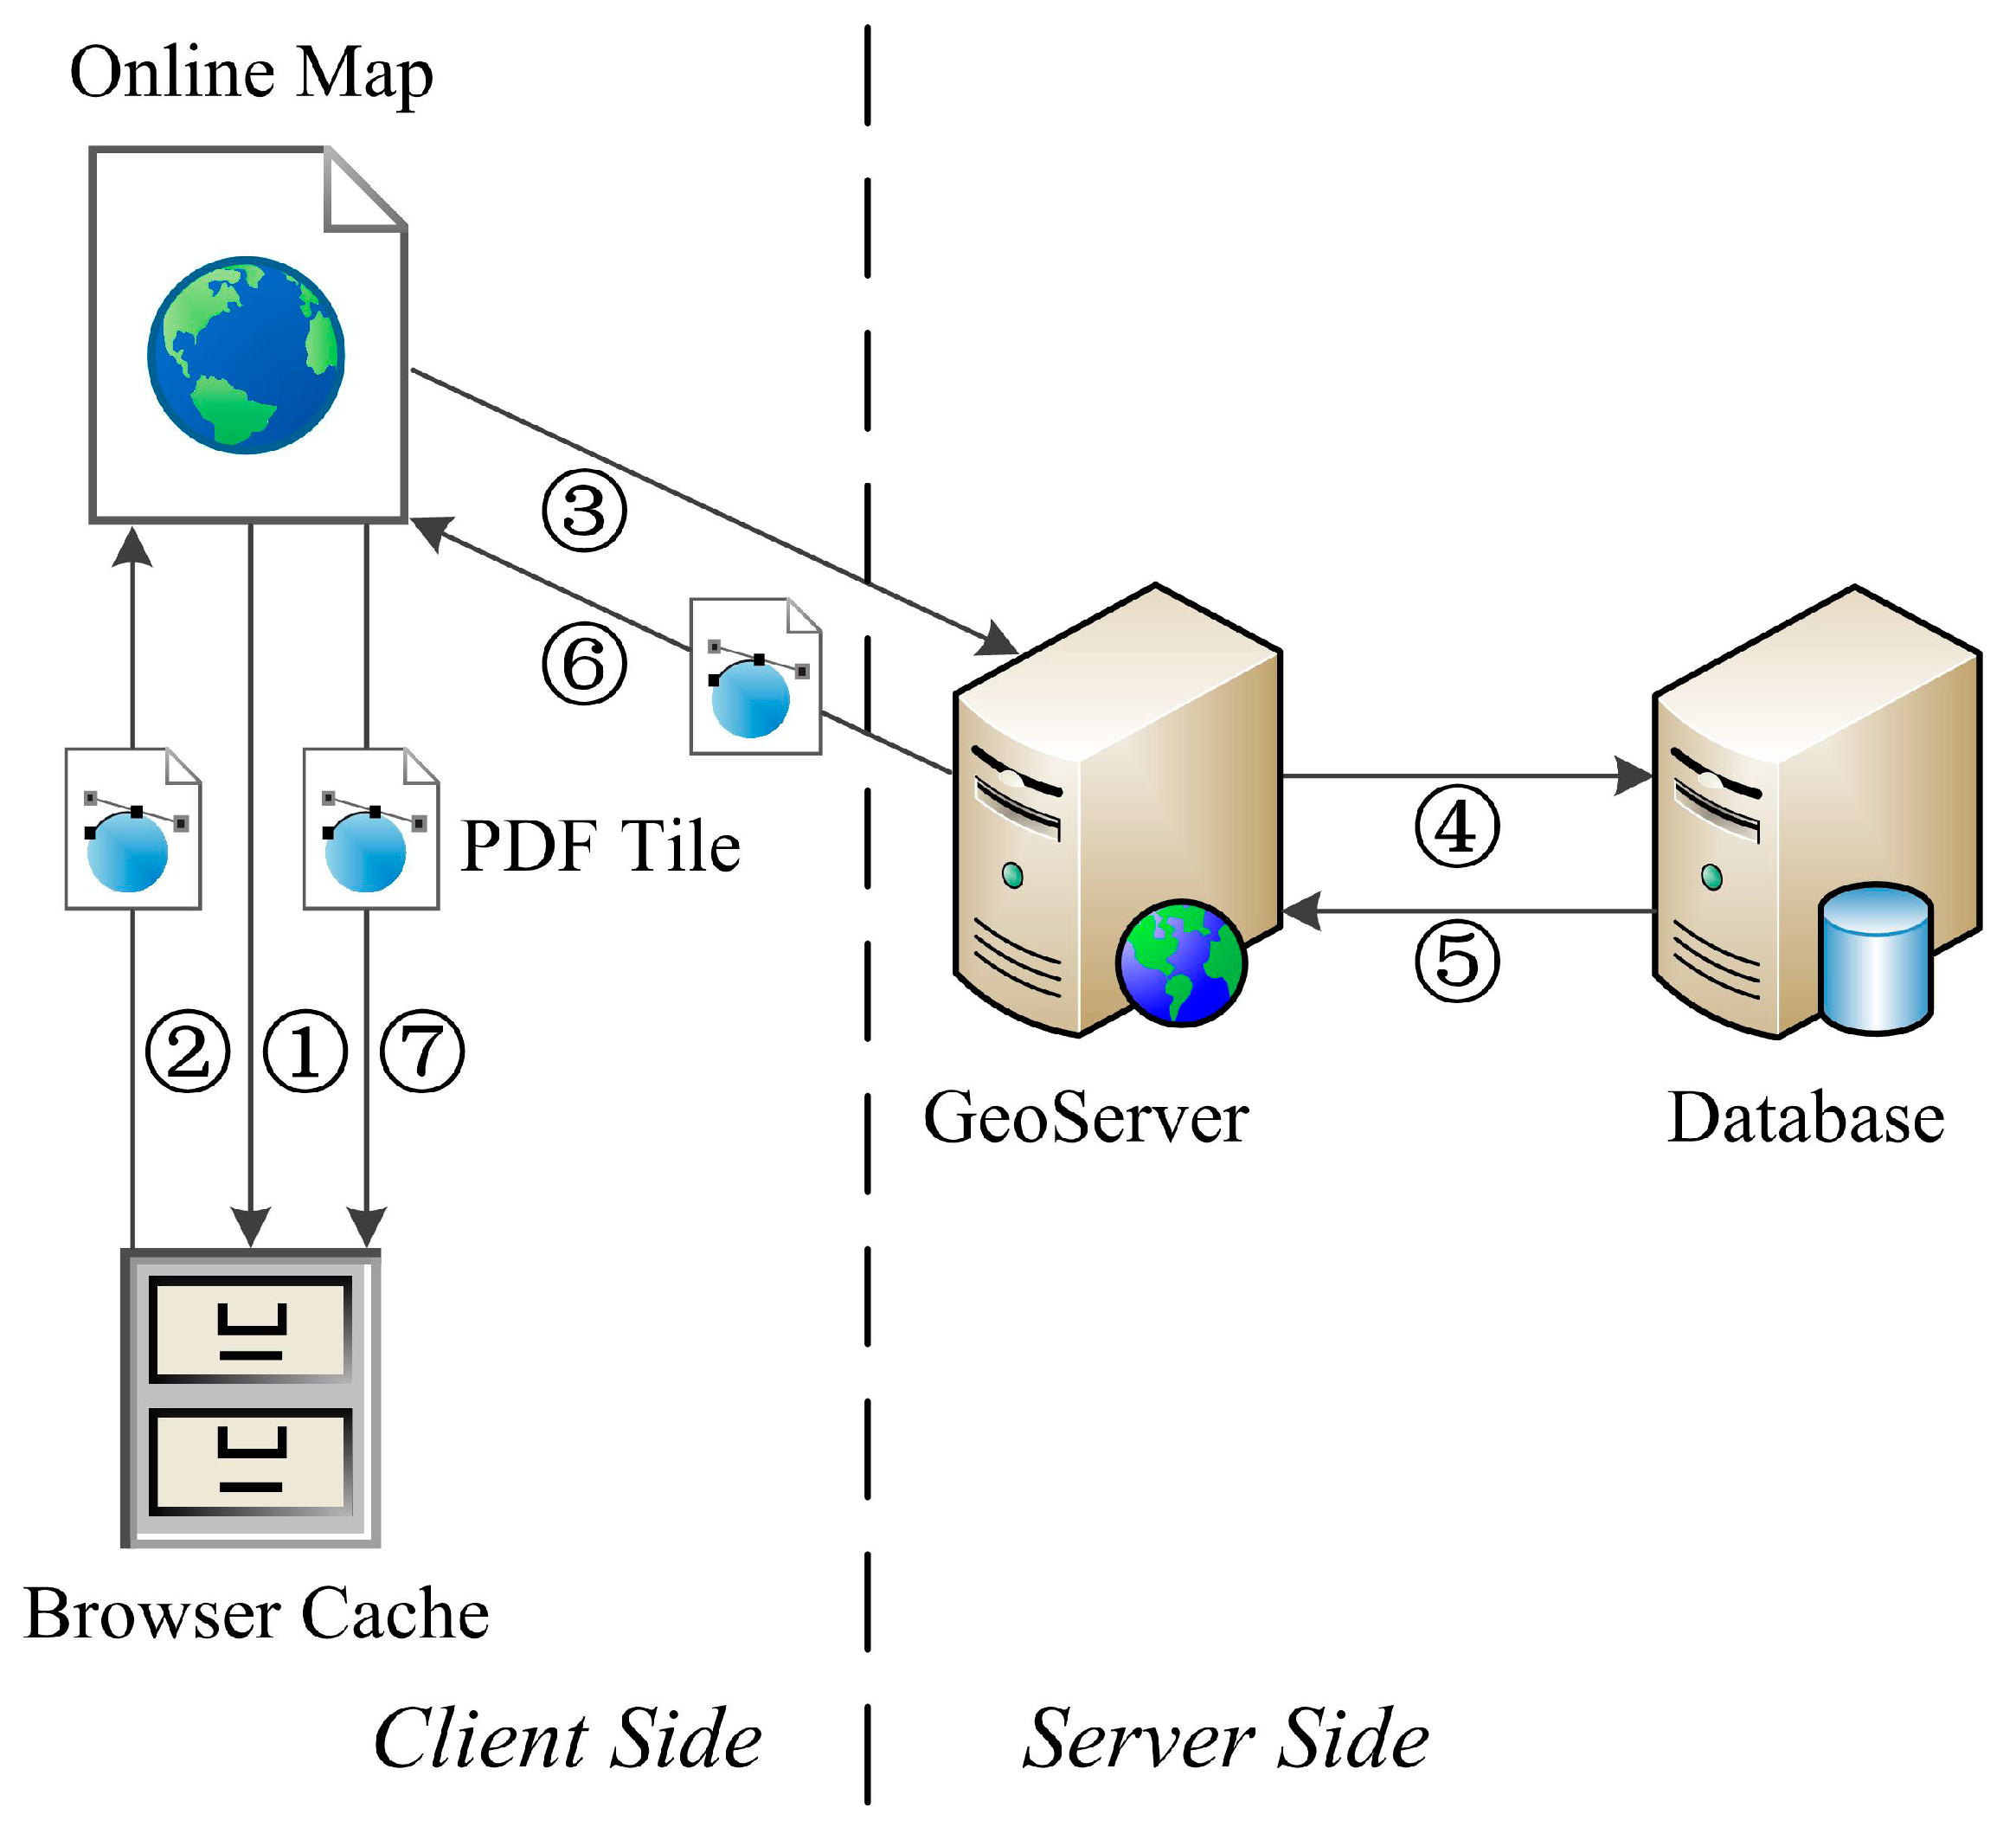
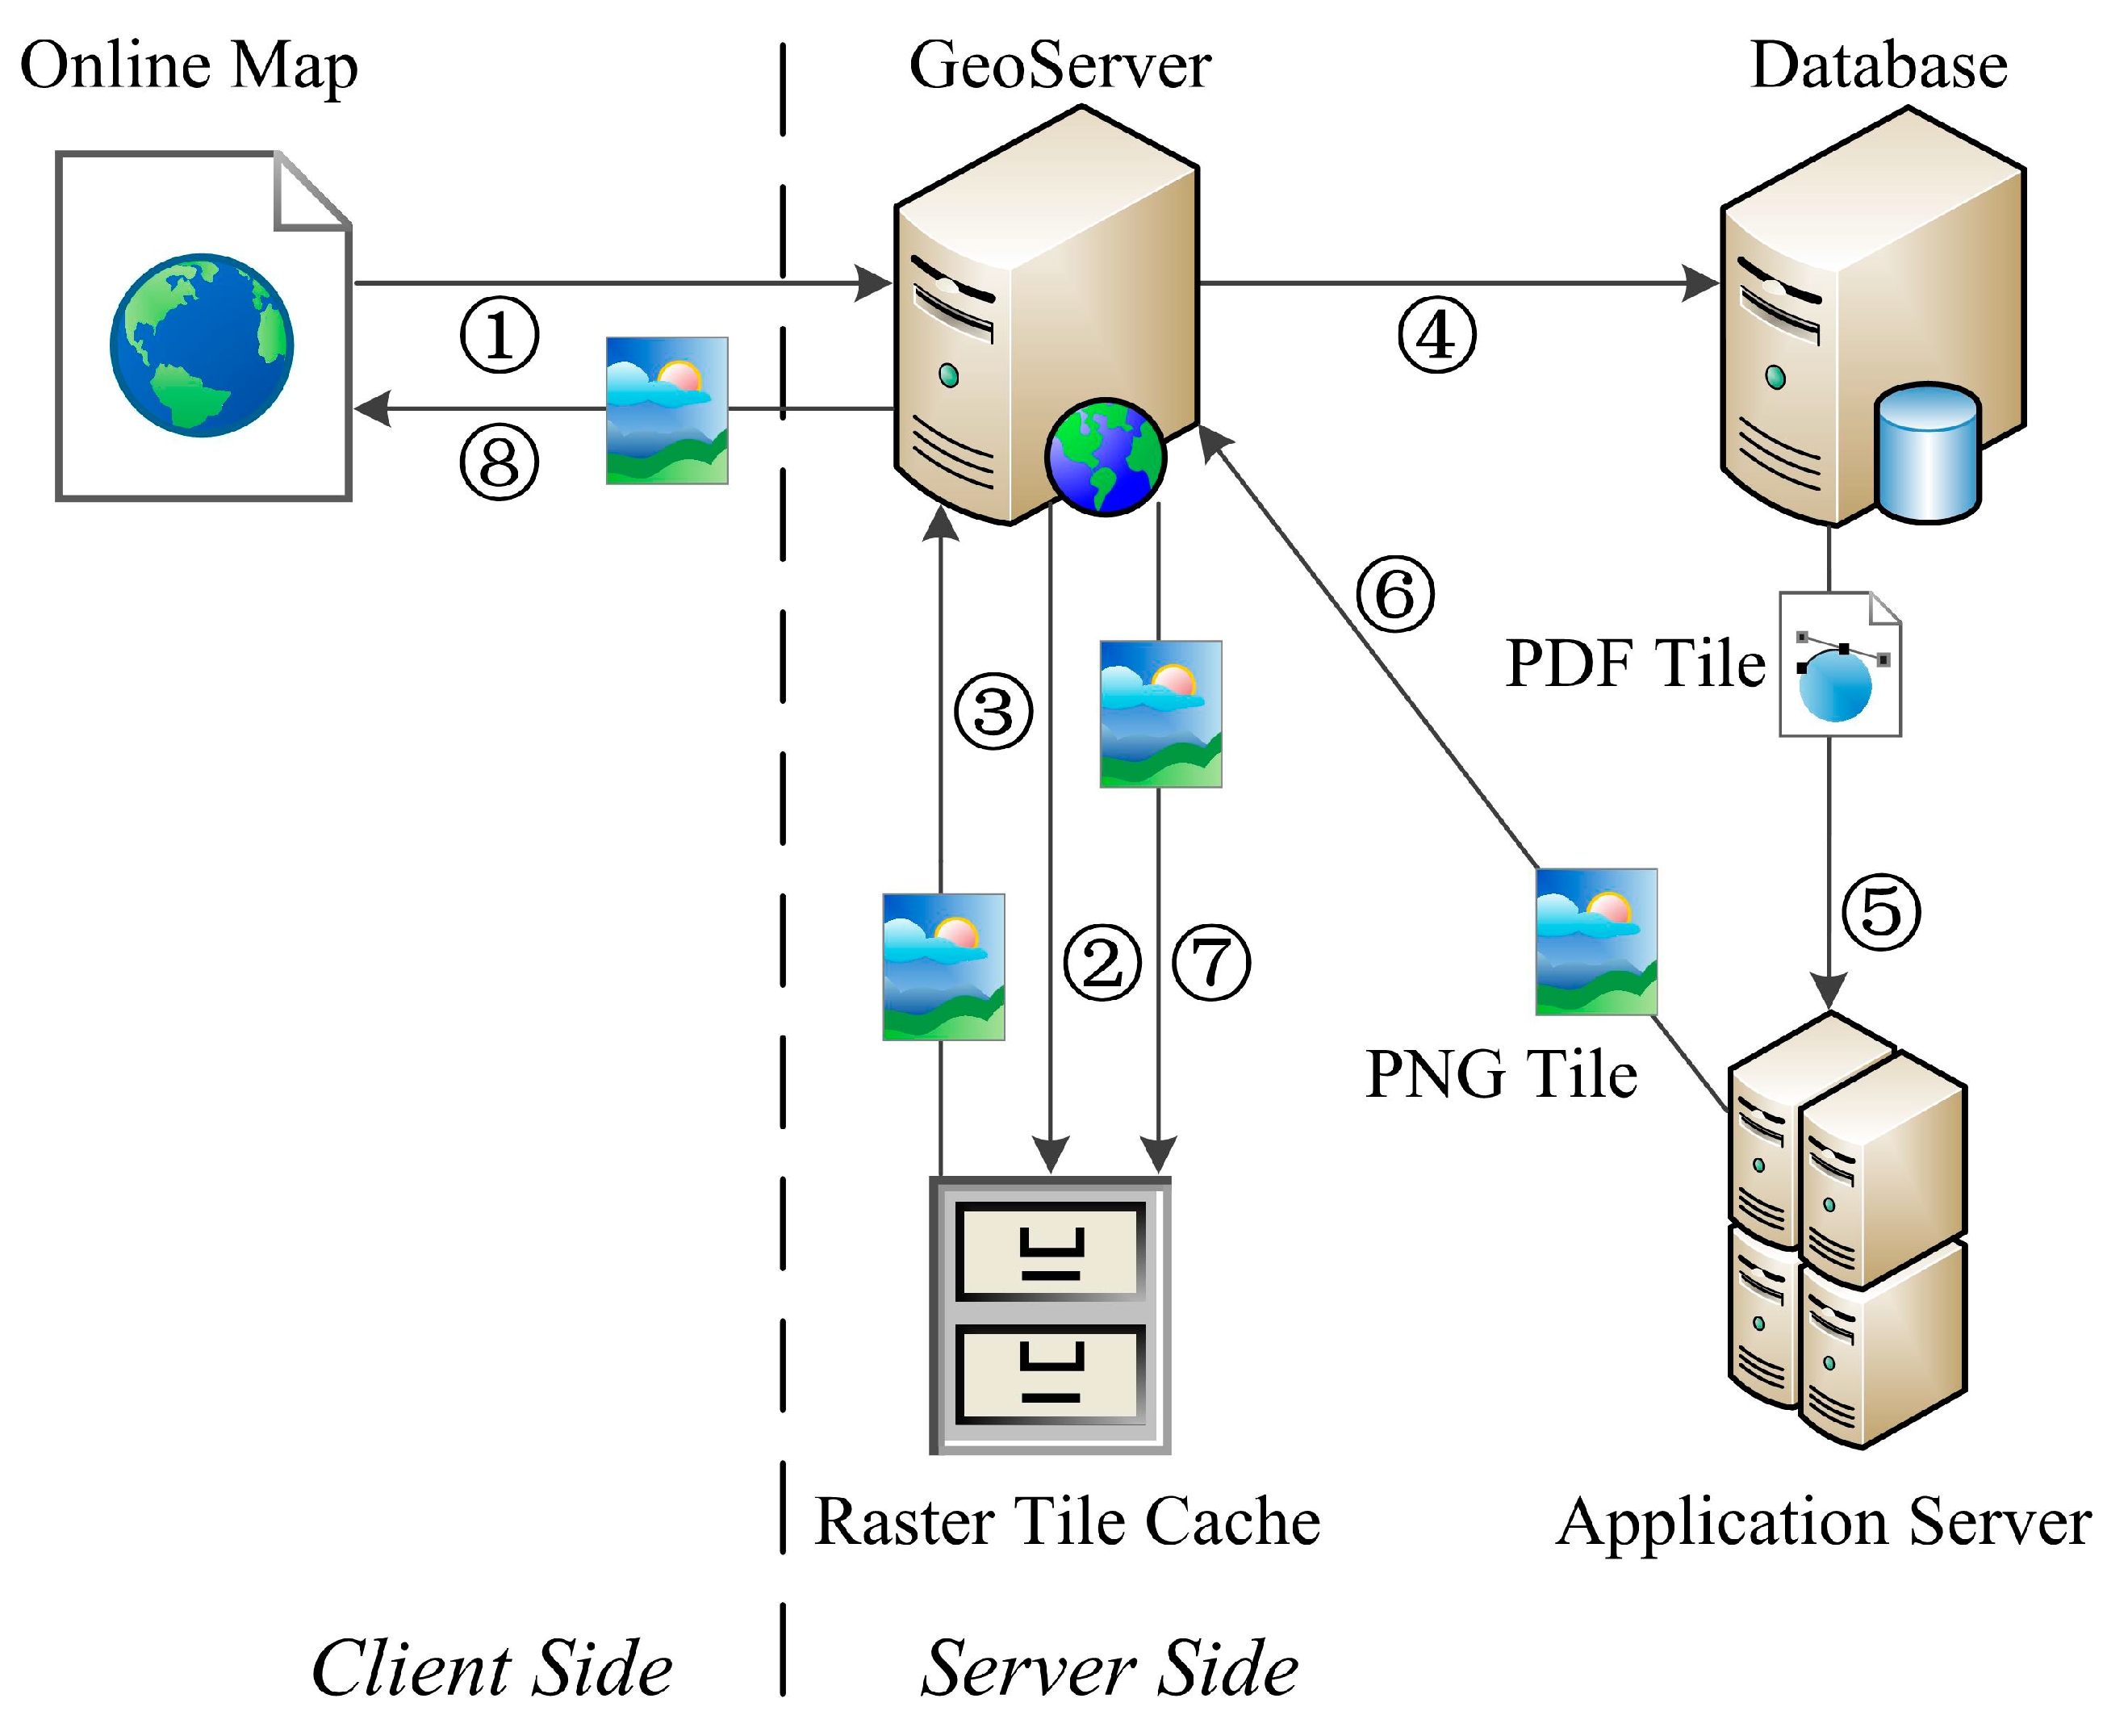
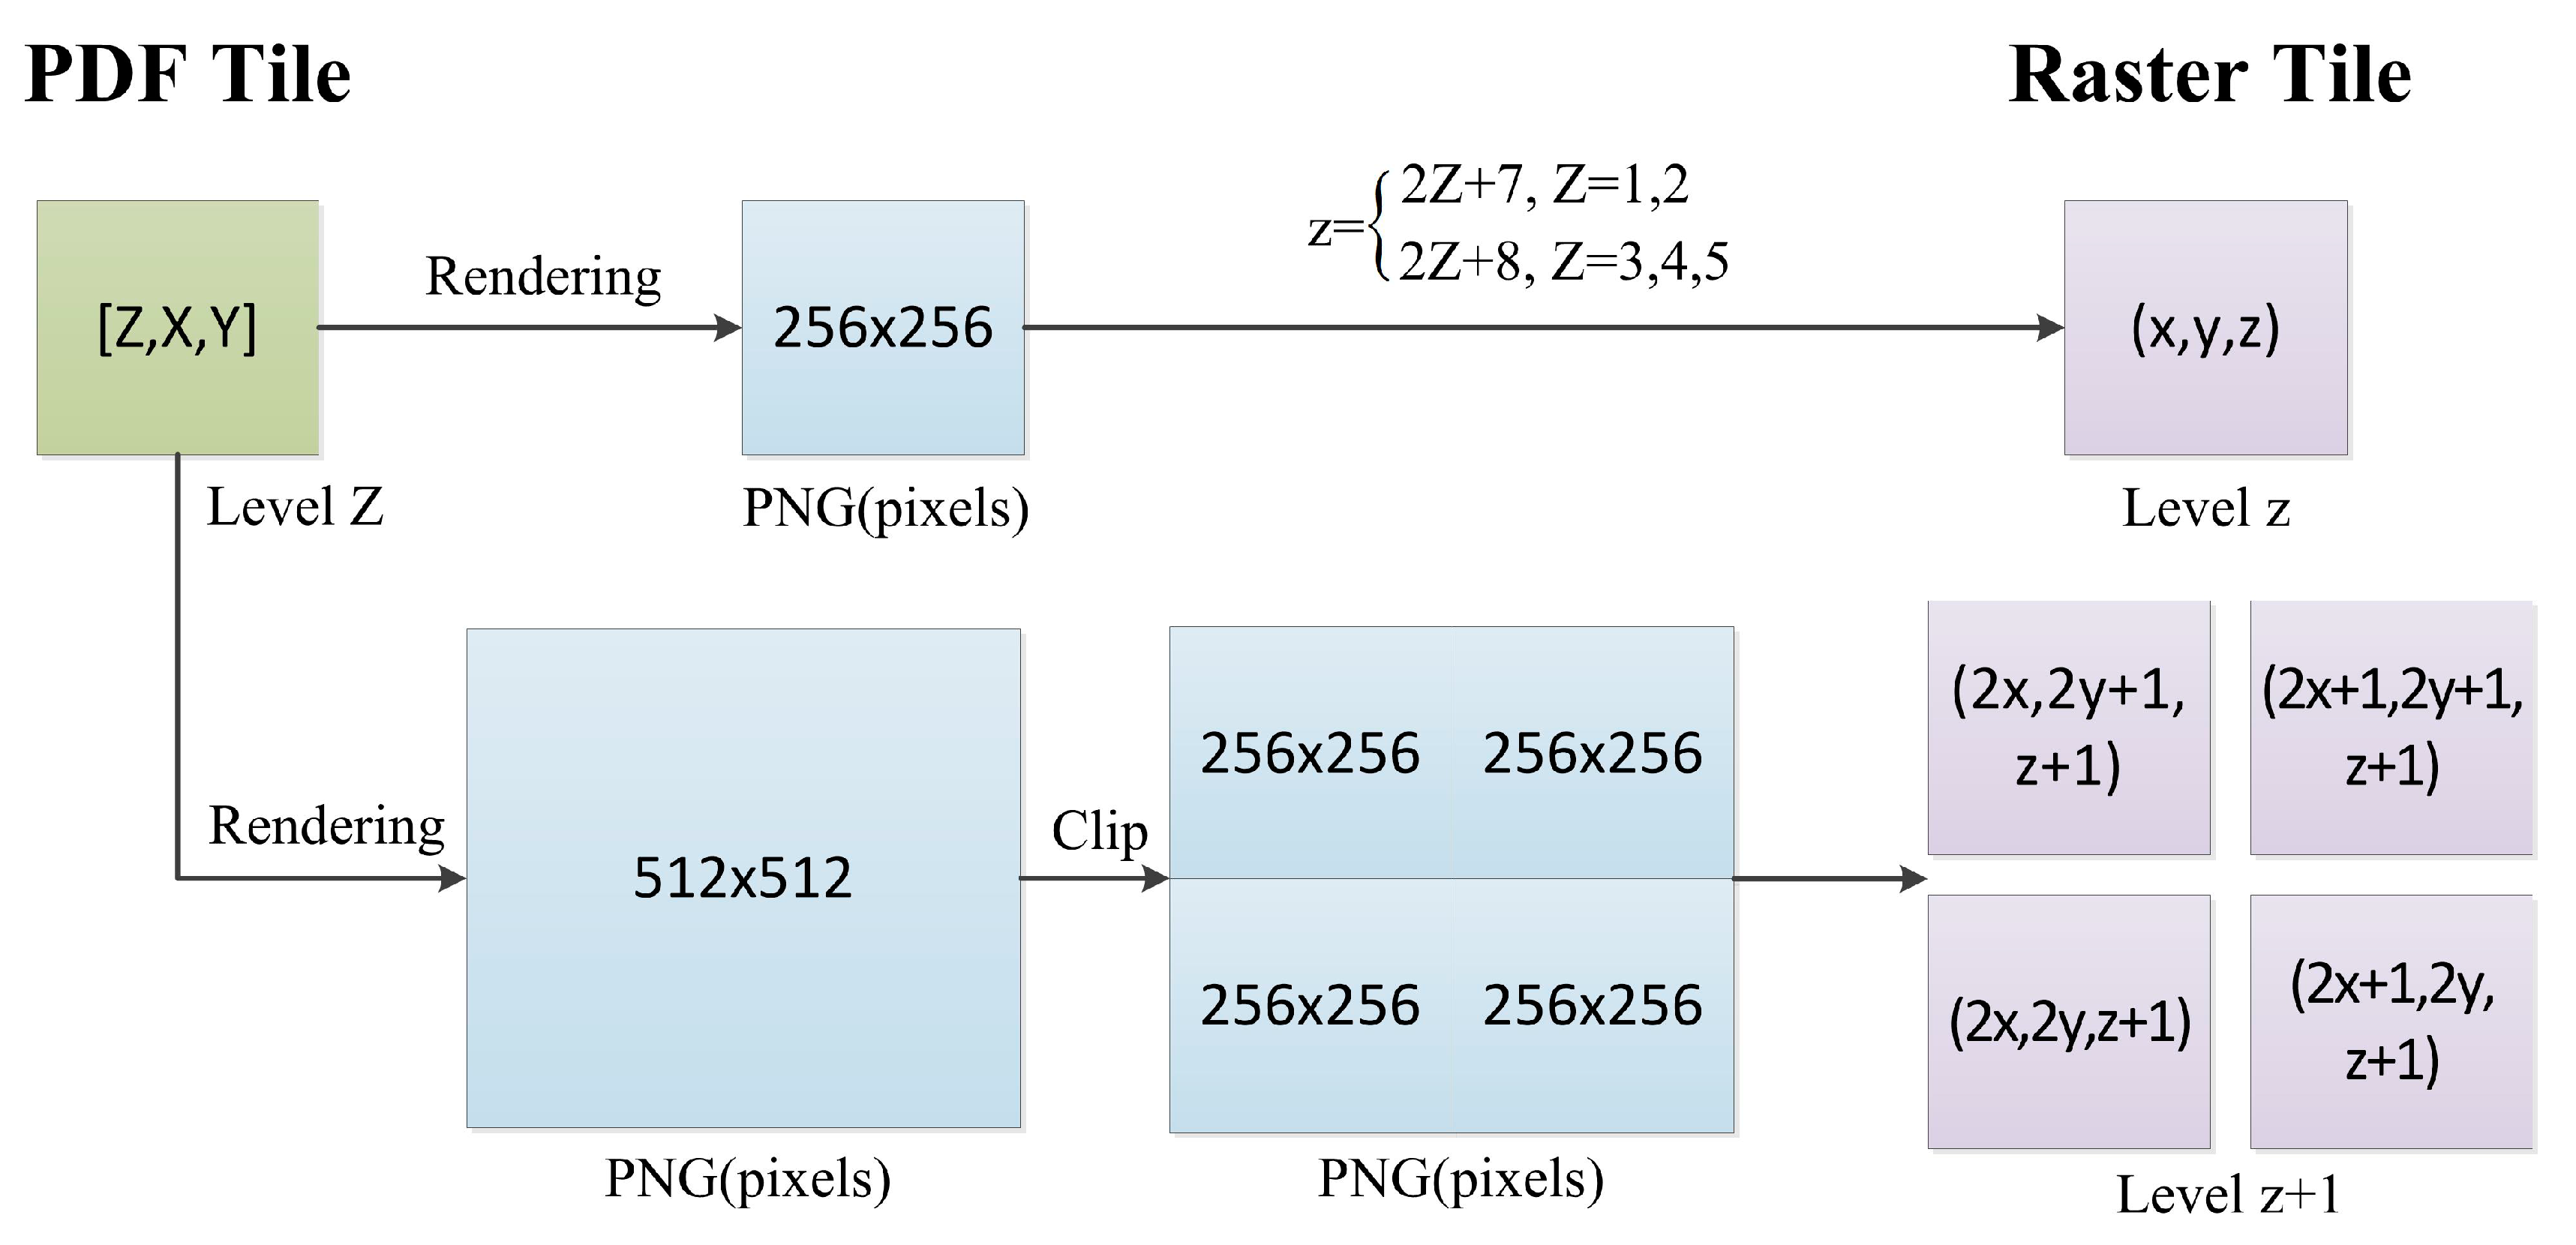
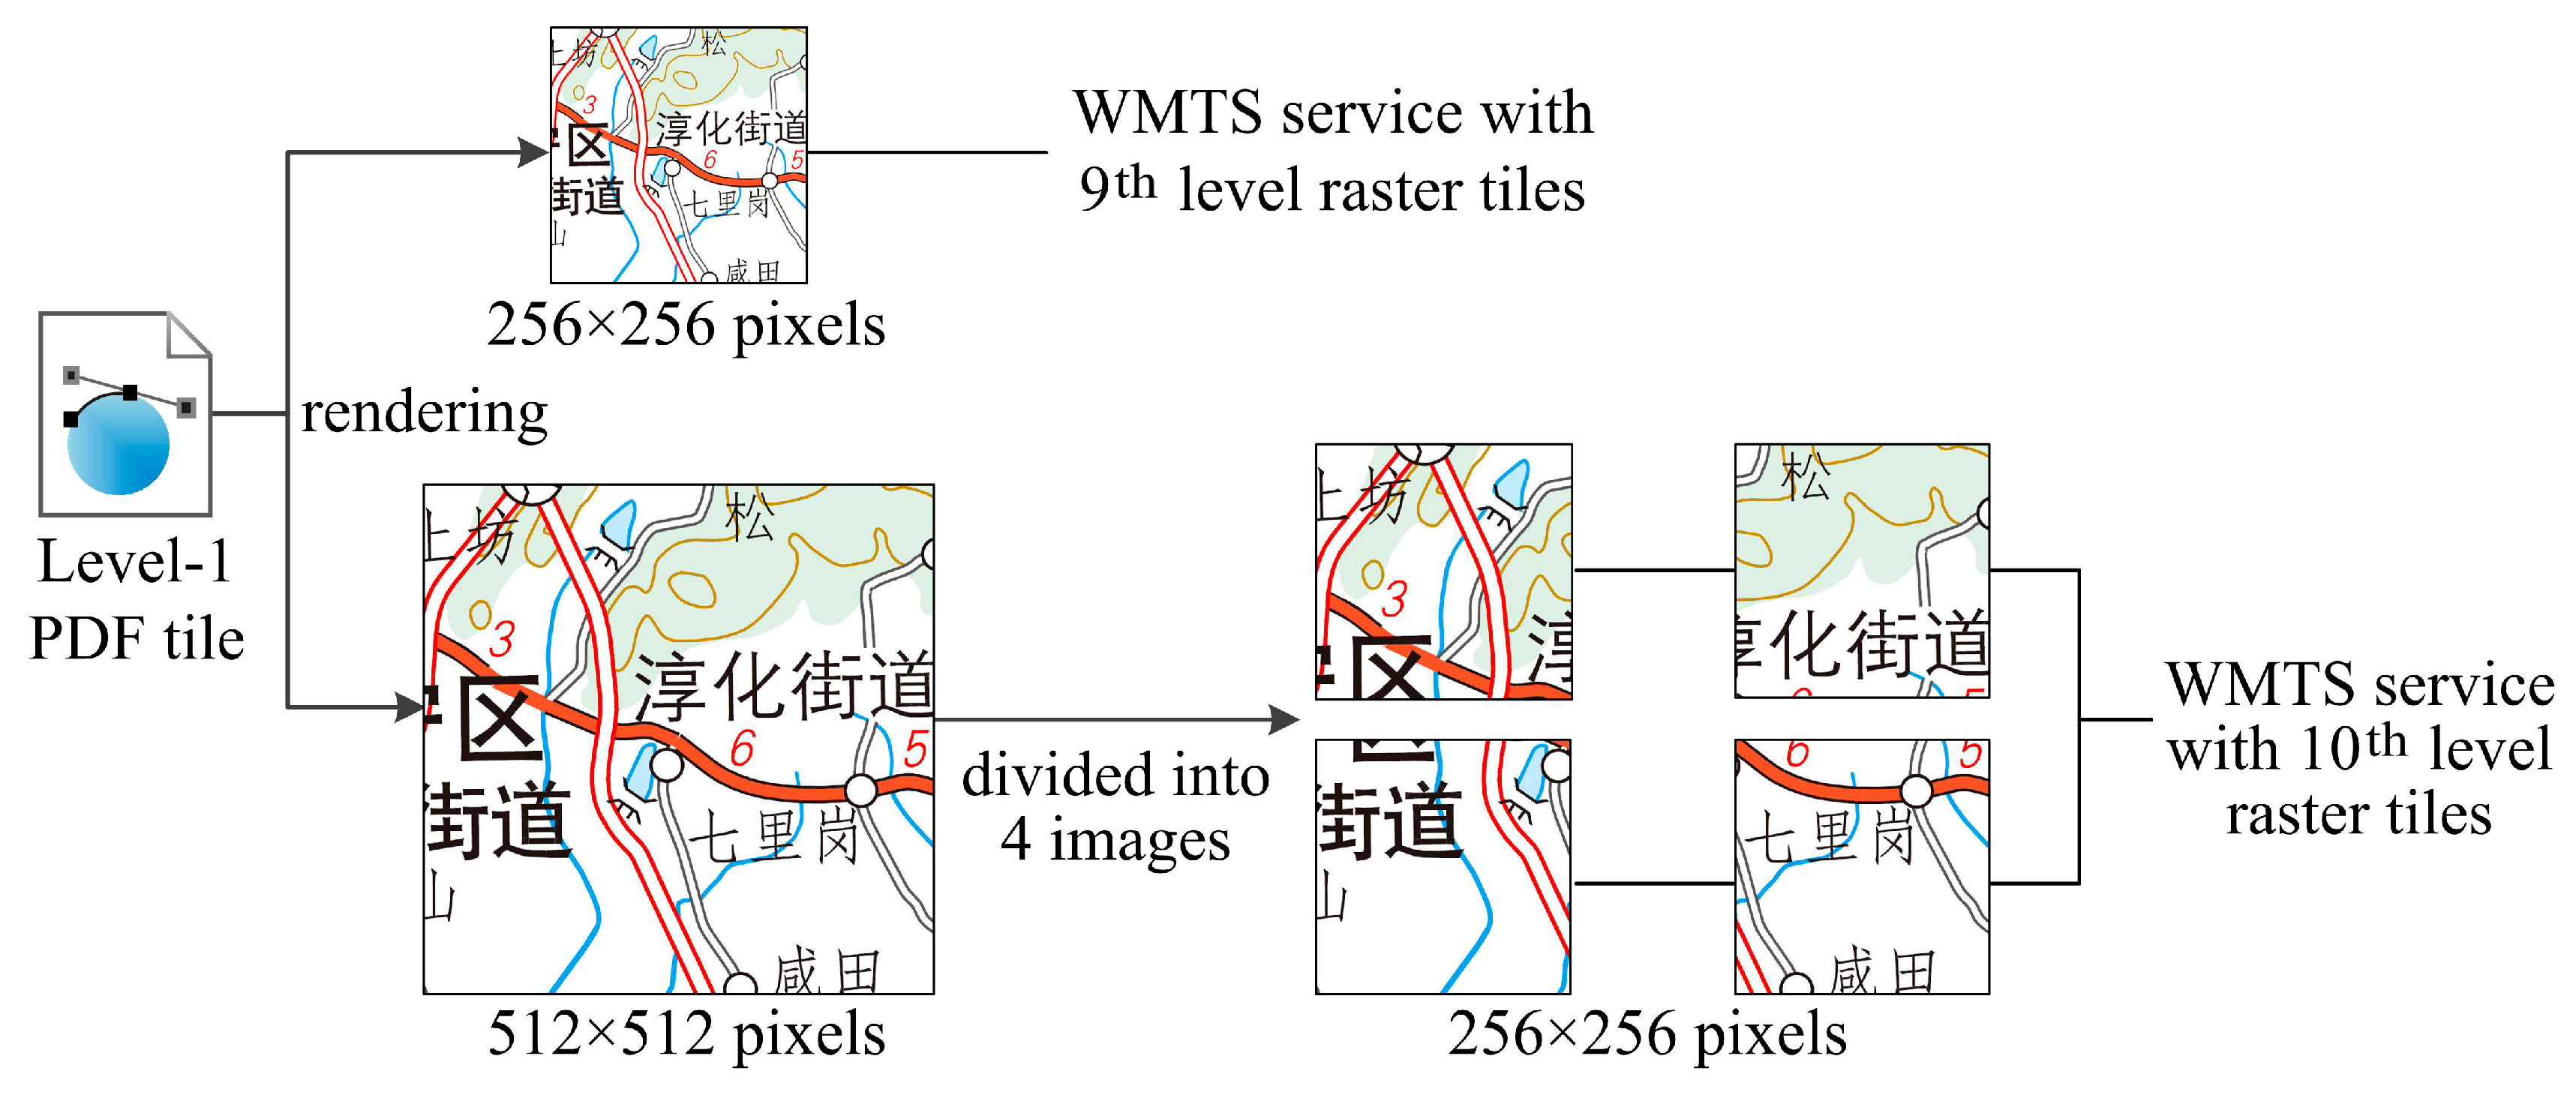
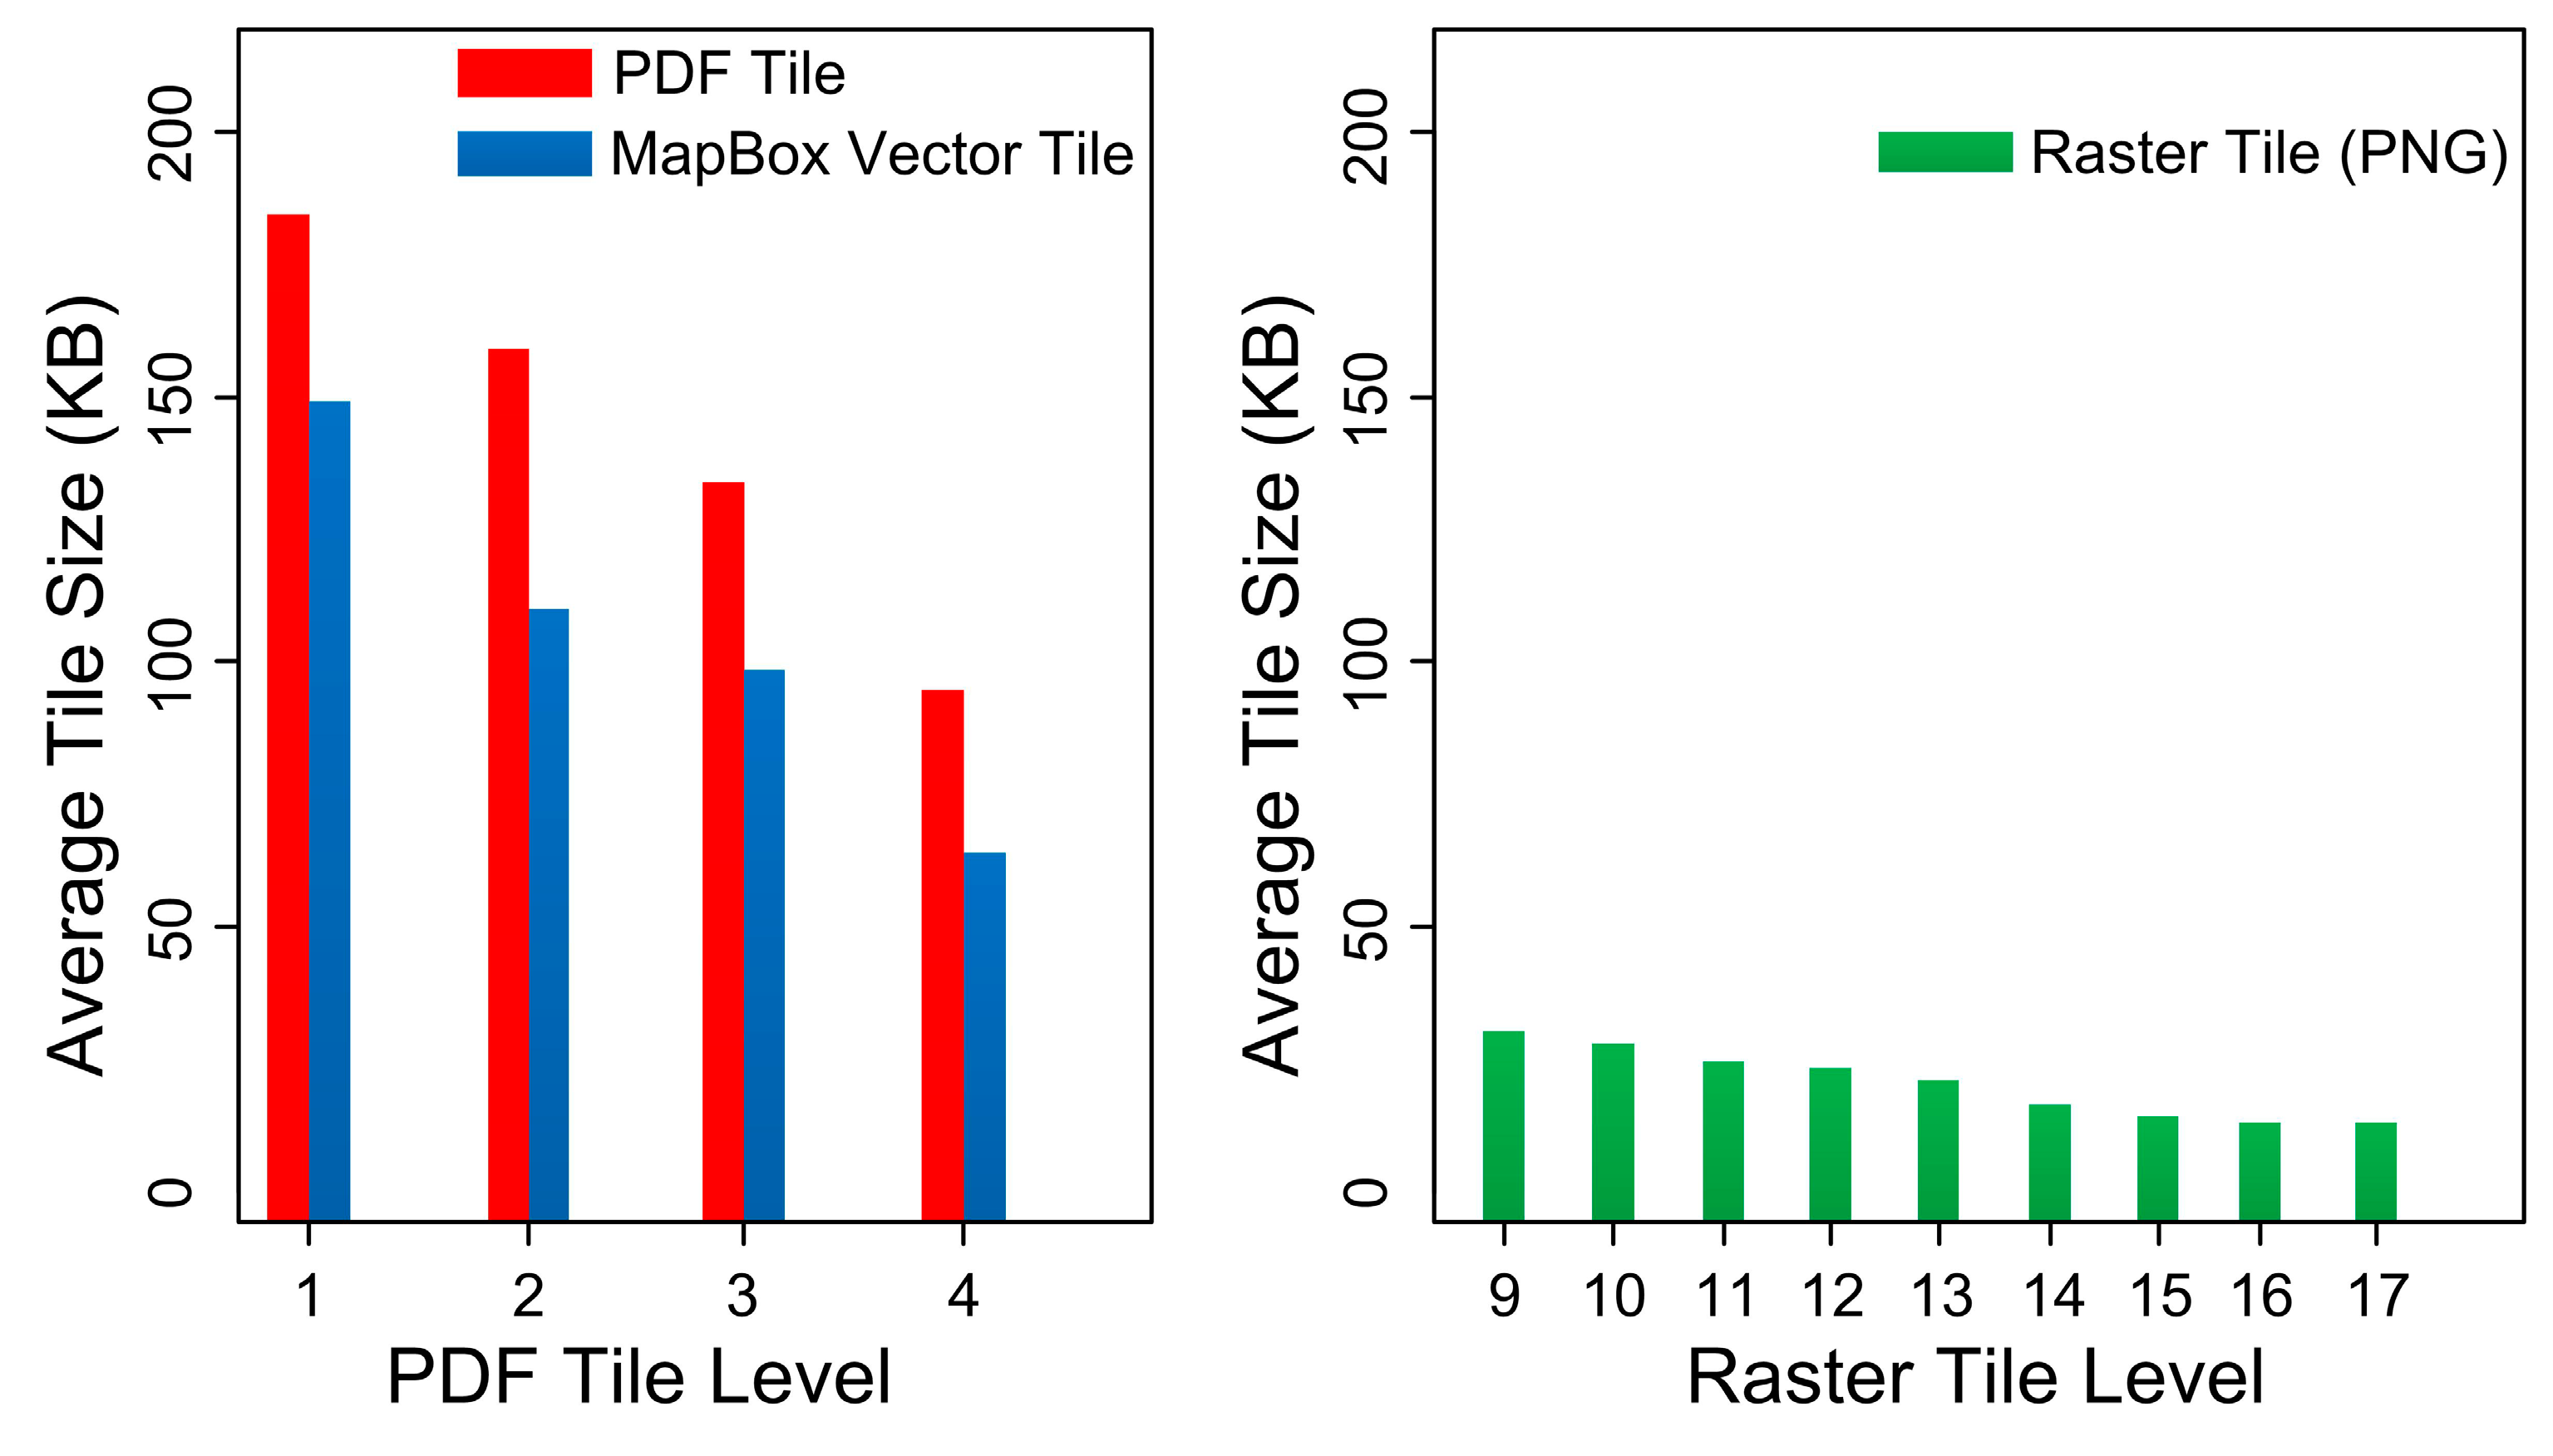
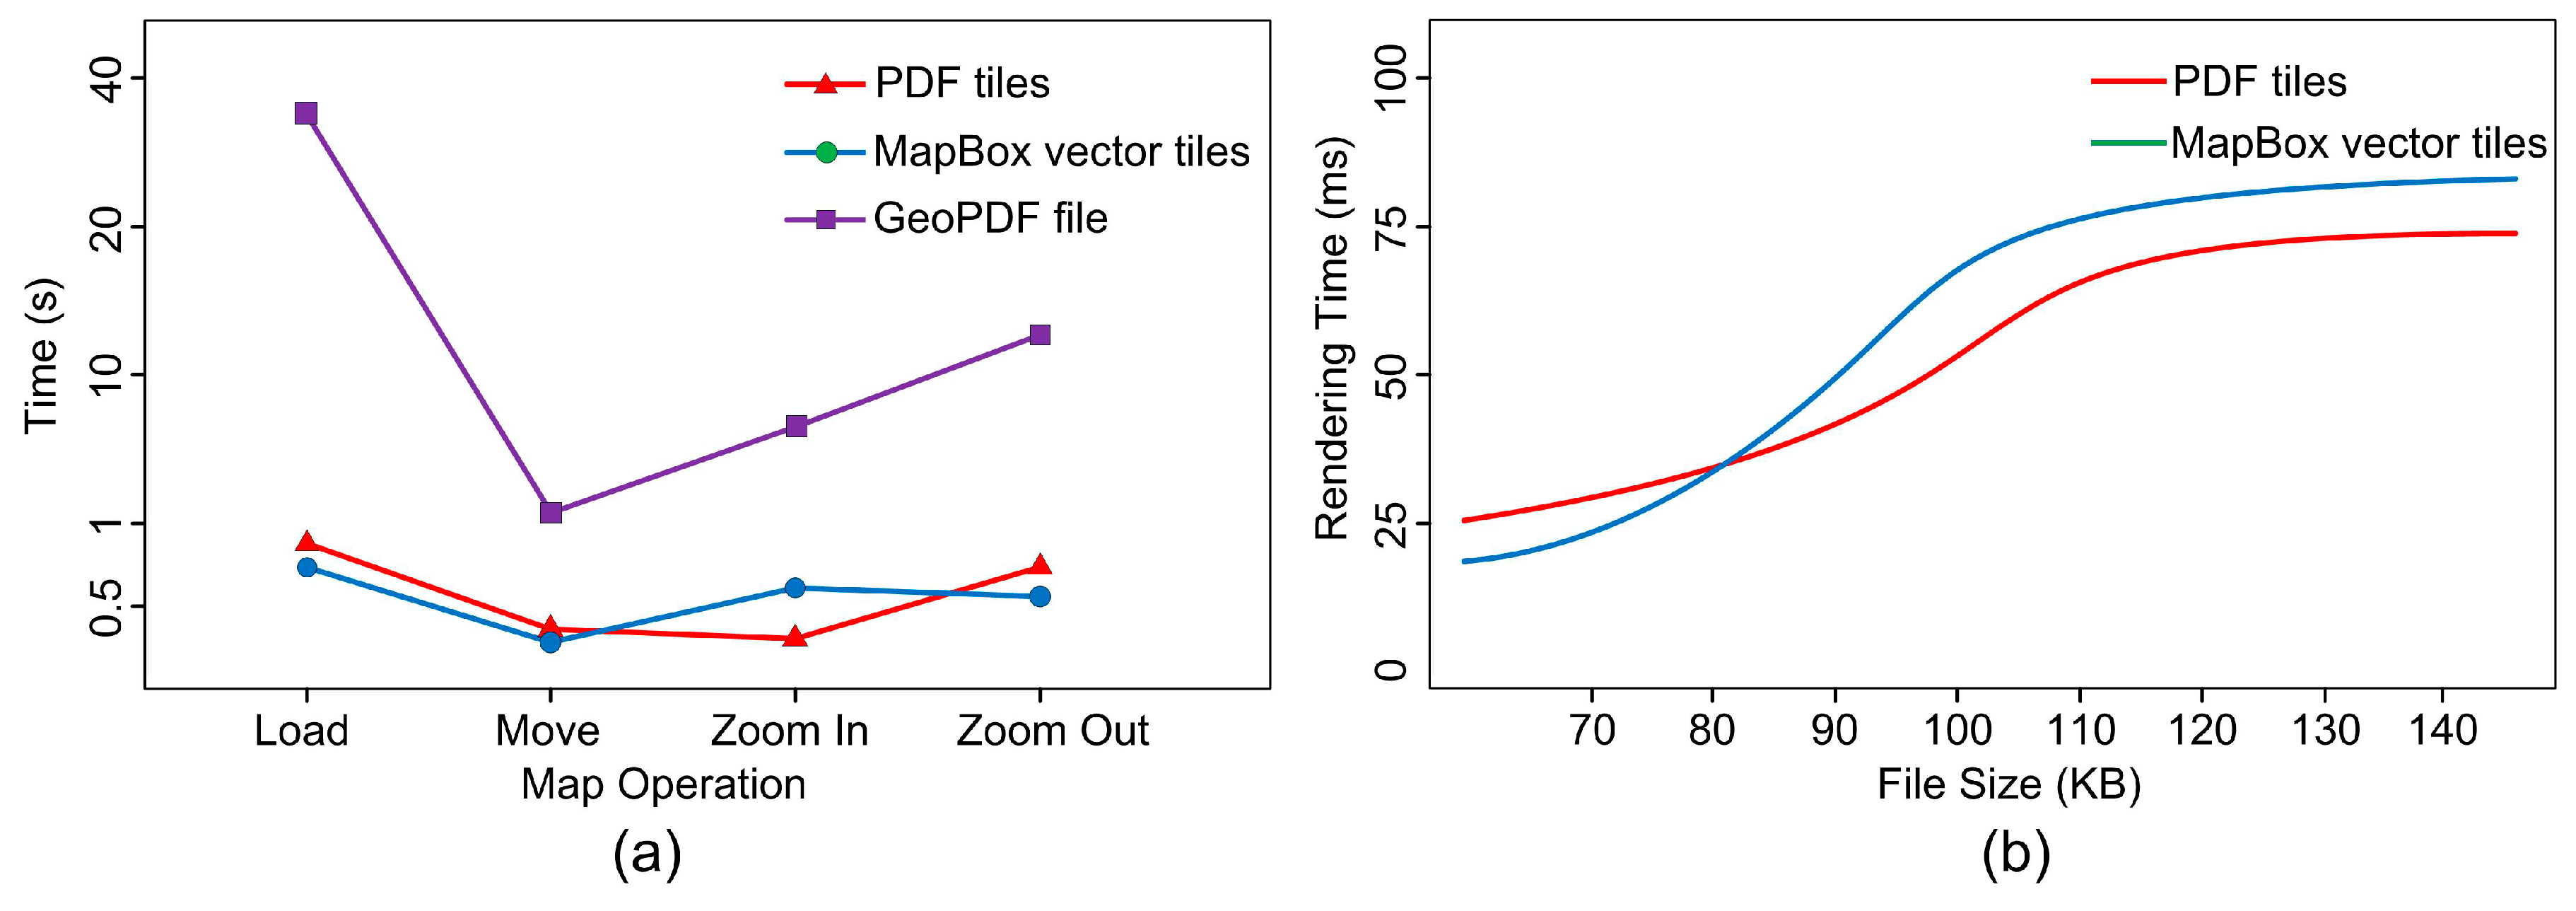
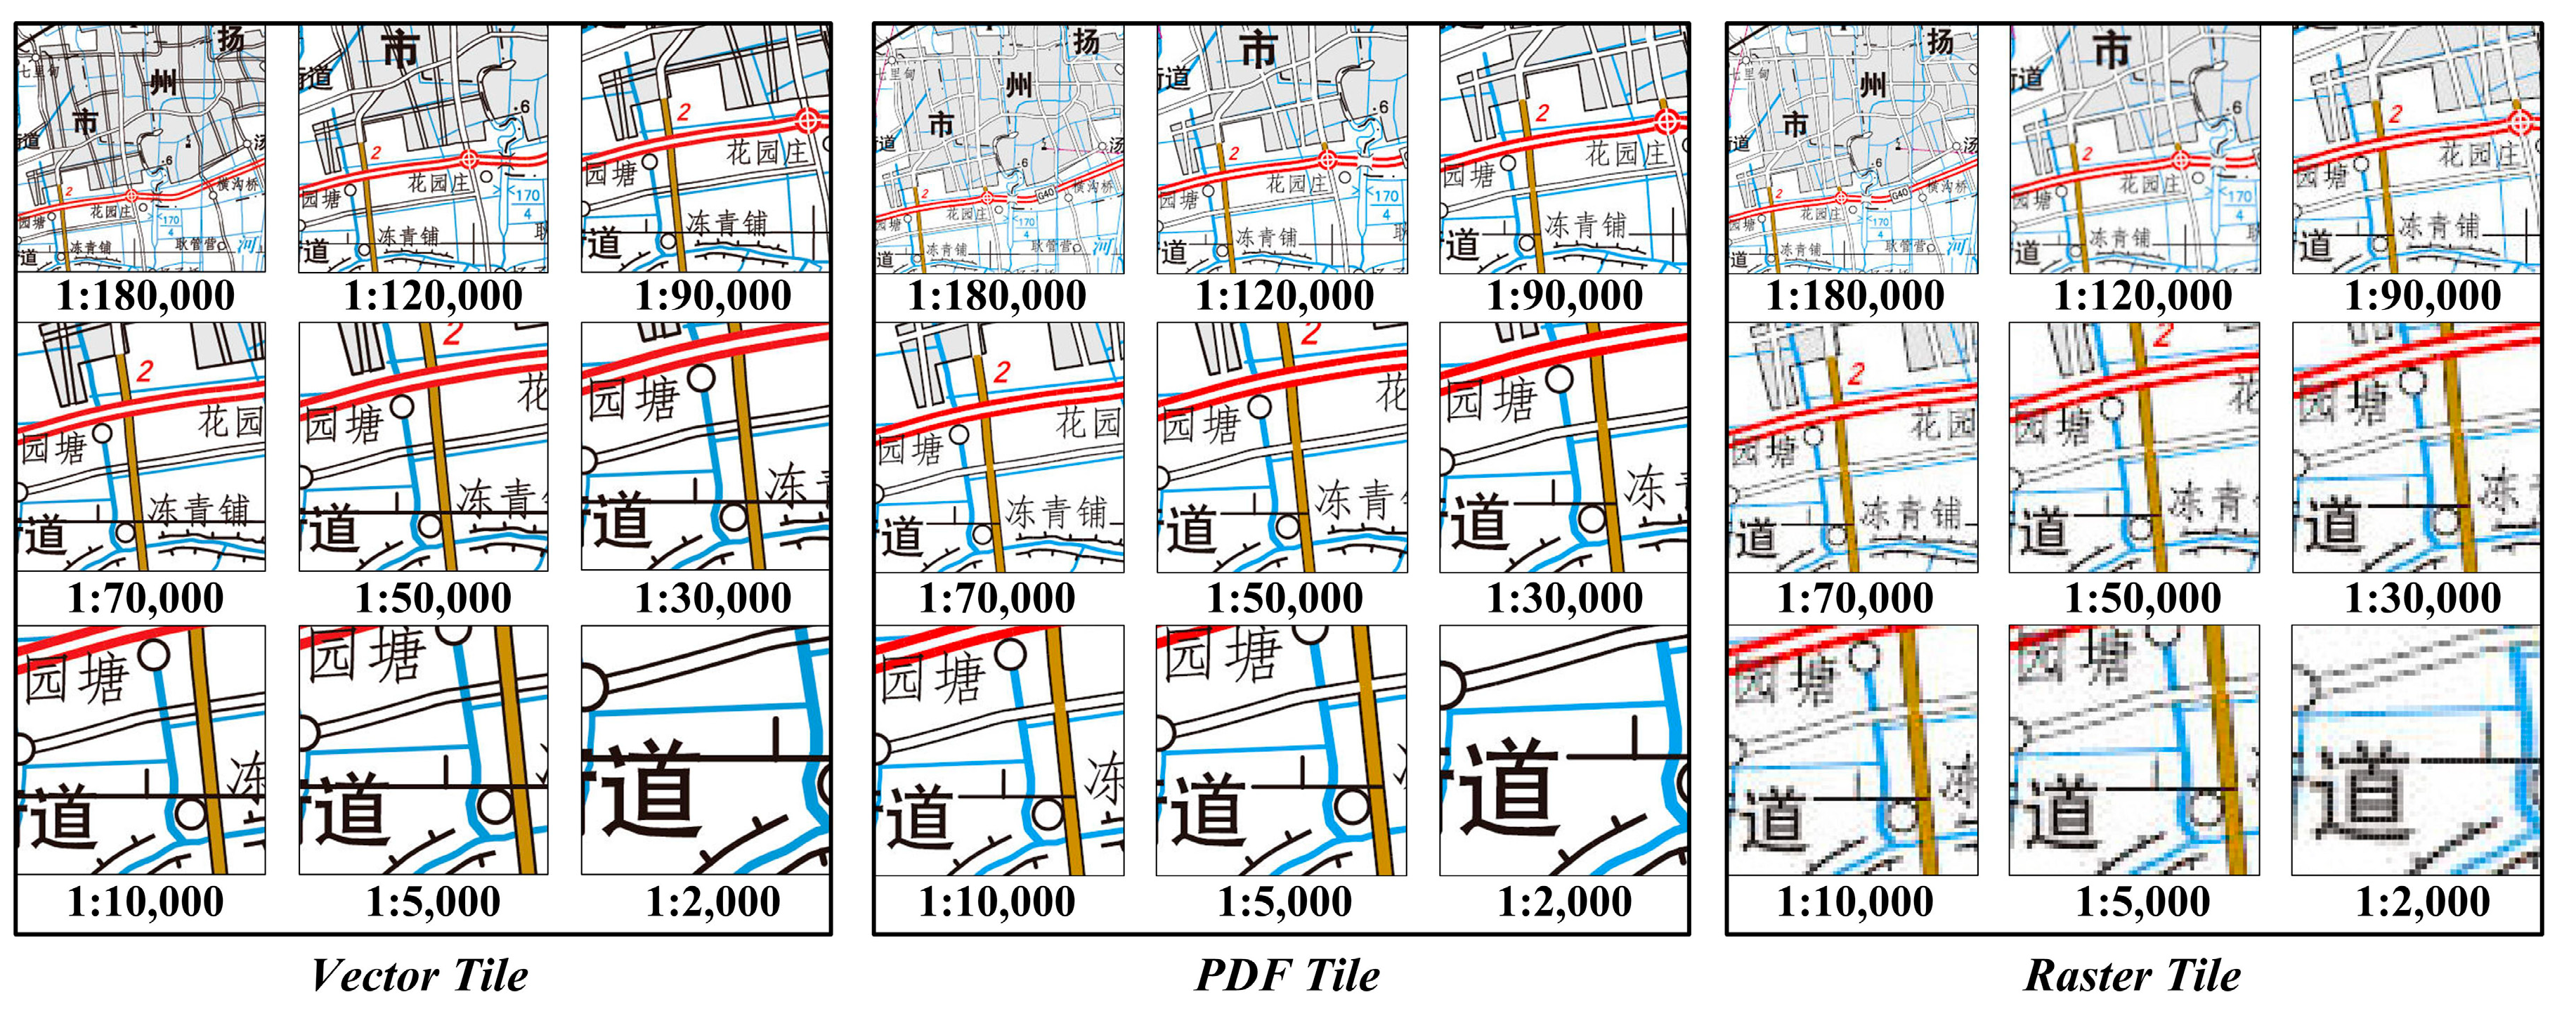
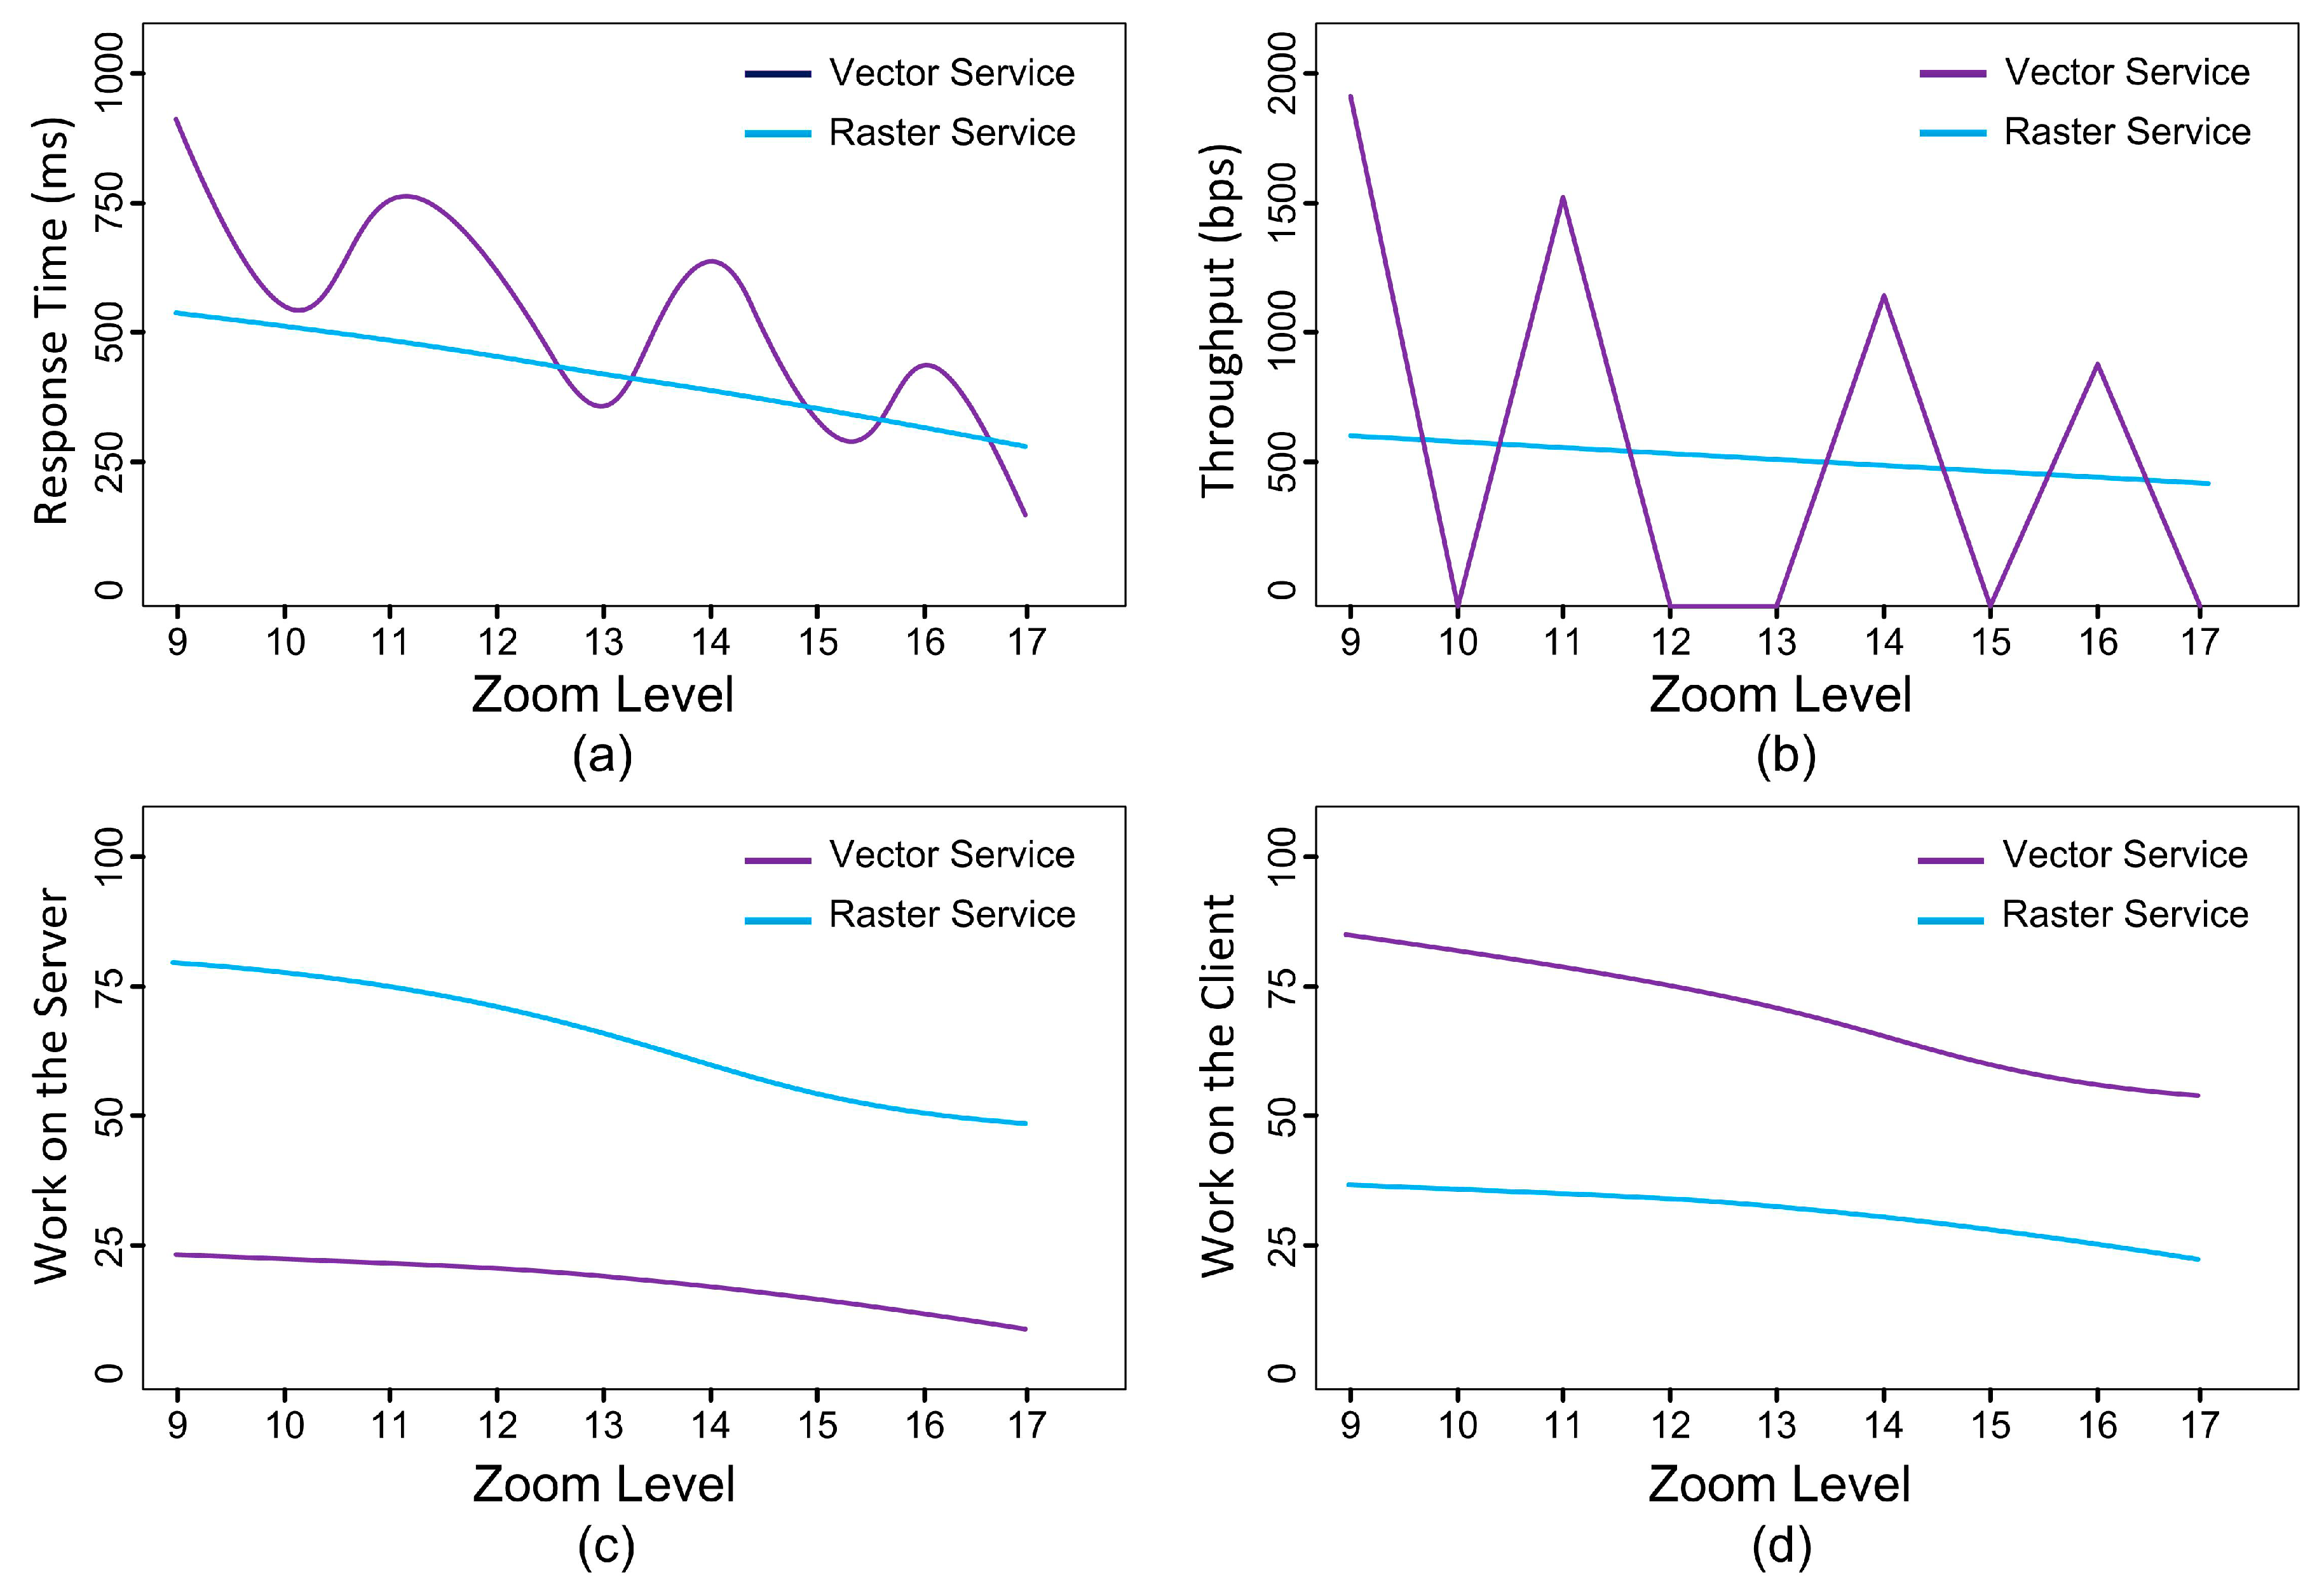
To achieve our goal, we created a PDF tile map pyramid model and successfully generated a PDF tile map based on DLG data and series scale digitally published topographic maps within a map sheet range of 1:1,000,000. The following conclusions can be drawn. First, the PDF tile map has the good characteristics of a vector map. The amount of PDF tile data for the same area is much smaller than the amount of raster tile data. The amplification of the PDF tile map retains the clarity of the vector graphics, while the amplification of raster tiles results in a reduction of resolution. Second, the PDF tile map model can seamlessly manage a series of scaled PDF maps, which provides multi-level adaptive display abilities. It can not only provide map services in the form of vector tiles, but also render the PDF tiles into PNG images at the server-terminal to provide map services in the form of raster tiles. The same level of PDF tiles can be rendered into different levels of raster tiles, and the rendering time of a single vector tile decreases as the tile level increases. Third, PDF tile mapping does not require the support of cartographic software or a symbol database when building the map service system. It simplifies the workflow of symbolization compared to a traditional vector tile map, and simultaneously reduces the requirement for the software and hardware of the system. Fourth, PDF tile map data is organized by the geometric data, attribute data, and symbolic data of a geographic entity. The symbolic information guarantees the ability of the PDF tile map to display the map, while the geometry and attribute information guarantees the interaction ability at the element level.
It can be seen that the PDF tile map model proposed in this paper has the characteristics of a vector tile map and has the ability to provide a web map service in the form of vector tiles. In the future, we will combine automatic cartographic generalization technology to realize the multi-representation of a PDF tile map. This improvement would enable the PDF tile map to automatically select and generalize map features with the zoom operation of the map.


