Article

Toward the Evolution of National Spatial Data Infrastructure Development in Indonesia

by
Tandang Yuliadi Dwi Putra
1,2,*,
Yoshihide Sekimoto
2 and
Ryosuke Shibasaki
3
1
Badan Informasi Geospasial, Jalan Raya Jakarta Bogor km. 46, Cibinong, Kabupaten Bogor 16911, Indonesia
2
Department of Civil Engineering, Graduate School of Engineering, The University of Tokyo, 7-3-1 Hongo Bunkyo-ku, Tokyo 113-8656, Japan
3
Center for Spatial Information Science, The University of Tokyo, 4-6-1 Komaba Meguro-ku, Tokyo 153-8505, Japan
*
Author to whom correspondence should be addressed.
ISPRS Int. J. Geo-Inf. 2019, 8(6), 263; https://doi.org/10.3390/ijgi8060263
Submission received: 11 April 2019 / Revised: 29 May 2019 / Accepted: 4 June 2019 / Published: 5 June 2019

Abstract

:
Over the last 25 years, the potential benefits of sharing and reusing geographic information for national development programs have led many countries to establish their own national spatial data infrastructure (NSDI). Indonesia is among the early adopters; however, despite its early introduction of NSDI concepts, the implementation has encountered some difficulties. The main objective of this study is to understand the evolution of NSDI development in Indonesia and then develop strategic directions for future implementation. We first characterized periods of current NSDI development based on the use of technology and identified problems that have occurred. To understand the problems’ causes, we conducted a stakeholder analysis utilizing questionnaire surveys. In addition, we analyzed cost components allocated for NSDI operation. The results showed that stakeholders’ low participation was caused by insufficient technological, financial, and human resources to manage geographic information. Subsequently, a strengths-weaknesses-opportunities-threats analysis was conducted to determine proposed directions of the institutional and technical aspects. This research provides the framework for analyzing NSDI evolution in one country—Indonesia. The proposed directions can be applied in other countries to ensure effective NSDI development and implementation.

1. Introduction

For the last 25 years, spatial data infrastructures (SDIs) have been recognized widely because they facilitate geographic data exchange and sharing. They help users at different levels (local, national, and regional) achieve their objectives by reducing data duplication as well as providing integration of fundamental datasets [1]. Several national SDI (NSDI) initiatives are being developed with the hope of improving national planning and supporting socio-economic development [2,3,4,5,6]. An NSDI is a framework of technology, standards, policy, and collaboration of different institutions to ensure national access, exchange, and utilization of spatial data [1,7]. Application of an NSDI can have positive influences on the social, environmental, and economic aspects of a country [8,9,10].
Since their initial development in the 1990s, NSDIs have evolved over different generations. The first generation was typically led by national mapping agencies to promote economic development, stimulate better government, and foster environmental sustainability [11]. The second generation facilitated data sharing and utilization using a geoportal, a key indicator in the operation [12]. Advancements in spatial technology and the internet have changed the NSDI landscape. Forthcoming development of SDI—expected to be influenced by the growing use of mobile computing and crowdsourcing—will lead to the need to integrate various types of data [13]. However, the NSDI’s ability to bring these technologies into use depends on not only technical aspects but also agreement with common policies, standards, and institutional frameworks [14,15].
Indonesia is considered an early adopter of the first-generation NSDI [11]. The National Coordinating Agency for Surveying and Mapping (Bakosurtanal) led the initiative in the early 1990s through a group meeting of several public institutions. The government wanted to coordinate various geographic information system (GIS) data produced by different agencies and reduce duplication of such data among them [16]. In 2011, the government issued the Geospatial Information Law as the main foundation of NSDI development in Indonesia. One goal of this law was to ensure the availability of, and access to, accountable geospatial information. To achieve this, there was a need to establish a geospatial information infrastructure incorporating the following five pillars: policy, institutional structure, technology, standards, and human resources. With the enactment of this law, Bakosurtanal was transformed into the Badan Informasi Geospasial (BIG) and became the national agency for organizing geospatial information.
Despite its timely adoption of the NSDI concept, Indonesia’s geospatial information development still faces some challenges. As stated in [17,18], the limited amount of detailed geospatial data in the form of high-scale urban planning maps is identified as an obstacle to regional development activities. Moreover, redundant datasets, such as road network layers, were provided by two different official agencies in a local government’s SDI operation [19]. Ineffective geospatial data sharing among government institutions still occurs in public administration processes, as recognized by [20]. Nevertheless, no comprehensive studies have investigated the cause of problems hampering NSDI development in Indonesia and how the interrelationships between stakeholders affect the implementation. Therefore, our research aims to understand the evolution of NSDI and then develop strategic directions for its upcoming implementation.
The rest of the paper is organized as follows. Section 2 explains the evolution of NSDI development in Indonesia, from its initial program to the present condition. It also identifies the problems of current NSDI implementation based on perspectives from participating institutions. Section 3 describes the stakeholder and cost analyses conducted to investigate the causes of these problems. Section 4 discusses the strengths, weaknesses, opportunities, and threats of NSDI implementation in Indonesia. Finally, Section 5 presents the proposed directions and conclusions of this study.

2. NSDI Development in Indonesia

2.1. Overview

Geospatial information activities in Indonesia started with several digital mapping projects in the 1980s and 1990s. Bakosurtanal, in cooperation with the Ministry of Transmigration and support from the UK, established the Regional Physical Planning Program for the Transmigration project in 1984 to map nationwide land systems used for regional planning [21]. Another mapping activity, called the Land Resource Evaluation Project (LREP), was conducted in two phases with support from the Asian Development Bank. LREP 1 (1986–1991) was conducted in Sumatra and West Java, whereas LREP 2 (1991–1996) was conducted in 13 provinces across Java, Kalimantan, Sulawesi, Nusa Tenggara, Maluku, and the Papua islands [22]. In addition to the land maps, the government launched the Marine Resource Evaluation and Planning project from 1993 to 1998 to provide base maps and databases to strengthen both marine and coastal planning management and information systems [23].
NSDI development was initiated in 1991 during the first meeting of a group called the Sistem Informasi Geografis Nasional [National Geographic Information System] Forum comprised of different government agencies [16]. In that meeting, organized by Bakosurtanal, all participants recognized the importance of making GIS data accessible to and exchangeable with other institutions. Regular meetings continued, with discussion of related topics such as the national geodatabase and metadata concept [24]. The NSDI was formally declared at the National Coordination Meeting of Survey and Mapping in 2000, and its objective was to provide good quality, easily accessible, and integrated spatial data for national development [25].
In the years following NSDI’s declaration, several programs were established to continue the development. Government agencies were encouraged to create metadata for each map produced from the mapping activities. The Federal Geographic Data Committee adopted a standard for developing metadata [24], and the National Geospatial Data Clearinghouse prototype was established in 2004 to collect metadata from data producers. The clearinghouse consisted of several metadata servers interconnected via a distributed system [26]. In 2007, Bakosurtanal developed a national information system called Sistem Informasi Spasial Nasional (SISN) to create a platform for e-government application based on geospatial data. At that time, many government agencies provided their data, including Bakosurtanal, the Central Bureau of Statistics, and the Coordinating Ministry of People’s Welfare [27].
Although NSDI development continued, the policy and legal aspects took some time to be established. Presidential Decree No. 85 was issued in 2007 to set up the NSDI. The decree was expected to support NSDI implementation by providing a platform for data sharing among government agencies. However, the decree was insufficient due to a change in the institutional settings and rapid progression of technology [17]. Four years later, the government enacted the Geospatial Information Law to strengthen the legal foundation. The law specifies the NSDI framework and provides further details such as its definition and components as well as its facilitation by Government Regulation No. 9 issued in 2014. In the same year, Presidential Decree No. 27/2014 was issued to organize the National Geospatial Information Network (NGIN) and replace the previous decree. The One Map Policy was declared by Presidential Decree No. 9/2016 in response to inconsistencies in forested areas on maps produced by the Ministry of Forestry and Ministry of Environment [28]. These discrepancies could lead to overlapping land permits and conflicts over space exploitation. Therefore, the decree stipulates that all thematic geospatial information should refer to one common reference, standard, database, and geoportal.
The institutional arrangement of Indonesia’s NSDI is defined by Presidential Decree No. 27/2014. According to the decree, participants of geospatial information sharing are called “network nodes” (simpul jaringan) and are classified into central and local network nodes. The “central network nodes” include ministries, state institutions, central government agencies, national police, and national armed forces. Meanwhile, “local network nodes” consist of provincial, municipal, and district governments. Each network node is responsible for collecting, maintaining, updating, exchanging, and disseminating specific geospatial data. The nodes have unique clearinghouse units and should connect to the NGIN. BIG is mandated as the “network nodes connector” responsible for developing, integrating, and managing other network nodes, as well as for operating the NGIN and national geoportal.
The national geoportal, Ina-Geoportal (http://tanahair.indonesia.go.id), was launched in October 2011. The portal facilitates access and sharing of geospatial data between government institutions. It utilizes web services to retrieve maps provided by data providers and then reuses them to create thematic data services. Currently, users are able to download geospatial information in the GIS format. The service supports the Open Geospatial Consortium Web Map Service (WMS), Web Feature Service (WFS), and another open standard (GeoJSON files) as well. Since 2013, BIG has developed a large computing infrastructure equipped with more than 300 servers, 3,200 terabytes of data storage, and 1 Gbps internet bandwidth. This helps support the Ina-Geoportal and maintain the NSDI network’s operation [29].
According to the Geospatial Information Law, standardization covers five phases: geospatial data acquisition, information processing, storage and security, information distribution, and information usage. Two methods were used to compose the geospatial information standards. First, the government created a new national standard and then adopted standards from the International Organization for Standardization (ISO). At present, 60 national standards have been published, with 26 adopted from the ISO 19100 series [30]. In addition, according to a decree from the head of BIG, the government published technical specifications, such as for the Indonesian Geospatial Reference System (SRGI2013) and Indonesian Geospatial Feature Catalogue (KUGI).
Based on extensive documentary analysis, we distinguished three periods of Indonesia’s NSDI development. These periods are defined mainly based on technological changes in managing geospatial data and information. The first development period occurred in the first decade of its adoption (1991–2000) when most of the activities conducted were digital mapping projects. Bakosurtanal managed these projects, and the data were stored in a centralized geodatabase [24]. Data sharing between government agencies was rare during this period.
The second development period occurred between 2001 and 2010 and included a shift in data management. With the adoption of a distributed system, government agencies started to share their data. They created geospatial metadata and stored them in a metadata server that was interconnected via a national clearinghouse [26]. Users could search and retrieve metadata information, but accessing the data content required contacting the data producer offline. In addition, web mapping applications such as SISN were developed to support decision making for social issues such as health and welfare [27].
The last period, starting from 2011 through the present time, was initiated with the operation of Ina-Geoportal. The portal implements distributed GIS technology and acts as a gateway to geographic data produced by the network nodes. Each network node has its own database, publishes data content using web services, and shares data on the Ina-Geoportal. This allows users to access online both metadata and the actual geographic data (ESRI Shapefiles, WMS, or WFS), such as administrative boundaries, built environments, and the transportation network. Several applications were created to utilize such data, such as the One Map Application that visualizes and analyzes 85 thematic maps produced by various government agencies [31]. The government has been focused on providing open data during this period, which is thus referred to as the open initiative period. Table 1 summarizes the three periods by identifying institutions involved in the NSDI as well as presents the data policy, technological changes, and recognized users.

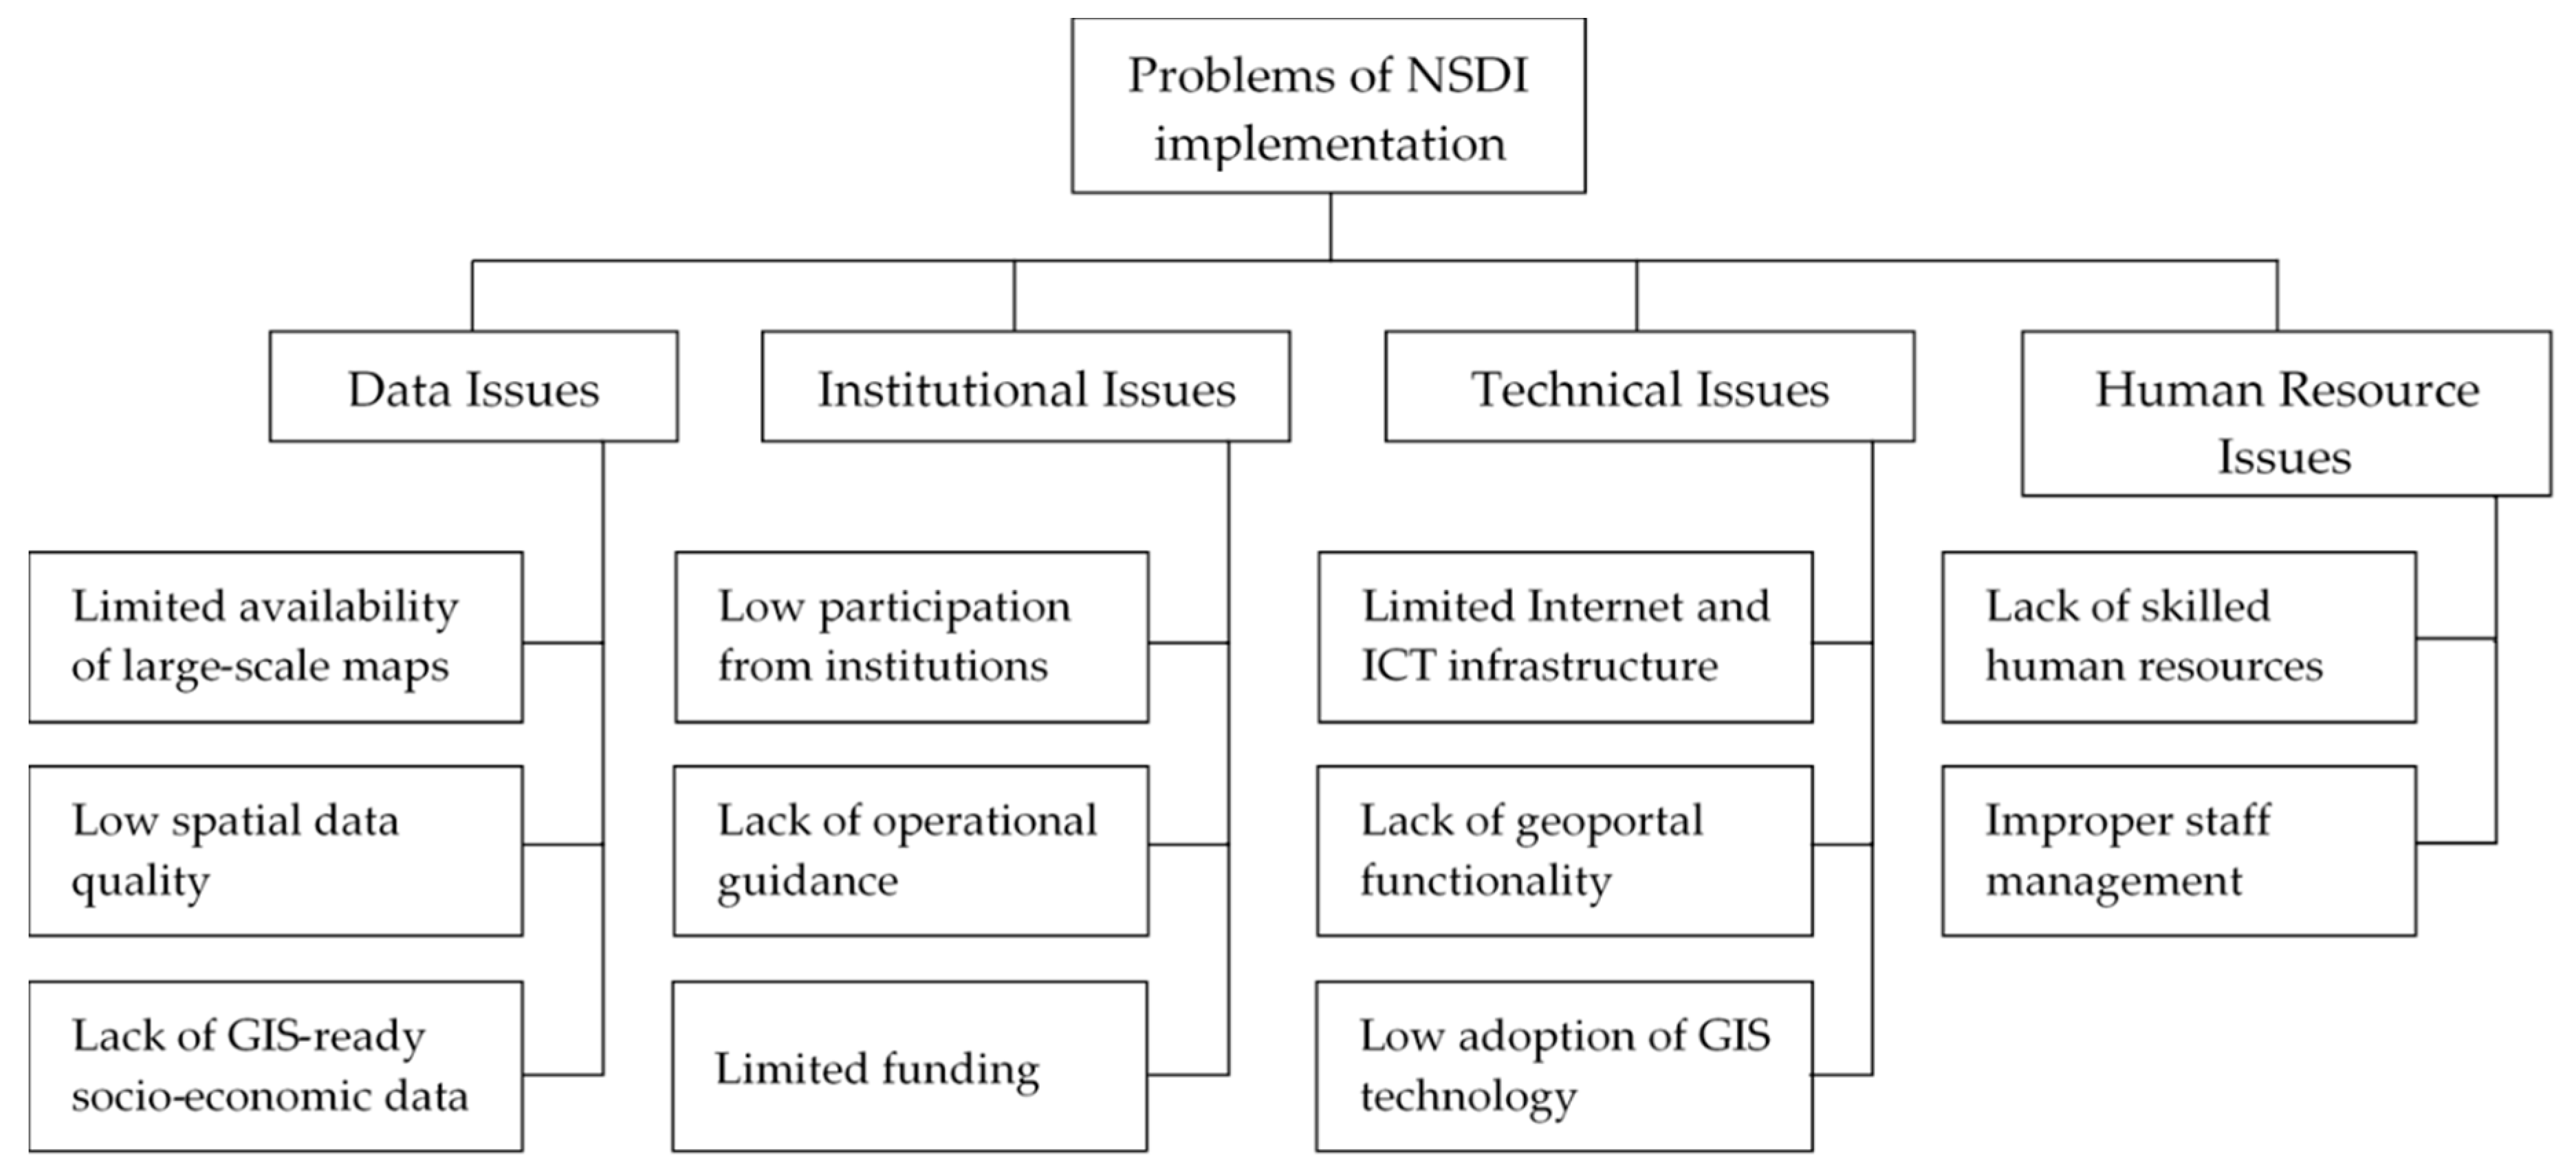
2.2. Problem Identification

In June 2017, to identify the problems of NSDI implementation, we conducted semi-structured interviews with stakeholder representatives in Indonesia. We used the purposive sampling technique to identify the representatives based on two criteria. First, we selected interviewees with experience in geospatial information activities. Second, we selected interviewees who were aware of or used NSDI data and services. Discussions with BIG officials helped us recognize the potential respondents. Our familiarity with Indonesia’s NSDI initiative was helpful in selecting appropriate individuals with suitable experience and knowledge.
We selected 18 representatives for interview activities: eight worked for government agencies, seven for private companies, and three for academic institutions. The roles of the interviewees varied; they included: an SDI coordinator at ministries, a GIS manager at local government, a director of the GIS software provider, an information technology (IT) executive at a web mapping company, and an associate professor at a university. Appendix A shows the interviewees’ institutions and positions.
In the first part of the interview, we collected the profile information. All interviewees claimed to have experience with GIS activities and projects of varied durations. Nine representatives practiced GIS for more than 10 years, while six worked in GIS-related fields for four to 10 years. Only three had less than four years of experience. In terms of educational background, two interviewees held doctoral degrees, and six held graduate degrees from a master’s program. The rest held bachelor’s degrees. More than half of the interviewees (10 representatives) studied geography, geodetics, or geomatics, whereas three graduated from the IT field. The other five representatives had different educational backgrounds such as agriculture, management, and mechanical engineering.
In the second part, we asked the representatives’ views on NSDI development, as well as the potential problems facing Indonesia. Most felt that the NSDI initiative is important and beneficial for their institutions, particularly for sharing geospatial data. The NSDI allows spatial data produced by government agencies to be used by other institutions. However, some interviewees (Int13, Int14, Int16, and Int17) felt that progress is still relatively slow, because it focuses on basic geospatial data, and these data are not updated regularly.
The interviewees mentioned a wide variety of NSDI problems based on their perspectives. These problems are related to the data, institution, technical, and human resource issues, as presented in Figure 1. Eight of the representatives mentioned data issues. An example was the limited availability of large-scale maps, particularly topographic maps in the 1:5000 scale (Int1, Int3–5, Int9, Int13, Int17, and Int18). The interviewees recognized that detailed maps are important in spatial planning for regional development and are the basis for spatial analysis in the decision-making process. Their perspective is in accordance with a report noting that, currently, only about 1% (3,922 from among 377,824 mapsheets) of the 1:5000 scale basic maps are available [32]. Four interviewees (Int3, Int11, Int12, and Int17) were concerned about the quality of geospatial data produced by the data provider. They believe it is necessary to improve the quality of data, particularly its accuracy, and ensure timely updates. The representatives also identified the lack of GIS-ready socio-economic data, which are required to create value-added information (Int12, Int15).
Five representatives (Int3, Int6, Int10, Int14, and Int16) mentioned technical issues: They felt that the internet and information communication technology (ICT) infrastructure condition might hamper NSDI implementation. They argued that internet connections are still weak in most local governments, especially for publishing geospatial data. The fact that Indonesia still ranked 111th among 176 countries in the International Telecommunication Union’s ICT Development Index in 2017 [33] supports this opinion. Other technical problems included the lack of Ina-Geoportal functionality (Int3, Int11, Int15, and Int16) and low adoption of GIS technology (Int2, Int11).
Finally, seven representatives (Int1, Int2, Int5, Int7, Int8, Int10, and Int17) mentioned human resource issues, specifically, the insufficient number of staff members having graduated from GIS-related fields. The number of staff members with the ability to manage geospatial information and operate the geospatial server for publishing map services is also limited. In addition, the interviewees mentioned improper staff management, including frequent rotation of government employees. It is difficult to find replacements for rotated employees with knowledge of geospatial information (Int1, Int7).

3. NSDI Stakeholder Analysis and Cost Analysis

We conducted stakeholder analysis and cost analysis to further investigate the causes of problems in NSDI implementation. Particularly, we focused on the two most frequent problems identified in the previous section: low participation from institutions, and limited availability of large-scale maps. NSDI is considered a complex system because its implementation includes dynamic negotiation and arrangement between different actors [34]. Thus, analysis of its stakeholders and their interrelation is necessary to find optimal support for NSDI development. In addition, our study analyzed the financial aspect to understand NSDI’s budget allocation and investigate efficient methods for providing large-scale basic maps.

3.1. Stakeholder Analysis

The NSDI stakeholder analysis framework followed a three-step process [35]: identifying stakeholders, categorizing stakeholders, and investigating relationships. For identifying NSDI stakeholders, we collected documentary evidence, including legal documents, meeting records, and annual reports. The authors’ familiarity with Indonesia’s NSDI facilitated access to these documents. Additionally, in-depth observation of the national geoportal was made to identify the users and participating actors.
To categorize stakeholders, we adopted the power-interest grid method, popular for classifying stakeholders based on their power to influence and their interest in a project [35,36]. Stakeholders’ interests and influences were identified during interview activities for identification of NSDI implementation problems. Despite the benefits of classifying stakeholders, some limitations of this method include a tendency to identify the “usual suspect” and absence of direct stakeholder participation [35]. To overcome bias, we added four elements that played important roles in NSDI implementation: geospatial data provision, technological infrastructure, financial resources, and human capacity. Geospatial data are at the center of every SDI initiative [1], and their availability attracts participants and users. The provision of digital data is considered as a key variable in assessing NSDIs, particularly in developing countries [37]. The technological infrastructure of access networks is critical for the use of data and services from SDIs [38]. Information is essential for NSDI implementation, specifically to ensure the capability of each network node to publish its data and connect to the national geoportal. Financial resources refer to the sources of funding to develop an SDI, including the budget for data management, institutional arrangements, hardware, and software [38]. This element is necessary to measure stakeholders’ ability to provide a sustainable budget. Finally, human capacity assesses the availability of GIS workers or the personnel of each stakeholder. As mentioned by [39], an SDI’s technological components alone will not ensure success in achieving the objectives. Skilled human resources are crucial for effective NSDI implementation. Appendix B presents descriptions of the four NSDI features with detailed indicators using a five-point Likert scale.
We used questionnaire surveys for collecting information about the stakeholders’ resources related to NSDI. We distributed the questionnaire to public institutions, private sectors, and academic institutions involved in the NSDI initiatives. To ensure reliability of the survey, we targeted representatives from central and local government agencies from public institutions, as well as survey and mapping and geospatial application companies from the private sector. The questionnaires were collected in August 2017, and we received feedback from 46 participating respondents. Five of the respondents were from central government agencies, four from provincial governments, 28 from municipal/district government agencies, one from a GIS software provider, two from survey and mapping companies, three from geospatial application developers, and three from universities.
The final step was investigating the relationships among the stakeholders involved in NSDI implementation. An actor-linkage matrix was used to list and describe these interrelations. Advantages of using a matrix included the ability to assess institutional connections of a system and quantify the strengths or weaknesses of each linkage [40]. To determine the relationships among NSDI stakeholders, we defined three indicators as follows: existence of collaboration, occurrence of communication, and data sharing practice. Collaboration is critical for the development of SDIs [41]. Therefore, any cooperation related to geospatial information between stakeholders improves the NSDI implementation. The second indicator used to measure stakeholders’ communication is the occurrence of regular meetings to discuss NSDI activities. The third indicator is the existence of geospatial data sharing between stakeholders. This indicator shows whether an institution has shared data with other agencies or utilized data provided by other institutions. Based on the identified number of interrelations, we developed an actor-linkage graph. The graph illustrates the link between stakeholders in an NSDI environment.

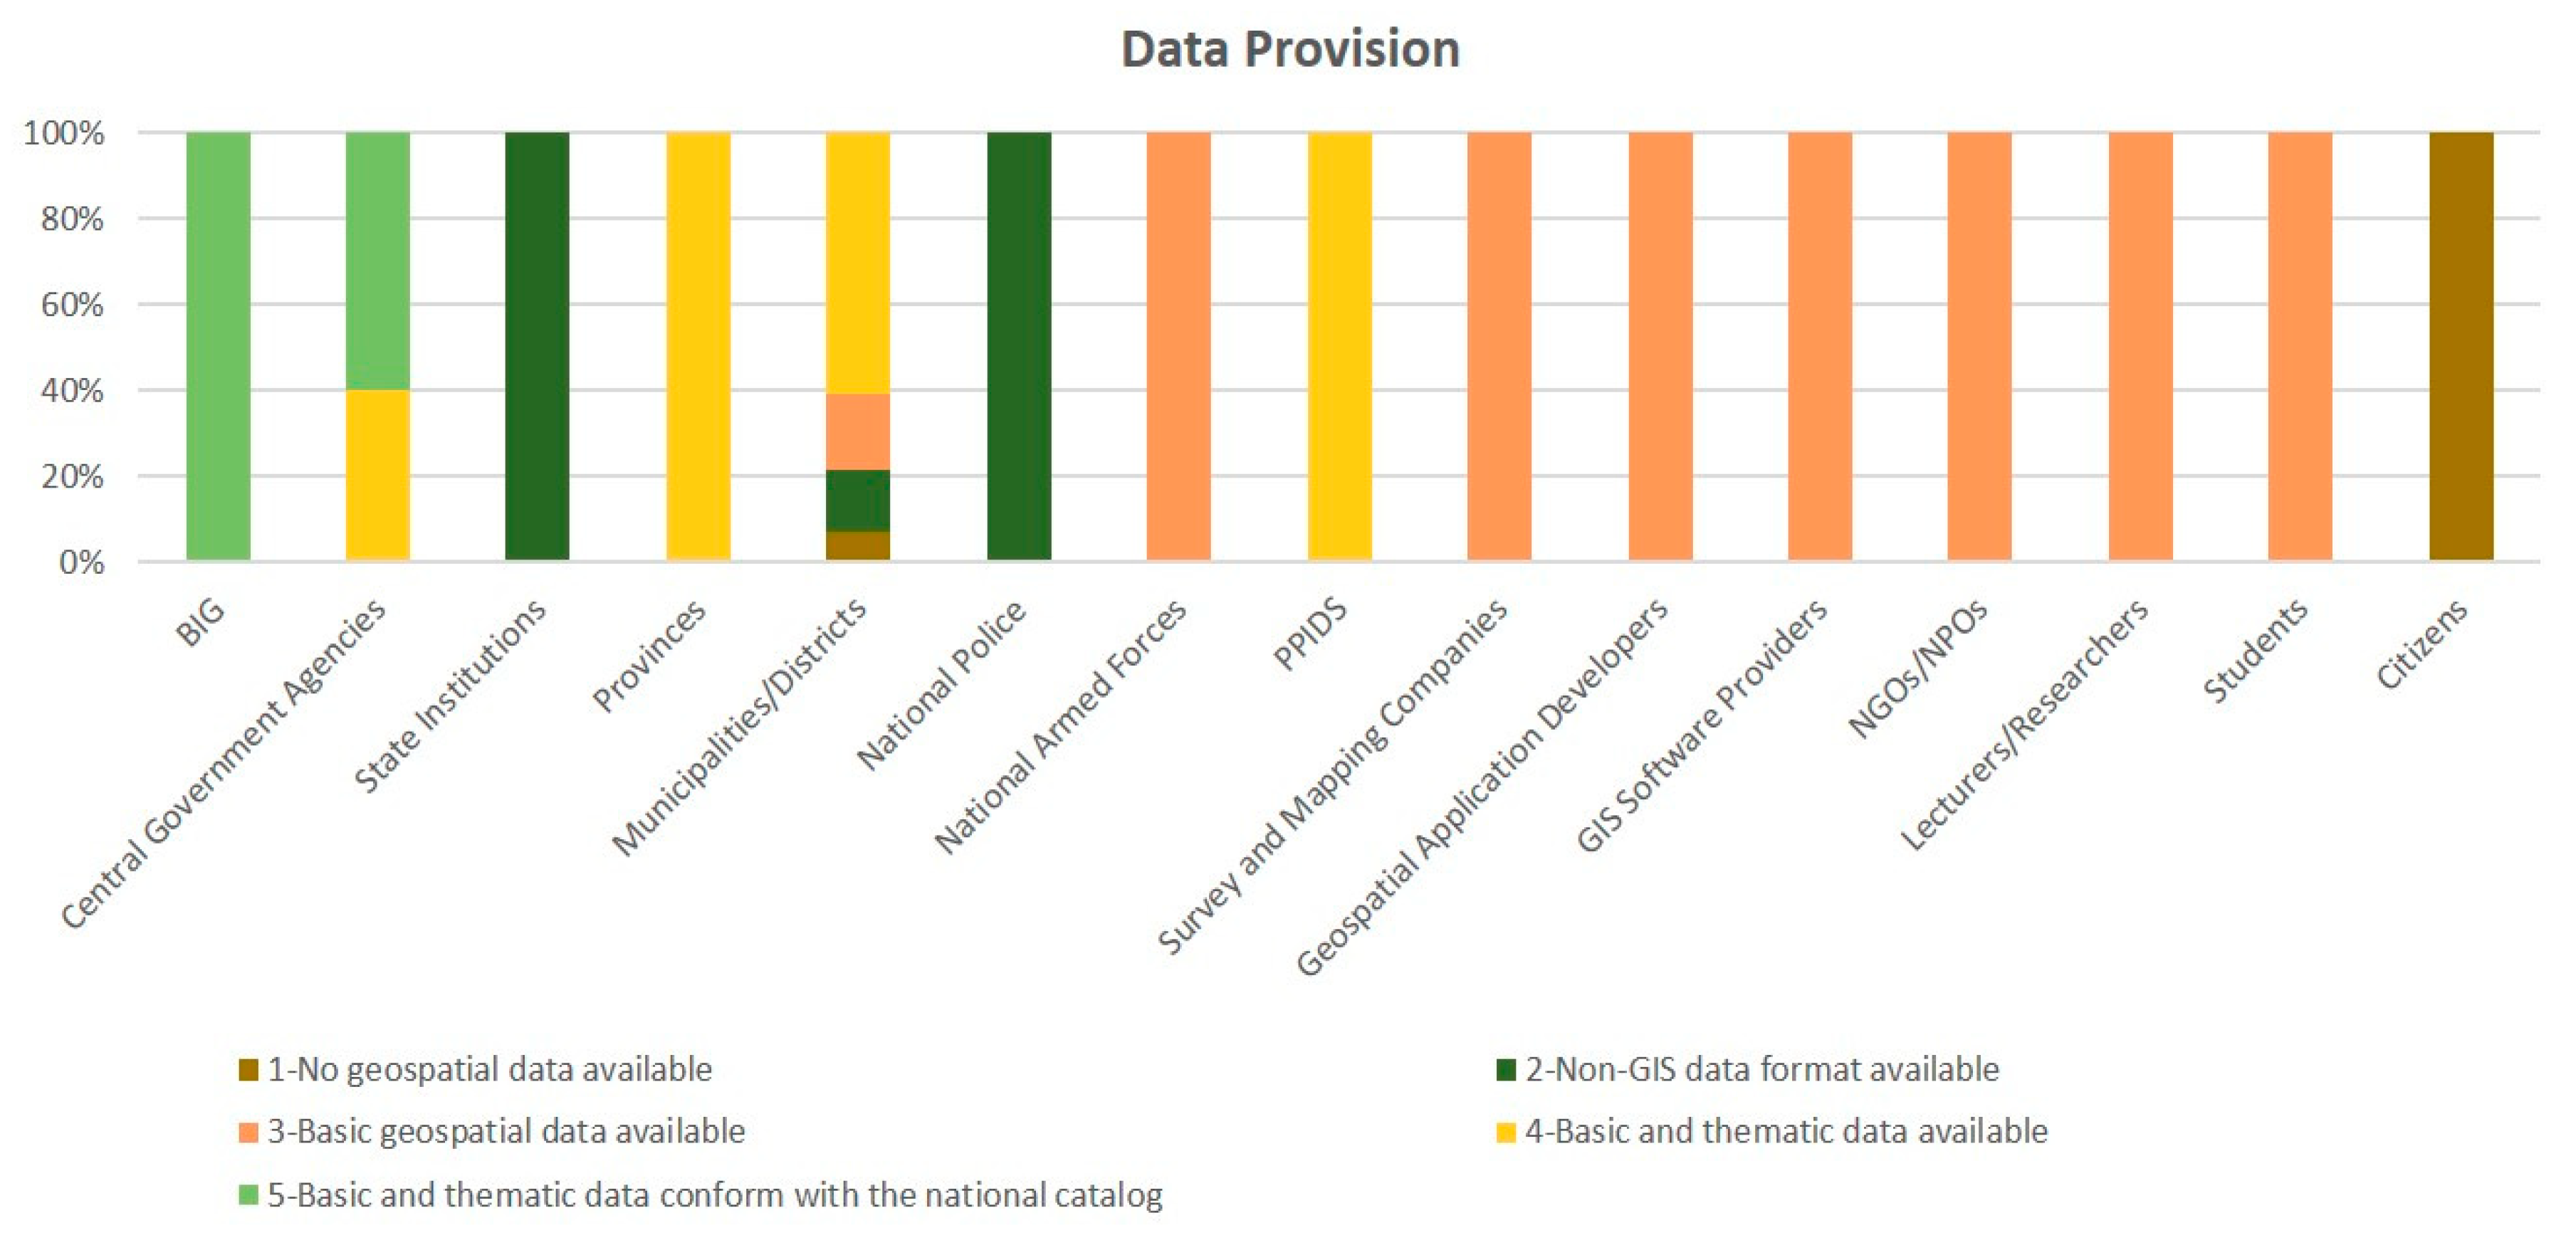
3.1.1. Identification of NSDI Stakeholders

The NGIN decree explicitly specifies the institutions involved in implementing NSDI in Indonesia. These network nodes consist of state institutions, central government agencies, national police, national armed forces, provincial government, and municipality/district government (article 4). Examples of state institutions include the house of representatives, supreme court, and supreme audit institution. Central government agencies comprise ministries and non-ministerial government institutions. Besides the network nodes, the decree states (article 14) that general users can participate in geospatial information networks.
According to the NGIN decree, BIG, the network nodes connector, can establish cooperation with other institutions to improve NSDI implementation in the local government. Therefore, BIG invites local universities with relevant geospatial information expertise to take part in the activities. This collaboration, known as the Center for SDI Development (Pusat Pengembangan Infrastruktur Data Spasial; PPIDS) acts as a regional center for innovation and consultation for neighboring local governments. By the end of 2015, 13 universities were established as PPIDS, including the Gadjah Mada University and Bandung Institute of Technology [42].
In addition to the documented facts, we observed the users of Ina-Geoportal to identify other actors. Based on the data received from BIG, there were 17,397 registered users as of December 2017. Most users (55.4%) worked in academia, including researchers, lecturers, and students (see Figure 2). Users from the private sectors (13%) worked with survey and mapping companies, GIS software providers, or geospatial information developers. Other types of users worked in non-governmental organizations (NGOs) or non-profit organizations (NPOs), were GIS consultants, and were general citizens.
After analyzing the evidence, we identified 15 stakeholders involved in Indonesia’s NSDI, as presented in the second column of Table 2. The first seven NSDI stakeholders are from government agencies. Each of these institutions is responsible for providing geospatial data based on its particular function. For instance, BIG, as the national mapping agency, produces geospatial maps that include topographic layers and coastal and marine environments. The provincial and municipal/district governments are responsible for data developed in their administrative areas. Meanwhile, central government agencies consist of 34 ministries and 30 non-ministerial government institutions. Presidential Decree No. 9/2016 on the acceleration of the One Map Policy’s implementation at the 1:50,000 map scale specifies thematic data that should be arranged by these institutions.

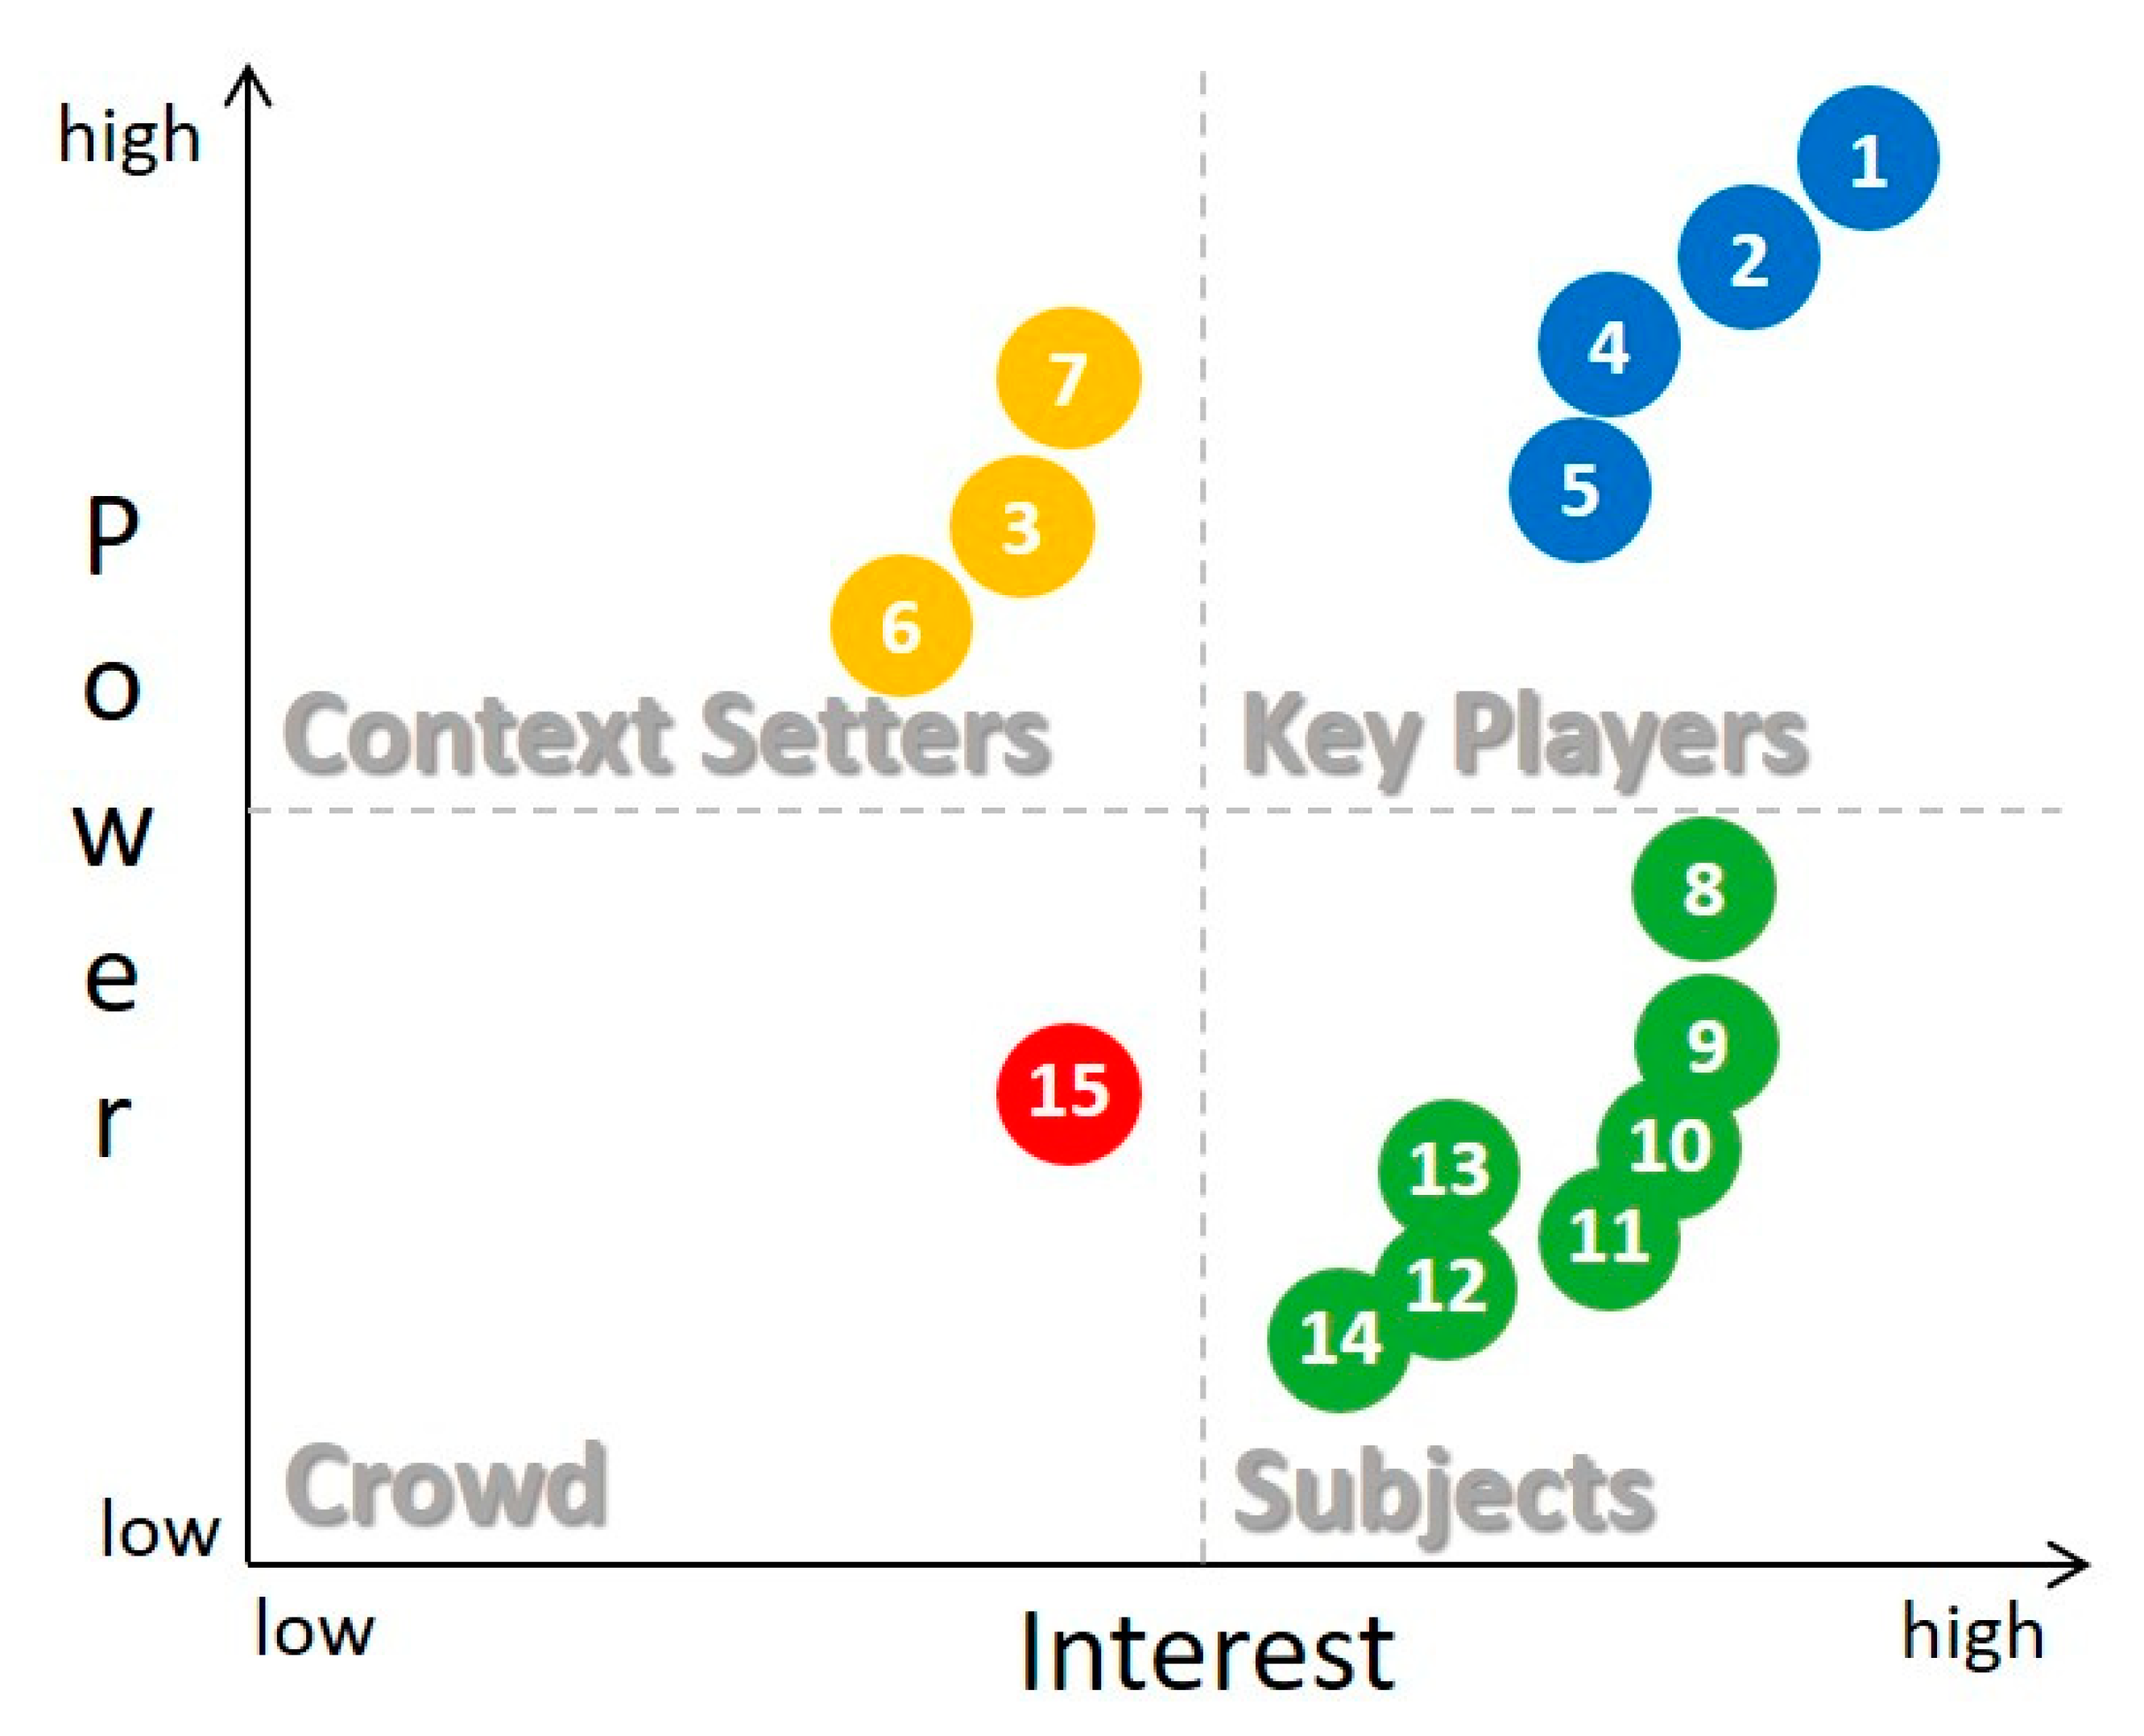
3.1.2. Categorization of NSDI Stakeholders

All stakeholders defined in the previous step (Section 3.1.1) have their own interests and power to affect NSDI implementation. Power refers to the stakeholders’ capability to arrange their own SDI, which is an explicit mandate for all network nodes. For example, central government agencies have an interest in NSDI because they want to collect topographic maps, exchange thematic data with other institutions, and access geospatial web services. They are considered powerful because, based on Presidential Decree No. 27/2014, they have a responsibility to build network nodes. They are able to establish internal policy to support NSDI implementation and provide resources such as financial support. In contrast, stakeholders 8–15 (see Table 2) are less powerful since they are not explicitly mandated by regulation. They are considered users of NSDI with no obligation to publish geospatial data in the national geoportal. Based on the interview results and documentary evidence, we generated Table 2 to list the interests and power of each stakeholder.
Based on the stakeholders’ interest and influence (Table 2), we developed the power-interest grid of NSDI stakeholders in Indonesia (see Figure 3). The grid distinguishes stakeholders into four quadrants: key players, context setters, subjects, and crowd. Stakeholders in the right-hand quadrants have the most interest in the project, but with varying degrees of power to influence. Key players, positioned on top of the right-hand side, have a more significant influence on the system, whereas subjects have less. The two left-hand quadrants display stakeholders with less interest; the context setter may have a high degree of power, while the crowd shows low power and low interest in the system as well [36]. In general, both key players and context setters are mainly from governmental institutions. Seven of the stakeholders with high interest in NSDI, but with less power, are placed in the subjects’ grid. Citizens are considered as crowd since they have relatively low interest and little power.
In Figure 3, the four institutions positioned as key players (blue color) are BIG (1), central government agencies (2), provincial government (4), and municipality/district government (5). These stakeholders have high interest in utilizing geospatial information, such as collecting topographic maps, sharing thematic data, and accessing web services provided by Ina-Geoportal. All key players have more power to affect NSDI, since they are specified in the NGIN decree as network nodes. Meanwhile, BIG has an additional role as the network nodes connector, and its position is slightly higher than the positions of the other stakeholders in this grid. Central government agencies, provincial government, and municipality/district government have the same role as members of the network nodes. However, as the data coverage of central government agencies is nationwide, their position is above the positions of the provincial and municipality/district governments. The provincial government’s position is above that of the municipality/district government because, based on the administrative regulations (Law No. 23/2014), it has more responsibility as the regional representative of the central government. Stakeholders in this quadrant have issued their own regulations to obtain the resources needed for NSDI activities. For example, the Ministry of Forestry and Environment published Ministerial Decree No. P28/Menlhk/Setjen/KUM.1/2/2016 about the geospatial information network. In addition, West Java Province issued Governor Decree No. 80/2015 for One Data Development in West Java. The key players have strong influences on NSDI implementation, since they provide the geospatial data and web services used by other institutions.
Context setters (in yellow) affect NSDI operations but possess low interest. The stakeholders in this group include state institutions (2), national police (6), and national armed forces (7). The NGIN decree states that they are members of the network nodes. In Indonesia, state institutions have authority granted by the 1945 Constitution, including the house of representatives, regional representative board, supreme court, and the supreme audit institution. Although state institutions have high power to affect NSDI development, currently, their interest is still low. This is evidenced by their absence as data providers in NSDI networks. Therefore, they are positioned in the context setters quadrant. The national armed forces’ position is, to some extent, higher than that of state institutions and the national police, since they have a working unit of geospatial information called Topographic Directorate of Army. In general, the interest of the context setters is still limited in collecting basic geospatial data.
There are seven types of stakeholders in the subjects grid (in green) that can be classified into institutions from private sectors, academia, and NGOs/NPOs. Most of them have a strong interest in collecting geospatial data and accessing services from the geoportal, particularly researchers and students. PPIDS (8) has a higher position, since it cooperates with BIG to support research related to the utilization of geospatial information, and it collaborates with the local government to improve human resource capacity. Private sectors have a role in geospatial data acquisition and development of geospatial applications. Most private sector institutions include survey and mapping companies (9), which obtain projects from government institutions. Their position is somewhat above that of geospatial application developers (10) and GIS software providers (11), because they participate in geospatial data provision for the NSDI. Furthermore, NGOs/NPOs (12), lecturers/researchers (13), and students (14) have similar interests and power. One exception is lecturers/researchers, who have more impact on utilization of geospatial data for research.
The last grid is crowd (in red), which consists of citizens (15) who mainly access the national geoportal. Their interests are exploring map visualization in the portal and looking for basic geospatial information (i.e., topographic maps).
In spite of its advantage in characterizing stakeholders according to their interests and influence, the power-interest grid cannot identify the correlation between their resources. Therefore, the authors generated the NSDI stakeholder diagram to overcome this limitation. The diagram has been created based on the questionnaire surveys results of the NSDI stakeholders.
Results of the data availability of each stakeholder showed that BIG and 60% of the central government agencies have basic and thematic geospatial data (see Figure 4). Their data can be integrated, since the data already conform to the Indonesian geospatial feature catalog. State institutions, national police, and a small number of municipalities/districts have data related to location, but in non-GIS formats such as PDF or Microsoft Excel files. Among the subjects stakeholders, PPIDS is equipped with basic and thematic geospatial data. National armed forces, survey and mapping companies, geospatial application developers, GIS software providers, NGOs/NPOs, lecturers/researchers, and students only have basic geospatial data available.
Related to technological infrastructure, most key players prepare infrastructure resources (see Figure 5). BIG, central government agencies, and some provinces are already developing geoportals and establishing dedicated data centers to manage geospatial hardware and software. However, some municipalities/districts have neither GIS software nor internet connections, and only 20% are capable of publishing data. Lack of technical support was also identified in state institutions, national police, and citizens. On the other hand, private sectors such as survey and mapping companies, geospatial application developers, and GIS software providers seem to have adequate technology for publishing geospatial services.
As for human capacity, BIG and central government agencies are supported by a large number of skilled personnel (see Figure 6). BIG, as the national agency for geospatial information development, has more than 200 employees with a background in geography or geodesy. Most central government agencies have more than 10 employees available. Private companies typically have sufficient human resources. For example, one geospatial application company hired 70 employees who were geographic information science graduates. Insufficient number of GIS personnel exists in most other NSDI stakeholders, including provinces, municipalities/districts, state institutions, national police, and NGOs/NPOs.
Results on financial resources (see Figure 7) reveal that BIG and central government agencies are backed by appropriately sustainable budgets for geospatial data provision and dissemination (about IDR 5 billion/US$ 370,000 annually). The financial support in municipalities/districts is varied: Half of them do not have the budget for data provision or dissemination. State institutions, NGOs/NPOs, and lecturers/researcher typically have incidental or project-based financial support. The national armed forces have somewhat better funding than the national police due to existence of the topographic mapping department.
Based on the questionnaire results, we determined the average value of NSDI features using a five-point Likert scale (see Table A3 in Appendix B). Based on this calculation, we created an NSDI stakeholder diagram (Figure 8) to visualize the association between stakeholders’ power and interest with their existing features. The diagram axes represent current resource availability of the stakeholders. The four quadrants of the power-interest grid can also be seen in Figure 8.
In Figure 8, the key players quadrant shows that only BIG (1) and central government agencies (2) have adequate resources. Although the other two players possess strong interest and influence, they have limitations in their resources. For example, provincial governments (4) were supported by decent data provision and technological infrastructure but lacked in the human capacity aspect. Municipalities/districts (5) have shortcomings in the areas of GIS-skilled staff, technical resources, and financial support, which lead them to contribute to NSDI networks passively.
The context setters quadrant shows that state institutions (3) and national police (6) have limited NSDI features, as they only scored 2.0 for most indicators, while national armed forces (7) have better support in data availability and personnel.
The subjects quadrant shows seven stakeholders clustered into three groups. PPIDS (8) has sufficient data and technological support. Survey and mapping companies (9), geospatial application developers (10), and GIS software providers (11) share the same capabilities as the private sectors. NGOs/NPOs (12), lecturers/researchers (13), and students (14) have moderate restrictions in labor and financial resources.

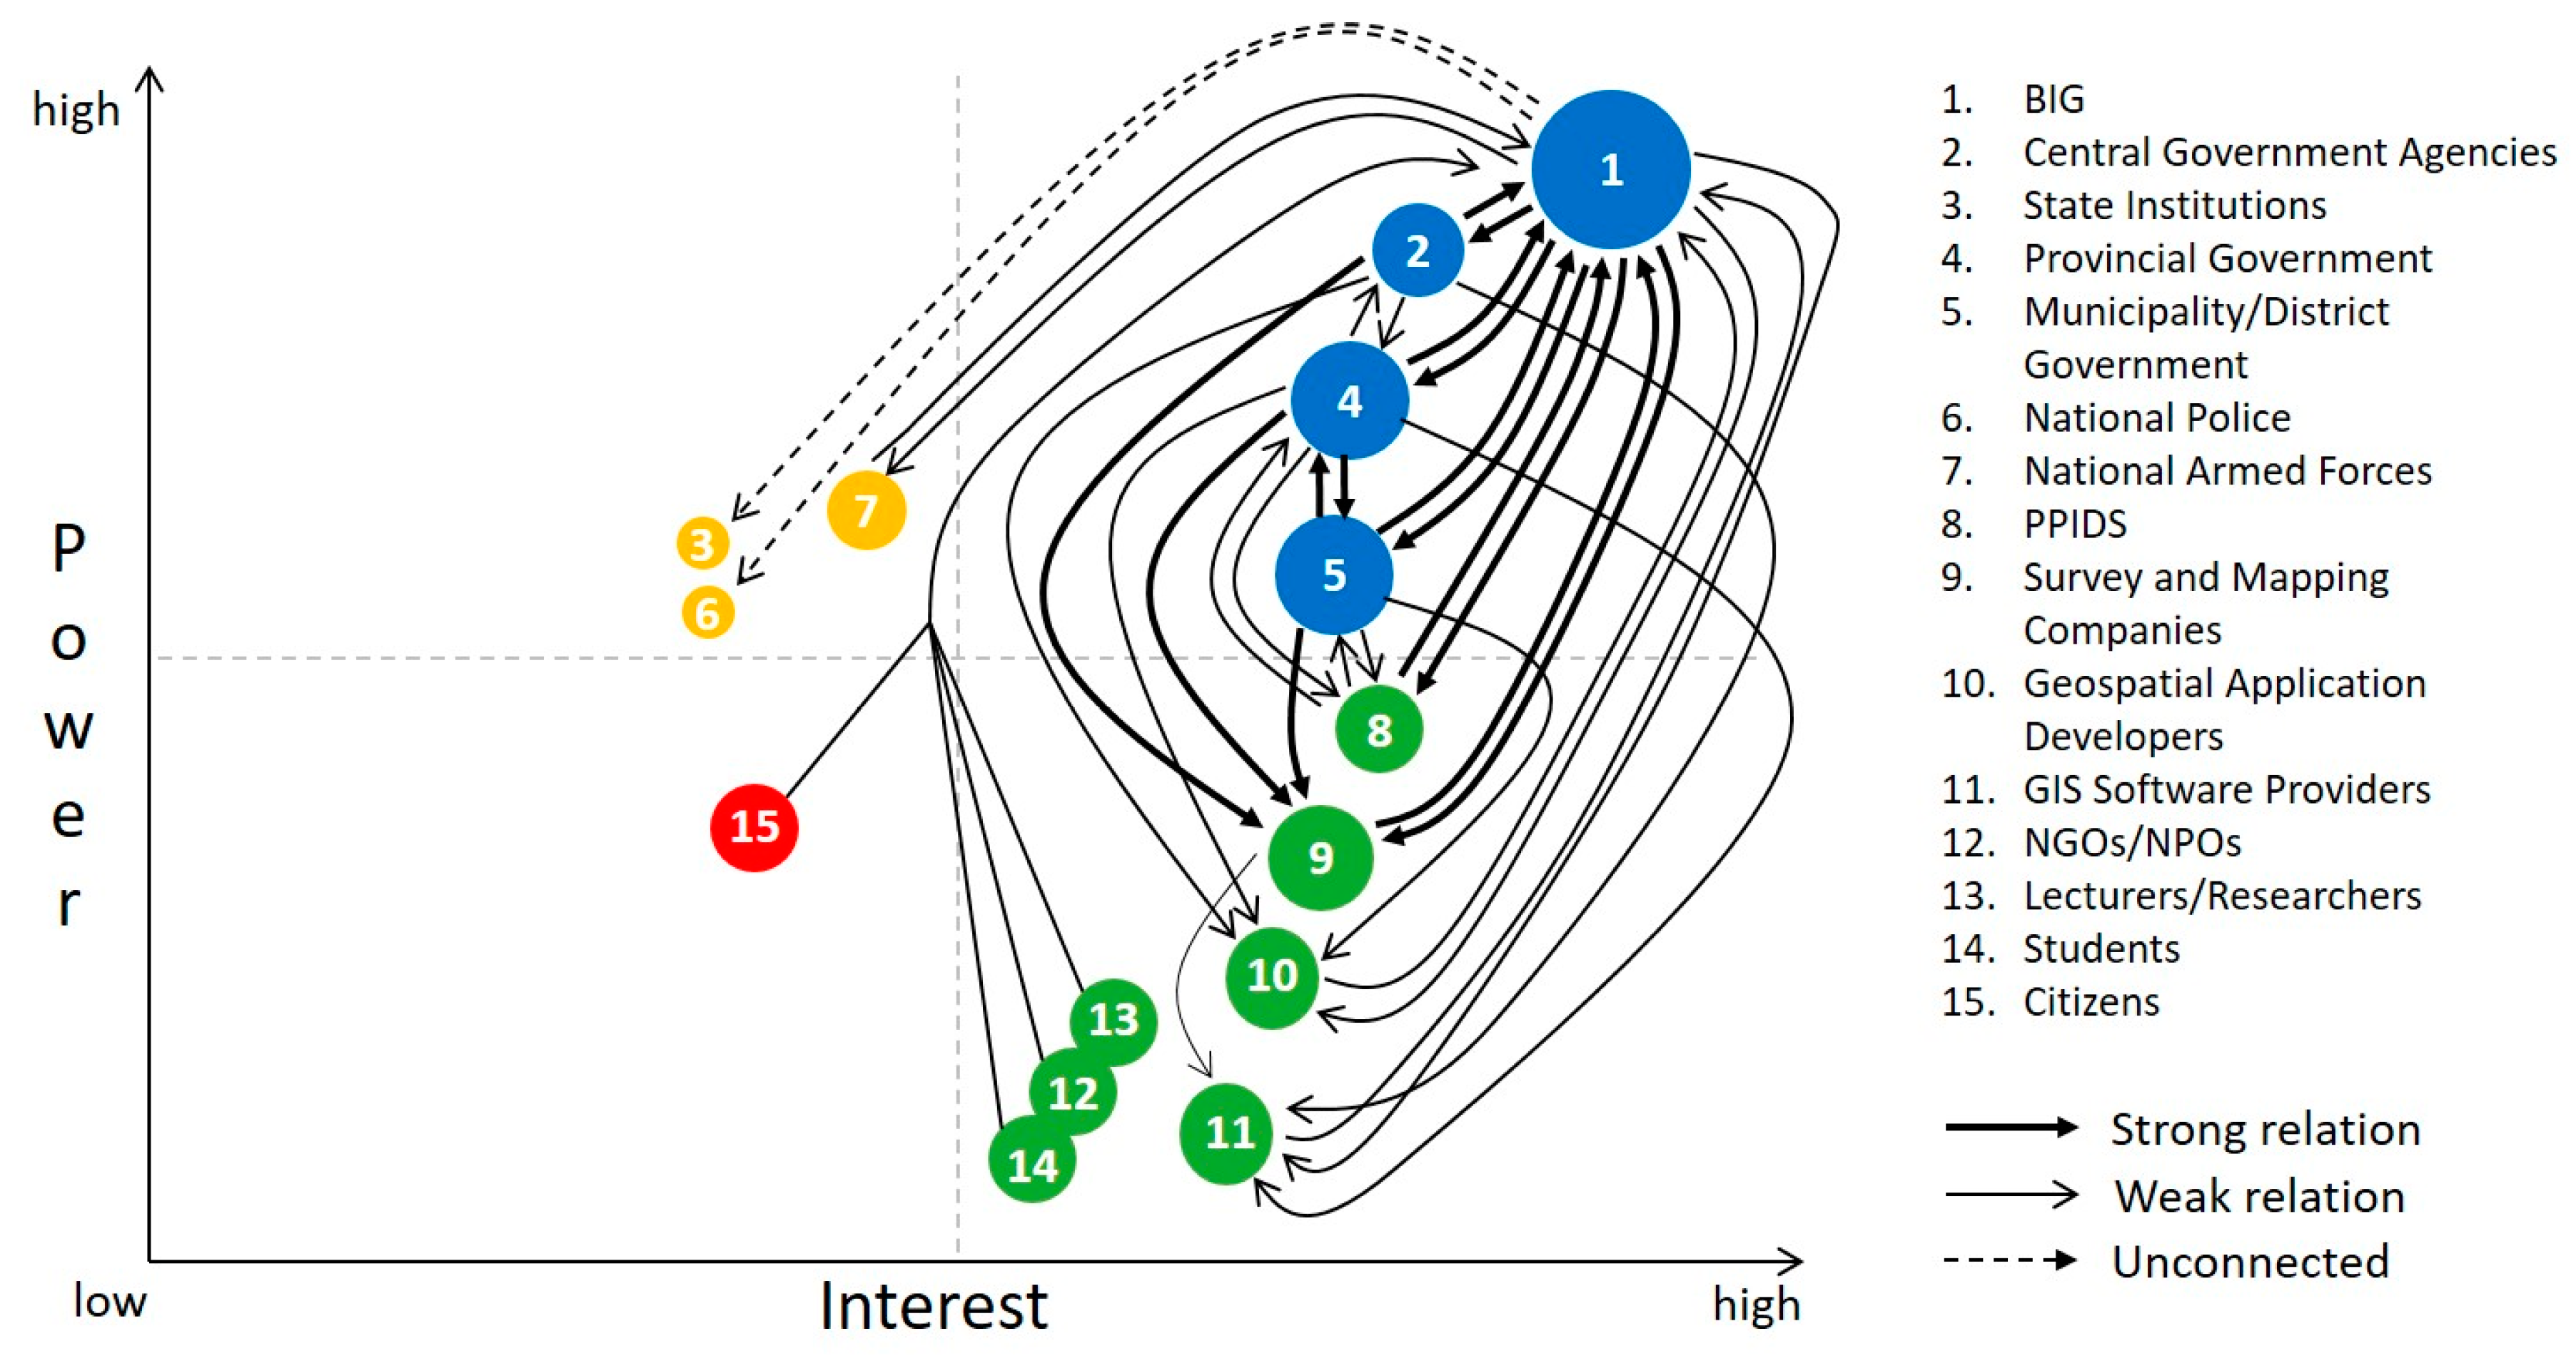
3.1.3. Relationships of NSDI Stakeholders

To examine the interrelationship between the NSDI stakeholders, we created the action-linkage matrix. We noted a strong (weak) connection between the existence of regular (incidental) cooperation or meetings and frequent (infrequent) data sharing. We noted no connection in the absence of communication or data sharing. For instance, in 2017, BIG created a memorandum of understanding to discuss the utilization of geospatial information with four central government agencies. They conducted a regular monthly meeting and frequently shared geospatial datasets, such as on administrative boundaries, buildings, and transportation layers. We noted this to be a strong relationship between BIG and the central government agencies.
The number of connections among all the stakeholders is listed in Table 3. It appears that most strong connections are dominated by BIG, followed by survey and mapping companies, provincial governments, and municipal/district governments. Survey and mapping companies have four strong relationships, all of them with government institutions, since they establish mapping projects every year. Strong relations also exist between the provincial and municipal/district governments, as they regularly cooperate, meet, and exchange thematic datasets for regional development, such as the spatial planning map. Central government agencies have solid connections with BIG and survey and mapping companies, but relatively weak collaboration with the local government in terms of geospatial information usage. The national armed force maintains strong cooperation with BIG. NGOs/NPOs, lecturers/researchers, students, and citizens have relatively weak connections with other stakeholders and BIG due to limited cooperation and poor geospatial data access. State institutions and national police have no connections based on the survey results, as shown in Table 3.
Based on the results about the number of connections, we generated an NSDI actor-linkage graph (see Figure 9) to illustrate the interrelationships among the stakeholders. The size of each circle represents the degree of total connections for each stakeholder. The arrows identify the flow of connections among the stakeholders, and the arrows’ width describes the intensity of the connection. For example, a thick arrow going from one stakeholder to another illustrates a strong relationship.
Strong interrelations exist between the key players such as governmental agencies, because BIG coordinates NSDI implementation with central government agencies, provinces, and municipalities/districts. However, BIG needs to increase communication with the context setters since, currently, only the national armed forces have established cooperation with it. State institutions and national police appear to be neglected, even though they have higher power to create their own network nodes.
The graph in Figure 9 also shows that connections between key players and private sectors are varied. Strong connections exist between government agencies and survey and mapping companies (e.g., PT. Waindo Specterra and PT. EXSA International) due to cooperation on digital mapping projects. Weak connections exist between the key players and geospatial application developers (e.g., PT. WebGIS Indonesia and PT. Qlue Performa Indonesia) and GIS software providers (e.g., PT. ESRI Indonesia). This indicates the presence of cooperation, even though it is still limited to particular projects. We also noted that other members of the subjects grid (lecturers/researchers, NGOs/NPOs, and students) as well as citizens have weak connections with BIG, as they only access the Ina-Geoportal for downloading geospatial data.

3.2. Cost Analysis

The cost analysis in our study consisted of two steps. The first step was to identify and define the existing NSDI cost components based on documentary evidence. We conducted extensive reviews on budgetary documents, particularly the budget of BIG as the network nodes connector of Indonesia’s NSDI, from 2013 to 2017. The second step was to calculate the potential cost for the production of large-scale maps. Limited availability of large-scale maps is one of the main hindrances in NSDI implementation, as discussed in the previous section (Section 2.2). The calculation aims to determine the cost of providing nation-wide topographic maps at the 1:5000 scale. We used standard cost specifications for geospatial information published by BIG as the reference for estimating the cost.

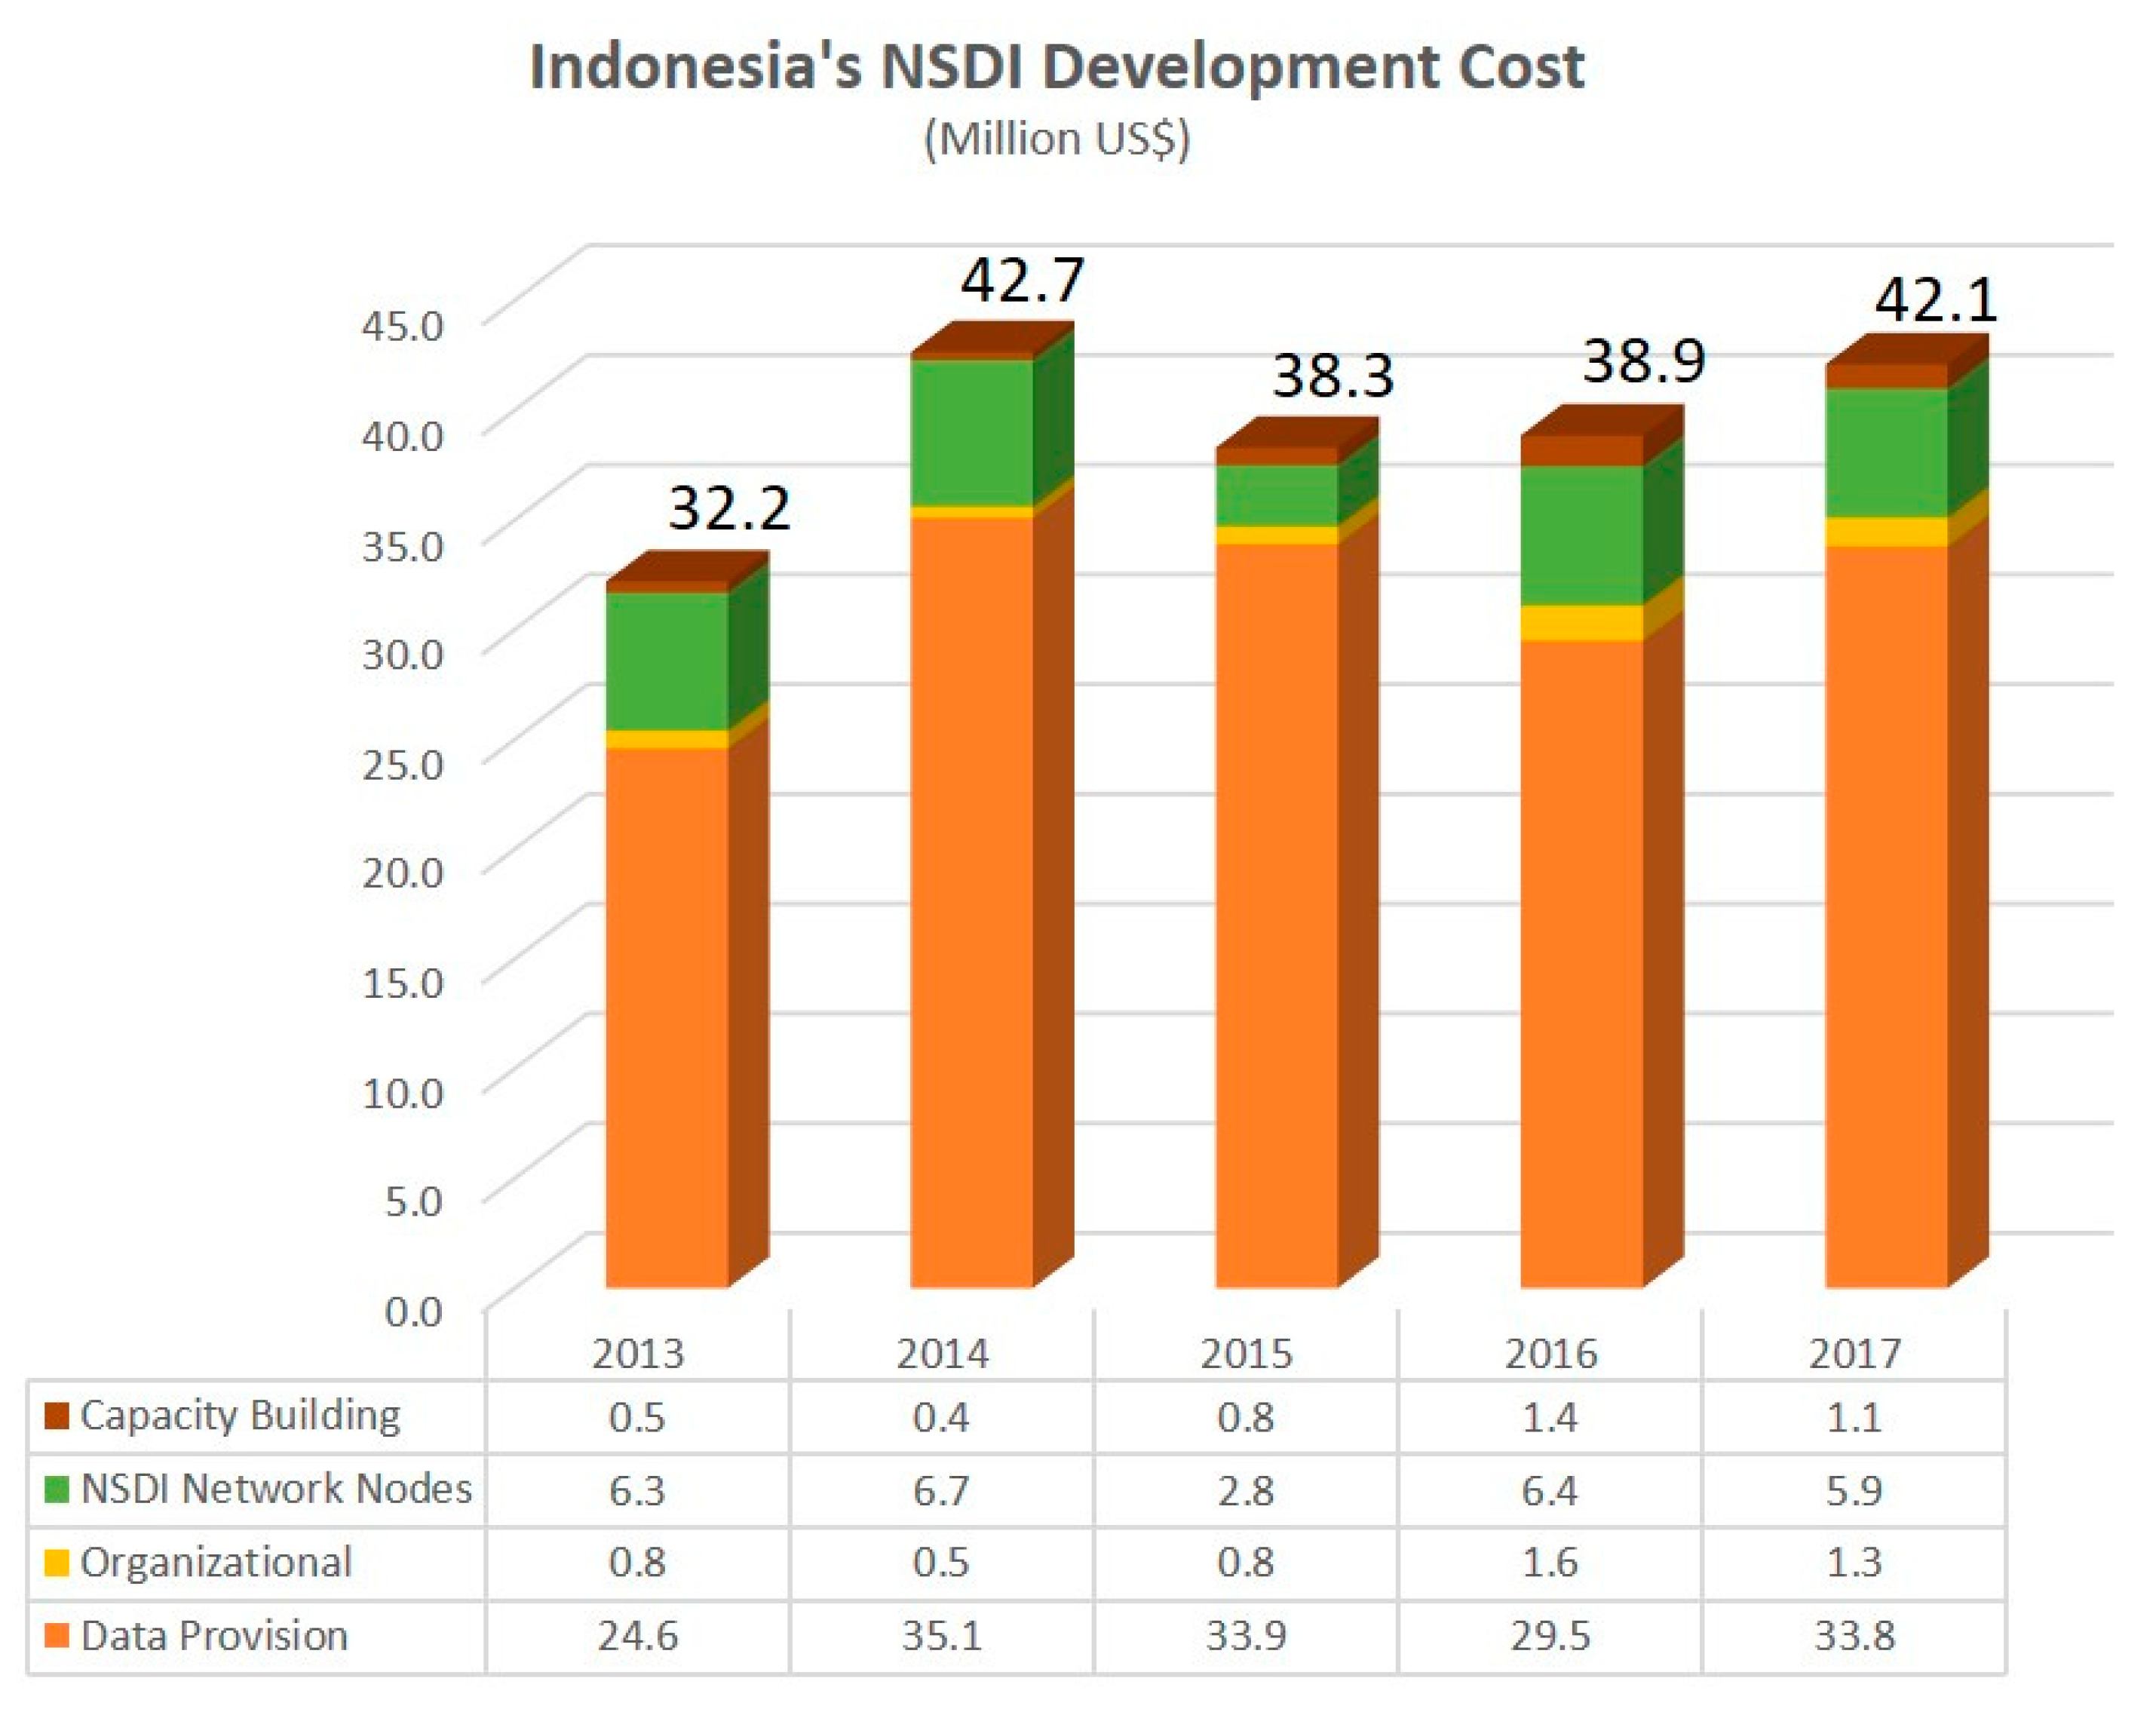
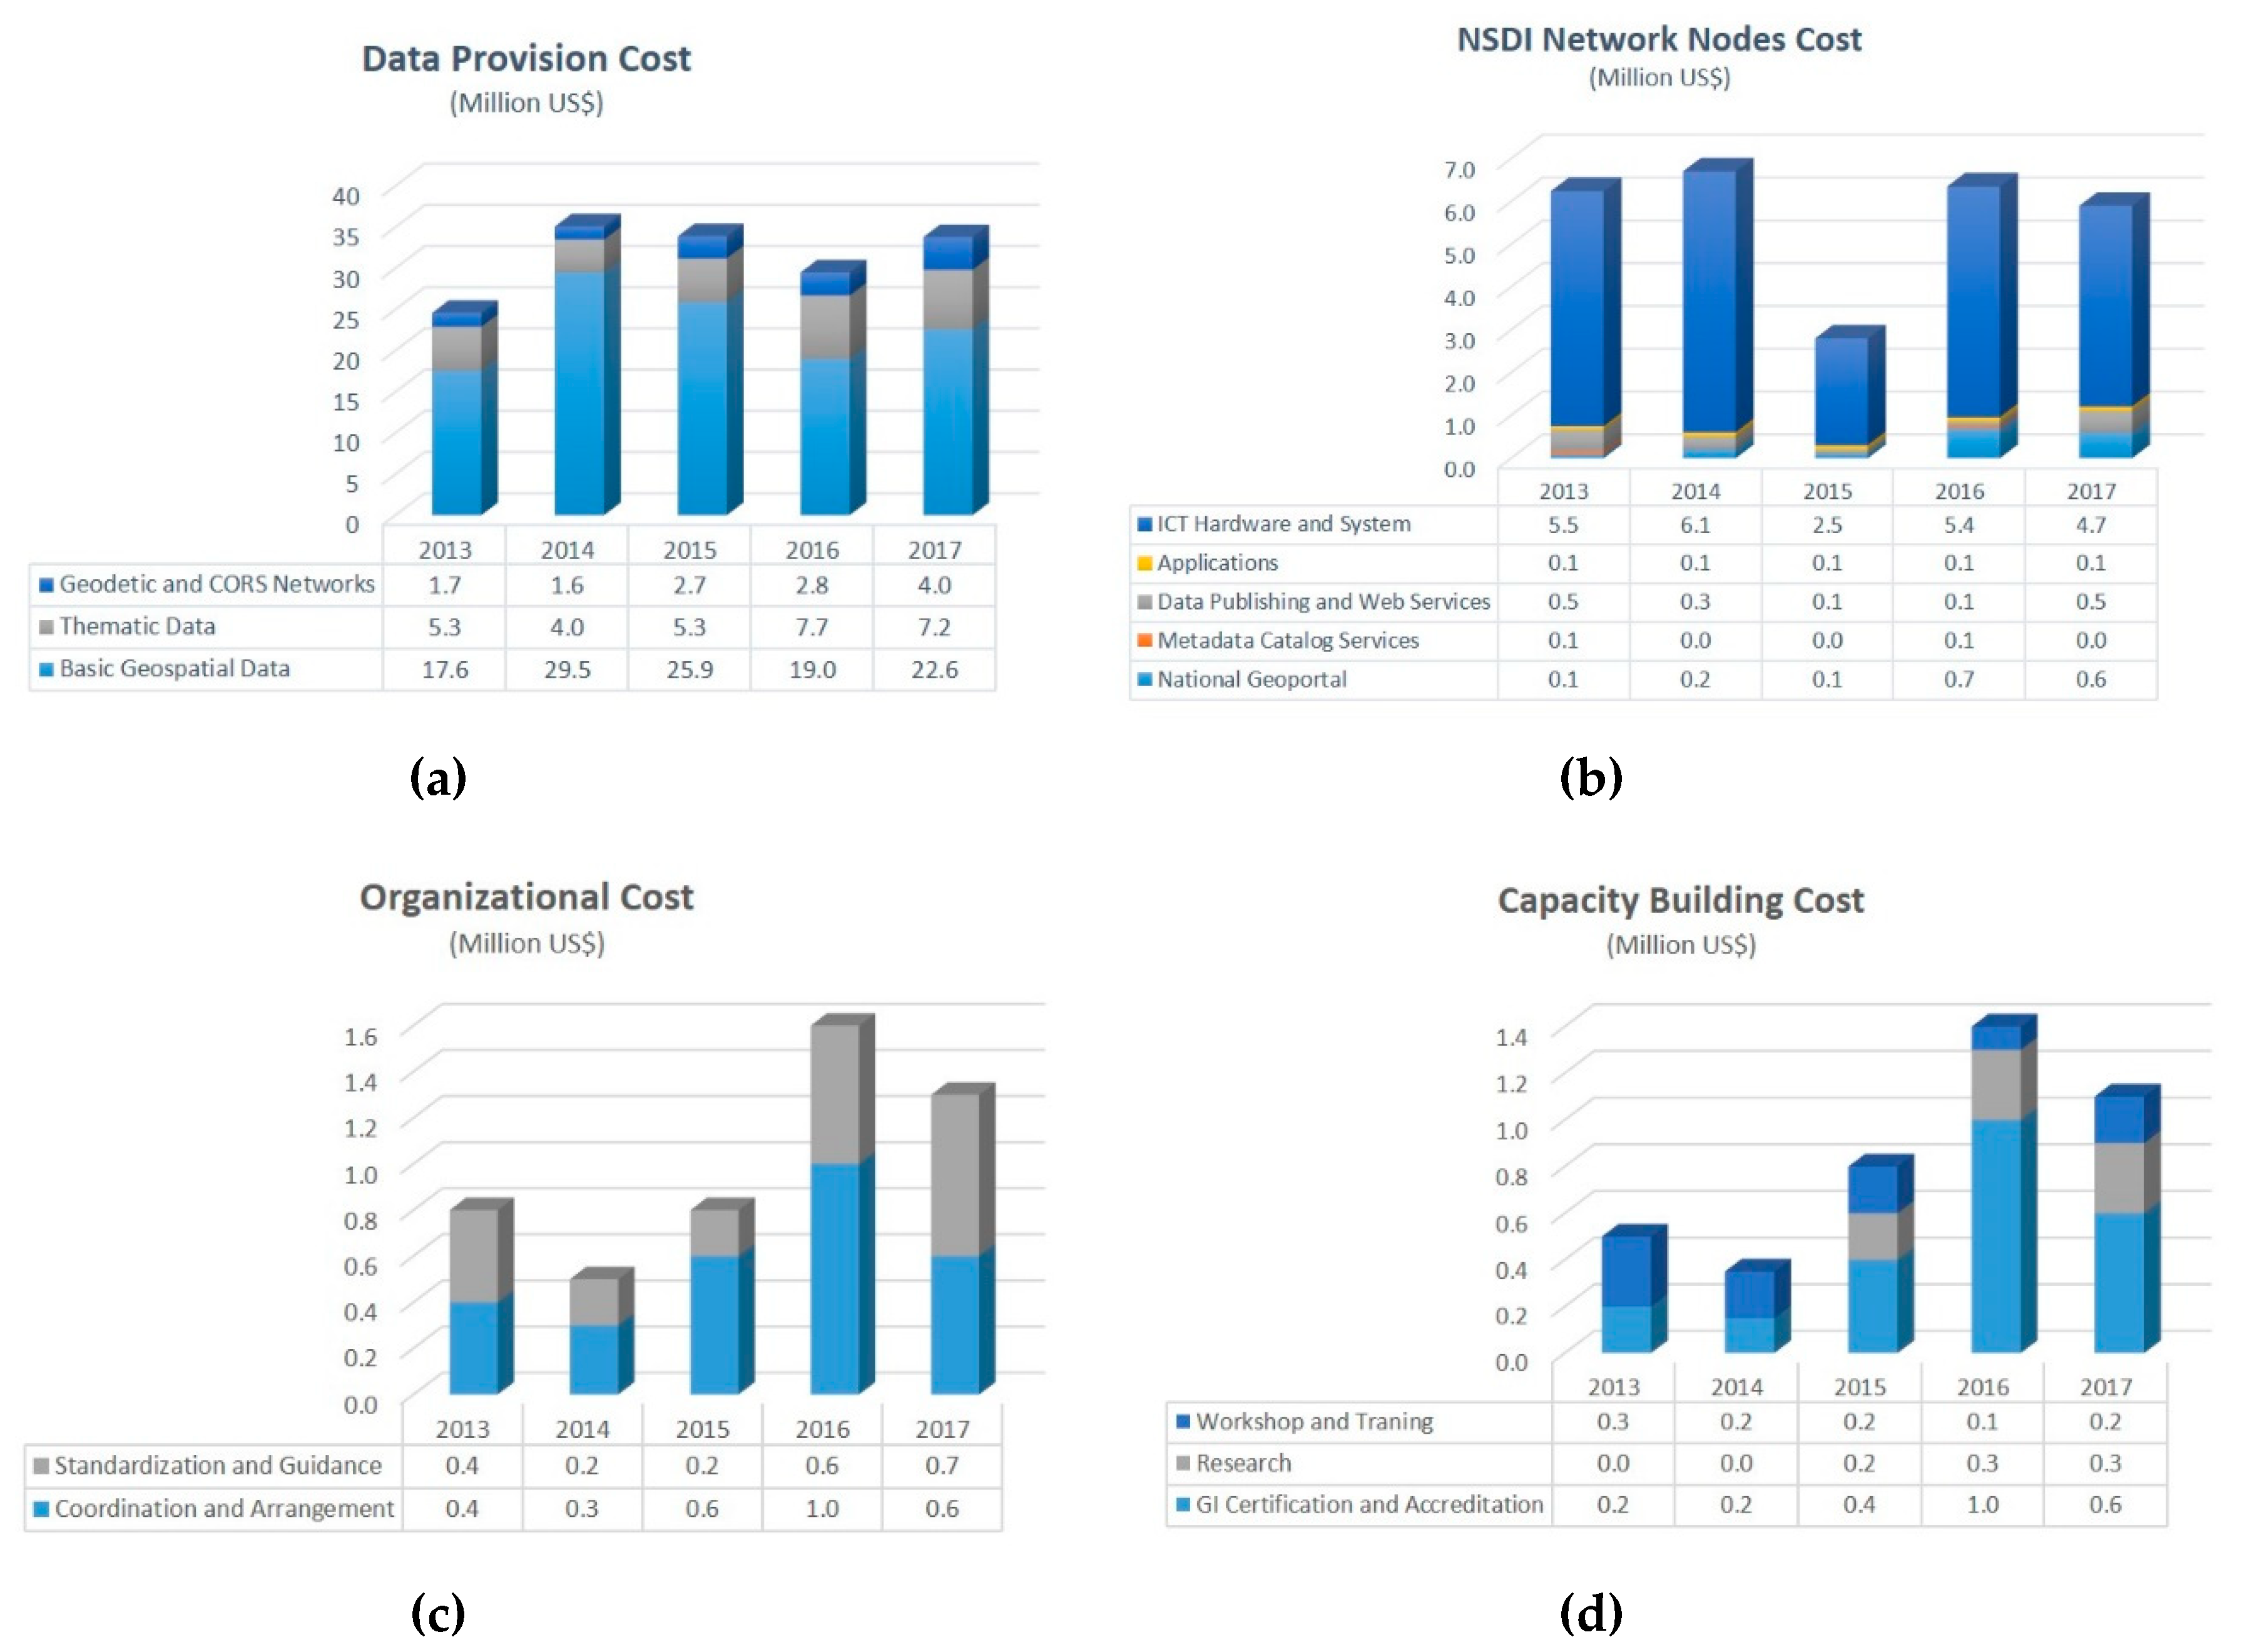
3.2.1. Cost of NSDI Implementation

In this subsection, we describe the cost based on the activities of NSDI development in Indonesia. These activities are categorized into four main components: geospatial data provision, NSDI network nodes operation, organizational arrangements, and capacity building. The annual budget for NSDI development was used to finance these components. The first cost component considers data as the basis of the NSDI. It consists of the budget to produce basic geospatial data, create thematic maps, and develop geodetic networks or the infrastructure of continuously operating reference stations. The second cost component identifies NSDI network nodes as the system for data access and sharing. The system’s operation requires ICT hardware and software, geospatial applications, data publishing and Web services, metadata catalogs, and enhancement of the Ina-Geoportal. The third component finances the organizational arrangements of the NSDI. It includes programs for setting up policy, standards development, coordination meeting, and dissemination activities. The last component improves human resources involved in NSDI implementation. The capacity building cost consists of the budget for workshops and training, research, and certification of geospatial information workers.
From the budgetary assessment, we found that the average annual total cost for NSDI development is $38.8 million USD ($1 USD = IDR 13,500). Figure 10 shows that most of the budget (average of about 80% per year) is allocated for producing geospatial data, followed by activities for establishing NSDI network nodes (14%). The funds for capacity building are relatively low, with only 2% ($0.8 million USD) of the total average cost, as are those for organizational arrangements ($1 million/year).
In the data provision cost, as presented in Figure 11a, the largest allocation is for completing digital topographic maps (average of $22.9 million USD/year). The production of large-scale topographic maps (1:5000) was started in 2013 in the north Bandung area and continued in the following years [42]. The data provision cost was increased in 2014 and 2015 due to a grant aid from the Japan International Cooperation Agency for digital mapping in Sumatra Island. Meanwhile, the cost for thematic mapping increased significantly in 2016 and 2017, as the One Map Policy program has accelerated.
Regarding the budget for technical operation of the NSDI network nodes, an average of more than 86% of the budget ($4.8 million USD) is assigned annually to set up the system (Figure 11b). This includes computer hardware and software and the leased internet line. The allocation for developing geospatial applications is still limited ($0.5 million USD), and, along with findings from the stakeholder analysis, cooperation between geospatial application developers is low. For the last two years (2016 and 2017), BIG has increased the budget for improving the national geoportal; unfortunately, most of that was for paying server license fees, since Ina-Geoportal was built on proprietary software.
Since BIG has a role as the network nodes connector, it conducted annual national and regional coordination meetings with an average budget of $0.6 million USD, as described in Figure 11c. In the meantime, standard development costs reached US$ 2.1 million until 2017, when they yielded 60 national standards. In addition, BIG also developed technical specifications used for geospatial information activities. An example is the Technical Specification for Village Map Presentation (Head of BIG Regulation No. 3/2016).
Capacity building activities appear to improve skill and knowledge of employees by conducting training and establishing certification systems. This is understandable, because many do not have the capability to manage GIS data, particularly in local governments, as identified in the stakeholder analysis. However, the government should consider increasing research activities since the budget is relatively low.

3.2.2. Cost for Completing Basic Maps

As seen from the data provision costs, producing basic maps is expensive. Nevertheless, it is important to examine the unit cost for completing nationwide basic geospatial information, such as 1:5000 scale topographic maps. Typically, topographic maps are generated using aerial photo mapping. To calculate the unit cost of producing large-scale topographic maps using aerial photos, we collected appraisal documents related to digital mapping from BIG and used the standard specified in the Head of BIG Regulation No. 11/2016, which refers to the standard costs of geospatial information activities for budget year 2017.
Topographic mapping based on aerial photos involves four procedures: data processing, field survey, geodatabase creation, and data visualization [43]. Data processing activities include preparation, stereo plotting, topology editing, digital terrain model creation, and contour editing. Field surveys validate the preliminary mapping results. Then, a geodatabase is created that includes feature editing, topology validation, and metadata creation. Finally, as part of the visualization procedure, the map is laid out and printed. Each of these procedures may contain cost components such as payment for workers (e.g., GIS supervisor, administrative staff, and GIS operator), cost for providing tools (e.g., computer, printer, and GIS software), stationery, and transportation expenditure. The base prices for these components are specified in [44].
In this study, we estimated topographic mapping in the Cibinong District with an area of 56.2 km2, or equal to 58 mapsheets. The assumptions for aerial photo surveys are as follows: the weather conditions are good and clear; density level of the geographical objects is medium; topography of the area is flat; and accessibility difficulty for the area is low. A summary of the calculation is presented in Table 4, and the details are described in Appendix C. The results show that the total cost for producing 58 mapsheets of large-scale topographic maps is about $463,300 USD. The unit cost for each mapsheet is $7,988 USD. Based on these figures, we estimated the required budget for mapping the nationwide data. Accordingly, 373,902 mapsheets of the 1:5000 scale topographic maps still need to be provided. Therefore, we calculated the total required budget as approximately $2.99 billion USD. Sub-Section 3.2.1 shows that the annual budget for producing basic geospatial data is approximately $23 million USD. Dividing the total required budget by the annual allocated budget indicates that the government would need 130 years to complete the nationwide topographic maps.

4. Discussion

This study evaluated the NSDI development in Indonesia using stakeholder and cost analyses as the frameworks for assessment. It is evident that the initiative has a top-down approach, with most key stakeholders coming from government agencies. They have responsibility as data providers and, at the same time, act as data users. As mentioned previously [13], this approach is mainly driven by the enactment of a national policy, specifically the Geospatial Information Law. Other characteristics noted are the existence of the NSDI coordination agency and development of national standards to be used by local governments or lower-level SDIs.
Although encouraged by regulations, involving stakeholders and ensuring their active contribution in SDI development is difficult. Based on our observations, the number of data providers in the national geoportal is still low. Even one of the following conditions hampers stakeholder participation: lack of skilled personnel, inadequate data availability, lack of technical infrastructure, and limited financial support. As demonstrated by the NSDI stakeholder diagram, only BIG and central government agencies have strong resources for managing geospatial data sharing and distribution. Local governments are still constrained with technological infrastructure and human resources. The interest from state institutions, national police, and national armed forces is considered low. It is necessary to assess this condition so the government can determine in what direction improvements can be made for each stakeholder.
Collaboration of the stakeholders in an SDI environment was examined by prior research from the motivational [41] and organizational [45] perspectives; however, an analysis of their interrelationships had not been conducted. Therefore, based on the NSDI actor-linkage graph, we identified connection patterns of the key players (i.e., government agencies) and other stakeholders. BIG, as the coordinating body, has strong relationships with official data providers such as central government agencies and local governments. Interrelationships with the private sector are still limited to mapping projects in which companies act as contractors. No commercial mapping agencies that produce data directly for NSDI have been identified at present. Cooperation between data providers and geospatial application developers is rare. The nonexistence of commercial producers in NSDI has also been noted for other developing countries such as South Africa, Namibia, Ghana [46], and Lao PDR [47]. Thus, the government should consider giving more responsibilities to private companies. The collaboration of public and private institutions should improve, since NSDI plans to fulfil users’ demand require a wide range of data for various applications [48].
The budget for NSDI development is allocated mostly toward improving the availability of geospatial data. From the cost assessment, we learned that the government should find other options for data production. The challenge is to provide large-scale topographic maps in a more efficient way. The adoption of emerging technologies such as high-resolution satellite imagery, light detection and ranging, and unmanned aerial vehicles is essential for this purpose. The budget for research and development needs to be increased to support the adoption of these technologies. PPIDS, as representatives of the universities, have the opportunity to be involved in NSDI research activities and product innovation.
Our findings on the stakeholder and cost analyses can be used to identify the strengths, weaknesses, opportunities, and threats (SWOT) of NSDI implementation in Indonesia. A SWOT analysis provides information that is helpful in matching an organization’s resources and defining future strategic directions [49]. Details of the SWOT analysis are presented below.
Strengths:
  • The head of government of Indonesia has good awareness about the geospatial information benefits of supporting the national development program. The understanding is represented in the National Medium Term Development Plan (RPJMN) 2015-2019. The support is also demonstrated with the establishment of the One Map Policy.
  • Geospatial Information Law was established in 2011 as the legal foundation of NSDI development. The law is reinforced by the issuance of several government regulations such as Government Regulation No. 9/2014 and Presidential Decree No. 27/2014. These regulations act as an umbrella for the NSDI initiative.
  • The national geoportal is available as the key product of NSDI development. It provides geospatial data to users and facilitates sharing and the exchange of geographic services among the stakeholders.
  • The government has published geospatial information standards to support interoperability and harmonize technical specifications. Currently, there are 60 standards available, including standards of metadata, data quality, web services, and data collection.
Weaknesses:
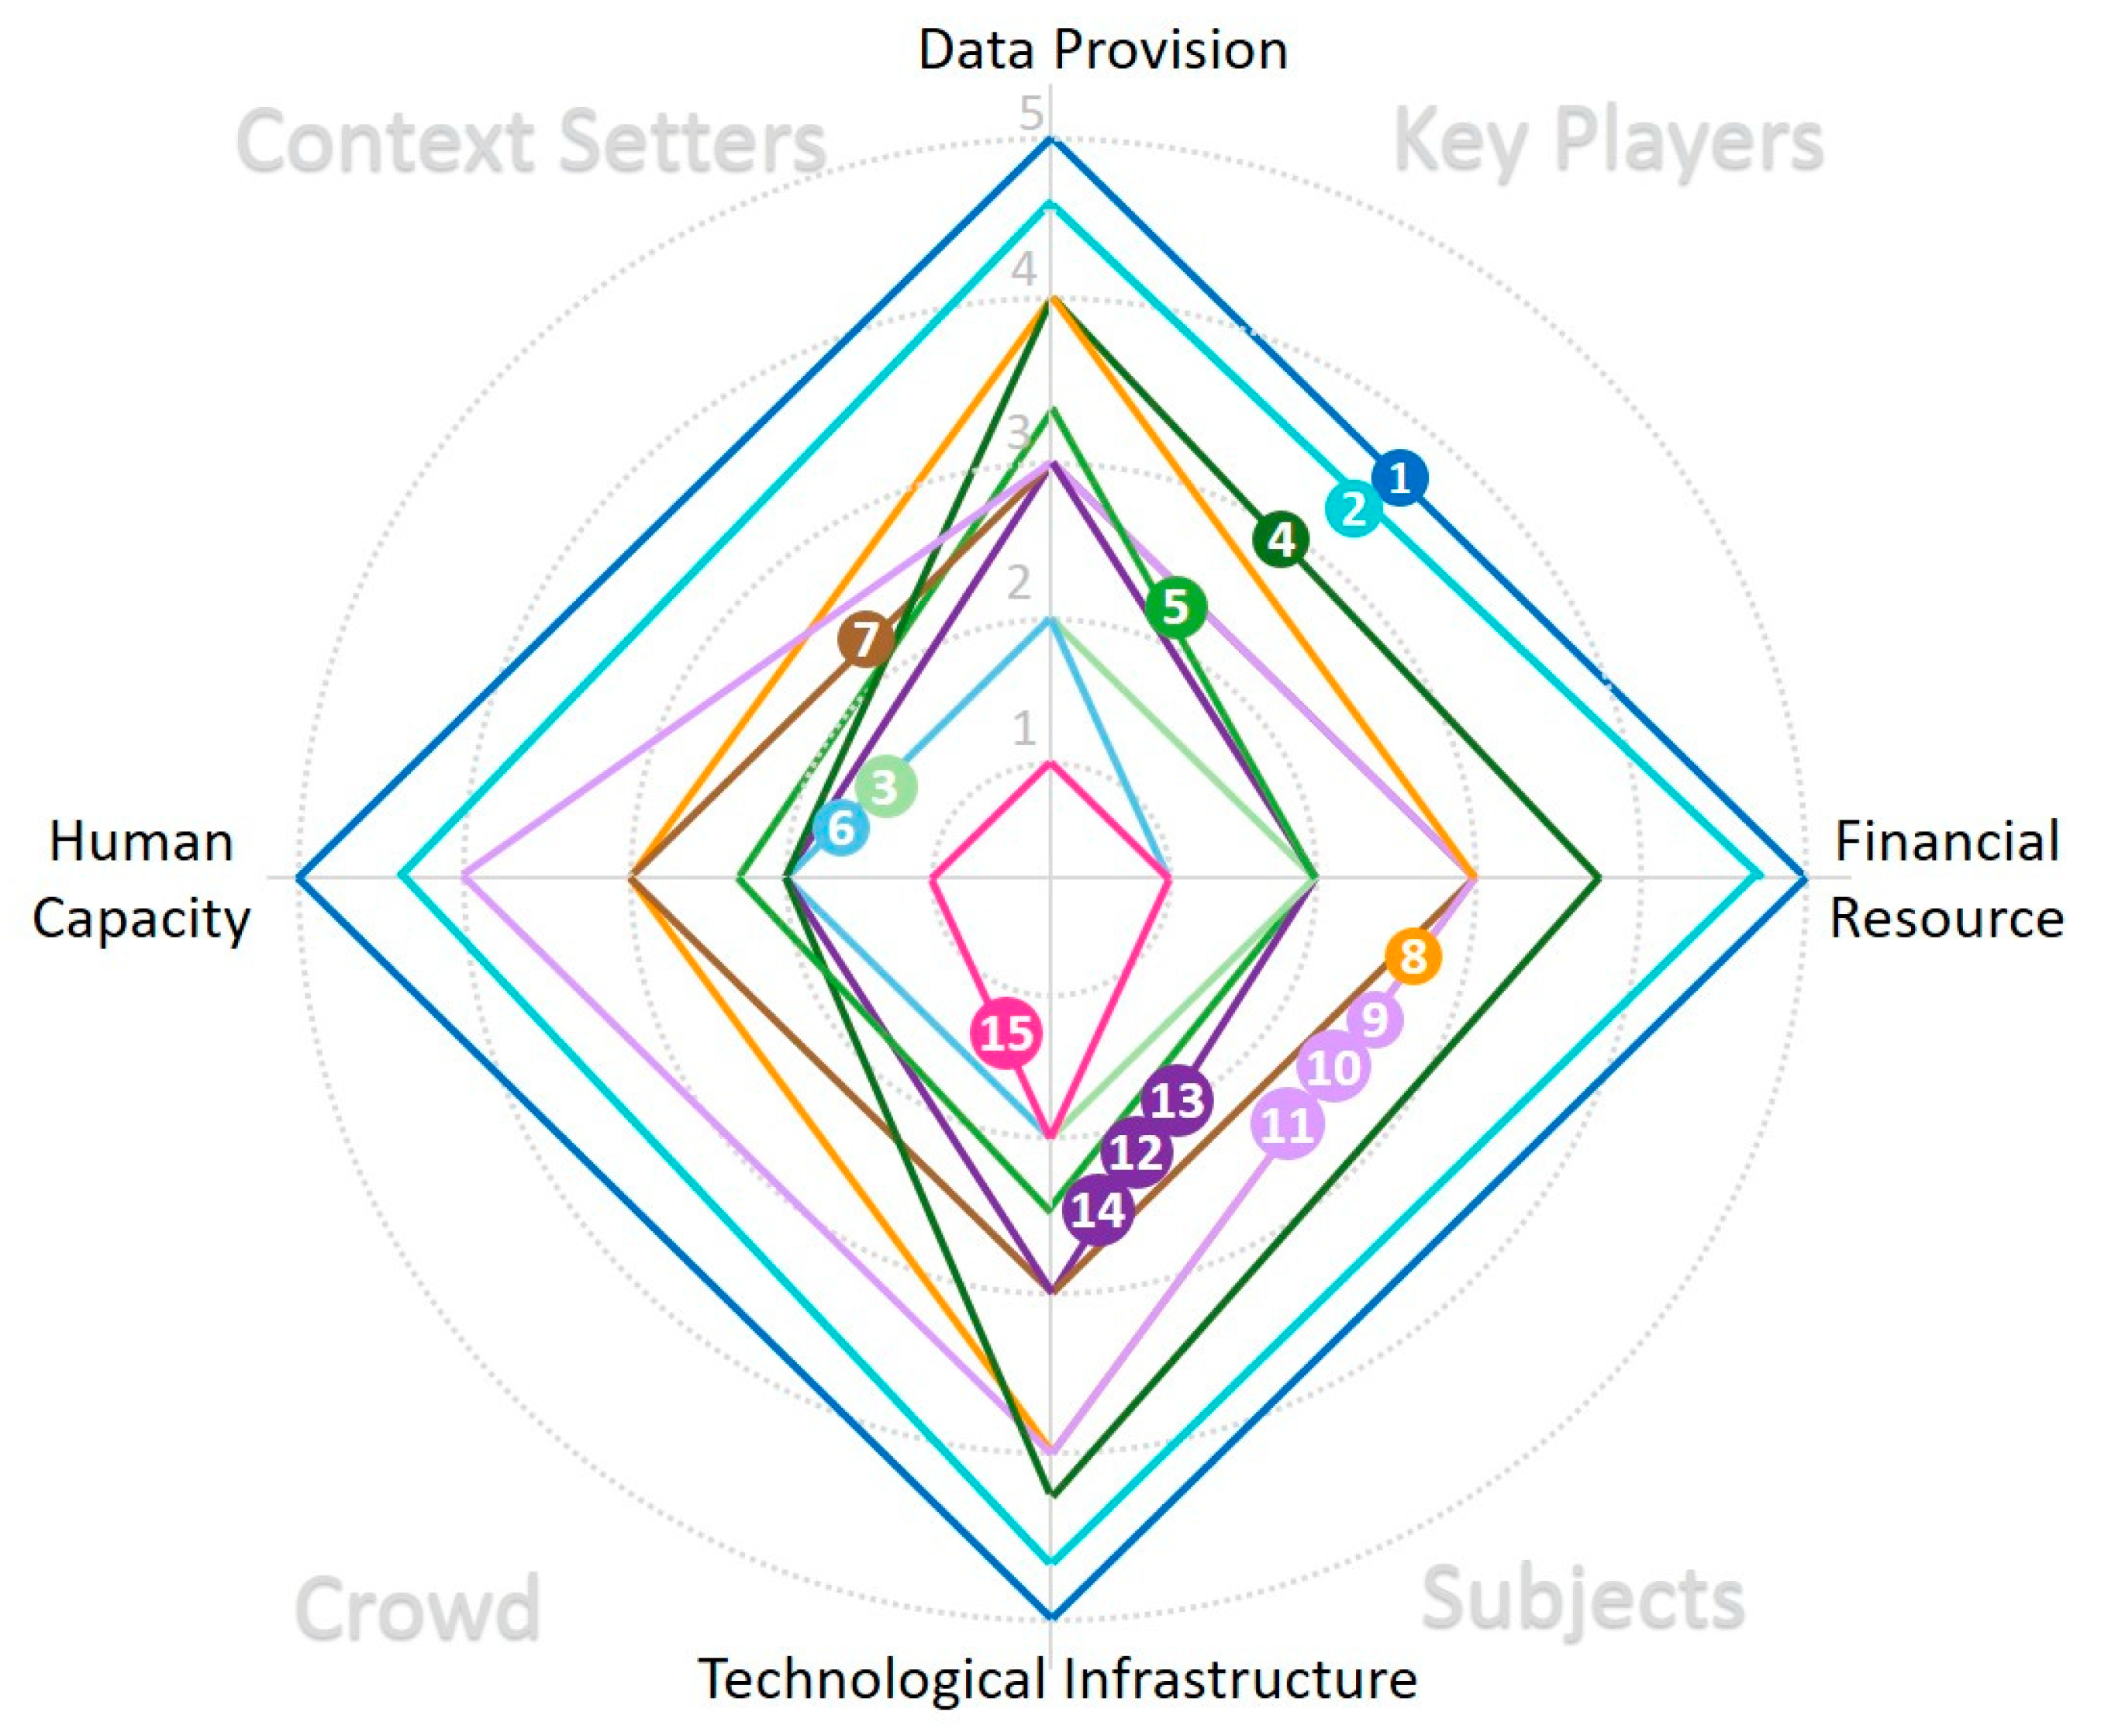
  • Participation of institutions in the NSDI network is low. According to the stakeholder analysis, BIG and central government agencies are active participants. Local governments are hampered by their lack of available resources, whereas private sectors are constrained by their limited roles in NSDI implementation.
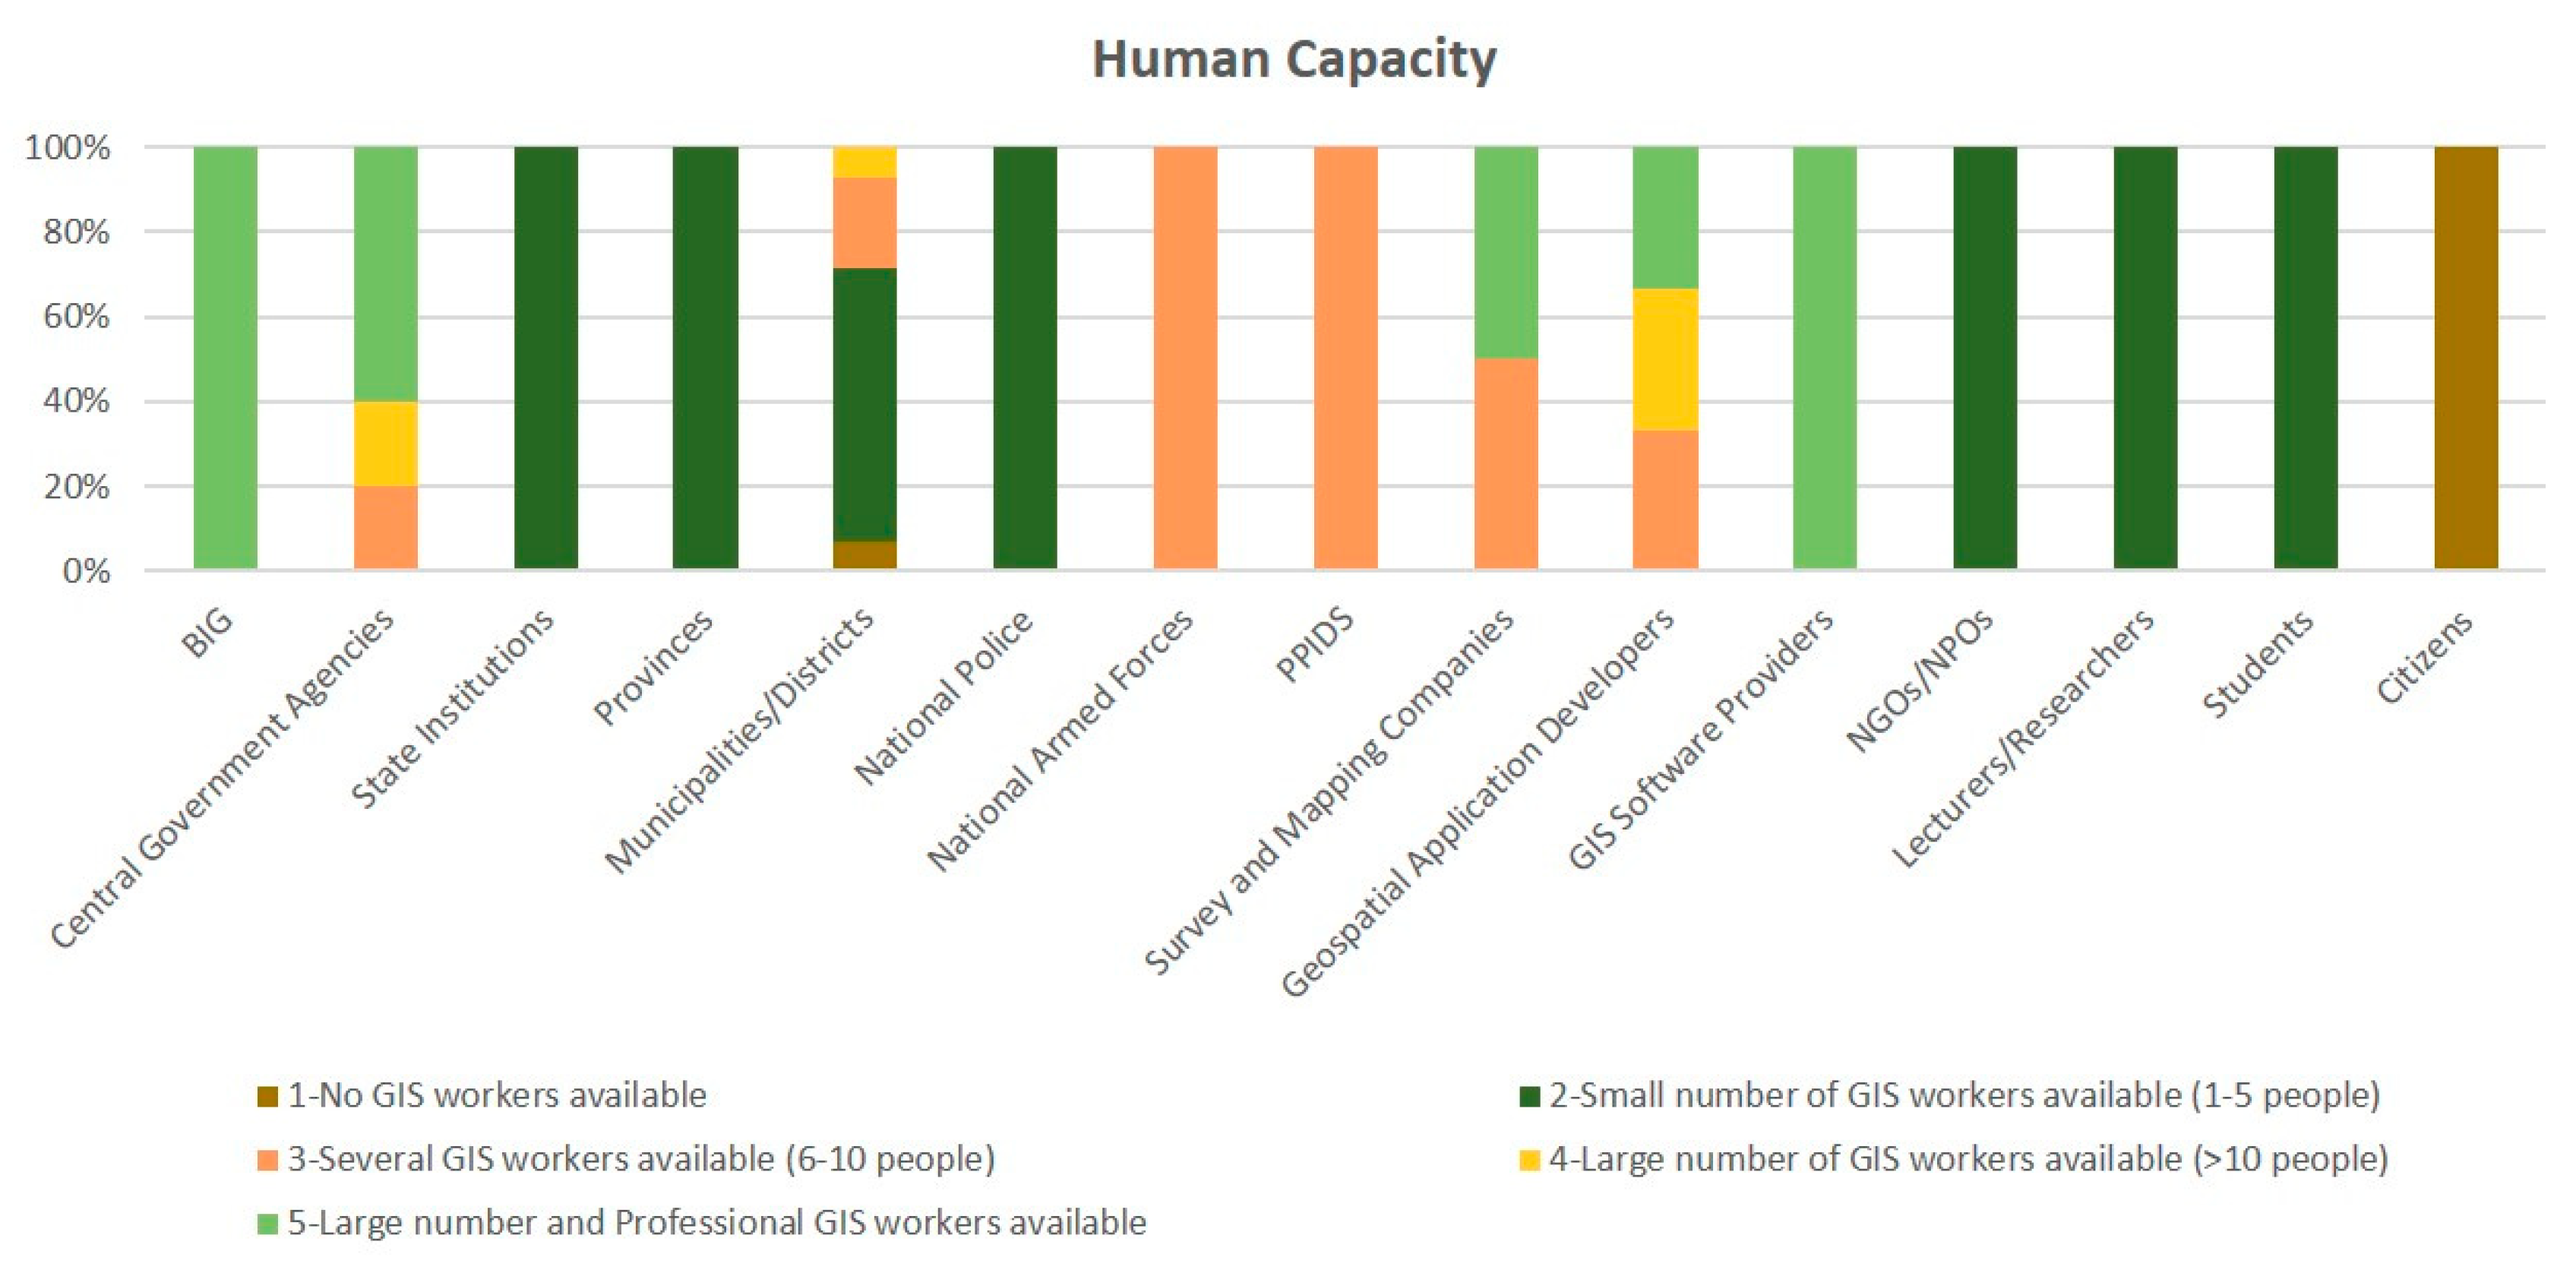
  • There are insufficient human resources with skills in the GIS field. As mentioned in the interview activities, provincial and municipal/district governments often experience fast rotation of employees. GIS departments in local governments hardly exist, and staff members who were not part of any particular department executed GIS tasks repeatedly [17]. Lack of GIS employees was also recognized by the other stakeholders, including state institutions, national police, and national armed forces.
  • Incomplete large-scale basic geospatial data are available. Because the obtainable data are mostly in medium scale (1:25,000), local governments have difficulties in conducting urban planning and land management.
  • Although the legal foundations have been established, the NSDI grand design has not been created yet. The grand design is important, as it provides visions, action plans, and time management for the implementation. The absence of this guidance may lead to obscurity of the project activities for participating institutions.
Opportunities:
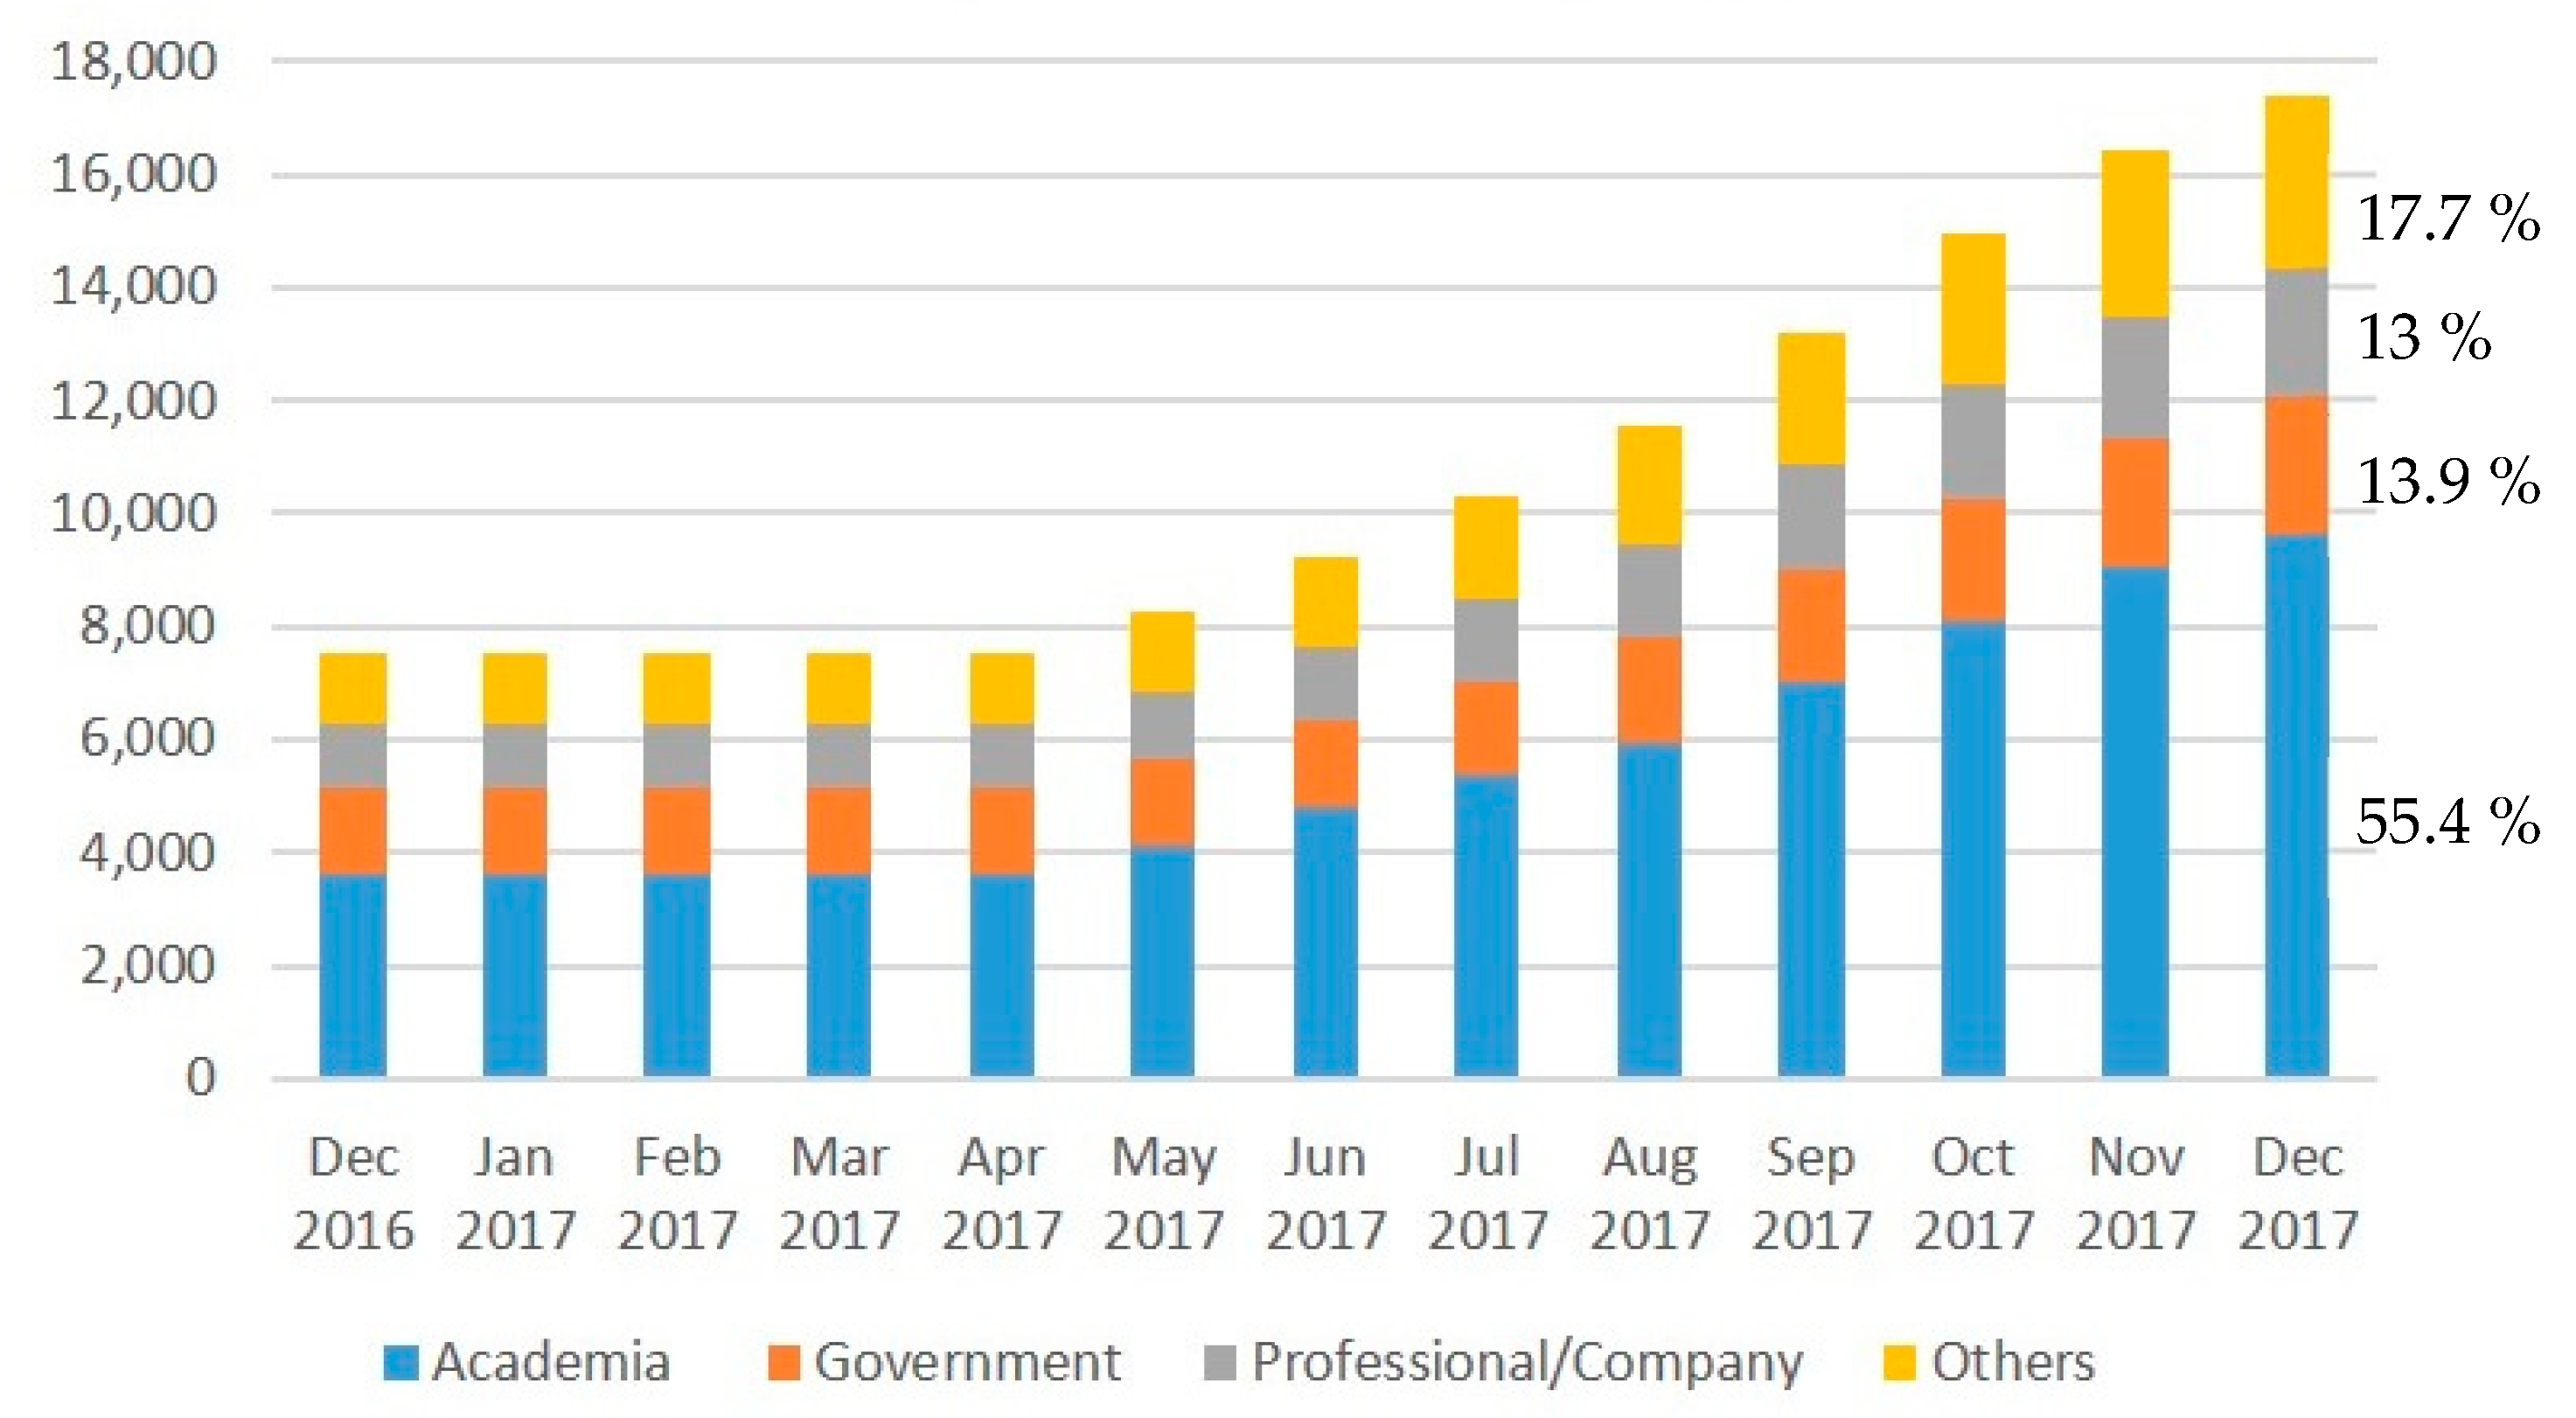
  • There is growing awareness of geospatial information in society. People are now starting to use maps in their daily lives, for example, to order online transportation (e.g., Grab) or food delivery service (e.g., Uber Eats). The demand for geospatial-related applications can be an opportunity to leverage NSDI data and services.
  • The government has launched the open data initiative, and one of its benefits is that geospatial data can be downloaded freely. This encourages interactions between public authorities and private companies and may help generate value-added products.
  • There are emerging trends in GIS application such as remote sensing, global navigation satellite system, cloud computing, and internet of things. Adopting state-of-the-art technologies will provide the innovation for geospatial applications to support public services.
Threats:
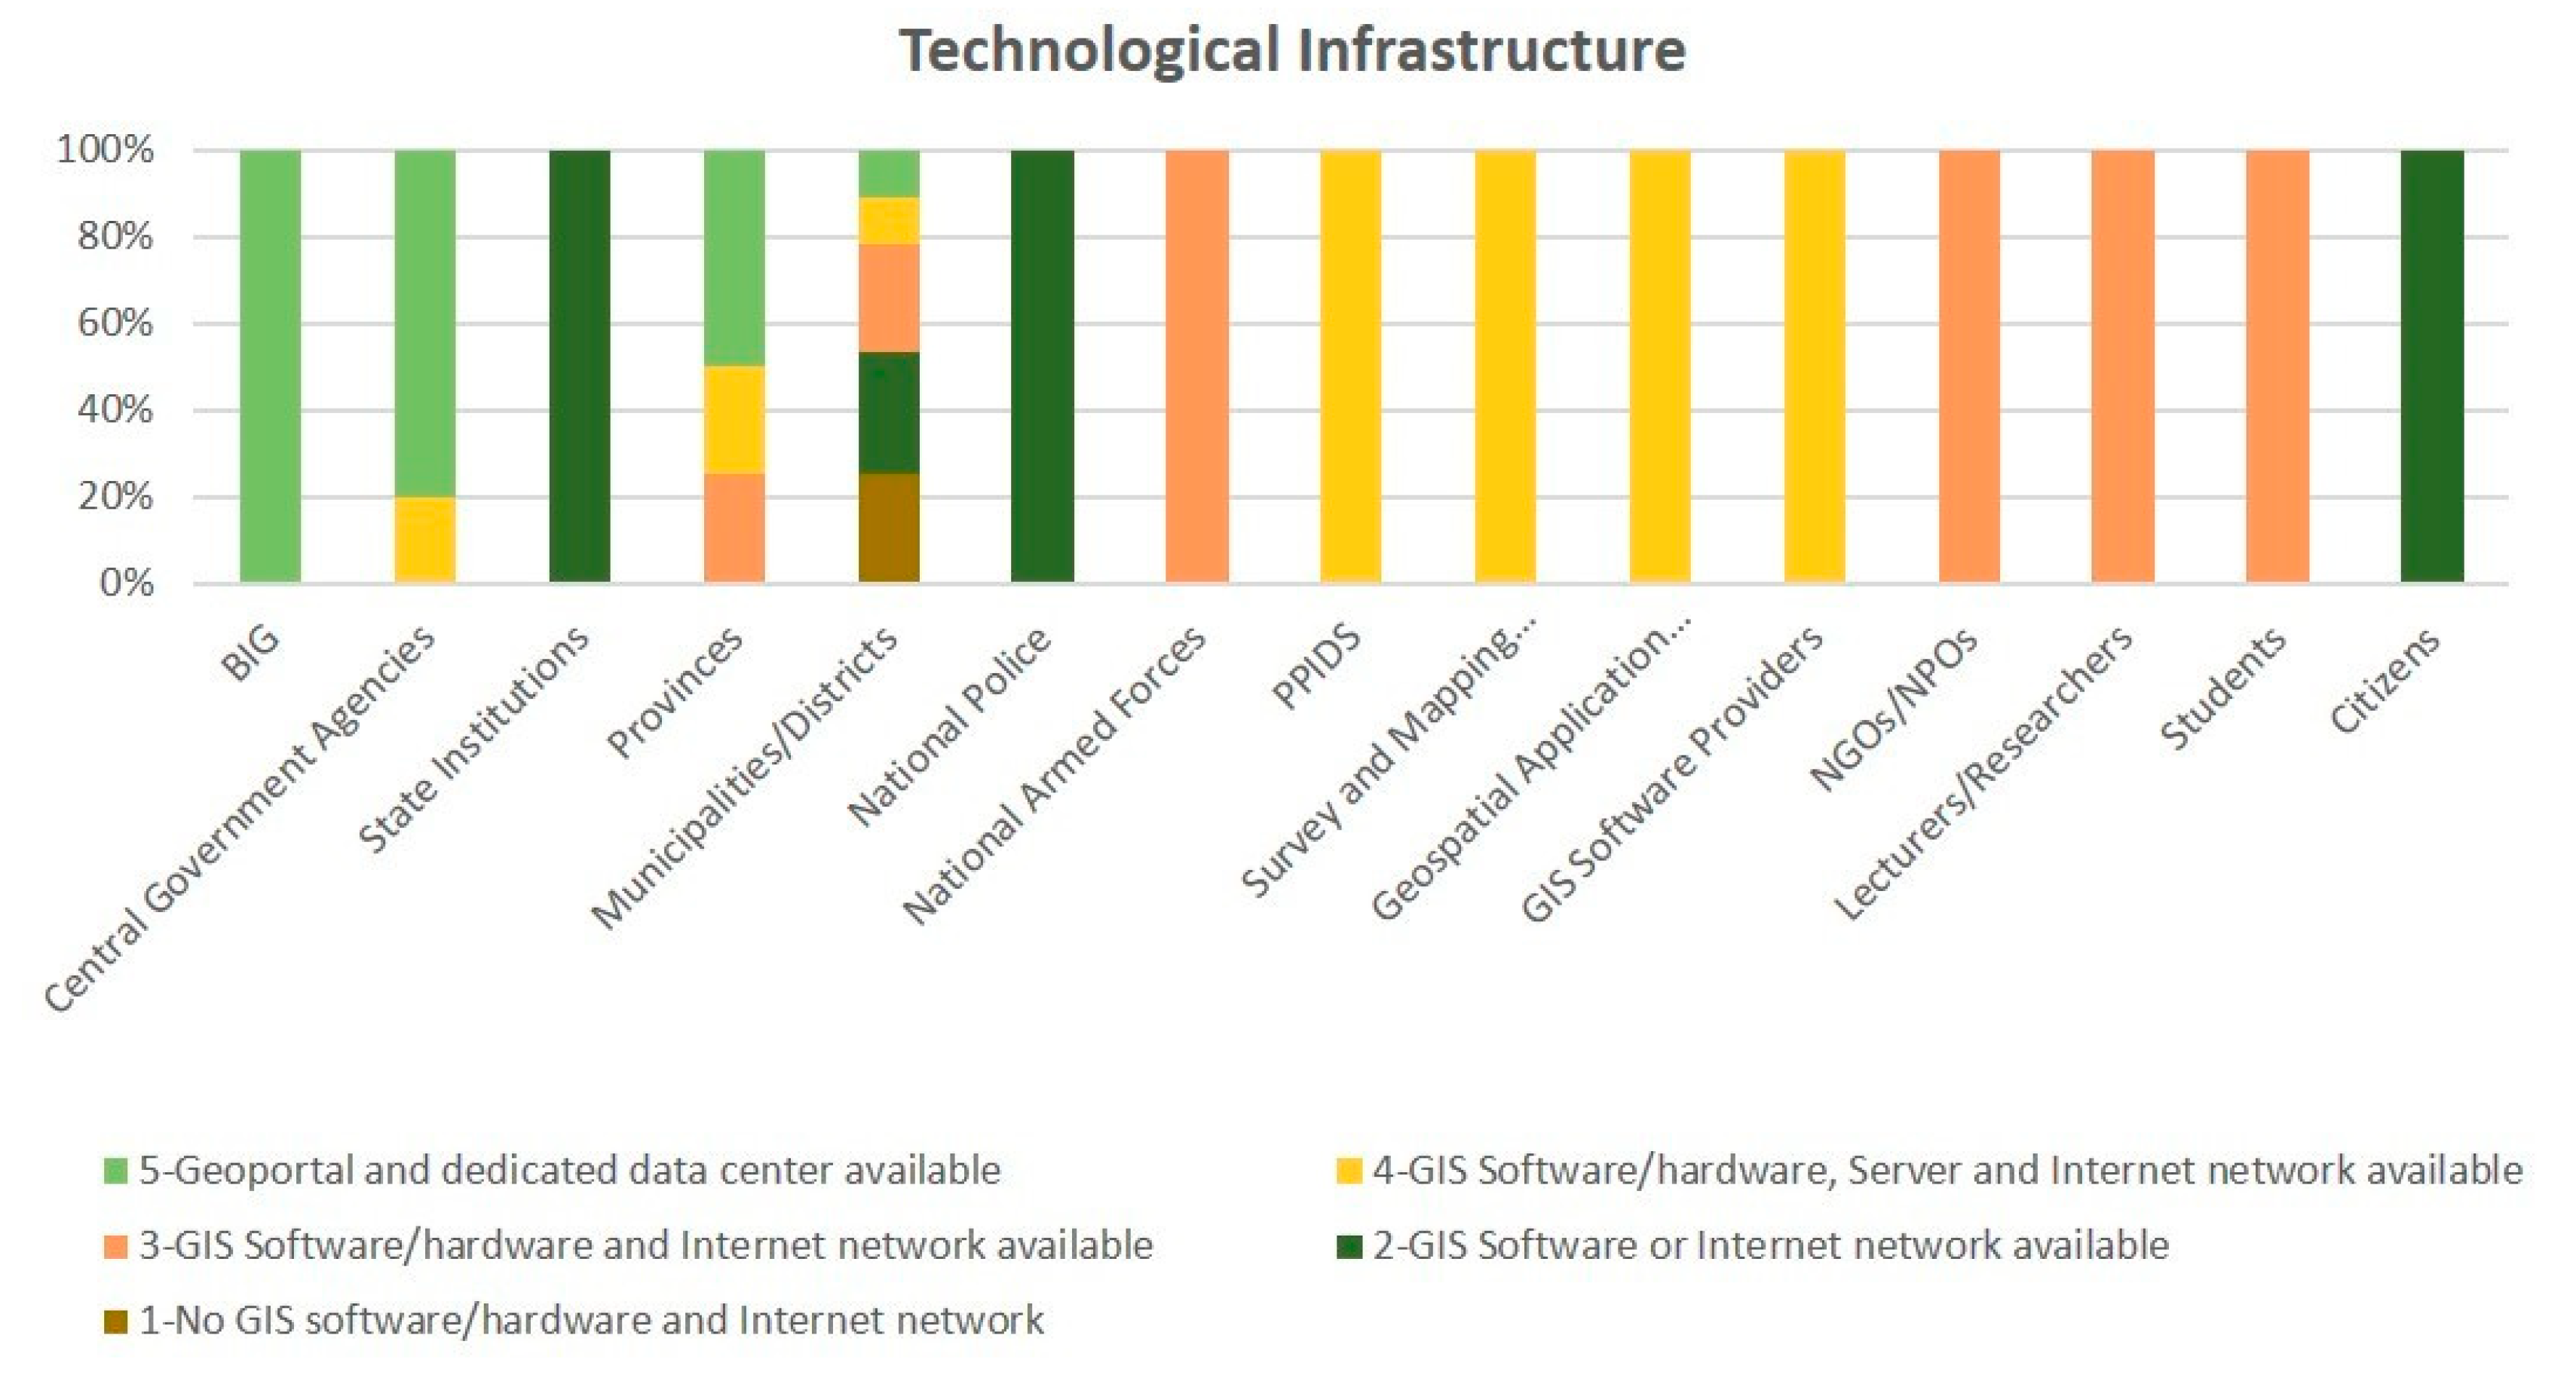
  • Local governments consider internet and ICT infrastructures to be a barrier to publishing geospatial data and communicating with the national geoportal.
  • Reluctance to share geospatial data among NSDI institutions was identified during the interviews. The representatives argued that misuse of data, ownership, and privacy issues are the major concerns.
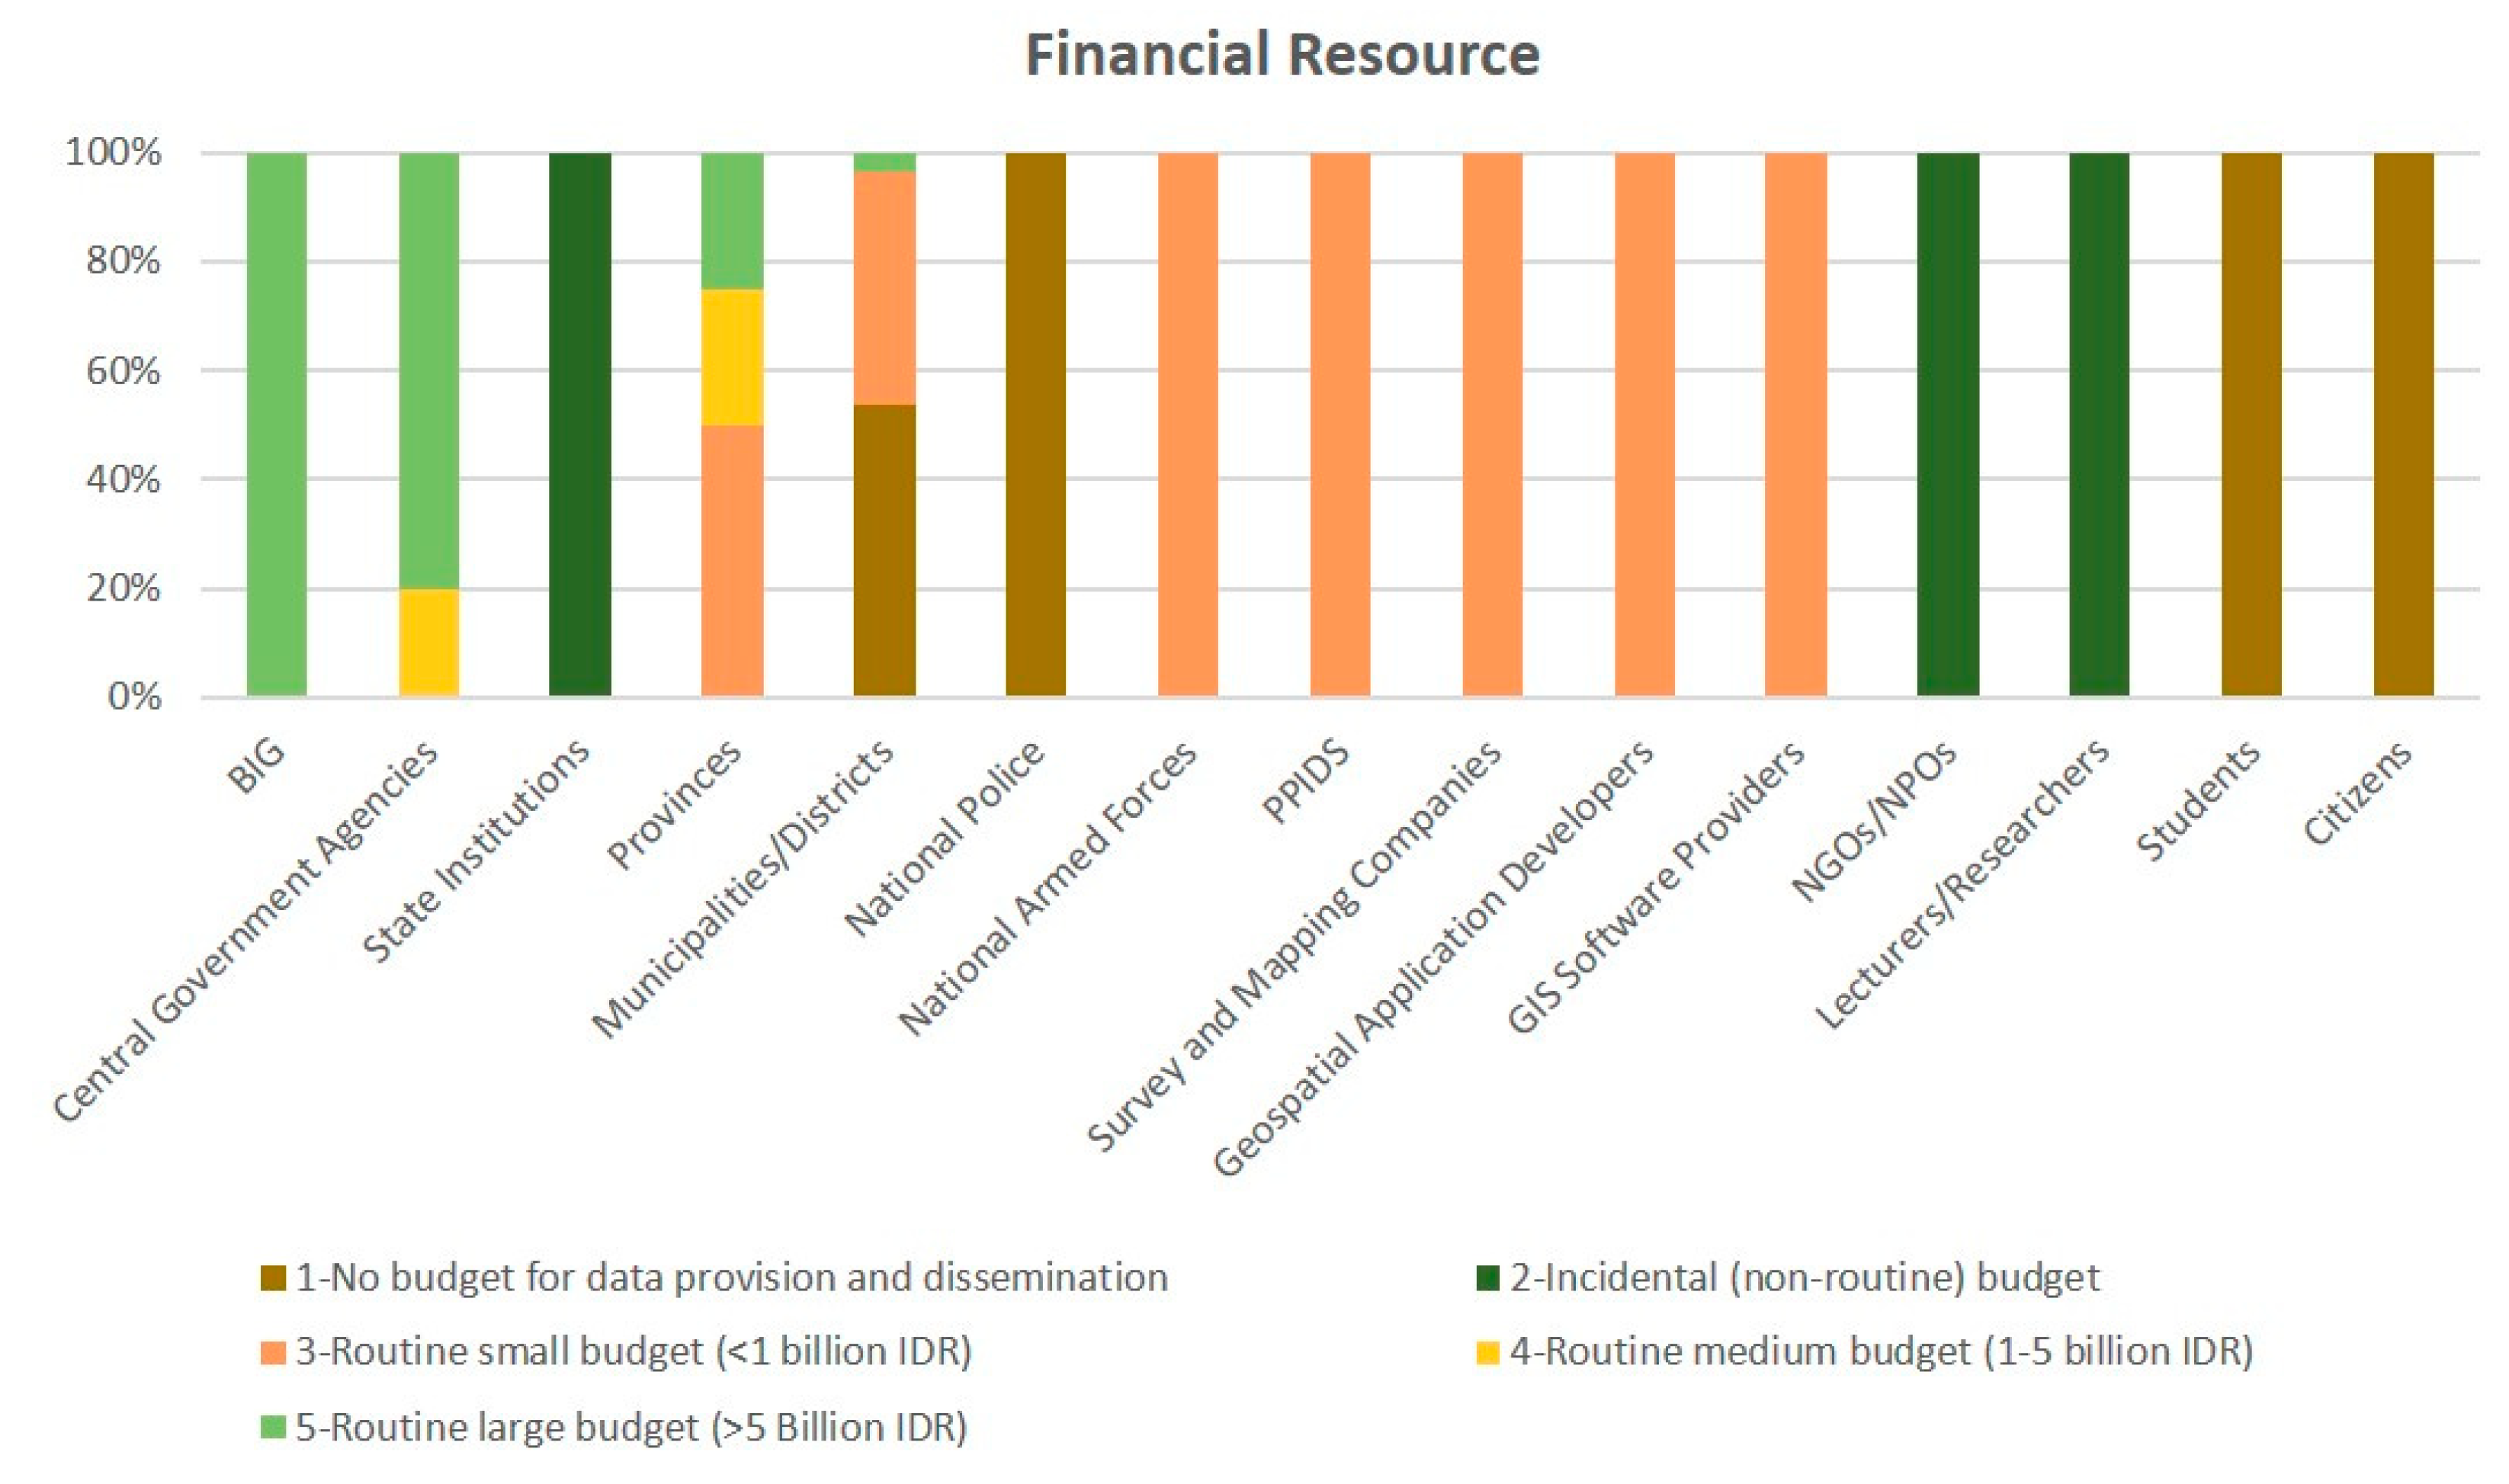
  • Sustainable funding for supporting NSDI activities only exists at BIG and central government agencies. Financial support from other key stakeholders is unreliable.

5. Conclusions

In this study, we identified the evolution of NSDI development in Indonesia. The initiative was developed over three periods, influenced by the technological changes in geospatial data management. Despite support from leaders and the existence of legal instruments for NSDI application, stakeholders still experience problems. The major obstacles are related to limitations in technical resources, financial support, and labor, which result in low participation in the NSDI network. In addition, active partnerships only exist among government institutions, particularly ministries and central government agencies. This leads to the invisibility of value-added products and services created by private companies.
The NSDI stakeholder diagram and NSDI actor-linkage graph were created to investigate the behavior of stakeholders, and these tools were helpful in evaluating NSDI development. Application of the NSDI stakeholder diagram distinguishes stakeholders based on their interest, influence, and capacity. The actor-linkage graph identifies and describes interrelationships among the stakeholders. These tools can be valuable additions to the current framework for NSDI assessment.
We propose several directions for better functioning of NSDI based on our SWOT analysis. First, the establishment of an NSDI committee is essential for NSDI implementation. Commitment from top-level executives could minimize governmental organization conflicts and weak interactions among the network nodes. The committee should comprise members that can tackle resource limitations encountered by the stakeholders and invite participation from the private sector and geospatial communities. Second, it is important to structure the NSDI objectives, outputs, and action plans in a detailed manner. An NSDI grand design is required for providing inclusive guidance and ensuring the measurement of NSDI activities. Finally, the NSDI should broaden its scope and functionality. It is necessary to have a platform that can accommodate active interactions among official data producers, companies, research institutions, and geospatial communities. Emerging geospatial and information technologies can be adopted to support efficient implementation, particularly in geospatial data provision and distribution.
The analysis conducted in this research was limited to Indonesia. It will be interesting to observe the evolution of NSDI development in other nations to understand how stakeholders contribute to and interact in different NSDI landscapes.

Author Contributions

Tandang Yuliadi Dwi Putra conducted the research and wrote the article. Yoshihide Sekimoto supported the research design and goals, provided suggestions, and reviewed the article. Ryosuke Shibasaki supported the research design and reviewed the article.

Funding

This research was funded by Research and Innovation in Science and Technology Project (RISET-Pro) from the Ministry of Research, Technology and Higher Education of Indonesia (Kementerian Riset, Teknologi, dan Pendidikan Tinggi).

Acknowledgments

The authors would like to thank BIG for supporting the questionnaire surveys and interview activities.

Conflicts of Interest

The authors declare no conflict of interest. The funder had no role in the design of the study; collection, analyses, or interpretation of data; writing of the manuscript; or the decision to publish the results.

Appendix A. Representatives of the Semi-Structured Interviews

Table A1 describes the types of institutions and positions of representatives for the semi-structured interviews.
Table A1. Details of the interviewees’ institutions and positions.
IDName of InstitutionType of InstitutionPosition
Int1Center for Regional Potential Development of West Java ProvinceProvincial governmentHead of Regional Potential Analysis as Local SDI Coordinator
Int2Ministry of Public Works and Public HousingMinistryHead of Information Technology Service Section as SDI Coordinator in the ministry
Int3National Land Agency (BPN)Central government agencyAnalyst of the Information System Network
Int4Ministry of Environment and ForestryMinistryHead of Management of Geospatial Data Network Section as SDI Coordinator in the ministry
Int5Regional Development Planning Agency of Depok MunicipalityMunicipal governmentHead of Research & Development Subdivision as Local SDI Manager
Int6Geospatial Information Agency (BIG)Central government agencyHead of Dissemination of Geospatial Information Division
Int7Spatial Planning and Land Agency of DKI Jakarta ProvinceProvincial governmentHead of Land Division
Int8Ministry of AgricultureMinistryAnalyst of Agricultural Data and Information
Int9PT. ESRI IndonesiaPrivate company (GIS software provider)Director of National Government Affairs
Int10PT. Waindo SpecTerraPrivate company (survey and mapping)Information Technology Manager
Int11PT. Tiza SolusindoPrivate Company (GIS application developer)Managing Director
Int12PT. Qlue Performa IndonesiaPrivate company (GIS application developer)Strategist for Public and Government Affairs
Int13PT. PAM Lyonnase JayaPrivate company (water supply service)GIS Manager
Int14PT. WebGIS IndonesiaPrivate company (Web mapping developer)Chief Executive Officer
Int15PT. Bank Muamalat IndonesiaPrivate company (banking and finance)Director of Information Technology
Int16University of Gadjah Mada (UGM)Academic (center for SDI development)Head of Center for SDI Development of UGM
Int17Bandung Institute of Technology (ITB)Academic (center for SDI development)Head of Center for SDI Development of ITB
Int18University of Pakuan BogorAcademicGIS Lecturer and Researcher
Note: SDI = spatial data infrastructure; GIS = geographic information system.

Appendix B. Indicator of the Stakeholders’ Features in the NSDI Stakeholder Analysis

Table A2 describes the four NSDI features of stakeholder capabilities, with detailed indicators presented using a five-point Likert scale. These indicators were extracted from the questionnaire surveys with the purpose of capturing each stakeholder’s capabilities to implement NSDI in their institution.
Table A2. National spatial data infrastructure (NSDI) determinants and their indicators used in the questionnaire.
NSDI DeterminantsIndicators
Geospatial data provision1 = No geospatial data available
2 = Non-GIS data format available
3 = Basic geospatial data available
4 = Basic and thematic data available
5 = All of the above, and the data conform with the national catalog
Technological infrastructure1 = No GIS software/hardware and internet network
2 = GIS software or internet network available
3 = GIS software/hardware and internet network available
4 = GIS software/hardware, GIS server, and internet network available
5 = All of the above, and the geoportal and dedicated data center available
Financial resource1 = No budget for data provision and dissemination
2 = Incidental (non-routine) budget
3 = Small annual budget (<IDR 1 billion/US$ 74,000 1)
4 = Medium annual budget (IDR 1–5 billion/US$ 74,000–370,000)
5 = Large annual budget (>IDR 5 billion/US$ 370,00)
Human capacity1 = No GIS workers available
2 = Small number of GIS workers available (1–5 people)
3 = Several GIS workers available (6–10 people)
4 = Large number of GIS workers available (>10 people)
5 = Large number of professional GIS workers available
Note: 1 Currency rate 1 USD = IDR 13,500; GIS = geographic information system.
Table A3 describes the average values of the four NSDI features from the questionnaire surveys.
Table A3. Average Likert scale values of the national spatial data infrastructure (NSDI) stakeholders’ features.
No.StakeholderData ProvisionTechnological InfrastructureHuman CapacityFinancial Resource
1.BIG5.05.05.05.0
2.Central Government Agencies4.64.84.44.8
3.State Institutions2.02.02.02.0
4.Provincial Government4.04.22.03.8
5.Municipality/District Government3.32.52.32.0
6.National Police2.02.02.01.0
7.National Armed Forces3.03.03.03.0
8.PPIDS4.04.03.03.0
9.Survey and Mapping Companies3.04.04.03.0
10.Geospatial Application Developers3.04.04.03.0
11.GIS Software Providers3.04.04.03.0
12.NGOs/NPOs3.03.02.02.0
13.Lecturers and Researchers3.03.02.02.0
14.Students3.03.02.02.0
15.Citizens1.02.01.01.0
Note: BIG = Badan Informasi Geospasial; PPIDS = Pusat Pengembangan Infrastruktur Data Spasial; GIS = geographic information system; NGOs/NPOs = non-governmental/non-profit organizations.

Appendix C. Details of the Cost Estimation of 1:5000 Scale Topographic Mapping by Aerial Photo Method

Table A4 describes cost components in detail for producing 1:5000 scale topographic maps using aerial photos. There are four types of cost components including work forces, tools (hardware and software), stationery, and transportation. We refer to the standard base price of geospatial information activity [44] for the cost calculation.
Table A4. Cost details of 1:5000 scale topographic mapping by the aerial photo method.
ProcedureSub-ProcedureActivityCost ComponentCost (IDR)
Data ProcessingProject preparation- Preparation of tools and personnel
- Creation of working plan
Work forces Stationery
Work forces
Tools
Stationery
53,000,000
260,000
26,500,000
5,374,000
312,540
- Report writingWork forces 3,900,000
Tools8,220,000
Stationery260,000
Data preparation- Preparation of tools and personnelWork forces3,080,000
Tools585,000
- Data assessmentWork forces3,080,000
Tools335,000
- Report writingWork forces 6,160,000
Tools 1,020,000
Stationery260,000
Subtotal Preparation112,346,540
Stereo plotting- Preparation of tools and personnelWork forces930,800
Tools871,700
- Stereo plotting all objects Work forces1,619,650,000
Tools1,081,700,000
- Report writingWork forces 6,160,000
Tools 1,020,000
Stationery260,000
Subtotal Stereo Plotting2,710,592,500
Topology editing- Preparation of tools and personnelWork forces930,800
Tools521,700
- Topology creation and editingWork forces80,982,500
Tools23,635,000
- Polygon creation and editingWork forces80,982,500
Tools23,635,000
- Report writingWork forces 6,160,000
Tools 1,020,000
Stationery260,000
Subtotal Topology Editing218,127,500
Digital terrain model (DTM) creation- Preparation of tools and personnelWork forces930,800
Tools521,700
- DTM creation and editingWork forces215,951,400
Tools63,028,600
- Report writingWork forces 6,160,000
Tools1,020,000
Stationery260,000
Contour editing- Preparation of tools and personnelWork forces930,800
Tools521,700
- Contour editingWork forces323,930,000
Tools94,540,000
- Spot height creationWork forces107,978,600
Tools31,511,400
- Report writingWork forces 6,160,000
Tools 1,020,000
Stationery260,000
Subtotal DTM and Contour Editing854,725,000
Field SurveySurvey preparation- Preparation of tools and personnelWork forces930,800
Tools487,800
- MobilizationWork forces3,660,000
Transportation1,400,000
- CoordinationWork forces4,654,100
Transportation8,474,450
Tools593,750
- DemobilizationWork forces3,660,000
Transportation1,400,000
- Secondary data collectionWork forces1,861,600
Tools525,000
- Creation of manuscript mapWork forces 35,093,480
Tools 13,142,800
Stationery18,127,320
- Detailed survey planningWork forces 930,800
Tools262,500
- Survey form Work forces 15,500
Tools 3,050
Stationery260,000
- Report developmentWork forces 6,160,000
Tools 1,020,000
Stationery260,000
Field survey- Preparation of tools and personnelWork forces 1,680,800
Tools 1,844,450
- MobilizationWork forces7,410,000
Transportation1,400,000
- Verification of topographic featureWork forces61,514,800
Transportation46,162,200
Tools41,945,600
- Boundary identificationWork forces38,448,200
Transportation28,849,200
Tools26,216,000
- Toponym collectionWork forces553,668,000
Transportation415,465,600
Tools377,493,000
- Accuracy testWork forces4,627,600
Transportation3,523,400
Tools5,398,000
- Data processingWork forces 60,476,600
Tools 87,701,800
- DemobilizationWork forces5,160,000
Transportation1,400,000
- Report writingWork forces 6,160,000
Tools 1,020,000
Stationery260,000
Subtotal Field Survey1,880,748,200
Geodatabase Feature editing- Preparation of tools and personnelWork forces 930,800
Tools 521,700
- Feature and attribute editingWork forces 269,943,600
Tools 78,781,400
- Edge matchingWork forces 64,786,000
Tools 18,908,000
Topology validation- Topology editing and validationWork forces 2,327,080
Tools 679,170
Subtotal Feature Editing and Topology Validation436,877,750
Metadata creation- Metadata editingWork forces 8,021,600
Tools 1,813,400
Stationery260,000
Subtotal Metadata Creation10,095,000
VisualizationMap presentation- Preparation of tools and personnelWork forces 930,800
Tools 575,300
- Lay outingWork forces 132,980
Tools 35,470
- Map printingWork forces 66,480
Tools 149,480
Stationery806,540
- Final report writingWork forces 15,910,000
Tools 3,070,000
Stationery9,352,000
Subtotal Visualization31,029,050

References

  1. Rajabifard, A.; Williamson, I.P.; Feeney, M.-E.F. Chapter Two: Spatial Data Infrastructures—Concepts, nature and SDI hierarchy. In Development of Spatial Data Infrastructures: From Concept to Reality; Rajabifard, A., Williamson, I.P., Feeney, M.-E.F., Eds.; Taylor & Francis: London, UK, 2003; ISBN 0-415-30265-X. [Google Scholar]
  2. Ayanlade, A.; Orimoogunje, I.O.O.; Borisade, P.B. Geospatial data infrastructure for sustainable development in sub-Saharan countries. Int. J. Dig. Earth 2008, 1, 247–258. [Google Scholar] [CrossRef]
  3. Fernandez, T.D.; Crompvoets, J. Evaluating Spatial Data Infrastructures in the Caribbean for sustainable development. In Proceedings of the 10th GSDI Conference, St. Augustine, Trinidad, 25–29 February 2008. [Google Scholar]
  4. Panagiotis, T.; Maria, P. Greek National Spatial Data Infrastructure: Attempts towards design and implementation. Int. J. Spat. Data Infrastruct. Res. 2013, 8, 21–42. [Google Scholar]
  5. Čada, V.; Janečka, K. The Strategy for the Development of the Infrastructure for Spatial Information in the Czech Republic. ISPRS Int. J. Geo-Inf. 2016, 5, 33. [Google Scholar] [CrossRef]
  6. Kusuda, T. A study of utilization of NSDI for the sustainable development. In Proceedings of the World Bank Annual Land and Poverty Conference, Washington, DC, USA, 20–24 March 2017. [Google Scholar]
  7. Masser, I. GIS Worlds: Creating Spatial Data Infrastructures; Esri Press: Redlands, CA, USA, 2005; ISBN 1-58948-122-4. [Google Scholar]
  8. Crompvoets, J.; de Bree, F.; van Oort, P.; Bregt, A.; Wachowicz, M.; Rajabifard, A.; Williamson, I.P. Worldwide impact assessment of spatial data clearinghouses. URISA J. 2007, 19, 23–32. [Google Scholar]
  9. Campagna, M.; Craglia, M. The Socioeconomic Impact of the Spatial Data Infrastructure of Lombardy. Environ. Plan. B Plan. Des. 2012, 39, 1069–1083. [Google Scholar] [CrossRef]
  10. Almirall, P.G.; Bergada, M.M.; Ros, P.Q. The Socio-Economic Impact of the Spatial Data Infrastructure of Catalonia; JRC Scientific and Technical Reports; European Commission: Luxembourg, 2008. [Google Scholar]
  11. Masser, I. All shapes and sizes: the first generation of national spatial data infrastructures. Int. J. Geogr. Inf. Sci. 1999, 13, 67–84. [Google Scholar] [CrossRef]
  12. Maguire, D.J.; Longley, P.A. The emergence of geoportals and their role in spatial data infrastructures. Comput. Environ. Urban Syst. 2005, 29, 3–14. [Google Scholar] [CrossRef]
  13. Harvey, F.; Iwaniak, A.; Coetzee, S.; Cooper, A. SDI Past, Present and Future: A Review and Status Assessment. In Spatially Enabling Government, Industry and Citizens: Research and Development Perspectives; Rajabifard, A., Coleman, D., Eds.; GSDI Association Press: Needham, MA, USA, 2012; ISBN 978-0-9852444-0-8. [Google Scholar]
  14. Diaz, L.; Remke, A.; Kauppinen, T.; Degbelo, A.; Foerster, T.; Stasch, C.; Rieke, M.; Schaffer, B.; Baranski, B.; Broring, A.; et al. Future SDI—Impulses from geoinformatics research and IT trends. Int. J. Spat. Data Inf. Res. 2012, 7, 378–410. [Google Scholar]
  15. Crompvoets, J.; Bregt, A. National Spatial Data Clearinghouses, 2000-2005. In Research and Theory in Advancing Spatial Data Infrastructure; Onsrud, H., Ed.; ESRI Press: Redlands, CA, USA, 2007. [Google Scholar]
  16. Lilywati, H.; Gularso, S.K. SIGNas sebagai Landasan Informasi Spasial untuk Menunjang Manajemen Pembangunan; BATAN: Jakarta, Indonesia, 2000; Volume XI, pp. 15–37. [Google Scholar]
  17. Darmawan, M.; Sutanta, H.; Rusmanto, A. Developing Local Government Capacity for SDI Development in Indonesia. In Proceedings of the FIG Congress 2014—Enganging the Challenges, Enhancing the Relevance, Kuala Lumpur, Malaysia, 16–21 June 2014; FIG: Kuala Lumpur, Malaysia, 2014. [Google Scholar]
  18. Ikawati, Y. Minim Peta untuk Rencana Detil Tata Ruang. Kompas, 19 September 2017; 10. [Google Scholar]
  19. Putra, T.Y.D.; Aditya, T.; de Vries, W. Making sense of Local Spatial Data Infrastructure in Volcanic Disaster Risk Management: A case study at Sleman Regency, Indonesia. In Spatially Enabling Society: Research, Emerging Trends and Critical Assessment; Rajabifard, A., Crompvoets, J., Kalantari, M., Kok, B., Eds.; Leuven University Press: Leuven, Belgium, 2010. [Google Scholar]
  20. Sahroni, W.Y.; Saleh, M.B.; Wijanarto, A.B. The effectiveness of spatial data sharing in Indonesia-SDI: Case study in Ministry of Environment and Forestry and Provincial Government of West Java. Majalah Ilmiah Globe 2017, 19, 53–64. [Google Scholar] [CrossRef]
  21. Poniman, A.; Nurwadjedi; Lumban-Tobing, P. Developing the National Land Resource Database for Supporting Spatial Land Use Planning. In Proceedings of the 3rd FIG Regional Conference, Jakarta, Indonesia, 3–7 October 2004. [Google Scholar]
  22. Ikawati, Y.; Setiawati, D.R. Survei dan Pemetaan Nusantara; Badan Koordinasi Survei dan Pemetaan Nasional (Bakosurtanal): Cibinong, Indonesia, 2009; ISBN 978-602-95542-0-5.
  23. Dahuri, R.; Sitepu, M.J.; Dutton, I.M. Building integrated coastal management capacity in Indonesia: The contribution of MREP. In Proceedings of the International Conference of Oceanology (OI 99), Singapore, 27–29 April 1999; pp. 223–237. [Google Scholar]
  24. Matindas, R.W.; Puntodewo; Purnawan, B. Development of National Spatial Data Infrastructure in Indonesia. In Proceedings of the FIG Working Week 2004, Athens, Greek, 22–27 May 2004. [Google Scholar]
  25. Bakosurtanal Pedoman Penyelenggaraan Infrastruktur Data Spasial Nasional; Bakosurtanal: Cibinong, Indonesia, 2008.
  26. Puntodewo; Nataprawira, R. Indonesian Geospatial Data Clearinghouse. In Proceedings of the 3rd FIG Regional Conference, Jakarta, Indonesia, 3–7 October 2004. [Google Scholar]
  27. Lilywati, H. Sistem Informasi Spasial Nasional. In Proceedings of the Rapat Koordinasi Infrastruktur Data Spasial Nasional, Jakarta, Indonesia, 25 June 2007. [Google Scholar]
  28. Nurwadjedi. One Map Policy: Integrating local data into national database. In Proceedings of the Disaster Risk Management in East Asia and the Pacific Distance Learning Seminar, Jakarta, Indonesia, 18 June 2013. [Google Scholar]
  29. Khafid. Pertukaran Data dan Informasi Geospasial melalui Jaringan Informasi Geospasial Nasional. In Proceedings of the Sosialisasi Aplikasi Open Source and Ina-Geoportal, Aceh, Indonesia, 28 April 2017. [Google Scholar]
  30. Badan Informasi Geospasial. Katalog Standar Nasional Indonesia Penyelenggaraan Informasi Geospasial; Badan Informasi Geospasial: Cibinong, Indonesia, 2015.
  31. Badan Informasi Geospasial. Pedoman Geoportal Kebijakan Satu Peta; Badan Informasi Geospasial: Cibinong, Indonesia, 2018.
  32. Abidin, H.Z. Strenghtening Geospatial Information in Indonesia. Presented at the 5th High Level Forum UN-GGIM, Mexico City, Mexico, 28–30 November 2017. [Google Scholar]
  33. International Telecommunication Union. Measuring the Information Society Report 2017; International Telecommunication Union: Geneva, Switzerland, 2017. [Google Scholar]
  34. Erik de Man, W.H. Understanding SDI; complexity and institutionalization. Int. J. Geogr. Inf. Sci. 2006, 20, 329–343. [Google Scholar] [CrossRef]
  35. Reed, M.S.; Graves, A.; Dandy, N.; Posthumus, H.; Hubacek, K.; Morris, J.; Prell, C.; Quinn, C.H.; Stringer, L.C. Who’s in and why? A typology of stakeholder analysis methods for natural resource management. J. Environ. Manag. 2009, 90, 1933–1949. [Google Scholar] [CrossRef] [PubMed]
  36. Ackermann, F.; Eden, C. Strategic Management of Stakeholders: Theory and Practice. Long Range Plan. 2011, 44, 179–196. [Google Scholar] [CrossRef]
  37. Eelderink, L.; Crompvoets, J.; de Man, W.E. Towards key variables to assess National Spatial Data Infrastructures (NSDIs) in developing countries. In A Multi-View Framework to Assess SDIs; Wageningen University: Wageningen, The Netherlands, 2008; p. 307. [Google Scholar]
  38. Fernández, T.D.; Fernández, M.D.; Andrade, R.E. The Spatial Data Infrastructure Readiness model and its worldwide application. In A Multi-View Framework to Assess SDIs; Crompvoets, J., Rajabifard, A., Van Loenen, B., Fernández, T.D., Eds.; Wageningen University: Wageningen, The Netherlands, 2008; p. 117. [Google Scholar]
  39. Hendriks, P.H.J.; Dessers, E.; van Hootegem, G. Reconsidering the definition of a spatial data infrastructure. Int. J. Geogr. Inf. Sci. 2012, 26, 1479–1494. [Google Scholar] [CrossRef]
  40. Biggs, S.; Matsaert, H. Strengthening Poverty Reduction Programmes Using an Actor-Oriented Approach: Examples from Natural Resources Innovation Systems; Overseas Development Institute (ODI), Agricultural Research & Extension: London, UK, 2004; ISBN 0-85003-704-2. [Google Scholar]
  41. Castelein, W.; Bregt, A.; Gruz, L. The Role of Collaboration in Spatial Data Infrastructures. URISA J. 2013, 25, 31–40. [Google Scholar]
  42. Badan Informasi Geospasial. Laporan Tahunan (Annual Report) 2015; Badan Informasi Geospasial: Cibinong, Indonesia, 2015.
  43. Badan Informasi Geospasial. Peraturan Kepala Badan Informasi Geospasial Nomor 12 Tahun 2016 tentang Analisis Biaya Keluaran Kegiatan Penyelenggaraan Informasi Geospasial; Badan Informasi Geospasial: Cibinong, Indonesia, 2016; (In Bahasa Indonesia).
  44. Badan Informasi Geospasial. Peraturan Kepala Badan Informasi Geospasial Nomor 11 Tahun 2016 tentang Standar Biaya Kegiatan Penyelenggaraan Informasi Geospasial Tahun Anggaran 2017; Badan Informasi Geospasial: Cibinong, Indonesia, 2016; (In Bahasa Indonesia).
  45. Van Loenen, B.; Van Rij, E. Assessment of Spatial Data Infrastructures from an Organizational Perspective. In A Multi-View Framework to Assess SDIs; Wageningen University: Wageningen, The Netherlands, 2008; p. 173. [Google Scholar]
  46. Sinvula, K.M.; Coetzee, S.; Cooper, A.; Owusu-Banahene, W.; Nangolo, E.; Rautenbach, V.; Hipondoka, M. A comparative analysis of stakeholder roles in the SDI of South Africa, Namibia and Ghana. Int. J. Spat. Data Infrastruct. Res. 2017, 12, 1–25. [Google Scholar]
  47. Janne, S.; Lorkhamyong, K. Establishing Sustainable NSDI: Combined Technical and Institutional Approach. In Proceedings of the From the Wisdom of the Ages to the Challenges of the Modern World, Sofia, Bulgaria, 17–21 May 2015. [Google Scholar]
  48. Hennig, S.; Belgiu, M. User-centric SDI: Addressing Users Requirements in Third-Generation SDI. The Example of Nature-SDIplus. Geoforum Perspektiv 2011, 20, 30–42. [Google Scholar]
  49. Gurel, E.; Tat, M. SWOT Analysis: A Theoretical Review. J. Int. Soc. Res. 2017, 10. [Google Scholar] [CrossRef]
Figure 1. Problems in national spatial data (NSDI) implementation, as identified by the interviewees. Geographic information system (GIS), information communication technology (ICT).
Ijgi 08 00263 g001
Figure 2. Ina-Geoportal users by type of institution.
Ijgi 08 00263 g002
Figure 3. Power-interest grid of national spatial data infrastructure stakeholders.
Ijgi 08 00263 g003
Figure 4. Questionnaire results on data provision of the stakeholders. Center for SDI Development (Pusat Pengembangan Infrastruktur Data Spasial; PPIDS), non-governmental organizations (NGOs) or non-profit organizations (NPOs).
Ijgi 08 00263 g004
Figure 5. Questionnaire results on technological infrastructure.
Ijgi 08 00263 g005
Figure 6. Questionnaire results on human capacity.
Ijgi 08 00263 g006
Figure 7. Questionnaire results on financial resources.
Ijgi 08 00263 g007
Figure 8. National spatial data infrastructure stakeholder diagram.
Ijgi 08 00263 g008
Figure 9. National spatial data infrastructure actor-linkage graph.
Ijgi 08 00263 g009
Figure 10. Cost of national spatial data infrastructure (NSDI) development in Indonesia for 2013–2017.
Ijgi 08 00263 g010
Figure 11. Four national spatial data infrastructure (NSDI) development costs in detail: (a) Data provision; (b) NSDI network nodes; (c) Organizational; (d) Capacity building.
Ijgi 08 00263 g011
Table 1. Periods of national spatial data infrastructure (NSDI) development in Indonesia.
Period Institution of NSDI OperationData PolicyTechnological ChangesUsers
Centralized Data
(1991–2000)
BakosurtanalPay for digital geospatial data (e.g., US$ 35/map sheet for a 1:25,000 topographic map) Desktop geographic information system and geodatabaseNational government agencies and the local government
Distributed System (2001–2010)Bakosurtanal as the coordinating agency; other national agencies as participantsPay for digital geospatial dataWeb mapping and clearinghouseNational government agencies, local government, academia, and non-profit organizations
Open Initiative (2011–present)Badan Informasi Geospasial (formerly Bakosurtanal) acting as the network nodes connector; ministries/national agencies and local governments as network nodes Public and open data; digital base maps available for downloadGeoportal, participatory mapping, and mobile applicationsNational government agencies, local government, academia, non-profit organizations, and web mapping companies
Table 2. Interest and power of stakeholders of the national spatial data infrastructure (NSDI).
No.StakeholderInterestPower to Influence
1.Badan Informasi Geospasial (BIG)
-
Disseminates basic geospatial information
-
Collects thematic data
-
Establishes network node connections
-
Accesses web services
Functions as a network node connector (Presidential Decree No. 27/2014)
2.Central Government Agencies
-
Collect topographic maps
-
Share thematic data
-
Access web services
Function as network nodes
3.State Institutions- Collect basic geospatial dataFunction as network nodes
4.Provincial Government
-
Collects topographic maps and thematic data
-
Integrates data from local government agencies
-
Accesses web services
Functions as a network node
5.Municipality/District Government
-
Collects topographic maps and thematic data
-
Integrates data from local government agencies
-
Accesses web services
Functions as a network node
6.National Police- Collects topographic maps and thematic dataFunctions as a network node
7.National Armed Forces- Collect topographic maps and thematic dataFunction as a network node
8.Pusat Pengembangan Infrastruktur Data Spasial
-
Collects basic and thematic data
-
Accesses web services
-
Researches spatial data infrastructure
-
Collaborates with network nodes
Has a memorandum of understanding with BIG
9.Survey and Mapping Companies- Collect basic and thematic dataAct as NSDI users (not members of the network nodes)
10.Geospatial Application Developers
-
Collect basic and thematic data
-
Access web services
Act as NSDI users
11.Geographic Information System Software Providers
-
Collect basic and thematic data
-
Provide software for network nodes
Act as NSDI users
12.Non-Governmental/Non-Profit Organizations
-
Collect basic and thematic data
-
Access web services
Act as NSDI users
13.Lecturers/Researchers
-
Collect basic and thematic data
-
Access web services
Act as NSDI users
14.Students
-
Collect basic and thematic data
-
Access web services
Act as NSDI users
15.Citizens- Access Ina-GeoportalAct as NSDI users
Table 3. Number of connections among national spatial data infrastructure stakeholders.
No.StakeholderConnection(s)
1.Badan Informasi Geospasial5 strong, 4 weak
2.Central Government Agencies2 strong, 4 weak
3.State InstitutionsNo connections
4.Provincial Government3 strong, 4 weak
5.Municipality/District Government3 strong, 4 weak
6.National PoliceNo connections
7.National Armed Forces1 strong
8.Pusat Pengembangan Infrastruktur Data Spasial1 strong, 2 weak
9.Survey and Mapping Companies4 strong, 1 weak
10.Geospatial Application Developers4 weak
11.Geographic Information System Software Providers5 weak
12.Non-Governmental/Non-Profit Organizations1 weak
13.Lecturers and Researchers1 weak
14.Students1 weak
15.Citizens1 weak
Table 4. Cost estimation of 1:5000 scale topographic mapping of Cibinong District using the aerial photo method.
ProcedureSub-ProcedureCost (IDR) Cost1 (USD)
Data processing- Preparation112,346,5408322
- Stereo plotting2,710,592,500200,785
- Topology editing218,127,50016,158
- Digital terrain model creation and contour editing854,725,00063,313
Field survey 1,880,748,200139,315
Geodatabase- Feature editing and topology validation436,877,75032,361
- Metadata creation10,095,000748
Visualization 31,029,0502,298
Total cost for 58 mapsheets6,254,541,540463,300
Unit cost per mapsheet107,963,8717,988
1 Currency rate 1 USD = IDR 13,500.

