Abstract
People share data in different ways. Many of them contribute on a voluntary basis, while others are unaware of their contribution. They have differing intentions, collaborate in different ways, and they contribute data about differing aspects. Shared Data Sources have been explored individually in the literature, in particular OpenStreetMap and Twitter, and some types of Shared Data Sources have widely been studied, such as Volunteered Geographic Information (VGI), Ambient Geographic Information (AGI), and Public Participation Geographic Information Systems (PPGIS). A thorough and systematic discussion of Shared Data Sources in their entirety is, however, still missing. For the purpose of establishing such a discussion, we introduce in this article a schema consisting of a number of dimensions for characterizing socially produced, maintained, and used ‘Shared Data Sources,’ as well as corresponding visualization techniques. Both the schema and the visualization techniques allow for a common characterization in order to set individual data sources into context and to identify clusters of Shared Data Sources with common characteristics. Among others, this makes possible choosing suitable Shared Data Sources for a given task and gaining an understanding of how to interpret them by drawing parallels between several Shared Data Sources.
1. Introduction
Data are increasingly produced, maintained, and used by heterogeneous groups of people, across cultures, country borders, differing levels of education, and so forth, which leads to a diversity of characteristics [1]. Among others, data are often stored in a loose format or even different formats within one dataset; people often have diverse motivations to contribute and use data; and the data are maintained with differing intensity. Further, such differences lead to a different degree of organization and collaboration among the contributors and users of a dataset. These factors pose major challenges to the interpretation and use of such data. Instead of well-defined ontologies, the data often need to be interpreted on-the-fly and while considering the context of its genesis. The geographical domain challenges the interpretation of data in a particular way because geographical data is often of intercultural and global nature.
Data (and corresponding projects) that are the result of a social process have been termed in different ways, among them ‘User-Generated Data’ and ‘User-Created Content’ [2]. These and other terms are often context dependent and refer thus only to a subset of such data sources. They possess a connotation and do thus not communicate the class of such datasets in its uttermost generality. The term ‘User-Generated Data’ refers, e.g., to the creation process of the data rather than also to their use. This is why we coin the term ‘Shared Data Sources’ (SDS) as a more generic umbrella term without such a connotation. We define: A dataset or project is called a ‘Shared Data Source’ if its production, maintenance, and use are predominantly social processes.
The reason behind the introduction and choice of the term ‘SDS’ is manifold. First, the term ‘SDS’ puts emphasis on the fact that the data are the result of a creation and maintenance process and are used in some social context. A ‘source’ refers to the process from which the data derives and by that also to its use—the creation process usually has the aim of producing data for a certain use, and the future use is the reason for why the data is created. In comparison, most of the terms used to identify a subset of SDSs refer to either information or data, such as Volunteered Geographic Information, while only some refer to a process [3]. The term ‘SDS’ contains reference to both the data and the process. Secondly, the introduction of the term ‘SDS’ is meant to highlight that all three aspects (data creation, maintenance, and use) need to predominantly be of social nature. Data created in a social process but used only by a single company is not an SDS, and data created by a small number of people is neither as long as the social interaction between these people does not strongly influence and shape the resulting data. The social nature of SDSs is, in fact, determining because mere technical aspects become less important whenever the data is shaped by a social process [4].
In addition to the term ‘Shared Data Source’, we coin the term ‘Geographical Shared Data Source’ (GSDS) for referring to an SDS in the geographical domain. At first hand, one might question why this term should be introduced because the restriction to a specific domain does not seem to be vital. In fact, many factors that relate to the heterogeneity of the social process, among them the cultural, social, and educational background of the involved people, are acknowledged to be significant to geography. When an SDS is about geographical content on a global scale1, its creation, maintenance, and use are thus often particularly subject to social influence. This is why we use GSDSs as examples in the following.
This article focusses on the methodological challenge of making sense of SDSs, both individually by setting an SDS in the context of others and by more holistically examining a larger number of SDSs in their entirety. Thereby, the following research questions are addressed:
- RQ1
- Which ‘dimensions’ can be used to characterize an SDS?The social nature of SDSs imposes structural complexity to both the data and the entire projects. There exist hence a multitude of dimensions, which can be used to characterize an SDS. Which of these dimensions are important and how can they be grouped by their role in the process of creating, maintaining, and using the data? Further, how can one evaluate the importance of a certain dimension for characterizing an SDS?
- RQ2
- How to characterize an SDS in the context of other SDSs? And how to characterize the change of an SDS over time?A characterization of an SDS relative to other ones is particularly efficient because differences and similarities become apparent. Again, the dimensions discussed in RQ1 can be utilized for such a comparison. Which methods exist to measure distances between SDSs? How to investigate similarities and differences between SDSs by visualizations? And how to trace changes of an SDS over time, i.e., the evolution of an SDS?
- RQ3
- How to choose suitable prototypes for grouping SDSs by their characteristics? And how to assess existing prototypes?Shared Data Sources are commonly classified into different types2, among them, Volunteered Geographic Information (VGI; Goodchild [8]), Ambient Geographic Information (AGI; [9]), and Public Participation Geographic Information Systems (PPGIS; [10]). Such typification creates obstacles: the types are fuzzy to some degree, they overlap, and the typification is often ambiguous. As a result, the definitions of these types evolve over time and even different definitions coexist. How can we identify groups of SDSs that share common characteristics? How to evaluate and visualize their fuzziness? And how to make sense of SDSs evolving over time in terms of prototypes?
It should be noted that these questions are of mere methodological nature. In this article, we propose conceptual means for characterizing ‘(Geographical) Shared Data Sources’. The proposed dimensions and the discussed prototypes (VGI, PGI3, and AGI) serve only as examples, and additional dimensions and prototypes can easily be integrated into the proposed framework. It is the aim of the article to discuss the methodological chances and issues of how to make sense of SDSs in their mutual context by utilizing the proposed framework. Thereby, we introduce new lenses for the interpretation of the data incorporating their genesis and characteristics, which allows for a more fine-grained typification of SDSs. The practical usefulness of the approach is demonstrated by setting GSDSs mutually into context and by discussing existing prototypes in terms of GSDSs.
The article is structured as follows. After a literature review, we establish the notions of the prototypes VGI, PGI, and AGI as well as of SDSs and GSDSs (Section 2). Further, we argue why a conceptual framework for setting SDSs mutually into context is needed (Section 3). It suggests itself to conceptualize SDSs by their characteristics in such a framework. These characteristics can formally be represented by several dimensions, which describe different aspects of an SDS (Section 4). Visualizations and statistical analysis can take advantage of these dimensions when analysing SDSs. We have described a large number of SDSs from the geographical domain, which can be set in context relative to the prototypes. As a result, the entirety of the described GSDSs, and not only individual ones, can be examined both visually and statistically. The utilized methods of visualization are by no means the only ones. We describe in detail why they are suitable and which aspects they focus on (Section 5). Finally, the findings of our analysis are discussed. In particular, we show that the introduced dimensions are compatible to a high degree with both a (common) thematic categorization of the SDSs as well as with the prototypes of VGI, PGI, and AGI, which is why the dimensions can serve as a reference frame for characterizing SDSs. This demonstrates the usefulness of the proposed methodological means (Section 6).
2. Related Work and Prototypes of Shared Data Sources
Shared Data Sources expose very different characteristics, even within the geographical domain. For instance, OpenStreetMap (OSM), Twitter, and civic issue tracking projects are very different. In literature, little work can be found about how to gain a systematic comprehension for classifying GSDSs in their generality and for describing the differences among them. In order to distinguish between volunteered and contributed information, Harvey [11] has discussed a classification of GSDSs by opt-in and opt-out strategies. Contributors volunteer if they decide on their own to contribute, and they do ‘only’ contribute (in contrast to volunteer) if they have to actively veto the use of the contributed data, according to Harvey [11]. A more fine-grained characterization has been used by Saxton et al. [12], who refers, among others, to the level of collaboration; compensation schemes, which reflect the amount of money one can earn; the control mechanisms; and trust-building systems. By this characterization, he is able to distinguish different mechanisms to create GSDSs, among them citizen media and collaborative software development. Another characterization has been proposed by Spyratos et al. [13]. They refer, among others, to the knowledge and the technical resources of the contributor; data quality requirements; and the actual data quality, including the mechanisms to ensure data quality. In addition, Spyratos et al. [13] have examined thematic categories of GSDSs. Finally, Comber et al. [14] have used text-based analysis methods to investigate scientific articles about GSDSs in order to achieve a common understanding of these SDSs in the geographical domain.
Geographical Shared Data Sources have been grouped into types, each of them containing GSDSs that share common characteristics. A number of terms have been introduced to refer to these different types of GSDSs, among them Volunteered Geographic Information (VGI), Ambient Geographic Information (AGI), Public Participation Geographic Information Systems (PPGIS), Citizen Science, Citizen-Contributed Geographic Information, Collaborative Mapping, Crowdsourcing, Participatory Sensing, Neogeography, and Science 2.0 [3]. These terms have been coined by different people, and while most of these terms refer to different concepts, there exist substantial overlaps between many of them. An overview of such terms has been provided by See et al. [3]. The inconsistent use of these terms is, among others, the result of the fact that the ways we contribute and use data change over time. The evolving nature of GSDSs has been discussed for a long time, among others, in respect to trust [15], their future potential, and corresponding obstacles [16]. Also, the influence of GSDSs on science has been discussed, both in general [17] and in respect to pluralism in science [18]. In the following, we discuss three of the most important types, namely VGI, AGI, and PPGIS.
The term Volunteered Geographic Information (VGI) is widely used. Introduced by Goodchild [8], it refers to ‘a special case of the more general Web phenomenon of user-generated content’ (p. 212). Thereby, he refers several times to the ‘volunteer effort’. Further thoughts, in particular on data quality as a result of the particular characteristics of VGI, have been expressed by Goodchild and Li [19]. Also Bordogna et al. [20] discuss how the creation process of VGI shapes the data quality due to its characteristics. They outline in how far VGI is particularly prone to fuzziness of the ontology as well as to varying precision of geometric information. The use of VGI in the context of geographical science and even in social practice have been discussed by Elwood et al. [4], and Sui and DeLyser [21]. As volunteers contribute knowingly to VGI, they often collaborate in some way, which leads to common insights and shared concepts [1]. In 2018, VGI is one of the most used types of SDSs in the geographical domain.
The term Ambient Geographic Information (AGI) has been introduced by Stefanidis et al. [9]. People often leave ‘footprints’ by using social media—‘passively contributed’ data. Burke et al. [22] discuss the concept of ‘participatory sensing’, strongly related to the idea of AGI: mobile devices collect data and share them automatically. Thereby, opportunities and potential uses of such data become apparent, e.g., in public health, urban planning, cultural identity, and natural resource management [22]. Further critical reflection refers to the context, which is often unknown in case of AGI [23]. The ability of AGI to communicate places through a description of how people experience them is, e.g., limited by the missing context in which the descriptions were created.
The term Public Participation Geographic Information Systems (PPGIS) has been used at least since 1996 when it was coined in a workshop [10]. Originally, it was used to refer to GISs that foster the ‘public involvement in the definition and analysis of questions tied to location and geography’, among others, ‘to incorporate public knowledge from multiple sources into decision frameworks’ that are ‘now primarily in the hands of expert managers of data-driven technologies’ [10]. Sieber [24] summarized the historical development of the concept of PPGIS. Thereby, she highlighted the main factors of PPGIS in terms of how people interact, which technology they use, how they collect and use the data, and the outcomes and evaluation of PPGIS. Despite using different terms, PPGIS has some commonalities with citizen science [25,26,27,28,29].
In this article we will refer to three exemplary prototypes, which will be used to discuss methodological questions, in particular RQ3. The terms discussed before (VGI, AGI, and PPGIS) refer to types of SDSs, but as their definitions are fuzzy in nature and inconsistent definitions and naming schemes coexist in literature [3], there is a need to introduce definitions of prototypes at least for the scope of this article. This helps avoiding the confusion about how to define the terms discussed before (VGI, AGI, and PPGIS). In contrast to these, a prototype does not describe a set of SDSs, which is why the discussion of the boundaries of such a set is avoided as well. Also, a prototype is not an existing SDS. Each SDS has its unique characteristics, which cannot be summarized to its fullest extent by a prototype. The prototypes act rather as a reference frame when setting SDSs into context. As the considerations are of merely methodological nature and the prototypes are only used as examples in this context, the considerations provided in the following sections will easily allow to incorporate further prototypes. In the scope of this article, we use three prototypes, which can be distinguished by the following characteristics:
Volunteered Geographic Information (VGI)4. A GSDS that people knowingly and actively contribute to. The contributors are aware of their contribution and have access to large parts of the resulting dataset. They can potentially join the team of organizers.
Participatory Geographic Information (PGI). A GSDS to which people are invited to contribute to. The contributors are aware of their contribution but have no access to the resulting dataset. They cannot easily join the team of organizers.
Ambient Geographic Information (AGI). A GSDS to which people contribute unintentionally when performing other activities, often even without being aware of the contribution. The contributors have no access to the resulting dataset. They cannot join the team of organizers.
These prototypes can be distinguished by two main properties: the awareness of the contributor while contributing and the possibility to join the team of organizers (Table 1). While these characteristics allow to distinguish these three prototypes, the prototypes are more complex and expose far more characteristics. We consider a larger array of characteristics, which relate to how the GSDSs are characterized in literature.

Table 1.
Simplified systematic overview of the prototypes.
In respect to the term PGI, it should be noted that the terms Public Participation GIS (PPGIS) and Participatory GIS (PGIS) have been used in the literature [30]. The terms differ in the context in which they are used: urban and regional context in developed countries, and rural context in developing countries. In the scope of this article, we use one prototype to refer to any kind of SDS to which people are invited to contribute but to the data of which they have no or only very indirect access. In contrast to the terms PPGIS and PGIS, which include a reference to a system for creating, maintaining, and using the data, we refer to the information itself. This is why we use the term Participatory Geographic Information (PGI)5.
3. The Need for a Conceptual Framework
Understanding the characteristics of an SDS, potentially also of a GSDS, is an important task when making sense and use of data. How could we otherwise know how to interpret the data, and how could we estimate the quality and the fitness for a certain purpose? In this section, we argue that the characteristics of an individual SDS becomes apparent when it is set into the context of other SDSs. Thereby, we discuss how to compare the characteristics of different SDSs in a conceptual space and why it is important to characterize a set of SDSs as a whole.
3.1. Relative Characterization of Individual Data Sources
The interpretation and use of data presumes an understanding of how to ground the data, i.e., of how to make sense of the data in terms of the real world and make it thus usable as information [31]. To establish such a grounding, it is important to explore the representation in respect to many aspects. The resulting characterization of the data provides manifold information, e.g., about the motivation behind the collection of the data, the potentially very heterogeneous collection process, the varied consumption of the data, and so forth. Also, such a characterization can contain information about the quality of the data and, as SDSs are the result of a social creation process, data quality often depends and can be characterized based on these social processes [1,4]. Data quality is actually able to demonstrate the complexity of such aspects. It can, e.g., be assessed by a comparison to reference data, which is considered as being of superior quality [32,33]. Instead of such a comparison to another dataset, data can also be assessed intrinsically by examining whether patterns and laws typical to a certain type of data also apply to the assessed SDS [32,34]. As an example, the number of contributors or the number of edits of a certain feature can provide insights into its quality. Likewise, a saturation of the length of a road network may indicate that the representation of the network is near to complete [34,35,36,37]. These different ways of assessing the data for its quality are, however, not universal. The way people contribute depends strongly on the individual SDS, which is why the preceding examples do not apply in general but only to certain examples of SDSs. A characterization of SDSs by their underlying social principles and mechanisms as well as other aspects is needed to make sense of data quality in particular and ground the data in general.
The classification of SDSs by their underlying principles is very useful for examining an individual SDS. When setting the individual SDS into the context of other SDSs, similarities and differences can easily be recognized. Thereby, similarities among the underlying principles of different SDSs might suggest that the ways of how to make sense of and use the data are similar as well. For instance, data quality measures incorporating the lineage of the data, such as the saturation of the length of a road network, apply to a number of VGI data sources while the heterogeneity of AGI might hinder a meaningful interpretation in many cases. The classification of SDSs by underlying principles thus allows to understand how to make sense of an SDS in manifold ways.
3.2. Characterization of the Set of Shared Data Sources
Shared Data Sources are manifold and multifaceted, which creates the need to characterize them by many different dimensions. The factors named before—the contributors, the consumers, the organizational structure, and so forth—can be used to characterize an SDS. Each of these factors, in turn, can be described by several dimensions. These dimensions characterize in detail how such SDSs mutually relate. As a result, each SDS can be placed in a conceptual space [38] that is spanned by the aforementioned dimensions.
Heterogeneity is a characteristic inherent to many SDSs. In some cases, it might even make sense to examine different parts of a data source independently although these parts belong to one project only—an SDS can be the result of several coexisting mechanisms that generate the data. Accordingly, an SDS usually occupies a region rather than a single point only in the conceptual space. Such regions often have a fuzzy boundary and potentially overlap with those of other SDSs.
The examination of the conceptual space of SDSs reveals not only characteristics of individual SDSs but, potentially, also characteristics of prototypes of SDSs. As an example, the size or shape of regions as well as their fuzziness might correlate to where the region of an SDS is located in the conceptual space. Moreover, some SDSs might cluster while others are evenly distributed in a region of the conceptual space. Instead of relating several SDSs in the conceptual space, also the change of an SDS over time can be traced, thereby relating the corresponding regions of the data source at different points in time. Such considerations may eventually lead to prototypes of SDSs as well as to prototypes of how SDSs can evolve.
4. Dimensions for Conceptualizing Shared Data Sources
As has been motivated in the last section, there is a need for a conceptual framework for characterizing individual SDSs in their mutual contexts and for characterizing a set of SDSs. The aspects can be aligned into dimensions, i.e., sets with a diverging character—low and high values, for example. The dimensions conform yet to different scales of measurement. In a first step, we will motivate how to conceptualize SDSs and thus which factors can be used to group the dimensions. Subsequently, the dimensions related to these factors are discussed.
4.1. Conceptualizing Shared Data Sources
Shared Data Sources are more than data. They are the result of one or more social processes, in which a number of people are involved. These social processes create the data and render their meaning. Without an understanding of how the data are created by social processes, the data cannot be interpreted as information in a meaningful way.
A formal conceptualization of an SDS needs to consider all parts of the social processes. This includes the creation by the contributors, the data and their meaning themselves, and the use of the data by consumers. Such contribution and potentially also the use of the data is often coordinated and structured by an organizer. The factors involved in the process are depicted in Figure 1 and explained in the following:
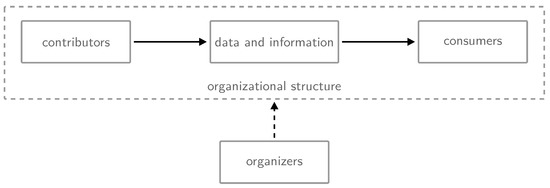
Figure 1.
Conceptualization of Shared Data Sources (SDSs) by contributors, data and information, consumers, the organizational structure, and organizers. A contributor might also be a consumer or an organizer. Flow of data is depicted by solid arrows while the influence of the organizers on the entire process is depicted by a dashed arrow.
Contributors. In the case of an SDS, there are a number of people contributing. These people often organize themselves to some degree, resulting in a community structure. The contribution process itself can be of different nature, e.g., of differing difficulty.
Data and information. The collected data are often of social relevance. In case of GSDSs, they describe either a part of the world or the entire surface of the Earth. The data also describe differing temporal extents, and they might be available only for a limited time.
Consumers of the data. The number of people or organizations using the data varies among projects. Also, the data can have a very limited scope of usage, or it can serve for many purposes.
Organizational structure of the project. An SDS can expose various degrees of coordination. For instance, NGOs or governmental organizations might organize such a project more strictly, while a community-based project is often more open to differing types of contribution. Projects also differ in the number of levels of the hierarchy, which is often a result of the evolution of the project.
Organizers of the project. Shared Data Sources are organized by very different kinds of groups and organizations. For instance, OpenStreetMap is organized by its community and the OpenStreetMap foundation, and Twitter is organized by the company Twitter Inc. While the contributors can easily become part of the organizer in case of OpenStreetMap, this is much harder to achieve in case of Twitter—you would have to apply for a position at Twitter Inc. Also, organizers have very differing intentions. Some intend to make money while others act more altruistically.
Many aspects related to these factors have been discussed in literature. As an example, Elwood et al. [4] have discussed who contributes to GSDSs and which motivations lie behind, as well as what legitimates the contributions. Further, it has been discussed how contributors collaborate [4,39]. It has been explored how taxonomies become folksonomies as a result of collaboration [1,40]. Trust has been discussed as a source for collaborative behaviour [41], and trust has been examined as a result of social interaction [42,43]. Further, Harvey [11] has examined how volunteered contributions to GSDSs are.
In subsequent sections, we discuss dimensions related to these factors. There exist numerous aspects that can be used to characterize SDSs. Due to the multiplicity, a choice needs to be made for which dimensions to include. We have selected dimensions that greatly allow for discriminating between several SDSs while also aiming to cover all major factors that render an SDS. Further factors exist and could easily be added, e.g., about the contributors’ motivations or the ways users are able to access the data. The methodological means described in Section 5 are exemplified by referring to this choice of dimensions but introducing additional dimensions would not alter the general way of how the methodological means work. The description of each dimension consists of a name, questions or a short summary for defining the dimension, and one or two practical examples illustrating the dimension.
4.2. Dimensions Related to the Contributor
Type of contributor. Who contributes? Can everyone contribute or is only a person with a strong knowledge in technology able to contribute?—Everyone can contribute to Twitter, while only ‘techies’ are able to contribute to platforms that collect sensor data like, such as OpenSenseMap.
Intention of the contributor. Why do people contribute? Do they contribute to share or support, or do they contribute for some other less altruistic reason?—People contribute to OpenStreetMap mostly because they want to share knowledge and use open geo data, while people use Facebook for more personal benefit without having user analytics in mind.
Awareness of the organizers’ intention. Are the contributors aware of the intention of the organizers?—People contributing to OpenStreetMap or the HOT community are aware of what the data is used for, while most users are unaware of their mobile phones collecting and sharing telemetry data, and of the corresponding intention of the company behind the data source.
Awareness of the contribution. Are the contributors aware of their contribution? In particular, are the contributors aware of how the data will be used?—Despite the fact that people writing Twitter messages are aware of writing a message, they have only little awareness of contributing to a dataset that can be accessed at a larger scale.
Effort of contributing. Is it easy to contribute? Do formal or technical issues make it hard or cumbersome to contribute?—Sharing information via social media is easy, while sharing data using Wikidata is more complex.
Type of the contributions. Is the information about general and long-lasting facts, or is it about short-time and individual events only?—Contributions in OpenStreetMap describe the general environment, while contributions in OpenSenseMap refer to discrete points in time at which an observation is made—temperature, e.g., changes more quickly than the location of a street.
4.3. Dimensions Related to the Data and Information within the Project
Factuality of the contribution. Are the contributions about factual information that everyone can agree on, or are they based on personal perception?—Wikipedia aims to collect only factual knowledge, while opinions, personal reflections, and feelings are often shared on social media.
Temporal extent of the project. How long will the project by intention exist?—OpenStreetMap aims to exist for an unlimited time, while the HOT platform consists of subprojects of both limited and unlimited temporal extent.
Temporal extent of the data usage. How long will the data of the project be available?—In contrast to the existence of a project, the data collected in a project is sometimes only accessible for a shorter period, e.g., in case of civic issue tracking platforms.
Spatial extent. What is the spatial extent of the project? Is the project only of local nature, does it concern a country or continent, or is it a worldwide project?—Information in social media is potentially of global nature, while civic issue tracking platforms often focus on a single city.
4.4. Dimensions Related to the Consumer of the Data
Targeted beneficiary. Who shall mainly benefit from the SDS, according to the intention of the organizer? Do, by intention, the organizers themselves benefit, or a specific group of people, or even everyone?—OpenStreetMap aims to provide information to everyone, while open civic issue tracking platforms are targeting local citizens as beneficiaries.
Verifiability (of the content) of the contribution. Can the contributed information be verified independently in an objective way?—Wikipedia data needs to be both verifiable and referenced, while the data of the OpenSenseMap can hardly be verified as it is impossible to remeasure environmental data of the past.
Consumer of the data. Who is able to access large parts of the data and actually also uses them? Is it some organization or NGO only? Do the contributors themselves consume the data? Or can potentially everyone consume the data?—Data of civic issue tracking platforms are mostly consumed by the local government, while Wikipedia data can be consumed by everyone.
4.5. Dimensions Related to the Organizational Structure
Level of organization. Is the community (including the organizers) organized by a strong and distinctive hierarchy?—The hierarchical structures in OpenStreetMap are much less distinctive than in Wikipedia. In the former, there exist basically only the roles of non-authenticated readers, contributors, moderators, and administrators with root access to the servers, whereas the roles of extended contributors, administrators, bureacrats, changes reviewers, rollbackers, account creators, and so forth additionally exist in the latter.
Organizational engagement. How strong does the organizer lead and engage with the contribution process?—In OpenStreetMap the organizer informally recommends which semantics to use for a contribution, while in Facebook the organizer mainly concentrates on attracting new users.
4.6. Dimensions Related to the Organizer
Type of organizer. Which formal state does the project and its organizer have? Is the project organized by, e.g., a company or by a community?—Facebook is organized by a company while Wikipedia is organized by a foundation and a subgroup of the contributors.
Effort of joining the organizer. How open is the organizer to new people being involved in the organizational process? Does the team of organizers welcome new people who would like to organize, or is it even near to impossible to join the team?—People can without large effort join the organizing team of OpenStreetMap because the organization work is, by and large, executed by open mailing lists and the OpenStreetMap Wiki, while it is much harder to join a company organizing commercial social media services.
Size of organizer. How many people are part of the organizing team? Is the project organized by one person only or is it organized by a larger group of people?—Projects like Wikipedia and OpenStreetMap are organized by a large number of people, while civic issue tracking platforms are often organized by only some few people.
Specificness of the organizer’s intention. What is the motivation of the organizer to establish and run the project? Is it a very specific one like using the data for a certain well-defined purpose, such as making money, or is it rather a general one of providing useful data?—OpenStreetMap aims at providing geo data for multiple purposes, while civic issue tracking platforms focus on very specific purposes.
Commercial orientation of the organizer. Is the motivation of the organizer a commercial or a non-commercial one?—Wikipedia and OpenStreetMap are not organized with a commercial intention, while many social media platforms like Twitter and Facebook have a commercial background.
5. Exploration and Visualization of Shared Data Sources
The presented framework aims to facilitate a fine-grained comparison and analysis of SDSs, allowing to explore them in different visual and analytical manners. In particular, methods like parallel coordinates, spider diagrams, correlation matrices, and clustering techniques can be utilized to get a better sense of where and how SDSs resemble and differentiate. In this section, we first discuss how to practically describe SDSs by the introduced dimensions (Section 5.1). Then, we discuss several ways of exploring SDSs in their entirety, both by setting them mutually into context as well as by setting them into the context of the three prototypes VGI, PGI, and AGI (Section 5.2, Section 5.3 and Section 5.4). Finally, we discuss ways of how to analyse the dimensions, which are used to set the SDSs into context (Section 5.5 and Section 5.6). It should become clear from the description of the framework that additional dimensions and SDSs can be taken into consideration. It is the aim of this section to discuss and illustrate how to apply the framework rather than to explore the SDSs by the chosen dimensions. The findings and results of applying the framework are discussed in Section 6.
5.1. Collection and Preparation of the Data
The authors of this article have collected a list of GSDSs. Despite not being complete—there exist too many GSDSs, and new ones appear and disappear on a regular basis—the list contains SDSs with various characteristics. To our best knowledge, no type of SDSs has been left out. Also, the list is limited by our perspectives on GSDSs. The GSDSs have been grouped into several thematic categories, which are widely used and accepted: augmented reality/games, citizen science, civic issue tracking, crowd-sourced sensor data, mobility trajectories, OSM-related SDSs, social media, and the Wikipedia ecosystem. It should be noted that this categorization is by no means the only one but these categories seem to be widely used.
Each of the SDSs has been characterized according to the dimensions that have been discussed in Section 4. As a result, each SDS is described by a textual description for each dimension. In case of some SDSs, it is hard to unambiguously assign a single value to a certain dimension because the data source itself is too heterogeneous. In these cases, the value that characterizes the data source best has been chosen. The textual description has been converted to a numerical value. As a result of the characterization, for each data source s, there exists a value for dimension i, which is between 0 and a maximum .
As a result of the characterization of an SDS by linguistic prototypes, each dimension is described by a discrete value. While numbers are usually regarded as being ‘crisp’, textual representations are mostly regarded as exposing some fuzziness. By translating from a textual description to a numerical one, this fuzziness is hidden to some degree. When interpreting the data, one should, however, be aware of this fuzziness. In some cases, elements of the visualization are hidden by other elements, which is the result of the discrete scale. The values characterizing an SDS have thus, for some visualizations, been slightly randomized in order to avoid such situations in which visual elements remain hidden.
In addition to the SDSs, also prototypes have been described by referring to these dimensions. Such prototypes are typical for a cluster of SDSs of similar characteristics. A prototype does, however, not reflect an existing SDS but rather exposes characteristics similar to most of the SDSs of the cluster. In subsequent sections, SDSs are both visually and statistically compared to these prototypes.
5.2. Setting Shared Data Sources Into Context by a Trilinear Graph
Two-dimensional space can represent at most two aspects independently. It is thus impossible to naturally embed all dimensions of SDSs into two or even three-dimensional space. Instead, one might set the SDSs into the context of prototypes, which reduces the number of required dimensions of the space used for the visualization. An SDS is accordingly not explicitly characterized by its dimensions rather than by its similarity (or dissimilarity) to each prototype. To further reduce the number of involved dimensions, we will visualize the data in projective space, which means that only the proportions but no absolute values are kept.
Each data source is compared to each prototype. For this purpose, each dimension of the data source is subtracted from the corresponding dimensions of the prototype:
These comparisons can be used to characterize each data source relative to the prototypes. In the visualization, each prototype shall be represented at a corner of a triangle, i.e., at location , , and respectively. Each data source is positioned relative to these coordinates. The i-th coordinate is thereby given as
As a result, a pair of two-dimensional coordinates is assigned to each of the data sources.
Even if vanishes for every prototype p, the prototypes themselves are not assigned to the corners of the triangle. A prototype shares certain characteristics with other prototypes, which is why for two prototypes p and q, the difference is not maximal in general. Thus, to each prototype, coordinates in the inner of the triangle are assigned (Figure 2a). In Figure 2b, a linear transformation has been applied to the coordinates such that the prototypes get reprojected to the corners of the triangle. The SDSs are mostly located within the triangle but can, due to the reprojection, also be located outside of the triangle. As the locations of the respective prototypes in the visualization form an equilateral triangle, the visualization is a trilinear graph [44], which we call the ‘Triangle of Shared Data Sources’ in short.
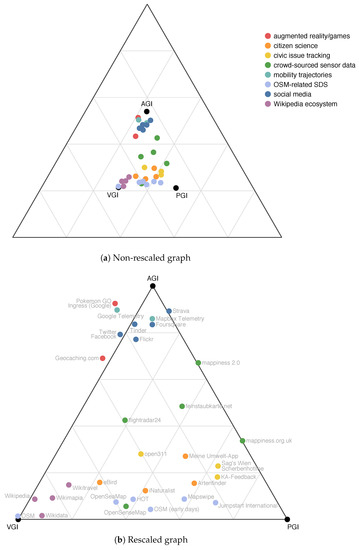
Figure 2.
Trilinear graph of Geographical Shared Data Sources (GSDSs), the ‘Triangle of Shared Data Sources’. The graph (b) depicts a rescaled version of (a), in which the prototypes are represented at the corners of the triangle.
Trilinear graphs allow for a visual clustering of SDSs. Similarities can easily be recognized and the evolution of a dataset can be visualized as a trace in the graph. However, different characteristics of an SDS can lead to similar locations in the graph. In particular, it cannot be distinguished between two SDSs that are very similar or dissimilar to all prototypes. In both cases, the SDS would be depicted in the centre of the graph.
5.3. Examination of Individual Shared Data Sources by Parallel Coordinates
Parallel coordinates are a technique to represent a larger number of dimensions in two-dimensional space [45]. Thereby, the dimensions are not naturally embedded but rather independently displayed (Figure 3), which allows for a comparison of more dimensions than the embedding space has. The dimensions are represented by parallely aligned axes. Each data source corresponds, accordingly, to several locations—one on each axis. These locations are joined by a polygonal line to allow for a visually clustering of SDSs with similar characteristics. Parallel coordinates provide thus a good opportunity to identify similarities between SDSs in respect to a smaller subset of all dimensions—dimensions that are depicted on neighbouring axes. When being displayed on an interactive display, the possibility to reorder the axes can even aid when comparing two non-neighbouring axes. It is widely known that parallel coordinates are not very useful when being displayed in a static way, as is the case in Figure 3. When being displayed in an interactive way on a website, however, parallel coordinates are a very useful technique.
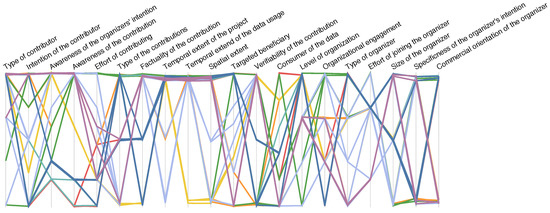
Figure 3.
Parallel coordinates graph of Geographical Shared Data Sources (GSDSs). The legend for the categories can be found in Figure 2. The data has been slightly randomized.
5.4. Visual Clustering of Shared Data Sources by Spider Charts
Spider charts are a variant of parallel coordinates [44]. Instead of aligning the axes in parallel, the axes are circularly arranged (with uniform angle) and share a common starting point at the centre (Figure 4 and Figure 5). Such a layout makes each value less readable because the axes are oriented differently. When the points on the axes are, however, connected by a polygonal line, the overall characterization of the SDS can easily be recognized by the shape of that line. As a result, the spider chart allows for a visual clustering of SDSs.
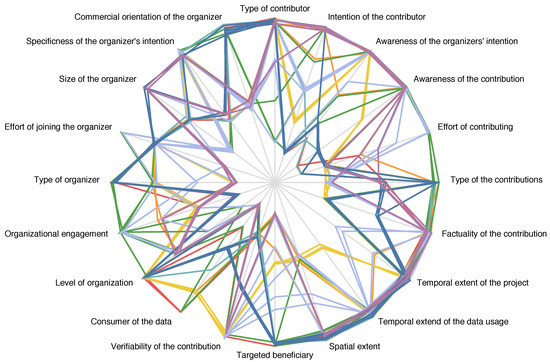
Figure 4.
Spider chart of Geographical Shared Data Sources (GSDSs), showing the different dimensions in detail. The data has been slightly randomized. The legend for the categories can be found in Figure 2.
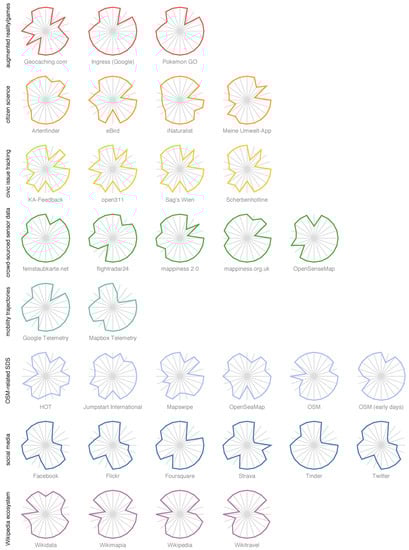
Figure 5.
Individual spider charts of Geographical Shared Data Sources (GSDSs). The individual depiction of each GSDS allows for a grouping by categories.
5.5. Correlation Analysis for Examining the Dimensions
The dimensions described in Section 4 are correlated to some degree. For instance, an organizer with clear financial interests might, at least statistically, not have strong interest in involving contributors in the organizational process because this could mean to share the revenue. An organizer without financial interests is in many cases, however, interested in involving contributors because the workload can be shared. Correlations between several dimensions can lead to a bias when characterizing SDSs. At the same time, correlations can also indicate similarities between a number of SDSs because they share similar characteristics. A correlation analysis of the dimensions (in respect to the considered SDSs) can, accordingly, provide insights about the interpretation and explanatory power of other methods that refer to these dimensions.
The correlation of several dimensions can be examined statistically. As there is no reason why the dimensions should be strictly linearly related, the dimensions need to be examined for various kinds of correlation. The Pearson correlation coefficient is widely used but would be able to measure linear correlation only. This is why we employ Kendall’s rank correlation coefficient6. This coefficient has the advantage of being able to detect non-linear relations. In contrast to Spearman’s rank correlation coefficient, Kendall’s rank correlation coefficient is regarded as being more robust [46]. To account for the different value ranges of the dimensions, which could lead to significant bias in the results, the data was rescaled to a common value range (the unit interval) prior to analysis. The resulting correlation is visualized as a heat map in Figure 6.
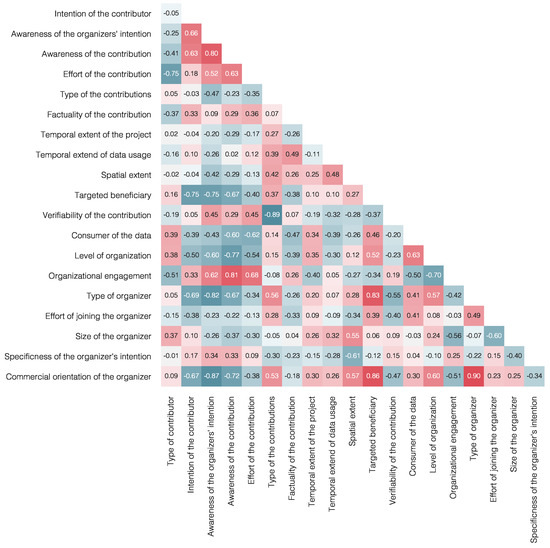
Figure 6.
Correlation matrix of the dimensions for Geographical Shared Data Sources (SDSs), based on Kendall’s rank correlation coefficient.
A correlation of two or more dimensions can have origin in many different scenarios. For instance, dimensions can be causally related. High values in one dimension may, e.g., cause high values in another dimension. However, dimensions can also be correlated without any causal relationship, i.e., the correlation can be spurious. With respect to the various ways of correlation, it makes sense to examine in more detail why a correlation has been detected. In Figure 7, two pairs of dimensions are displayed in detail. As before, the data is slightly randomized in order to make possible displaying identical values. Despite both pairs of dimensions exposing a similarly strong correlation, more detailed information can be concluded from this type of visualization.
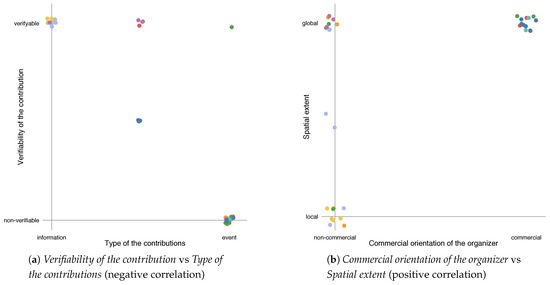
Figure 7.
Scatter plots for selected pairs of dimensions for Geographical Shared Data Sources (GSDSs). The legend for the categories can be found in Figure 2. The data has been normalized and slightly randomized.
5.6. Hierarchical Clustering of Shared Data Sources
The clustering of SDSs into categories can be achieved in various ways: by experience and common sense; by a visual exploration of their characteristics as is, e.g., discussed in Section 5.4; or based on a statistical analysis. The latter way has the advantage of not relying on human judgement and thus of potentially creating more fine grained categorizations while avoiding human bias. In Figure 8, Figure 9 and Figure 10, a hierarchical clustering of GSDSs is shown. For generating these figures, the GSDSs have been (hierarchically) clustered based on how similar they are. For the hierarchical clustering, the distances between the clusters were calculated using the Unweighted Pair Group Method with Arithmetic Mean (UPGMA) algorithm [47] in combination with the average Manhattan metric for determining the distance between two clusters. The UPGMA algorithm is widely employed because it is robust towards outliers. The similarity of the SDSs has been measured by their characteristics expressed in terms of the previously introduced dimensions (Figure 8) as well as by their similarity to the three prototypes AGI, PGI, and VGI (Figure 9). Such clustering can also be performed for a subgroup of dimensions, e.g., the ones related to the organizer (Figure 10).
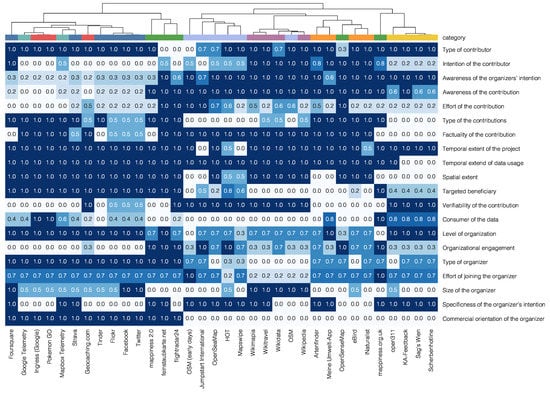
Figure 8.
Hierarchical clustering of Geographical Shared Data Sources (GSDSs) by characterization through the dimensions. The legend for the categories can be found in Figure 2. The data has been normalized.
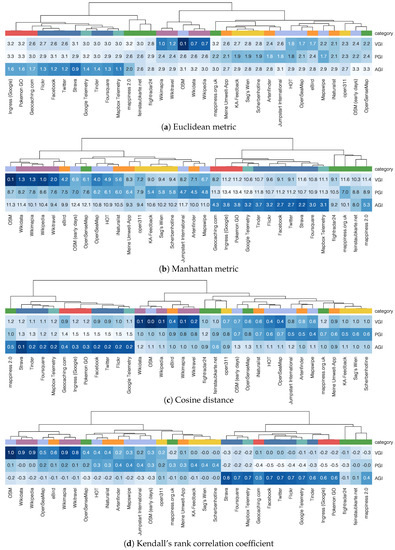
Figure 9.
Hierarchical clustering of Geographical Shared Data Sources (GSDSs) by similarity to prototypes, using four different distance measures. For Kendall’s rank correlation coefficient, high values indicate high similarity, for the other three measures, low similarity. The colour scale was set individually for each plot using the respective minimum and maximum value. The legend for the categories can be found in Figure 2.
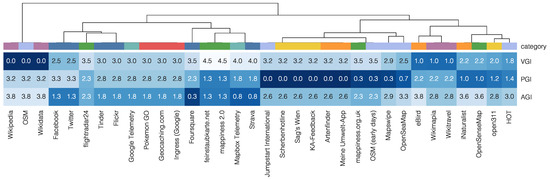
Figure 10.
Hierarchical clustering of Geographical Shared Data Sources (GSDSs) by similarity to prototypes, only considering dimensions related to the organizer, using the cosine similarity. The legend for the categories can be found in Figure 2.
The similarity between an SDS and a prototype can be measured in different ways. Among the similarity metrics commonly used to measure such similarity in terms of the dimensions are the Euclidean metric, the Manhattan metric, cosine similarity, and Kendall’s rank correlation coefficient. The Euclidean metric, defined as , computes the shortest distance between the vectors as we know it from the space we live in. This metric only makes sense if the space exposes some concept of neighbourhood because the dimensions are set into their mutual context. This is the case when regarding the space spanned by the previously introduced dimensions as a conceptual space [38]. Accordingly, the differences in the dimensions do not just add up but are examined in combination. This is in contrast to the Manhattan metric, which is defined as . The Manhattan metric considers the difference in each dimension separately and is thus meaningful also for ‘abstract’ spaces that do not expose the concept of neighbourhoods other than separately for each dimension. The cosine similarity is different to these two metrics by only considering the angle spanned by the two vectors, not their magnitude. Instead of comparing each dimension independently, as is the case with the Manhattan metric, the cosine similarity puts emphasis to the combination of the dimensions. It is defined by and requires the dimensions to be rescaled such that the distribution of the respective values is centred around 0. As a result, the cosine similarity only considers how the difference in one dimension relates to the difference in another one, making it particularly useful when the dimensions shall be compared relatively rather than absolutely. Finally, Kendall’s rank correlation coefficient derives from the intuition of measuring whether the rank of each dimension is about the same for two vectors (Figure 9).
The results of the clustering are visualized by a dendrogram, which is attached to a heat map that represents the results of the similarity metrics. The dendrogram groups SDSs, which are very similar. Such groups and further SDSs can, in turn, be grouped again. The resulting groups are depicted by horizontal lines, whose vertical position refers to the similarity of the grouped SDSs. While the dendrogram provides an overview of the hierarchical clustering, the heat map can be used to retrace why the algorithm has clustered in the way it did. The results of the statistical analysis and the visualizations as well as the gained insights about the methods and the SDSs, both gained from this and from previous methods, are discussed in the next section.
6. Results
In the previous section, we discussed methods to visualize and statistically analyse a set of SDSs. Here, we report about the findings, i.e., what the visualizations and analyses can provide to the general understanding of SDSs, and of GSDSs in particular. In a first step, we discuss how the dimensions are related in case of GSDSs (Section 6.1). In a second step, the clustering of SDSs by their similarity to the prototypes is compared to the previously discussed categories (Section 6.2). Throughout the section, we maintain both a methodological focus as well as a focus on the entirety of GSDSs instead of individual ones. These results are both of independent interest as well as allow for an evaluation of the discussed framework.
6.1. Correlations Between the Dimensions
We have examined how the dimensions relate in case of the examined GSDSs. The correlation matrix of all dimensions mainly shows correlation coefficients of low to medium strength with only some pairs exhibiting a strong correlation (Figure 6). The Commercial orientation of the organizer is, e.g., negatively correlated both with the Intention of the contributor and the Awareness of the organizers’ intention—when someone contributes to an SDS with a commercial orientation, e.g., to typical AGI data sources like Twitter, the contributor often contributes without the intention of sharing the data for broader and more detailed analysis. Also, such contributors are often not aware of the intention of the organizer. This is in contrast to SDSs with a non-commercial orientation, to which volunteers often contribute knowingly, being aware for which purpose the data is collected. While providing a good overview over all correlations, the correlation matrix does not provide information about how exactly the dimensions relate for different SDSs.
A more detailed comparison of the dimensions for individual GSDSs can be achieved by a scatter plot. In Figure 7, we display two strongly correlated pairs of dimensions. The Type of the contributions is negatively correlated to the Verifiability of the contribution (Figure 7a). General information is verifiable in case of the considered SDSs, information about events is less so. As events happen at some point in time and are, at least in parts, intangible thereafter, information about an event is hard to verify. The Commercial orientation of the organizer and the Spatial extent of an SDS are positively correlated (Figure 7b). Shared Data Sources with a commercial orientation are, in case of the examined GSDS, of global nature. A possible explanation might be that commercial companies aim to expand their projects to a global extent for maximizing their benefit. In contrast, SDSs with a non-profit orientation are, in parts, of local nature. Despite the fact that both pairs of dimensions depicted in Figure 7 expose a correlation—this fact can be seen in Figure 6—the scatter plots provide a better understanding of how they are related.
Similar specificities of the dimensions can be uncovered by using parallel coordinates. As can be seen in Figure 3, the values representing the characteristics of the GSDSs are not equally distributed for many dimensions. This applies, e.g., to the Temporal extent of the project and the Temporal extent of the data usage—most GSDSs are temporally unbounded and so is the use of the data collected in the project. The Awareness of the contribution is ‘polarizing’—there are only very few GSDSs for which the contributor is only to some degree aware of his or her contribution. Also, the positive and negative correlations that can be found in the correlation matrix are apparent in the parallel coordinates plot. However, in contrast to the correlation matrix, a dimension (represented by an axis) can only be compared to the ‘neighbouring’ ones in the plot, which is why the axes need to be reordered. Such a reordering is possible when the plot is interactively displayed.
While we have so far considered correlations between the dimensions for all categories of GSDSs, additional significant correlations can occur within a single category. As an example, it becomes visible in Figure 5 that social media data sources expose very similar characteristics judged by the dimensions. This even applies to other categories. In addition, correlations among the dimensions can be found beyond the thematic categories, e.g., between crowd-sourced sensor data and mobility trajectories. The previously discussed figures could be restricted to SDSs from only one category as well. When examining SDSs by category, one gains not only information about the correlations within a category but also about how meaningful the categories are. In the next section, the prototypes and the categories are evaluated.
6.2. Clustering by Prototypes and Clustering into Categories
We have selected three prototypes—VGI, PGI, and AGI—which can be used for setting the GSDSs into context. In addition, we have grouped the GSDSs into thematic categories, which are broadly used and widely accepted. The techniques presented in Section 5 can aid in evaluating both the prototypes and the categories with respect to how well they can be explained in terms of the dimensions. In addition, it can be concluded how compatible the prototypes and the categories are—do the categories make sense in the context provided by the prototypes? And finally, one can use the discussed techniques for clustering SDSs into meaningful categories of differing granularity. In this section, we discuss the corresponding results.
The spider charts in Figure 5 show that each thematic category contains GSDSs of similar characteristics, as has been discussed earlier. This demonstrates that the categories make sense in terms of the dimensions. In addition, differences between GSDSs within a category can easily be recognized and potential subcategories can be identified, e.g., in case of crowd-sourced sensor data. The spider charts can even be used to assign a new GSDS to one of these categories, because the differences between the categories are apparent for the most part. Also GSDSs are grouped thematically into categories in the trilinear graph, despite the fact that the dimensions are projected to two-dimensional space and much information is thus lost (Figure 2). As becomes apparent by the horizontal structure, the GSDSs of a thematic category can easily be recognized as being similar or dissimilar to the AGI prototype, while it is harder to distinguish between the VGI and the PGI prototype. While spider charts offer a more fine-grained representation in respect to the dimensions, the trilinear graph allows for easily tracing how an SDS develops over time. For instance, the graph reflects that OSM has changed from an SDS that shared about equal similarity to the VGI and PGI prototype (while exposing little similarity to the AGI prototype) to an SDS that is very similar to the VGI prototype—OSM was, in the first months, organized by a very restricted number of people, who focussed on their own interests, but changed then its organizational structure to become a major community-based project.
The statistical approach of hierarchical clustering allows for both a fine-grained as well as an automatized thematic grouping of the SDSs. In particular, the clustering based on the dimensions is, by and large, in accordance with the thematic categories (Figure 8). Only some SDSs fall into different groups such as OSM and OpenSenseMap. The categories mobility trajectories, social media, and augmented reality/games cannot be separated but form a distinct group. Within this group, the clustering and the thematic categories do not coincide. Figure 8 also demonstrates, like the other figures before, that the thematic categories make sense and are, to a high degree, compatible with the characterization by the dimensions.
Figure 9 and corresponding considerations can reveal whether the similarity to the prototypes can be used for grouping the GSDSs in a meaningful way. We discussed before that the similarity between an SDS and a prototype can be measured in different ways, each of them having its own advantages and shortcomings. The four distance measures used in Figure 9 lead though to similar results for the considered GSDSs. Indeed, the distances between the SDSs and the prototypes are, by and large, independent of the used distance measure when considering the fact that they need to be rescaled before being compared. There exist, however, minor differences. The cosine distance and the Manhattan metric, e.g., indicate more clearly that Artenfinder, Mapswipe, and similar SDSs are similar to the PGI prototype. In contrast, Kendall’s rank correlation coefficient shows generally less similarity to the PGI prototype than other distance measures. As a result of these differences between the distance measures, the clustering depicted by the dendrogram differs slightly too. This similarity becomes more visible when the SDSs are horizontally reordered while maintaining the clusters. The Manhattan metric seems to produce best results in respect to how the categories are grouped together.
The statistical clustering demonstrates that the prototypes and the categories are reasonable in terms of their relation to the characteristics of the SDSs. In case of all four distance measures, four major clusters can be identified (Figure 9): one cluster of AGI-related and one cluster of VGI-related SDSs, as well as two further clusters. The two latter ones are less distinctive but expose most similarity to the PGI prototype, besides some similarity to the VGI prototype. In particular, the SDSs related to civic-issue tracking and crowed-sourced sensor data show a tendency towards the PGI prototype, which is mainly due to the dimensions describing the organizer, as can be seen in Figure 10. The categories of the SDSs can be reconstructed only by the similarity of the SDSs to the prototypes without making use of the categorization itself. The SDSs classified as crowed-sourced sensor data are grouped in case of some distance measures while being spread over several clusters in case of other ones. Also, the category of OSM-related SDSs spread over several clusters. This finding seems to be reasonable—OSM-related SDSs are, in fact, of very different nature—but demonstrates the limitations of the compatibility between the prototypes and the categories.
7. Conclusions
This article aims to provide a lens on new and collaborative forms of geographical data sources. We have introduced and coined the notions of ‘Shared Data Sources’ (SDS), ‘Geographical Shared Data Sources’ (GSDS), and ‘Participatory Geographic Information’ (PGI). Thereby, we have discussed the need for a conceptual framework for describing SDSs, which derives from incorporating dimensions to characterize different types of SDSs. A number of dimensions for conceptualizing SDSs have been introduced, among them dimensions related to the contributors, the data and information, consumers, the organizational structure, and the organizers. Finally, we have introduced tools and instruments to examine SDSs in their entirety, leading to different lenses through which we can learn about and make sense of such data sources.
The provided tools—visualizations and statistical analysis—allow for an examination of a set of SDSs in its entirety but an examination of differences and similarities within VGI, PGI, AGI, and similar prototypes would be of interest for future research. Categories of SDSs similar to AGI can easily be distinguished from those dissimilar to AGI. It seems, though, to be much harder to distinguish between VGI and PGI-related SDSs in the same way. Future research might focus on how SDSs can be distinguished better in terms of these prototypes and what hinders us from doing so at the moment. In particular, it may be discussed why the categories, prototypes, and characteristics discussed in this article are compatible and which limitations exist for this compatibility.
A number of dimensions have been introduced to characterize SDSs. Given some desired characteristics, can these dimensions be used to construct new forms of SDSs? For instance, can we derive from the desired characteristics of which nature the social process creating, maintaining, and using the data should be? If not, which characteristics contradict and hinder us from such a construction? The reasons behind these contradictions may even provide clues about further correlations and characteristics of SDSs. Also, one may ask which parts of the conceptual space remain yet ‘unused’ and would thus give rise to new types of SDSs.
When analysing SDSs and making sense of them in their entirety, data about the SDSs are needed, in particular, data about the contributions and the resulting data, about the consumers of the data, and about the roles of the organizers. The data used in this article have been collected by ourselves, which poses limitations to their interpretation and creates biases. Future research might explore how these limitations and biases can be characterized and how they can be avoided. In particular, the views of organizers, contributors, and users could be incorporated, which would create different biases. Also, it would be interesting to examine how such biases influence the resulting analysis. Such research would ideally build upon the methodology of the social sciences, requiring very different perspectives than the one used in this article.
Some SDSs are too heterogeneous to be described in a meaningful way, or too broad to be properly demarcated from one another. Among these examples is the Internet, which is very diverse and heterogeneous in its nature. Another example are Linked Open Data, which form, by definition, a web of statements. These statements are created by various people and organizations, and they share common vocabularies. These common vocabularies and semantics make possible to mutually relate the statements, leading (more or less) to only one big and heterogeneous data source. Future research might explore how such heterogeneous and broad SDSs can be conceptualized and incorporated into the analysis.
The discussed characterizations allow for making sense of SDSs. Further research might discuss structural differences between GSDSs in the geographical domain and SDSs in general. Also, the characterization by the ‘Triangle of Shared Data Sources’ allows for an examination of the temporal development of an individual SDS. Having examined several such trajectories, one might conclude how types and prototypes like VGI, PGI, and AGI evolve over time and, in addition, how our categorization into categories such as augmented reality/games, citizen science, civic issue tracking, crowd-sourced sensor data, and social media reacts to this temporal evolution. Finally, such understanding might render possible to trace or even predict the future development of SDSs, or a prototype like VGI or AGI.
Author Contributions
Conceptualization, Franz-Benjamin Mocnik; methodology, Franz-Benjamin Mocnik and Christina Ludwig; software, Franz-Benjamin Mocnik and Christina Ludwig; validation, Franz-Benjamin Mocnik, Christina Ludwig, A. Yair Grinberger, Clemens Jacobs, Carolin Klonner, and Martin Raifer; formal analysis, Franz-Benjamin Mocnik and Christina Ludwig; investigation, Franz-Benjamin Mocnik and Christina Ludwig; resources, Martin Raifer; data curation, Clemens Jacobs, Carolin Klonner, and A. Yair Grinberger; writing—original draft preparation, Franz-Benjamin Mocnik and Christina Ludwig; writing—review and editing, Franz-Benjamin Mocnik and Christina Ludwig; visualization, Franz-Benjamin Mocnik and Christina Ludwig; supervision, Franz-Benjamin Mocnik; project administration, Franz-Benjamin Mocnik.
Funding
Franz-Benjamin Mocnik has been funded by Deutsche Forschungsgemeinschaft as part of the project A framework for measuring the fitness for purpose of OpenStreetMap data based on intrinsic quality indicators (FA 1189/3-1); Christina Ludwig and Martin Raifer, by the Klaus Tschira Stiftung; Carolin Klonner, by the Heidelberg Academy of Sciences and Humanities; and A. Yair Grinberger, by the Alexander von Humboldt Foundation. The publication has financially been supported by Deutsche Forschungsgemeinschaft within the funding programme Open Access Publishing, by the Baden-Württemberg Ministry of Science, Research and the Arts, and by Heidelberg University.
Acknowledgments
The authors express their gratitude for the valuable comments received by Alexander Zipf.
Conflicts of Interest
The authors declare no conflict of interest. The funders had no role in the design of the study; in the collection, analyses, or interpretation of data; in the writing of the manuscript, or in the decision to publish the results.
Abbreviations
The following abbreviations are used in this manuscript:
| SDS | Shared Data Source |
| GSDS | Geographical Shared Data Source |
| VGI | Volunteered Geographic Information |
| AGI | Ambient Geographic Information |
| PGI | Participatory Geographic Information |
References
- Mocnik, F.-B.; Zipf, A.; Raifer, M. The OpenStreetMap folksonomy and its evolution. Geo-Spatial Inf. Sci. 2017, 20, 219–230. [Google Scholar] [CrossRef]
- Organisation for Economic Co-Operation and Development. Participative Web: User-Created Content. 2007. Available online: https://www.oecd.org/sti/38393115.pdf (accessed on 24 May 2019).
- See, L.; Mooney, P.; Foody, G.M.; Bastin, L.; Comber, A.; Estima, J.; Fritz, S.; Kerle, N.; Jiang, B.; Laakso, M.; et al. Crowdsourcing, citizen science or volunteered geographic information? The current state of crowdsourced geographic information. ISPRS Int. J. Geo-Inf. 2016, 5, 55. [Google Scholar] [CrossRef]
- Elwood, S.; Goodchild, M.F.; Sui, D.Z. Researching volunteered geographic information: Spatial data, geographic research, and new social practice. Ann. Assoc. Am. Geogr. 2012, 102, 571–590. [Google Scholar] [CrossRef]
- Mocnik, F.-B. The polynomial volume law of complex networks in the context of local and global optimization. Sci. Rep. 2018, 8. [Google Scholar] [CrossRef] [PubMed]
- Mocnik, F.-B.; Frank, A.U. Modelling spatial structures. In Proceedings of the 12th Conference on Spatial Information Theory (COSIT), Santa Fe, NM, USA, 12–16 October 2015; pp. 44–64. [Google Scholar] [CrossRef]
- Mocnik, F.-B. A Scale-Invariant Spatial Graph Model. Ph.D. Thesis, Vienna University of Technology, Vienna, Austria, 2015. [Google Scholar]
- Goodchild, M.F. Citizens as sensors: The world of volunteered geography. GeoJournal 2007, 69, 211–221. [Google Scholar] [CrossRef]
- Stefanidis, A.; Crooks, A.; Radzikowski, J. Harvesting ambient geospatial information from social media feeds. GeoJournal 2013, 78, 319–338. [Google Scholar] [CrossRef]
- Beard, K.; Egenhofer, M.J.; Lopez, X.; Onsrud, H.; Schroeder, P. Public participation GIS, Workshop. Available online: http://www.commoncoordinates.com/ppgis/ppgishom.html (accessed on 10 October 2018).
- Harvey, F. To volunteer or to contribute locational information? Towards truth in labeling for crowdsourced geographic information. In Crowdsourcing Geographic Knowledge: Volunteered Geographic Information (VGI) in Theory and Practice; Sui, D.Z., Elwood, S., Goodchild, M.F., Eds.; Springer: Dordrecht, The Netherlands, 2013; pp. 31–42. [Google Scholar]
- Saxton, G.D.; Oh, O.; Kishore, R. Rules of crowdsourcing: Models, issues, and systems of control. Inf. Syst. Manag. 2013, 30, 2–20. [Google Scholar] [CrossRef]
- Spyratos, S.; Lutz, M.; Pantisano, F. Characteristics of citizen-contributed geographic information. In Proceedings of the 17th AGILE Conference on Geographic Information Science, Castellón, Spain, 3–6 June 2014. [Google Scholar]
- Comber, A.; Schade, S.; See, L.; Mooney, P.; Foody, G.M. Semantic analysis of citizen sensing, crowdsourcing and VGI. In Proceedings of the 17th AGILE Conference on Geographic Information Science, Castellón, Spain, 3–6 June 2014. [Google Scholar]
- Bishr, M.; Kuhn, W. Geospatial information bottom-up: A matter of trust and semantics. In Proceedings of the 10th AGILE Conference on Geographic Information Science, Aalborg, Denmark, 8–11 May 2007. [Google Scholar] [CrossRef]
- Heipke, C. Crowdsourcing geospatial data. ISPRS J. Photogramm. Remote Sens. 2010, 65, 550–557. [Google Scholar] [CrossRef]
- DeLyser, D.; Sui, D.Z. Crossing the qualitative-quantitative divide II: Inventive approaches to big data, mobile methods, and rhythmanalysis. Prog. Hum. Geogr. 2012, 37, 293–305. [Google Scholar] [CrossRef]
- DeLyser, D.; Sui, D.Z. Crossing the qualitative-quantitative chasm III: Enduring methods, open geography, participatory research, and the fourth paradigm. Prog. Hum. Geogr. 2014, 38, 294–307. [Google Scholar] [CrossRef]
- Goodchild, M.F.; Li, L. Assuring the quality of volunteered geographic information. Spat. Stat. 2012, 1, 110–120. [Google Scholar] [CrossRef]
- Bordogna, G.; Frigerio, L.; Kliment, T.; Brivio, P.A.; Hossard, L.; Manfron, G.; Sterlacchini, S. “Contextualized VGI” creation and management to cope with uncertainty and imprecision. ISPRS Int. J. Geo-Inf. 2016, 5, 234. [Google Scholar] [CrossRef]
- Sui, D.Z.; DeLyser, D. Crossing the qualitative-quantitative chasm I: Hybrid geographies, the spatial turn, and volunteered geographic information (VGI). Prog. Hum. Geogr. 2012, 36, 111–124. [Google Scholar] [CrossRef]
- Burke, J.; Estrin, D.; Hansen, M.; Ramanathan, N.; Reddy, S.; Srivastava, M.B. Participatory sensing. In Proceedings of the 1st Workshop on World-Sensor-Web: Mobile Device Centric Sensory Networks and Applications (WSW), Boulder, CO, USA, 31 October 2006. [Google Scholar]
- Quesnot, T. L’involution géographique: Des données géosociales aux algorithmes. Netw. Commun. Stud. 2016, 30, 281–304. [Google Scholar] [CrossRef]
- Sieber, R. Public participation geographic information systems: A literature review and framework. Ann. Assoc. Am. Geogr. 2006, 96, 491–507. [Google Scholar] [CrossRef]
- Conrad, C.C.; Hilchey, K.G. A review of citizen science and community-based environmental monitoring: Issues and opportunities. Environ. Monit. Assess. 2011, 176, 273–291. [Google Scholar] [CrossRef] [PubMed]
- Haklay, M. Citizen science and volunteered geographic information: Overview and typology of participation. In Crowdsourcing Geographic Knowledge: Volunteered Geographic Information (VGI) in Theory and Practice; Sui, D.Z., Elwood, S., Goodchild, M.F., Eds.; Springer: Dordrecht, The Netherlands, 2013; pp. 105–122. [Google Scholar]
- Wiggins, A.; Newman, G.; Stevenson, R.D.; Crowston, K. Mechanisms for data quality and validation in citizen science. In Proceedings of the 7th IEEE International Conference on e-Science Workshops, Stockholm, Sweden, 5–8 December 2011; pp. 14–19. [Google Scholar] [CrossRef]
- Wiggins, A.; Crowston, K. From conservation to crowdsourcing: A typology of citizen science. In Proceedings of the 44th Hawaii International Conference on System Sciences, Kauai, HI, USA, 4–7 January 2011. [Google Scholar] [CrossRef]
- Wiggins, A.; Crowston, K. Goals and tasks: Two typologies of citizen science projects. In Proceedings of the 45th Hawaii International Conference on System Sciences, Maui, HI, USA, 4–7 January 2012; pp. 3426–3435. [Google Scholar] [CrossRef]
- Brown, G.; Kyttä, M. Key issues and research priorities for public participation GIS (PPGIS): A synthesis based on empirical research. Appl. Geogr. 2014, 46, 122–136. [Google Scholar] [CrossRef]
- Scheider, S. Grounding Geographic Information in Perceptual Operations; IOS Press: Amsterdam, The Netherlands, 2012. [Google Scholar]
- Mocnik, F.-B.; Mobasheri, A.; Griesbaum, L.; Eckle, M.; Jacobs, C.; Klonner, C. A grounding-based ontology of data quality measures. J. Spat. Inf. Sci. 2018, 16, 1–25. [Google Scholar] [CrossRef]
- Haklay, M. How good is volunteered geographical information? A comparative study of OpenStreetMap and Ordnance Survey datasets. Environ. Plan. B 2010, 37, 682–703. [Google Scholar] [CrossRef]
- Barron, C.; Neis, P.; Zipf, A. A comprehensive framework for intrinsic OpenStreetMap quality analysis. Trans. GIS 2014, 18, 877–895. [Google Scholar] [CrossRef]
- Neis, P.; Zielstra, D.; Zipf, A. The street network evolution of crowdsourced maps: OpenStreetMap in Germany 2007–2011. Future Internet 2012, 4, 1–21. [Google Scholar] [CrossRef]
- Rehrl, K.; Gröchenig, S. A framework for data-centric analysis of mapping activity in the context of volunteered geographic information. ISPRS Int. J. Geo-Inf. 2016, 5, 37. [Google Scholar] [CrossRef]
- Barrington-Leigh, C.; Millard-Ball, A. The world’s user-generated road map is more than 80% complete. PLoS ONE 2017, 12, e0180698. [Google Scholar] [CrossRef] [PubMed]
- Gärdenfors, P. Conceptual Spaces. The Geometry of Thought; MIT Press: Cambridge, MA, USA, 2000. [Google Scholar]
- Mooney, P.; Corcoran, P. How social is OpenStreetMap? In Proceedings of the 15th AGILE Conference on Geographic Information Science, Avignon, France, 24–27 April 2012; pp. 282–287. [Google Scholar]
- Trant, J. Studying social tagging and folksonomy: A review and framework. J. Digit. Inf. 2009, 10, 1–42. [Google Scholar]
- Bégin, D.; Devillers, R.; Roche, S. Assessing volunteered geographic information (VGI) quality based on contributors’ mapping behaviours. Int. Arch. Photogramm. Remote Sens. Spat. Inf. Sci. 2013, 149–154. [Google Scholar] [CrossRef]
- Fogliaroni, P.; D’Antonio, F.; Clementini, E. Data trustworthiness and user reputation as indicators of VGI quality. Geo-Spat. Inf. Sci. 2018, 21, 213–233. [Google Scholar] [CrossRef]
- Keßler, C.; de Groot, R.T.A. Trust as a proxy measure for the quality of volunteered geographic information in the case of OpenStreetMap. In Proceedings of the 16th AGILE Conference on Geographic Information Science, Leuven, Belgium, 14–17 May 2013; pp. 21–37. [Google Scholar] [CrossRef]
- Harris, R.L. Information Graphics. A Comprehensive Illustrated Reference; Management Graphics: Atlanta, GA, USA, 1996. [Google Scholar]
- Wegman, E.J. Hyperdimensional data analysis using parallel coordinates. J. Am. Stat. Assoc. 1990, 85, 664–675. [Google Scholar] [CrossRef]
- Croux, C.; Dehon, C. Influence functions of the Spearman and Kendall correlation measures. Stat. Methods Appl. 2010, 19, 497–515. [Google Scholar] [CrossRef]
- Sokal, R.R.; Michener, C.D. A statistical method for evaluating systematic relationships. Univ. Kans. Sci. Bull. 1958, 38, 1409–1438. [Google Scholar]
| 1 | Restricting geographical data to smaller areas does not provide the same possibilities of analysis because geospatial datasets expose particular characteristics at different scales [5,6,7]. As a result, it is in many cases a necessity that geographical datasets are of global nature. |
| 2 | A set of SDSs with similar characteristics could be named a category. As these sets, however, overlap, we refer to them as types. |
| 3 | Participatory Geographic Information (PGI) is a variant of PPGIS, which will be introduced later. |
| 4 | Please note that the prototypes VGI and AGI are named in the same way as the types described before. In the reminder of this article, we use these terms to solely refer to the prototypes if not stated differently. |
| 5 | Our notion of ‘PGI’ should not be confused with the one used by Spyratos et al. [13], which refers to ‘Professional Geographic Information’. |
| 6 | Kendall’s rank correlation coefficient is in many cases also referred to as ‘Kendall’s tau coefficient,’ or ‘Kendall’s tau’ in short. |
© 2019 by the authors. Licensee MDPI, Basel, Switzerland. This article is an open access article distributed under the terms and conditions of the Creative Commons Attribution (CC BY) license (http://creativecommons.org/licenses/by/4.0/).