Abstract
This paper compares different artificial intelligence (AI) models in order to develop the best crop yield prediction model for the Midwestern United States (US). Through experiments to examine the effects of phenology using three different periods, we selected the July–August (JA) database as the best months to predict corn and soybean yields. Six different AI models for crop yield prediction are tested in this research. Then, a comprehensive and objective comparison is conducted between the AI models. Particularly for the deep neural network (DNN) model, we performed an optimization process to ensure the best configurations for the layer structure, cost function, optimizer, activation function, and drop-out ratio. In terms of mean absolute error (MAE), our DNN model with the JA database was approximately 21–33% and 17–22% more accurate for corn and soybean yields, respectively, than the other five AI models. This indicates that corn and soybean yields for a given year can be forecasted in advance, at the beginning of September, approximately a month or more ahead of harvesting time. A combination of the optimized DNN model and spatial statistical methods should be investigated in future work, to mitigate partly clustered errors in some regions.
1. Introduction
Accurate estimations of crop yields are important for many agronomic issues, including agricultural management, national food policies, and international crop trade. For this reason, a variety of methods are employed for crop yield prediction, and the application of satellite images is becoming increasingly important. Satellite remote sensing techniques, which continuously cover large areas, can help provide more accurate estimations of crop yields. Prasad et al. [1] predicted corn and soybean yields in Iowa, and Ren et al. [2] estimated the yield of winter wheat in Shandong, China, using a regression model with vegetation index and weather data. Most studies have focused on statistical analysis based on linear relationships between crop yields and vegetation indices obtained from optical satellite sensors [1,2,3,4,5,6,7]. In addition to vegetation indices, various land surface variables, such as weather elements, soil moisture (SM), hydrological conditions, soil properties, and fertilizer application, have also been used in crop yield estimation [8,9]. Empirical models using vegetation indices and weather elements have been widely applied due to their convenient data acquisition and relatively high prediction accuracy. Awad [10,11] presented a new mathematical optimization model to compensate for the lack of high resolution remote sensing images, and estimated potato yield using the biomass calculated by the model.
Many studies have achieved meaningful results, but the relationships between explanatory variables and crop yields have not always been clarified by linear equations; therefore, artificial intelligence (AI) approaches have become necessary to solve nonlinear and complex problems. AI is a computer technology that simulates human intelligence through learning processes [12]. AI could be an alternative to statistical modeling, because it can efficiently handle the problems of nonlinearity and complexity. Since crop yield is a nonlinear process, AI can be regarded as a suitable prediction approach. AI includes machine learning models, such as the random forest (RF) and support vector machine (SVM), and neural network models, such as the artificial neural network (ANN) and deep neural network (DNN). RF generates a large number of decision trees with slightly different characteristics through repetitive random sampling of the training data. It includes a bootstrap that determines the suitability of the sampling distribution and conducts resampling as needed. Bagging processes, which aggregate the results of the decision trees derived from bootstrapping, are also incorporated in the RF for ensemble modeling [13]. SVM conducts an optimal grouping of data using maximum margin hyperplanes (MMHs) with nonlinear kernel functions, and then builds a statistical model appropriate for each group [14]. ANN is a network model that can produce an approximation by optimizing a weight and bias set for a node-link structure consisting of input, hidden, and output layers [15,16]. DNN, a part of deep learning, is a more advanced technique that combines the advantages of traditional neural networks and machine learning models through an intensive learning process in a deep network. DNN can overcome the problem of local minima found in classic ANN approaches, and the problem of overfitting seen in traditional machine learning models. This is because the DNN can optimize a deep network structure via the back-propagation algorithm, which integrates forward and backward optimization processes, and by the activation function, which prevents the problem of vanishing gradients of loss functions during the back-propagation process. In addition, unexpected outliers can be handled efficiently by the drop-out method in a DNN model.
Recently, AI models have been used in research to improve the accuracy of crop yield prediction. Jiang et al. [17] estimated winter wheat yields in North China using multiple linear regression (MLR) and ANN models with satellite-derived vegetation indices and climate data, and showed that ANN outperformed MLR. Jeong et al. [18] predicted global and regional yields of wheat, corn, and potatoes using climate, soil, and hydrological variables; the overall results of RF were more efficient than those of MLR. Kuwata and Shibasaki [19,20] estimated corn yields in the United States (US) using satellite-based vegetation indices and climate data, and found that the prediction results from DNN were better than that from SVM. Ma et al. [21] used meteorological and satellite-based vegetation index data to predict rice yield in Korea, and the results showed that the convolutional neural network (CNN) had a higher accuracy than ANN.
However, these studies did not conduct a comprehensive and objective evaluation of the performance of various AI models available for crop yield prediction. In addition, previous studies using DNN or CNN did not present the model configuration sufficiently—such as the hyper-parameter setting and option tuning, which can greatly affect the model performance. Indeed, the existing research is somewhat limited in terms of input data. Most studies extracted input data from the entire period of crop growth (e.g., May to September) and used an average value of all months, although monthly variation of input variables may account for the effect of phenology on crop yield. Also, approaches based on data averaged over all months cannot predict crop yield for the year in advance (i.e., at the late August or early September stage). Early prediction of crop yields for the major producer countries are important because they can affect world crop prices.
The objective of this study was to develop an optimized DNN crop yield prediction model using optimized input variables from satellite products and meteorological datasets, following comprehensive and objective comparisons of various AI models. We first prepared input data for crop yield prediction, such as satellite-based vegetation indices, and meteorological and hydrological data, and constructed a matchup database on the Cropland Data Layer (CDL), a high-resolution map classifying crop types. Then, we selected an optimal period for crop yield estimation by considering the effect of phenology; for example, (1) May to September (entire growing season), (2) July to August (major productive period), and (3) a combination of all months showing high correlations between input variables and crop yield. We assumed that the prediction could be done based only on the July to August dataset, which can allow for yield prediction for the year, before harvesting. Using the optimized input dataset, we built six major AI models, including multivariate adaptive regression splines (MARS), SVM, RF, extremely randomized trees (ERT), ANN, and DNN, and comprehensively and objectively compared them. In particular, the DNN model was optimized by adjusting the hyper-parameters, layer structure, loss function, optimizer, activation function, and drop-out ratio to improve the accuracy of the crop yield prediction. Our experiment focused on corn and soybean yields in the Midwestern US, 2006–2015.
2. Study Area and Datasets
2.1. Study Area
The US is the world’s largest grain exporter [22], and our experiment focused on five states in the Midwestern US (Illinois, Iowa, Minnesota, North Dakota, and South Dakota), where corn and soybeans are dominant. Our study area included 407 counties in five states (102 in Illinois, 99 in Iowa, 87 in Minnesota, 53 in North Dakota, and 66 in South Dakota), which were selected because the area of cropland exceeded 50% of the county area (Figure 1).
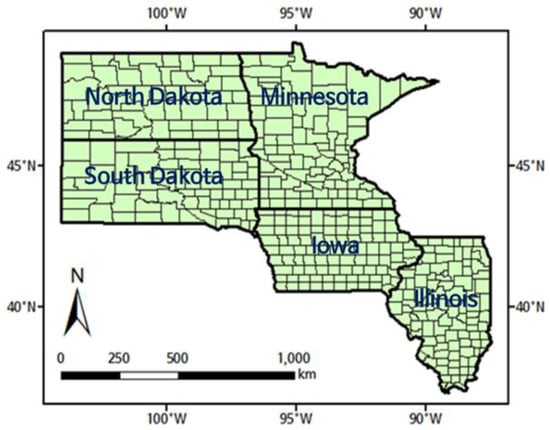
Figure 1.
Study area.
2.2. Satellite Products
The Terra Moderate Resolution Imaging Spectroradiometer (MODIS) is a satellite sensor operated by the National Aeronautics and Space Administration (NASA) for Earth environmental monitoring. The MODIS captures data in 36 spectral bands ranging in wavelength from 400 to 1440 nm, at varying spatial resolutions (two bands for red and near infrared rays at 250 m resolution, five bands for blue, green, and shortwave infrared rays at 500 m resolution, and a further 29 bands for ultraviolet, visible, and infrared rays at 1 km resolution) [23]. It produces 44 products for the atmosphere, land, and oceans. We obtained the normalized difference vegetation index (NDVI), enhanced vegetation index (EVI), leaf area index (LAI), fraction of photosynthetically active radiation (FPAR), and gross primary production (GPP) as indicators of vegetation vitality, photosynthesis, and biomass [24].
The NDVI, which represents the vitality of vegetation and photosynthetic activity, is the most commonly used vegetation index, and is calculated using the reflectance of near-infrared and red bands. The EVI is calculated by including the reflectance of the blue band to solve the signal saturation problem of the NDVI. Because the EVI is more sensitive to vegetation vitality than the NDVI in highly vegetated areas, it has been widely used for cropland monitoring [25,26].
The LAI is defined as the total leaf area per unit of ground surface area and is conventionally used as a proxy for the biomass of leaves [27]. It can be derived using maximum primary production and a crop-specific growth coefficient. The FPAR is defined as the fraction of incident photosynthetically active radiation (400–700 nm) absorbed by the green elements of a vegetation canopy [27]. GPP represents the vegetation biomass resulting from photosynthetic activity, in terms of chemical energy (kg C m−2) [28].
We used the products for NDVI and EVI, which were provided in the form of 250 m spatial resolution and 16 day temporal resolution. Also, we obtained the products for LAI, FPAR, and GPP which have 500 m spatial resolution and eight-day temporal resolution.
2.3. Meteorological and Hydrological Data
The Parameter-elevation Regressions on Independent Slopes Model (PRISM) [29] is a knowledge-based system developed for estimating regional-scale climate elements in physiographically complex landscapes at 4 km spatial resolution, such as precipitation (PPT), maximum temperature (TMAX), minimum temperature (TMIN), and mean temperature (TMEAN) [30]. The Global Land Data Assimilation System (GLDAS) [31] enables a reanalysis of land surface data by combining three land surface models (LSMs): Mosaic, Noah, and the Community Land Model (CLM) [32]. The SM product of GLDAS is known to be very reliable [33], and we used the monthly SM from the Noah land surface model (LSM) in a 0.25° grid for crop yield modeling.
2.4. Cropland Data Layer
The National Agricultural Statistics Service (NASS) of the US Department of Agriculture (USDA) provides a CDL map for crop type classifications at 30 m resolution for 2006–2009 and 56 m resolution for 2010–2015 [34]. The CDL is based on the cropland census and satellite images from the Landsat Thematic Mapper (TM) and Advanced Wide Field Sensor (AWIFS) [35]. The CDL product is updated yearly and used to produce a crop mask map [36,37]. In this study, we extracted pixels that were recorded as corn or soybean area on the CDL map for masking the croplands.
2.5. Crop Yield Statistics
The USDA NASS provides annual county-level statistics for crop yields [38]. The yield statistics of corn and soybeans in the study area were gathered for the period 2006–2015. The bushels per acre data were converted to tons per hectare for the sake of convenience. Table 1 summarizes the dataset used in this study. The study period was 2006–2015, during which all of the necessary data were available.

Table 1.
Summary of the dataset used in this study.
2.6. Data Processing
We first extracted the cropland pixels from the CDL recorded as corn (ID = 1) and soybean (ID = 5). Then, we carried out spatial re-arrangement to distribute the input variables (NDVI, EVI, LAI, FPAR, GPP, PPT, TMAX, TMIN, TMEAN, and SM) on the CDL grid, using the nearest neighbor method. By referring to the quality index of the MODIS products, only the best-quality pixels were extracted for NDVI, EVI, LAI, FPAR, and GPP. For comparison with county-level yield statistics, all the gridded variables were aggregated in accordance with the polygon zone of each county using a zonal mean operation. Finally, two databases were built for corn- and soybean-sown areas (Figure 2).
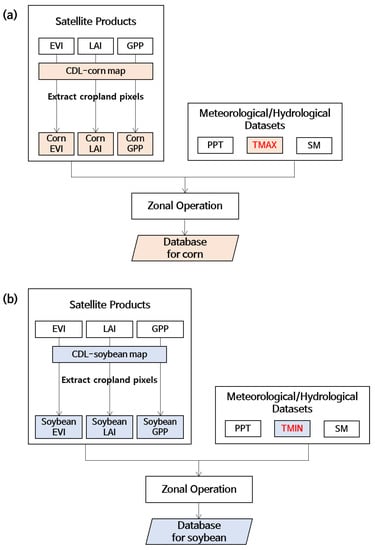
Figure 2.
Process for constructing the matchup database for (a) corn and (b) soybean, based on the Cropland Data Layer (CDL).
For the 10 candidate explanatory variables, we conducted a multi-collinearity test using the variation inflation factor (VIF). The VIF of the j-th explanatory variable is expressed as:
where is the R-squared value of the regression equation, with as a response variable and the other x variables as regressors. It indicates the degree to which an explanatory variable is correlated with the other explanatory variables. The actual input variables for our crop yield models were selected through the multi-collinearity test. The variables with VIF > 10 were generally excluded from the input data, because they could respond erratically to small changes in the model or the data [39]. Six variables were selected as valid explanatory variables: EVI, LAI, GPP, PPT, SM, and either TMAX (for corn) or TMIN (for soybean). The optimal temperature for soybean growth is between 20 and 26 °C; germination, flowering, and pod development can be delayed with lower temperatures [40]. Temperatures of 25–33 °C are appropriate for the growth of corn, which originated from tropical regions; temperature > 35 °C without sufficient rainfall can decrease growth [41]. Table 2 shows the correlation coefficients between the selected explanatory variables and the yields for corn and soybean.
Table 2.
Variation inflation factors (VIFs) of selected variables (May to September) against corn and soybean yields, 2006–2015.
3. Methods
3.1. Major Artificial Intelligence Models
We employed six major artificial intelligence models for crop yield modeling. Main features, advantages, disadvantages, and the software used were summarized in Table 3.
Table 3.
Summary of the main features, advantages, disadvantages, and the software for the six major artificial intelligence (AI) models used in this study.
MARS is a non-parametric regression technique that combines a series of linear models to cope with nonlinearity and interactions between variables. The learning dataset is divided into adaptive splines with different slopes. In general, the splines are smoothly connected to each other, and the polynomial function for the splines can generate a flexible model that can handle nonlinear relationships between data [42,43]. The suitability of a MARS model can be evaluated using the generalized cross-validation (GCV) value [44].
SVM is a machine-learning algorithm that performs optimal grouping of data and builds a regression model for the optimally divided dataset [45,46,47]. A hyperplane is used for the optimal grouping of data [48,49,50] by maximizing the margin between groups. The MMH can be found by maximizing the margin between support vectors at the boundary of the data groups [51], using kernel functions such as linear and Gaussian radial basis functions (RBFs).
RF, which represents an improved version of classification and regression trees (CART), is an ensemble model using the bootstrap and bagging technique [52]. It generates a large number of decision trees with slightly different features by extracting random samples from the training data, including a bootstrap that determines the suitability of the sampling distribution, and conducts resampling as needed. During the bagging process, bootstrap-based decision trees are aggregated to create a final solution, using an ensemble model such as the average or majority vote [13,53]. The final decision tree can be optimized by the tree pruning algorithm to determine an optimal size for the trees. In our experiment, the number of trees was set to 500, and the number of variables used for splitting nodes was set to n/3 (n = number of input variables). In addition, the out-of-bag error was used as the criterion of model suitability.
ERT is an ensemble model similar to RF, but it uses unpruned decision trees. ERT divides the nodes by randomly chosen cut-points and incorporates the complete learning sample (without bootstrap copying) to grow the trees [54]. The two main parameters for ERT are the number of attributes randomly selected at each node and the minimum sample size for splitting the node. The predictions of the trees are aggregated to produce a final ensemble prediction. In our experiment, the number of trees and the number of variables used for splitting nodes were set to be the same as those of RF.
ANN is a network model for emulating a biological neural system, and consists of input, hidden, and output layers [55]. The input layer corresponds to the explanatory variables, and the hidden layer represents the core of the node-link network for the computation of nonlinear problems [56,57]. Factors affecting the performance of ANNs include the number of nodes in the hidden layer, the learning rate, and the training tolerance [55]. The learning rate determines the amount by which the weights change during a series of iterations to bring the predicted value within an acceptable range of the observed value; furthermore, the training tolerance refers to the maximum error rate at which the network must converge during training [58]. Through this process, we can optimize a weight and bias set for the node-link structure and produce an approximation of the answer. In our experiment, the number of neurons in the hidden layer was set to three, which was selected through a performance test.
The classic ANN has a local minima problem in which an optimization process often stops at a locally, rather than globally, optimized state. In addition, generic machine learning models sometimes have problems with overfitting, in which they cannot handle data with outliers due to excessive learning from the given dataset. Such problems can be resolved by DNNs through an intensive optimization process in a deep network structure. To handle local minima and issues with overfitting, L1/L2 regularization can be employed to ensure sparsity (L1) and simplicity (L2) of the DNN model. Also, backward and forward optimization is conducted in the back-propagation algorithm to improve accuracy. The problem of vanishing gradients of loss functions, which may occur during the back-propagation process, can be managed by applying appropriate activation functions, such as sigmoid and rectified linear units (ReLU). The drop-out method deals with unexpected outliers via a learning mechanism in which the DNN model becomes more robust to extreme cases through iterations of a type of handicapped training with randomly deleted links and nodes [59]. In addition, a weight and bias set built in an existing DNN model can be imported as an initial value of a new DNN model for more custom-tailored training. This is called pre-training and transfer learning, which can improve the optimization of a DNN model. Fine-tuning can also be incorporated into the optimization process to adjust the weight and bias set in more detail, by including additional training data [60]. We set up the configurations of our DNN model through the parameter optimization procedure presented in Figure 3.
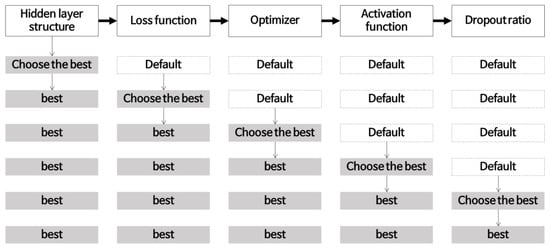
Figure 3.
Parameter optimization process for a deep neural network (DNN) model in this study.
3.2. Prediction and Validation
Since crop harvesting is conducted yearly, our prediction and validation were also conducted on a yearly basis. Leave-one-year-out cross-validation was conducted to examine the accuracy of corn and soybean yield predictions [61,62,63,64,65]. The hindcasting models were built by training with the nine-year dataset, excluding the target year, and the predicted yields for the target year were validated using the hidden, true observation values of the target year. We conducted 10 rounds of training and validation, and the number of datasets for each round was approximately 3,200 for training and 350 for validation. The mean bias error (MBE), mean absolute error (MAE), root mean square error (RMSE), mean absolute percentage error (MAPE), and the correlation coefficient between the observed and predicted yields during 2006–2015 were calculated for the validation statistics.
3.3. Spatial Analysis of Errors
The prediction errors can often show a unique spatial pattern. These errors may be either randomly distributed in space or spatially clustered. Hence, the spatial autocorrelation characteristics of the prediction errors were also examined using the Local Geary index (Gi*) [66], which expresses the degree of spatial association of an area with its neighboring areas:
where is the attribute value of the neighboring area j, is the average value of x, is the spatial weight between a target area i and its neighboring area j, is the number of areas, and is the standard deviation of x. The Gi* statistic is calculated for each area as a z-score. A positive, high value of Gi* indicates a hot spot with high clustering, and a negative, low value indicates a cold spot with low clustering. A value of zero indicates neutral or random spacing.
4. Results and Discussion
4.1. Phenology Effect
In general, corn and soybeans are planted between late April and mid-May, mature in September, and are harvested by late October [1]. To analyze the effects of phenology, we derived 13 cases using different combinations of months, including one case representative of the entire growing season (GS) between May and September, five cases corresponding to individual months, four cases corresponding to two successive months, and three cases corresponding to three successive months (Table 4 and Table 5). By considering correlation coefficients between input variables and crop yield, three periods were distinguished: (1) the entire GS from planting to harvest; (2) July–August (JA), which is the major period for corn and soybean production; and (3) the optimal combination (OC) of months with high correlations between input variables and crop yield. The OC for corn yield was based on EVI, LAI, and GPP data for JA, PPT data for June–July–August (JJA), TMAX data for July, and SM data for June–July (JJ). The OC for soybean included EVI, LAI, and SM data for JA, GPP data for July–August–September (JAS), PPT data for GS, and TMIN data for June.
Table 4.
Correlation coefficients between the selected variables and corn yields according to combinations of months, 2006–2015.
Table 5.
Correlation coefficients between the selected variables and soybean yields according to combinations of months, 2006–2015.
4.2. Development of the Optimized Prediction Model for Corn Yield
Crop yield can differ by land surface variables according to season. To find the best months for crop yield prediction, we conducted an analysis using the three aforementioned periods: (1) GS, (2) JA, and (3) OC. For corn yield prediction, we built six AI models (MARS, SVM, RF, ERT, ANN, and DNN) for the three periods (GS, JA, and OC). In particular, we carried out the parameter optimization for the DNN models according to the procedure presented in Figure 3. The results of the sensitivity analysis according to DNN parameters are illustrated in Figure 4. The best structure of the hidden layers was determined to be 300–300 nodes, which was selected from several layer structures, including 200–200, 300–300, 500–500, 200–200–200, 300–300–300, and 500–500–500 nodes. From the loss function, such as sum of square errors (SSE), mean of square errors (MSE), and cross entropy (CE), SSE was selected as the best one. The adaptive gradient (AdaGrad) algorithm was better than the root mean square propagation (RMSProp) as an optimizer. For the activation function, the ReLU outperformed the sigmoid and hyperbolic tangent functions. The drop-out ratio was set to 40% through minimization of RMSE and MAPE.
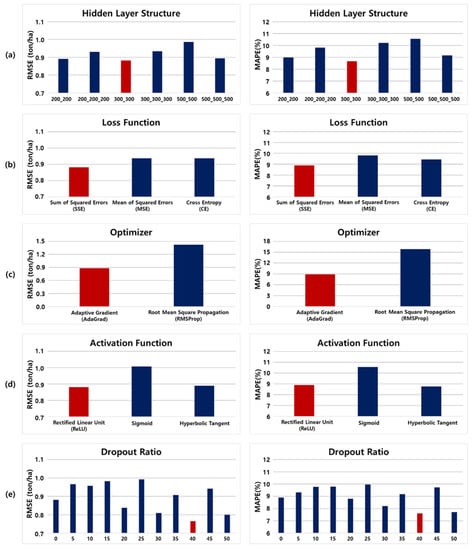
Figure 4.
The results of the optimized deep neural network (DNN) model: root mean square error (RMSE) and mean absolute percentage error (MAPE) according to the (a) hidden layer structure, (b) loss function, (c) optimizer, (d) activation function, and (e) drop-out ratio.
Then, we examined the results of all 18 corn yield models (six models by three periods). The overall prediction accuracy was higher for JA than for GS or OC. In terms of the correlation coefficient, the highest accuracy was 0.945 for JA, 0.919 for GS, and 0.935 for OC. This suggests that a prediction model consisting of July and August input data is sufficient for corn-yield forecasting for the year. Therefore, we can forecast the yield for the year in advance (at the beginning of September) using the JA database. The summary of validation results produced by the 10 rounds of experiments between 2006 and 2015 are presented in Table 6.
Table 6.
Summary of validation statistics from 10 rounds of experiments for corn yield: July–August (JA) (major productive period), 2006–2015.
The optimized DNN model produced the highest prediction accuracy (RMSE = 0.765 ton/ha and MAPE = 7.6%), and the scatter plot of the DNN for the predicted versus actual corn yields during 2006–2015 showed better agreement than other models (Figure 5). The other five models had somewhat dispersed patterns in terms of the one-to-one line of the scatter plots, which was due to problems with overfitting or local minima. The DNN model overcame such issues because of the intensive optimization in the deep network structure, including the best configurations for the cost function, optimizer, activation function, and drop-out ratio. In terms of MAE, the DNN model with the JA database produced an approximately 21% (0.703/0.582–1) to 33% (0.773/0.582–1) better outcome than the other five models.
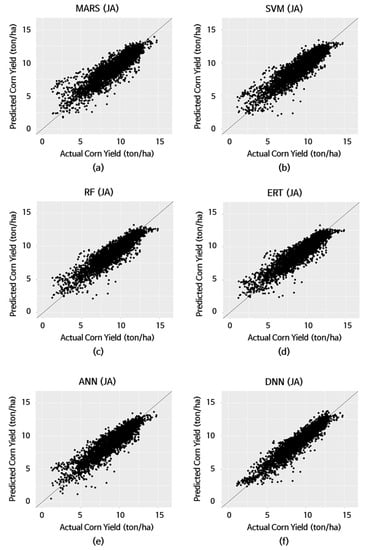
Figure 5.
Actual versus predicted corn yields from 10 rounds of experiments for July–August (JA) (major productive period), 2006–2015: (a) multivariate adaptive regression splines (MARS), (b) support vector machine (SVM), (c) random forest (RF), (d) extremely randomized trees (ERT), (e) artificial neural network (ANN), and (f) deep neural network (DNN).
4.3. Development of Optimized Prediction Model for Soybean Yield
To examine the effect of phenology on prediction accuracy, we compared the predicted soybean yields from the GS, JA, and OC periods. The overall prediction accuracy of soybean yield was higher than for GS or OC. In terms of correlation coefficient, the highest accuracy was 0.901 for JA, 0.867 for GS, and 0.880 for OC. The validation results produced by the 10 rounds of experiments between 2006 and 2015 are presented in Table 7. The accuracy of soybean models was similar to that of corn models in terms of MAPE, but was somewhat lower in terms of the correlation coefficient. This is presumably because soybeans are a small grain and have a small yield value, which may lead to a relatively dispersed pattern around the one-to-one line on the scatter plot (Figure 6). However, the prediction results of the DNN model were relatively stable and its scatter plot was highly concentrated around the one-to-one line. Similar to the optimization of the corn yield model, the best-fitted DNN model for soybean yield was built by setting the structure of the hidden layers to 500–500 nodes, SSE for loss function, AdaGrad for optimizer, ReLU for activation function, and the drop-out ratio to be 40%. The optimized DNN model for soybean showed high prediction accuracy (RMSE = 0.285 ton/ha, MAPE = 7.8%), which suggests that the DNN approach can be also effective for crops other than corn or soybeans. In terms of MAE, the DNN model with the JA database produced an outcome approximately 17% (0.270/0.222–1) to 22% (0.259/0.222–1) more accurate than those of the other five models.
Table 7.
Summary of validation statistics from 10 rounds of experiments for soybean yield: July–August (JA) (major productive period), 2006–2015.
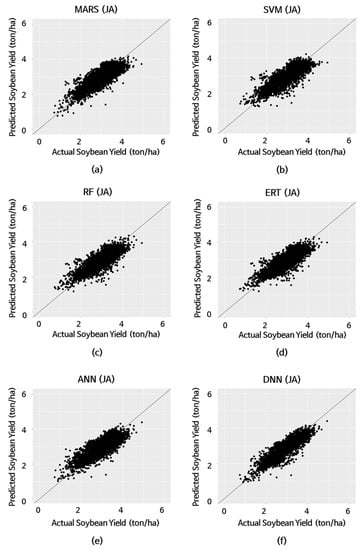
Figure 6.
Actual versus predicted soybean yields from 10 rounds of experiments for July–August (JA) (major productive period), 2006–2015: (a) multivariate adaptive regression splines (MARS), (b) support vector machine (SVM), (c) random forest (RF), (d) extremely randomized trees (ERT), (e) artificial neural network (ANN), and (f) deep neural network (DNN).
4.4. Spatial Characteristics of the Optimized DNN Models
Section 4.1 and Section 4.2 showed that the crop yield prediction accuracy was highest when using the optimized DNN model with the JA period data. To analyze the spatial characteristics of the result in more detail, we examined the annual predicted corn and soybean yields of the optimized DNN model for JA. Figure 7, Figure 8, Figure 9 and Figure 10 are the maps of the annual county-level corn and soybean yields, respectively, for 2006–2015. The actual (Figure 7a, Figure 8a, Figure 9a and Figure 10a) and predicted yields (Figure 7b, Figure 8b, Figure 9b and Figure 10b) showed quite similar patterns. Figure 7c, Figure 8c, Figure 9c and Figure 10c show the prediction errors for corn and soybean yields. Figure 7d, Figure 8d, Figure 9d and Figure 10d show the Gi* for the prediction errors of our DNN model for corn and soybean yields. A somewhat spatially clustered pattern was found in a few areas for multiple years. This tendency of the spatial autocorrelation of the prediction error may be associated with the spatial distribution of the input data for land surface and weather variables. Indeed, the DNN model does not account for the spatial relationships between crop yield and agricultural variables. To examine the spatial clustering tendency of the prediction errors in more detail, and to solve the problem, the DNN model used in this study could be coupled with spatial statistical methods, such as geographically weighted regression (GWR), in a future work.
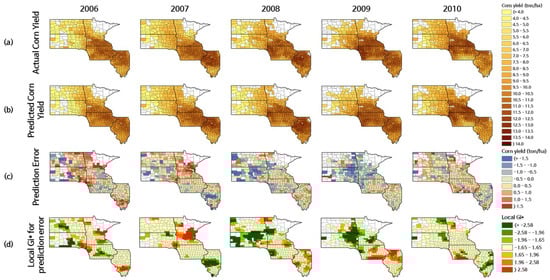
Figure 7.
Maps of the actual and predicted corn yields, prediction errors, and Local Geary index (Gi*) of the prediction errors, 2006–2010.
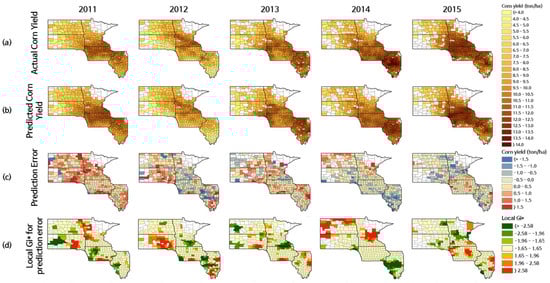
Figure 8.
Maps of the actual and predicted corn yields, prediction errors, and Local Geary index (Gi*) of the prediction errors, 2011–2015.
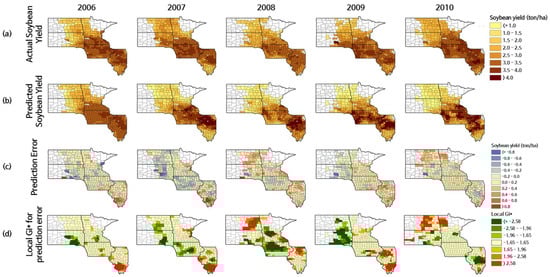
Figure 9.
Maps of the actual and predicted soybean yields, prediction errors, and Local Geary index (Gi*) of the prediction errors, 2006–2010.
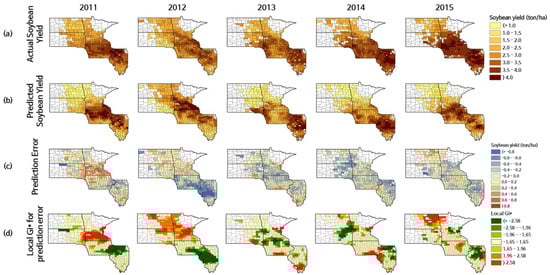
Figure 10.
Maps of the actual and predicted soybean yields, prediction errors, and Local Geary index (Gi*) of the prediction errors, 2011–2015.
Examination of soil properties was also effective for analyzing the spatial pattern of prediction errors. In the case of Illinois, the spatial clustering of prediction errors was found in almost every year, for both corn and soybeans. This may be related to the spatial characteristics of the distribution of soil property values, such as bulk density and sodium content. High bulk density can prevent plants from rooting, and high sodium content can result in water stress for crops. Hence, we referred to the soil property maps from the Harmonized World Soil Database (HWSD) for the study area. Presumably, the spatial clustering of prediction errors in Illinois can be associated with the values of bulk density and sodium content, which were higher than in the other states. Additional treatment aimed at the spatial distribution of soil properties can contribute to improving the accuracy of crop yield prediction.
5. Conclusions
This paper compared different AI models in order to develop the best crop yield prediction model for the midwestern US. We constructed the input dataset from satellite-based vegetation indices, and meteorological and hydrological variables, in accordance with a high-resolution CDL. Through experiments to examine the effects of phenology using three periods (GS, JA, and OC), we selected the JA database as the best months to predict corn and soybean yields. Using the optimal input database, we built six major AI models for crop yield prediction and conducted a comprehensive and objective comparison of the AI models. Particularly for the DNN model, we performed an optimization process to ensure the best configurations for the layer structure, cost function, optimizer, activation function, and drop-out ratio, to improve the crop yield prediction accuracy. Consequently, the DNN model with the JA database outperformed the other five AI models, with prediction errors of approximately 7.6% and 7.8% for corn and soybeans, respectively, which is a better result than those of previous studies. In terms of MAE, our DNN model with the JA database was approximately 21–33% and 17–22% more accurate for corn and soybeans, respectively, than the other five AI models. Our model showed a correlation coefficient of 0.945 for corn and 0.901 for soybean. This was a better result than that previous research using AI models, although the experiment conditions were different in terms of the crop types and study areas (Table 8). This indicates that our DNN with JA model can forecast the corn and soybean yields very accurately for a given year in advance, at the end of August or beginning of September. The optimized DNN model developed in this study can also be adopted in other regions and/or for other crops, only if the parameter optimization is conducted for a new region (or crop). Additionally, we analyzed the spatial characteristics of the prediction errors using Gi*. Prediction errors had a tendency to cluster spatially in some areas in several years, indicating that the relationship between crop yield and land environmental factors can have a locally unique or regionally heterogeneous pattern, and that it will be necessary to employ spatial statistical methods to solve these problems. Therefore, a combination of the optimized DNN model and a spatial statistical model, such as GWR, should be investigated in a future work for greater accuracy improvement. This could also help mitigate the slight tendency toward underestimation of our soybean yield model. Also, more appropriate input variables, such as the growing degree days, should be added to a modified DNN model.
Table 8.
Result of crop yield estimation using artificial intelligence (AI) from previous research.
Author Contributions
Research design and supervision by Yang-Won Lee; data processing and analysis by Nari Kim; Manuscript preparation by Nari Kim and Yang-Won Lee; literature review and discussion by Kyung-Ja Ha, No-Wook Park, Jaeil Cho, and Sungwook Hong.
Funding
This research was funded by the NRF (National Research Foundation) of Korean government (2017R1D1A1B03034245 and 2018R1A6A3A01013215).
Conflicts of Interest
The authors declare no conflict of interest.
References
- Prasad, A.K.; Chai, L.; Singh, R.P.; Kafatos, M. Crop yield estimation model for Iowa using remote sensing and surface parameters. Int. J. Appl. Earth Obs. Geoinf. 2006, 8, 26–33. [Google Scholar] [CrossRef]
- Ren, J.; Chen, Z.; Zhou, Q.; Tang, H. Regional yield estimation for winter wheat with MODIS-NDVI data in Shandong, China. Int. J. Appl. Earth Obs. Geoinf. 2008, 10, 403–413. [Google Scholar] [CrossRef]
- Allen, J.D. A look at the remote sensing applications program of the National Agricultural Statistics Service. J. Off. Stat. 1990, 6, 393–409. [Google Scholar]
- Labus, M.P.; Jielsen, G.A.; Lawrence, R.L.; Engel, R.; Long, D.S. Wheat yield estimates using multi-temporal NDVI satellite imagery. Int. J. Remote Sens. 2002, 23, 4169–4180. [Google Scholar] [CrossRef]
- Ferencz, C.; Bognár, P.; Lichtenberger, J.; Hamar, D.; Tarcsai, G.; Timár, G.; Molnár, G.; Pásztor, S.; Steinbach, P.; Székely, B.; et al. Crop yield estimation by satellite remote sensing. Int. J. Remote Sens. 2004, 25, 4113–4149. [Google Scholar] [CrossRef]
- Doraiswamy, P.C.; Sinclair, T.R.; Hollinger, S.; Akhmedov, B.; Stern, A.; Prueger, J. Application of MODIS derived parameters for regional crop yield assessment. Remote Sens. Environ. 2005, 97, 192–202. [Google Scholar] [CrossRef]
- Bolton, D.K.; Friedl, M.A. Forecasting crop yield using remotely sensed vegetation indices and crop phenology metrics. Agric. For. Meteorol. 2013, 173, 74–84. [Google Scholar] [CrossRef]
- Nguu, N.V. Effect of nitrogen, phosphorus and soil and crop residues management practices on maize (Zea mays L.) yield in ultisol of eastern Cameroon. Fertil. Res. 1987, 14, 135–142. [Google Scholar] [CrossRef]
- Garcia-Paredes, J.D.; Olson, K.R.; Lang, J.M. Predicting corn and soybean productivity for Illinois soils. Agric. Syst. 2000, 64, 151–170. [Google Scholar]
- Awad, M.M. Toward Precision in Crop Yield Estimation Using Remote Sensing and Optimization Techniques. Agriculture 2019, 9, 54. [Google Scholar] [CrossRef]
- Awad, M.M. An Innovative Intelligent System Based on Remote Sensing and Mathematical Models for Improving Crop Yield Estimation. Available online: https://www.sciencedirect.com/science/article/pii/S2214317318302981 (accessed on 9 May 2019).
- Russell, S.J.; Norvig, P. Artificial Intelligence: A modern Approach; Pearson Education Limited: Petaling jaya, SEL, Malaysia, 2016. [Google Scholar]
- Breiman, L. Random forests. Mach. Learn. 2001, 45, 5–32. [Google Scholar] [CrossRef]
- Vapnik, V. Statistical Learning Theory; Wiley: New York, NY, USA, 1998. [Google Scholar]
- Simpson, G. Crop yield prediction using a CMAC neural network. Proc. Soc. Photo-Opt. Instrum. Eng. 1994, 2315, 160–171. [Google Scholar]
- Baret, F.; Clevera, J.G.; Steven, M.D. The robustness of canopy gap fraction estimates from red and near-infrared reflectance: A comparison of approaches. Remote Sens. Environ. 1995, 54, 141–151. [Google Scholar] [CrossRef]
- Jiang, D.; Yango, X.; Clinton, N.; Wang, N. An artificial neural network model for estimating crop yields using remotely sensed information. Int. J. Remote Sens. 2004, 25, 1723–1732. [Google Scholar] [CrossRef]
- Jeong, J.H.; Resop, J.P.; Mueller, N.D.; Fleisher, D.H.; Yun, K.; Butler, E.E.; Timlin, D.J.; Shim, K.-M.; Gerber, J.S.; Reddy, V.R.; et al. Random forests for global and regional crop yield predictions. PLoS ONE 2016, 11, e0156571. [Google Scholar] [CrossRef]
- Kuwata, K.; Shibasaki, R. Estimating crop yields with deep learning and remotely sensed data. In Proceedings of the 2015 IEEE International Geoscience and Remote Sensing Symposium (IGARSS), Milan, Italy, 26–31 July 2015; pp. 858–861. [Google Scholar]
- Kuwata, K.; Shibasaki, R. Estimating corn yield in the United Sates with MODIS EVI and machine learning methods. ISPRS Ann. Photogramm. Remote Sens. Spat. Inf. Sci. 2016, 3, 131–136. [Google Scholar] [CrossRef]
- Ma, J.W.; Nguyen, C.H.; Lee, K.; Heo, J. Convolutional neural networks for rice yield estimation using MODIS and weather data: A case study for South Korea. J. Korean Soc. Surv. Geod. Photogramm. Cartogr. 2016, 34, 525–534. [Google Scholar] [CrossRef]
- USDA. Census of Agriculture; United States Department of Agriculture: Washington, DC, USA, 2012. Available online: https://www.agcensus.usda.gov/ (accessed on 9 May 2019).
- NASA MODIS Home Page. Available online: https://modis.gsfc.nasa.gov/about/specifications.php (accessed on 9 May 2019).
- NASA EARTHDATA Search Home Page. Available online: https://search.earthdata.nasa.gov/ (accessed on 9 May 2019).
- Townshend, J.R.G.; Justice, C.O.; Li, W.; Gurney, C.; McManus, J. Global land cover classification by remote sensing: Present capabilities and future capabilities. Remote Sens. Environ. 1991, 35, 243–255. [Google Scholar] [CrossRef]
- Huete, A.R.; Didan, K.; Miura, T.; Rodriguez, E.P.; Gao, X.; Ferreria, L.G. Overview of the radiometric and biophysical performance of the MODIS vegetation indices. Remote Sens. Environ. 2002, 83, 195–213. [Google Scholar] [CrossRef]
- Sellers, P.J. Canopy reflectance, photosynthesis and transpiration. Int. J. Remote Sens. 1985, 6, 1335–1372. [Google Scholar] [CrossRef]
- Lee, S.-J.; Cho, J.; Hong, S.; Ha, K.-J.; Lee, H.; Lee, Y.-W. On the relationships between satellite-based drought index and gross primary production in the North Korean croplands, 2000–2012. Remote Sens. Lett. 2016, 7, 790–799. [Google Scholar] [CrossRef]
- PRISM Climate Group Home Page. Available online: http://www.prism.oregonstate.edu/ (accessed on 9 May 2019).
- Daly, C. Descriptions of PRISM Spatial Climate Datasets for the Conterminous United States. PRISM Doc. Available online: http://www.prism.oregonstate.edu/documents/PRISM_datasets_aug2013.pdf (accessed on 20 April 2019).
- GES DISC Home Page. Available online: https://disc.gsfc.nasa.gov/ (accessed on 9 May 2019).
- Rodell, M.; Houser, P.R.; Jambor, U.; Gottschalck, J.; Mitchell, K.; Meng, C.-J.; Arsenault, K.; Cosgrove, B.; Radakovich, J.; Bosilovich, M.; et al. The global land data assimilation system. Bull. Am. Meteorol. Soc. 2004, 85, 381–394. [Google Scholar] [CrossRef]
- De Jeu, R.; Holmes, T.; Dorigo, W.; Wagner, W.; Hahn, S.; Parinussa, R. Evaluation of SMOS soil moisture with other existing satellite products. In Proceedings of the Remote Sensing and Hydrology 2010 Symposium, Jackson Hole, WY, USA, 27–30 September 2010. [Google Scholar]
- NASS USDA Home Page. Available online: https://www.nass.usda.gov/ (accessed on 9 May 2019).
- Boryan, C.; Yang, Z.; Mueller, R.; Craig, M. Monitoring US agriculture: The US department of agriculture, national agricultural statistics service, cropland data layer program. Geocarto Int. 2011, 26, 341–358. [Google Scholar] [CrossRef]
- Becker-Reshef, I.; Vermote, E.; Lindeman, M.; Justice, C. A generalized regression-based model for forecasting winter wheat yields in Kansas and Ukraine using MODIS data. Remote Sens. Environ. 2010, 114, 1312–1323. [Google Scholar] [CrossRef]
- Johnson, D.M. An assessment of pre- and within-season remotely sensed variables for forecasting corn and soybean yields in the United States. Remote Sens. Environ. 2014, 141, 116–128. [Google Scholar] [CrossRef]
- NASS USDA Quick Stats Home Page. Available online: http://quickstats.nass.usda.gov (accessed on 9 May 2019).
- Kutner, M.H.; Nachtsheim, C.J.; Neter, J. Applied Linear Regression Models, 4th ed.; Mc-Graw-Hill/Irwin: Upper Saddle River, NJ, USA, 2004. [Google Scholar]
- Liu, X.; Jin, J.; Wang, G.; Herber, S.J. Soybeans yield physiology and development of high-yielding practices in Northeast China. Filed Crops Res. 2008, 105, 157–171. [Google Scholar] [CrossRef]
- Neild, R.E.; Newman, J.E. Growing Season Characteristics and Requirements in the Corn Belt, Cooperative Extension Service; Iowa State University: Ames, IA, USA, 1987. [Google Scholar]
- Friedman, J.H. Multivariate adaptive regression splines. Ann. Stat. 1991, 19, 1–67. [Google Scholar] [CrossRef]
- Zhang, W.; Goh, A.T.C. Multivariate adaptive regression splines and neural network models for prediction of pile drivability. Geosci. Front. 2016, 7, 45–52. [Google Scholar] [CrossRef]
- Hastie, T.; Tibshirani, R.; Friedman, J. The Elements of Statistical Learning: Data Mining, Inference and Prediction, 2nd ed.; Springer: New York, NY, USA, 2009. [Google Scholar]
- Pal, M.; Mather, P.M. An assessment of the effectiveness of decision tree methods for land cover classification. Remote Sens. Environ. 2003, 86, 554–565. [Google Scholar] [CrossRef]
- Jensen, J.R.; Im, J.; Hardin, P.; Jense, R.R. Chapter 19: Image Classification. In The Sage Handbook of Remote Sensing; Warner, T.A., Nellis, M.D., Foody, G.M., Eds.; SAGE Publications Ltd.: London, UK, 2009; pp. 269–296. [Google Scholar]
- Duro, D.C.; Franklin, S.E.; Dube, M.G. A comparison of pixel-based and object-based image analysis with selected machine learning algorithms for the classification of agricultural landscapes using SPOT-5 HRG imagery. Remote Sens. Environ. 2012, 118, 259–272. [Google Scholar] [CrossRef]
- Mountrakis, G.; Im, J.; Ogole, C. Support vector machines in remote sensing: A review. ISPRS J. Photogramm. Remote Sens. 2011, 66, 247–259. [Google Scholar] [CrossRef]
- Foody, G.M.; Mathur, A. The use of small training sets containing mixed pixels for accurate hard image classification: Training on mixed spectral responses for classification by SVM. Remote Sens. Environ. 2006, 103, 179–189. [Google Scholar] [CrossRef]
- Van der Linder, S.; Hostert, P. The influence of urban structures on impervious surface maps from airborne hyperspectral data. Remote Sens. Environ. 2009, 113, 2298–2305. [Google Scholar] [CrossRef]
- Meyer, D. Support Vector Machines, 2019. Available online: https://cran.r-project.org/web/packages/e1071/e1071.pdf (accessed on 9 May 2019).
- Breiman, L.; Cutler, A. Random Forests, 2014. Available online: http://www.stat.berkeley.edu/~breiman/RandomForests/cc_home.htm (accessed on 9 May 2019).
- Ali, J.; Khan, R.; Ahmad, N.; Maqsood, I. Random forests and decision trees. Int. J. Comput. Sci. Issues 2012, 9, 272–278. [Google Scholar]
- Geurts, P.; Ernst, D.; Wehenkel, L. Extremely randomized trees. Mach. Learn. 2006, 63, 3–42. [Google Scholar] [CrossRef]
- Kaul, M.; Hill, R.L.; Walthall, C. Artificial neural networks for corn and soybean yield prediction. Agric. Syst. 2005, 85, 1–18. [Google Scholar] [CrossRef]
- Brown, M.E.; Lary, D.J.; Vrieling, A.; Stathakis, D.; Mussan, H. Neural networks as a tool for constructing continuous NDVI time series from AVHRR and MODIS. Int. J. Remote Sens. 2008, 29, 7141–7158. [Google Scholar] [CrossRef]
- Hu, X.; Weng, Q. Estimating impervious surfaces from medium spatial resolution imagery using the selforganizing map and multi-layer perceptron neural networks. Remote Sens. Environ. 2009, 113, 2089–2102. [Google Scholar] [CrossRef]
- Ji, B.; Sun, Y.; Yang, S.; Wan, J. Artificial neural networks for rice yield prediction in mountainous regions. J. Agric. Sci. 2007, 145, 249–261. [Google Scholar] [CrossRef]
- Pham, V.; Bluche, T.; Kernorvant, C.; Louradour, J. Drop-out improves recurrent neural networks for handwriting recognition. In Proceedings of the 2014 14th International Conference on Frontiers in Handwriting Recognition (ICFHR), Crete, Greece, 1–4 September 2014. [Google Scholar]
- Erhan, D.; Bengio, Y.; Courville, A.; Manzagol, P.A.; Vincent, P. Why does unsupervised pre-training help deep learning? J. Mach. Learn. Res. 2010, 11, 625–660. [Google Scholar]
- Schut, A.G.T.; Stephen, D.J.; Stovold, R.G.H.; Adams, M.; Craig, R.L. Improved wheat yield and production forecasting with a moisture stress index, AVHRR and MODIS data. Crop Pasture Sci. 2009, 60, 60–70. [Google Scholar] [CrossRef]
- Mkhabela, M.S.; Bullock, P.; Wang, S.; Yang, Y. Crop yield forecasting on the Canadian Prairies using MODIS NDVI data. Agric. For. Meteorol. 2011, 151, 385–393. [Google Scholar] [CrossRef]
- Kouadio, L.; Newlands, N.K.; Davidson, A.; Zhang, Y.; Chipanshi, A. Assessing the performance of MODIS NDVI and EVI for seasonal crop yield forecasting at the Ecodistrict scale. Remote Sens. 2007, 22, 837–852. [Google Scholar] [CrossRef]
- Chipanshi, A.; Zhang, Y.; Kouadio, L.; Newlands, N.; Davidson, A.; Hill, H.; Warren, R.; Qian, B.; Daneshfar, B.; Bedard, F.; et al. Evaluation of the integrated Canadian crop yield forecaster (ICCYF) model for in-season prediction of crop yield across the Canadian agricultural landscape. Agric. For. Meteorol. 2015, 206, 137–150. [Google Scholar] [CrossRef]
- Govedarica, M.; Jovanović, D.; Sabo, F.; Borisov, M.; Vrtunski, M.; Alargić, I. Comparison of MODIS 250 m products for early corn yield predictions: A case study in Vojvodina, Serbia. Open Geosci. 2016, 8, 747–759. [Google Scholar] [CrossRef]
- Anselin, L. Local indicators of spatial association—LISA. Geogr. Anal. 1995, 27, 93–115. [Google Scholar] [CrossRef]
- Kim, N.; Lee, Y.W. Machine learning approaches to corn yield estimation using satellite images and climate data: A case of Iowa State. J. Korean Soc. Surv. Geod. Photogramm. Cartogr. 2016, 34, 383–390. [Google Scholar] [CrossRef]
- Khaki, S.; Wang, L. Crop Yield Prediction Using Deep Neural Networks. arXiv 2019, arXiv:1902.02860. [Google Scholar]
- Wang, A.X.; Tran, C.; Desai, N.; Lobell, D.; Ermon, S. Deep transfer learning for crop yield prediction with remote sensing data. In Proceedings of the 1st ACM SIGCAS Conference on Computing and Sustainable Societies, Menlo Park/San Jose, CA, USA, 20–22 June 2018; ACM: New York, NY, USA, 2018. [Google Scholar]
- Yang, Q.; Shi, L.; Han, J.; Zha, Y.; Zhu, P. Deep convolutional neural networks for rice grain yield estimation at the ripening stage using UAV-based remotely sensed images. Field Crops Res. 2019, 235, 142–153. [Google Scholar] [CrossRef]
© 2019 by the authors. Licensee MDPI, Basel, Switzerland. This article is an open access article distributed under the terms and conditions of the Creative Commons Attribution (CC BY) license (http://creativecommons.org/licenses/by/4.0/).