Multi-Mode Two-Step Floating Catchment Area (2SFCA) Method to Measure the Potential Spatial Accessibility of Healthcare Services


Abstract
:1. Introduction
2. Methods
2.1. Multi-Mode Two-Step Floating Catchment Area Method
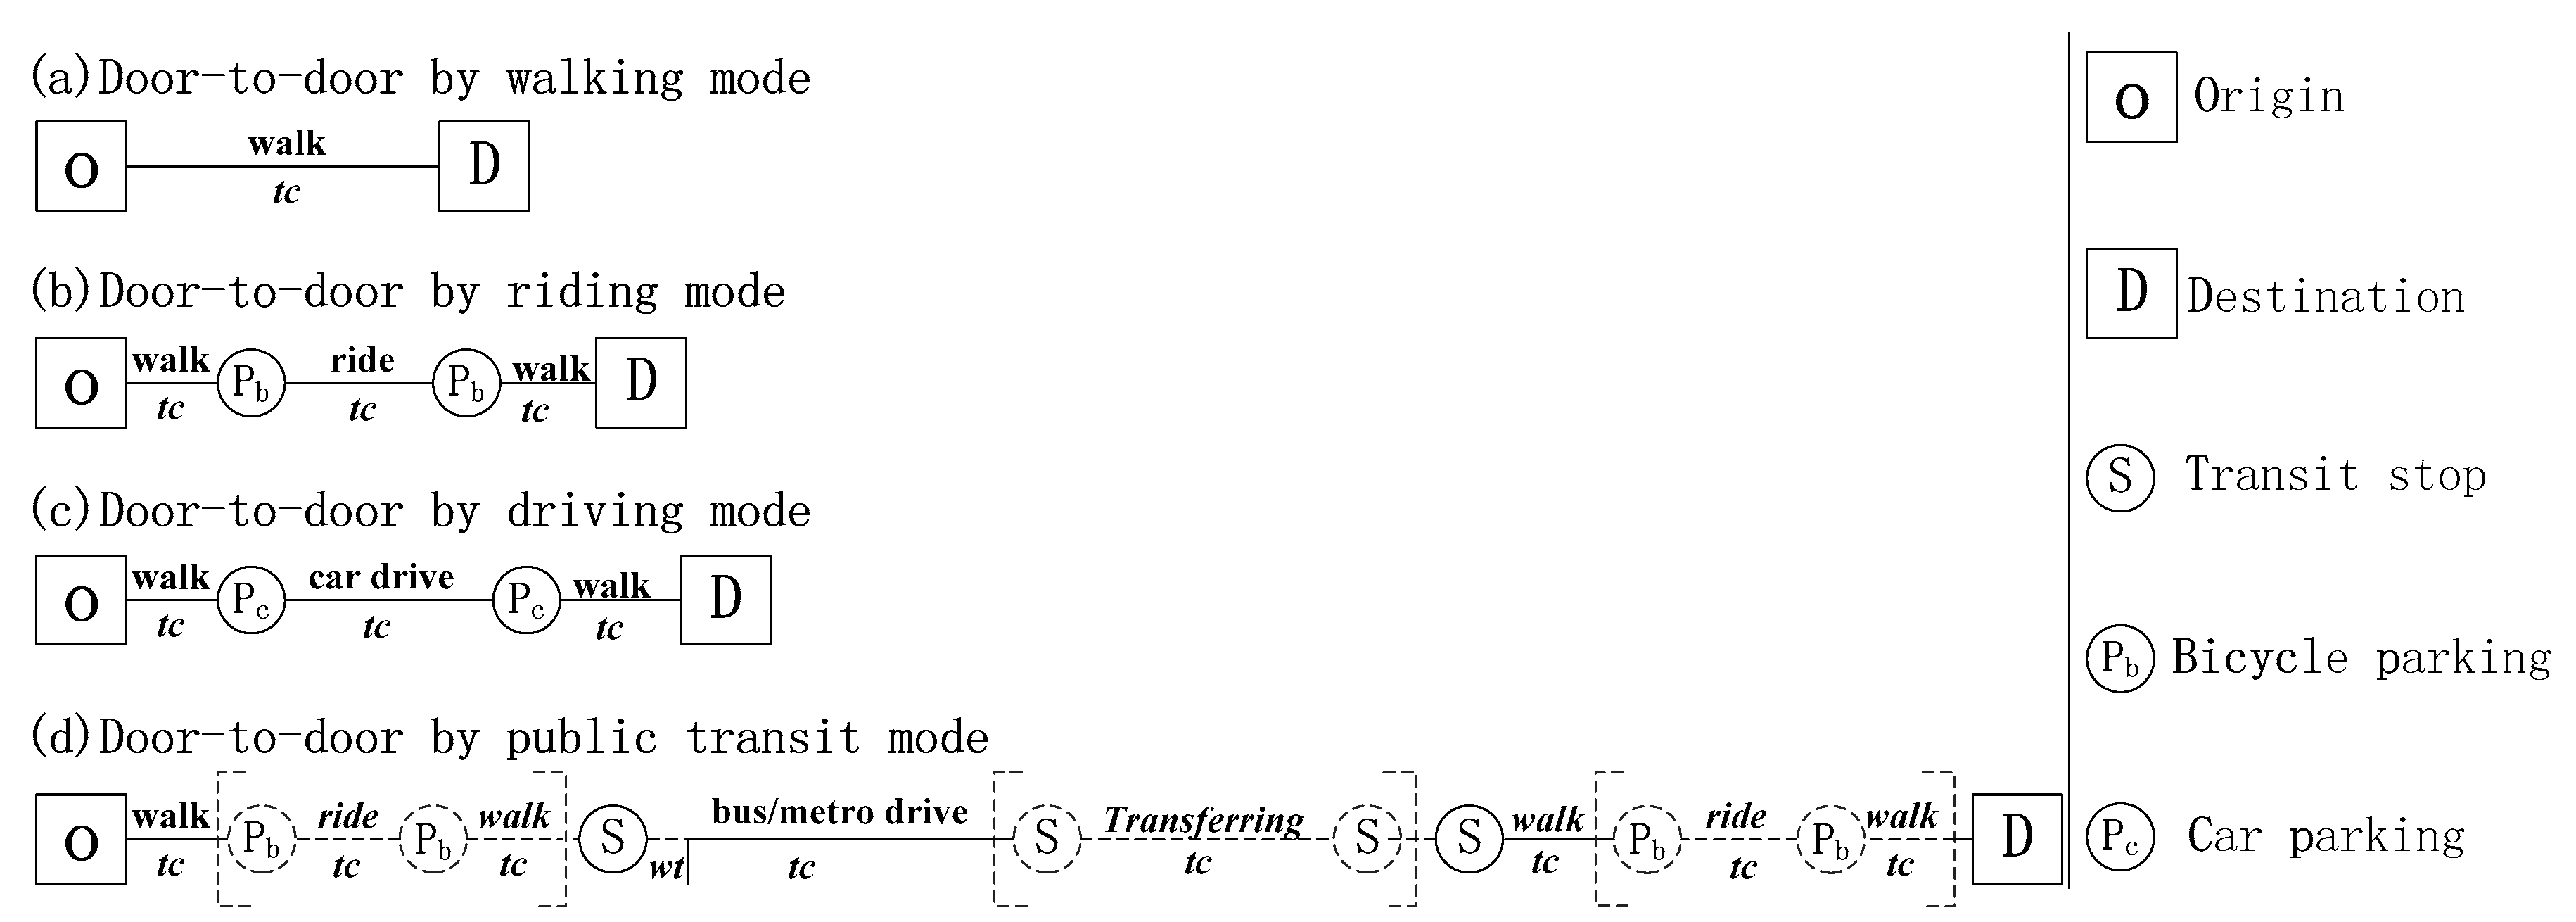
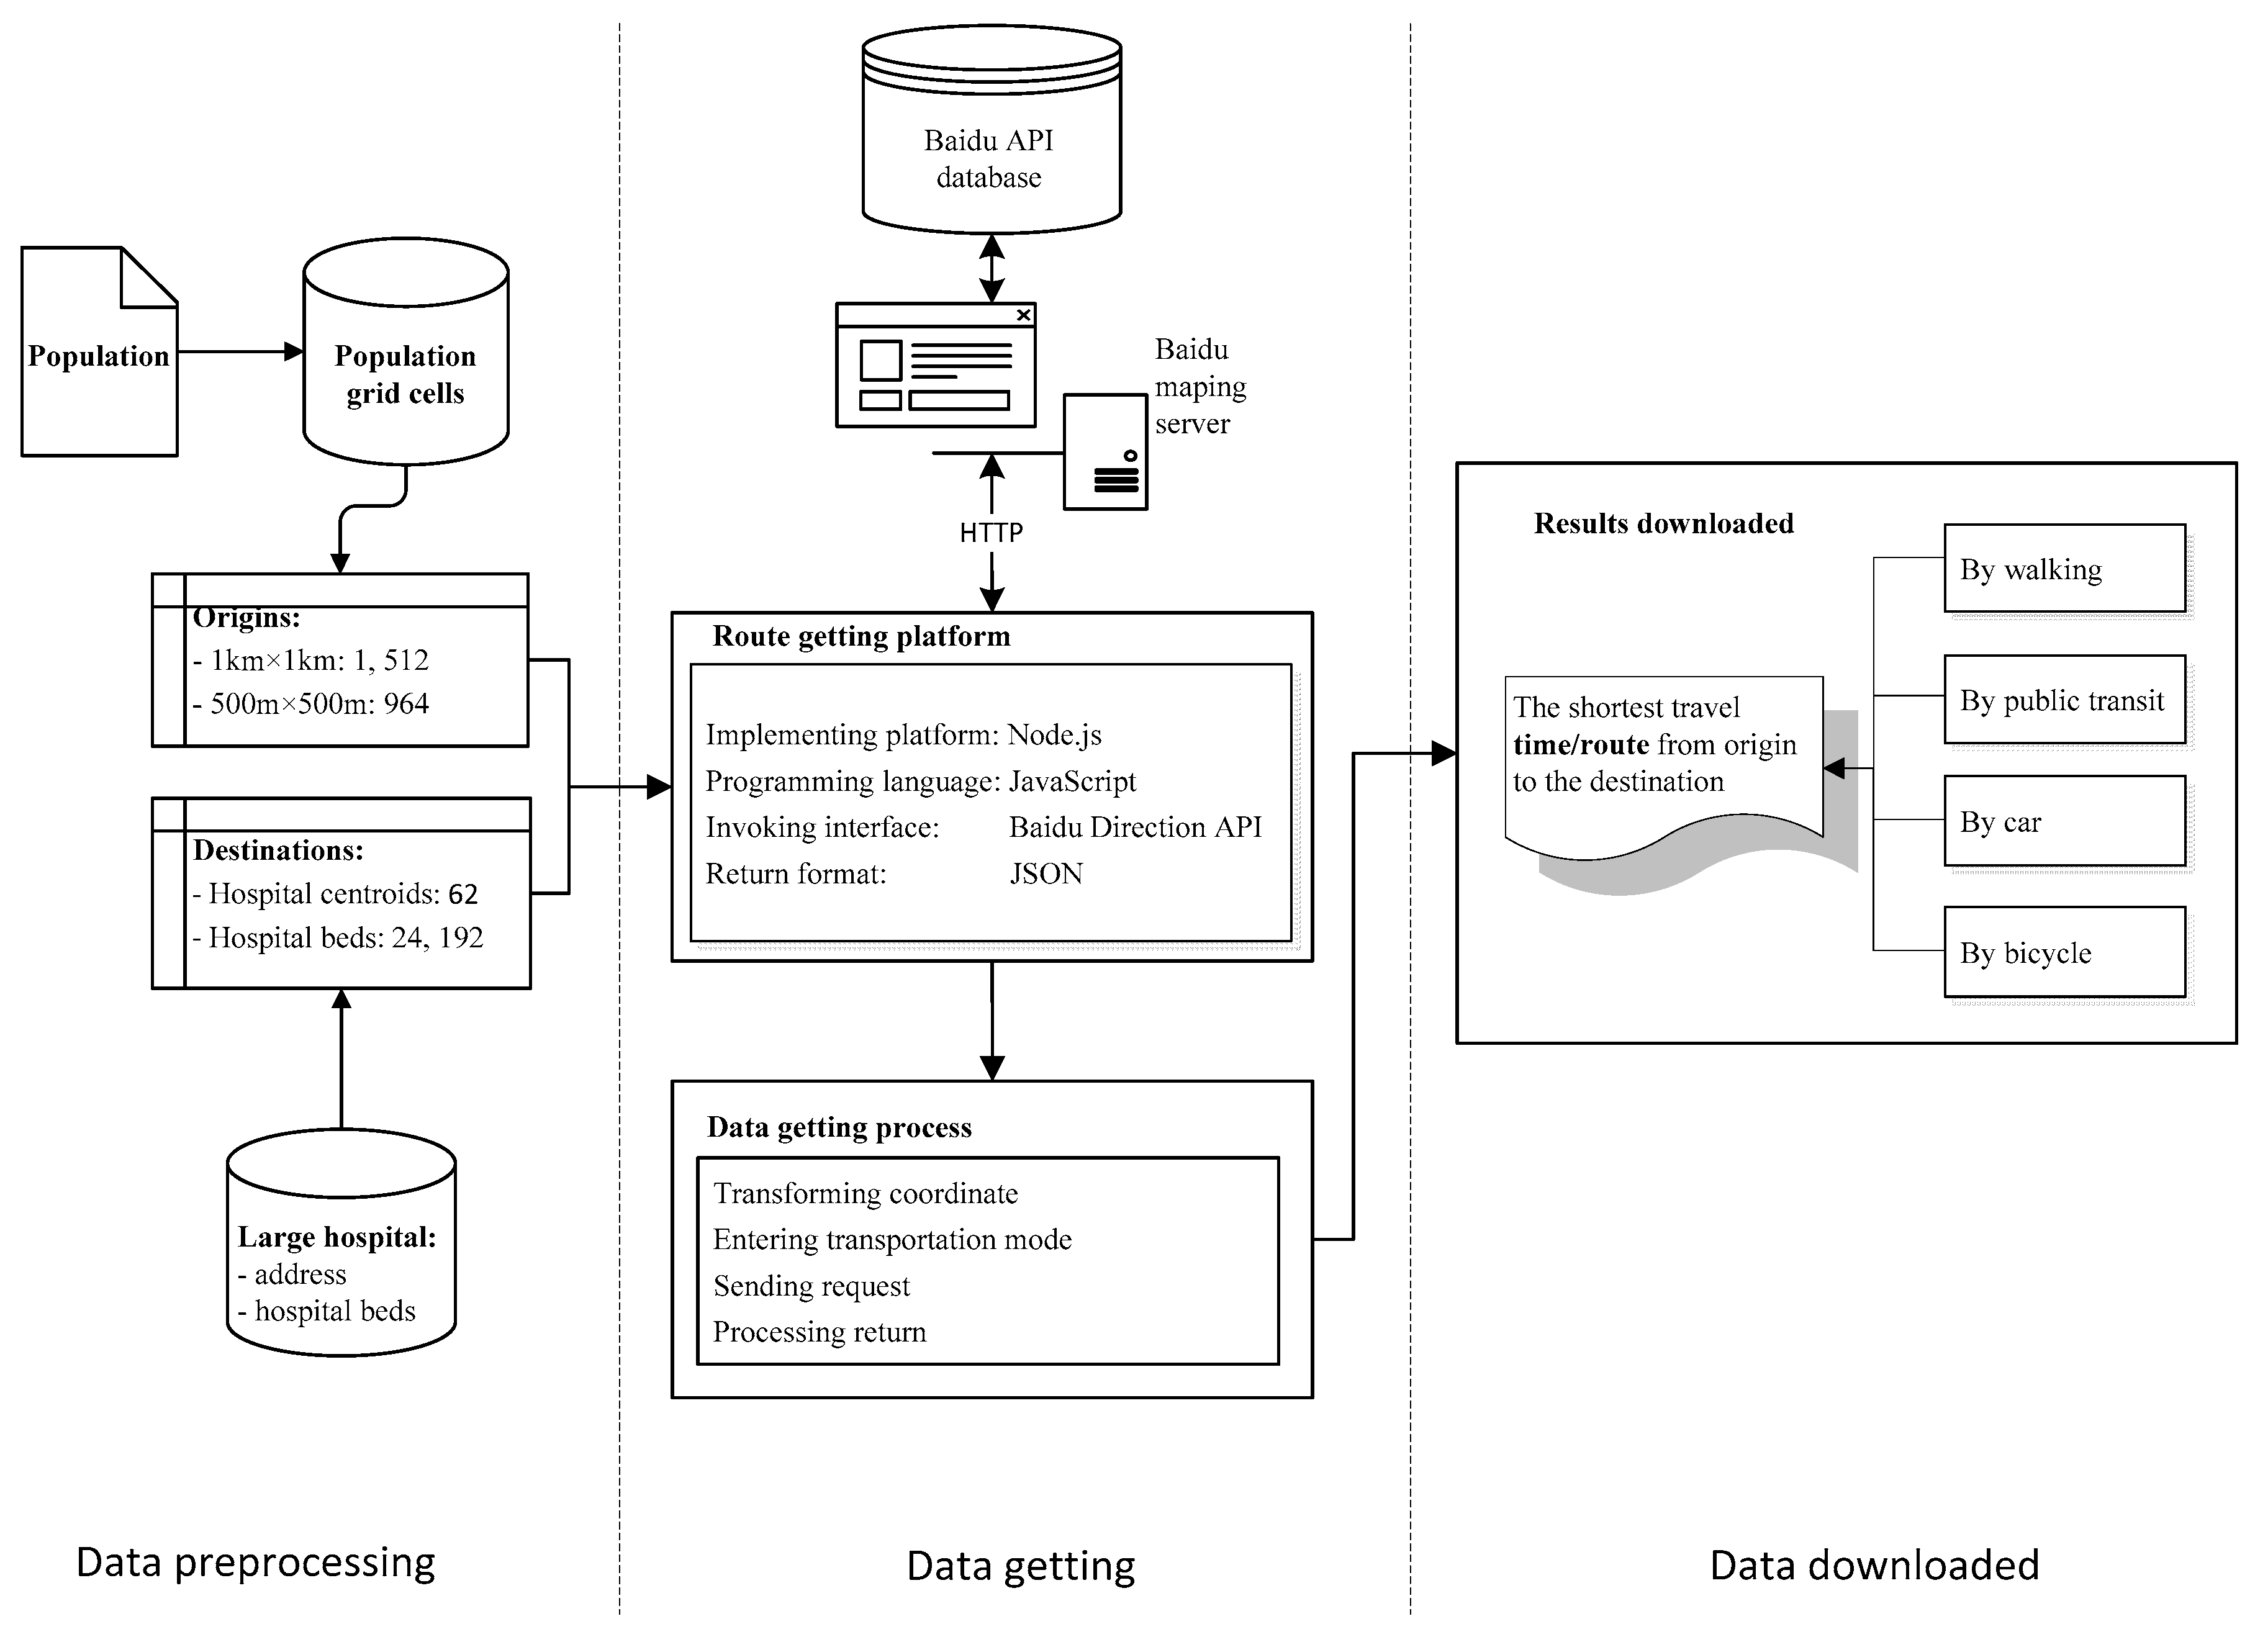
2.2. Door-to-Door Approaches of Multiple Transportation Modes
3. Case Study
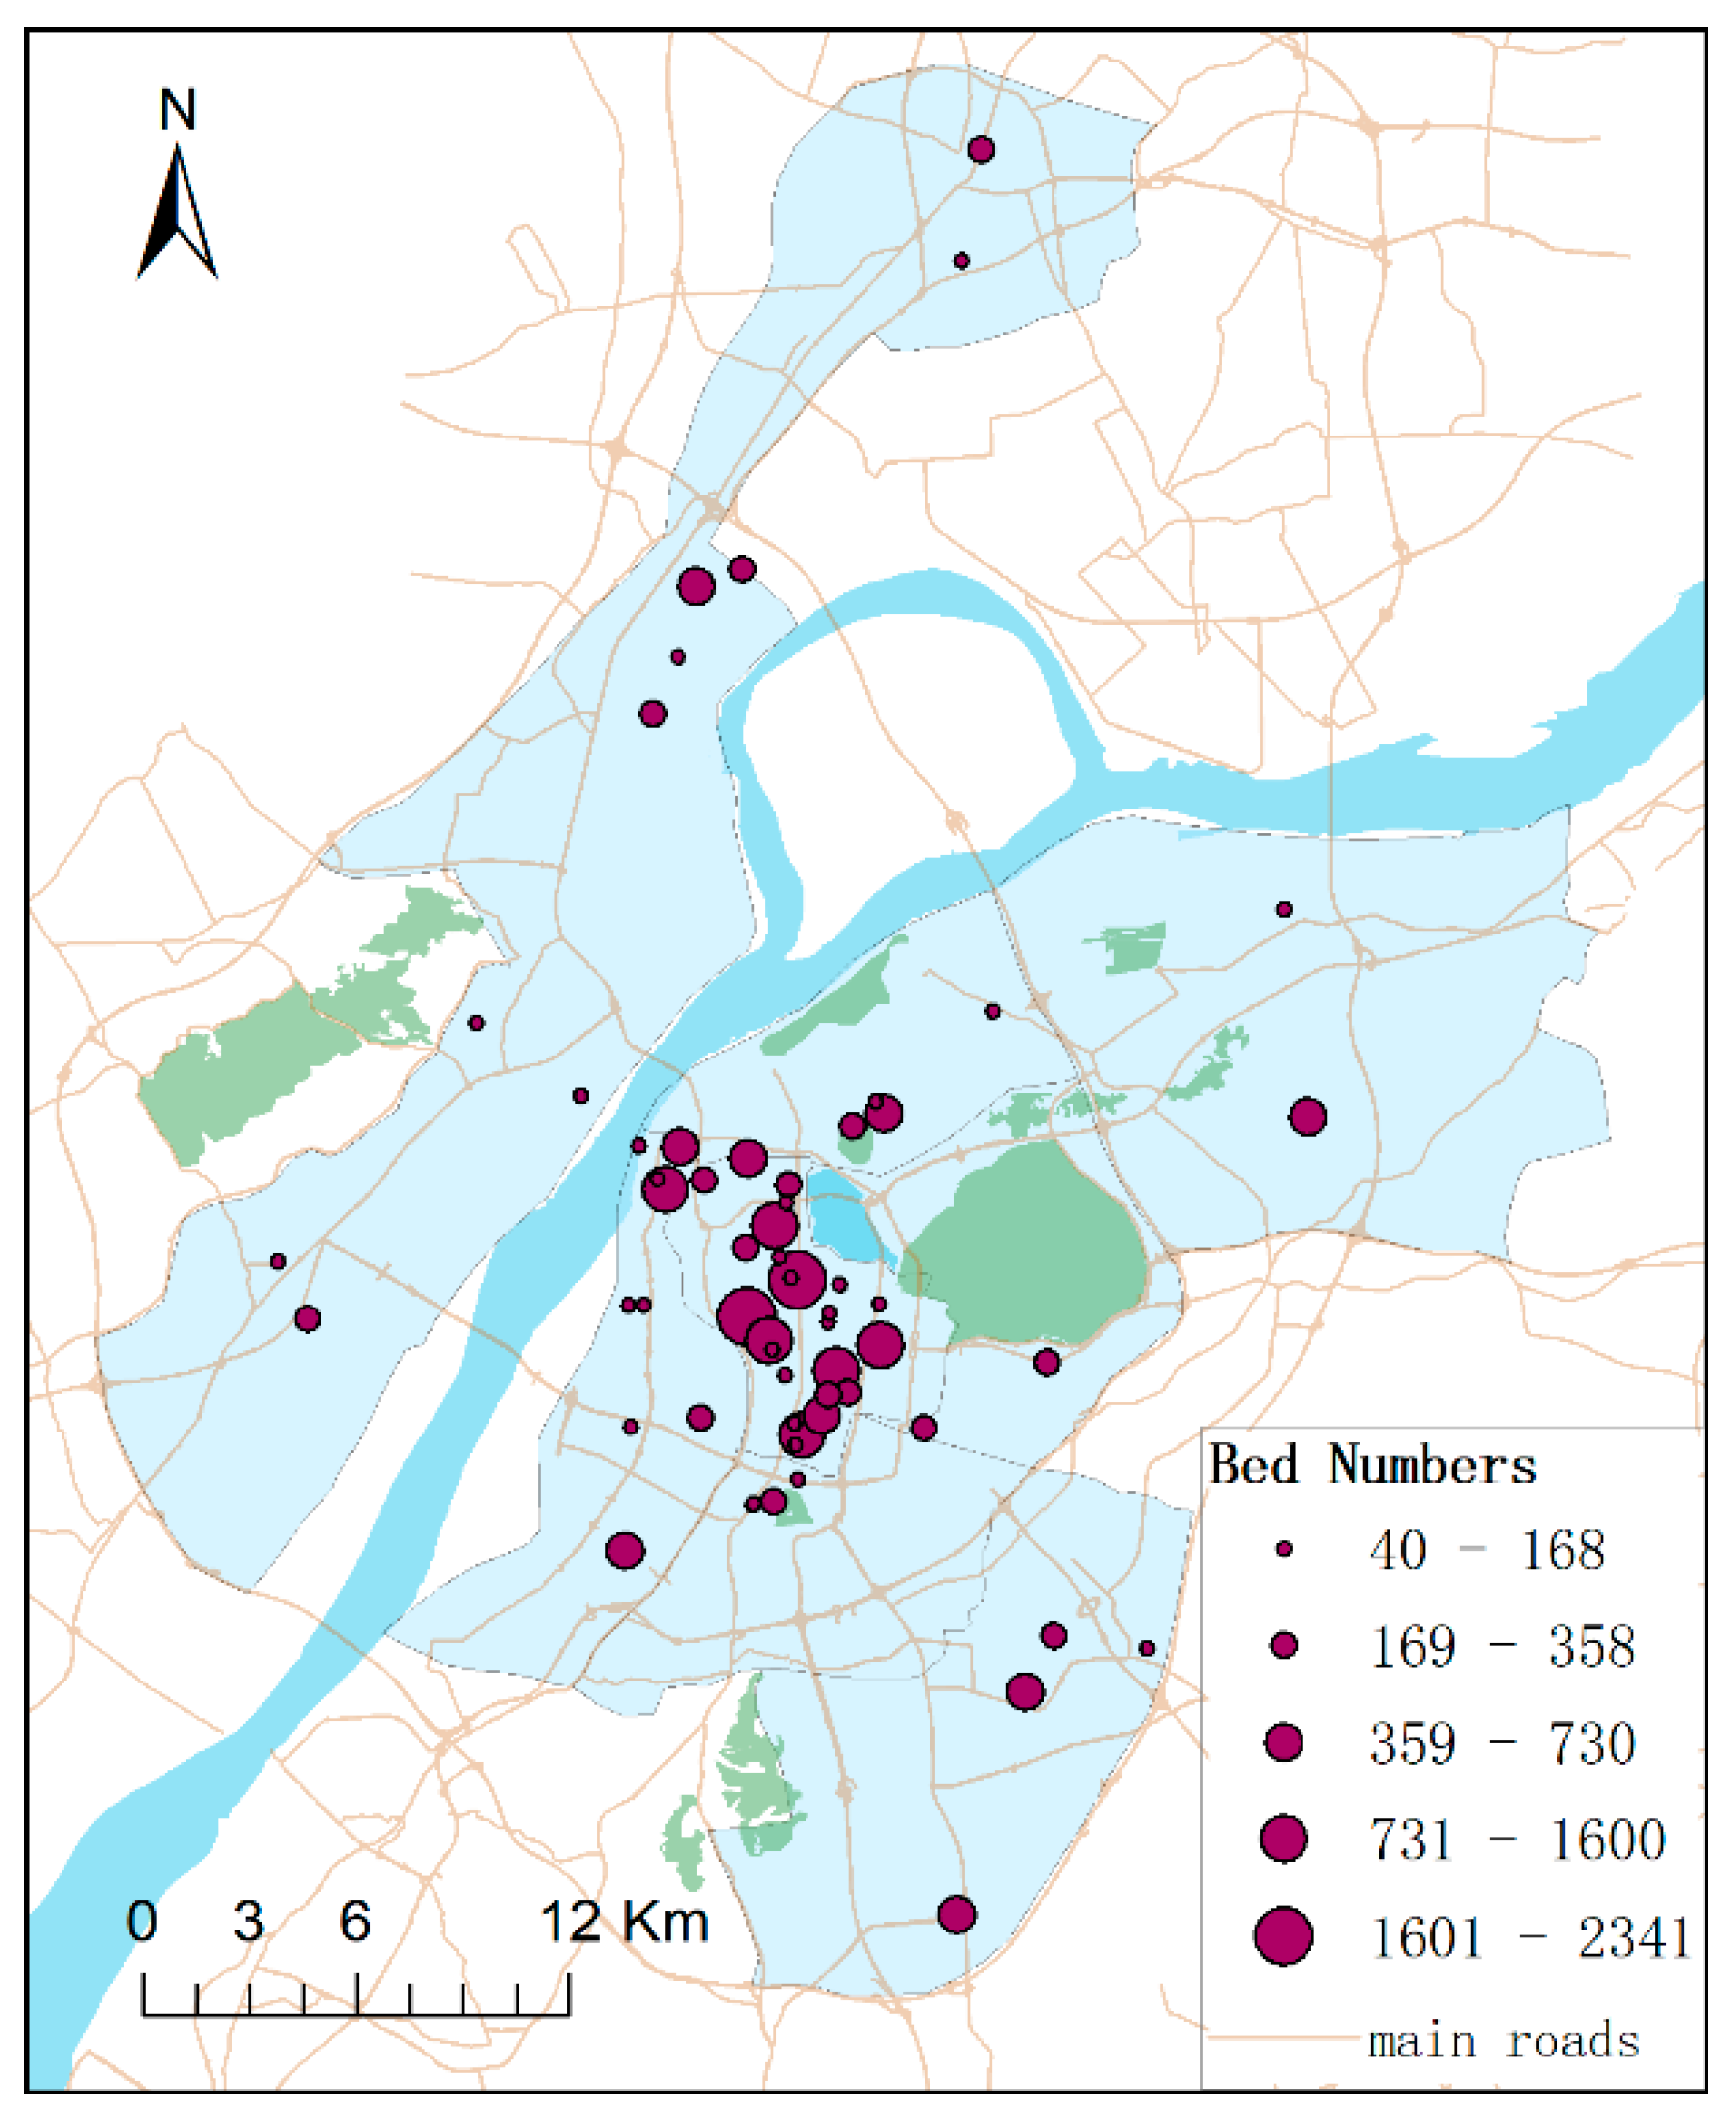
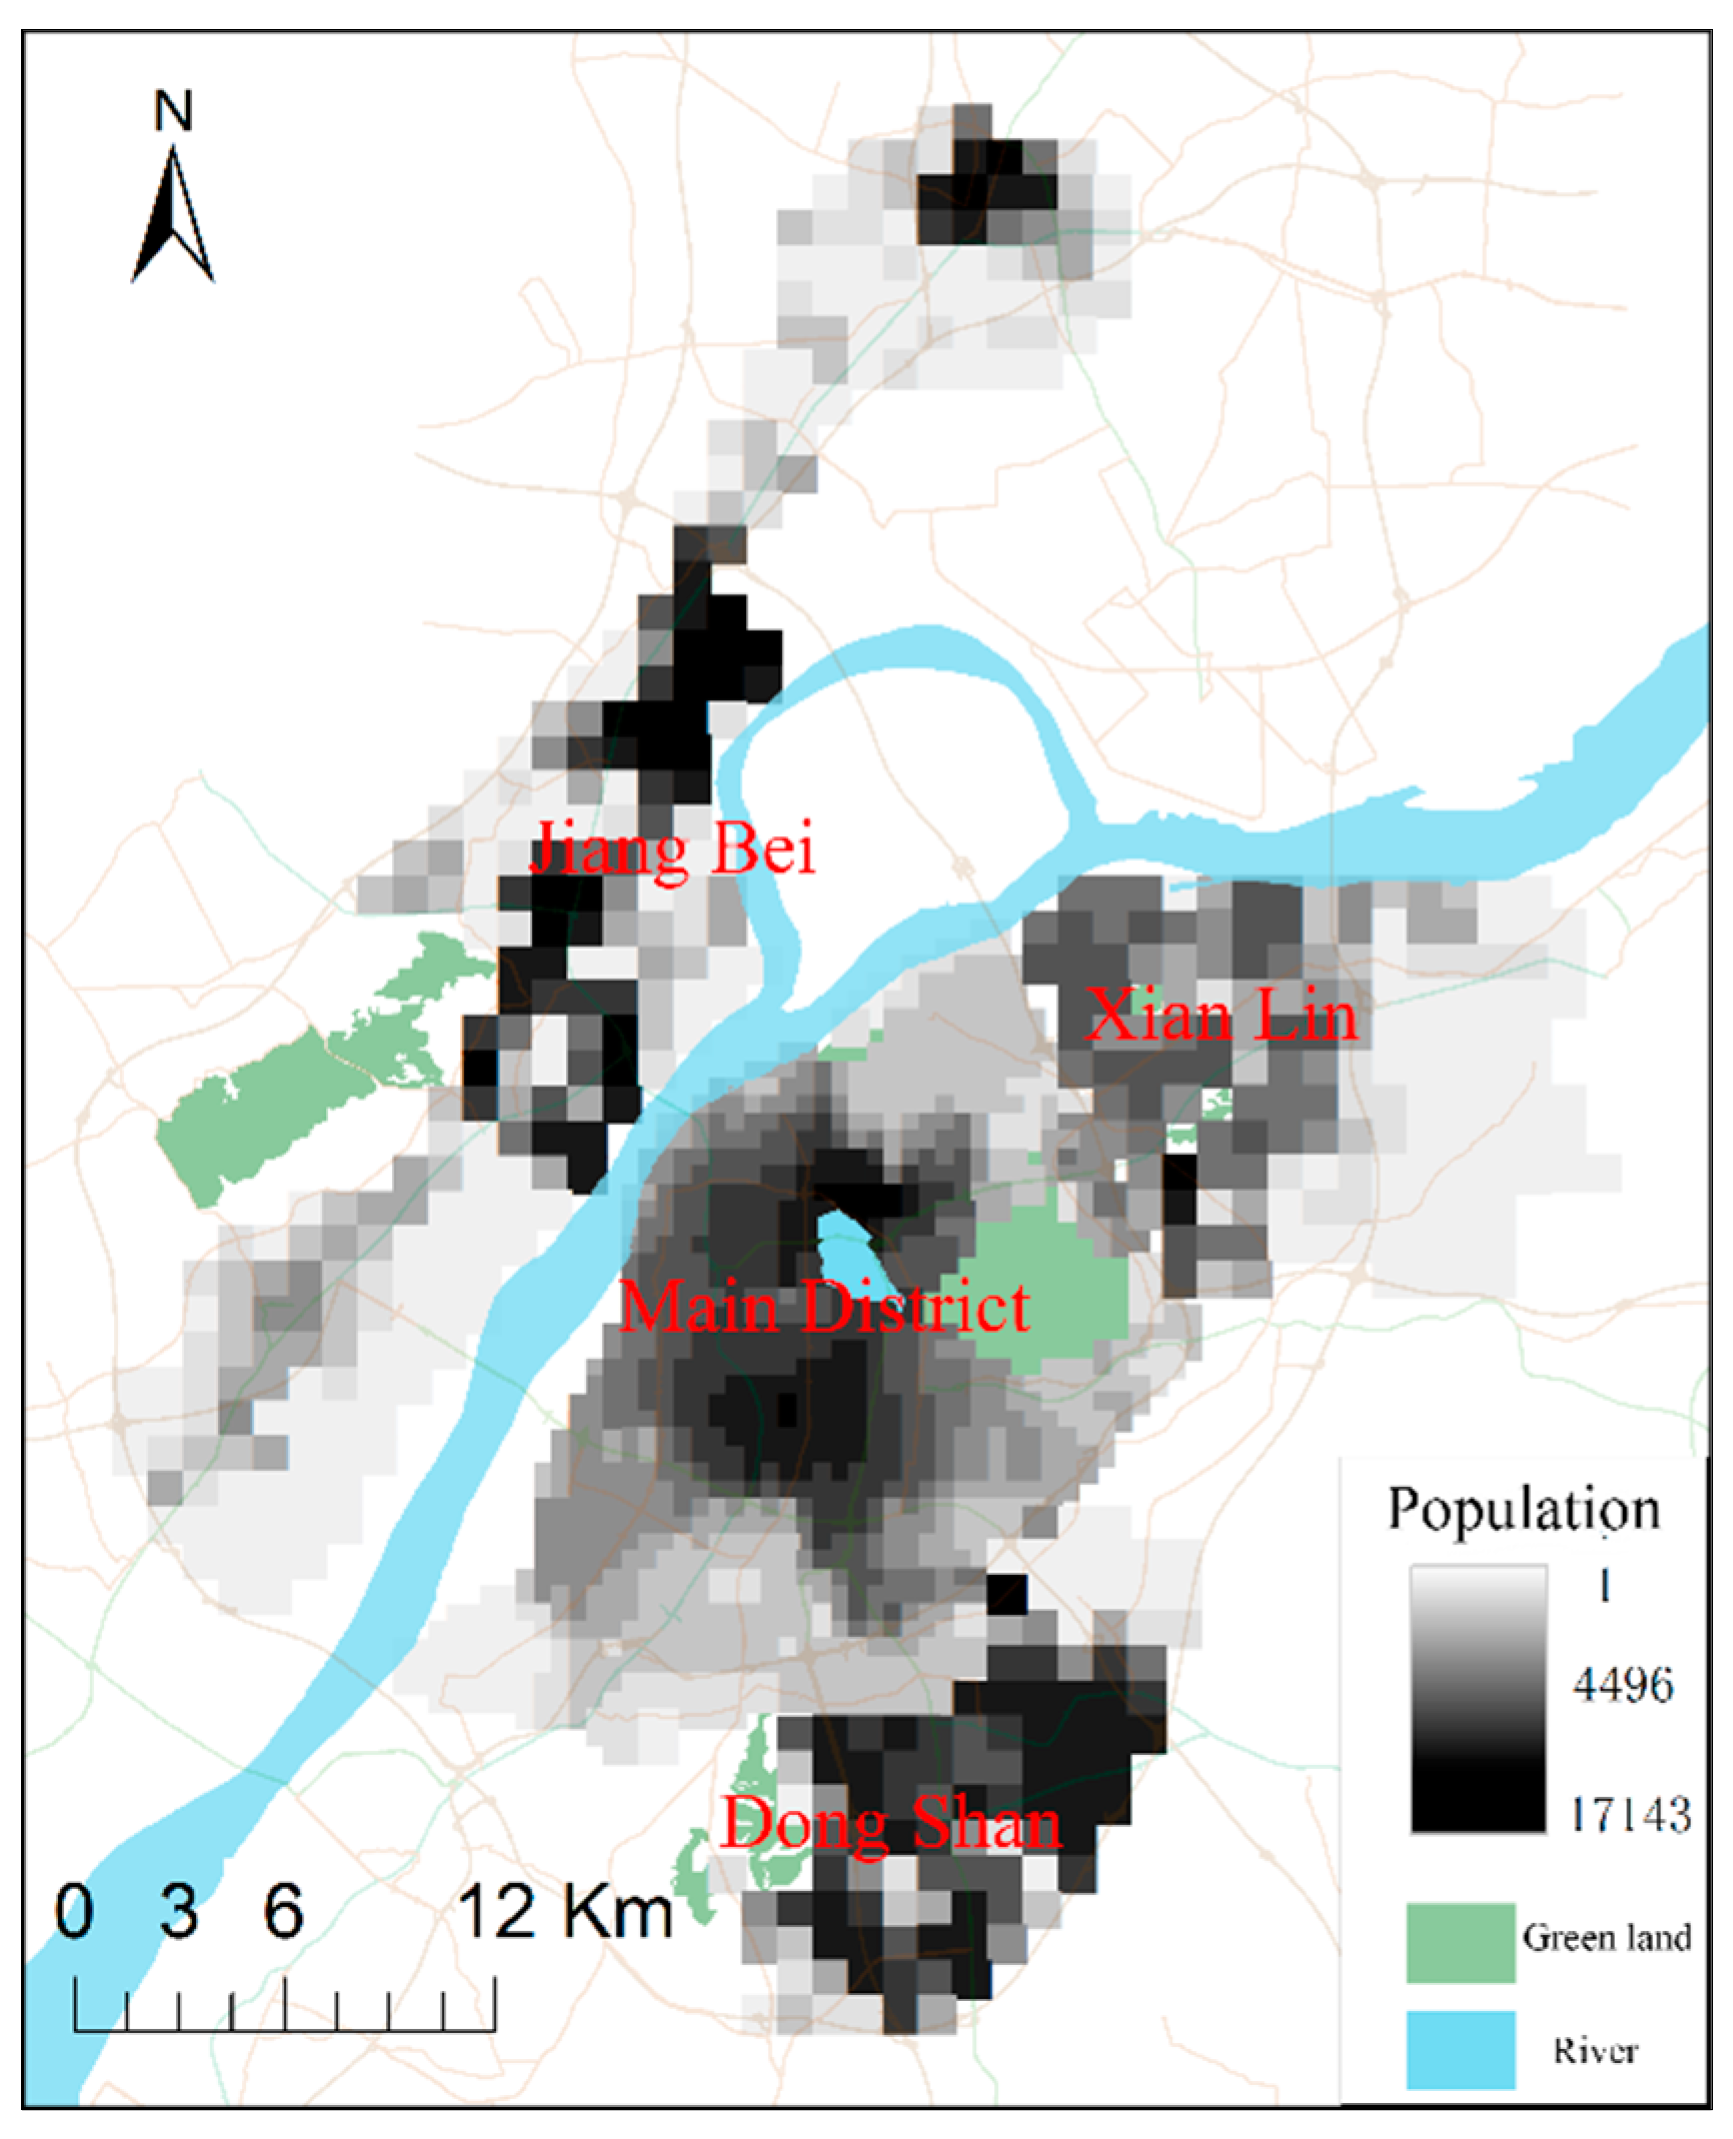
3.1. Study Area and Datasets
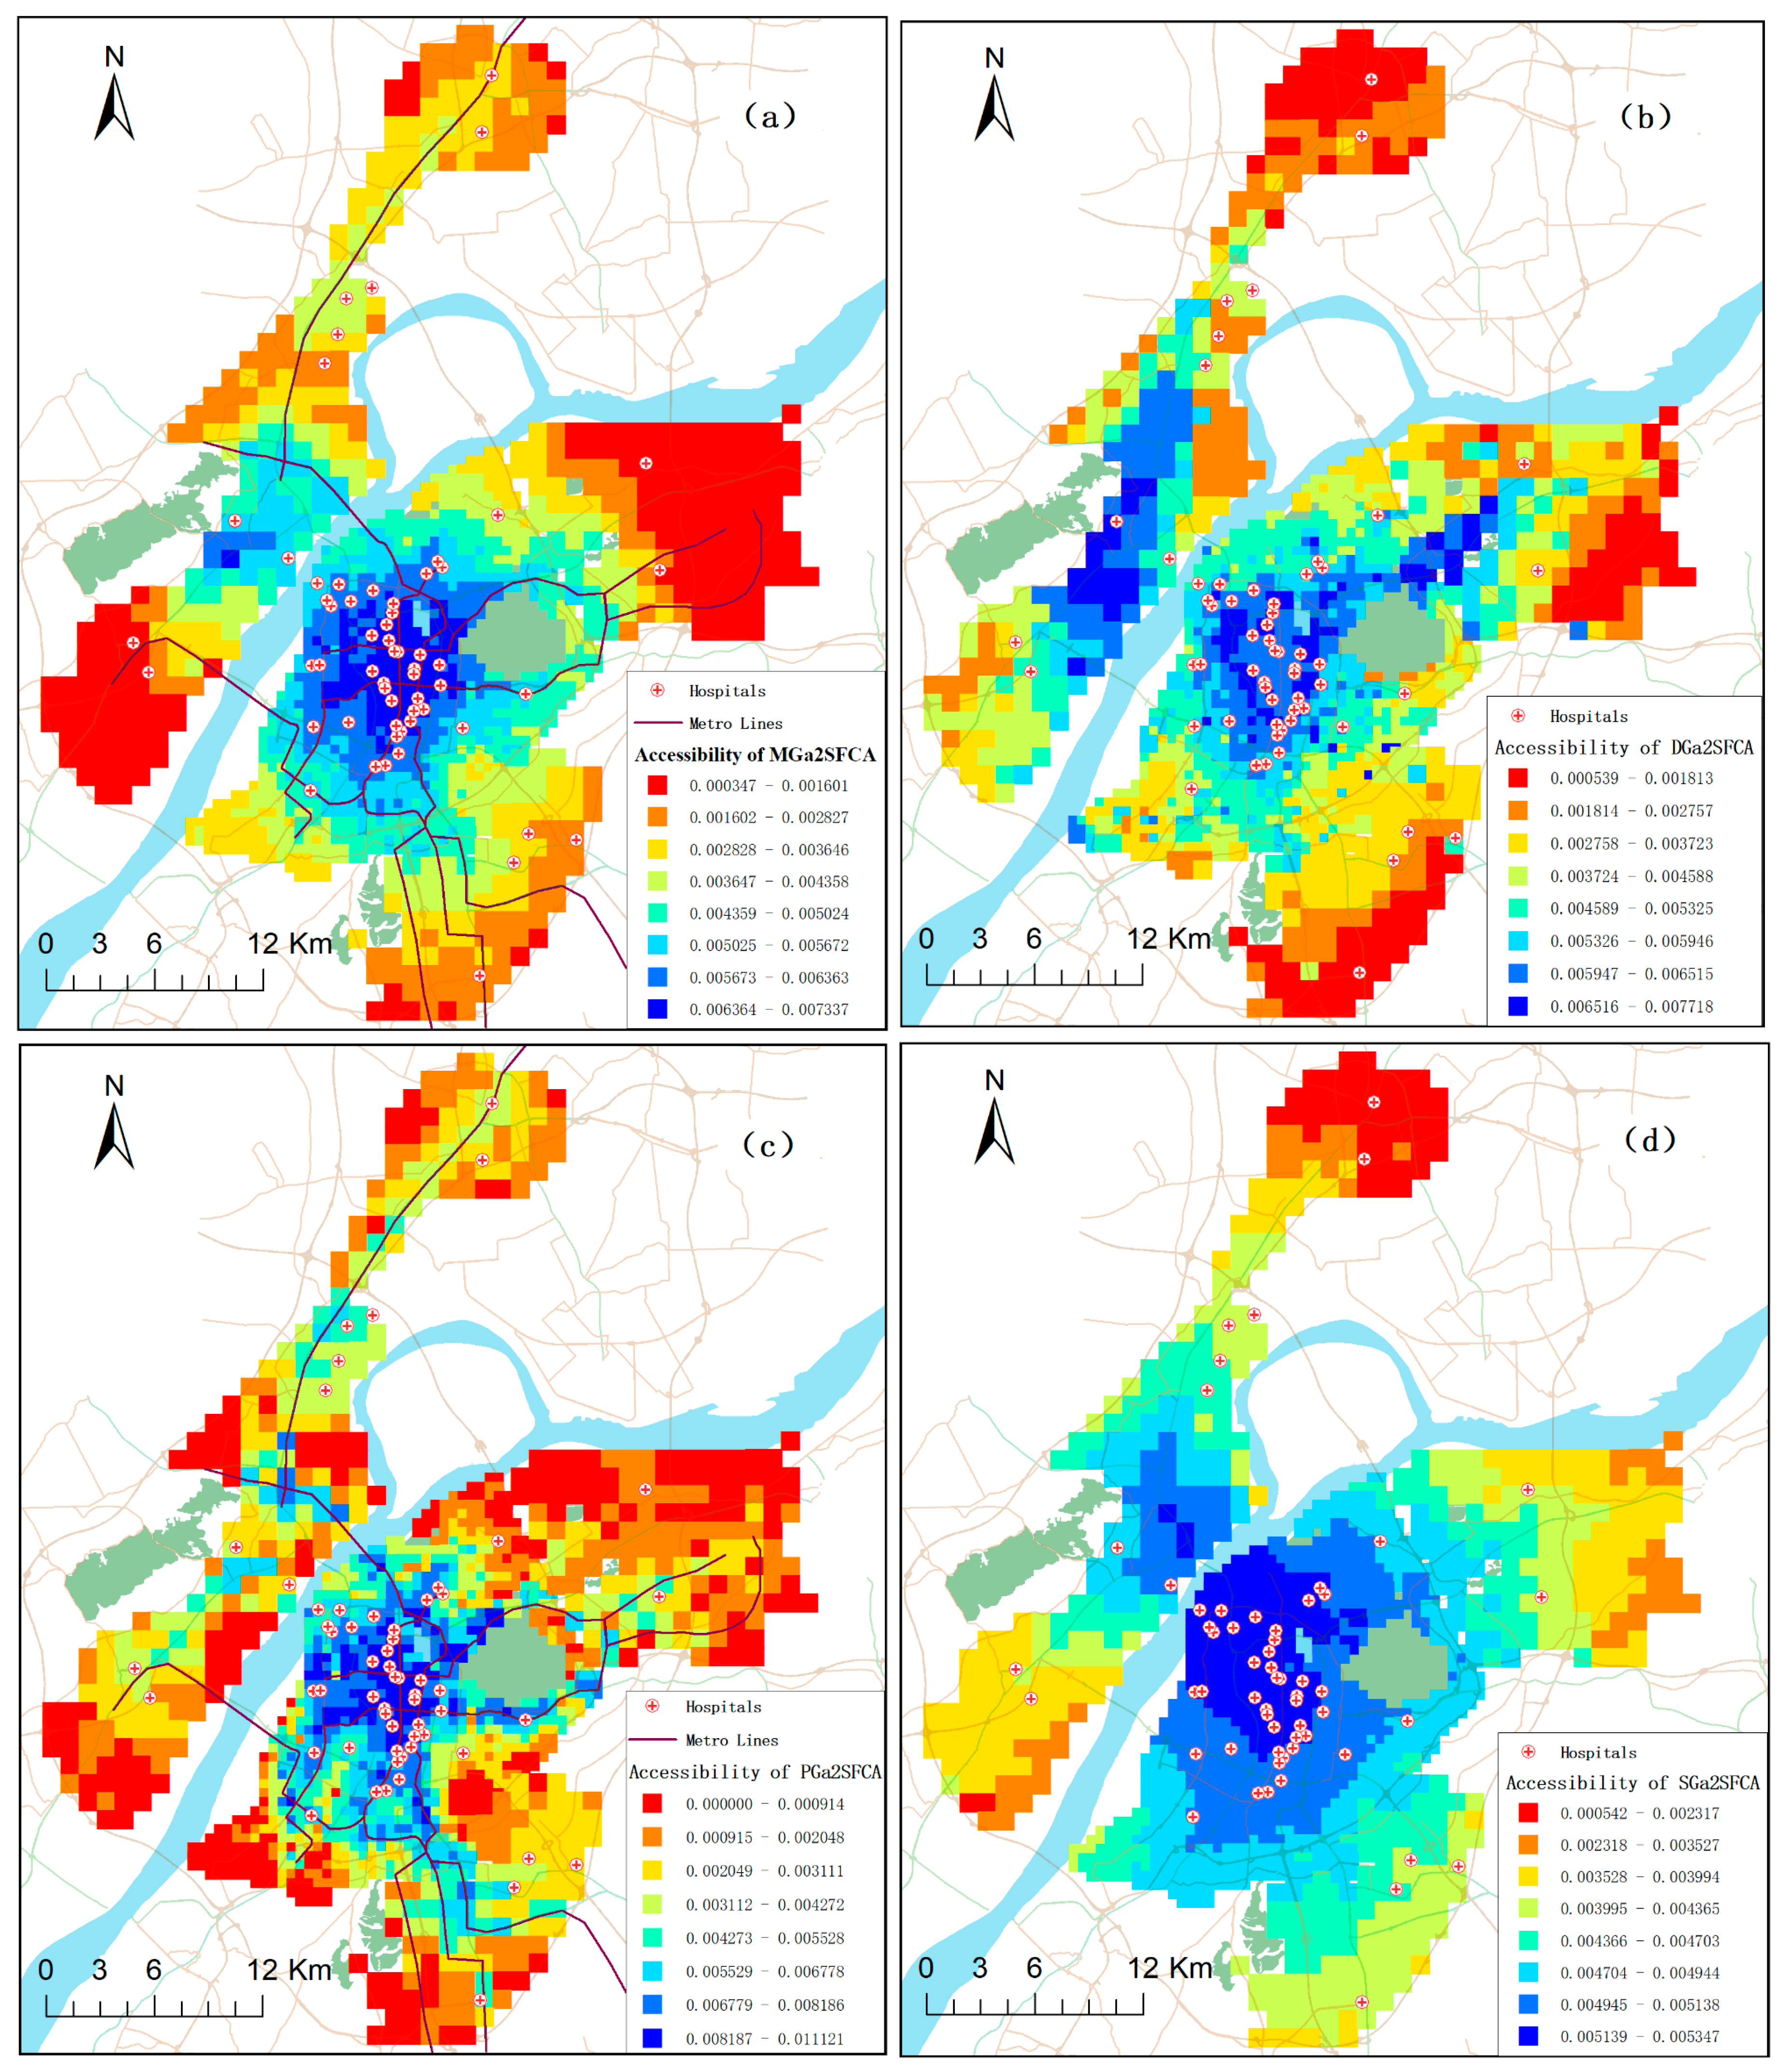
3.2. Results
4. Conclusions
Author Contributions
Funding
Conflicts of Interest
References
- Luo, W.; Wang, F. Measures of spatial accessibility to health care in a GIS environment: Synthesis and a case study in the Chicago Region. Environ. Plan. B 2003, 30, 865–884. [Google Scholar] [CrossRef]
- Luo, W.; Qi, Y. An enhanced two-step floating catchment area (E2SFCA) method for measuring spatial accessibility to primary care physicians. Health Place 2009, 15, 1100–1107. [Google Scholar] [CrossRef]
- Luo, W.; Whippo, T. Variable catchment sizes for the two-step floating catchment area (2SFCA) method. Health Place 2012, 18, 789–795. [Google Scholar] [CrossRef]
- Wan, N.; Zou, B.; Sternberg, T. A three-step floating catchment area method for analyzing spatial access to health services. Int. J. Geogr. Inf. Sci. 2012, 26, 1073–1089. [Google Scholar] [CrossRef]
- Delamater, P.L. Spatial accessibility in suboptimally configured health care systems: A modified two-step floating catchment area (M2SFCA) metric. Health Place 2013, 24, 30–43. [Google Scholar] [CrossRef]
- Luo, J. Integrating the Huff model and floating catchment area methods to analyze spatial access to healthcare services. Trans. GIS 2014, 18, 436–448. [Google Scholar] [CrossRef]
- Ni, J.; Wang, J.; Rui, Y.; Qian, T.; Wang, J. An enhanced variable two-step floating catchment area method for measuring spatial accessibility to residential care facilities in Nanjing. Int. J. Environ. Res. Public Health 2015, 12, 14490–14504. [Google Scholar] [CrossRef]
- McLafferty, S.; Grady, S. Prenatal care need and access: A GIS analysis. J. Med. Syst. 2004, 28, 321–333. [Google Scholar] [CrossRef]
- Dai, D.; Wang, F. Geographic disparities in accessibility to food stores in southwest Mississippi. Environ. Plan. B 2011, 38, 659–677. [Google Scholar] [CrossRef]
- Langford, M.; Fry, R.; Higgs, G. Measuring transit system accessibility using a modified two-step floating catchment technique. Int. J. Geogr. Inf. Sci. 2012, 26, 193–214. [Google Scholar] [CrossRef]
- Mao, L.; Nekorchuk, D. Measuring spatial accessibility to healthcare for populations with multiple transportation modes. Health Place 2013, 24, 115–122. [Google Scholar] [CrossRef]
- Langford, M.; Higgs, G.; Fry, R. Multi-modal two-step floating catchment area analysis of primary health care accessibility. Health Place 2016, 38, 70–81. [Google Scholar] [CrossRef] [PubMed]
- Mavoa, S.; Witten, K.; McCreanor, T.; O’Sullivan, D. GIS based destination accessibility via public transit and walking in Auckland, New Zealand. J. Transp. Geogr. 2012, 20, 15–22. [Google Scholar] [CrossRef]
- Salonen, M.; Toivonen, T. Modelling travel time in urban networks: Comparable measures for private car and public transport. J. Transp. Geogr. 2013, 31, 143–153. [Google Scholar] [CrossRef]
- Dony, C.C.; Delmelle, E.M.; Delmelle, E.C. Re-conceptualizing accessibility to parks in multi-modal cities: A Variable-width Floating Catchment Area (VFCA) method. Landsc. Urban Plan. 2015, 143, 90–99. [Google Scholar] [CrossRef]
- Benenson, I.; Ben-Elia, E.; Rofé, Y.; Geyzersky, D. The benefits of a high-resolution analysis of transit accessibility. Int. J. Geogr. Inf. Sci. 2017, 31, 213–236. [Google Scholar] [CrossRef]
- Christie, S.; Fone, D. Equity of access to tertiary hospitals in Wales: A travel time analysis. J. Public Health 2003, 25, 344–350. [Google Scholar] [CrossRef]
- Martin, D.; Jordan, H.; Roderick, P. Taking the bus: Incorporating public transport timetable data into health care accessibility modelling. Environ. Plan. A 2008, 40, 2510–2525. [Google Scholar] [CrossRef]
- Yiannakoulias, N.; Bland, W.; Svenson, L.W. Estimating the effect of turn penalties and traffic congestion on measuring spatial accessibility to primary health care. Appl. Geogr. 2013, 39, 172–182. [Google Scholar] [CrossRef]
- Ivan, I.; Horak, J.; Fojtik, D.; Inspektor, T. Evaluation of public transport accessibility at municipality level in the Czech Republic. In Proceedings of the International Multidisciplinary Scientific GeoConference: SGEM: Surveying Geology & mining Ecology Management, Albena, Bulgaria, 16–22 June 2013. [Google Scholar]
- Tao, Z.; Yao, Z.; Kong, H.; Duan, F.; Li, G. Spatial accessibility to healthcare services in Shenzhen, China: Improving the multi-modal two-step floating catchment area method by estimating travel time via online map APIs. BMC Health Serv. Res. 2018, 18, 345. [Google Scholar] [CrossRef]
- Liu, S.; Zhu, X. Accessibility analyst: An integrated GIS tool for accessibility analysis in urban transportation planning. Environ. Plan. 2004, 31, 105–124. [Google Scholar] [CrossRef]
- Lei, T.L.; Church, R.L. Mapping transit-based access: Integrating GIS, routes and schedules. Int. J. Geogr. Inf. Sci. 2010, 24, 283–304. [Google Scholar] [CrossRef]
- Benenson, I.; Martens, K.; Rofé, Y.; Kwartler, A. Public transport versus private car GIS-based estimation of accessibility applied to the Tel Aviv metropolitan area. Ann. Reg. Sci. 2011, 47, 499–515. [Google Scholar] [CrossRef]
- Tribby, C.P.; Zandbergen, P.A. High-resolution spatio-temporal modeling of public transit accessibility. Appl. Geogr. 2012, 34, 345–355. [Google Scholar] [CrossRef]
- Baidu Maps. Available online: http://map.baidu.com (accessed on 4 January 2019).
- Google Maps. Available online: https://www.google.com/maps (accessed on 4 January 2019).
- Bing Maps. Available online: https://cn.bing.com/ditu (accessed on 4 January 2019).
- Cai, E.; Liu, Y.; Jing, Y.; Zhang, L.; Li, J.; Yin, C. Assessing spatial accessibility of public and private residential aged care facilities: A case study in Wuhan, Central China. ISPRS Int. J. Geo Inf. 2017, 6, 304. [Google Scholar]
- Survey of Travel to Healthcare Service in Nanjing Urban Areas. Available online: https://sojump.com/jq/11835390.aspx (accessed on 4 January 2019).
- Zhang, F.; Liu, B.; Bi, J.; Chen, J. Traffic alternatives for urban residents and affecting factors: A case of Nanjing city. Sichuan Environ. 2012, 31, 132–138. [Google Scholar]
- Chen, X.; Gu, X. The fifth travel survey of residents in Shanghai and characteristics analysis. Urban Transp. China 2011, 9, 1–7. [Google Scholar]
- Tao, Z.; Cheng, Y.; Dai, T.; Rosenberg, M.W. Spatial optimization of residential care facility locations in Beijing, China: Maximum equity in accessibility. Int. J. Health Geogr. 2014, 13, 33. [Google Scholar] [CrossRef]


| Distance Sections | W | B | D | PT | EB | MB | Total |
|---|---|---|---|---|---|---|---|
| 0–1 km | 51 | 11 | 7 | 3 | 20 | 8 | 100% |
| 1–3 km | 21 | 14 | 16 | 17 | 23 | 9 | 100% |
| 3–5 km | 1 | 8 | 32 | 28 | 19 | 12 | 100% |
| 5–15 km | 0 | 2 | 41 | 36 | 10 | 11 | 100% |
| 15–25 km | 0 | 0 | 48 | 37 | 6 | 9 | 100% |
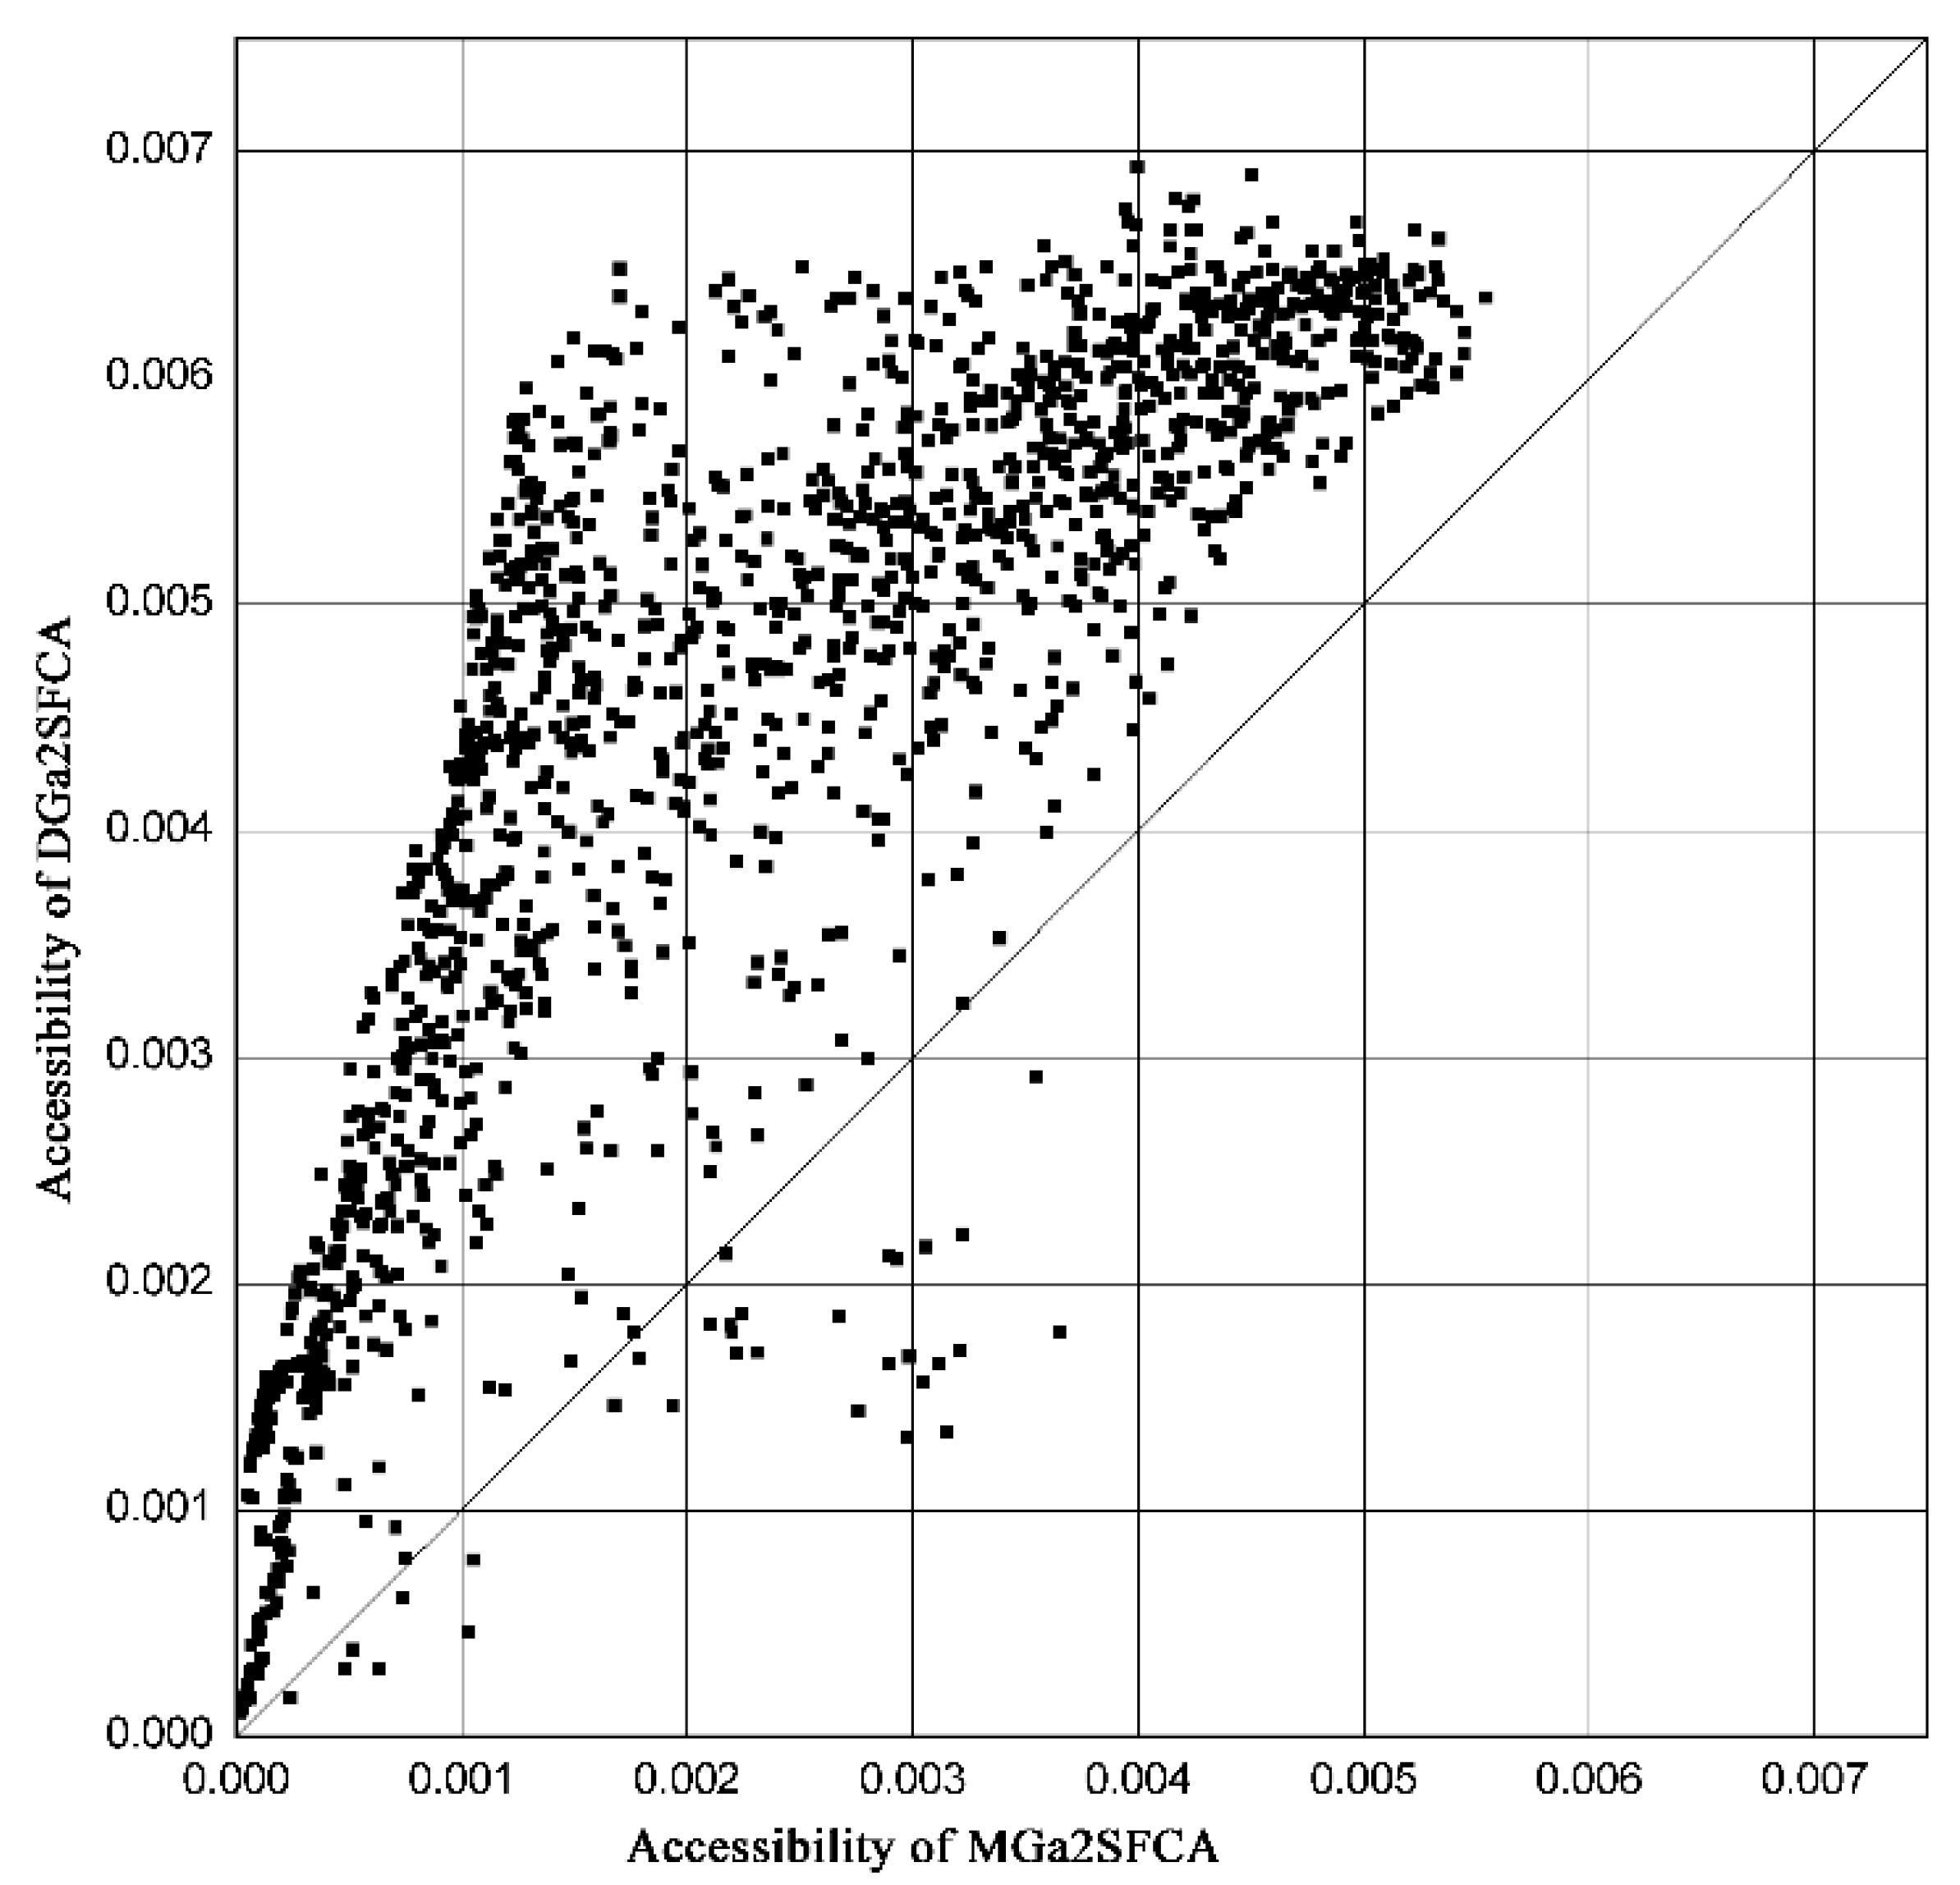
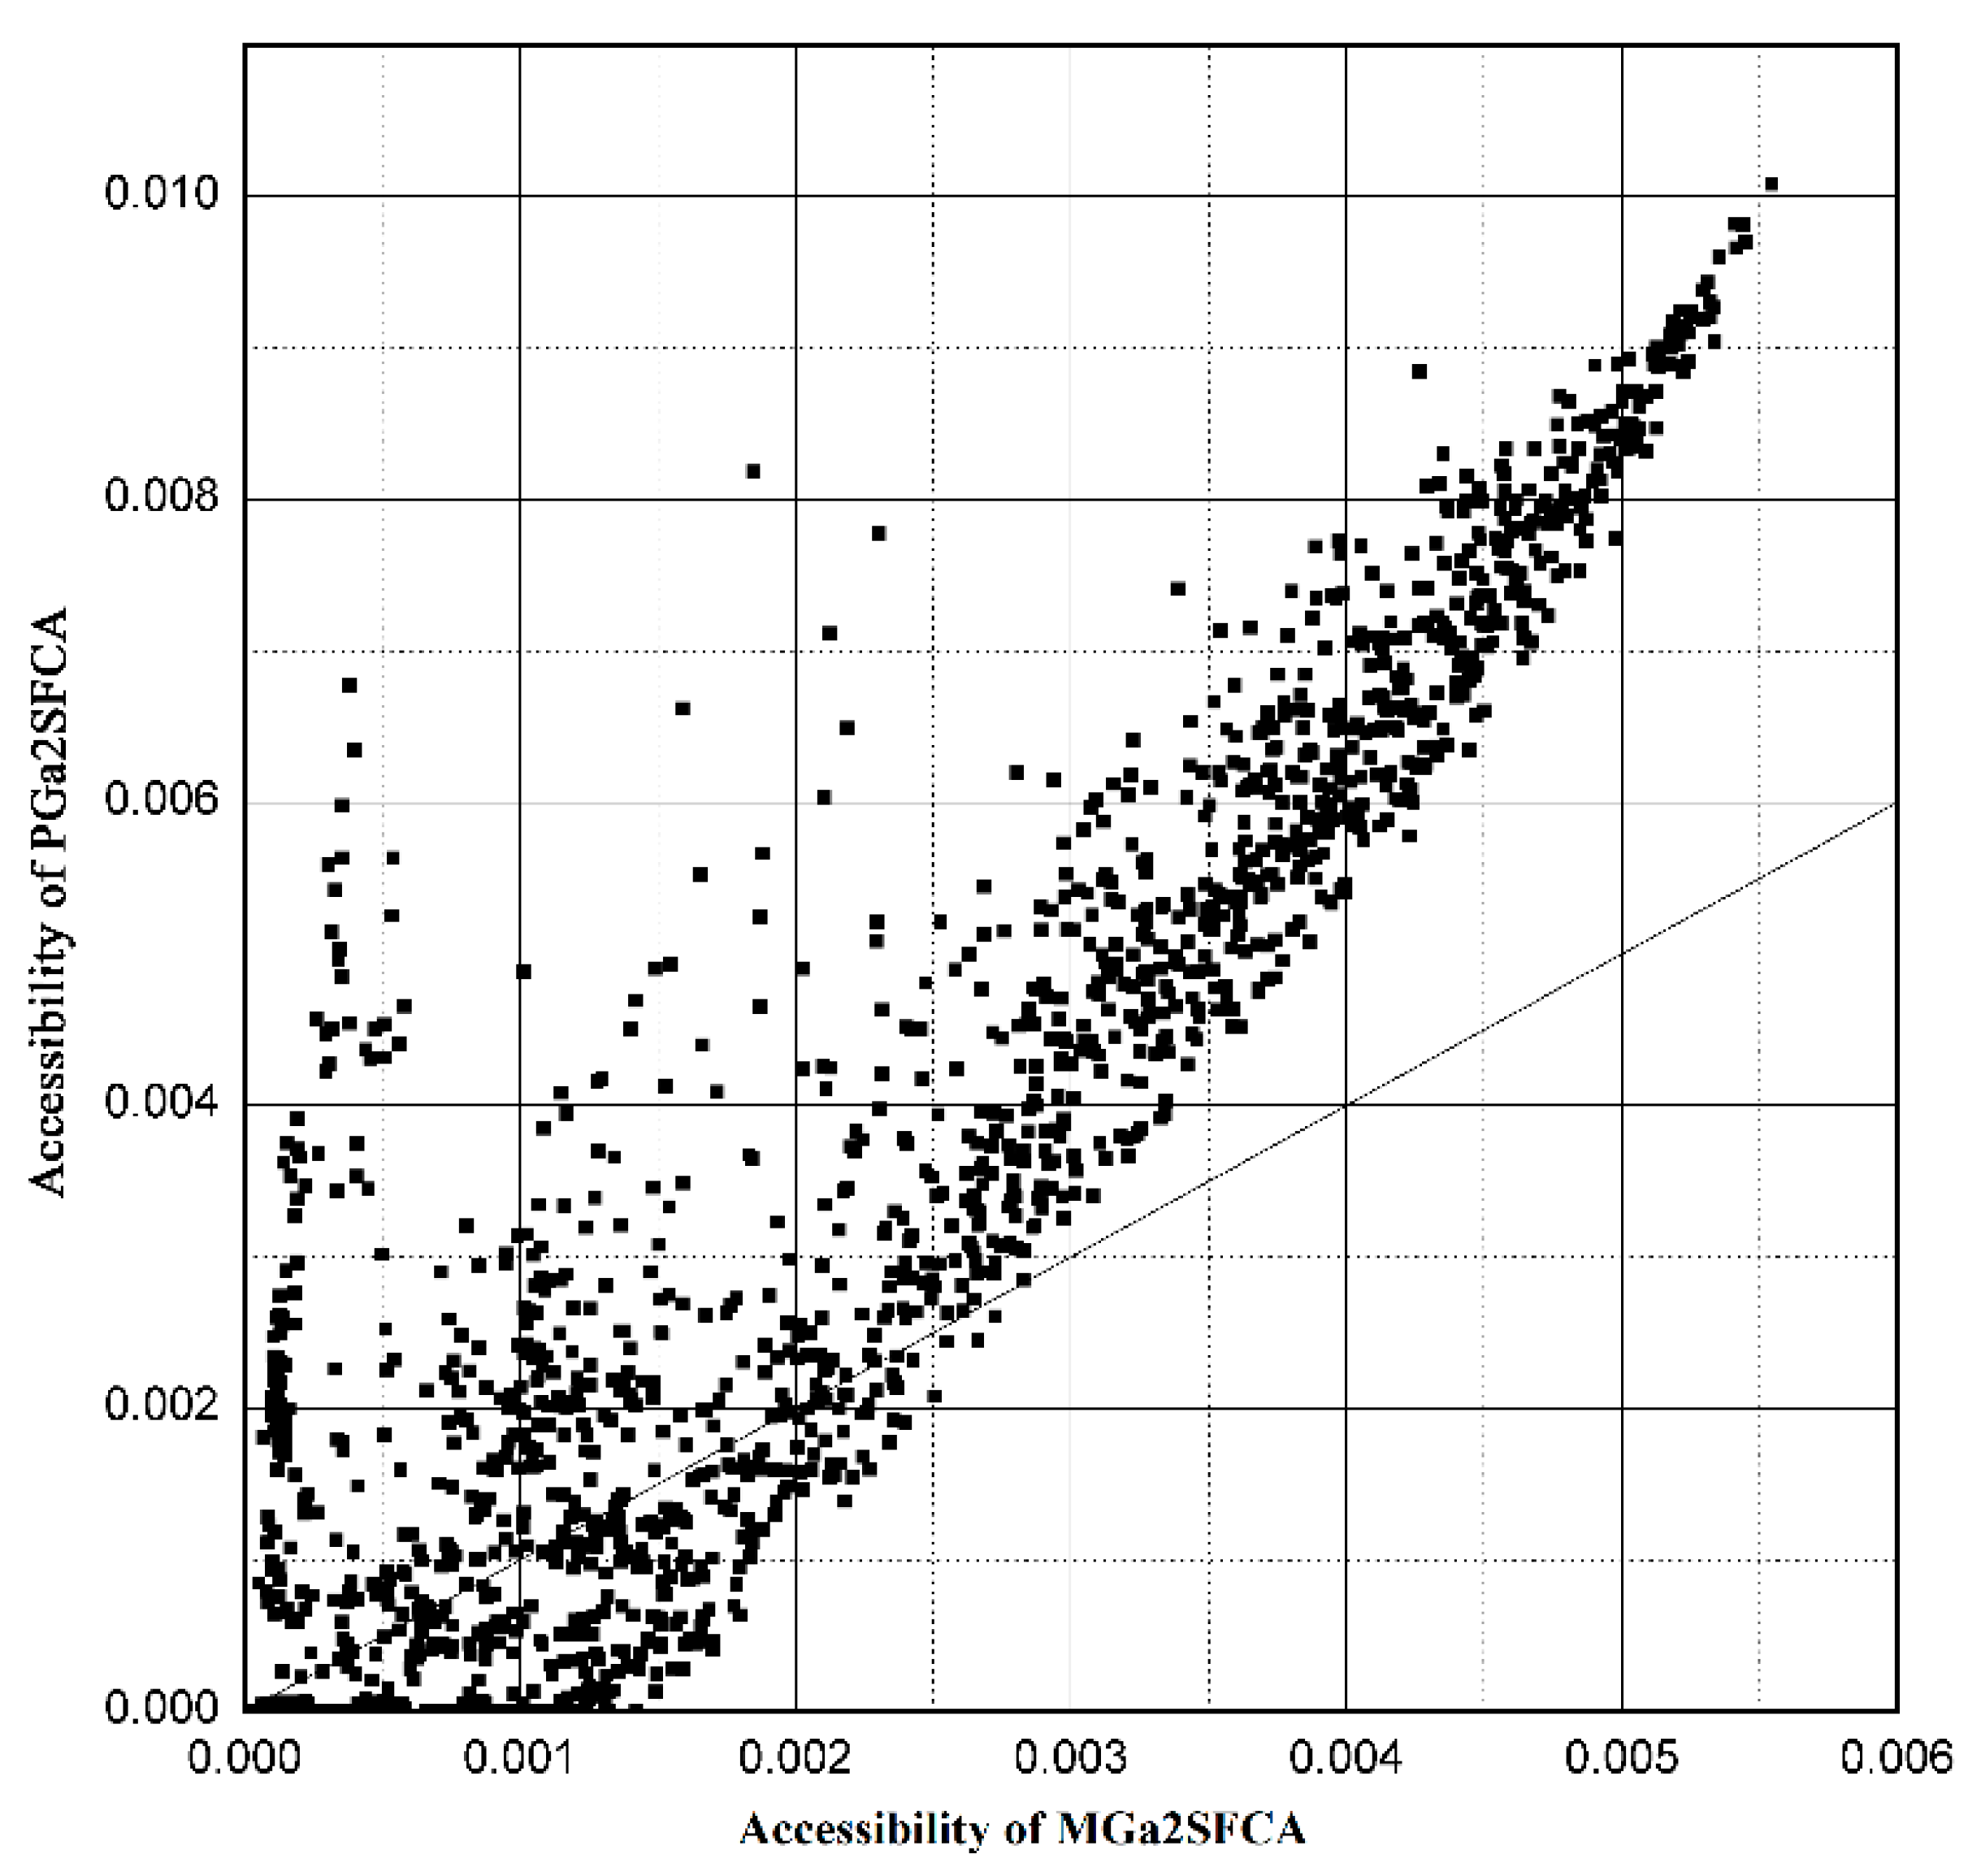
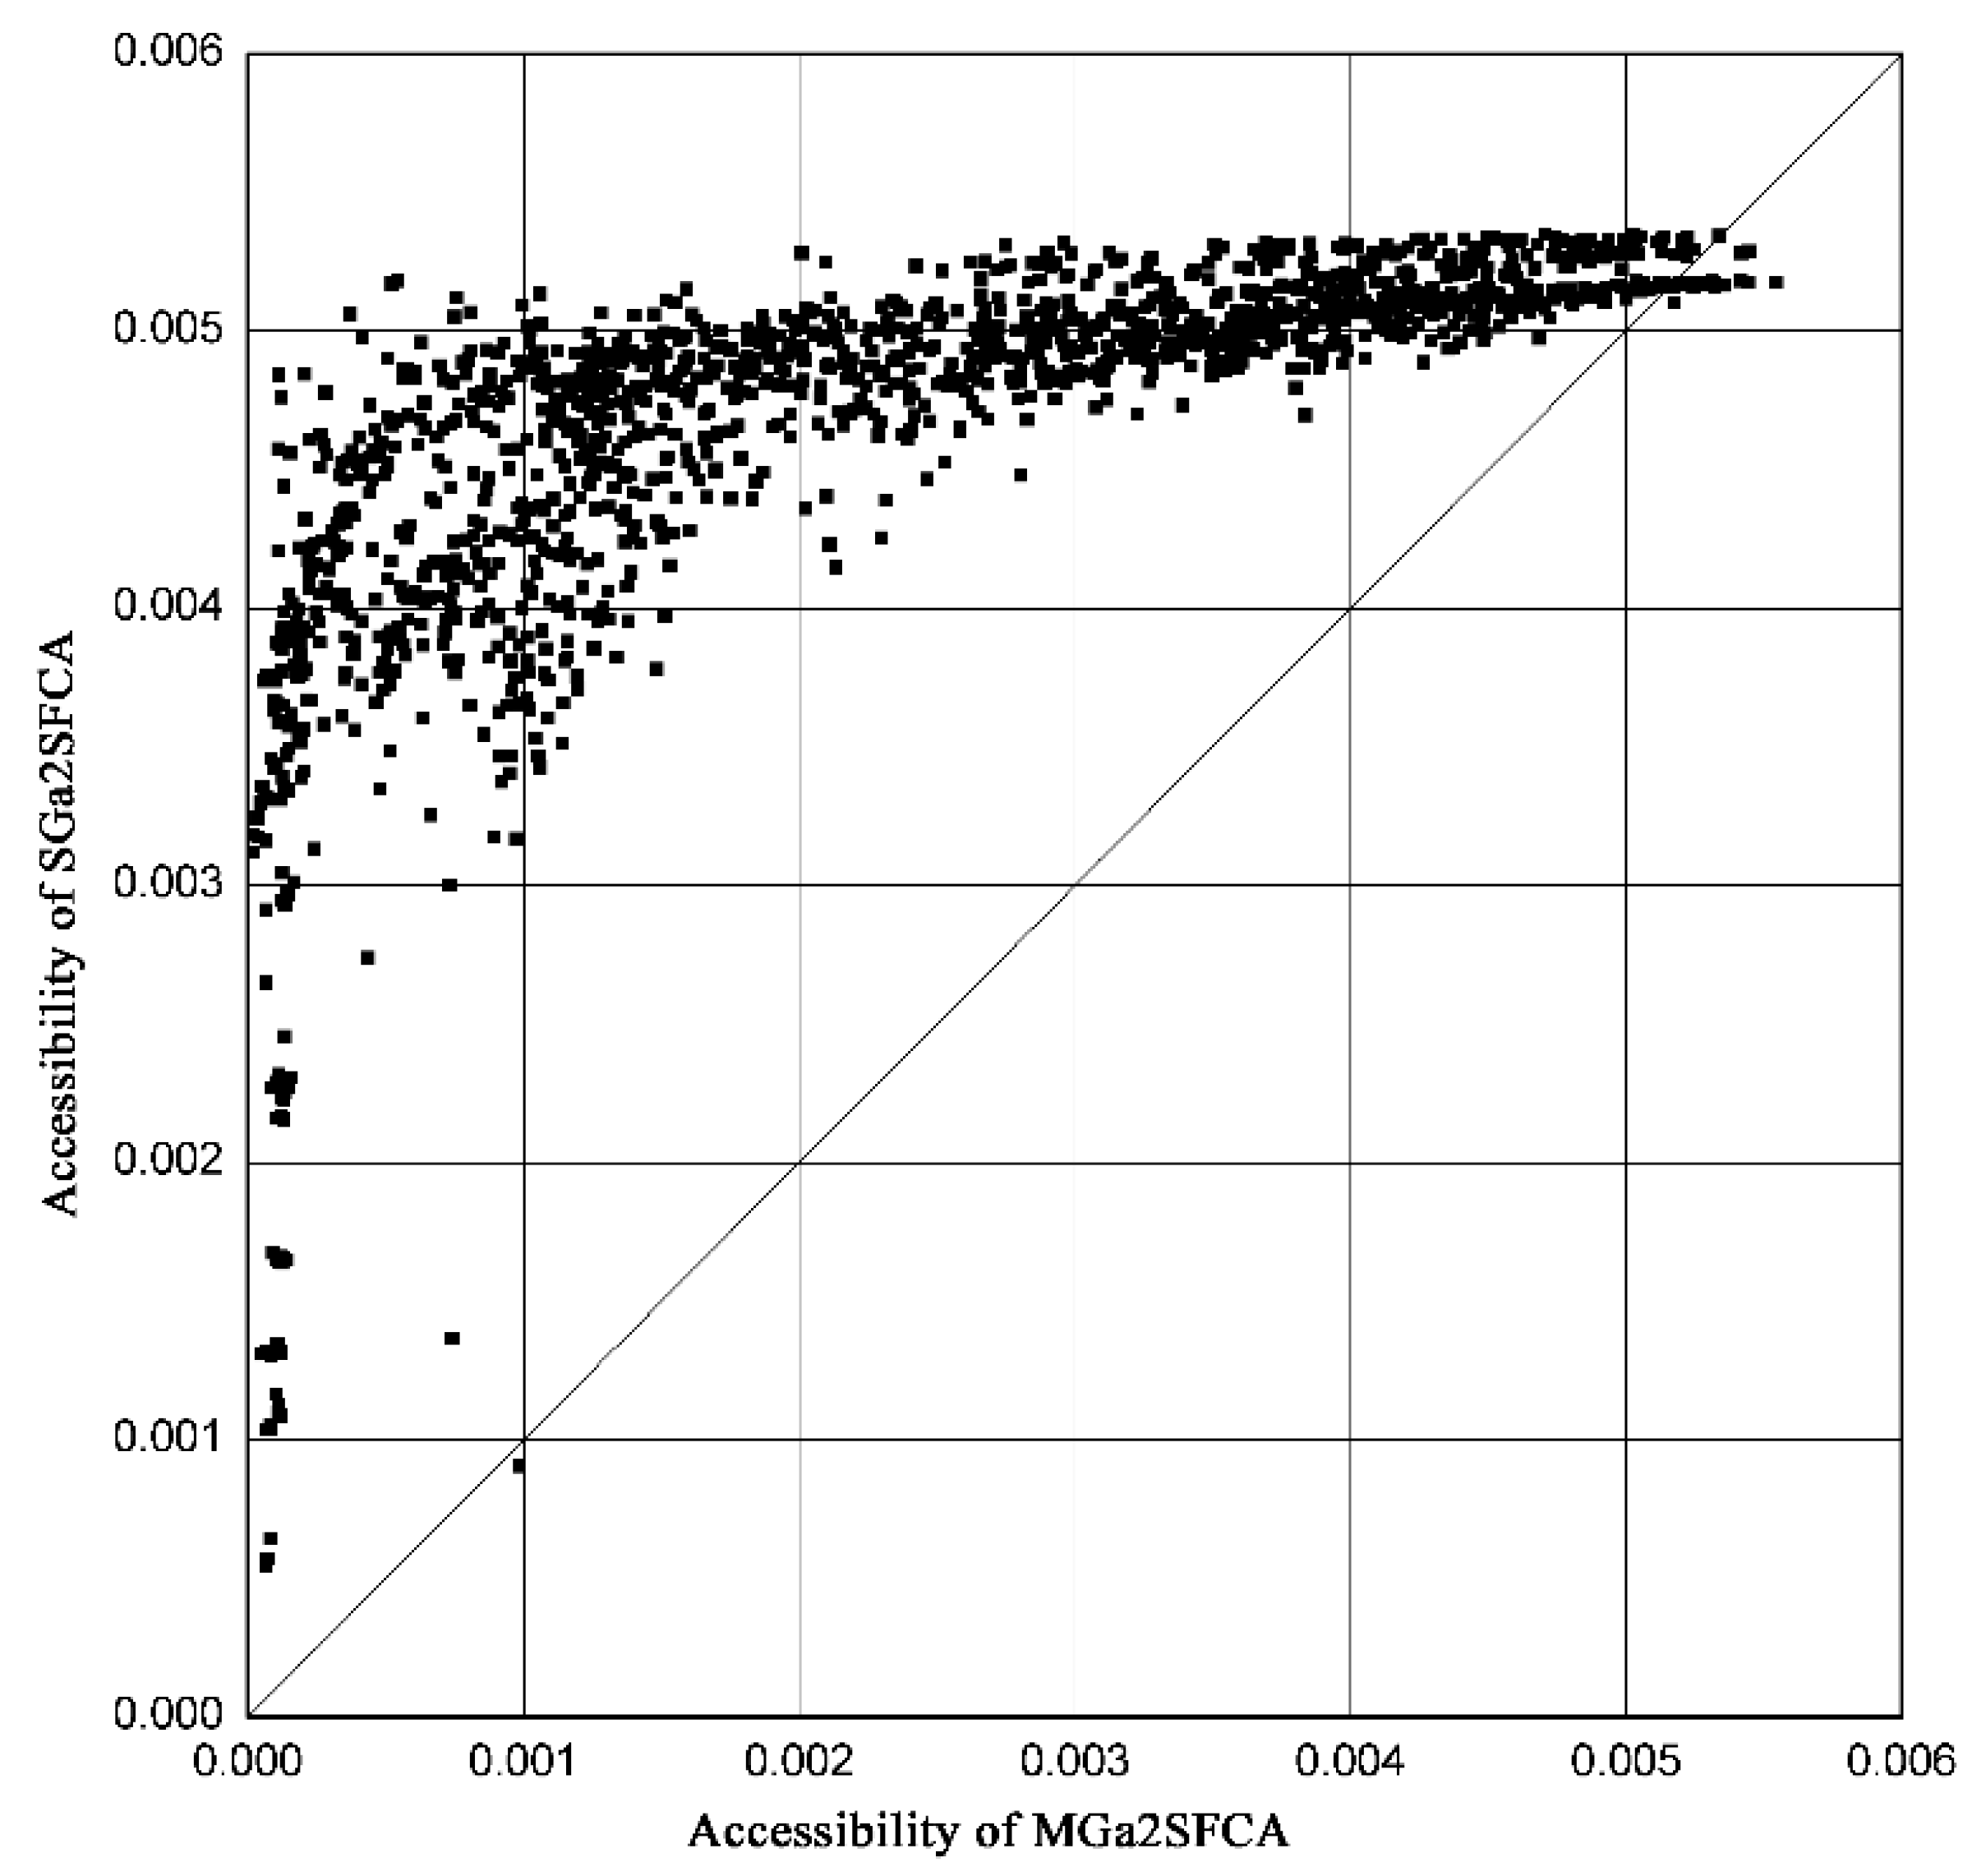
| Methods | Min. | Max. | Avg. | Std. Dev. |
|---|---|---|---|---|
| MGa2SFCA | 0.000347 | 0.007337 | 0.004290 | 0.001722 |
| DGa2SFCA | 0.000539 | 0.007718 | 0.004491 | 0.001578 |
| PGa2SFCA | 0.000012 | 0.011121 | 0.003821 | 0.002716 |
| SGa2SFCA | 0.000542 | 0.005347 | 0.004639 | 0.000744 |
© 2019 by the authors. Licensee MDPI, Basel, Switzerland. This article is an open access article distributed under the terms and conditions of the Creative Commons Attribution (CC BY) license (http://creativecommons.org/licenses/by/4.0/).
Share and Cite
Ni, J.; Liang, M.; Lin, Y.; Wu, Y.; Wang, C. Multi-Mode Two-Step Floating Catchment Area (2SFCA) Method to Measure the Potential Spatial Accessibility of Healthcare Services. ISPRS Int. J. Geo-Inf. 2019, 8, 236. https://doi.org/10.3390/ijgi8050236
Ni J, Liang M, Lin Y, Wu Y, Wang C. Multi-Mode Two-Step Floating Catchment Area (2SFCA) Method to Measure the Potential Spatial Accessibility of Healthcare Services. ISPRS International Journal of Geo-Information. 2019; 8(5):236. https://doi.org/10.3390/ijgi8050236
Chicago/Turabian StyleNi, Jianhua, Ming Liang, Yan Lin, Yanlan Wu, and Chen Wang. 2019. "Multi-Mode Two-Step Floating Catchment Area (2SFCA) Method to Measure the Potential Spatial Accessibility of Healthcare Services" ISPRS International Journal of Geo-Information 8, no. 5: 236. https://doi.org/10.3390/ijgi8050236
APA StyleNi, J., Liang, M., Lin, Y., Wu, Y., & Wang, C. (2019). Multi-Mode Two-Step Floating Catchment Area (2SFCA) Method to Measure the Potential Spatial Accessibility of Healthcare Services. ISPRS International Journal of Geo-Information, 8(5), 236. https://doi.org/10.3390/ijgi8050236