Article

CHS Priority Planning Tool (CPPT)—A GIS Model for Defining Hydrographic Survey and Charting Priorities

Canadian Hydrographic Service, 200 Kent Street, Ottawa, ON K1A 0E6, Canada
*
Author to whom correspondence should be addressed.
ISPRS Int. J. Geo-Inf. 2018, 7(7), 240; https://doi.org/10.3390/ijgi7070240
Submission received: 23 April 2018 / Revised: 29 May 2018 / Accepted: 19 June 2018 / Published: 22 June 2018

Abstract

:
This paper presents a geographic information system (GIS) model that the Canadian Hydrographic Service (CHS) developed to prioritize hydrographic survey and charting at a national scale. Canada has the largest coastline in the world; determining its survey and charting priorities at a national scale is a challenging task, requiring sufficient data to provide national coverage. In order to achieve this task and manage the geospatial layers, CHS has developed a GIS-based model, the CHS Priority Planning Tool (CPPT). Geospatial information of navigational significance (e.g., traffic patterns, water depth, and infrastructure) have been compiled into a GIS model to identify where CHS’s hydrographic survey and charting priorities exist. Probability risk modelling, such as a risk of grounding and collision model, as well as a drift model, are included in the CPPT to ensure that CHS has proper mitigation measures in “high-risk” areas. Other environmental factors such as ice and wind speed are also included to help define national priorities for CHS. The CPPT is operational and is currently being used to define and prioritize CHS’s survey and charting requirements nationally for multiple years. A GIS web tool has been developed to facilitate accessibility for all Department of Fisheries and Oceans employees and to aid in decision making regarding CHS’s national priorities.

1. Introduction

Under the authority delegated to Fisheries and Oceans Canada under the Oceans Act, the Canadian Hydrographic Service (CHS) is responsible for providing hydrographic products and services to ensure safe, sustainable, and navigable use of Canada’s waterways. Canada borders on three oceans and has the longest coastline in the world at over 243,700 km [1]. The oceans surrounding Canada (i.e., Pacific, Arctic, and Atlantic), as well as internal waters, cover a surface area of approximately 7.1 million square kilometers [1]. This represents 70% of the surface area of the country [1]. Approximately 1000 paper charts are required to cover Canada’s oceans and navigable waterways. Due to this large extent, shoreline complexity, and more than half its waters being present in remote areas such as the Arctic Ocean, collecting and processing data on Canadian waterways presents significant challenges. Even if CHS charts and products have full coverage of Canadian waters, some of these areas contain information collected with techniques that predate the advanced and more accurate technologies available to us today. This is primarily true for the Canadian Arctic, as well as the Labrador Coast, where the large extent of water, varying environmental factors, remoteness, and short surveying seasons are ongoing challenges for CHS.
Recent initiatives from the Government of Canada are contributing to the acquisition of modern survey data that will support the creation of navigational products. These initiatives include:
  • The World-Class Tanker Safety System Initiative (WCTSS): CHS received funds to create a modern and charted navigation system [2].
  • Budget 2015: The federal government announced funding in Budget 2015 (31 July 2015) for seafloor mapping, including funding specifically for installing multibeam sonar equipment on Canadian coast guard vessels. The initiative will contribute to “improve the safety of marine transportation in the Arctic” [3].
  • Budget 2016: The federal government announced in Budget 2016 (22 March 2016) an investment to increase ocean and freshwater science, including monitoring and research activities [4] (p. 163). Some of the funds will be used to acquire additional multibeam survey capacity.
  • In 2016 the Government of Canada announced $1.5 billion for the Oceans Protection Plan (OPP). These funds will be used to improve marine safety, support responsible shipping, protect Canada’s marine environment, and create stronger partnerships with indigenous and coastal communities.
With these new investments, there will be increased survey and charting opportunities. With more hydrographic data being acquired, it will be critical for CHS to prioritize and plan surveys and charting activities at a national level. This also follows the recommendation of the Audit of Arctic Marine Navigation in the 2014 Fall Report of the Commissioner of the Environment and Sustainable Development to identify and prioritize Arctic regions requiring survey and charting. The CHS Priority Planning Tool (CPPT) was developed to prioritize and plan surveying and charting at the national level. The CPPT is a hybrid tool that uses the advantage of a Geographic Information System (GIS), as well as a matrix approach, which incorporates critical navigational information and prediction models such as risk of grounding, risk of collision, and drift. The CPPT is currently being used in the decision-making aspect of the CHS surveying and charting planning process. The CPPT output is a result of a large-scale data compilation and analysis, resulting in a geographical output highlighting physical hydrographic areas of need and a chart-based output highlighting charts in need of improvement. The output allows CHS to address various factors which are deemed critical for marine navigation. The capabilities of geospatial technologies such as GIS have allowed CHS to collect data from various federal and provincial government agencies to conduct priority analysis utilizing multiple components. The CPPT provides an illustration of where priority zones are located in Canadian waters. When the CPPT was first developed, CHS did research to see what other survey and chart prioritization methods existed within other Hydrographic Offices. There are other GIS-based prioritization models that exist within other Hydrographic Organizations, such as the New Zealand Hydrographic Risk Assessment with Land Information New Zealand (LINZ) [5], as well as the National Hydrographic Survey Priority Model with the National Oceanic and Atmospheric Administration (NOAA) [6]. Other Hydrographic Priority Models, such as those mentioned from LINZ and NOAA, are used for specific surveying priorities for their respective countries. The CPPT was created for national representation of priorities, but more importantly the tool addresses specific challenges faced by CHS in regards to surveying Canadian waters (i.e., ice coverage in the Arctic). This paper will present the methodology behind building the CPPT in a geospatial context, while also presenting the practical uses of this operational model.

2. Dataset

For CHS to plan nationally, multiple geospatial data sets were required at a national scale. In 2009, CHS implemented an ESRI ArcGIS database to manage chart products and hydrographic data. As part of the on-going commitment to a geospatial library, CHS has acquired a large amount of maritime GIS data. Prior to database creation, the data was stored in multiple systems which were hard to access and combine for planning purposes. Since then, with the collaboration of multiple federal government departments, a library of information fit for spatial analysis and product planning was produced (Table 1). This approach has resulted in the acquisition of various data formats and databases, both static and dynamic, available at CHS’s disposal for analysis. The GIS layers used in the CPPT are International Organization for Standardization (ISO) 19115: Geographic Information Metadata format compliant. In order to maintain coverage for the CPPT, each layer was processed for complete coverage of the Canadian Exclusive Economic Zone (EEZ) (Figure 1).

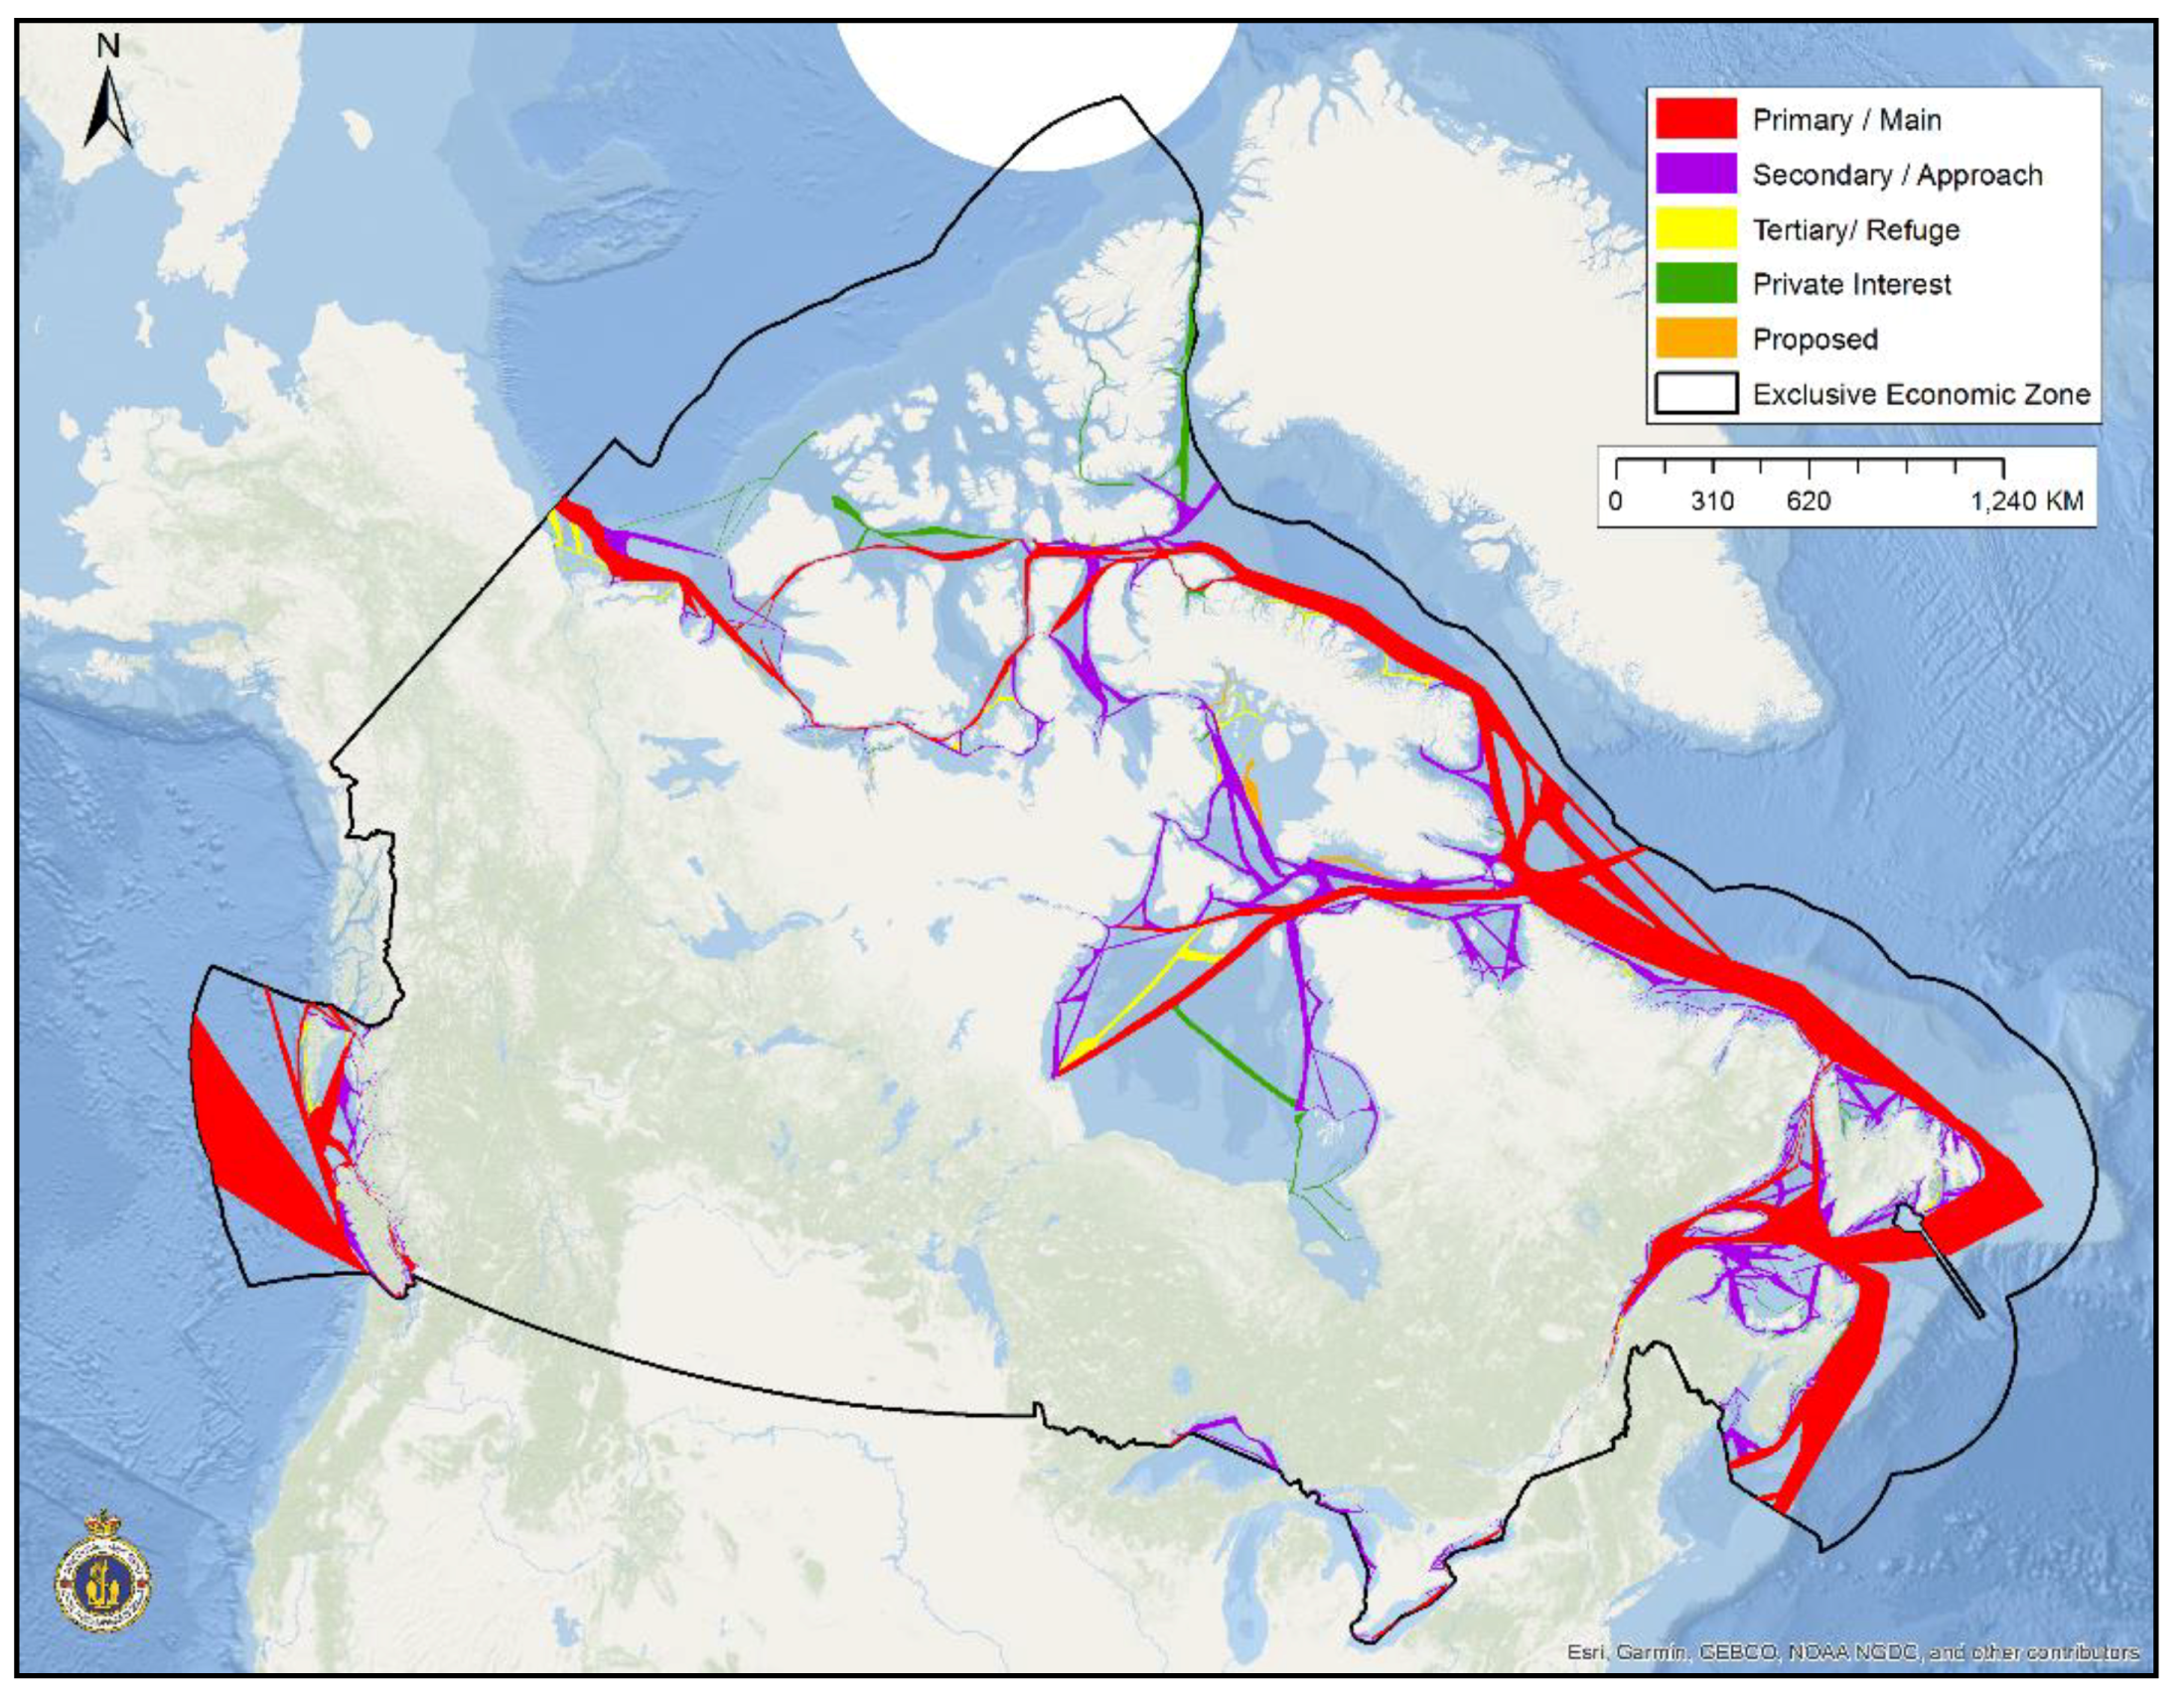
2.1. Marine Transportation Corridors

The Marine Transportation Corridors (MTC, Windhoek, Republic of Namibia), and the Corridors initiative, is a dataset created by CHS to determine where ships are travelling in Canadian waters. The first phase in the Corridors Initiative was to create the Northern Marine Transportation Corridors (NMTC), which was developed under the Government of Canada World-Class Tanker Safety System Initiative (WCTSS) for Canadian waterways north of 60°. With the help of Oceans Protection Plan (OPP), the Corridors Initiative, also known as the Low-Impact Northern Shipping Corridors, will continue to be developed [7]. The CPPT is derived at a national scale, therefore the Corridors were expanded to a national scale (Figure 1), consisting of areas that contain critical information for marine transportation and services [8,9]. Many factors are used in the creation of the MTC, including: Automatic Identification System (AIS) point data from 2012–2014, water depths, anchorage areas, aids to navigation, survey Category Zone of Confidence (CATZOC) coverage, Ecologically and Biologically Significant Marine Areas (EBSA), protected areas, traditional knowledge, ice concentration, projected mines, places of refuge, populated places, ports, tidal windows, and Earth Observation (EO) data. The factors used in the creation of the MTC include data compiled from 12 federal government agencies. The MTC will be modified annually with the addition of new data available to CHS, such as ice information, AIS data, and environmental factors. The MTC are divided into a five class hierarchical ranking system: Primary Corridor (Main Corridor), Secondary Corridor (Approach Corridor), Tertiary Corridor (Refuge Corridor), Quaternary Corridor (Private Interest Corridor), and Quinary Corridor (Projected Corridor).

2.2. Water Depth

Water depth information is one of the most critical factors in terms of safe navigation and hydrographic survey requirements. Information for this dataset was derived from CHS’s Electronic Navigational Chart (ENC) and paper chart products. In some areas there was a lack of reliable data. When this occurred, information was extracted from CHS’s survey data to bridge the gap. Although CHS survey datasets extend throughout the Canadian EEZ, some areas did not contain the high quality information required for this dataset due to outdated survey techniques (e.g., single lead lines). For these regions, depth data was extracted from the General Bathymetric Chart of the Oceans (GEBCO) database, transformed to vector data, and classified into five depth contour areas. Depth becomes increasingly critical to safe navigation as depths decrease; therefore shallow depths were given a greater weight than deep areas. The depths that are considered critical for safe navigation are from 0–50 m. As charting continues over time, accuracy and coverage will continuously improve.

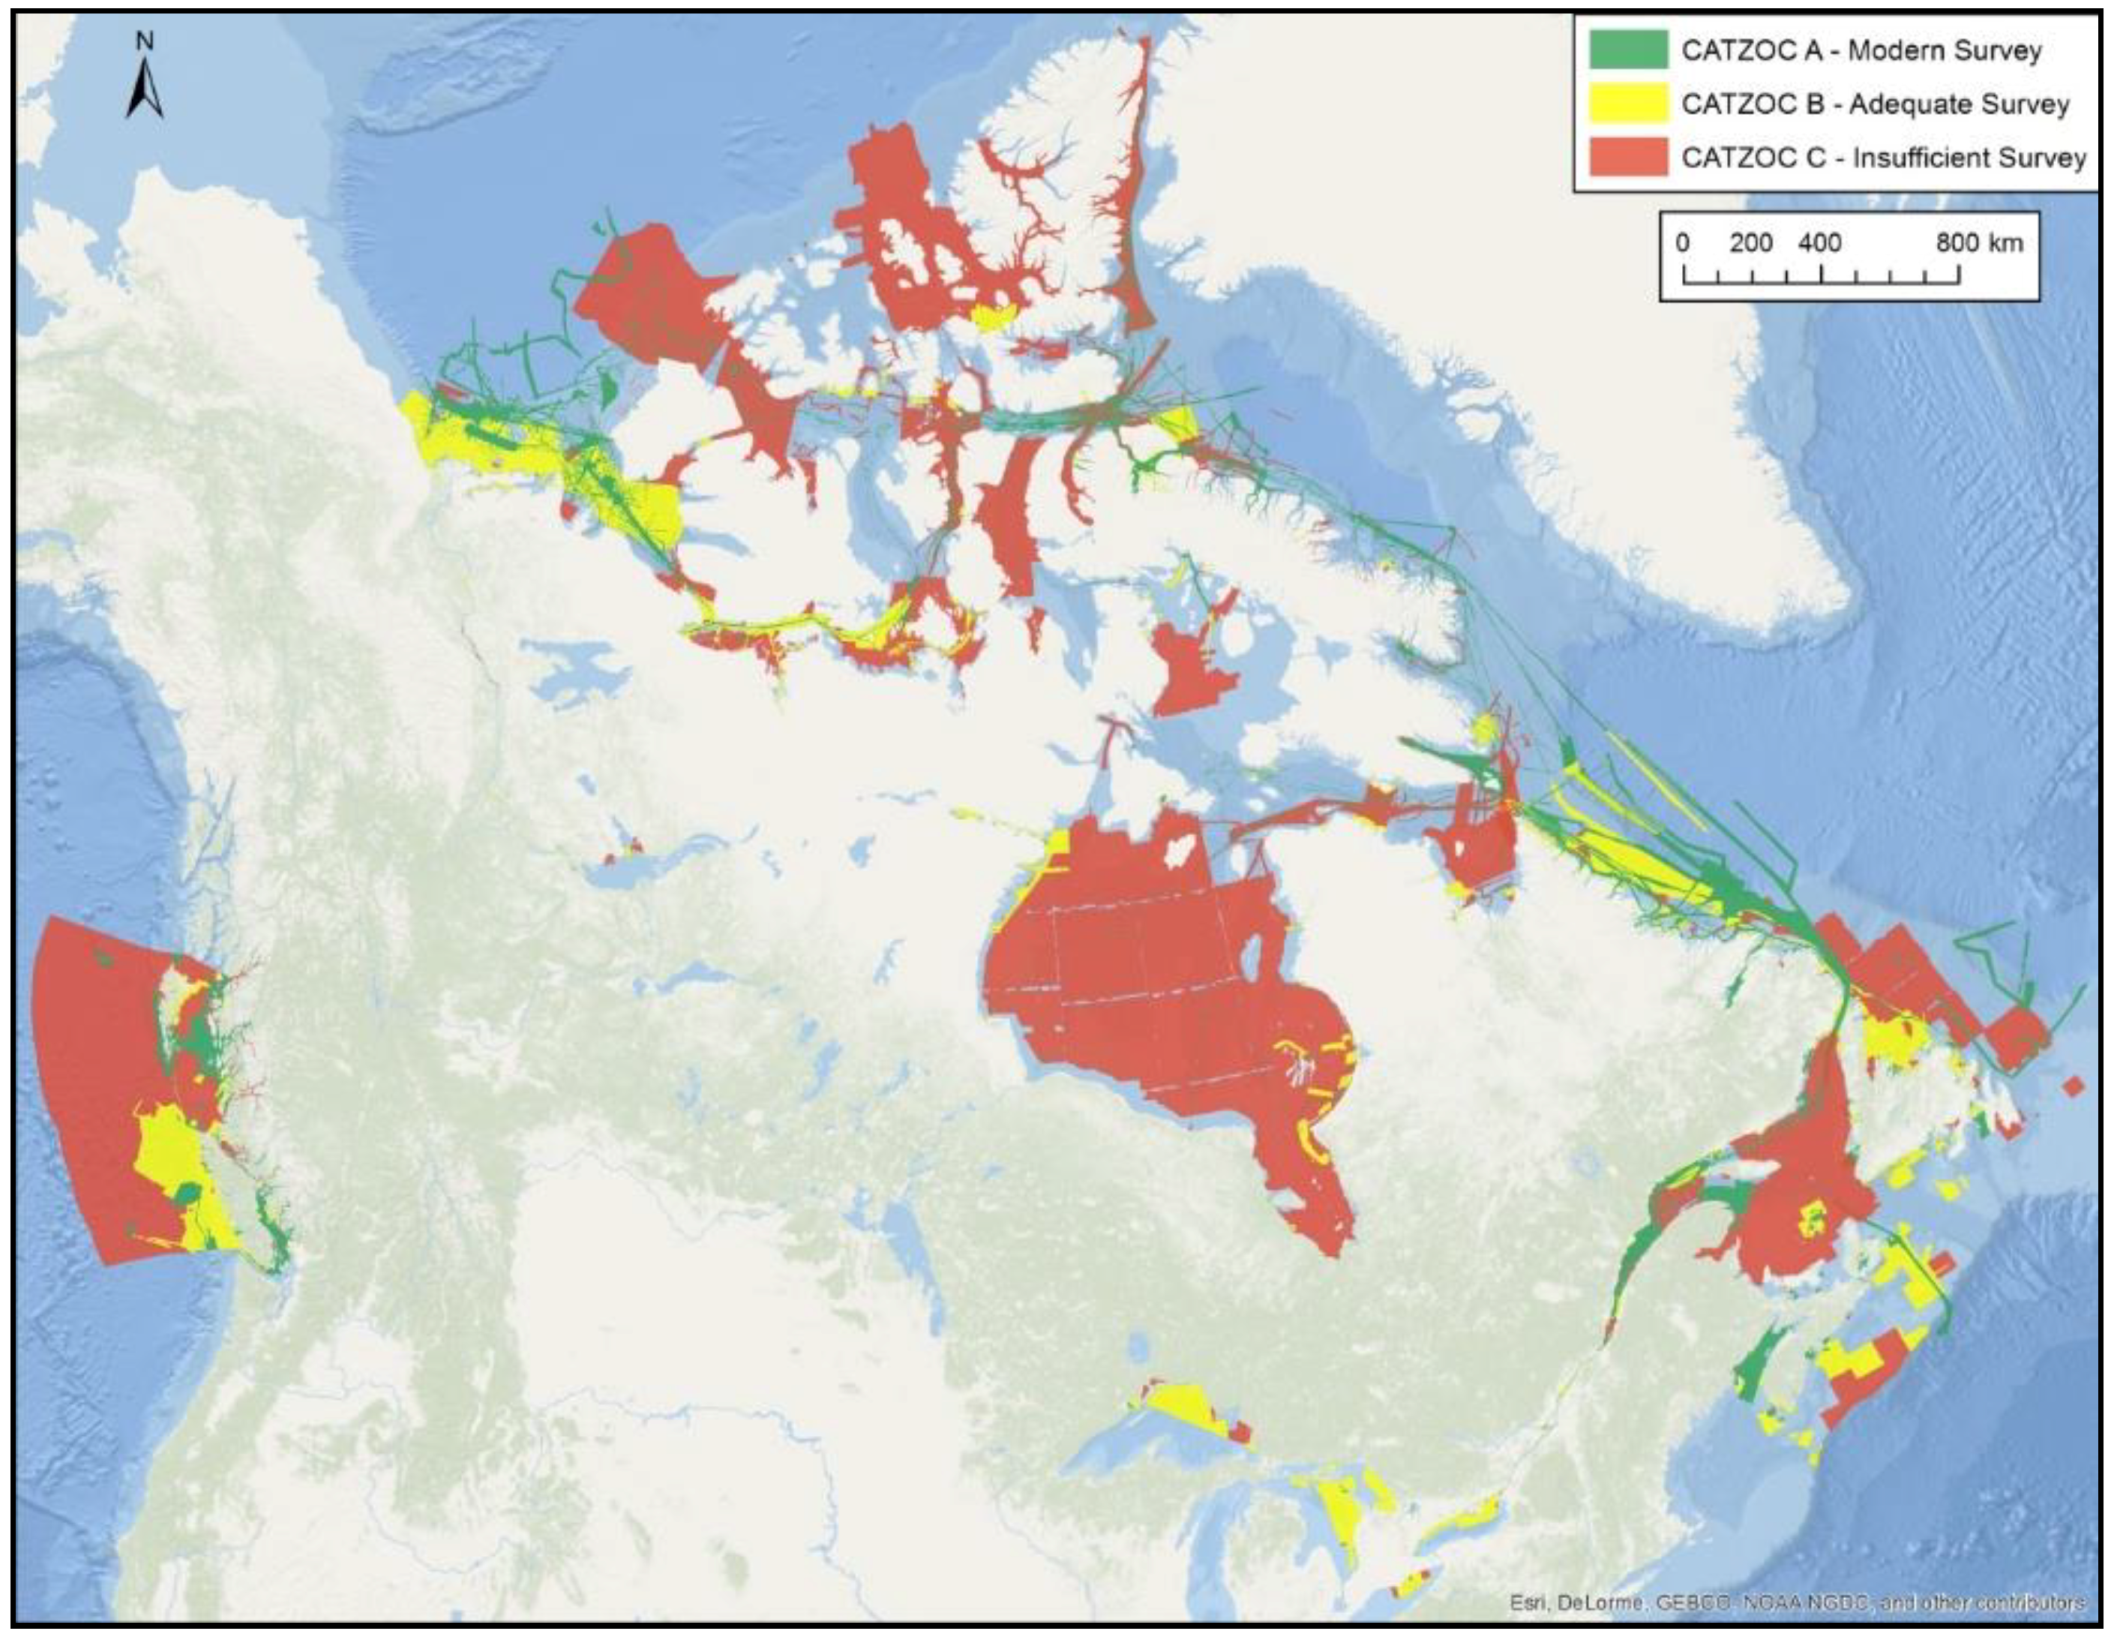
2.3. CHS Existing Surveys

The information collected during CHS hydrographic surveys are stored in a national bathymetry database allowing for storage of sonar, Light Detection and Ranging (LiDAR), and historical hydrographic data (Figure 2). Through this database, CHS is able to view survey information, specifically CATZOC classifications, in order to analyze geographic areas where existing CHS surveys are located. Areas where CATZOC A data is present would not require additional surveys, as they are already surveyed to International Hydrographic Organization (IHO) standards [10]. In areas with depths greater than 50 m, CATZOC B data is accepted as sufficient under international standards. Shallow areas where CATZOC C or lower is the best available data do not meet international standards and should be re-surveyed. This dataset is given a negative weight, in order to eliminate areas which are already adequately surveyed, therefore giving priority to areas which have not been surveyed to modern standards.

2.4. Seafloor Complexity

Complex seafloor is defined as an area with a significant change in seafloor elevation, which can present challenges to marine navigation. The complexity of the seafloor is increasingly significant as depths decrease. The seafloor complexity dataset was created using depth values derived from both CHS’s ENC data and the GEBCO Digital Elevation Model (DEM). The complexity was determined using the Slope function in ArcGIS, which calculates the maximum change in elevation over the distance between the cell and its eight neighbors. Slope values were compiled into three classes: low (0° to 0.25°), medium (0.25° to 4°), and high (4° to 60°). The rate of slope changes on the seabed is a binary layer where the medium and high slope classes are considered complex seafloor. This layer is used to show where we have areas of very complex seafloor within the Exclusive Economic Zone of Canada, as well as determining the survey requirements layer.

2.5. Survey Requirements

The CHS’s standard for hydrographic surveys specifies requirements for hydrographic surveys in Canadian waters which are based on IHO Special Publications No. 44 [10]. Table 2 outlines survey requirements within each depth classification and the seafloor complexity related to each. Where survey requirements are not met, the weighted value is added to the priority model, thus giving highest priority to shallower depths which are inadequately surveyed. Depth values which have met survey requirements are given no weight, thus giving a lower priority to areas which are adequately surveyed.

2.6. Probability Risk Modelling

Most of the GIS Layers that are computed in the CPPT are based on concrete hydrographic data, such as water depth, CATZOC survey data, as well as data pulled from the CHSP Paper Charts. It is also important to include a probability risk model in the CPPT to capture data such as risk of grounding, risk of collision, and drift modelling.

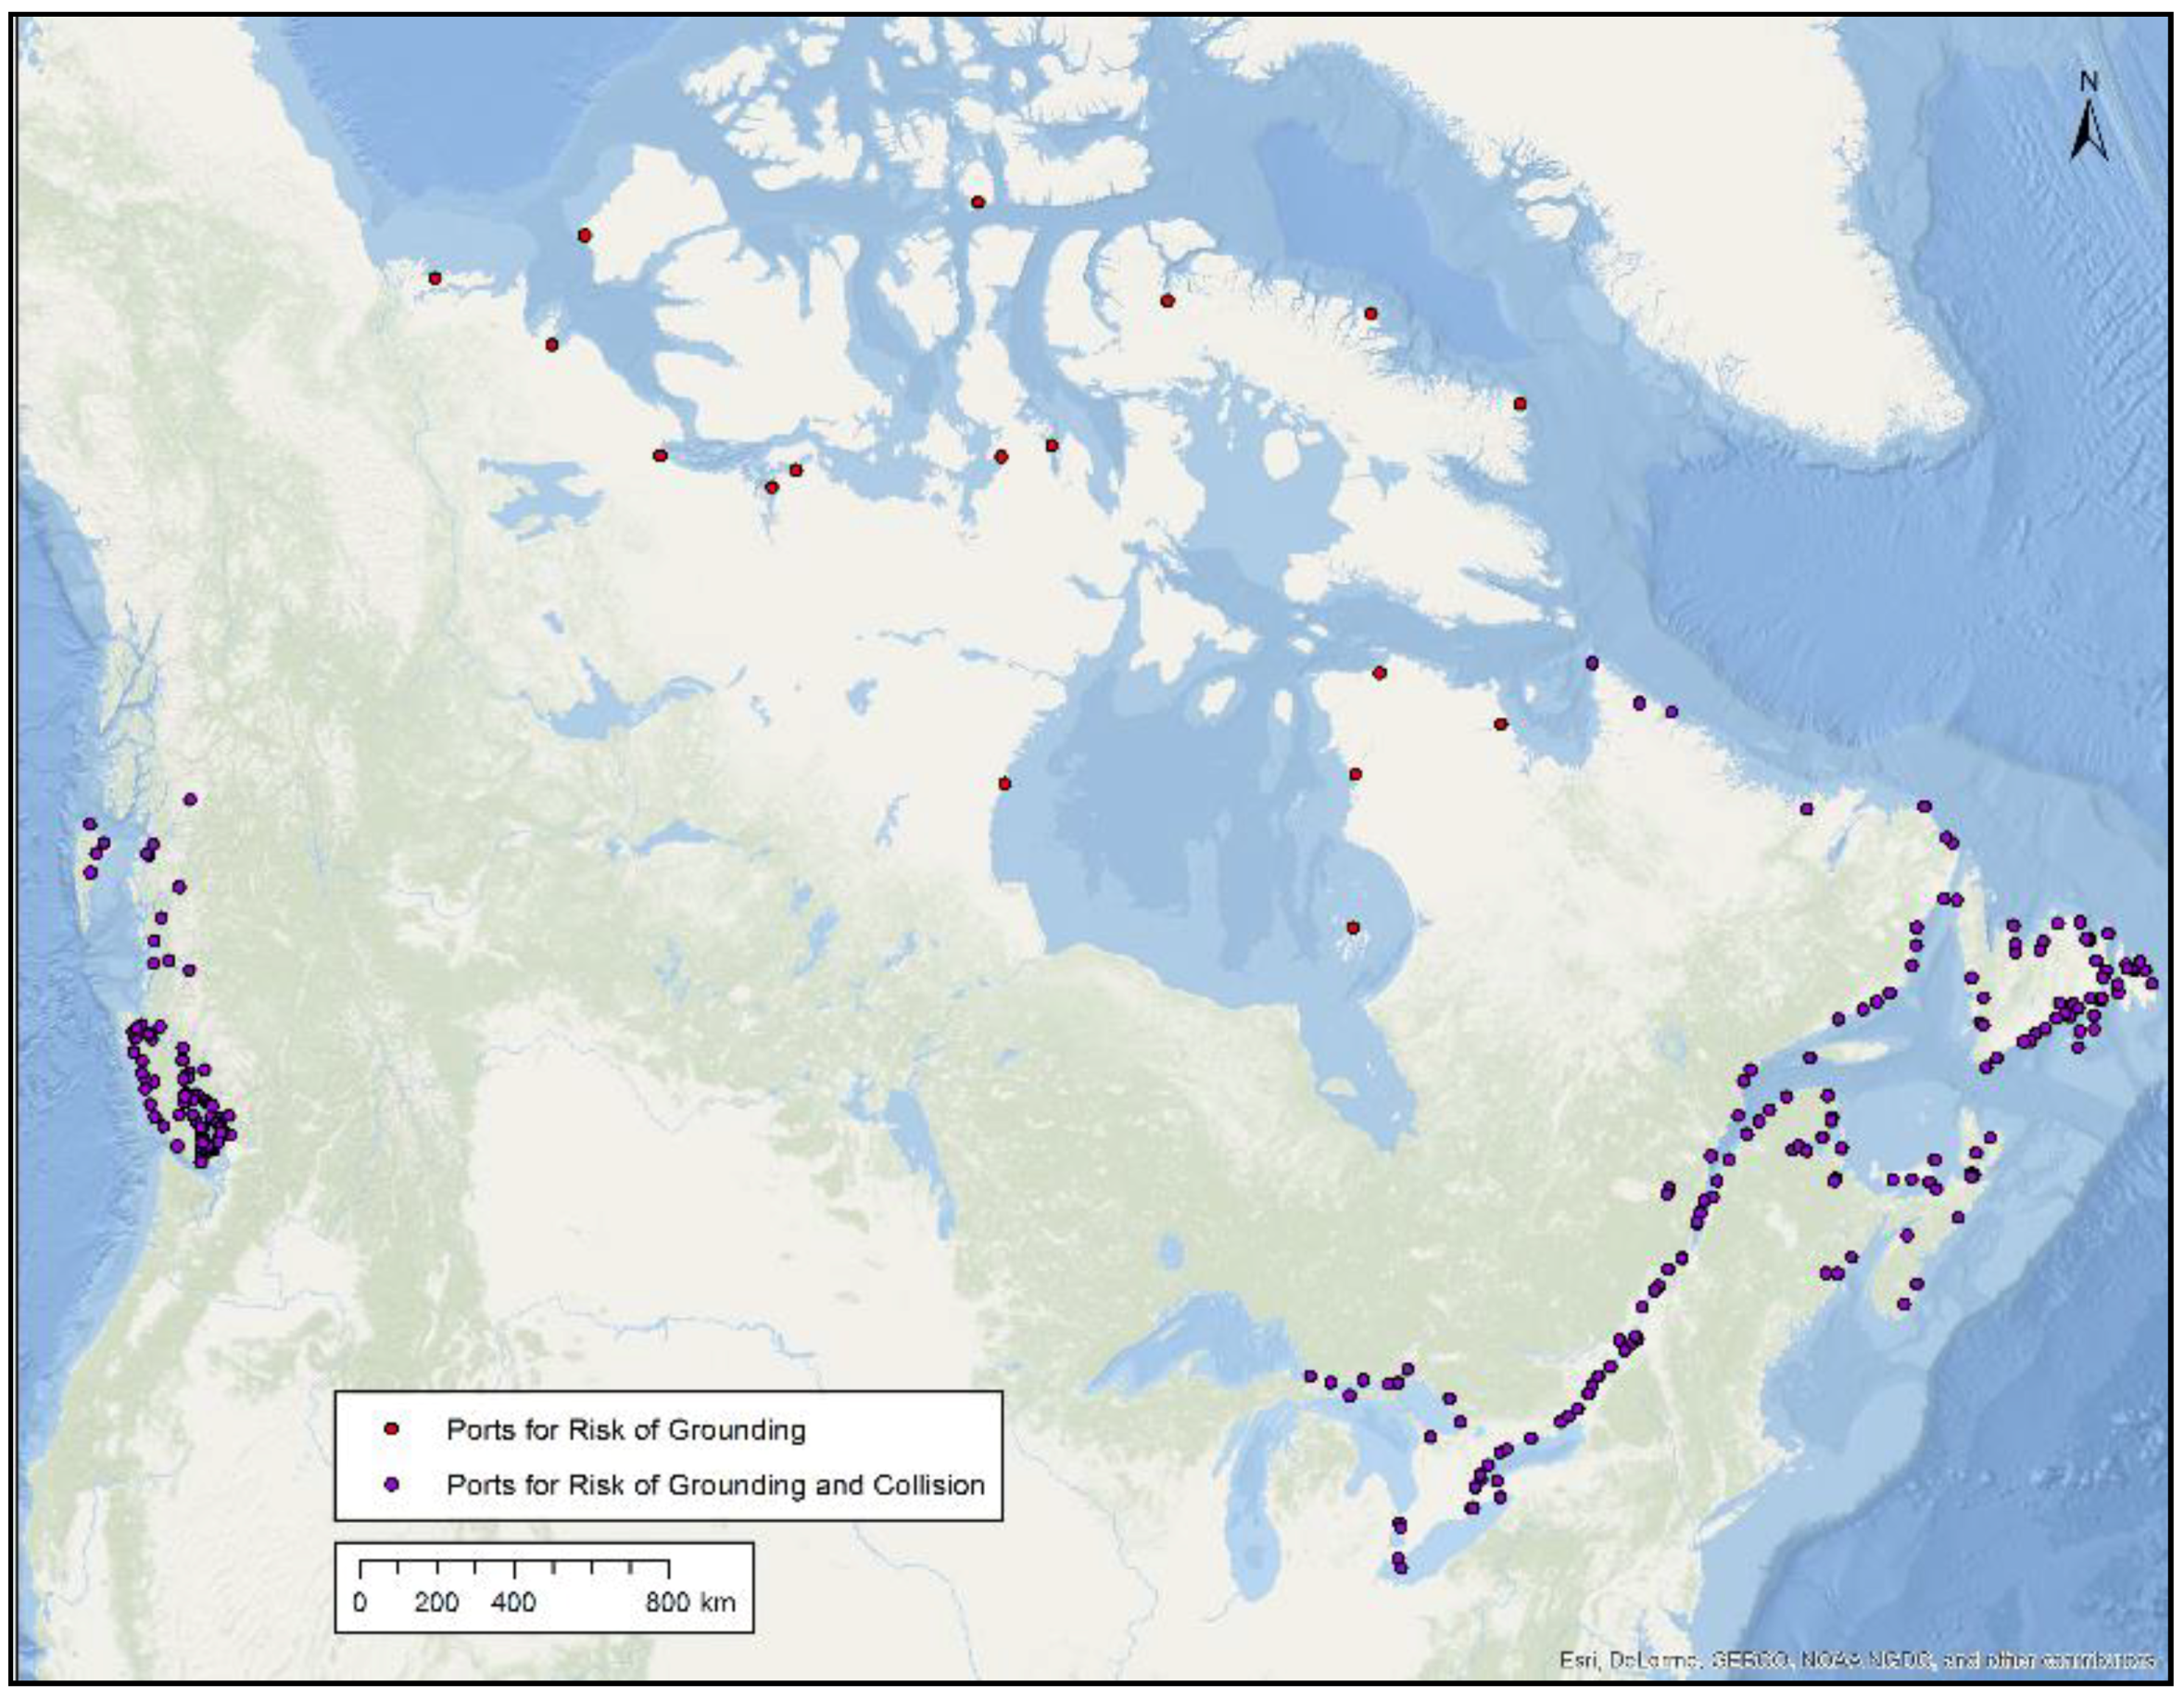
2.6.1. Risk of Grounding and Risk of Collision

In an effort to ensure areas of high navigational risk are captured in the model output, a study was completed by the Canadian Coast Guard (CCG) and CHS in 2014. This study evaluated the risk of grounding for Canadian Arctic communities (Figure 3). The analysis was based on the Permanent International Association of Navigational Congresses (PIANC) and the US Corps of Engineering approaches. Risk of grounding was classified into five groups: very low, low, medium, high, and very high. Risk of collision was not evaluated in the Arctic due to low traffic volume. In 2017, CHS extended this study to major Canadian ports, also incorporating risk of collision analysis. In total, 309 ports and communities were evaluated based on numerous factors, including the major factors shown in Table 3.

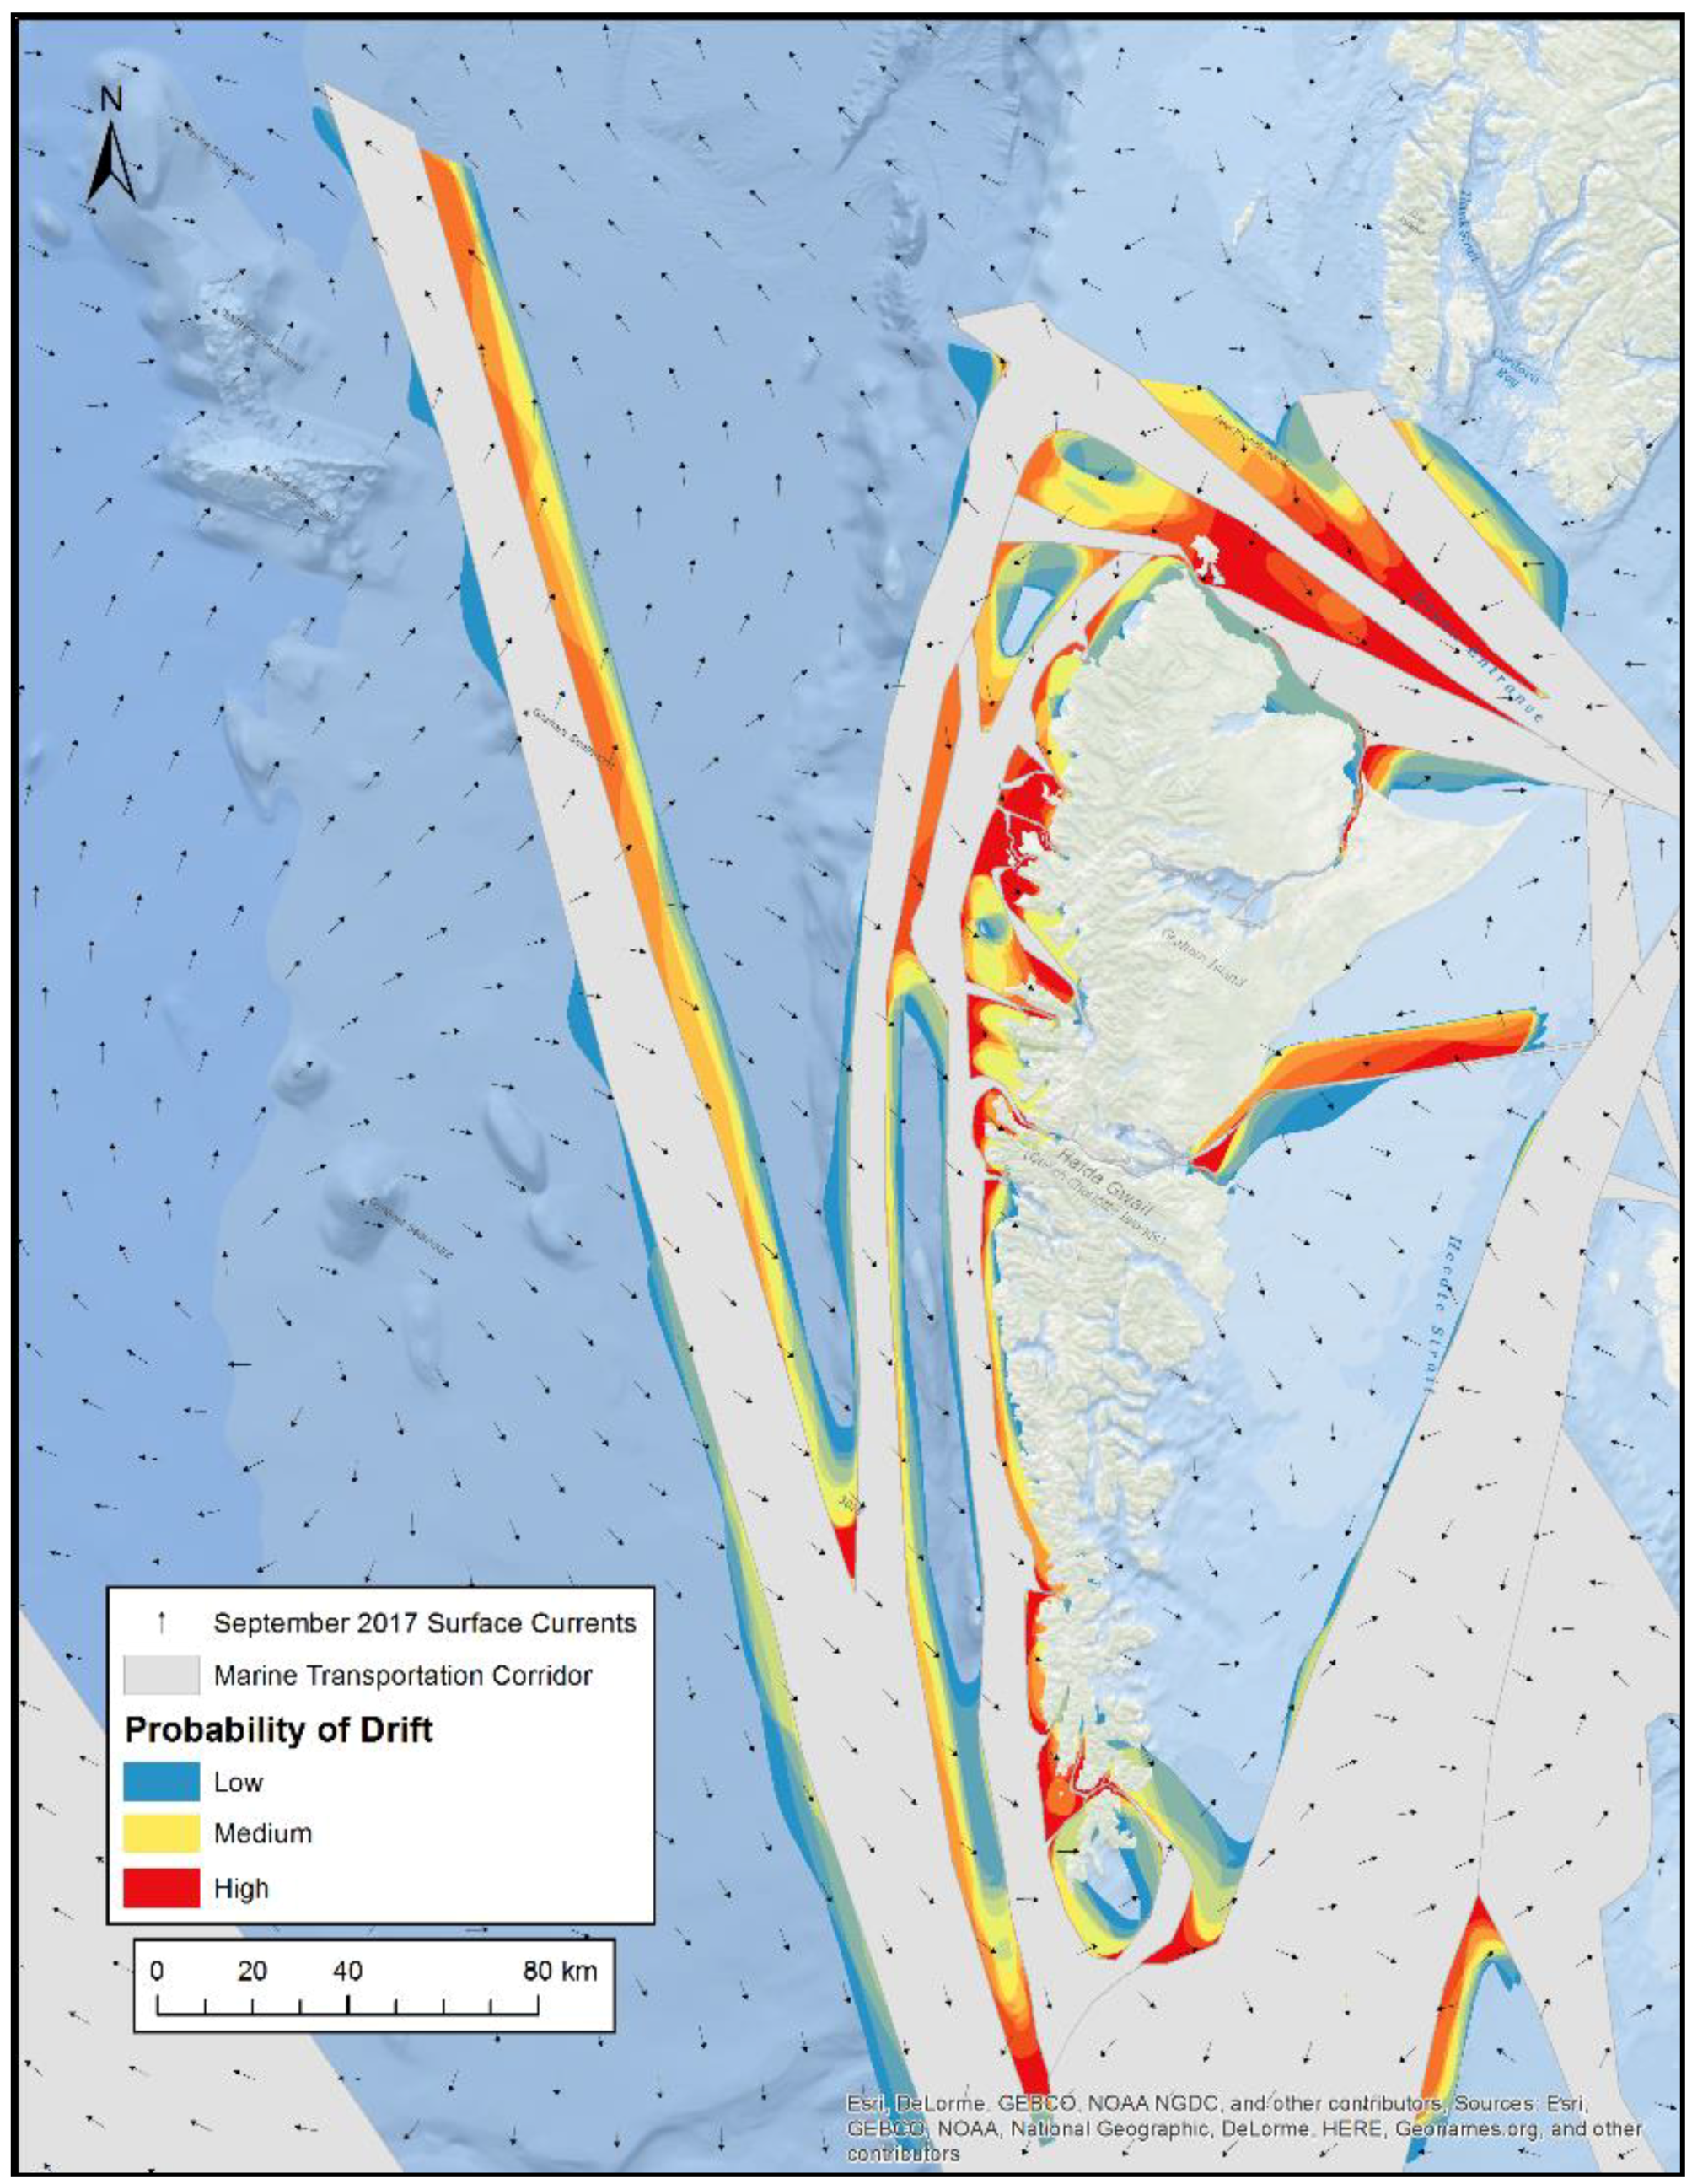
2.6.2. Drift Model Analysis

A major risk in the quality of survey data and gaps within data is represented by a ship drifting outside of the MTC area during emergency situations such as engine failure (Figure 4). To extend survey priorities outside the MTC, a drift model was developed to represent potential areas, up to 10 km around the MTC, where an object has the possibility of drifting
The probability model expanded the MTC based on bearings derived from ocean surface current velocity. Drift polygons were created using monthly water velocity datasets from the Global Ice Prediction System (GIOPS), which provides velocity x and velocity y vectors. For each chosen month, an interpolated direction surface was created and a surface with bearings, degrees clockwise from North, was calculated. The bearing surface was then used to predict drift tracks from the edge of the corridor and create polygons from the tracks. The polygons for each month were combined show where there are high and low frequencies of potential areas of drift. They are weighted by the number of months the area is represented; as number of months with possibility of drift increase, the weight increase.
Model validation was completed using information from two historical ship drifting incidents. Predicted drift from the model was visually compared to the general area and direction where the ships were expected to drift to ensure a logical model representation.

2.7. CHS Major Projects
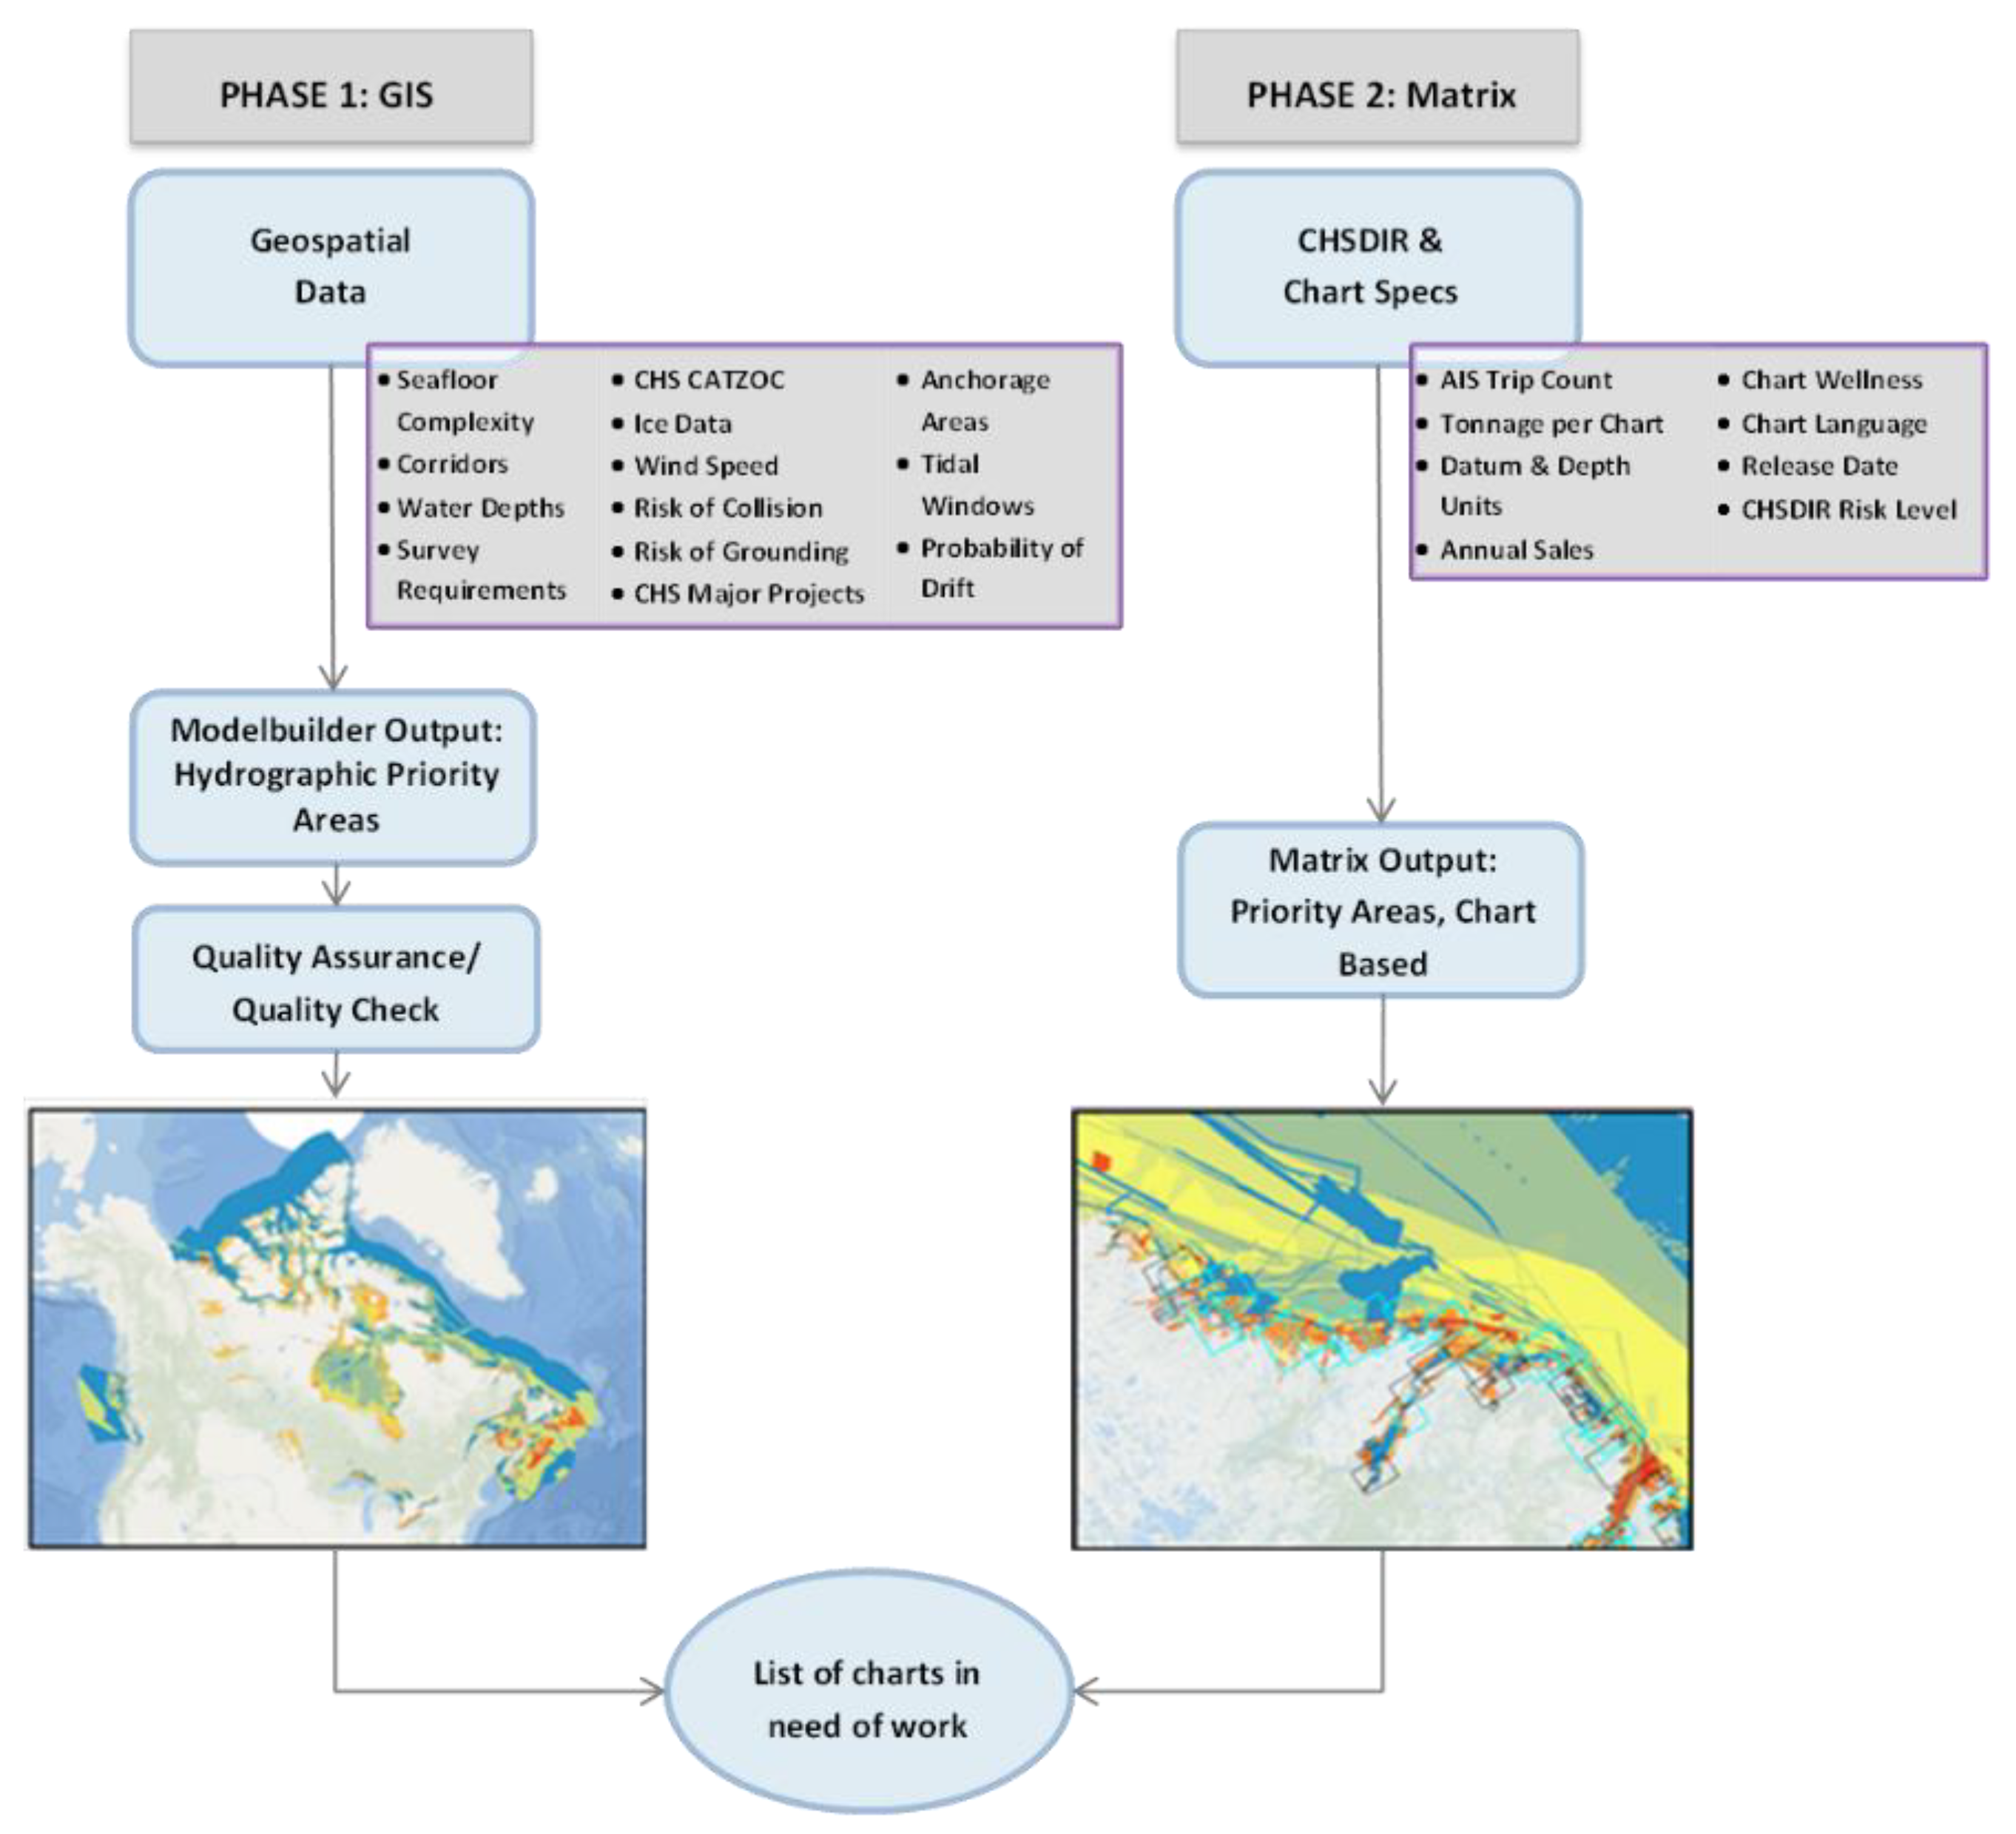
There are other major projects that drive CHS priorities, and are consequently an important layer to incorporate in the CPPT. When the CPPT was first being developed, the World Class Tanker Safety System (WCTSS) was mid-project. The WCTSS Initiative was developed to ensure Canada could manage potential ship-source oil pollution, while also supporting development for Canadian national resources. The CHS’s role in the WCTSS Initiative was to ensure that the top 20 oil and gas ports in Canada were surveyed to the highest of the organization’s ability. Therefore, CHS used the top 20 ports as a Major Projects layer in the CPPT to ensure these twenty ports were high on the priority list. Another major project CHS is involved with is the Canadian Oceans Protection Plan (OPP). The CHS has developed five main pillars of OPP that will gear the prioritization model towards the pillars’ goals from 2017–2021, as OPP is a five-year project. Some of these pillars include major ports in Canada, collecting near-shore bathymetric data, as well as supporting efforts in the Canadian Arctic. These areas are all listed in the CHS Major Projects layer for the CPPT to again ensure that these areas are on the top of CHSs’ priority list.
The CHS is also driven by reoccurring surveys that must be done to ensure safety of navigation within Canadian waters. The primary driver of requiring reoccurring survey is heavy silting, such as in areas around Prince Edward Island. This area has heavy silting each year, which fundamentally changes the shoreline. By ensuring surveys are done in the area regularly, CHS can provide updated information to mariners for their safety.

3. Methodology

The CPPT was developed in two phases: the GIS phase and the Matrix phase (Figure 5). In the GIS phase, an output of geographic areas with surveying priority zones was created. The Matrix phase generated a production plan matrix for CHS charts, based on the geographic areas created in the GIS Phase. The Matrix phase was quality assessed by CHS to ensure charts of high priority contained areas of high priority from the GIS phase. Both aspects accounted for consideration factors, found in Table 1 and Table 3, which are important for safety of navigation within Canadian waters.

3.1. GIS Phase

As the data analysis process was completed, CHS had a clear indication of which components were important for national planning and the CPPT (Table 1). The methodology of the GIS phase was based on a primary component analysis where dominating factors were given a higher weight. Looking at all factors deemed important, CHS identified seven primary datasets for the GIS phase due to their significance and relevance to navigational safety. The main factors included: traffic corridors, water depth, CHS existing surveys, seafloor complexity, survey requirements, risk of grounding, and collision and drift model analysis. There are many environmental factors (i.e., wind and ice) that CHS can factor into the CPPT, which have a lower weight as they are not as navigationally significant as the major factors. For reference, if there is an area that is shallow (0–50 m), areas that are not surveyed to modern standards, and have a corridor passing through it, the area will be highly ranked with the CPPT.
After understanding, formatting, and analyzing the identified main factors, the compilation stage of the GIS phase was completed through execution of the model. The model implemented a weighted linear combination approach applied using a GIS-based multi-criteria decision analysis (MCDA). Goodchild [11] states that integrating a MCDA with a GIS allows for a better spatial decision support, and for CHS and the CPPT, this is hydrographic planning [12]. While there is a lack of theoretical basis for weights, by using expert stakeholders and theoretical limits to define classes, priority assessment can be evaluated using Eastman’s equation [13]:
Suitability   =   w i X i   *   C j
where
  • w i = weight assigned to factor i
  • X i = criterion score of factor i ;
  • C j = constraint j .
Using this equation, CHS was able to determine a priority model and develop a 5-year charting and survey plan.
When put into practice at a national scale, hydrographic planning and the CPPT becomes a substantial undertaking. Each of the input factors for the CPPT model were given a positive weight (with the exception of areas that have adequate surveys) and added together for a final weighted sum. The CPPT output is a summation of each weight for each input factor. The output is classified using a 25-class quantile classification (Figure 4), resulting in an even distribution of values within the classes. This allows for maximizing between-class differences while minimizing within-class differences [14].
The CPPT results in over 100 operations within the model. Some of these functions are essential to follow Eastman’s equation, while others are used for performance measures and intermediate formatting. The CPPT output is evaluated through quality assurance measures using CHS products to ensure the model properly represents Eastman’s equation. While CHS products are used for quality assurance purposes, the use of multiple databases containing source information is also used to ensure that the result is accurate. The final GIS output is computed over the entirety of navigable Canadian waterways. It is important to note that while computing the GIS phase of the CPPT, the output is geographic areas with high to low priority weights.

3.2. Matrix Phase

While a GIS approach is a good start for determining hydrographic priorities in Canada, CHS’s organizational needs require more precision in order to create a chart production plan. In Phase 2 of the CPPT, a dynamic matrix was built in order to consider components, such as the quality of the existing chart, datum and depth units, risk of grounding, etc., which are all navigationally significant factors, which are shown in Table 4. There are primary components to the matrix phase which appear in bold below, as well as secondary components which are in plain text. While some of the data being used in this phase is static, such as risk of grounding, it is imperative to use this data as they are good indicators, in order to properly prioritize CHS charts for production. Port tonnage and trip density, which are calculated based on chart extents, are datasets developed by CHS through the use of the Python programming language via ArcPy. The database components contain chart specifications, which include information such as language and chart wellness. Chart wellness is a value created within CHS to determine which paper chart needs to be focused on based on age, number of notices, and other vital information. Within the matrix, the use of CHS chart sales is used to provide information pertaining to how often these charts are purchased by recreational mariners, which includes small craft harbor charts and pleasure craft charts. To ensure CHS captures the need for recreational mariners, the use of chart sales is crucial as AIS data is mainly available for commercial shipping only.
The Matrix phase of the CPPT consists of analyzing every CHS paper chart to determine the final ranks of the charts for priority. Some of the factors were analyzed using CHS products, while others required field experts for external data. One of the most important factors in the matrix phase is the priority output from Phase 1 of the CPPT. The priority model is based on the top four classes of the weighted sum output from the GIS phase and on which charts overlap with these priority areas. The higher the weighted sum, the more important the geographic area is within the CPPT. Once weights have been assigned and calculated for each chart in the matrix, they are ranked to create a priority or rank list of charts. From the GIS phase, the Matrix phase overlaps the geographic areas to create a CHS chart based analysis. It should also be noted that since the model is automated to create the CPPT priority areas, expert and local knowledge with human intervention is required to define CHS’s final national priorities. To facilitate prioritizing the charts, CHS has developed an internal committee which evaluated the CPPT priority areas and created a 5-year plan.

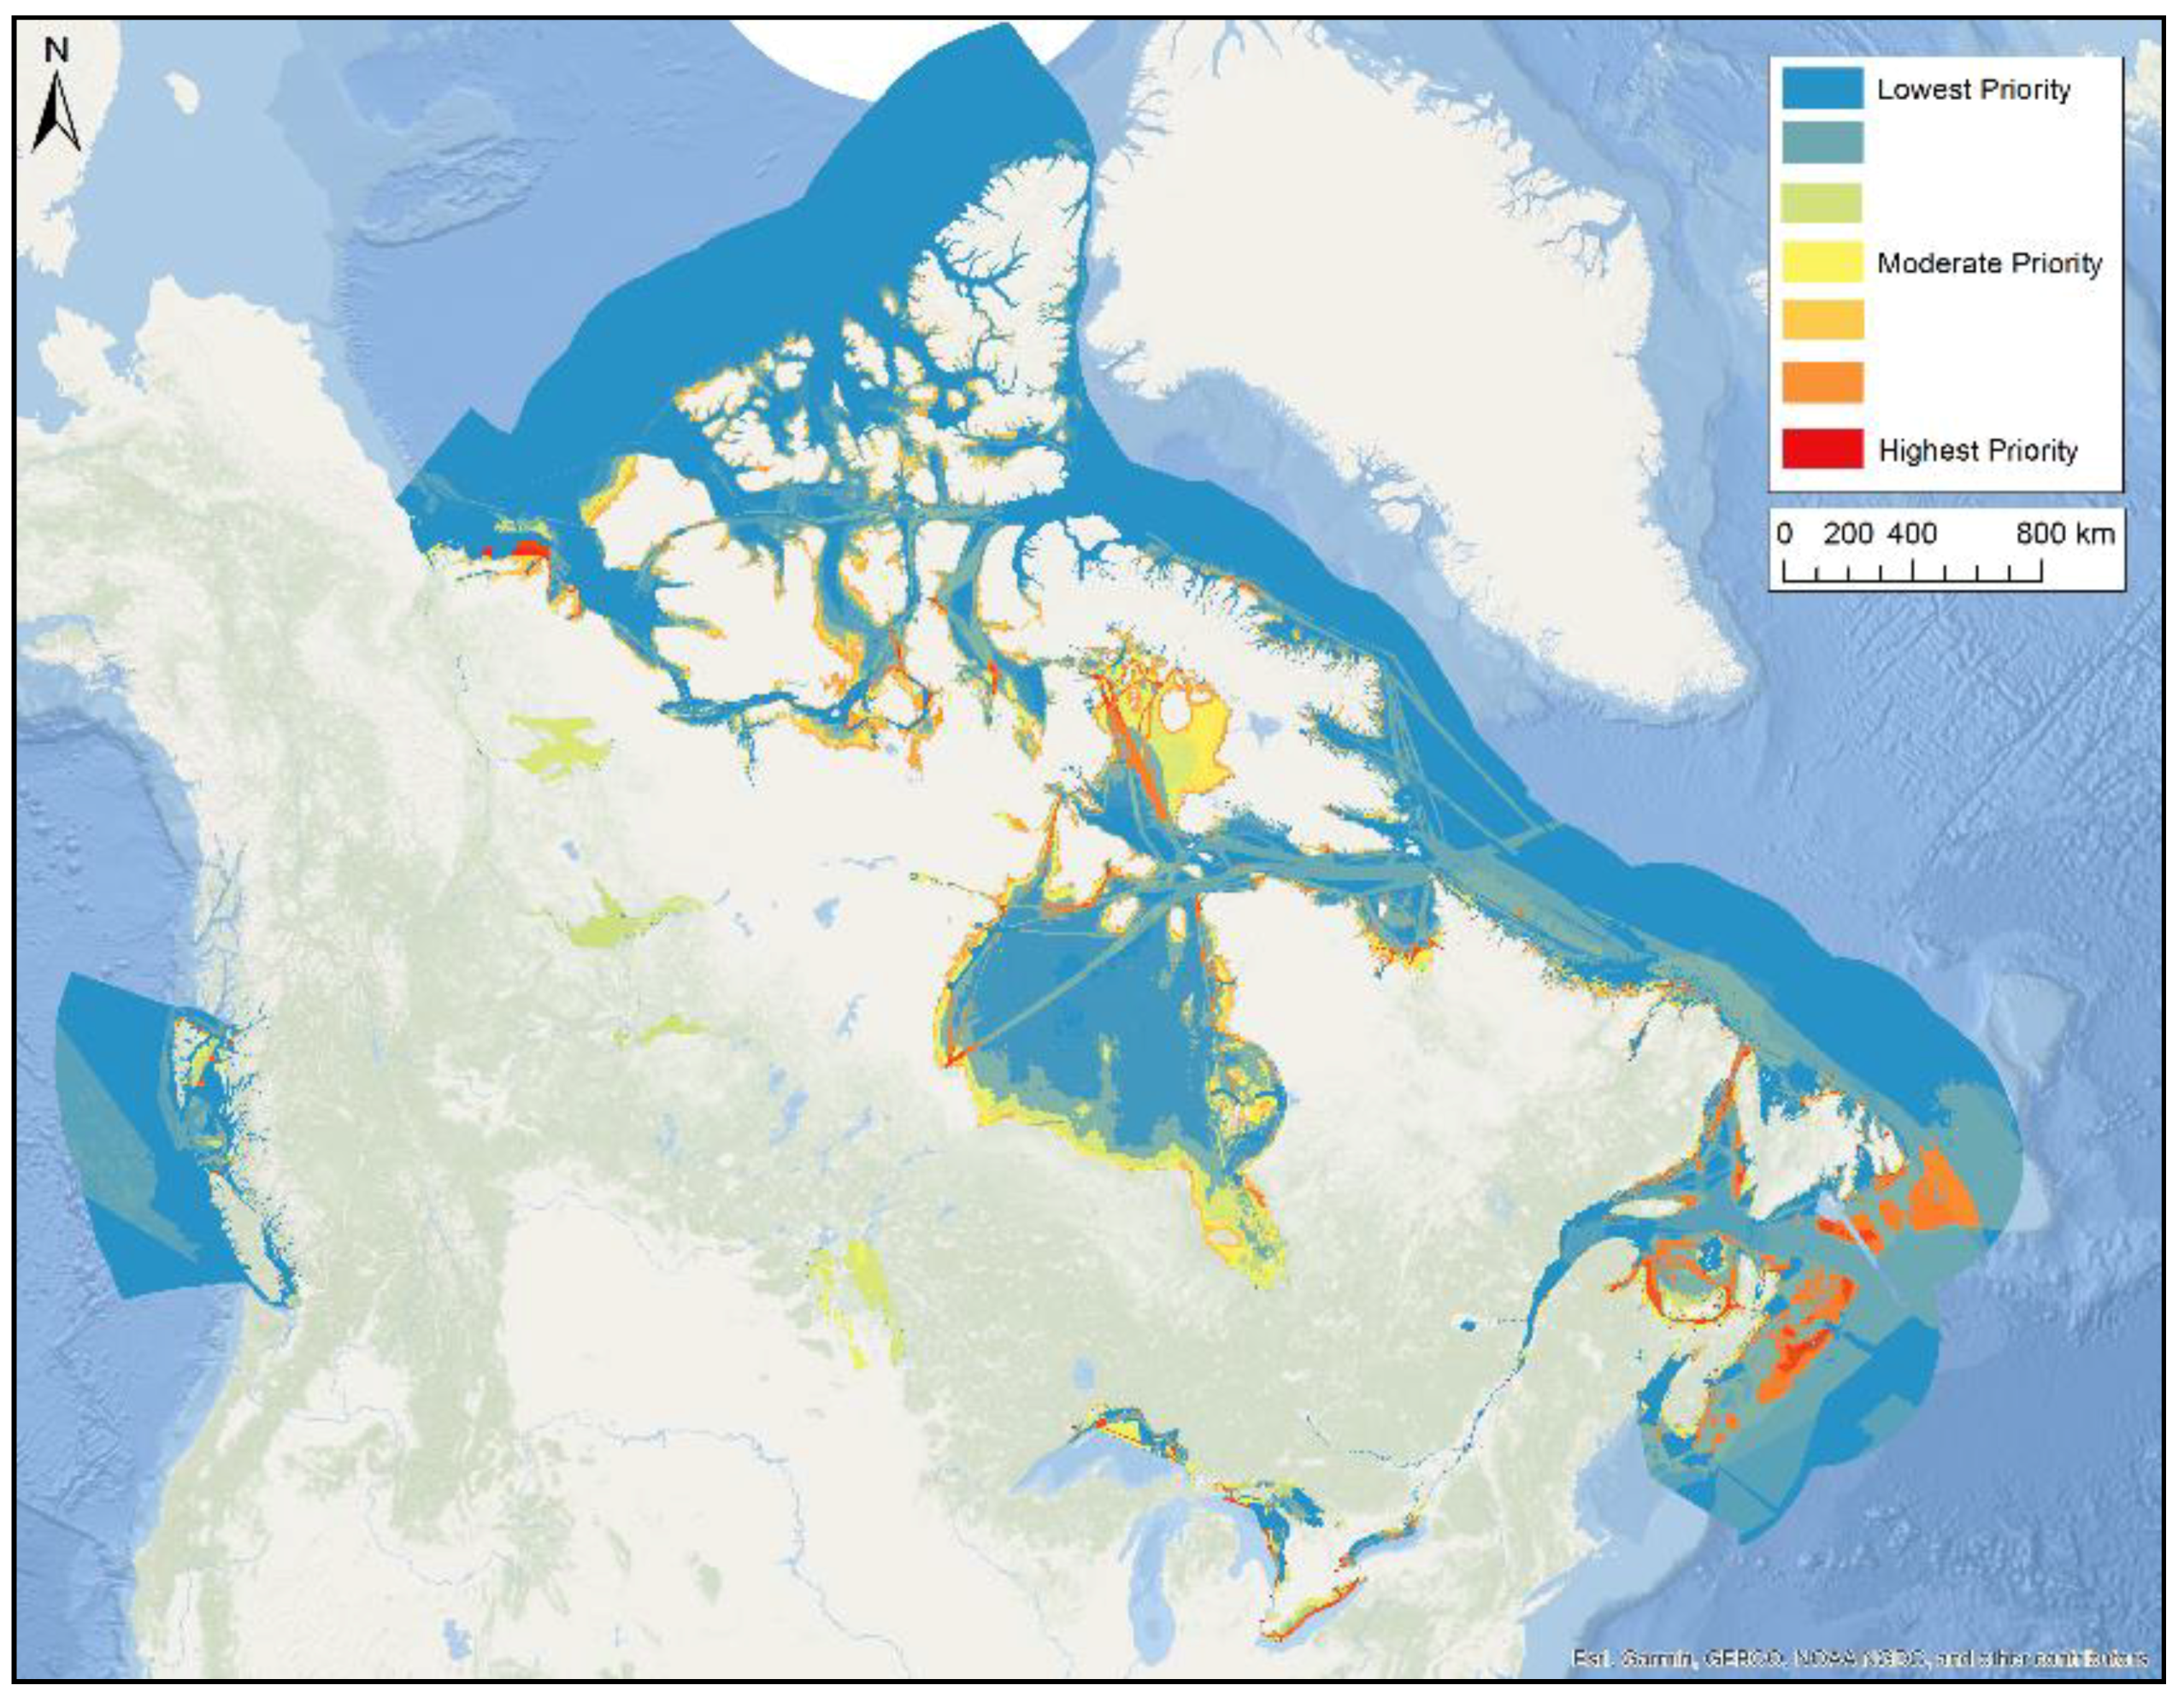
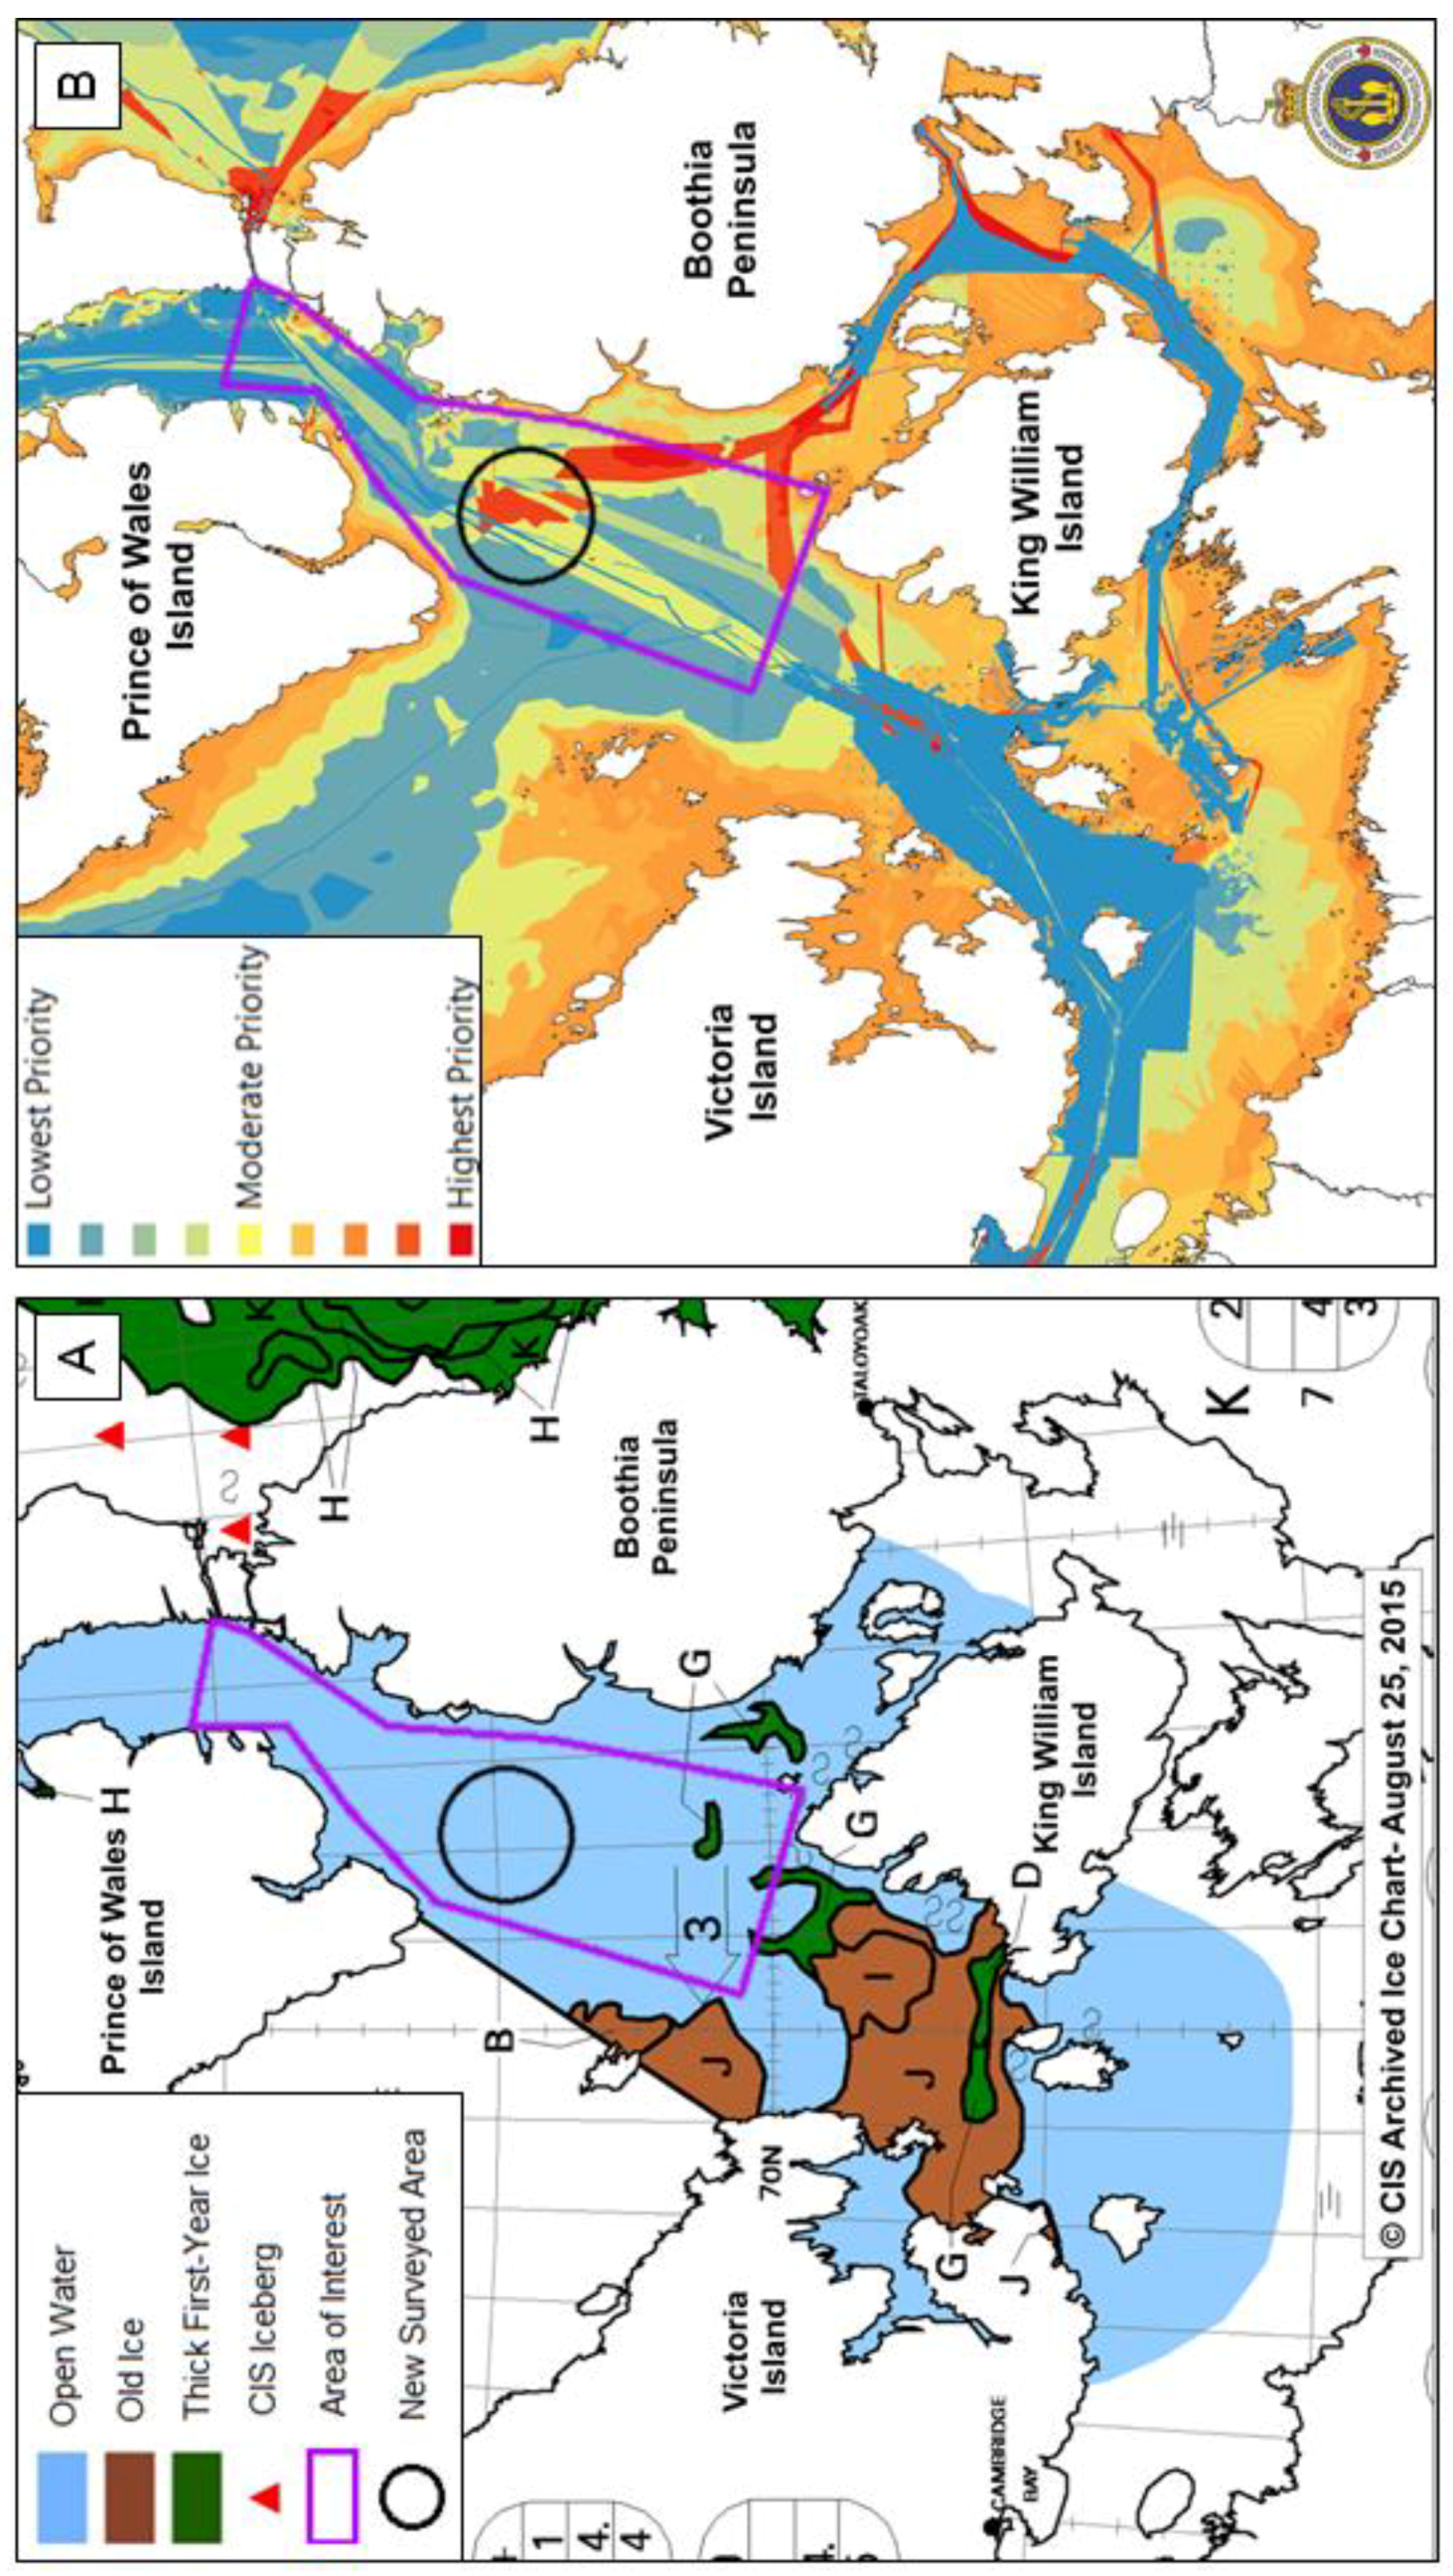
4. Results and Discussion

As previously mentioned, CHS’s response to the 2014 Fall Report of the Commissioner of the Environment and Sustainable Development Audit of Arctic Marine Navigation suggested the implementation of an operational planning tool by September 2016 [15]. The CPPT is currently operational and has been used to produce a long-term national chart production and survey plan (Figure 6). In order to meet operational deadlines, CHS conducted trials on the CPPT output in order to test the validity, delivery, and output of the tool. These trials showcased the CPPT’s diversity in application, from optimization of surveying missions, to a contingency plan while CHS staff are in the field.

4.1. Results and Quality Control

After the model is run and a survey and charting plan is created, the GIS team will evaluate the outputs to ensure that all the conditions of the model were executed properly and that the output respects the defined conditions. This is done by creating a matrix of all the factors that were inputted with their weights to ensure that their summation match the results in the output. After this validation, the survey and charting plan is evaluated with a CHS’s national committee where representatives from each regional office take a second look at the plan with a regional expertise. In its first year of operation (2016), the outputs from the CPPT were acceptable with just a few issues. The main issues related to the plan generated from the CPPT were related to the quality of some of the input data. One of the issues was that some of the data available at the national scale like the GEBCO have a coarse resolution (500 m grid), in some location this coarse dataset created some issues especially in narrow channels in British Colombia. In order to fix those issues, CHS used existing products like paper charts and ENC to create a higher resolution product. It has to be noted that in locations where CHS does not have depth information, the GEBCO is still the source of data that is used, therefore this still remains a potential source of uncertainty in the model output. A second source of errors that was identified in the first year of operation was that the GIS layer of the survey did not correctly reflect CHS’s survey dataset. This was mainly related to data not being entered in the CHS main survey database. In some cases, hold field sheets that were not available digitally could not be entered into a GIS system. In the last two years, CHS made lots of effort to fix the issues related to the loading of survey data in our database. Since the tool is also available in a web version to all CHS’s employees for planning purposes, the model has also been scrutinized by many employees, and when inconsistencies are detected they are reported for correction. Since the quality of the output model is only as accurate as the input sources, the validation of the CPPT was not only beneficial to create an accurate model, but it also helped CHS to address issues related to other internal databases that are critical for its operation.

4.2. Other Applications of CPPT

The CPPT is a versatile tool, as it can handle both short- and long-term planning. In the past year, the CPPT has been used to support contingency planning for CHS staff participating in field surveys when required, such as when environmental conditions require a change to planned survey.

Contingency Plan

During a 2015 survey mission in the Victoria and Franklin Straits of the Canadian Arctic, the CPPT was used to provide an alternative solution to the original planned survey. Old ice and thick first-year ice was restricting work in the original planned survey area (area around J in Figure 7A), which was south of the area of interest. The GIS tool was used to produce a new survey plan to re-direct active operations to an area of interest (purple box) where ice conditions allowed for the completion of surveys. The black circles in Figure 7A,B show the area where surveying was completed, which is a high priority area from the CPPT output. Even if data was not collected in the original planned area, CHS was able to maximize resource use and productivity by collecting data in areas defined as critical for safe navigation. In the past, such actions would not have been possible and survey time could have been unused.

4.3. Future Work

The CHS’s Priority Planning Tool is currently operational, and the CPPT webmap is used by the department to view the GIS layers and the CPPT output. As a result of the tool now being used for decision making, its capabilities are being increasingly presented and showcased. This results in additional data being acquired in order to increase the accuracy of the output, as well as enabling the tool to consider other hydrographically important factors.
The CHS is investigating methods to collect traffic density statistics of small craft harbors and to expand the study conducted on large commercial ports. This will be a challenge as not all recreational ships are equipped with AIS receivers, therefore we will not be able to run statistics on the small craft harbor traffic volume. Compiling this dataset is important for the CPPT, as small craft harbors must be included in these statistics to serve CHS’s mandate. The CHS is considering methods to incorporate client feedback reports in to the CPPT.
The CHS will continue to improve the CPPT output as new data becomes available. It should be noted that some input datasets are updated annually, such as AIS datasets. As new AIS data is inputted, the Marine Transportation Corridors will be updated, which could change the location of priority areas.

5. Conclusions

Charting Canada’s vast areas of oceans, inland waterways and coastlines is extremely challenging. With increased interest in shipping expected over time, particularly within the Arctic, the challenges facing CHS for the provision of information to support safe navigation will only grow. As such, being able to appropriately identify and prioritize areas for hydrographic survey is critical for CHS to be able to achieve its mandate. The CHS Priority Planning Tool (CPPT) represents an integration of geospatial information within a GIS that are compiled and analyzed to provide a layer of surveying and charting priorities. Results of the application of CPPT illustrate how its use has allowed for more efficient and effective planning of CHS survey activities, thus maximizing the value of deployed Government of Canada resources within a dynamic operational environment. The CPPT showcases priority areas which allow CHS to create a long-term charting and surveying plan.
As resource development continues throughout the Canadian Arctic it will be imperative for CHS to assure the highest confidence in the products we offer. Prime Minister Trudeau announced in March 2016 that the Government of Canada is committed to protecting a warming Arctic [16]. Thus navigational safety in the Arctic will have to increase within the Marine Transportation Corridors. By implementing the CPPT, CHS can better adapt and act on new programs, technologies, and initiatives falling under our mandate, while considering hydrographic priorities on a national scale.

Author Contributions

R.C. contributed to the idea and helped write the article. L.A. contributed to the idea, helped write the article, and provided the majority of the analysis. H.M. helped write the article and provided some analysis.

Funding

This research received no external funding.

Acknowledgments

The authors would like to thank and acknowledge all parties that provided data for the CHS Prioritization and Planning Tool. The authors would like to extend special thank you to Olivier Sabourin and Ryan Ahola for his contribution.

Conflicts of Interest

The authors declare no conflicts of interest.

References

  1. DFO. The Role of the Canadian Government in the Oceans Sector; Oceans Directorate, Fisheries and Oceans Canada: Ottawa, ON, Canada, 2008; ISBN 978-1-100-11233-6. [Google Scholar]
  2. Fadaie, K. CHS Role in the Implementation of a World Class Tanker Safety System. In Proceedings of the US-Canada Hydrographic Commission, Harbor, MD, USA, 16 March 2015. [Google Scholar]
  3. Government of Canada. Harper Government Takes Action to Enhance Marine Safety in the Arctic. Archived News Release. 2015. Available online: https://www.canada.ca/en/news/archive/2015/07/harper-government-takes-action-enhance-marine-safety-arctic.html (accessed on 19 February 2018).
  4. Growing the Middle Class. 2016 Budget. 2016. Available online: http://www.budget.gc.ca/2016/docs/plan/budget2016-en.pdf (accessed on 19 February 2018).
  5. Riding, J.; Roberts, J.; Priovolos, G. Land Information New Zealand. In New Zealand Hydrographic Risk Assessment—National Overview Issue 1; Marico Marine NZ Limited: Wellington, New Zealand, 2016. [Google Scholar]
  6. National Oceanic and Atmospheric Administration. National Hydrographic Survey Priorities. U.S. Department of Commerce. Available online: https://nauticalcharts.noaa/gov/publications/national-Hydrographic-survey-prioirties.html (accessed on 19 February 2018).
  7. Transport Canada. Investments under the Oceans Protection Plan to protect Canada’s Arctic Coast and Water. Government of Canada, 2017. Available online: https://www.canada.ca/en/transport-canada/news/2017/08/investments_undertheoceansprotectionplantoprotectcanadasarcticco.html (accessed on 22 February 2018).
  8. Leyzack, A.; Chenier, R.; Hinds, S. Marine Corridors: A Methodology for Planning and Prioritizing Surveys, Products and Services. In Proceedings of the Canadian Hydrographic Conference, St. John’s, NL, Canada, 14–17 April 2014. [Google Scholar]
  9. Chenier, R.; Abado, L.; Sabourin, O.; Tardif, L. Northern marine transportation corridors: Creation and analysis of northern marine traffic routes in Canadian waters. Trans. GIS 2017, 21, 1085–1097. [Google Scholar] [CrossRef] [Green Version]
  10. International Hydrographic Organization. IHO Standards for Hydrographic Surveys. In International Hydrographic Organization, 5th ed.; Special Publication N°44; International Hydrographic Bureau: Monaco, Monaco, 2008. [Google Scholar]
  11. Goodchild, M. The State of GIS for Environmental Problem-Solving. In Environmental Modeling with GIS; Oxford University Press: New York, NY, USA, 1993; pp. 8–15. [Google Scholar]
  12. Malczewski, J. On the Use of Weighted Linear Combination Method in GIS: Common and Best Practice Approaches. Trans. GIS 2000, 4, 5–22. [Google Scholar] [CrossRef]
  13. Eastman, J.R.; Jin, W.; Kyem, P.A.K.; Toledano, J. Raster Procedures for Multi-Criteria/Multi-Objective Decisions. Photogramm. Eng. Remote Sens. 1995, 61, 539–547. [Google Scholar]
  14. ESRI GIS Dictionary. Available online: http://support.esri.com/en/knowledgebase/GISDictionary/term/quantile%20classification (accessed on 19 February 2018).
  15. Office of the Auditor General of Canada. Chapter 3 Marine Navigation in the Canadian Arctic. In 2014 Fall Report of the Commissioner of the Environment and Sustainable Development; Queen’s Printer of Canada: Ottawa, ON, USA, 2014. [Google Scholar]
  16. Dyer, E. Obama and Trudeau Pledge to Protect a Warming Arctic. CBC News, 2016. Available online: http://www.cbc.ca/news/politics/us-canada-arctic-protection-1.3486062 (accessed on 19 February 2018).
Figure 1. Government of Canada marine traffic corridors (MTCs).
Ijgi 07 00240 g001
Figure 2. Category zone of confidence (CATZOC) data for Canada, extracted from CHS’s bathymetry database. Extraction date for Bathymetry data is 8 March 2018.
Ijgi 07 00240 g002
Figure 3. Ports analyzed for only a risk of grounding and ports that were additionally analyzed for risk of collision.
Ijgi 07 00240 g003
Figure 4. Predicted drift polygons around the MTC from low to high probability of drift. Global Ice Prediction System (GIOPS) ocean current data for September 2017 represented as the calculated water velocity bearing.
Ijgi 07 00240 g004
Figure 5. The CPPT Workflow. Phase 1 is the GIS phase of the CPPT, while Phase 2 is the Matrix phase. Quality assurance is completed on both phases of the CPPT.
Ijgi 07 00240 g005
Figure 6. The CPPT output, with priority zones present in all navigable waterways on a national scale for Canada.
Ijgi 07 00240 g006
Figure 7. The 2015 survey mission in the Victoria and Franklin Straits: CIS Archived Ice Chart showing areas scheduled for survey (A). The CPPT output used to find new a survey area (B).
Ijgi 07 00240 g007
Table 1. Main geographic information system (GIS) layers used in the Canadian Hydrographic Service (CHS) Priority Planning Tool (CPPT).
ComponentInformationSource
Marine Transportation CorridorsPrimary/Main, Secondary/Approach, Tertiary/Refuge, Private Interest, and Proposed CorridorsCHS, Canadian Coast Guard (CCG), Transport Canada (TC)
Water Depth0–20 m, 21–50 m, 51–100 m, 101–200 m, 200+ mCHS Paper charts/Electronic Navigational Charts (ENC), General Bathymetric Chart of the Oceans (GEBCO)
CHS Existing SurveysSurvey Category Zone of Confidence (CATZOC) A, CATZOC B (acceptable)CHS—Survey data
Seafloor ComplexityLow, medium, high complexityCHS Paper charts/ENC, GEBCO
Survey RequirementsComplex/Non-Complex seabed and CATZOCCHS Paper charts/ENC, GEBCO
Anchorage Areas and Ports Area, 1 km buffer zoneCHS Paper charts/ENC
Ice ConcentrationLow, medium, high concentration; multi-year iceEnvironment Canada (EC), Canadian Ice Service (CIS)
Wind Speed20 class average, low to highEnvironment Canada (EC), CHS
Tidal WindowsLarge tide areasCHS
Risk of Grounding and Collision (Geographic Area)Very low, low, medium, high, very high for both Risk of Grounding and Risk of CollisionCHS, CCG
CHS Drift AnalysisHigh, medium, and low values of probability of drift CHS
CHS Major ProjectsMajor Projects within CHS will drive priorityCHS
Table 2. CHS standards for hydrographic survey requirements.
ValueSurvey Requirement
0–20 mCATZOC A
21–50 mCATZOC A
51–100 m Complex SeafloorCATZOC A
51–100 m Non-Complex SeafloorCATZOC B
101–200 m Complex SeafloorCATZOC B
101–200 m Non-Complex SeafloorCATZOC C
200+ m CATZOC C
Table 3. Risk of grounding and risk of collision major factors.
Risk of Grounding FactorsRisk of Collision Factors
PIANCTrip density
Minimum channel depth and widthVessel maneuverability
Ship factors (speed, draft, width, length…)2 vs. 1 way traffic
Environmental (rides, wave height, wave exposure…)Visibility
Depth ratioIce
Survey accuracy Sedimentation
Table 4. Primary and secondary components: Matrix phase.
ComponentSource
Priority Output (GIS based)CHS
Risk of Grounding and Collision (as a reference)CCG, CHS
Port Tonnage (Chart based)CHS, TC
Trip Density (Chart based)CHS, TC
Chart Release DateCHS
Chart DatumCHS
Chart LanguageCHS
Chart DepthCHS
Chart ProjectionCHS
Chart Wellness (Chart based)CHS
Chart Sales (Customer based; includes small craft harbors)CHS

