A New Geographical Cluster View on Passenger Vehicle Purchasing in Chinese Cities


Abstract
1. Introduction
2. Background Literature
3. Methodology
3.1. Data and Research Area
3.2. Revealed Comparative Advantage (RCA) and Proximity
3.3. City Cluster Based on Proximity
3.4. Discriminant Analysis
4. Results
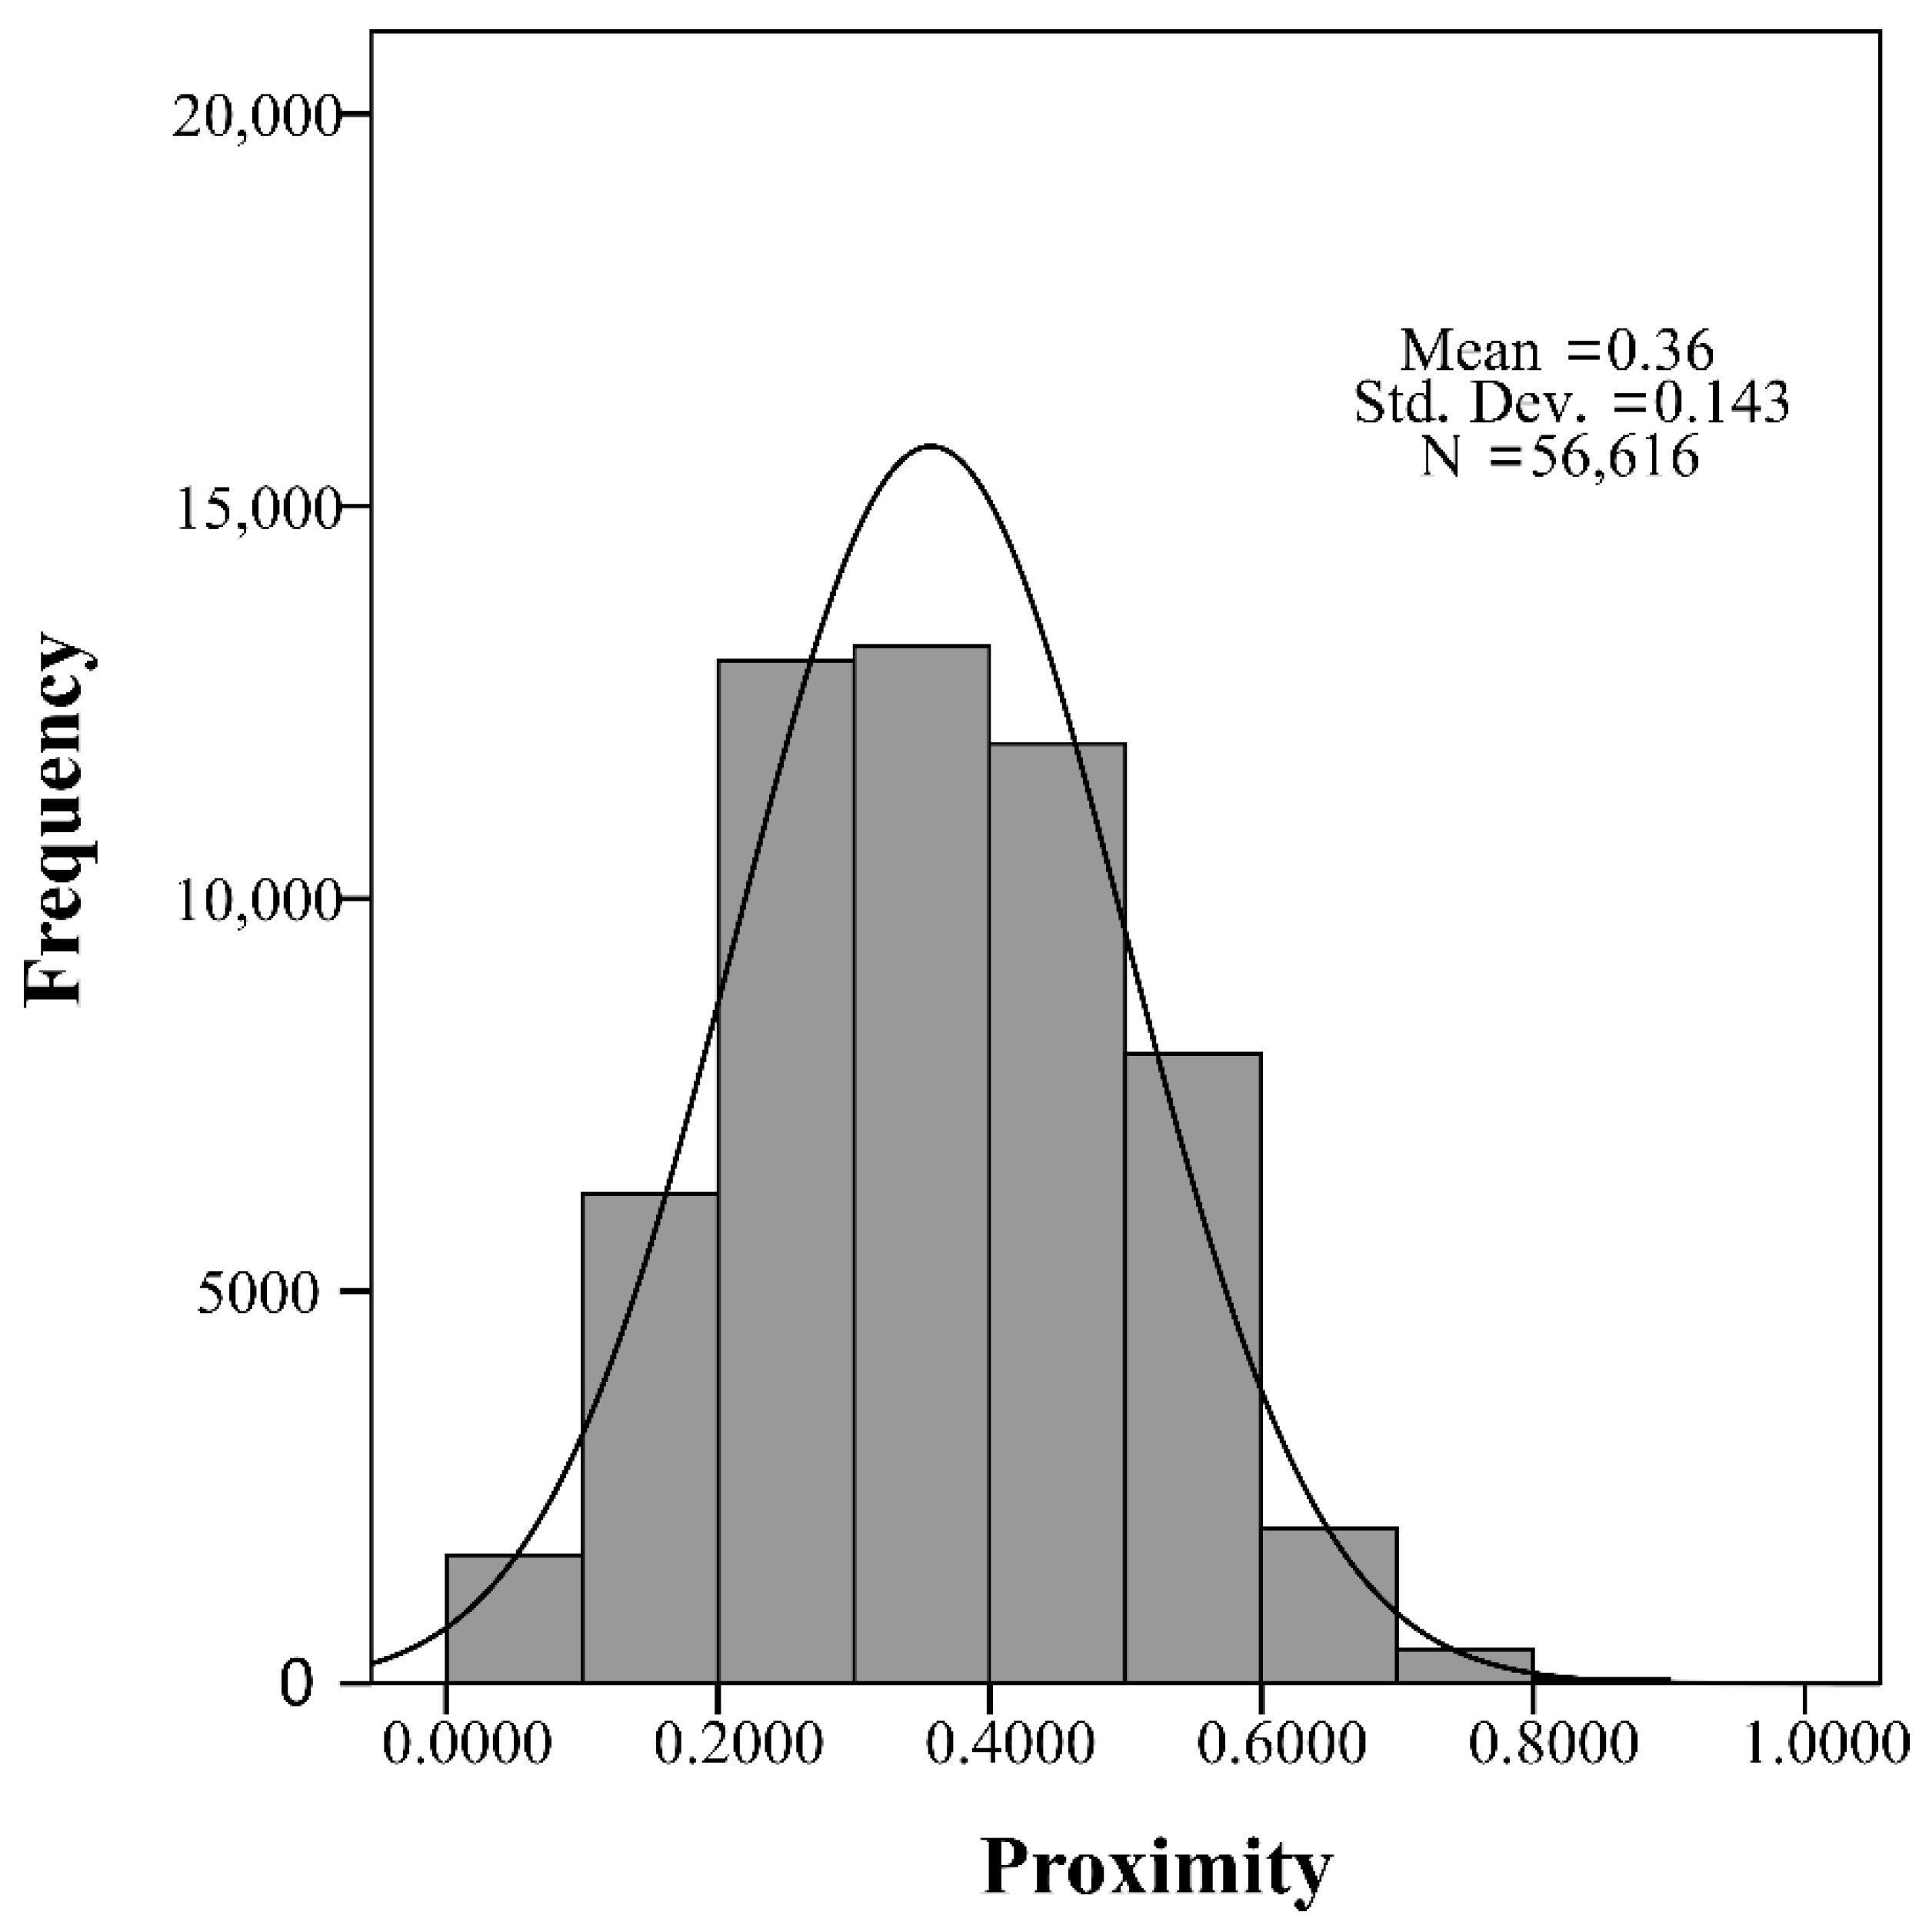
4.1. The Statistics of Proximity
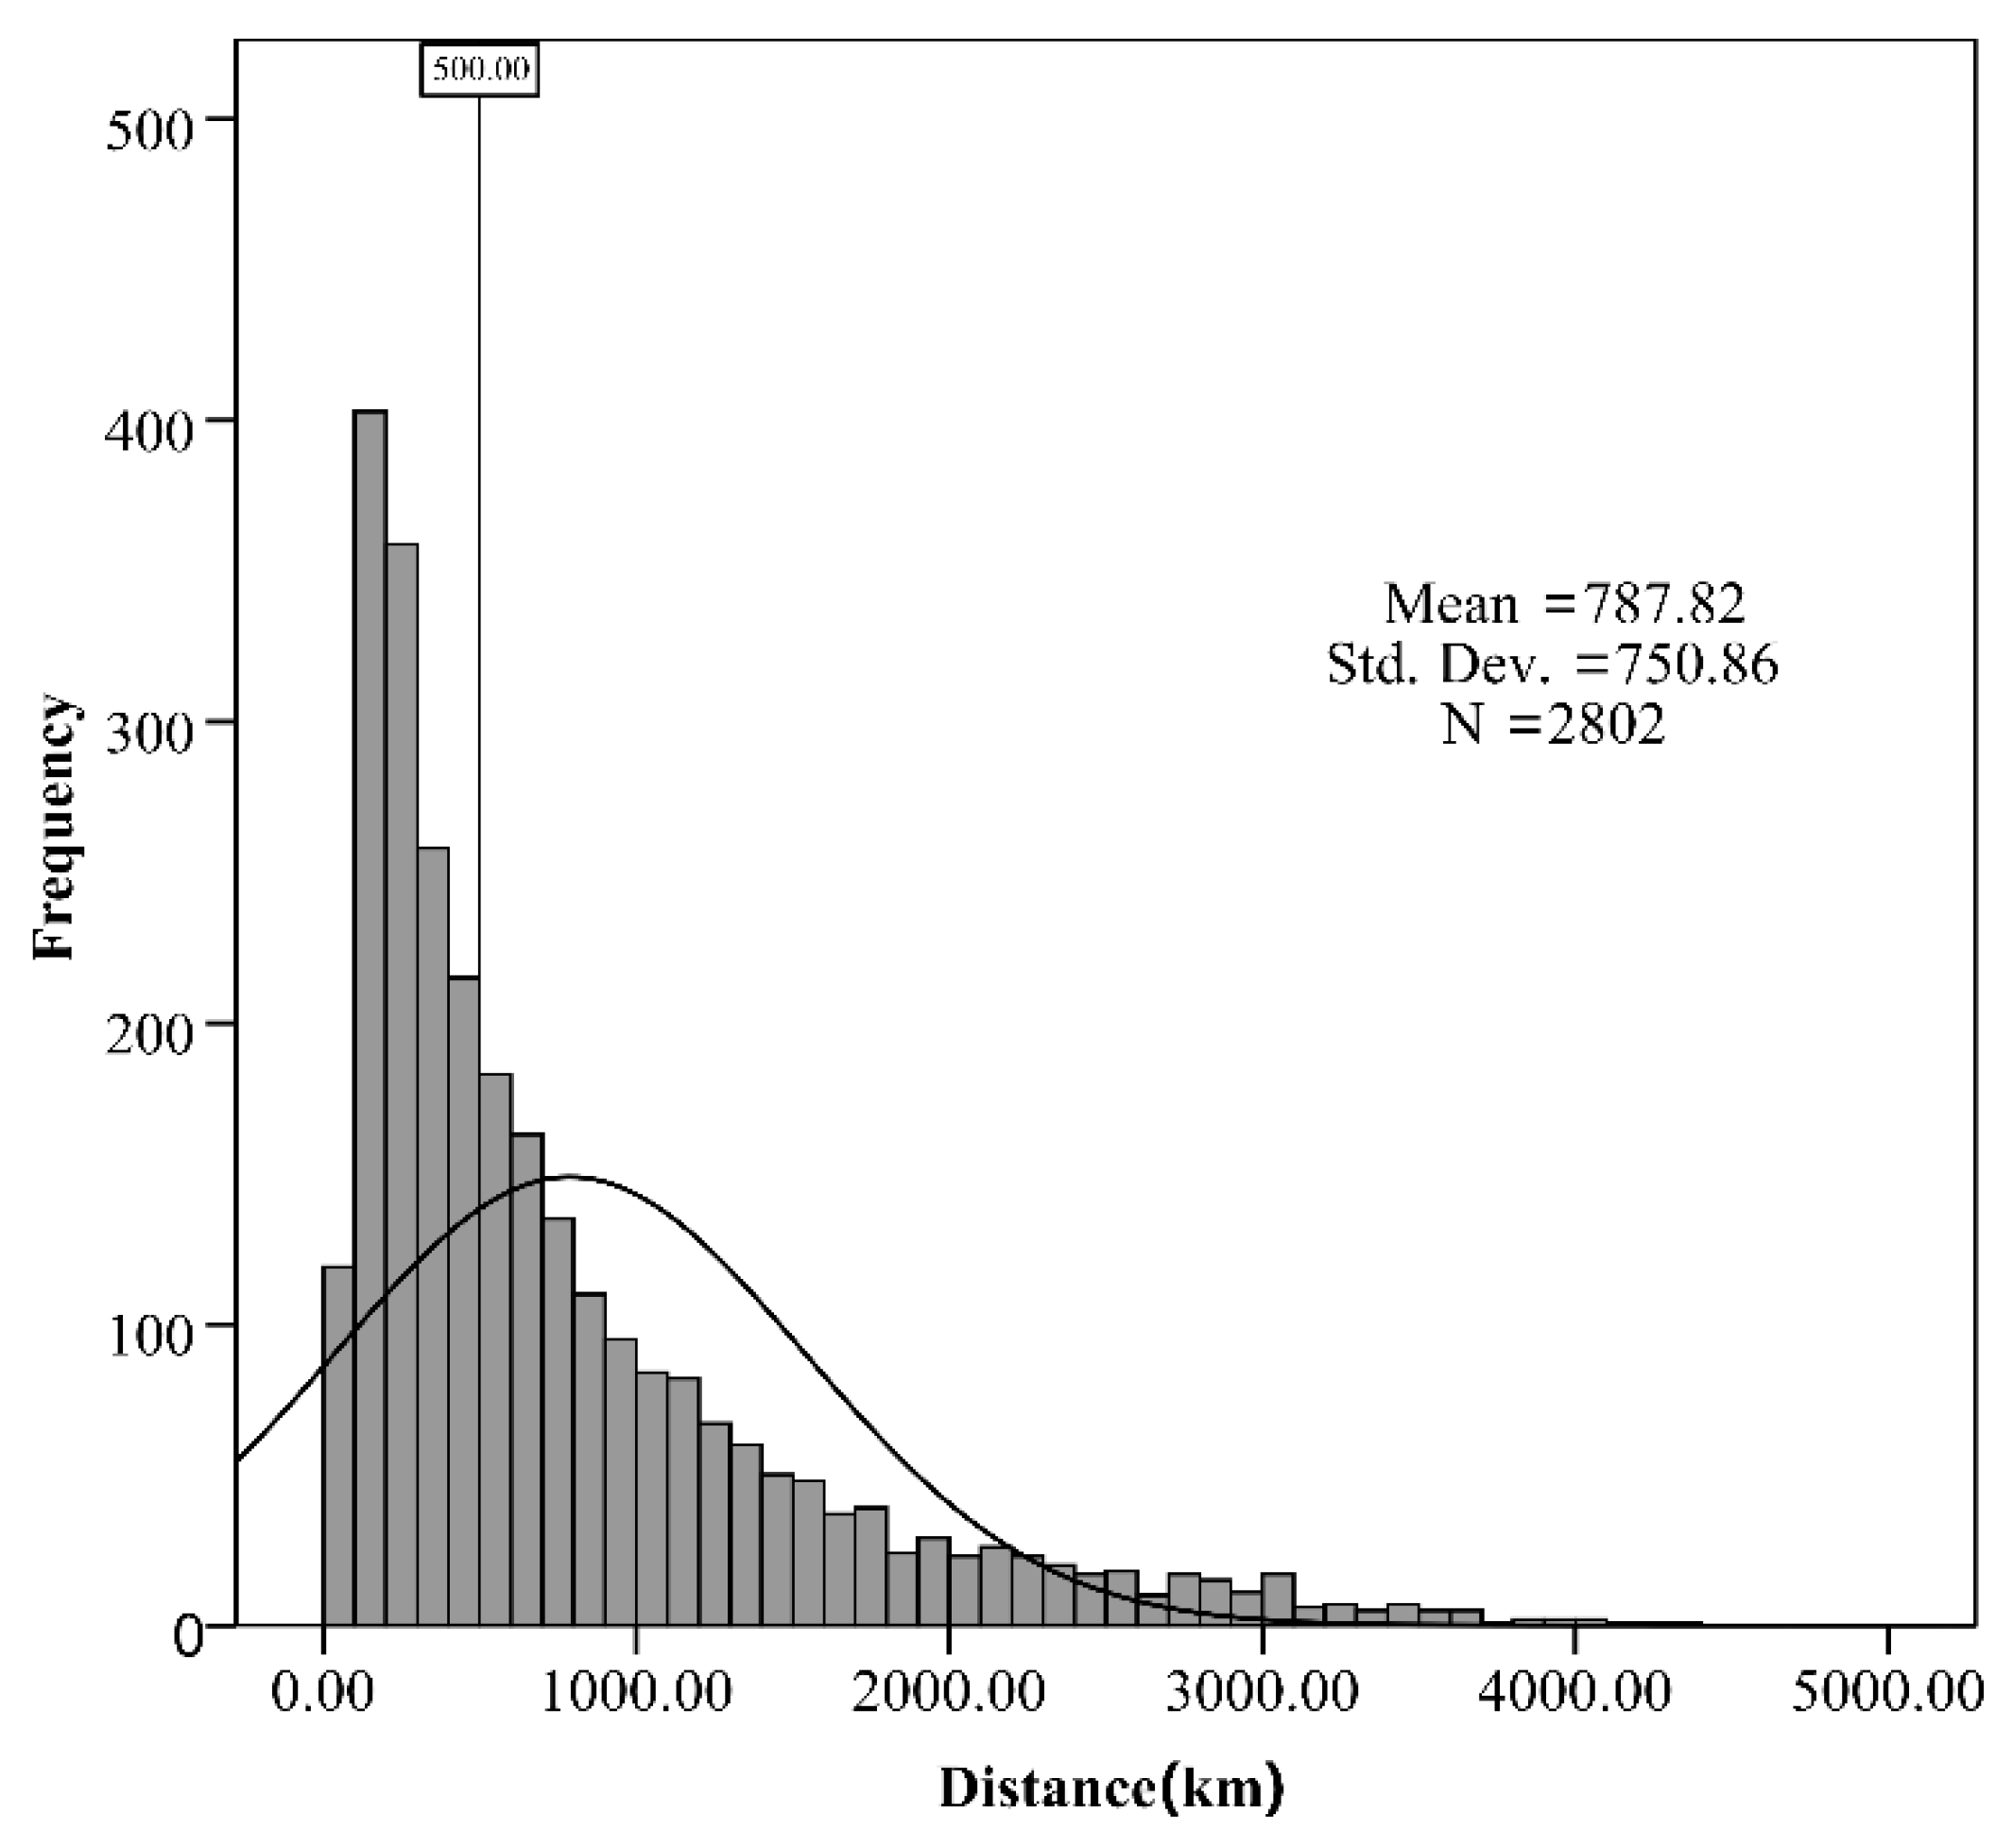
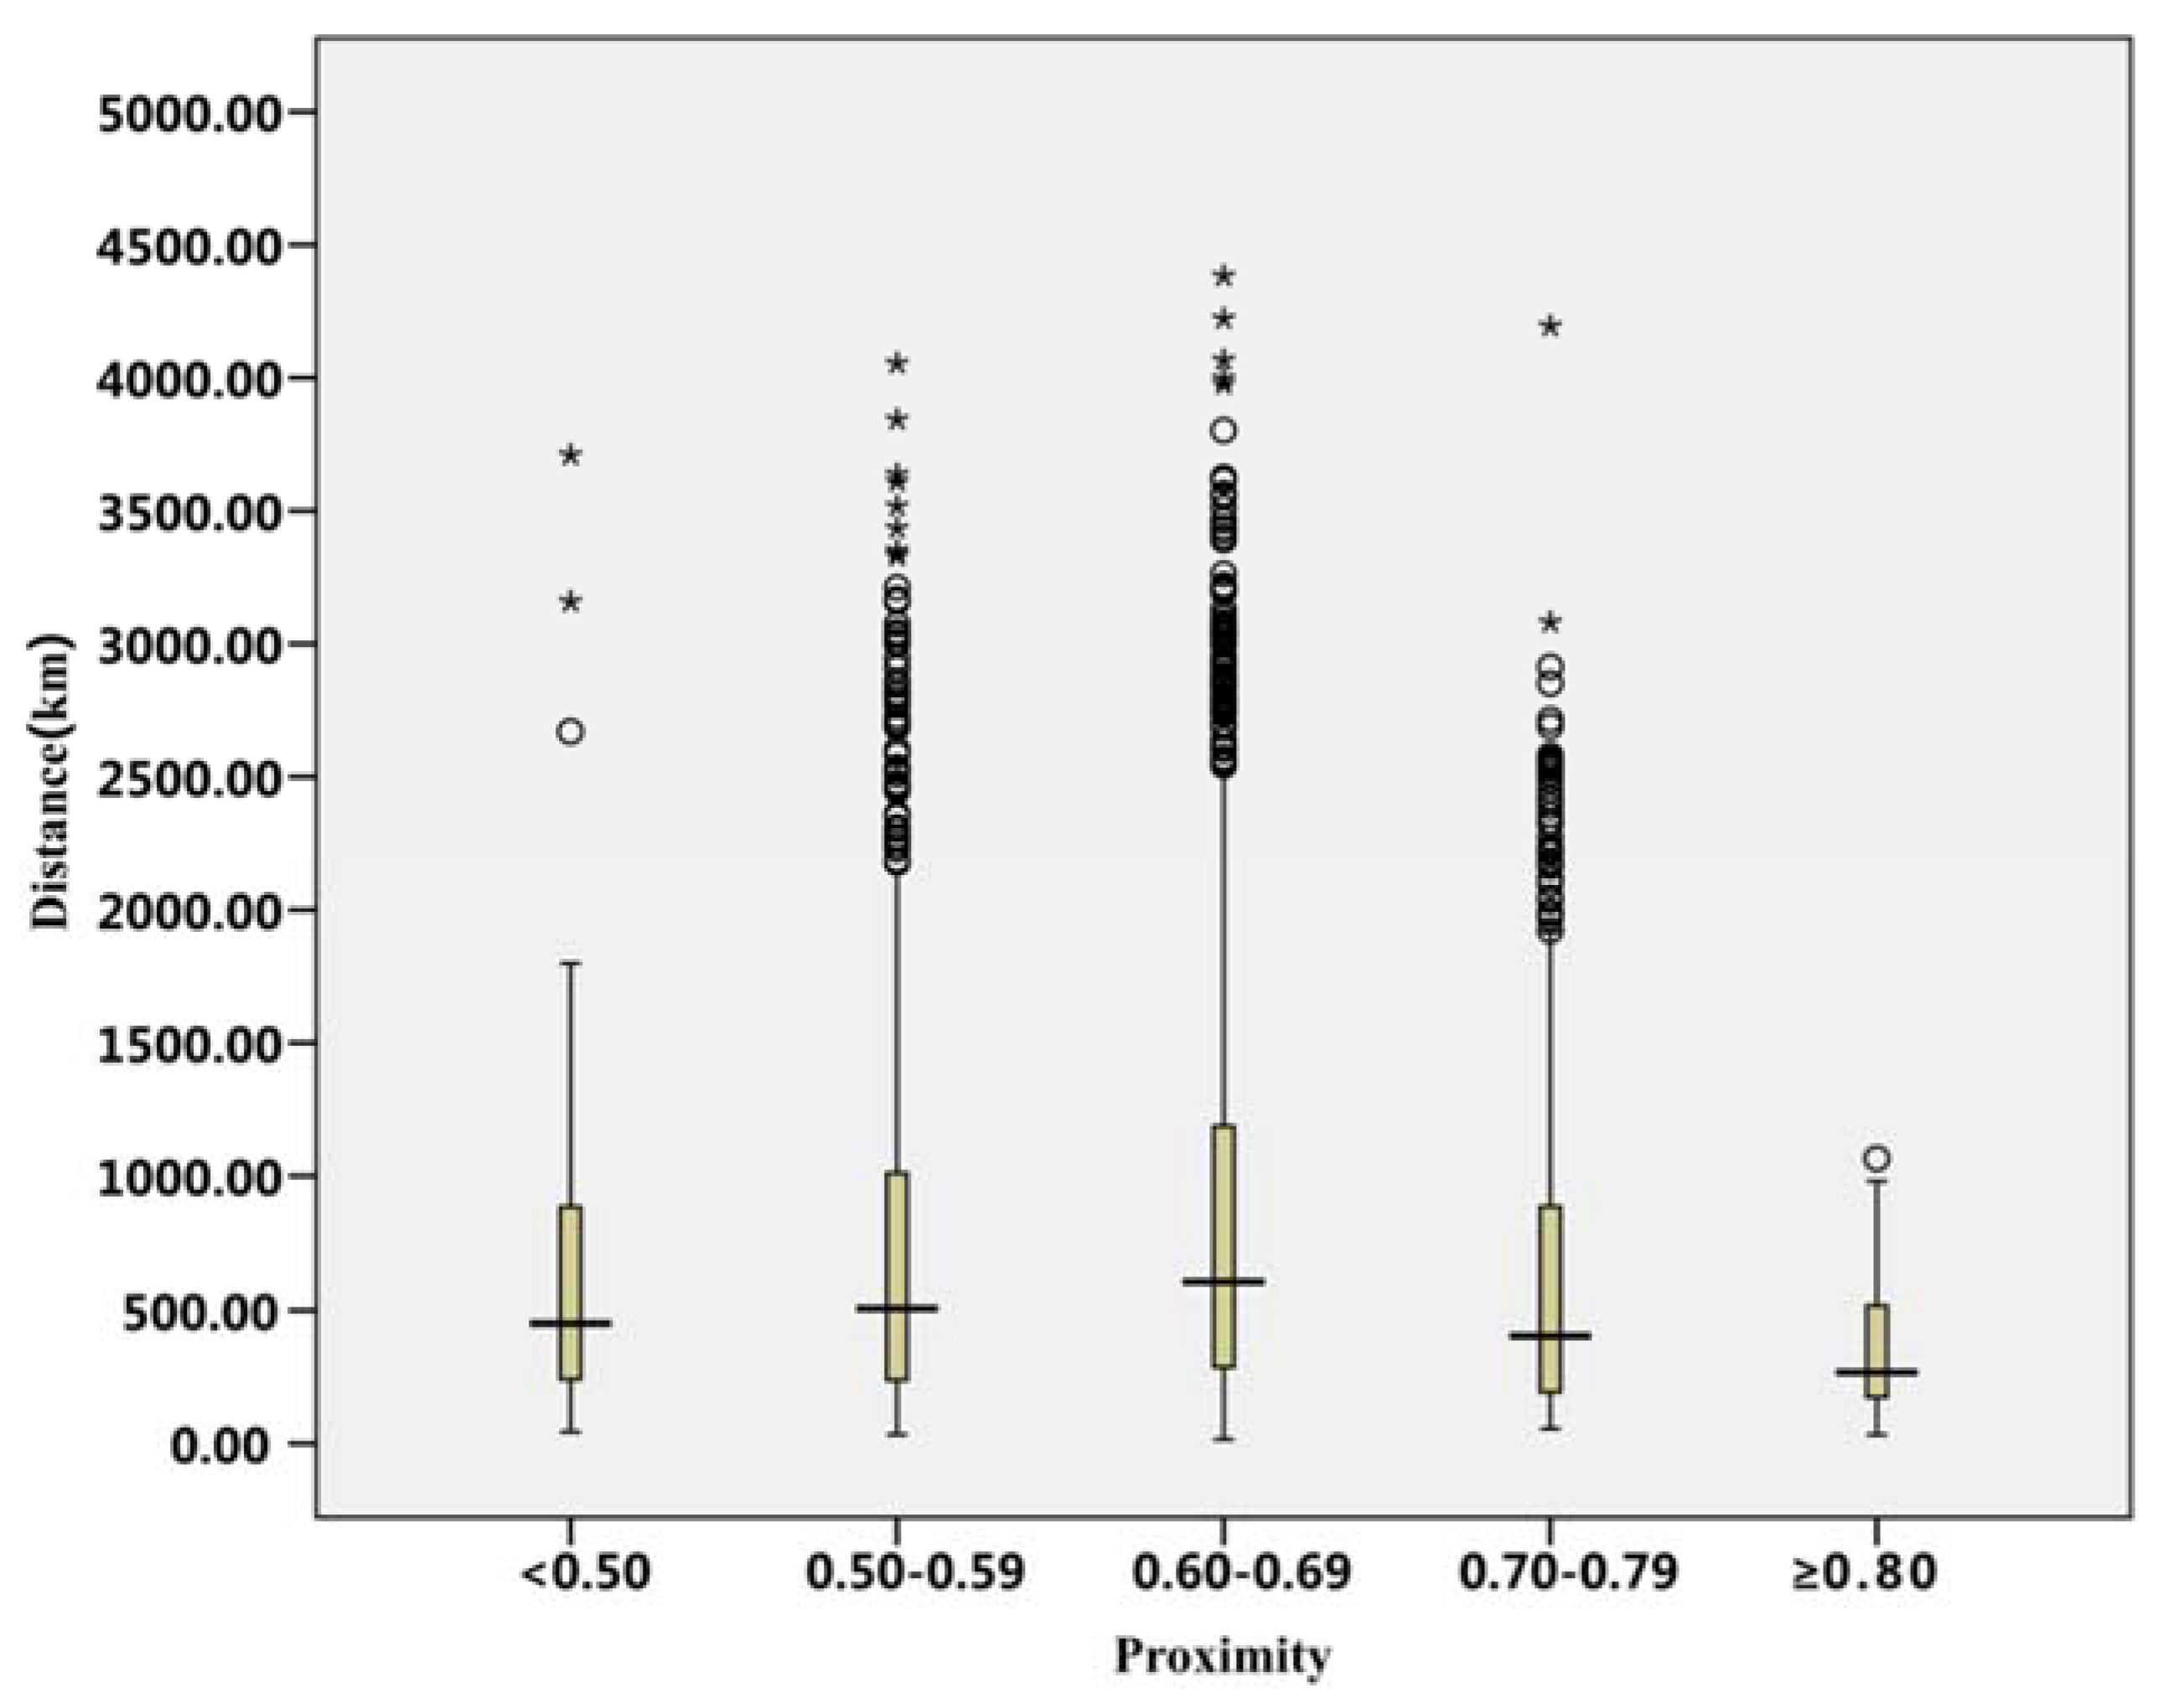
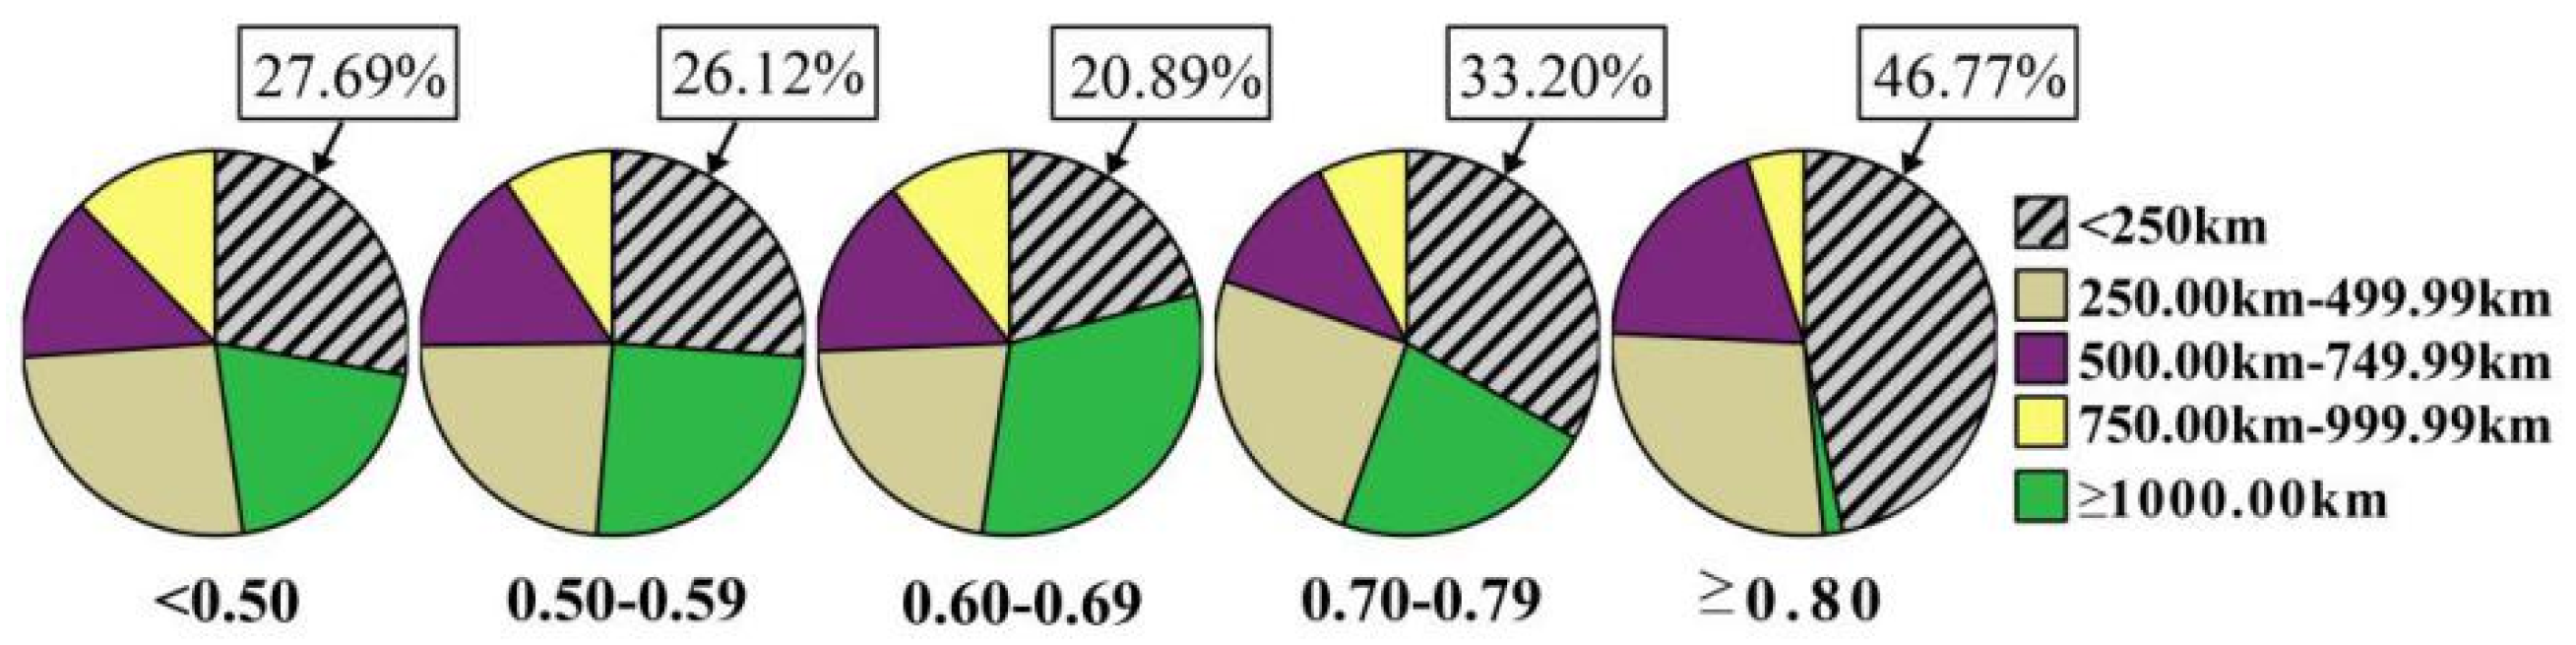
4.2. Proximity and Distance
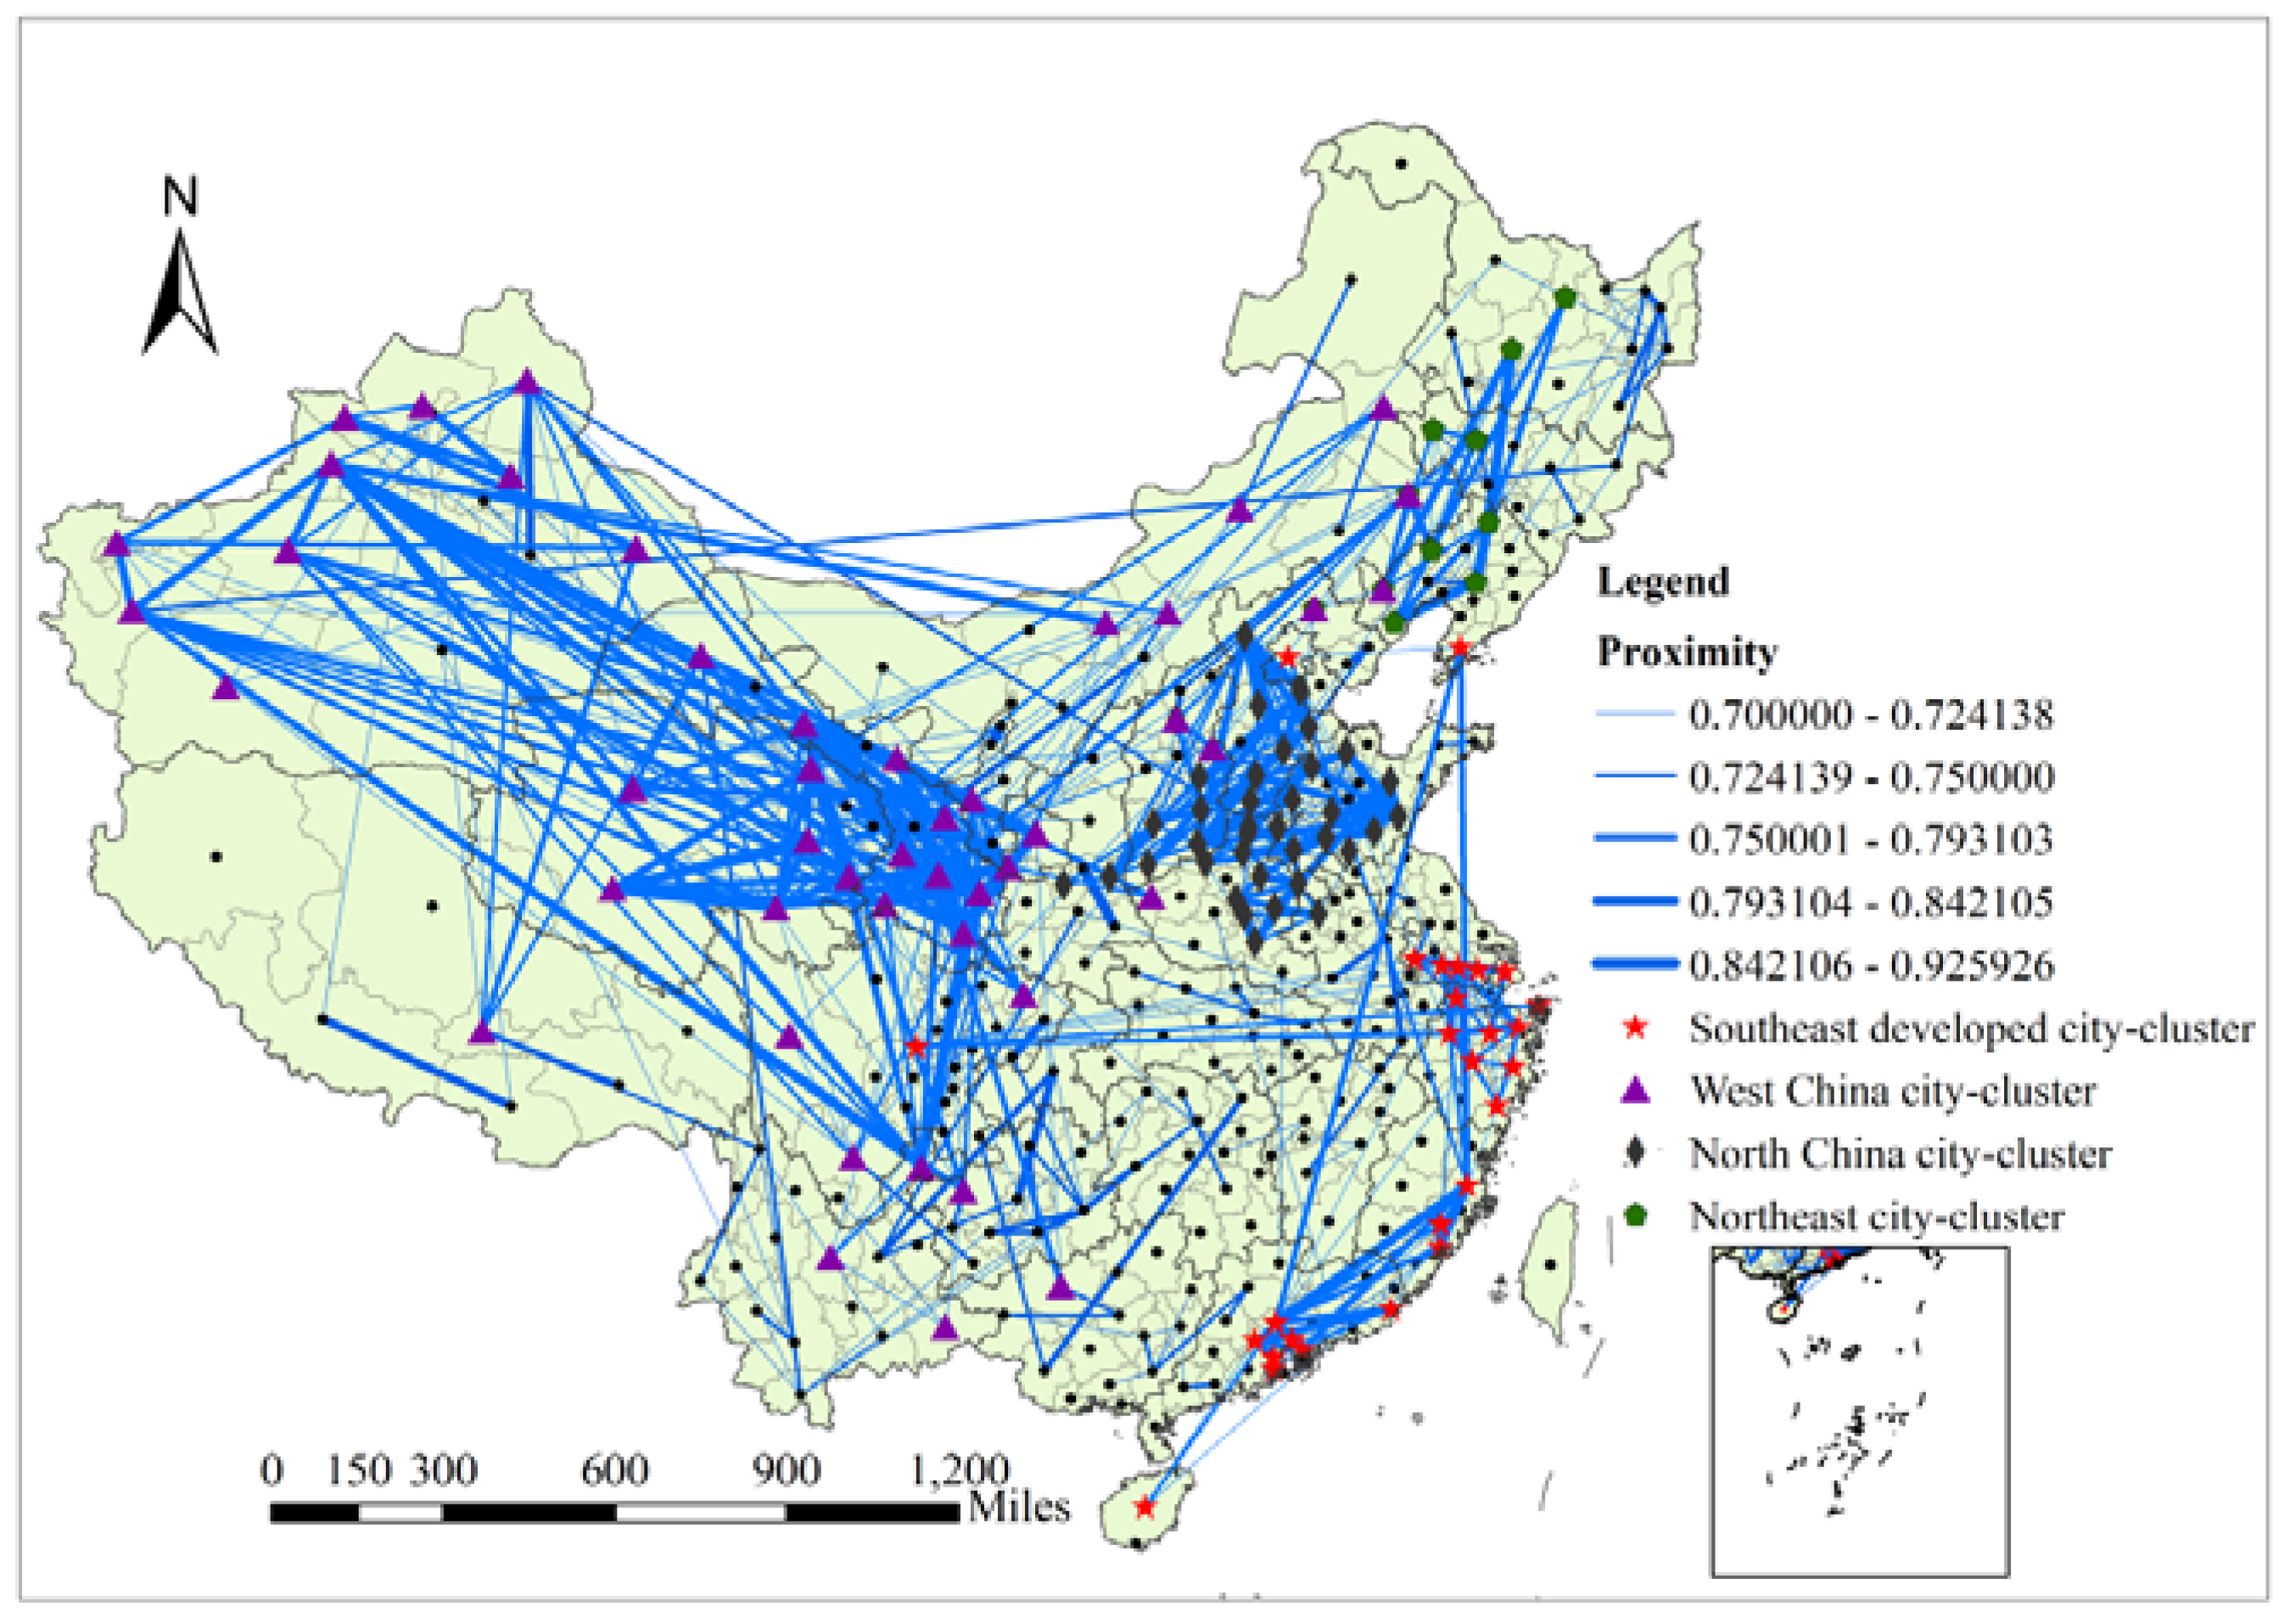
4.3. City Clusters Based on Higher Proximity Links
- (1)
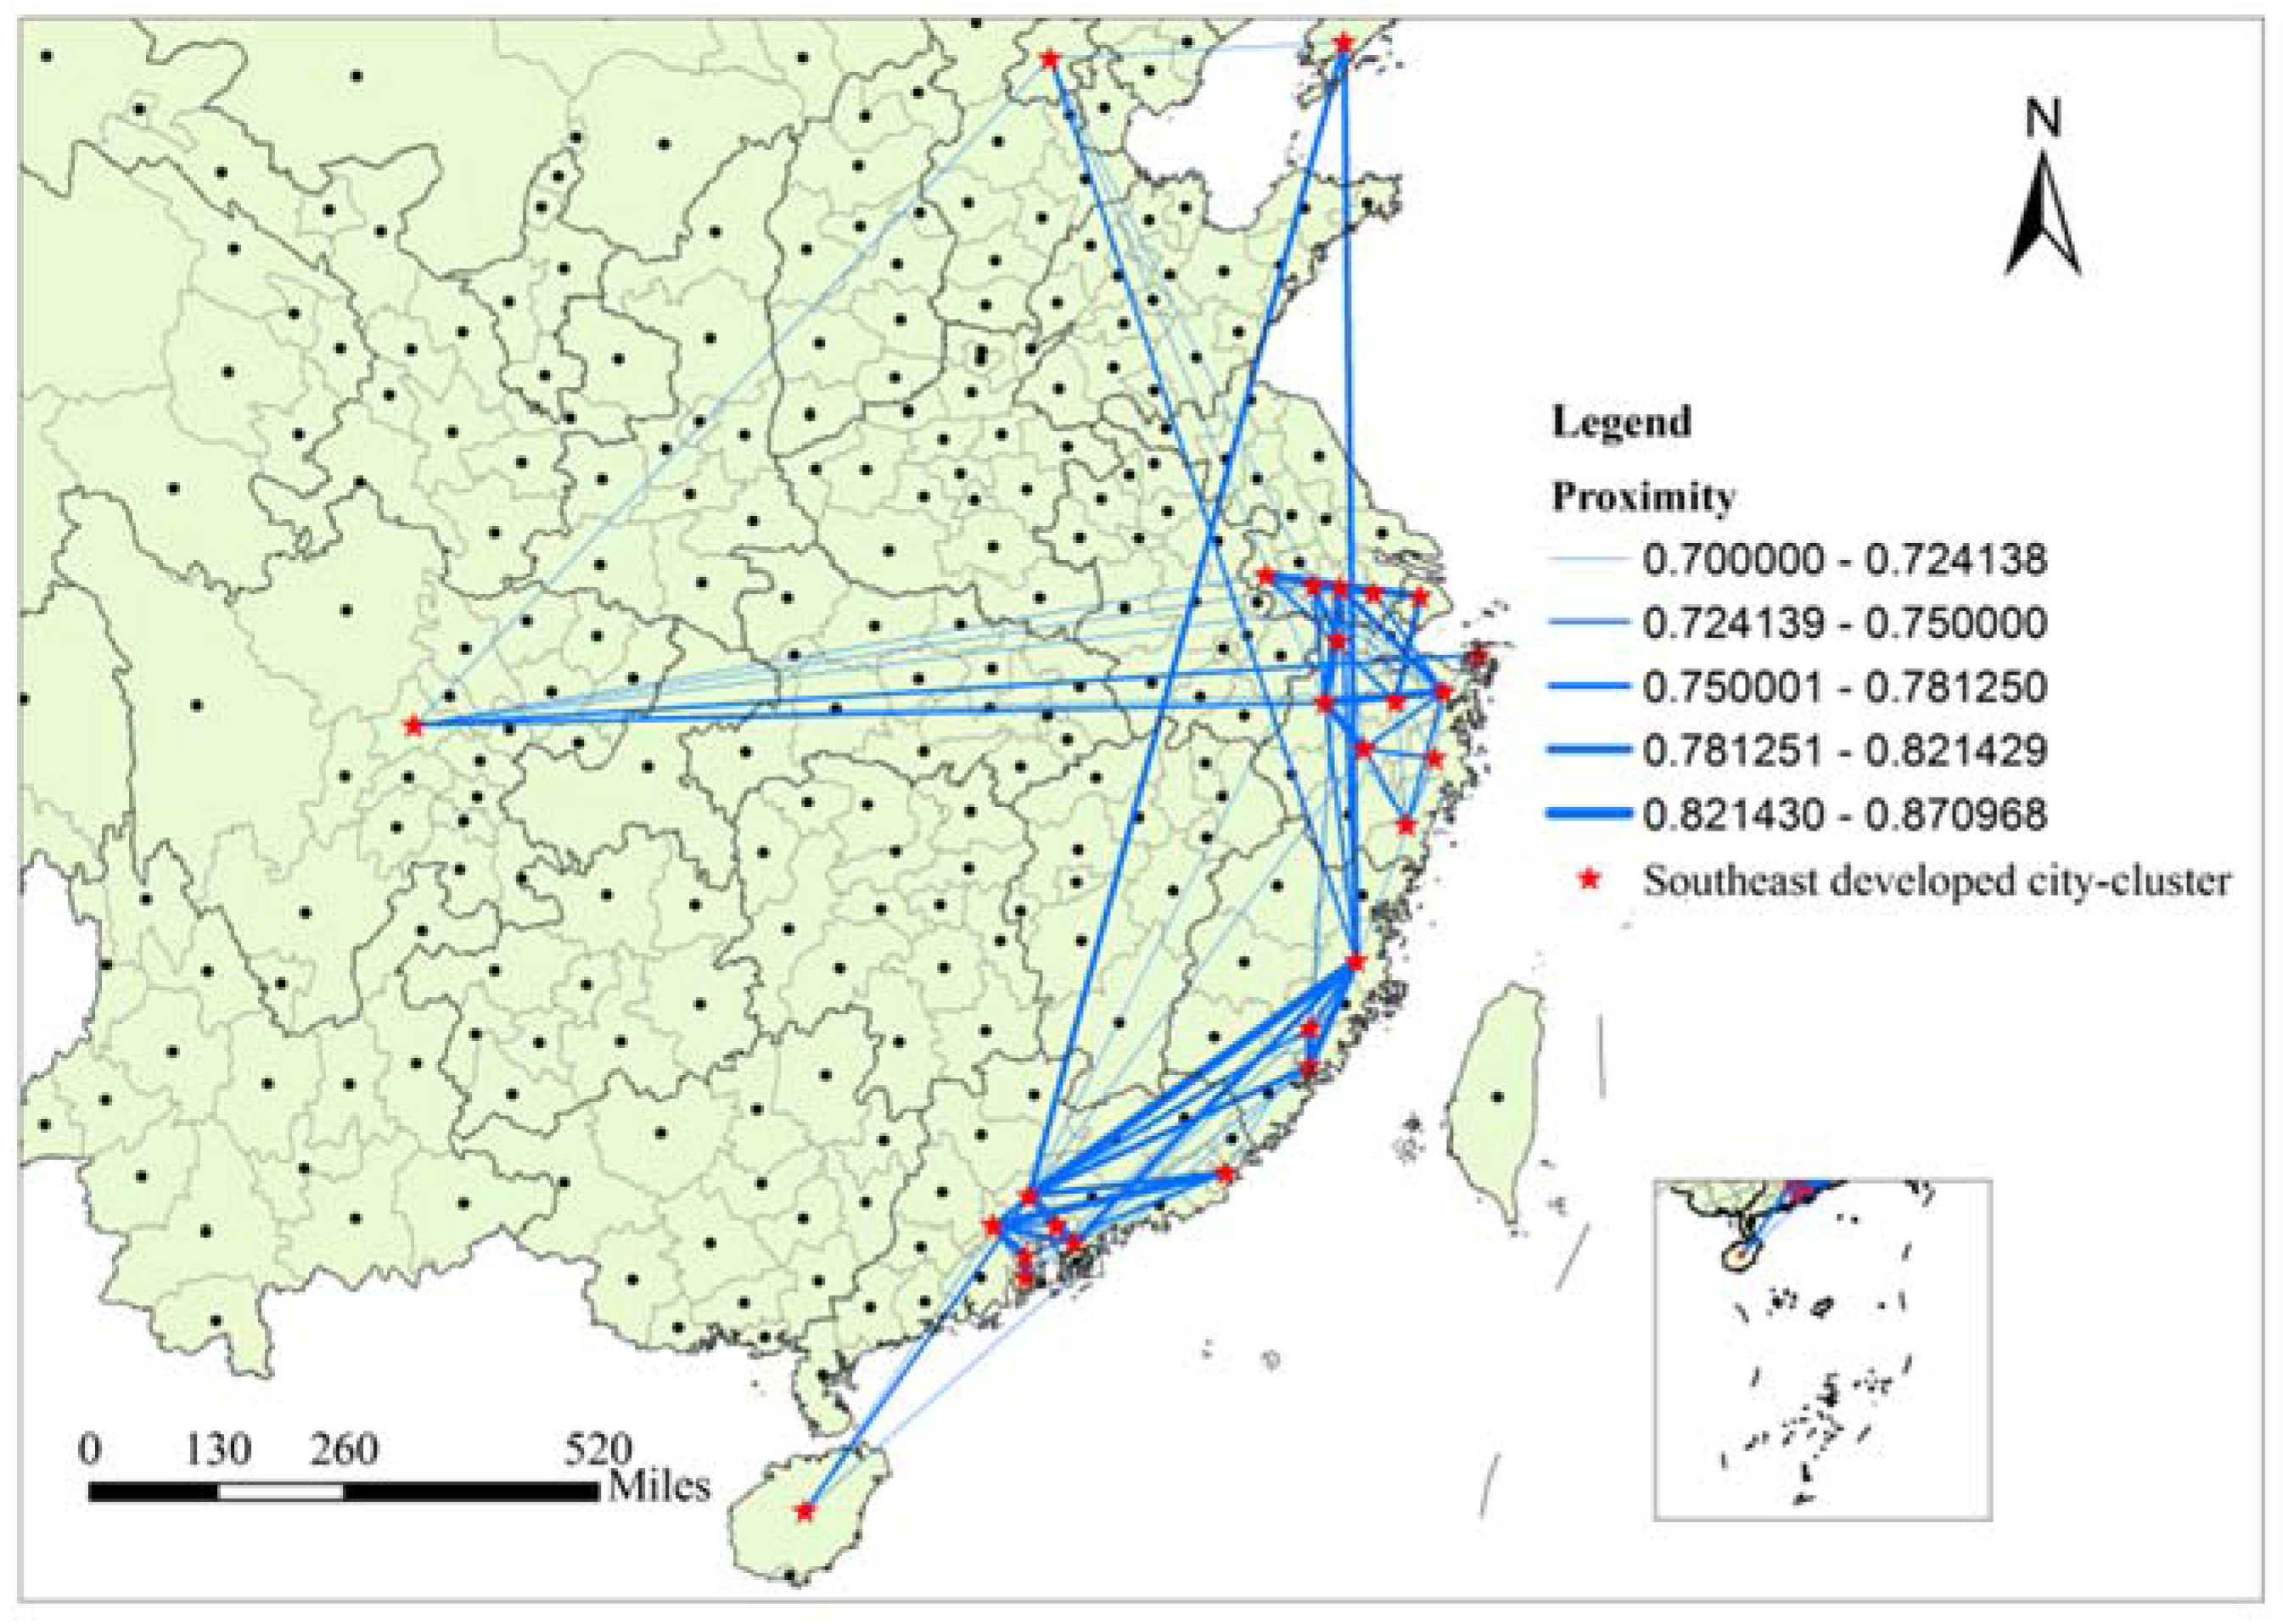
- The Southeast developed city-cluster. As Figure 6 shows, there are 27 cities in this cluster, most of which are located in the provinces in the southeast coastal area of China, such as Shanghai, Jiangsu, Zhejiang, Fujian, and Guangdong. Meanwhile, several economically developed inland cities are also included in this group, such as Beijing and Chengdu. Virtually all of them are prominent and populous cities with highly developed economies, not only in relation to their own provinces but also to the whole country of China. All of the cities are playing a leading role in shaping China’s current and future economic landscape and city space.
- (2)
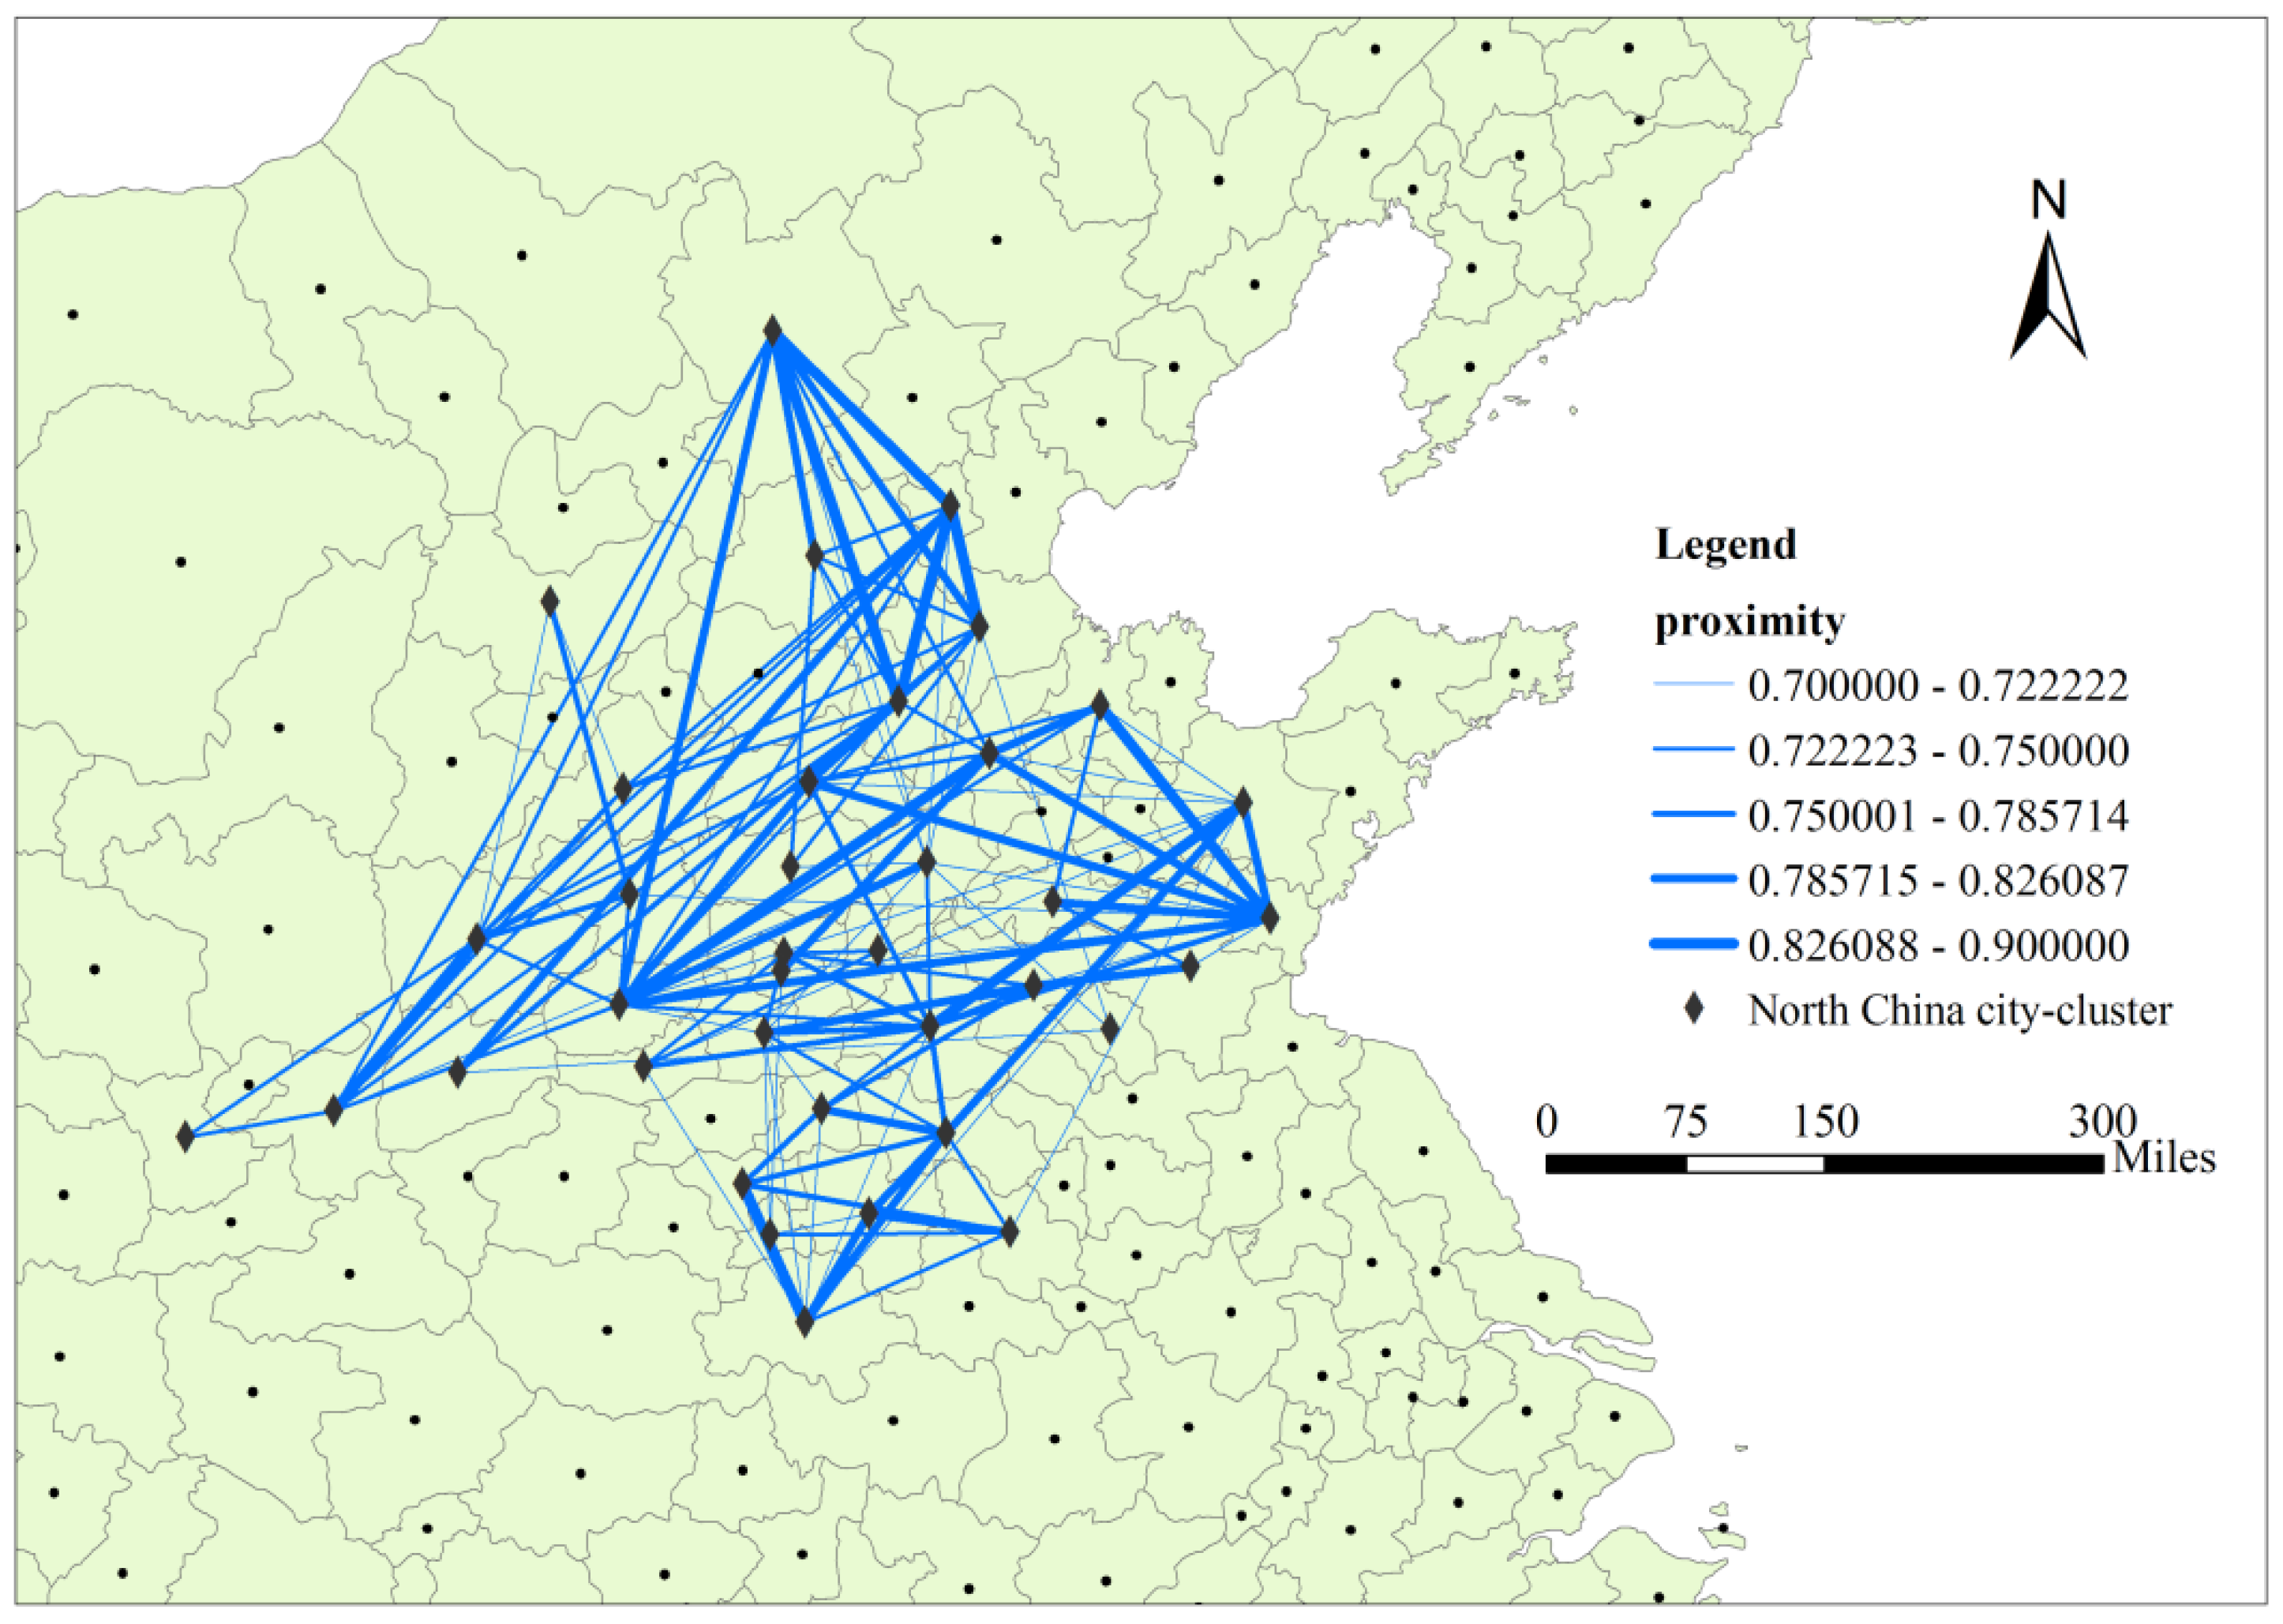
- The North China city-cluster. A total of 37 cities are included in this group. In addition to higher market proximities among them, cities in this cluster demonstrate more geographical closeness and an apparent spatial agglomeration in the North China Plain and surroundings, such as Hebei, Henan, Shanxi, and Shandong (Figure 7). Some common features of these cities are that their economy and population levels are much smaller than those in the Southeast coast city-cluster, and most of them are in the second-tier and third-tier cities of their respective provinces.
- (3)
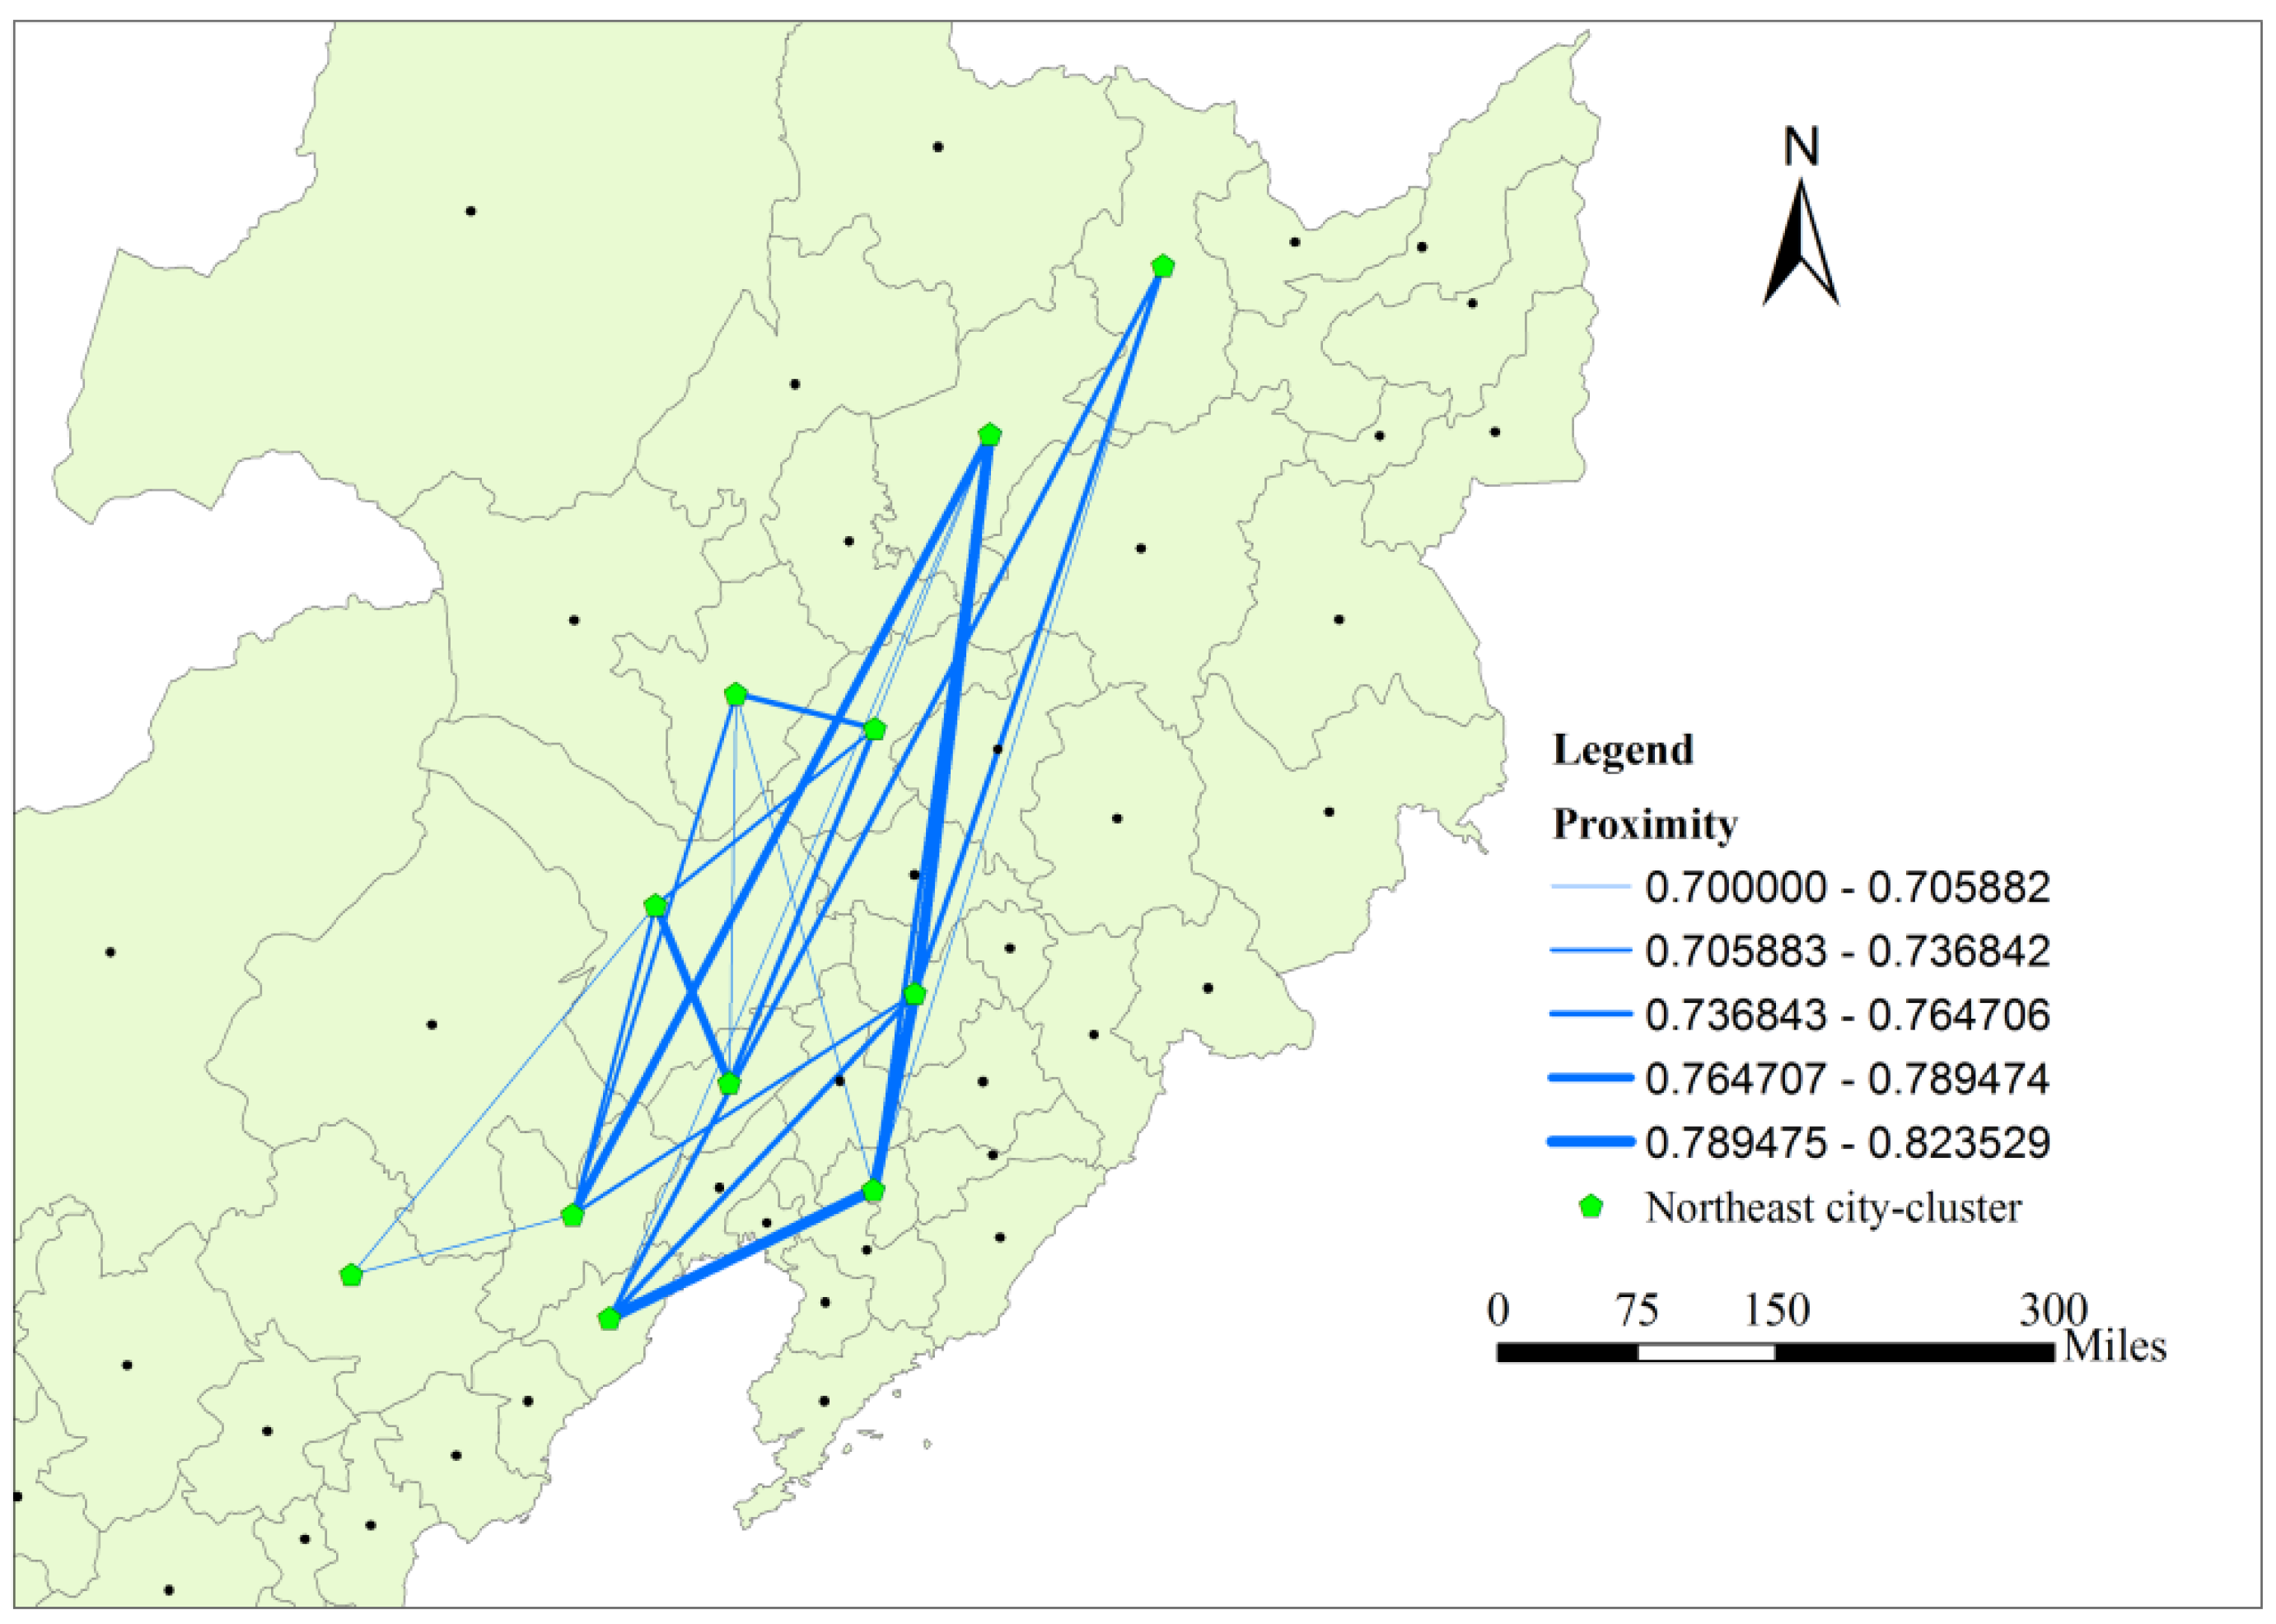
- The Northeast city-cluster. Only 11 cities are included in this group, making its number the smallest among all the four clusters (Figure 8). These cities are mostly located in the middle and western parts of Northeast China, with relatively weak economies compared to cities in Southeast city-cluster and North China city-clusters. In fact, most of the more developed cities in Northeast China are excluded from the cluster.
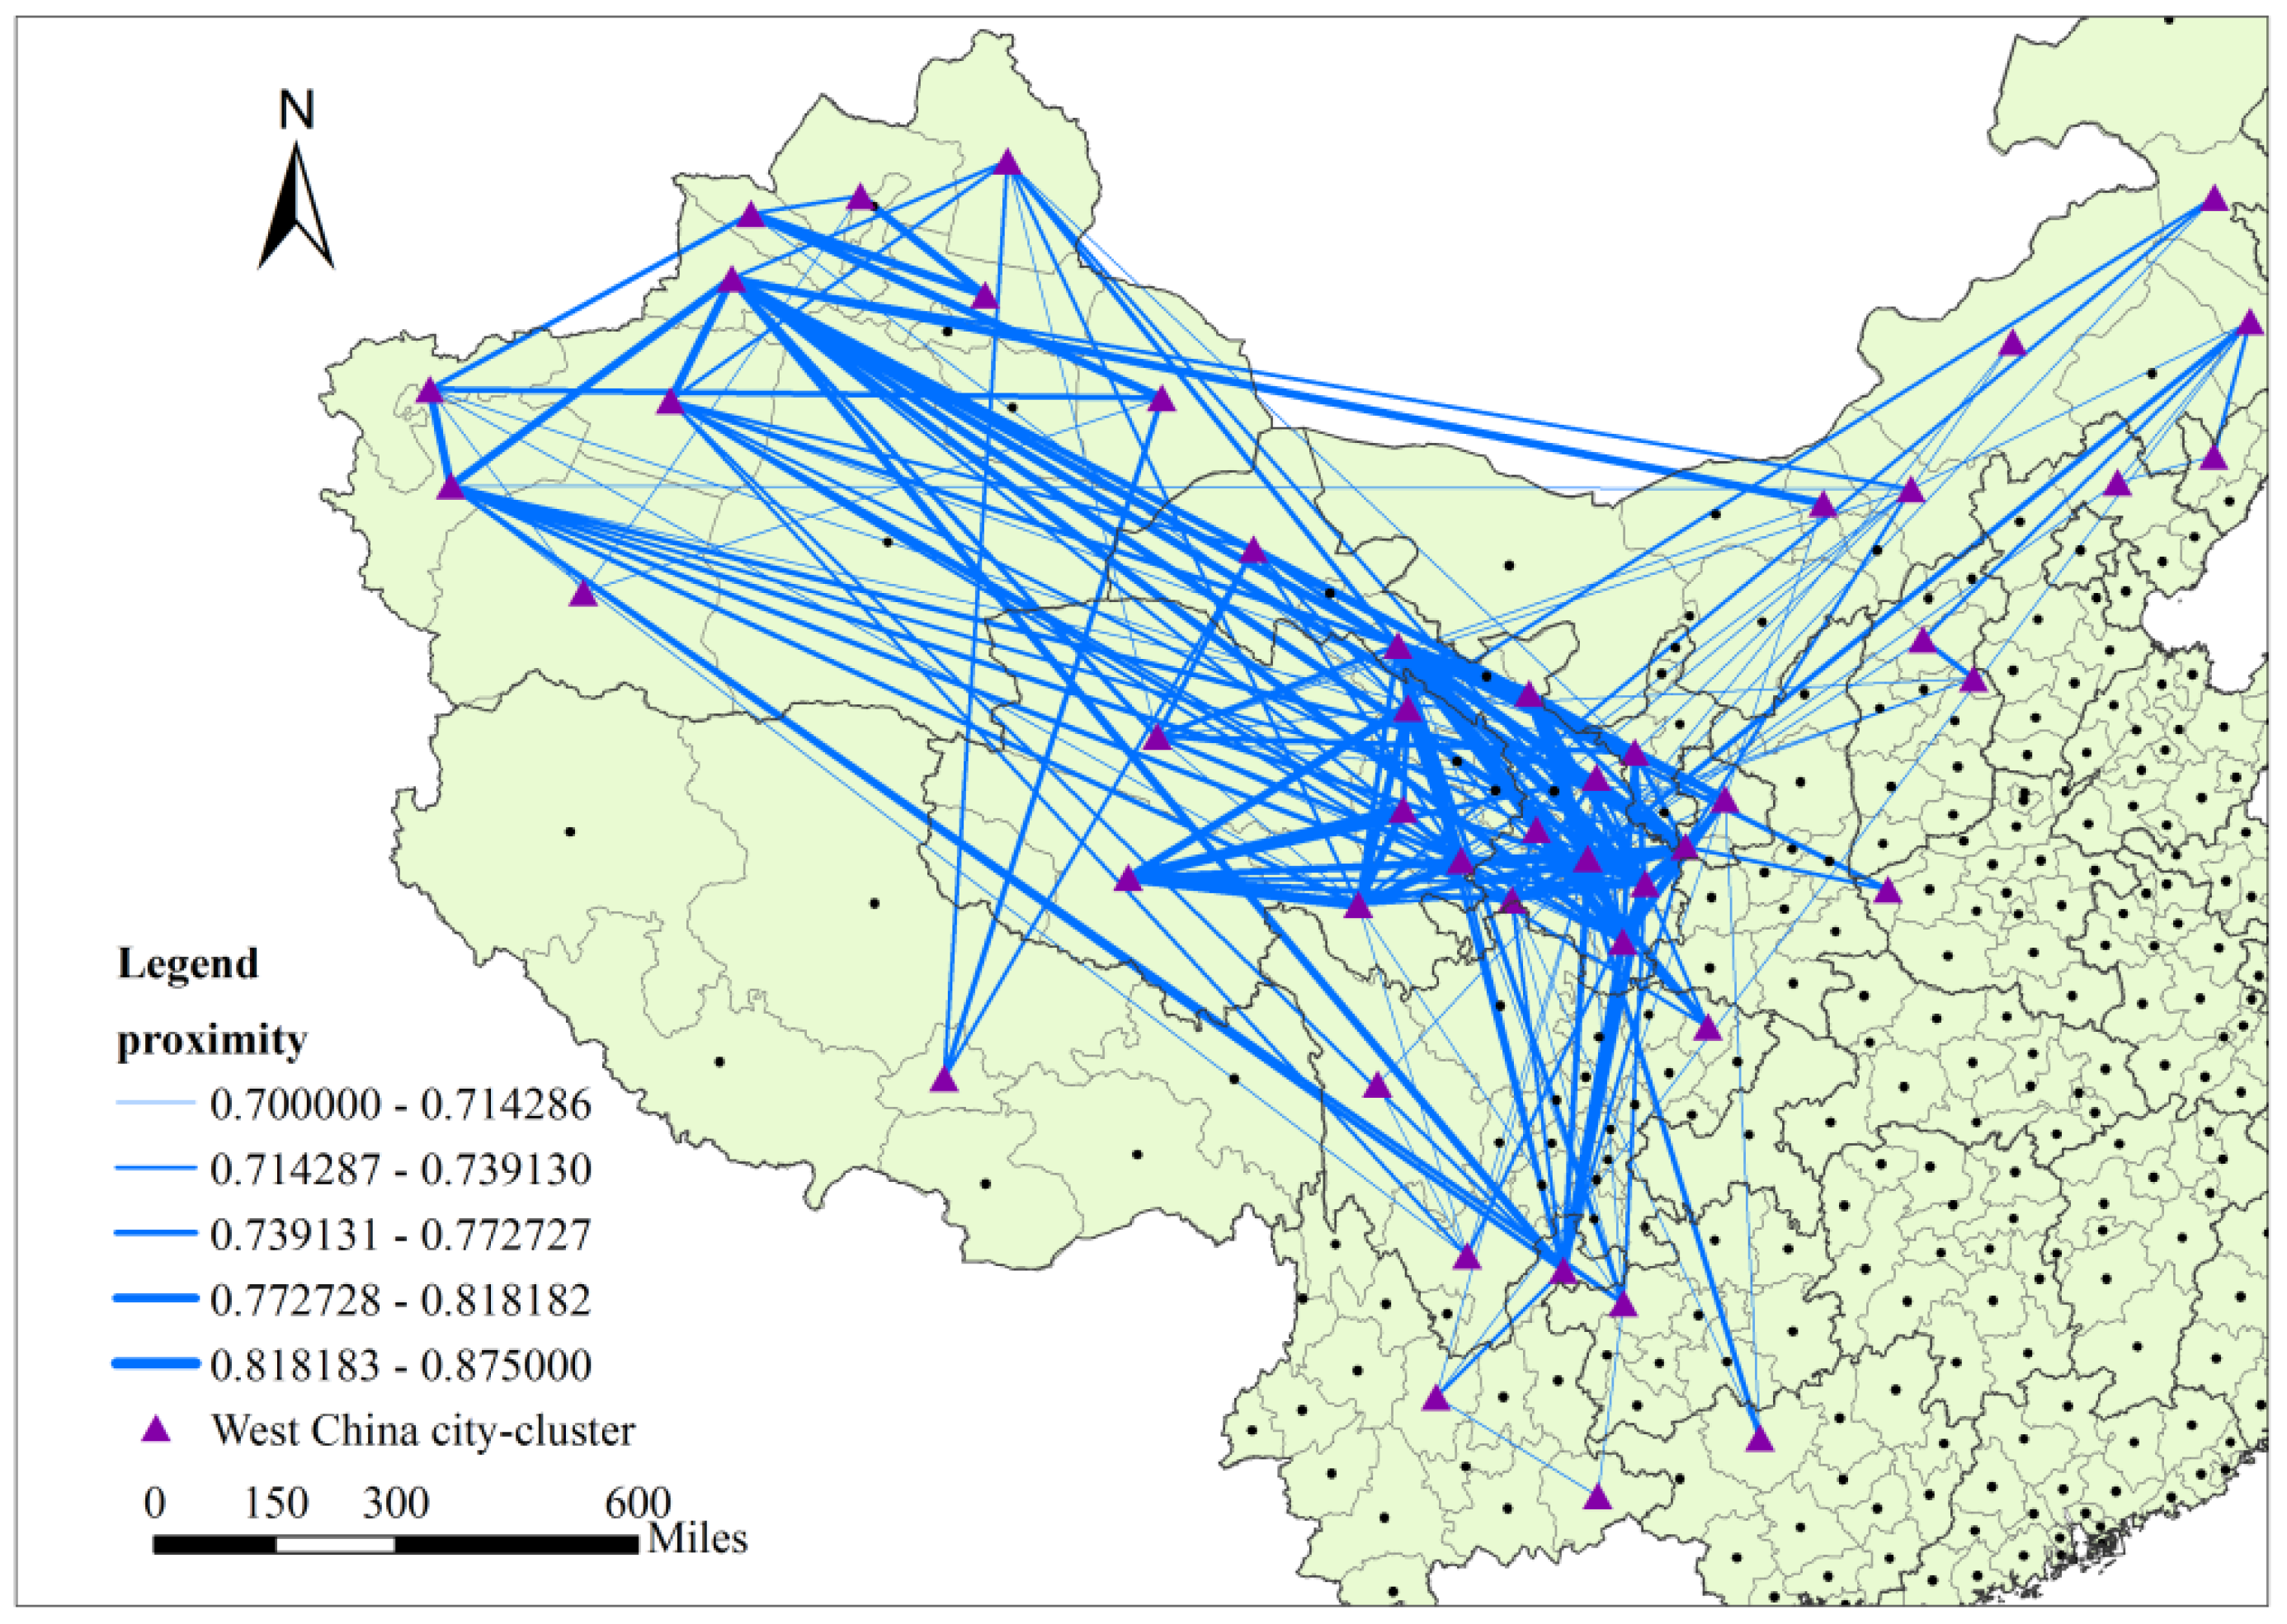
- (4)
- The West China city-cluster. This cluster has the largest number of cities (47) and covers a broader geographical territory (Figure 9). It includes many major cities in west and southwest China and they are generally considered underdeveloped with the lowest development levels. The proximity values among these cities are commonly higher, especially in the provinces of Ningxia, Gansu, Qinghai, and Xinjiang. These cities share quite similar automobile market structures. Overall, cities in this group have a smaller urban economy and population.
4.4. Heterogeneity among City-Clusters
5. Discussion
6. Conclusions
Acknowledgments
Author Contributions
Conflicts of Interest
References
- Hidalgo, C.A.; Klinger, B.; Barabási, A.-L.; Hausmann, R. The product space conditions the development of nations. Science 2007, 317, 482–487. [Google Scholar] [CrossRef] [PubMed]
- Thanasuta, K.; Patoomsuwan, T.; Chaimahawong, V.; Chiaravutthi, Y. Brand and country of origin valuations of automobiles. Asia Pac. J. Mark. Logist. 2009, 21, 355–375. [Google Scholar] [CrossRef]
- Wang, X.; Yang, Z. Does country-of-origin matter in the relationship between brand personality and purchase intention in emerging economies? Evidence from China’s auto industry. Int. Mark. Rev. 2008, 25, 458–474. [Google Scholar] [CrossRef]
- Wang, X.; Yang, Z.; Liu, N.R. The impacts of brand personality and congruity on purchase intention: Evidence from the Chinese mainland’s automobile market. J. Glob. Mark. 2009, 22, 199–215. [Google Scholar] [CrossRef]
- Deng, H.; Ma, A.C. Market structure and pricing strategy of China’s automobile industry. J. Ind. Econ. 2010, 58, 818–845. [Google Scholar] [CrossRef]
- Haque, A.; Anwar, N.; Yasmin, F.; Sarwar, A.; Ibrahim, Z.; Momen, A. Purchase intention of foreign products. SAGE Open 2015, 5. [Google Scholar] [CrossRef]
- Rits, V.; Kypreos, S.; Wokaun, A. Evaluating the diffusion of fuel-cell cars in the China markets. IATSS Res. 2004, 28, 34–46. [Google Scholar] [CrossRef]
- Qian, L.; Soopramanien, D. Using diffusion models to forecast market size in emerging markets with applications to the Chinese car market. J. Bus. Res. 2014, 67, 1226–1232. [Google Scholar] [CrossRef]
- Qian, L.; Soopramanien, D. Incorporating heterogeneity to forecast the demand of new products in emerging markets: Green cars in China. Technol. Forecast. Soc. 2015, 91, 33–46. [Google Scholar] [CrossRef]
- Huo, H.; Wang, M. Modeling future vehicle sales and stock in China. Energy Policy 2012, 43, 17–29. [Google Scholar] [CrossRef]
- Wan, Z.; Sperling, D.; Wang, Y. China’s electric car frustrations. Transp. Res. Part D 2015, 34, 116–121. [Google Scholar] [CrossRef]
- Liu, D.; Lo, K.; Song, W.; Xie, C. Spatial patterns of car sales and their socio-economic attributes in China. Chin. Geogr. Sci. 2017, 27, 684–696. [Google Scholar] [CrossRef]
- Cao, J.; Cao, X. The impacts of LRT, neighbourhood characteristics, and self-selection on auto ownership: Evidence from Minneapolis-St. Paul. Urban Stud. 2013, 51, 2068–2087. [Google Scholar] [CrossRef]
- Clark, B.; Chatterjee, K.; Melia, S. Changes in level of household car ownership: The role of life events and spatial context. Transportation 2016, 43, 565–599. [Google Scholar] [CrossRef]
- Oakil, A.T.M.; Manting, D.; Nijland, H. Determinants of car ownership among young households in the Netherlands: The role of urbanisation and demographic and economic characteristics. J. Transp. Geogr. 2016, 51, 229–235. [Google Scholar] [CrossRef]
- Weinberger, R.; Goetzke, F. Unpacking preference: How previous experience affects auto ownership in the United States. Urban Stud. 2010, 47, 2111–2128. [Google Scholar] [CrossRef]
- Hidalgo, C.A.; Hausmann, R. A network view of economic development. Dev. Altern. 2008, 12, 5–10. [Google Scholar]
- Felipe, J.; Kumar, U.; Abdon, A. How rich countries became rich and why poor countries remain poor: It’s the economic structure…duh! Jpn. World Econ. 2014, 29, 46–58. [Google Scholar] [CrossRef]
- Cruz, J.D.L.; Riker, D. Product Space Analysis of the Exports of Brazil; Working Paper No. 2012-06A; U.S. International Trade Commission Office of Economics: Washington, DC, USA, 2012. Available online: https://www.usitc.gov/publications/332/EC201206A.pdf (accessed on 27 February 2017).
- Kali, R.; Reyes, J.; McGee, J.; Shirrell, S. Growth networks. J. Dev. Econ. 2013, 101, 216–227. [Google Scholar] [CrossRef]
- Boschma, R.; Heimeriks, G.; Balland, P.-A. Scientific knowledge dynamics and relatedness in biotech cities. Res. Policy 2014, 43, 107–114. [Google Scholar] [CrossRef]
- Neffke, F.; Henning, M.; Boschma, R. How do regions diversify over time? Industry relatedness and the development of new growth paths in regions. Econ. Geogr. 2011, 87, 237–265. [Google Scholar] [CrossRef]
- Bahar, D.; Hausmann, R.; Hidalgo, C.A. Neighbors and the evolution of the comparative advantage of nations: Evidence of international knowledge diffusion? J. Int. Econ. 2014, 92, 111–123. [Google Scholar] [CrossRef]
- Piana, V. Proximity in Product Space and Diversification Strategies. Economic Web Institute. 2007. Available online: http://www.economicswebinstitute.org/essays/proximityproduct.htm (accessed on 27 February 2017).
- Klinger, T.; Kenworthy, J.R.; Lanzendorf, M. Dimensions of urban mobility cultures—A comparison of German cities. J. Transp. Geogr. 2013, 31, 18–29. [Google Scholar] [CrossRef]
- Charreire, H.; Weber, C.; Chaix, B.; Salze, P.; Casey, R.; Banos, A.; Badariotti, D.; Kesse-Guyot, E.; Hercberg, S.; Simon, C.; et al. Identifying built environmental patterns using cluster analysis and GIS: Relationships with walking, cycling and body mass index in French adults. Int. J. Behav. Nutr. Phys. 2012, 9, 59. [Google Scholar] [CrossRef] [PubMed]
- Longley, P.A.; Cheshire, J.A.; Mateos, P. Creating a regional geography of Britain through the spatial analysis of surnames. Geoforum 2011, 42, 506–516. [Google Scholar] [CrossRef]
- Guedes, A.S.; Jiménez, M.I.M. Spatial patterns of cultural tourism in Portugal. Tour. Manag. Perspect. 2015, 16, 107–115. [Google Scholar] [CrossRef]
- Wei, C.; Cabrera Barona, P.; Blaschke, T. A new look at public services inequality: The consistency of neighborhood context and citizens’ perception across multiple scales. ISPRS Int. J. Geo-Inf. 2017, 6, 200. [Google Scholar] [CrossRef]
- Zhou, D.; Xu, J.; Radke, J.; Mu, L. A spatial cluster method supported by GIS for urban-suburban-rural classification. Chin. Geogr. Sci. 2004, 14, 337–342. [Google Scholar] [CrossRef]
- Ribeiro, S.C.; Migliozzi, A.; Incerti, G.; Correia, T.P. Placing land cover pattern preferences on the map: Bridging methodological approaches of landscape preference surveys and spatial pattern analysis. Landsc. Urban Plan. 2013, 114, 53–68. [Google Scholar] [CrossRef]
- Von der Dunk, A.; Grêt-Regamey, A.; Dalang, T.; Hersperger, A.M. Defining a typology of peri-urban land-use conflicts—A case study from Switzerland. Landsc. Urban Plan. 2011, 101, 149–156. [Google Scholar] [CrossRef]
- Chen, N.; Akar, G. Effects of neighborhood types & socio-demographics on activity space. J. Transp. Geogr. 2016, 54, 112–121. [Google Scholar] [CrossRef]
- Tobler, W.R. A computer movie simulating urban growth in the Detroit region. Econ. Geogr. 1970, 46, 234–240. [Google Scholar] [CrossRef]


| Variables | All the Prefecture Cities | Southeast City-Cluster | North China City-Cluster | Northeast City-Cluster | West China City-Cluster | |||||
|---|---|---|---|---|---|---|---|---|---|---|
| Mean | CV | Mean | CV | Mean | CV | Mean | CV | Mean | CV | |
| Total car sales | 38,798 | 147.95% | 145,039 | 77.58% | 47,424 | 62.39% | 19,019 | 36.50% | 11,465 | 75.54% |
| GDP (billion yuan) | 157.5 | 140.35% | 571.24 | 80.51% | 153.51 | 46.09% | 84.69 | 41.21% | 46.77 | 103.94% |
| Per capita GDP (yuan) | 36,902 | 68.59% | 73,189 | 31.90% | 29,019 | 30.66% | 31,017 | 34.84% | 25,835 | 82.16% |
| Population(million) | 3.96 | 81.91% | 7.746 | 65.67% | 5.483 | 42.06% | 2.830 | 38.31% | 2.062 | 67.90% |
| Employed population (million) | 2.32 | 81.84% | 4.68 | 56.31% | 3.32 | 46.08% | 1.46 | 39.69% | 1.14 | 77.71% |
| Per capita disposable income of urban residents (yuan) | 19,011 | 27.22% | 30,310 | 16.10% | 18,826 | 12.53% | 16,799 | 13.75% | 15,650 | 18.86% |
| Proportion of car sales of foreign automakers (%) | 5.76 | 50.89% | 11.79 | 16.68% | 2.79 | 29.29% | 4.17 | 20.42% | 4.16 | 36.23% |
| Proportion of car sales of Sino-foreign joint ventures (%) | 64.40 | 14.22% | 72.82 | 3.69% | 63.62 | 6.84% | 60.16 | 8.32% | 54.15 | 17.06% |
| Proportion of car sales of domestic automakers (%) | 29.84 | 33.40% | 15.39 | 16.35% | 33.59 | 13.93% | 35.67 | 15.60% | 41.69 | 22.90% |
| Top 10 Manufacturers with Dominance in each cluster | 1. BMW *; 2. Mercedes-Benz *; 3. BMW Brilliance; 4. Beijing-Benz; 5. Volkswagen *; 6. Audi *; 7. Lexus *; 8. Mini *; 9. Infiniti *; 10. Porsche * | 1. Changan #; 2. Changhe-Suzuki; 3. Chery #; 4. SGMW; 5. Geely #; 6. Beijing-Hyundai; 7. Great Wall #; 8. FAW-Haima; 9. BYD #; 10. DYK | 1. FAW-Volkswagen; 2. Chery #; 3. Tianjin-FAW; 4. Brilliance #; 5. Great Wall #; 6. BYD #; 7. Changan-Suzuki; 8. Toyota; 9. Beijing-Hyundai; 10. Geely # | 1. Geely #; 2. Hawtai #; 3. Great Wall #; 4. GAC-Changfeng #; 5. Lifan #; 6. Beijing-Hyundai; 7. Chery #; 8. Toyota; 9. Hyundai; 10. Mitsubishi | ||||||
| Variables | Function 1 | Function 2 | Function 3 |
|---|---|---|---|
| Per capita disposable income of urban residents | −0.374 | −0.030 | 0.054 |
| Employed population | 0.060 | −0.444 | −0.048 |
| Per capita GDP | 0.217 | −0.086 | −0.069 |
| Proportion of car sales of foreign automakers | −0.834 | 0.049 | −0.088 |
| West | 0.493 | 0.798 | −0.289 |
| Northeast | 0.164 | 0.426 | 0.871 |
| Middle | 0.338 | −0.073 | −0.184 |
| Group | Function 1 | Function 2 | Function 3 |
|---|---|---|---|
| Southeast | −5.248 | 0.226 | −0.201 |
| North China | 1.200 | −2.317 | −0.117 |
| Northeast | 0.933 | 0.963 | 4.143 |
| West China | 1.836 | 1.469 | −0.762 |
© 2018 by the authors. Licensee MDPI, Basel, Switzerland. This article is an open access article distributed under the terms and conditions of the Creative Commons Attribution (CC BY) license (http://creativecommons.org/licenses/by/4.0/).
Share and Cite
Liu, D.; Song, W.; Lu, J.; Xie, C.; Wen, X. A New Geographical Cluster View on Passenger Vehicle Purchasing in Chinese Cities. ISPRS Int. J. Geo-Inf. 2018, 7, 9. https://doi.org/10.3390/ijgi7010009
Liu D, Song W, Lu J, Xie C, Wen X. A New Geographical Cluster View on Passenger Vehicle Purchasing in Chinese Cities. ISPRS International Journal of Geo-Information. 2018; 7(1):9. https://doi.org/10.3390/ijgi7010009
Chicago/Turabian StyleLiu, Daqian, Wei Song, Jia Lu, Chunyan Xie, and Xin Wen. 2018. "A New Geographical Cluster View on Passenger Vehicle Purchasing in Chinese Cities" ISPRS International Journal of Geo-Information 7, no. 1: 9. https://doi.org/10.3390/ijgi7010009
APA StyleLiu, D., Song, W., Lu, J., Xie, C., & Wen, X. (2018). A New Geographical Cluster View on Passenger Vehicle Purchasing in Chinese Cities. ISPRS International Journal of Geo-Information, 7(1), 9. https://doi.org/10.3390/ijgi7010009