
Evaluation of Multiple Classifier Systems for Landslide Identification in LANDSAT Thematic Mapper (TM) Images


Abstract
:1. Introduction
2. Material and Methods
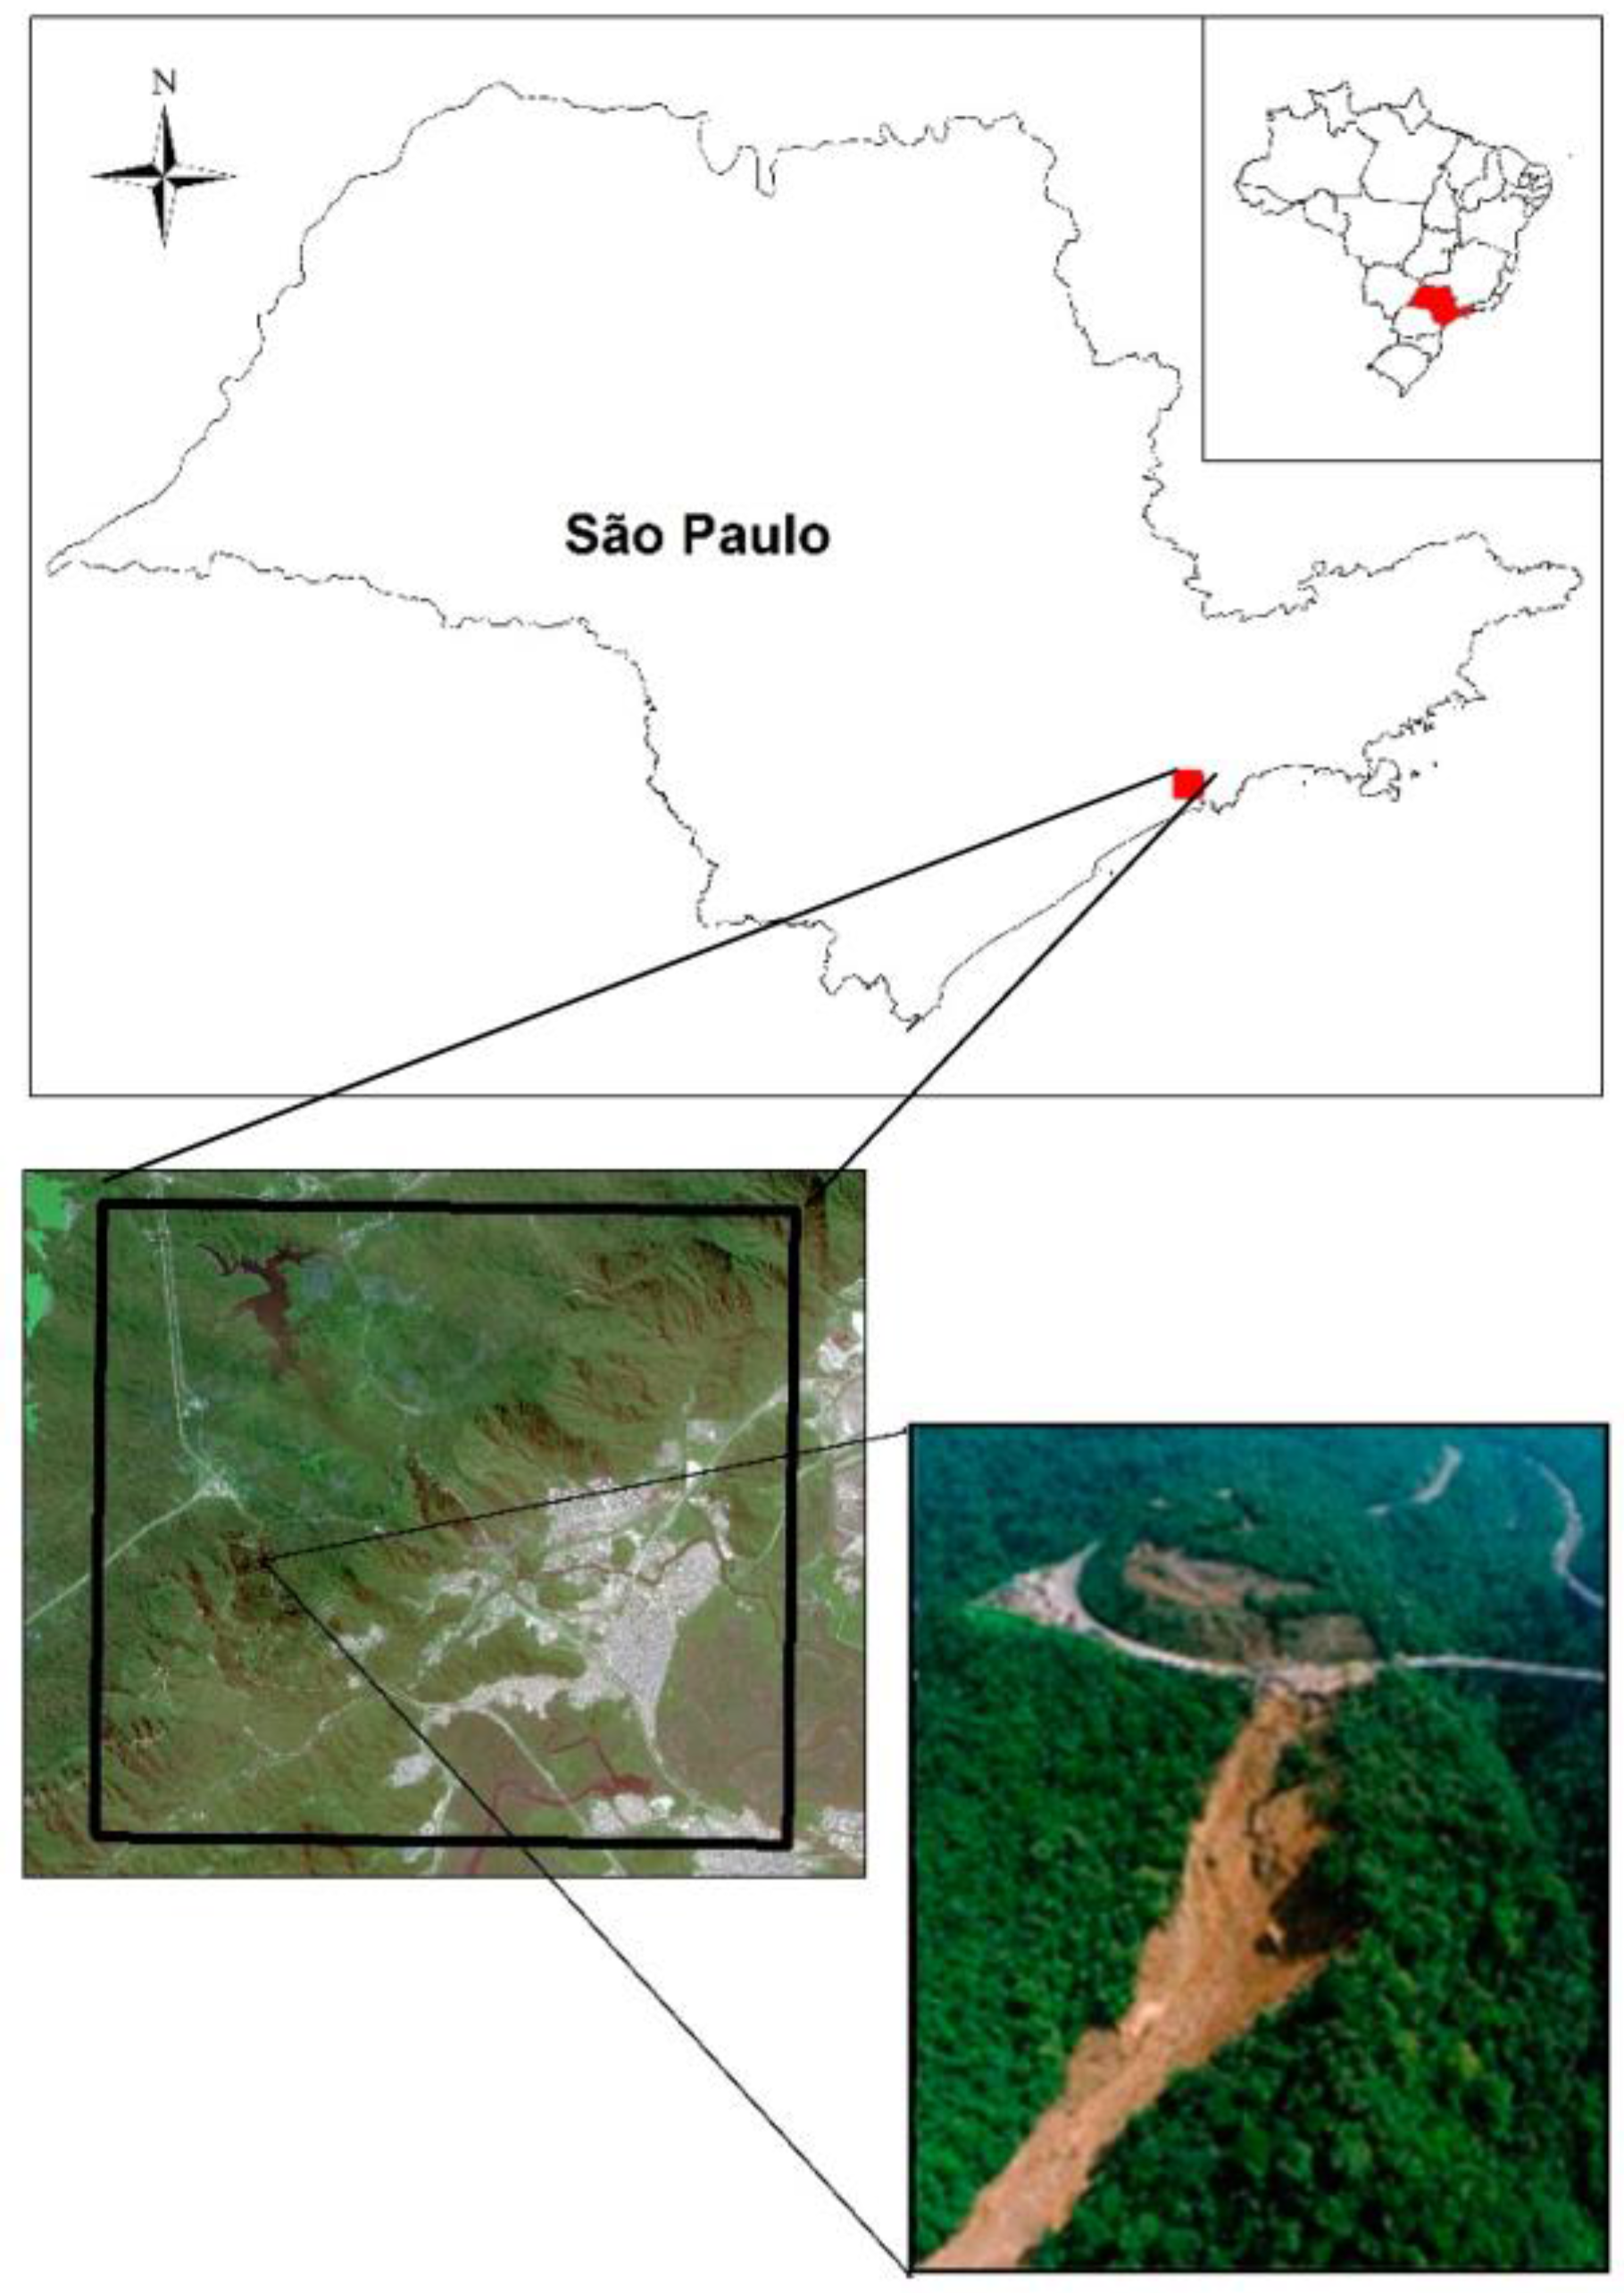
2.1. Study Area
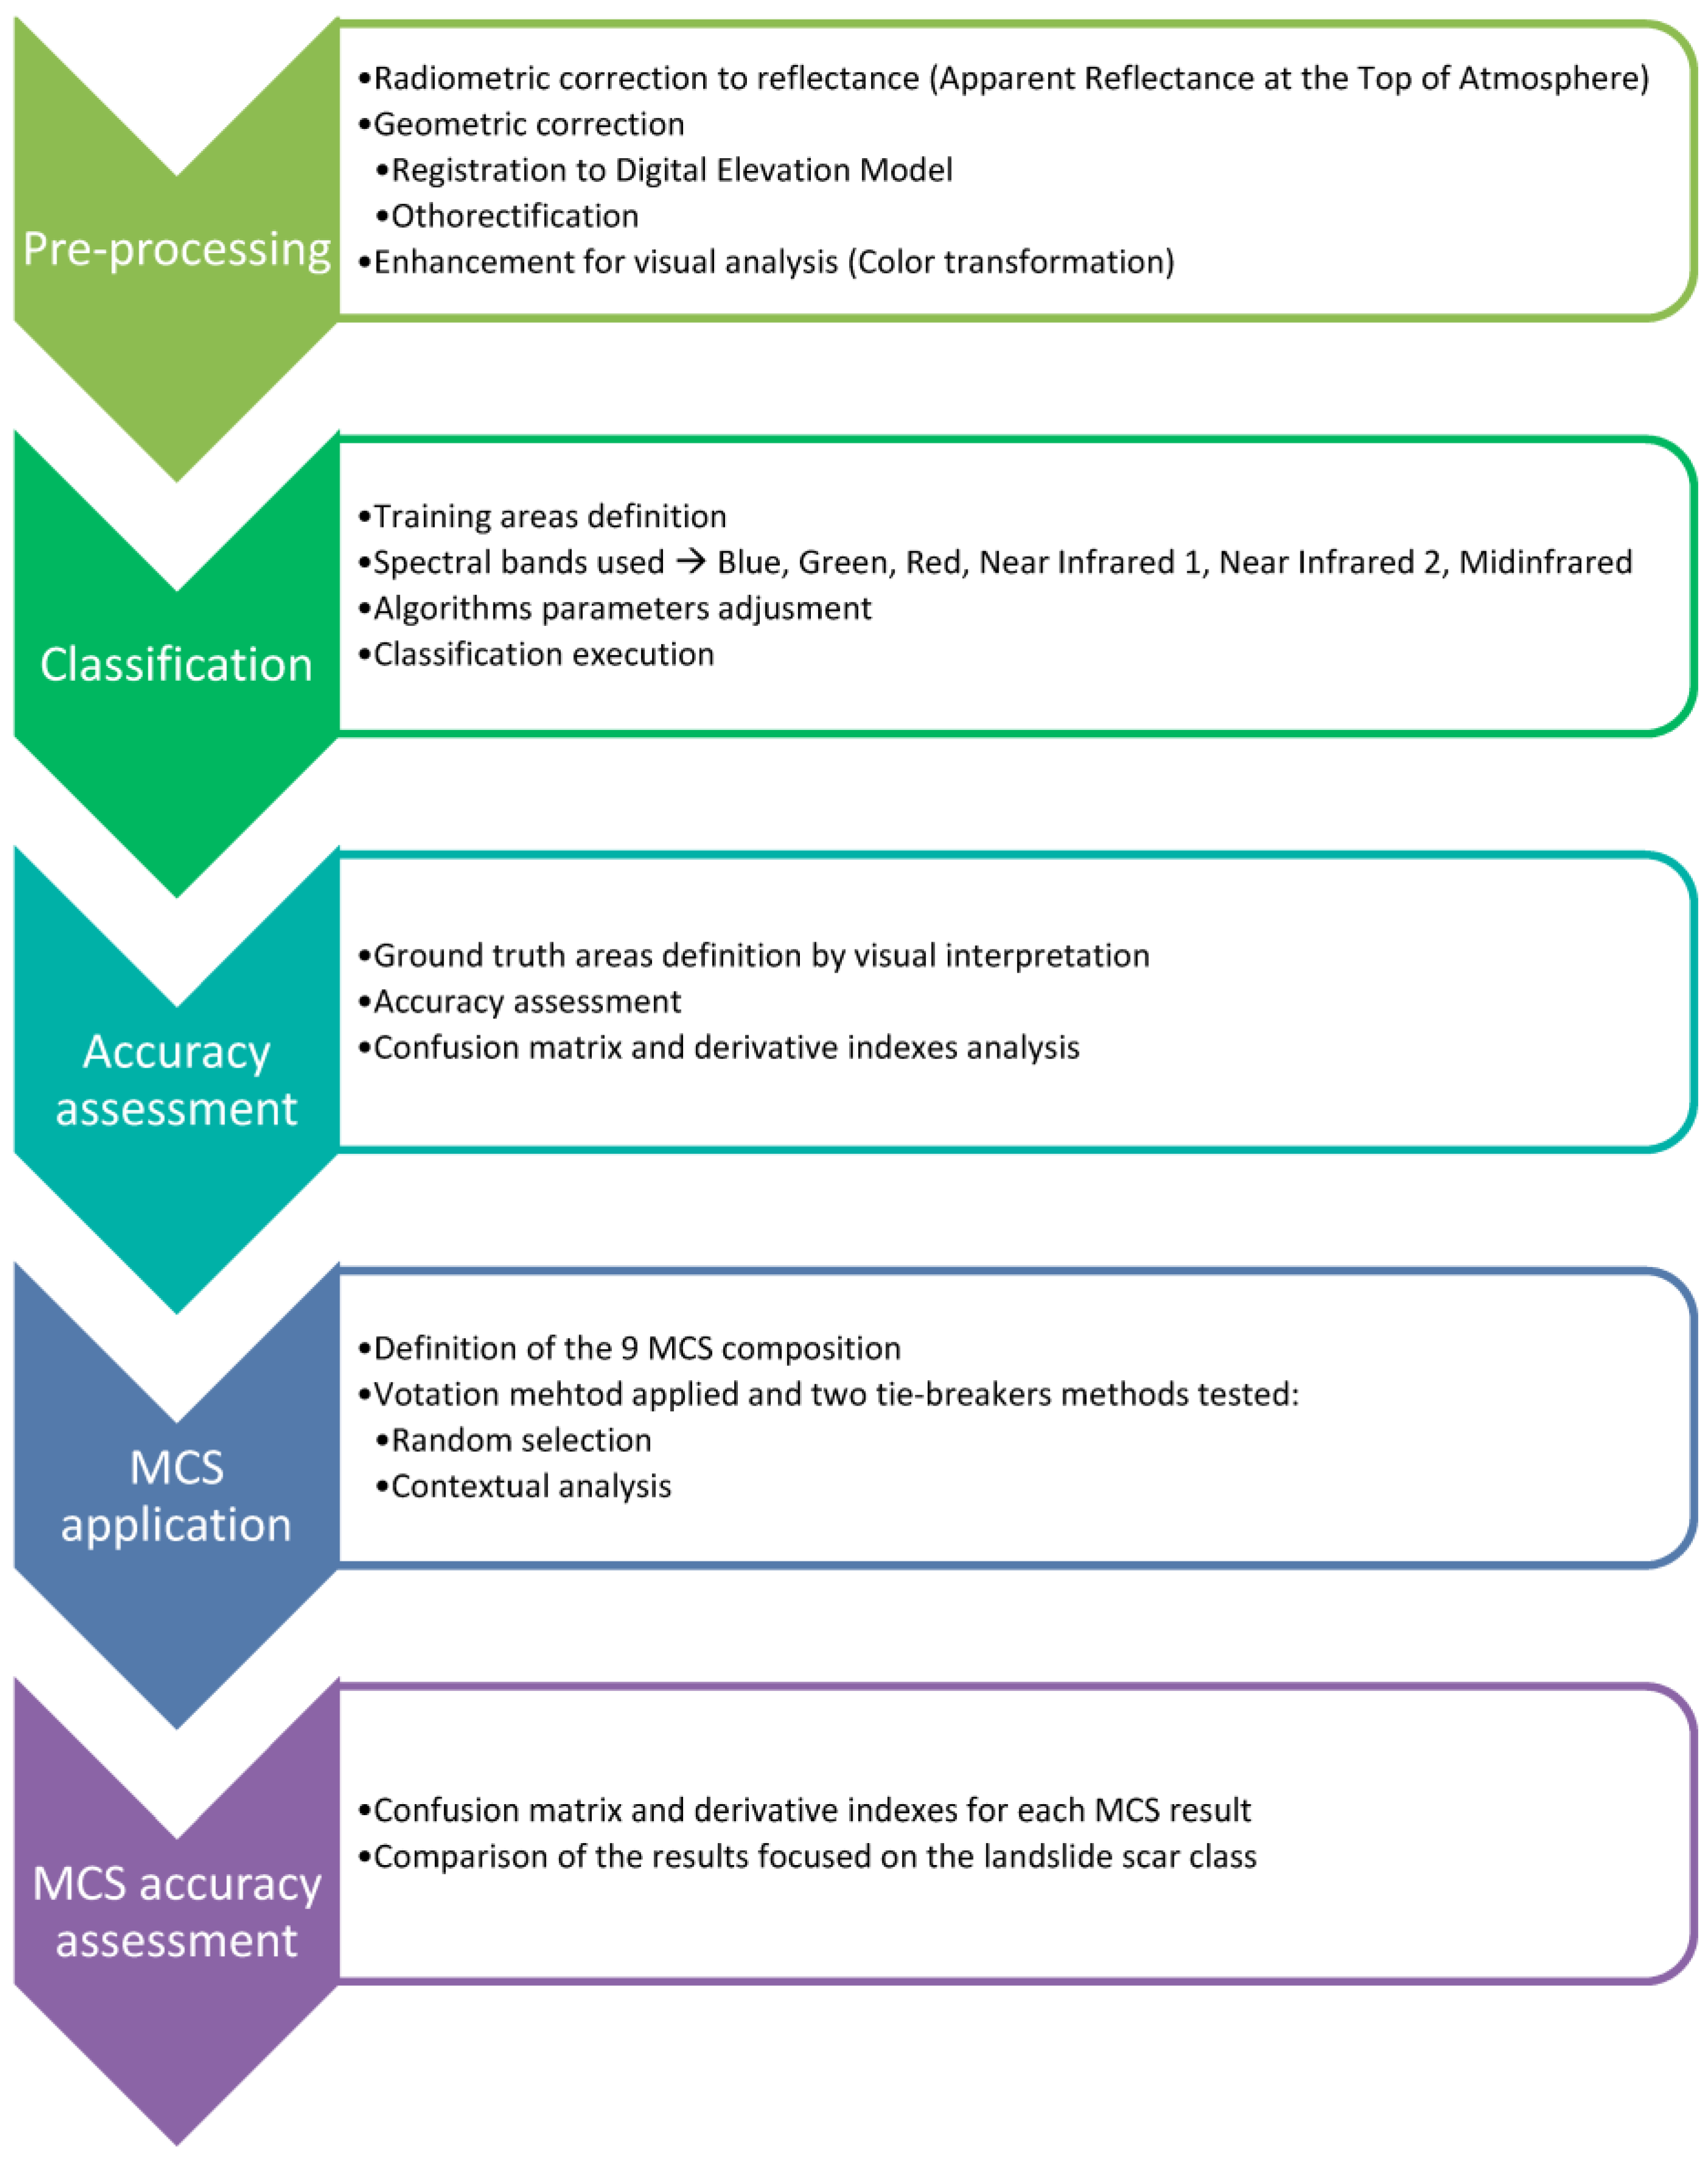
2.2. Procedures
- Supervised
- ○
- Support Vector Machine (SVM)—Kernel Type = Radius Bias Function, Gamma in Kernel Function = 0.167, Penalty Parameter = 500, Classification Probability Threshold = 0
- ○
- Neural Network (NN)—Activation = Logistic, Training Threshold Contribution = 0.9, Training Rate = 0.5, Training Momentum = 0, Training RMS Exit Criteria = 0.1
- ○
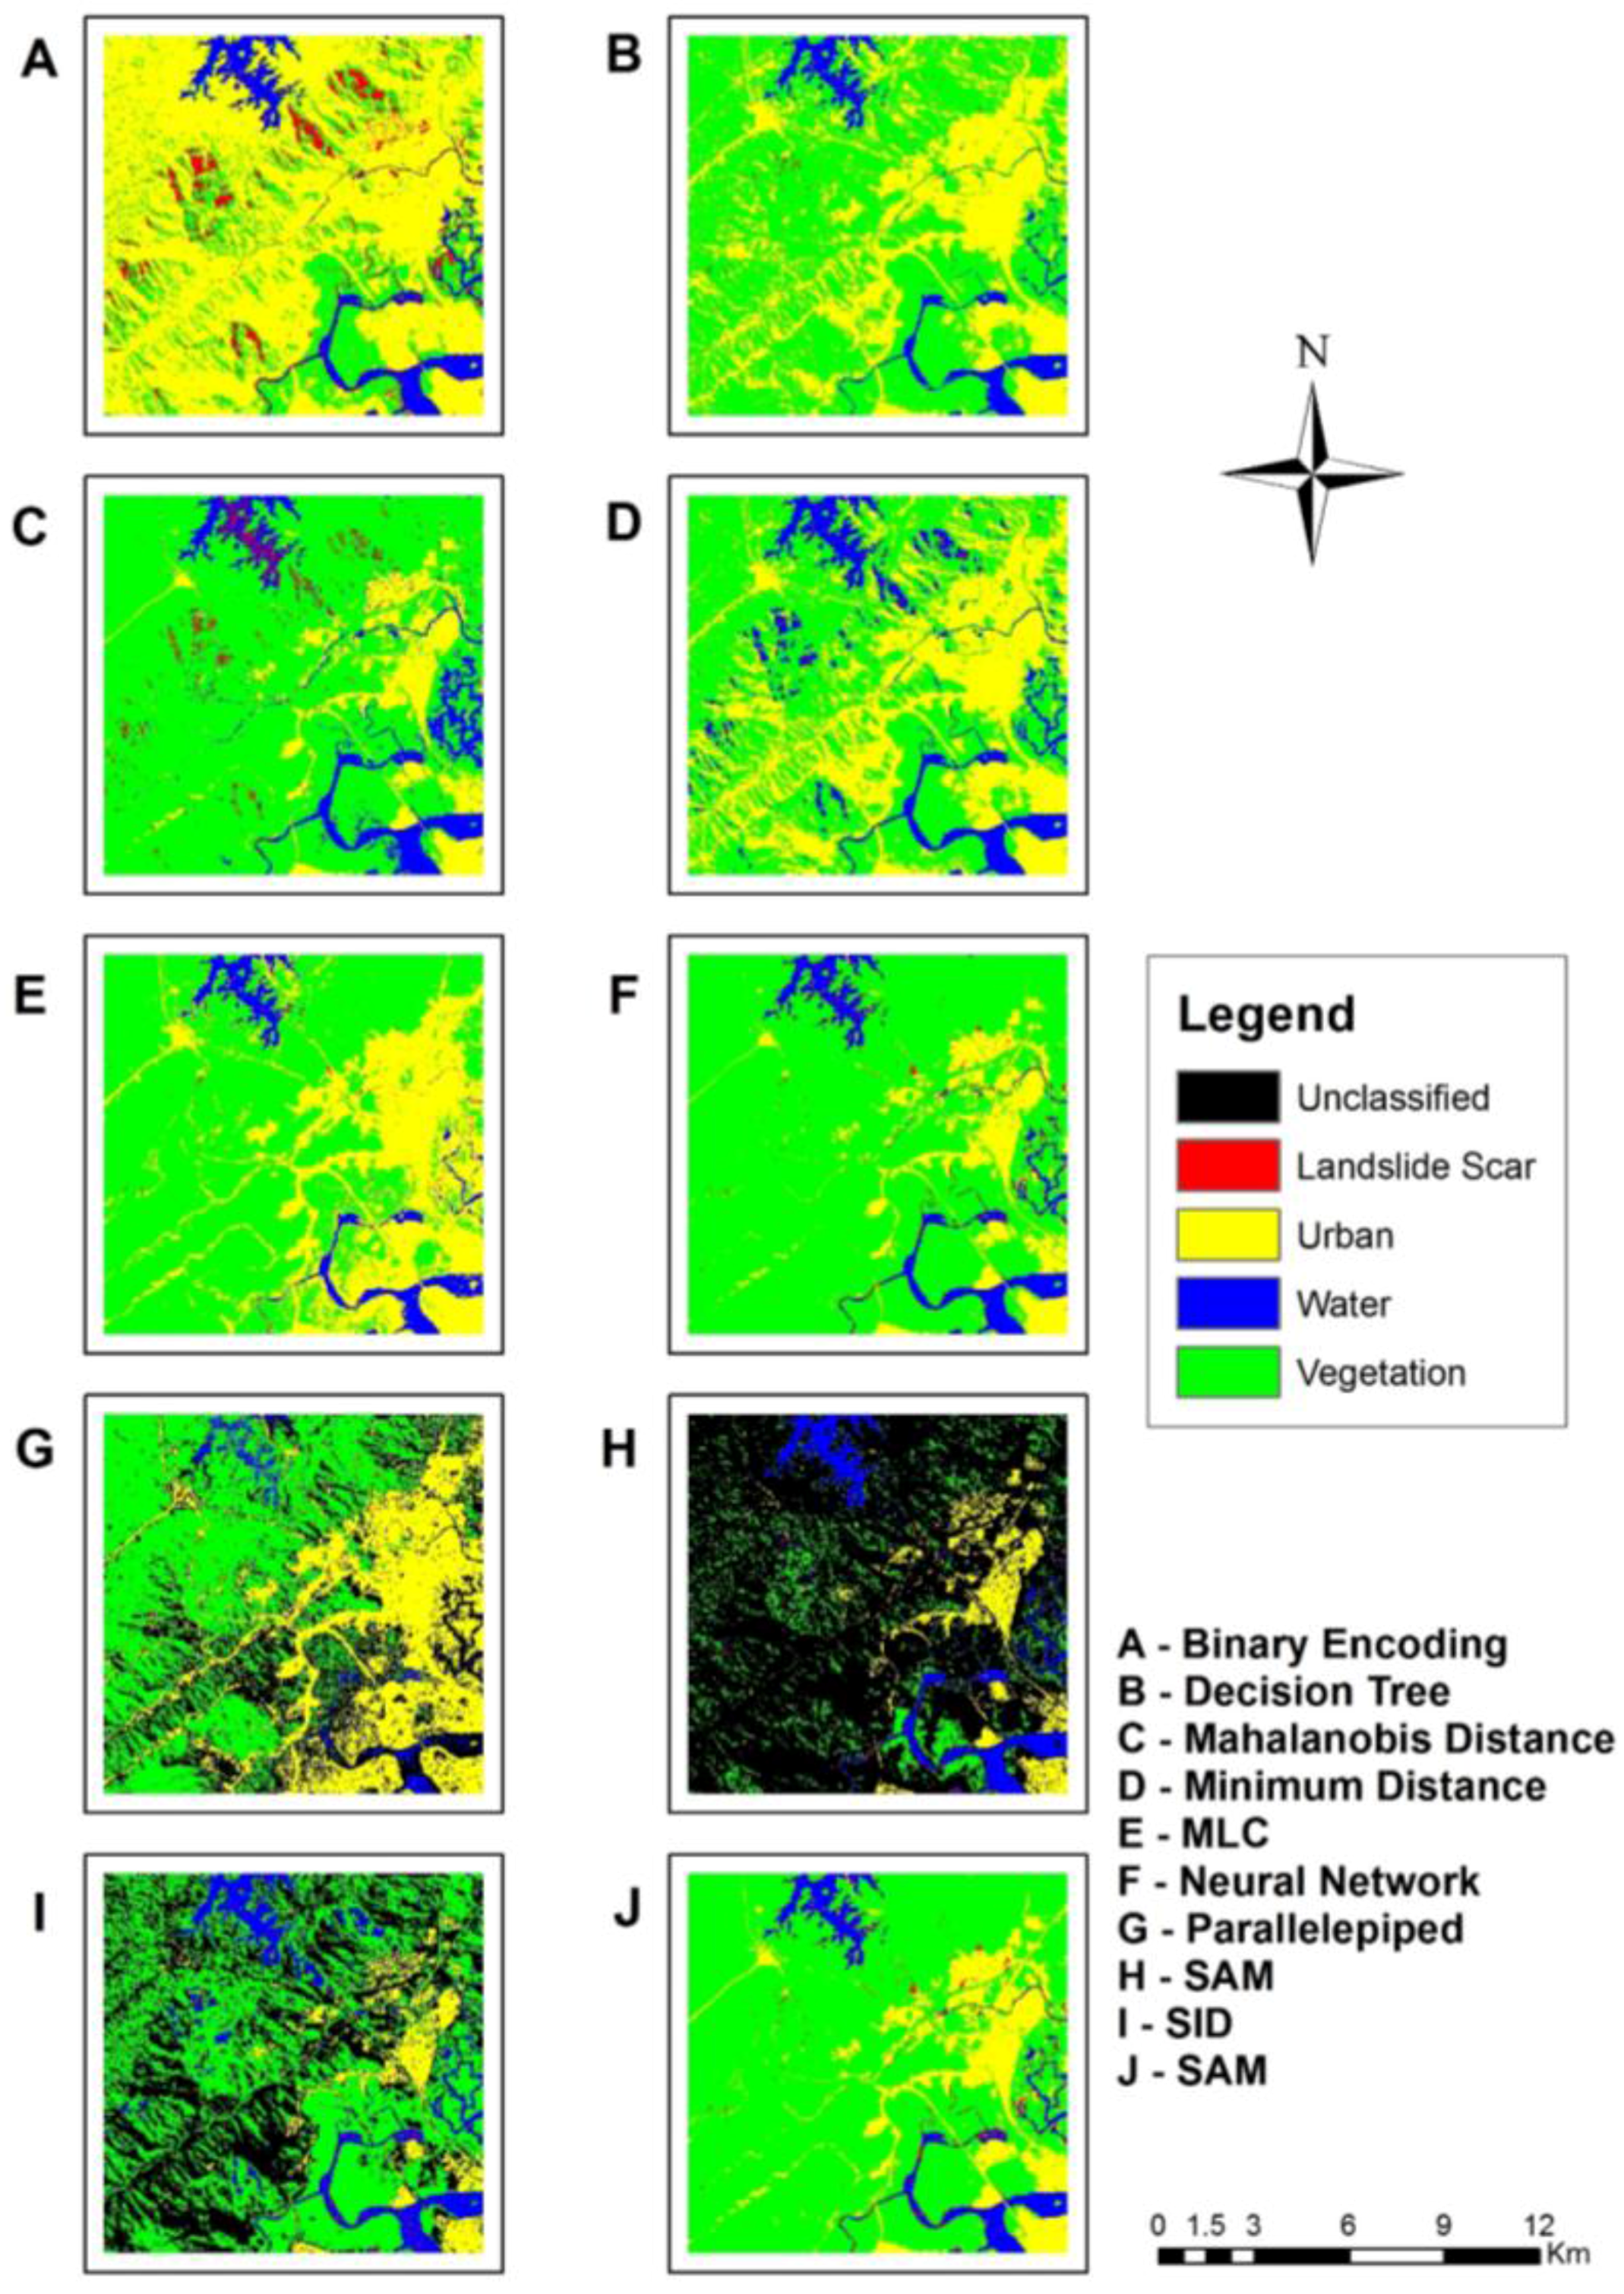
- Binary Encoding (BE)—Minimum Encoding Threshold for Landslide class = 3
- ○
- Spectral Information Divergence (SID)—Maximum Divergence Threshold for Landslide class = 0.005
- ○
- Spectral Angle Mapper (SAM)—Maximum Angle for Landslide class = 0.047
- ○
- Maximum Likelihood Classification (MLC)—Probability Threshold for Landslide class = 0.05
- ○
- Mahalanobis Distance (MHD)—Maximum Distance Error = 1.5
- ○
- Minimum Distance (MD)—Maximum Standard Deviation from Mean for Landslide class = 1.1, Maximum Distance Error = 10
- ○
- Parallelepiped (PAR)—Maximum Standard Deviation from Mean for Landslide Class = 0.72
- Decision Tree (DT)
- ○
- J-48 Data Mining
3. Results
4. Discussion
5. Conclusions
Acknowledgments
Author Contributions
Conflicts of Interest
Abbreviations
| TM | Thematic Mapper |
| MCS | Multiple Classifier System |
| SVM | Support Vector Machine |
| SAM | Spectral Angle Mapper |
| NN | Neural Net |
| BE | Binary Encoding |
| SID | Spectral Information Divergence |
| MLC | Maximum Likelihood Classification |
| MD | Minimum Distance |
| MHD | Mahalanobis Distance |
| PAR | Parallelepiped |
| DT | Decision Tree |
References
- Borga, M.; Stoffel, M.; Marra, F.; Jakob, M. Hydrogeomorphic response to extreme rainfall in headwater systems: Flash floods and debris flow. J. Hydrol. 2014, 518, 194–206. [Google Scholar] [CrossRef]
- Petley, D. Global pattern of loss of life from landslides. Geology 2012, 40, 927–930. [Google Scholar] [CrossRef]
- Wang, H.; Zhang, Y.; Hu, H. A Study on the relationship between the occurrence of Landslides and Rainfall. In Proceedings of the 2nd International Conference on Electric Technology and Civil Engineering, Yichang, China, 8–20 May 2012; pp. 200–203.
- Di Martino, L.; Masciocco, L.; Ricca, G.; Toja, M. Relationships between landslides phenomena and road network: An example from hilly region of Asti Province (North-Western Italy). Eng. Geol. Soc. Territ. 2014, 2, 1049–1053. [Google Scholar]
- Kumar, K.; Jangpangi, L.; Gangopadhyay, S. Highway vs. landslides and their consequences in Himalaya. Landslide Sci. Safer Geoenvironment 2014, 1, 389–395. [Google Scholar]
- Guthrie, R.H. The effects of logging on frequency and distribution of landslides in three watersheds on Vancouver Island, British Columbia. Geomorphology 2002, 43, 273–292. [Google Scholar] [CrossRef]
- Guzzetti, F.; Mondini, A.C.; Cardinali, M.; Fiorucci, F.; Santangelo, M.; Chang, K.T. Landslide inventory maps: New tools for an old problem. Earth Sci. Rev. 2012, 112, 42–66. [Google Scholar] [CrossRef]
- Manconi, A.; Casu, F.; Ardizzone, F.; Bonano, M.; Cardinali, M.; De Luca, C.; Gueguen, E.; Marchesini, I.; Parise, M.; Vennari, C.; et al. Brief Communication: Rapid mapping of landslide events: The 3 December 2013 Montescaglioso landslide, Italy. Nat. Hazards Earth Syst. Sci. 2014, 14, 1835–1841. [Google Scholar] [CrossRef]
- Tofani, V.; Hong, Y.; Singhroy, V. Introduction: Remote sensing techniques for landslide mapping and monitoring. Landslide Sci. Safer Geoenvironment 2014, 1, 301–303. [Google Scholar]
- Nichol, J.; Wong, M.S. Satellite remote sensing for detailed landslide inventories using change detection and image fusion. Int. J. Remote Sens. 2005, 26, 1913–1926. [Google Scholar] [CrossRef]
- Liu, J.G.; Mason, P. Essential image processing and GIS for Remote Sensing; Wiley-Blackwell: New York, NY, USA, 2009; p. 450. [Google Scholar]
- Lu, D.; Weng, Q.; Moran, E.; Li, G.; Hetrick, S. Remote sensing image classification. In Advances in Environmental Remote Sensing: Sensors, Algorithms, and Applications, Part II; CRC Press/Taylor & Francis Group Publishers: Boca Raton, FL, USA, 2011; pp. 219–240. [Google Scholar]
- Richards, J.A. Remote Sensing Digital Image Analysis; Springer: Berlin, Germany, 1999. [Google Scholar]
- Schott, J.R. Remote Sensing; Oxford University Press: Oxford, UK, 2007; p. 513. [Google Scholar]
- Steele, B.M. Combining multiple classifiers: An application using spatial and remotely sensed information for land cover type mapping. Remote Sens. Environ. 2000, 74, 545–556. [Google Scholar] [CrossRef]
- Briem, G.; Benediktsson, J.; Sveinsson, J. Multiple classifiers applied to multisource remote sensing data. IEEE Trans. Geosci. Remote Sens. 2002, 40, 2291–2299. [Google Scholar] [CrossRef]
- Benediktsson, J.A.; Chanussot, J.; Fauvel, M. Multiple classifier systems in remote sensing: From basics to recent developments. In Multiple Classifier Systems; Springer: Berlin Germany, 2007; pp. 501–512. [Google Scholar]
- Doan, H.T.X.; Foody, G.M. Increasing soft classification accuracy through the use of an ensemble of classifiers. Int. J. Remote Sens. 2007, 28, 4609–4623. [Google Scholar] [CrossRef]
- Foody, G.M.; Boyd, D.S.; Sanchez-Hernandez, C. Mapping a specific class with an ensemble of classifiers. Int. J. Remote Sens. 2007, 28, 1733–1746. [Google Scholar] [CrossRef]
- Waske, B.; Van der Linden, S.; Benediktsson, J.A.; Rabe, A.; Hostert, P. Sensitivity of support vector machines to random feature selection in classification of hyperspectral data. IEEE Trans. Geosci. Remote Sens. 2010, 48, 2880–2889. [Google Scholar] [CrossRef]
- Smits, P.C.; Dellepiane, S.G.; Schowengerdt, R.A. Quality assessment of image classification algorithms for land-cover mapping: A review and a proposal for a cost-based approach. Int. J. Remote Sens. 1999, 20, 1461–1486. [Google Scholar] [CrossRef]
- Giacinto, G. An approach to the automatic design of multiple classifier systems. Pattern Recognit. Lett. 2001, 22, 25–33. [Google Scholar] [CrossRef]
- Kuncheva, L.I.; Whitaker, C.J. Measures of diversity in classifier ensembles and their relationship with the ensemble accuracy. Mach. Learn. 2003, 51, 181–207. [Google Scholar] [CrossRef]
- Breiman, L. Bagging predictors. Mach. Learn. 1996, 24, 123–140. [Google Scholar] [CrossRef]
- Xu, L.; Krzyzak, A.; Suen, C.Y. Methods of combining multiple classifiers and their applications to handwriting recognition. IEEE Trans. Syst. Man Cybern. 1992, 22, 418–435. [Google Scholar] [CrossRef]
- Rahman, A.F.R.; Fairhurst, M.C. Serial combination of multiple experts: A unified evaluation. Pattern Anal. Appl. 1999, 2, 292–311. [Google Scholar] [CrossRef]
- Du, P.; Xia, J.; Zhang, W.; Tan, K.; Liu, Y.; Liu, S. Multiple classifier system for remote sensing image classification: A review. Sensors 2012, 12, 4764–4792. [Google Scholar] [CrossRef] [PubMed]
- Abe, B.T.; Olugbara, O.O.; Marwala, T. IAENG transactions on engineering technologies. In Classification of Hyperspectral Images Using Machine Learning Methods; Springer Netherlands: Dordrecht, The Netherlands, 2014; pp. 555–569. [Google Scholar]
- Pontius Junior, R.G.; Millones, M. Death to Kappa: Birth of quantity disagreement and allocation disagreement for accuracy assessment. Int. J. Remote Sens. 2011, 32, 4407–4429. [Google Scholar] [CrossRef]
- Iiames, J.S.; Congalton, R.G.; Lunetta, R.S. Analyst variation associated with land cover image classification of Landsat ETM+ data for the assessment of coarse spatial resolution regional/global land cover products. GIScience Remote Sens. 2013, 50, 604–622. [Google Scholar]
- Ogura, A.T. Relação e Previsibilidade de Eventos Meteorológicos Extremos Deflagadores de Acidentes de Movimentos de Massa na Serra do Mar; IPT (Instituto de Pesquisa e Tecnologia): São Paulo, Brazil, 2006. [Google Scholar]
- Manfre, L.A. Identificação e Mapeamento de Áreas de Deslizamento Associadas a Rodovias Utilizando Imagens de Sensoriamento Remoto. Ph.D. Thesis, Escola Politécnica da Universidade de São Paulo, São Paulo, Brazil, 2015. [Google Scholar]
- Wolle, C.M. Análise dos Escorregamentos Translacionais Numa Região da Serra do Mar no Contexto de uma Classificação de Mecanismos de Instabilização de Encostas. Ph.D. Thesis, Escola Politécnica da Universidade de São Paulo, São Paulo, Brazil, 1988. [Google Scholar]
- Toledo, J.M.A. Crop Discrimination Using Harmonic Analysis of EVI Modis Time-Series Data. Master’s Thesis, Instituto Nacional de Pesquisas Espaciais, São José dos Campos, Brazil, 2008. [Google Scholar]
- Ma, H.; Qin, Q.; Shen, X. Shadow segmentation and compensation in high resolution satellite images. In Proceedings of the International Geoscience and Remote Sensing Symposium, Boston, MA, USA, 7–11 July 2008; Volume 2, pp. 1036–1039.
- Kanungo, T.; Mount, D.M.; Netanyahu, N.S.; Piatko, C.D.; Silverman, R.; Wu, A.Y. An efficient k-means clustering algorithm: Analysis and implementation. IEEE Trans. Pattern Anal. Mach. Intell. 2002, 24, 881–892. [Google Scholar] [CrossRef]
- Lo, C.P.; Choi, J. A hybrid approach to urban land use/cover mapping using Landsat 7 Enhanced Thematic Mapper Plus (ETM+) images. Int. J. Remote Sens. 2004, 25, 2687–2700. [Google Scholar] [CrossRef]
- Nemmour, H.; Chibani, Y. Multiple support vector machines for land cover change detection: An application for mapping urban extensions. ISPRS J. Photogramm. Remote Sens. 2006, 61, 125–133. [Google Scholar] [CrossRef]
- Otukei, J.R.; Blaschke, T. Land cover change assessment using decision trees, support vector machines and maximum likelihood classification algorithms. Int. J. Appl. Earth Obs. Geoinf. 2010, 12, S27–S31. [Google Scholar] [CrossRef]
- Petropoulos, G.P.; Vadrevu, K.P.; Xanthopoulos, G.; Karantounias, G.; Scholze, M. A comparison of spectral angle mapper and artificial neural network classifiers combined with Landsat TM imagery analysis for obtaining burnt area mapping. Sensors 2010, 10, 1967–1985. [Google Scholar] [CrossRef] [PubMed]
- Ranawana, R.; Palade, V. Multi-classifier systems: Review and a roadmap for developers. Int. J. Hybrid Intell. Syst. 2006, 3, 1–41. [Google Scholar] [CrossRef]
- Testud, J.; Oury, S.; Black, R.A.; Amayenc, P.; Dou, X. The concept of “normalized” distribution to describe raindrop spectra: A tool for cloud physics and cloud remote sensing. J. Appl. Meteorol. 2001, 40, 1118–1140. [Google Scholar] [CrossRef]
- Tso, G.K.F.; Yau, K.K.W. Predicting electricity energy consumption: A comparison of regression analysis, decision tree and neural networks. Energy 2007, 32, 1761–1768. [Google Scholar] [CrossRef]
- Ghose, M.K.; Pradhan, R.; Ghose, S.S. Decision tree classification of remotely sensed satellite data using spectral separability matrix. Int. J. Adv. Comput. Sci. Appl. 2010, 1, 93–101. [Google Scholar]
- Wu, F.; Zhan, J.; Yan, H.; Shi, C.; Huang, J. Land cover mapping based on multisource spatial data mining approach for climate simulation: A case study in the farming-pastoral ecotone of North China. Adv. Meteorol. 2013, 2013. [Google Scholar] [CrossRef]
- Blaschke, T. Object based image analysis for remote sensing. ISPRS J. Photogramm. Remote Sens. 2010, 65, 2–16. [Google Scholar] [CrossRef]
- Congalton, R.G. A review of assessing the accuracy of classifications of remotely sensed data. Remote Sens. Environ. 1999, 37, 35–46. [Google Scholar] [CrossRef]
- Ho, T.K.; Hull, J.J.; Srihari, S.N. On multiple classifier systems for pattern recognition. In Proceedings of the 11th IEEE International Conference on Pattern Recognition, Hague, The Netherlands, 30 August–3 September 1992; p. 84.
- Ben Abdallah, A.C.; Frigui, H.; Gader, P. Adaptive local fusion with fuzzy integrals. IEEE Trans. Fuzzy Syst. 2012, 20, 849–864. [Google Scholar] [CrossRef]
- Tian, G.; Liu, J.; Xie, Y.; Yang, Z.; Zhuang, D.; Niu, Z. Analysis of spatio-temporal dynamic pattern and driving forces of urban land in China in 1990s using TM images and GIS. Cities 2005, 22, 400–410. [Google Scholar] [CrossRef]
- Lorenzi, L.; Melgani, F.; Mercier, G. A complete processing chain for shadow detection and reconstruction in VHR images. IEEE Trans. Geosci. Remote Sens. 2012, 50, 3440–3452. [Google Scholar] [CrossRef]
- Manfré, L.A.; Shinohara, E.J.; Silva, J.B.; Siqueira, R.N.P.; Giannotti, M.A.; Quintanilha, J.A. Method for landslides identification at the Sao Paulo state coast, Brazil. Geociências 2014, 33, 172–180. [Google Scholar]
- Woźniak, M.; Graña, M.; Corchado, E. A survey of multiple classifier systems as hybrid systems. Inf. Fusion 2014, 16, 3–17. [Google Scholar] [CrossRef]
- Kittler, J.; Hatef, M.; Duin, R.; Matas, J. On combining classifiers. IEEE Trans. Pattern Anal. Mach. Intell. 2006, 20, 226–239. [Google Scholar] [CrossRef]
- Lysiak, R.; Kurzynski, M.; Woloszynski, T. Optimal selection of ensemble classifiers using measures of competence and diversity of base classifiers. Neurocomputing 2014, 126, 29–35. [Google Scholar] [CrossRef]
- Moreno-Seco, F.; Inesta, J.; De Leon, P.; Mico, L. Comparison of classifier fusion methods for classification in pattern recognition tasks. In Structural, Syntactic, and Statistical Pattern Recognition; Springer: Berlin, Germany, 2006; pp. 705–713. [Google Scholar]
- Foody, G.M. Status of land cover classification accuracy assessment. Remote Sens. Environ. 2002, 80, 185–201. [Google Scholar] [CrossRef]
- Krogh, A.; Vedelsby, J. Neural network ensembles, cross validation, and active learning. Adv. Neural Inf. Process. Syst. 1995, 7, 231–238. [Google Scholar]
- Brown, G.; Wyatt, J.; Harris, R.; Yao, X. Diversity creation methods: A survey and categorisation. Inf. Fusion 2005, 6, 5–20. [Google Scholar] [CrossRef]
- Michail, P.; Benediktsson, J.A.; Ioannis, K. The effect of classifier agreement on the accuracy of the combined classifier in decision level fusion. IEEE Trans. Geosci. Remote Sens. 2005, 39, 2539–2546. [Google Scholar]
- Chandra, A.; Yao, X. Evolving hybrid ensembles of learning machines for better generalisation. Neurocomputing 2006, 69, 686–700. [Google Scholar] [CrossRef]
- Foody, G.M. Classification accuracy comparison: Hypothesis tests and the use of confidence intervals in evaluations of difference, equivalence and non-inferiority. Remote Sens. Environ. 2009, 113, 1658–1663. [Google Scholar] [CrossRef]
- Giacinto, G.; Roli, F.; Fumera, G. Selection of image classifiers. Electron. Lett. 2000, 36, 420–422. [Google Scholar] [CrossRef]
- Koc-San, D. Evaluation of different classification techniques for the detection of glass and plastic greenhouses from WorldView-2 satellite imagery. J. Appl. Remote Sens. 2013, 7. [Google Scholar] [CrossRef]
- Waske, B.; Van Der Linden, S.; Oldenburg, C.; Jakimow, B.; Rabe, A.; Hostert, P. imager—A user-oriented implementation for remote sensing image analysis with Random Forests. Environ. Model. Softw. 2012, 35, 192–193. [Google Scholar] [CrossRef]
- Liu, J.; Pan, Y.; Zhu, X.; Zhu, W. Using phenological metrics and the multiple classifier fusion method to map land cover types. J. Appl. Remote Sens. 2014, 8, 083691. [Google Scholar] [CrossRef]


| Number of Classifiers | Classifiers |
|---|---|
| 10 | BE, DT, MHD, MD, MLC, NN, PAR, SAM, SID and SVM |
| 9 | DT, MHD, MD, MLC, NN, PAR, SAM, SID and SVM |
| 8 | MHD, MD, MLC, NN, PAR, SAM, SID and SVM |
| 7 | MHD, MLC, NN, PAR, SAM, SID and SVM |
| 6 | MHD, MLC, NN, PAR, SAM and SVM |
| 5 | MHD, MLC, NN, SAM and SVM |
| 4 | MD, MLC, NN, and SVM |
| 3 | MLC, SVM and NN |
| 2 | SVM and NN |
| Classifiers | Kappa | Overall Accuracy % | Landslide Class | ||
|---|---|---|---|---|---|
| Commission Errors % | Omission Errors % | % Correct | |||
| Binary Encoding | 0.3424 | 48.5433 | 93.81 | 48.77 | 61.23 |
| Decision Tree (J48) | 0.8081 | 89.4852 | 82.22 | 77.78 | 22.22 |
| Mahalanobis Distance | 0.7527 | 85.6517 | 94.14 | 54.94 | 43.06 |
| Minimum Distance | 0.5561 | 71.7515 | 80.85 | 62.5 | 37.5 |
| Maximum Likelihood Classification | 0.9359 | 96.6484 | 59.3 | 48.61 | 51.39 |
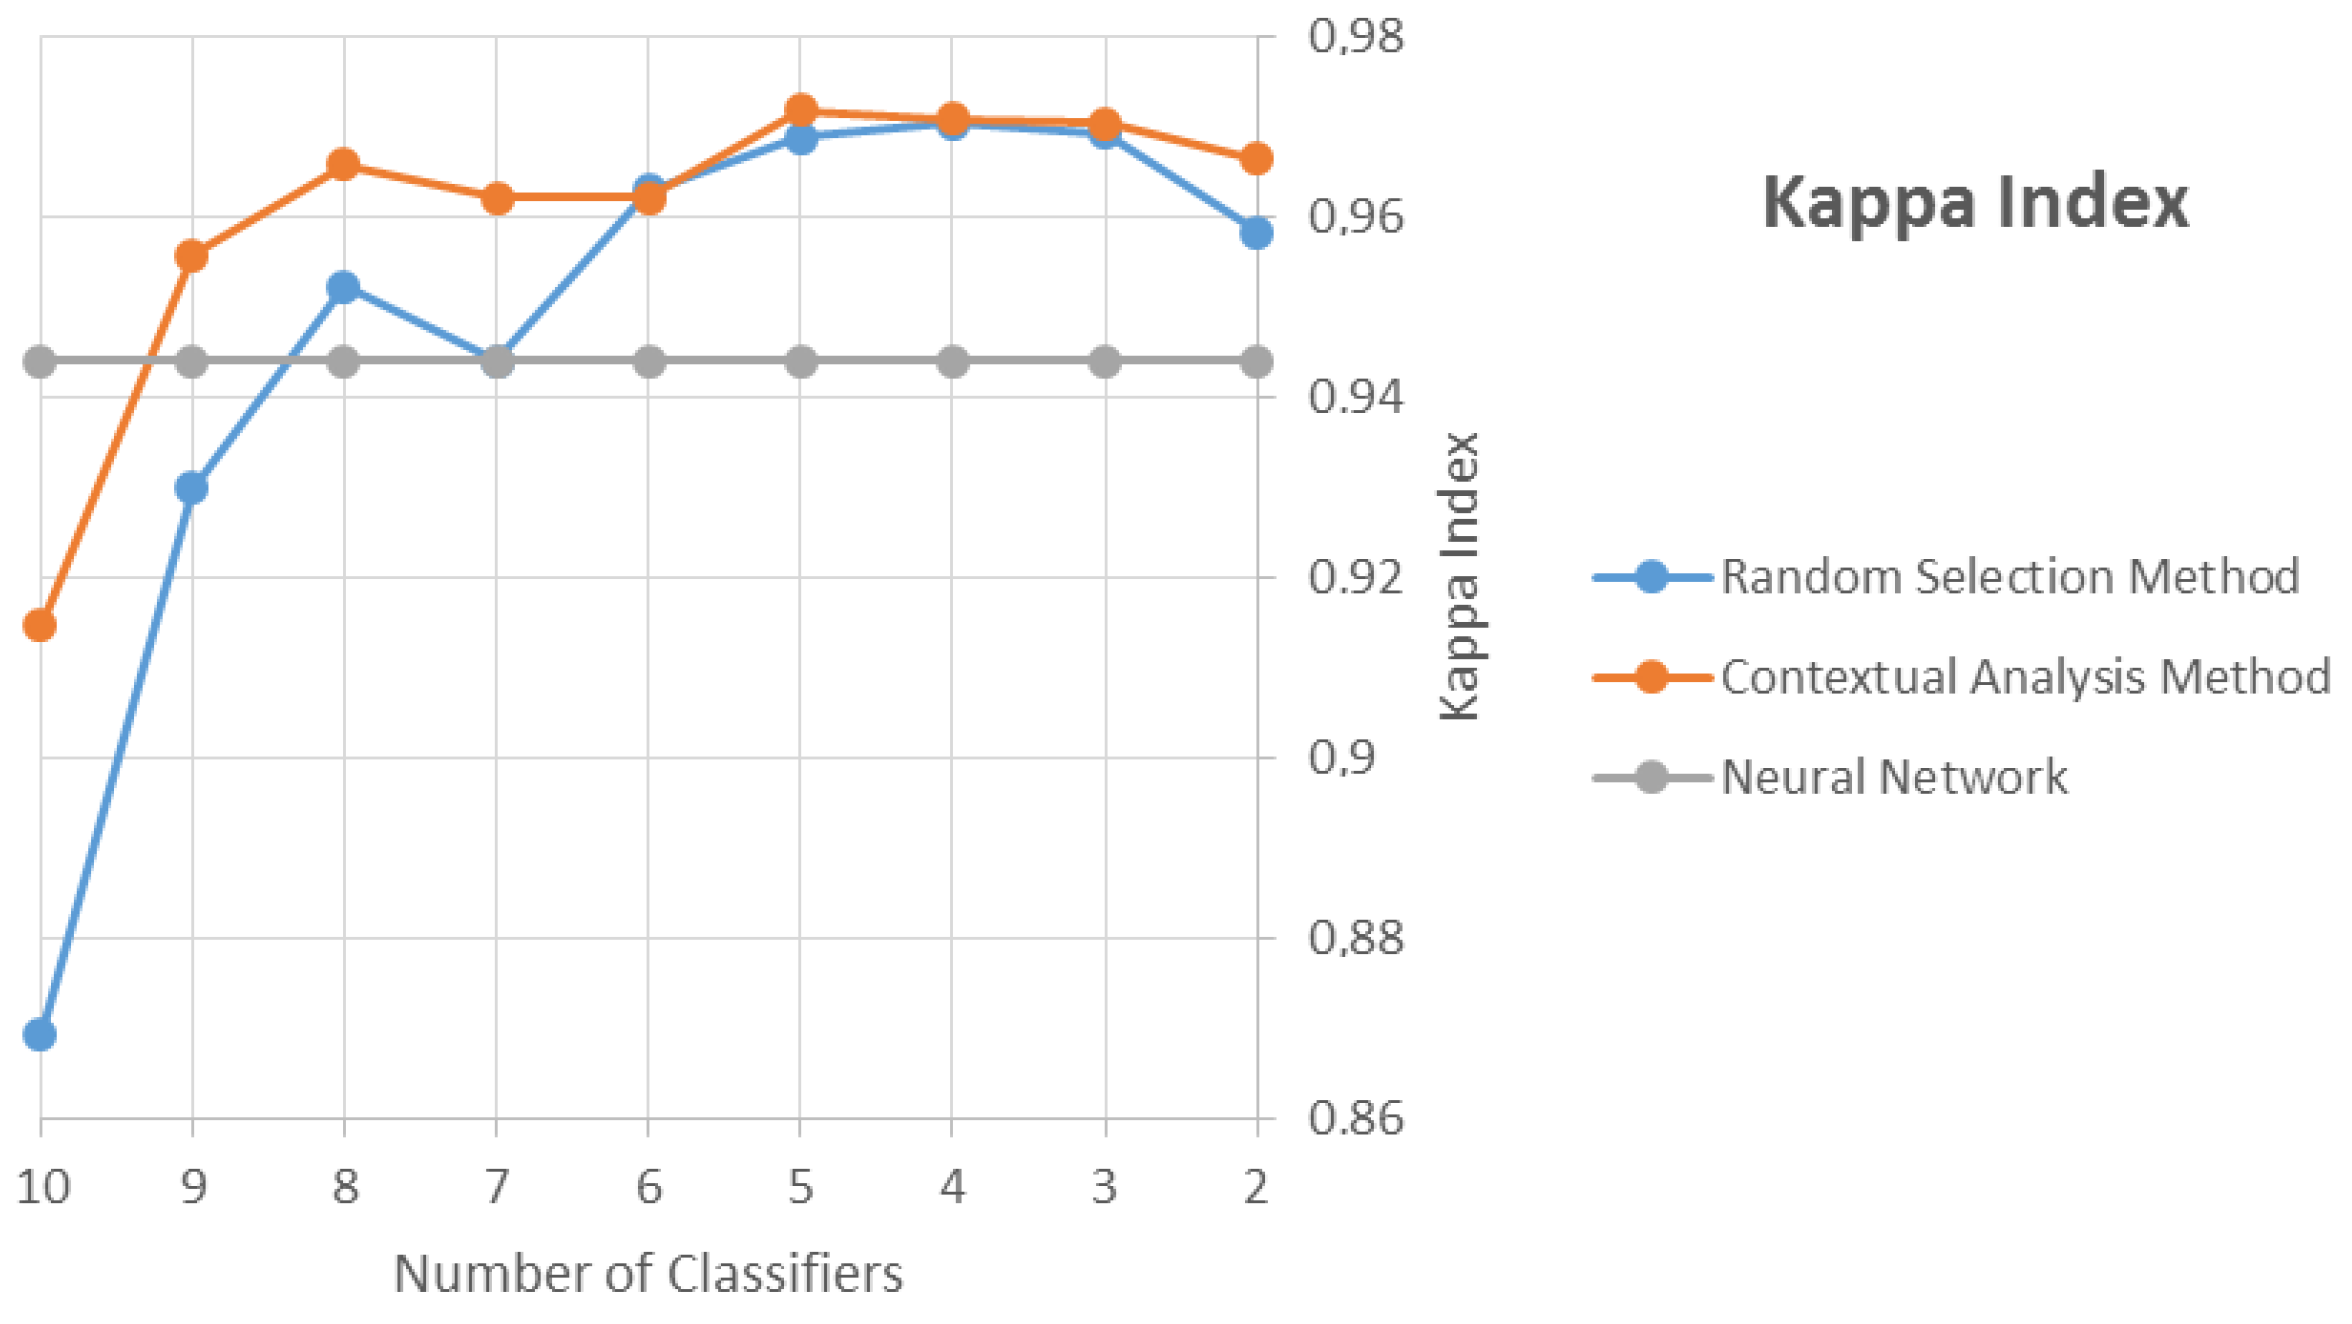
| Neural Network | 0.9441 | 97.0865 | 59.09 | 25.00 | 75.00 |
| Parallelepiped | 0.638 | 79.759 | 82.81 | 69.44 | 30.56 |
| Spectral Angle Mapper | 0.3002 | 37.678 | 60.00 | 55.56 | 44.44 |
| Spectral Information Divergence | 0.4673 | 62.322 | 70.11 | 63.89 | 36.11 |
| Support Vector Machine | 0.9325 | 96.4513 | 66.49 | 13.89 | 86.11 |
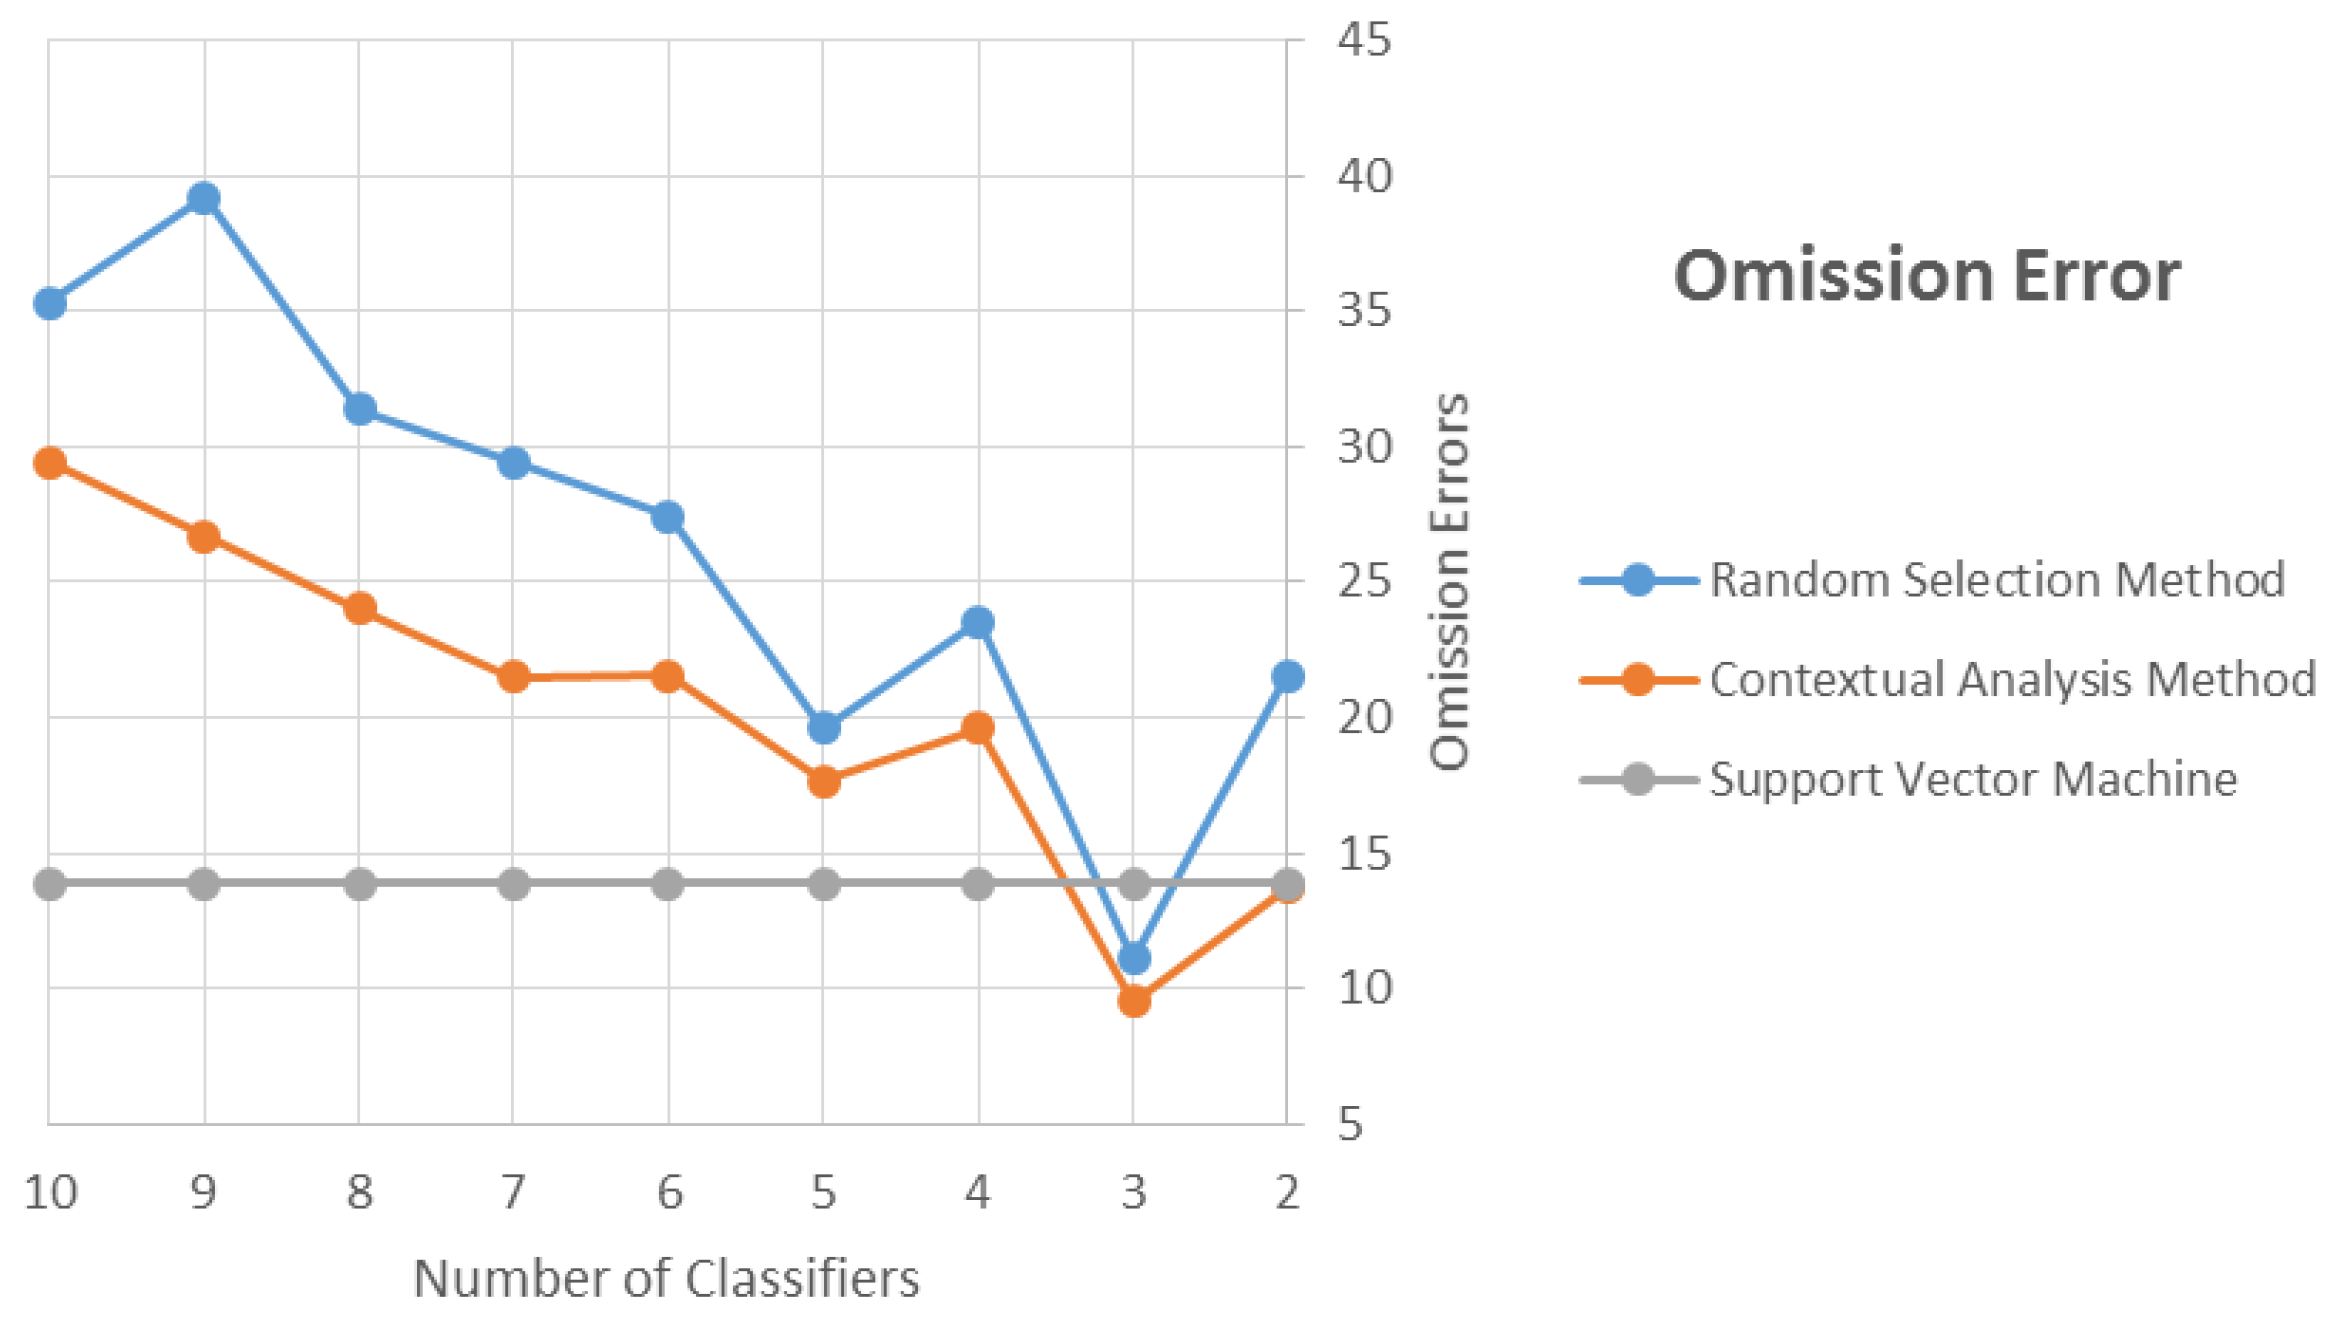
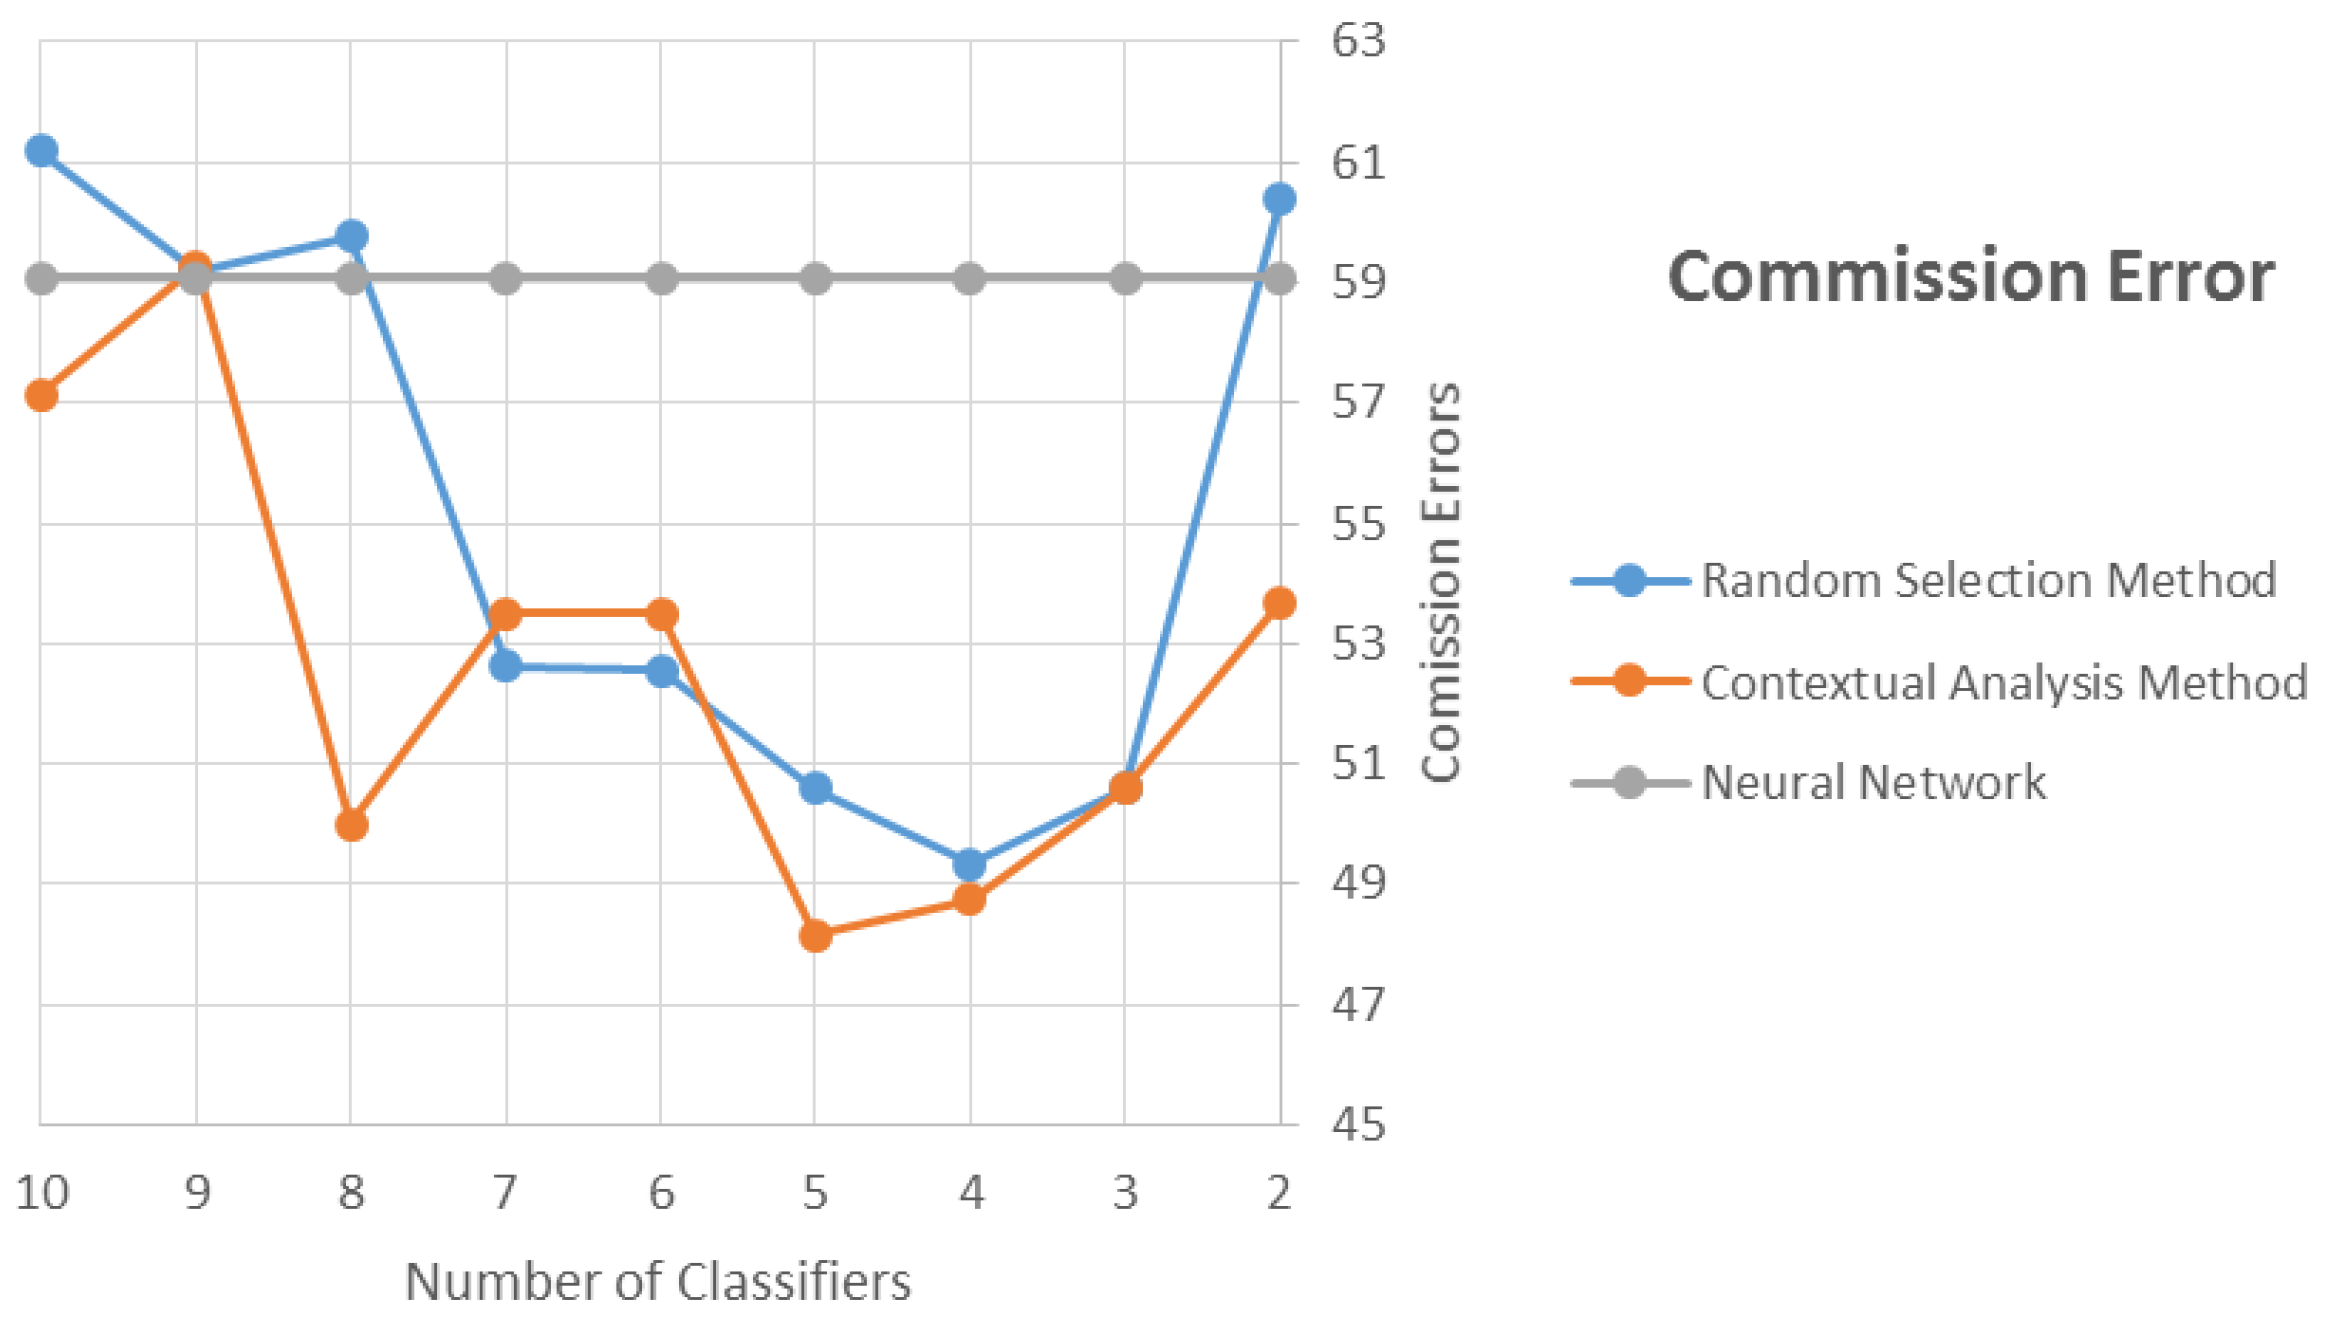
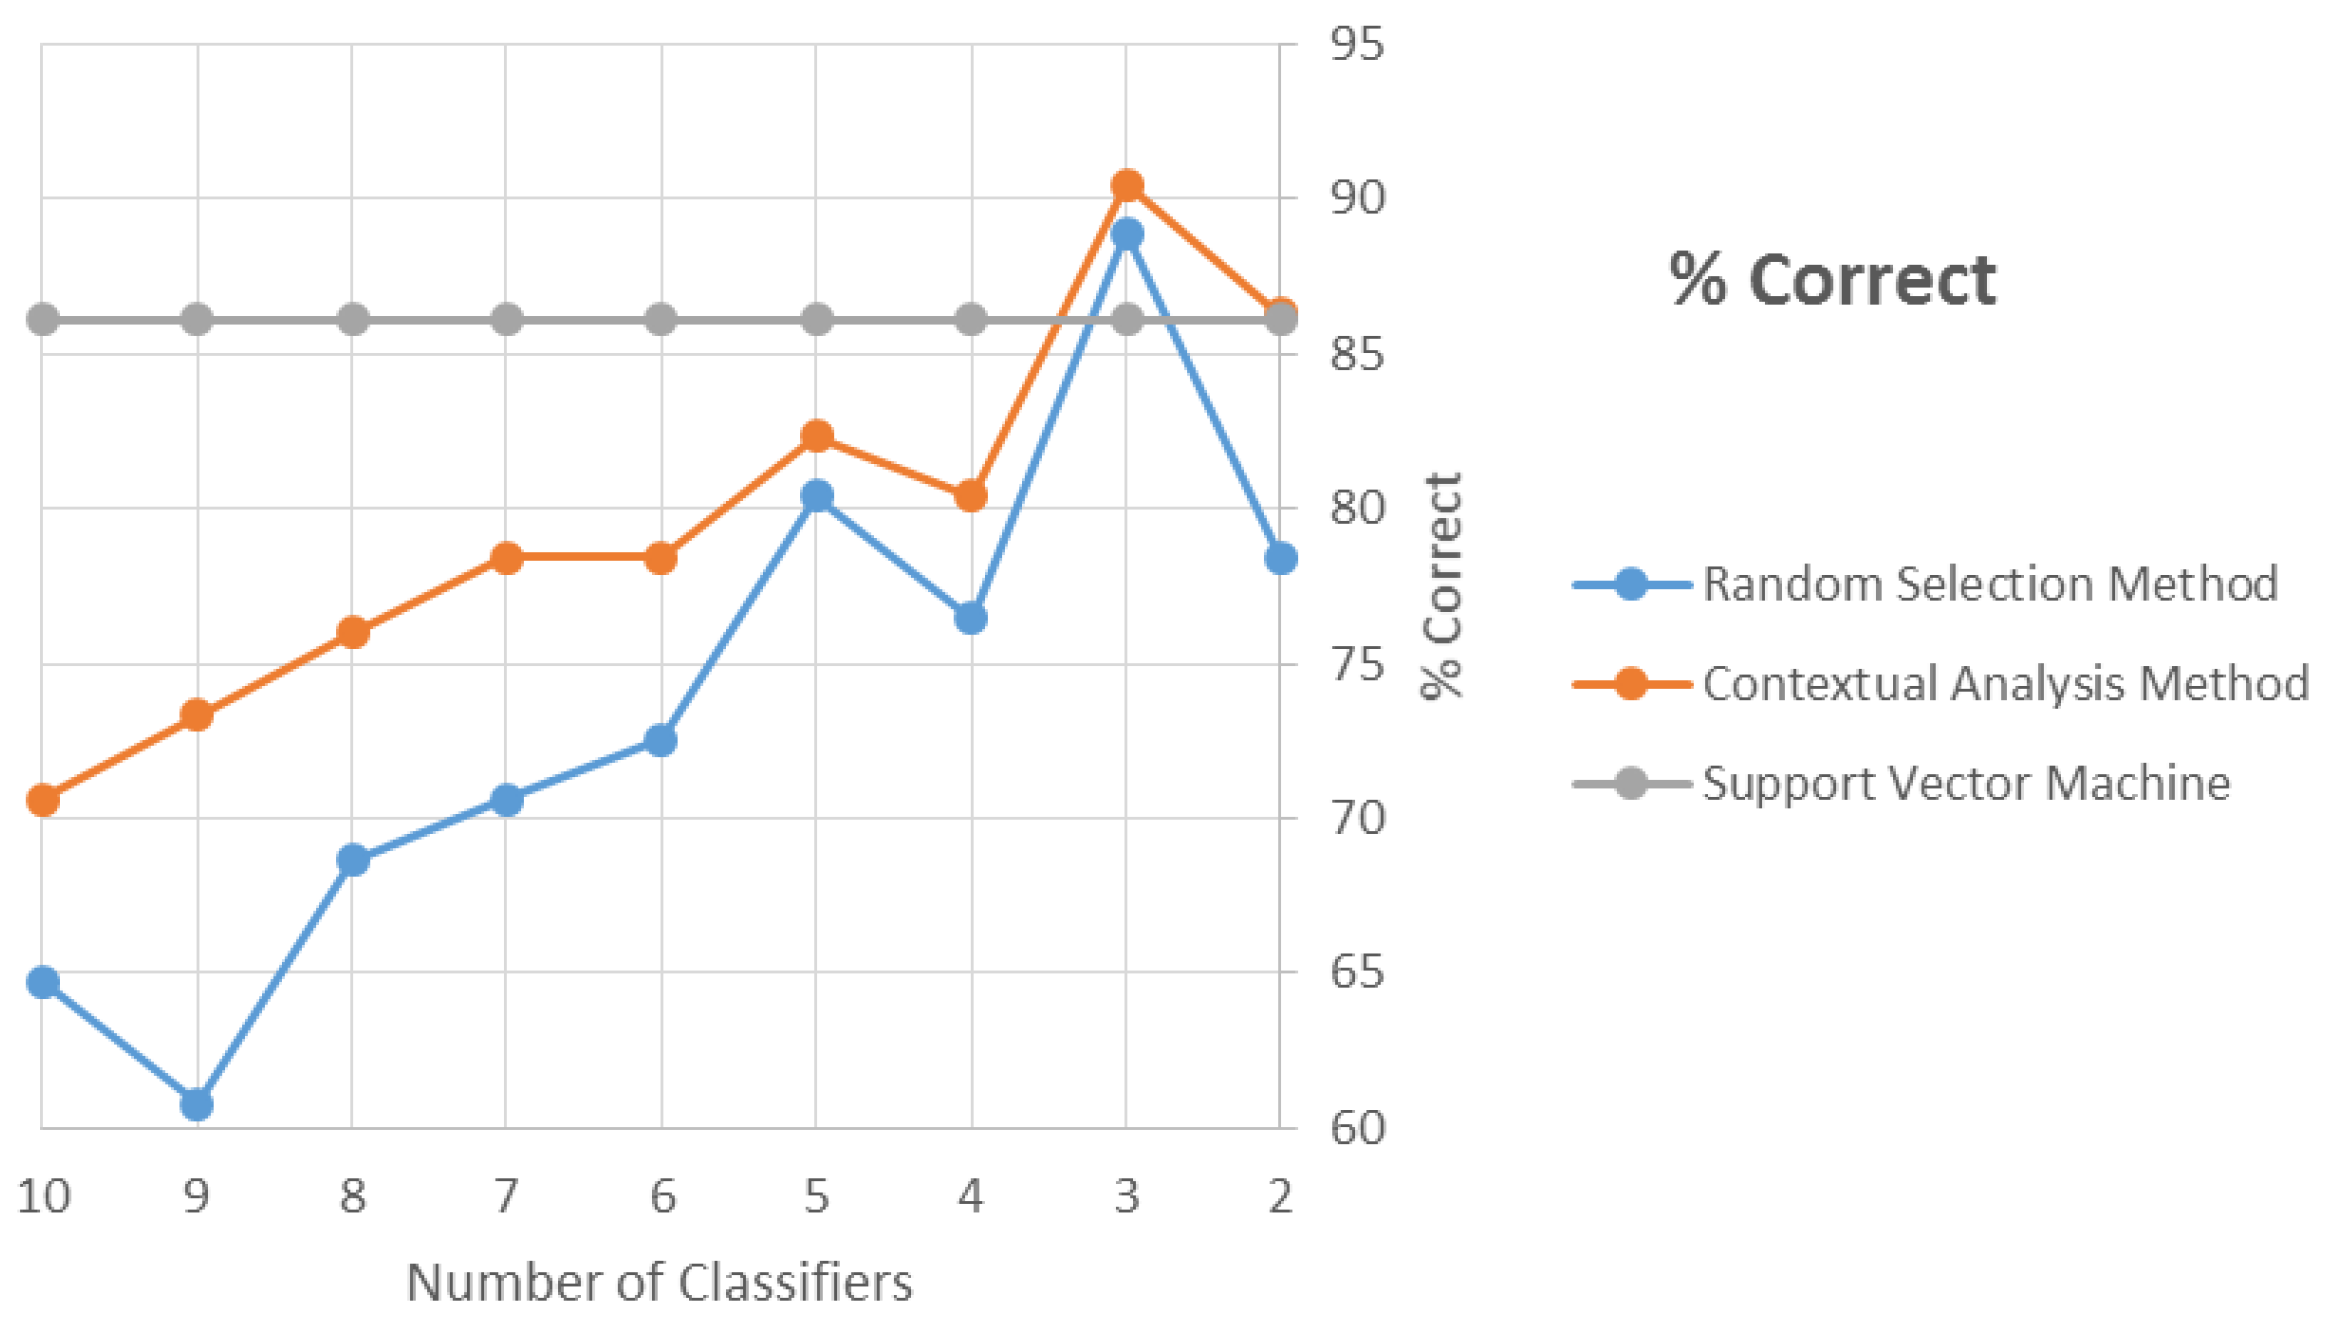
| Tie Breaking | Classifiers Number | Kappa | Overall Accuracy % | Landslide Class | ||
|---|---|---|---|---|---|---|
| Commission Errors % | Omission Errors % | % Correct | ||||
| Random Selection Method | 10 | 0.8692 | 93.404 | 61.18 | 35.29 | 64.71 |
| 9 | 0.93 | 96.6313 | 59.21 | 39.22 | 60.78 | |
| 8 | 0.9523 | 97.7385 | 59.77 | 31.37 | 68.63 | |
| 7 | 0.9441 | 97.338 | 52.63 | 29.41 | 70.59 | |
| 6 | 0.963 | 98.2568 | 52.56 | 27.45 | 72.55 | |
| 5 | 0.9689 | 98.5395 | 50.6 | 19.61 | 80.39 | |
| 4 | 0.9704 | 98.6101 | 49.35 | 23.53 | 76.47 | |
| 3 | 0.9694 | 98.563 | 50.6 | 11.11 | 88.89 | |
| 2 | 0.9584 | 98.0448 | 60.4 | 21.57 | 78.43 | |
| Contextual Analysis | 10 | 0.9147 | 95.8539 | 57.14 | 29.41 | 70.59 |
| 9 | 0.9558 | 97.8998 | 59.26 | 26.67 | 73.33 | |
| 8 | 0.9659 | 98.3966 | 50 | 24 | 76 | |
| 7 | 0.9622 | 98.2097 | 53.49 | 21.47 | 78.43 | |
| 6 | 0.9622 | 98.2097 | 53.49 | 21.57 | 78.43 | |
| 5 | 0.9719 | 98.6805 | 48.15 | 17.65 | 82.35 | |
| 4 | 0.9709 | 98.6337 | 48.75 | 19.61 | 80.39 | |
| 3 | 0.9704 | 98.6101 | 50.59 | 9.52 | 90.48 | |
| 2 | 0.9664 | 98.4217 | 53.68 | 13.73 | 86.27 | |
| From/To | Unclassified | Landslides | Urban | Water | Vegetation |
|---|---|---|---|---|---|
| Unclassified | 0.4123 | 0.1727 | 0.2705 | 0.0663 | 0.2779 |
| Landslide | 0.0141 | 0.4408 | 0.0033 | 0.014 | 0.0082 |
| Urban | 0.2466 | 0.029 | 0.6 | 0.0037 | 0.0948 |
| Water | 0.015 | 0.1811 | 0.0033 | 0.9076 | 0.0094 |
| Vegetation | 0.3121 | 0.1764 | 0.1229 | 0.0083 | 0.6097 |
© 2016 by the authors; licensee MDPI, Basel, Switzerland. This article is an open access article distributed under the terms and conditions of the Creative Commons Attribution (CC-BY) license (http://creativecommons.org/licenses/by/4.0/).
Share and Cite
Manfré, L.A.; De Albuquerque Nóbrega, R.A.; Quintanilha, J.A. Evaluation of Multiple Classifier Systems for Landslide Identification in LANDSAT Thematic Mapper (TM) Images. ISPRS Int. J. Geo-Inf. 2016, 5, 164. https://doi.org/10.3390/ijgi5090164
Manfré LA, De Albuquerque Nóbrega RA, Quintanilha JA. Evaluation of Multiple Classifier Systems for Landslide Identification in LANDSAT Thematic Mapper (TM) Images. ISPRS International Journal of Geo-Information. 2016; 5(9):164. https://doi.org/10.3390/ijgi5090164
Chicago/Turabian StyleManfré, Luiz Augusto, Rodrigo Affonso De Albuquerque Nóbrega, and José Alberto Quintanilha. 2016. "Evaluation of Multiple Classifier Systems for Landslide Identification in LANDSAT Thematic Mapper (TM) Images" ISPRS International Journal of Geo-Information 5, no. 9: 164. https://doi.org/10.3390/ijgi5090164
APA StyleManfré, L. A., De Albuquerque Nóbrega, R. A., & Quintanilha, J. A. (2016). Evaluation of Multiple Classifier Systems for Landslide Identification in LANDSAT Thematic Mapper (TM) Images. ISPRS International Journal of Geo-Information, 5(9), 164. https://doi.org/10.3390/ijgi5090164