Article

Soil Sealing and the Complex Bundle of Influential Factors: Germany as a Case Study

Leibniz Institute of Ecological Urban and Regional Development, DE-01217 Dresden, Germany
*
Author to whom correspondence should be addressed.
ISPRS Int. J. Geo-Inf. 2016, 5(8), 132; https://doi.org/10.3390/ijgi5080132
Submission received: 29 April 2016 / Revised: 18 July 2016 / Accepted: 21 July 2016 / Published: 1 August 2016

Abstract

:
In order to discuss the impact of land consumption, it is first necessary to localize and quantify the extent of sealed surfaces. Since 2010, the monitoring of land use structures and developments in Germany has been provided by the Monitor of Settlement and Open Space Development at the Leibniz Institute of Ecological Urban and Regional Development (IÖR; IÖR Monitor), a scientific service operated by the Leibniz Institute of Ecological Urban and Regional Development. The IÖR Monitor includes an indicator for soil sealing for the years 2006, 2009 and 2012. Using this new source of data, it is possible for the first time to conduct quantitative studies at the level of Germany’s municipalities with the aim of documenting the extent of soil sealing as a form of spatial classification, as well as to investigate possible correlations with other influential factors. Here, we describe a comprehensive data inspection of soil sealing and potential influential factors. Structural interrelationships are identified under the application of classical and spatial regression methods.

1. Introduction

1.1. The Problem of Land Take and Soil Sealing

“In contrast to water or biomass, soils are an exhaustible and non-renewable natural resource. In general, they are finite, ecologically sensitive and can only be restored under considerable technical and financial investment” [1]. Currently, the question of how to reconcile the consumption of previously undisturbed sites for settlement and transportation infrastructure (= land take) with the general principle of sustainable development has been at the heart of discussions in the national and international spatial sciences (e.g., Research for the Reduction of Land Consumption and for Sustainable Land Management (REFINA) 2006–2012, Research for Sustainability (FONA) 2009–2015, [2,3,4]), as well as at the political level (cf. National Strategy on Biological Diversity, German Adaptation Strategy to Climate Change, National Sustainability Strategy). The increase in the extent of soil sealing is closely linked, though not identical with, land consumption. Soil sealing has repercussions for groundwater reserves, the urban climate, as well as local flora and fauna [5,6,7,8,9,10]. There exists a range of various definitions of soil sealing: “Soil sealing is the covering or sealing of soil with partially permeable (e.g., water-bound surface materials, grass pavers) or impermeable materials (e.g., concrete, tarmac) for buildings as well as transport infrastructure (and open space development)” (cf. [11], p. 38). “Sealed soils are those whose natural succession of soil horizons or substrate layers have been altered by the introduction of a structural foundation or barrier layer (concrete, tarmac, cobblestones, plastic sheeting, buildings, etc.)” ([12], p. 325). “Soil sealing can be defined as the covering of soils by buildings, constructions and layers of completely or partly impermeable artificial material (asphalt, concrete, etc.). It is the most intense form of land take and is essentially an irreversible process” (cf. [9], p. 200).
In Germany, there exists a number of laws that serve to protect the natural basis for life (cf. Basic Law Art. 20 a), to secure the efficient and careful handling of land and soils (cf. Federal Building Code § 1a, Federal Spatial Planning Act § 2) or to reduce the extent of soil sealing (cf. Federal Soil Protection Act § 1, § 5, Federal Nature Conservation Act § 1, Soil Framework Directive § 1). At the European Level, efforts to reduce the destruction of soils by means of the Soil Framework Directive (EU-SFD) have been hotly discussed (see also: Soil Thematic Strategy, Soil Framework Directive, Resource Efficiency Roadmaps). In 2012, the EU Environment Commissioner, Janez Potocnik, emphasized the necessity of limiting the extent of soil sealing (EU Commission, 2012): “The loss of soil resources through urbanisation and the conversion of our landscape is one of the major environmental challenges facing Europe. There is an urgent need to use this valuable resource more wisely, in order to secure its many vital services for future generations. We simply cannot pave over our chances for a sustainable future”. Against this backdrop, one prerequisite for an informed discussion on the extent and repercussions of land consumption is the localization and quantification of sealed surfaces. In Germany, as well as in other European nations, the challenge now is to survey the level of soil sealing for entire national territories. Hitherto, now spatially-differentiated maps of sealed surfaces have only been drawn up as part of research projects and often only in selected regions (see Section 2). However, recently available remote-sensing data provided by the European Environmental Agency (EEA) now enable the uniform detection of sealed surfaces for the whole of Europe (EEA 2010) [13]. This also permits us to specify possible correlations with other economic, social, ecological and technical variables (cf. [14,15]).

1.2. Objectives and Structure of the Paper

The aim of this paper is to use the recently available EEA data to classify Germany’s municipalities according to the degree of soil sealing, as well as to map the current extent of sealing. The main emphasis is on applying correlation and regression methods to uncover interdependencies with other influential factors (using additional statistical data). This will create an empirical basis to help pinpoint potential developments in soil sealing and to underpin discussions on how political instruments can help reduce the extent of soil sealing (cf. [2]). The paper is structured as follows. Section 2 provides an overview of previous methods to estimate and describe soil sealing. Then, we present a list of hypothesis on the complex bundle of influential factors (Section 3). On this basis, we present some specially-developed data capturing and processing steps (Section 4), as well as relevant data analysis methods in support of correlation and regression analysis (Section 5). A discussion of the results of the data analysis (Section 6) provides the basis for a detailed discussion (Section 7) and some conclusions (Section 8).

2. Studies on the Quantification of Soil Sealing

Previous approaches to the quantification and description of soil sealing can be distinguished according to the underlying methodology, i.e., indicator-based calculations, remote sensing models or estimates based on multivariate statistics.
In this section, we concentrate on the discussion of approaches for a nationwide investigation of soil sealing. Further, this discussion will be complemented by references to studies that have examined the local and regional characteristics of soil sealing. In the following, we do not describe the local surveying and mapping of sealed surfaces, as the resulting data can generally not be fully transferred to the national level due to a lack of time or resources.

2.1. Indicator-Based Calculations

Assisted by expert knowledge, as well as a range of previous studies on soil sealing, the indicator-based calculations should determine the surface area within settlement and transportation areas that is either built-up or sealed (e.g., water-bound surfaces or surfaces covered by concrete, tarmac or paving). Pre-determined soil sealing ratios (indicators) for the various classes of land use have been applied in previous studies [16,17,18].

2.2. Datasets from Remote Sensing

Remote sensing imagery combined with techniques of image analysis can provide an up-to-date, detailed and spatially-differentiated analysis of soil sealing. Previous studies at the local and regional level have confirmed the potential of these techniques to determine the extent of soil sealing both in Germany (such as Agglomeration Cologne/Bonn: [19]; Stuttgart: [20]; North Rhine-Westphalia: [21]; Bavaria: [22,23] and elsewhere (such as the Columbus Metropolitan Area, Ohio: [24]; large regions in the USA: [25]; and Italy: [26,27]). Furthermore, efforts have been made to predict impervious surface extents based on urban growth models (e.g., [28]).
However, results derived in this way are generally unsuited to the analysis of soil sealing at the national level as the processing steps are highly complex and may require some manual input.
As mentioned earlier, the European Environment Agency [13] published the first exhaustive dataset on imperviousness in Europe for the years 2006, 2009 and 2012 based on the analysis of high-resolution satellite data. Several technical EEA documentations indicate the acquisition, analysis and evaluation processes of the soil sealing (resp. imperviousness) datasets [29,30]. The estimation of the degree of soil sealing is based on the strong (negative) correlation between the extent of vegetation and the degree of imperviousness in urban areas. Vegetation coverage can be reliably derived from the Normalized Differenced Vegetation Index (NDVI), which allows for the discrimination of vegetation from other surfaces due to its specific spectral signature in the red and near-infrared bands [19].

2.3. Estimates of Soil Sealing Using Multivariate Analysis

When multivariate analysis is applied in this context, soil sealing is treated as a highly aggregated indicator that can be used to investigate complex and interrelated urban development processes that are often difficult to model [11,31,32]. In order to support the comparative evaluation of land services (e.g., ecological and economic services), variables are carefully selected to reveal dependencies between features, as well as other causal relationships. Generally, bivariate correlation and regression analysis is applied [11,33,34,35,36,37,38,39,40], as well as principal component analysis [11,31,37]. In connection with data on soil sealing, cluster analysis is also used in individual cases to create a classification of urban types representing specific features of land use or services provision on the basis of economic and ecological criteria (e.g., [41]). The creation of “complex” systems of functions helps to reveal interdependencies that can be used to characterize soil sealing at the national level [2,42,43]. Previous quantitative studies have largely focused on urban areas.
It is the view of the authors of the current paper that the investigation of the named interdependencies has been greatly facilitated in recent years by the increased availability and topicality of geo-referenced data sources on soil sealing, as well as statistical data on potential influential factors. It is the aim of the current article to classify the extent of soil sealing at the level of Germany’s municipalities using nationally available data (see Section 4: European Soil Sealing Data). This will also enable the creation of functions to estimate the extent of soil sealing and can help to improve our understanding of the underlying interdependencies, as well as related spatial structures.

3. Hypotheses on Soil Sealing and the Complex Bundle of Influential Factors

Table 1 gives an overview of hypotheses on the expected complex bundle of influential factors. The table aims to support data collection and, in particular, multidimensional data analyses (cf. Section 6). Each hypothesis refers to a thematic dimension, such as mobility, economy, politics, etc. [44]. Selected references to other studies on influential factors are listed in the last column of the Table. The list is intended to encourage the discussion of geostatistical results and to provide a comparison with similar results in other countries or with results referring to other spatial scales (cf. Section 7).

4. Data

4.1. European Soil Sealing Data

The Imperviousness High Resolution Layer (HRL) constitutes one of the first operational geo-information services of the European Copernicus Land Monitoring Services (formerly GMES (Global Monitoring for Environment and Security)) of the European Commission (EC) and the European Space Agency (ESA). Previously, this dataset was referred to as the EEA Fast Track Service Precursor on Land Monitoring—Degree of soil sealing. The temporal perspective not only enables the analysis of the current state of soil sealing, but also offers insight into the way this changes over time, as data series allow for comparison. Derived datasets, such as the indicator “change of degree of imperviousness”, are also available for the time frames 2006/2009 and 2009/2012. Data are provided as raster datasets at geometric resolution of 20 m × 20 m and 100 m × 100 m in the European Grid projection (European Terrestrial Reference System 1989, Lambert azimuthal equal-area projection; ETRS89-LAEA) for a total of 38 European nations (including Germany). Input data are largely orthorectified high-resolution satellite images (visible and near infrared) for the relevant years (in each case ±1 year) provided by SPOT 4 and 5 as well as IRS-P6 platforms (Geoland 2, 2013). Data processing is by means of supervised classification with subsequent visual optimization of the classification results. The accuracy of the data is specified at 85% R 2 for urbanized areas. Validation of the 20 m dataset revealed an above-average correlation of R 2 = 0 . 65 with imperviousness reference data. However, after aggregating pixels to larger units (up to a 500 m cell size), the correlation could be increased to R 2 = 0 . 88 [29].
As we intended to analyze soil sealing degrees for the German municipalities, the calculation of mean municipal values corresponds (as previously mentioned) to pixel aggregation. Thus, a high accuracy for calculated imperviousness degree values can be expected.
The EEA soil sealing data used in this article consist of 905 tiles, each of spatial extent 100 km × 100 km. The naming of the tiles conforms with the INSPIRE Data Specification on Geographical Grid Systems (INSPIRE D2.8.I.2), i.e., descriptors are placed on the upper left tile corner (e.g., 100KME09N27). The pixel values (or grid codes) of the EEA dataset represent three different information types: The vast majority of pixels are accorded a value from 0–100 representing the degree of imperviousness (expressed as a percentage of the pixel area) ranging from unsealed (= 0) to completely impervious (= 100). The values 254 and 255 are used to indicate pixels that represent unclassifiable areas (e.g., due to cloud coverage or shadow) or which are outside the study area (e.g., sea areas or EEA non-member states), respectively. In order to analyze soil sealing for the whole of Germany, the first step was to select all tiles lying within the country’s national borders (see Figure 1). This was accomplished using an authoritative border dataset for Germany called Verwaltungsgebiete 1:250,000 (VG250), provided by the Federal Agency for Cartography and Geodesy [50]. The selected 57 tiles were then formed into a raster mosaic. In those cases where tiles extended beyond the national borders, the external areas were simply cut off to match the borderline. The degree of soil sealing was calculated as the mean value of the EEA soil sealing raster for various administrative units from the national state to the federal states, spatial planning regions, districts and municipalities and for geographical grid cells with cell sizes ranging from 100 m to 10 km using zonal statistical procedures. No-data values were assigned to administrative units and grids cells for which implausible soil sealing values were expected due to heavy cloud coverage in the input data. The applied threshold for discriminating these indeterminate spatial units was a maximum permissible cloud coverage of 10% R 2 of the urbanized area.

4.2. Statistical Data on Influential Factors
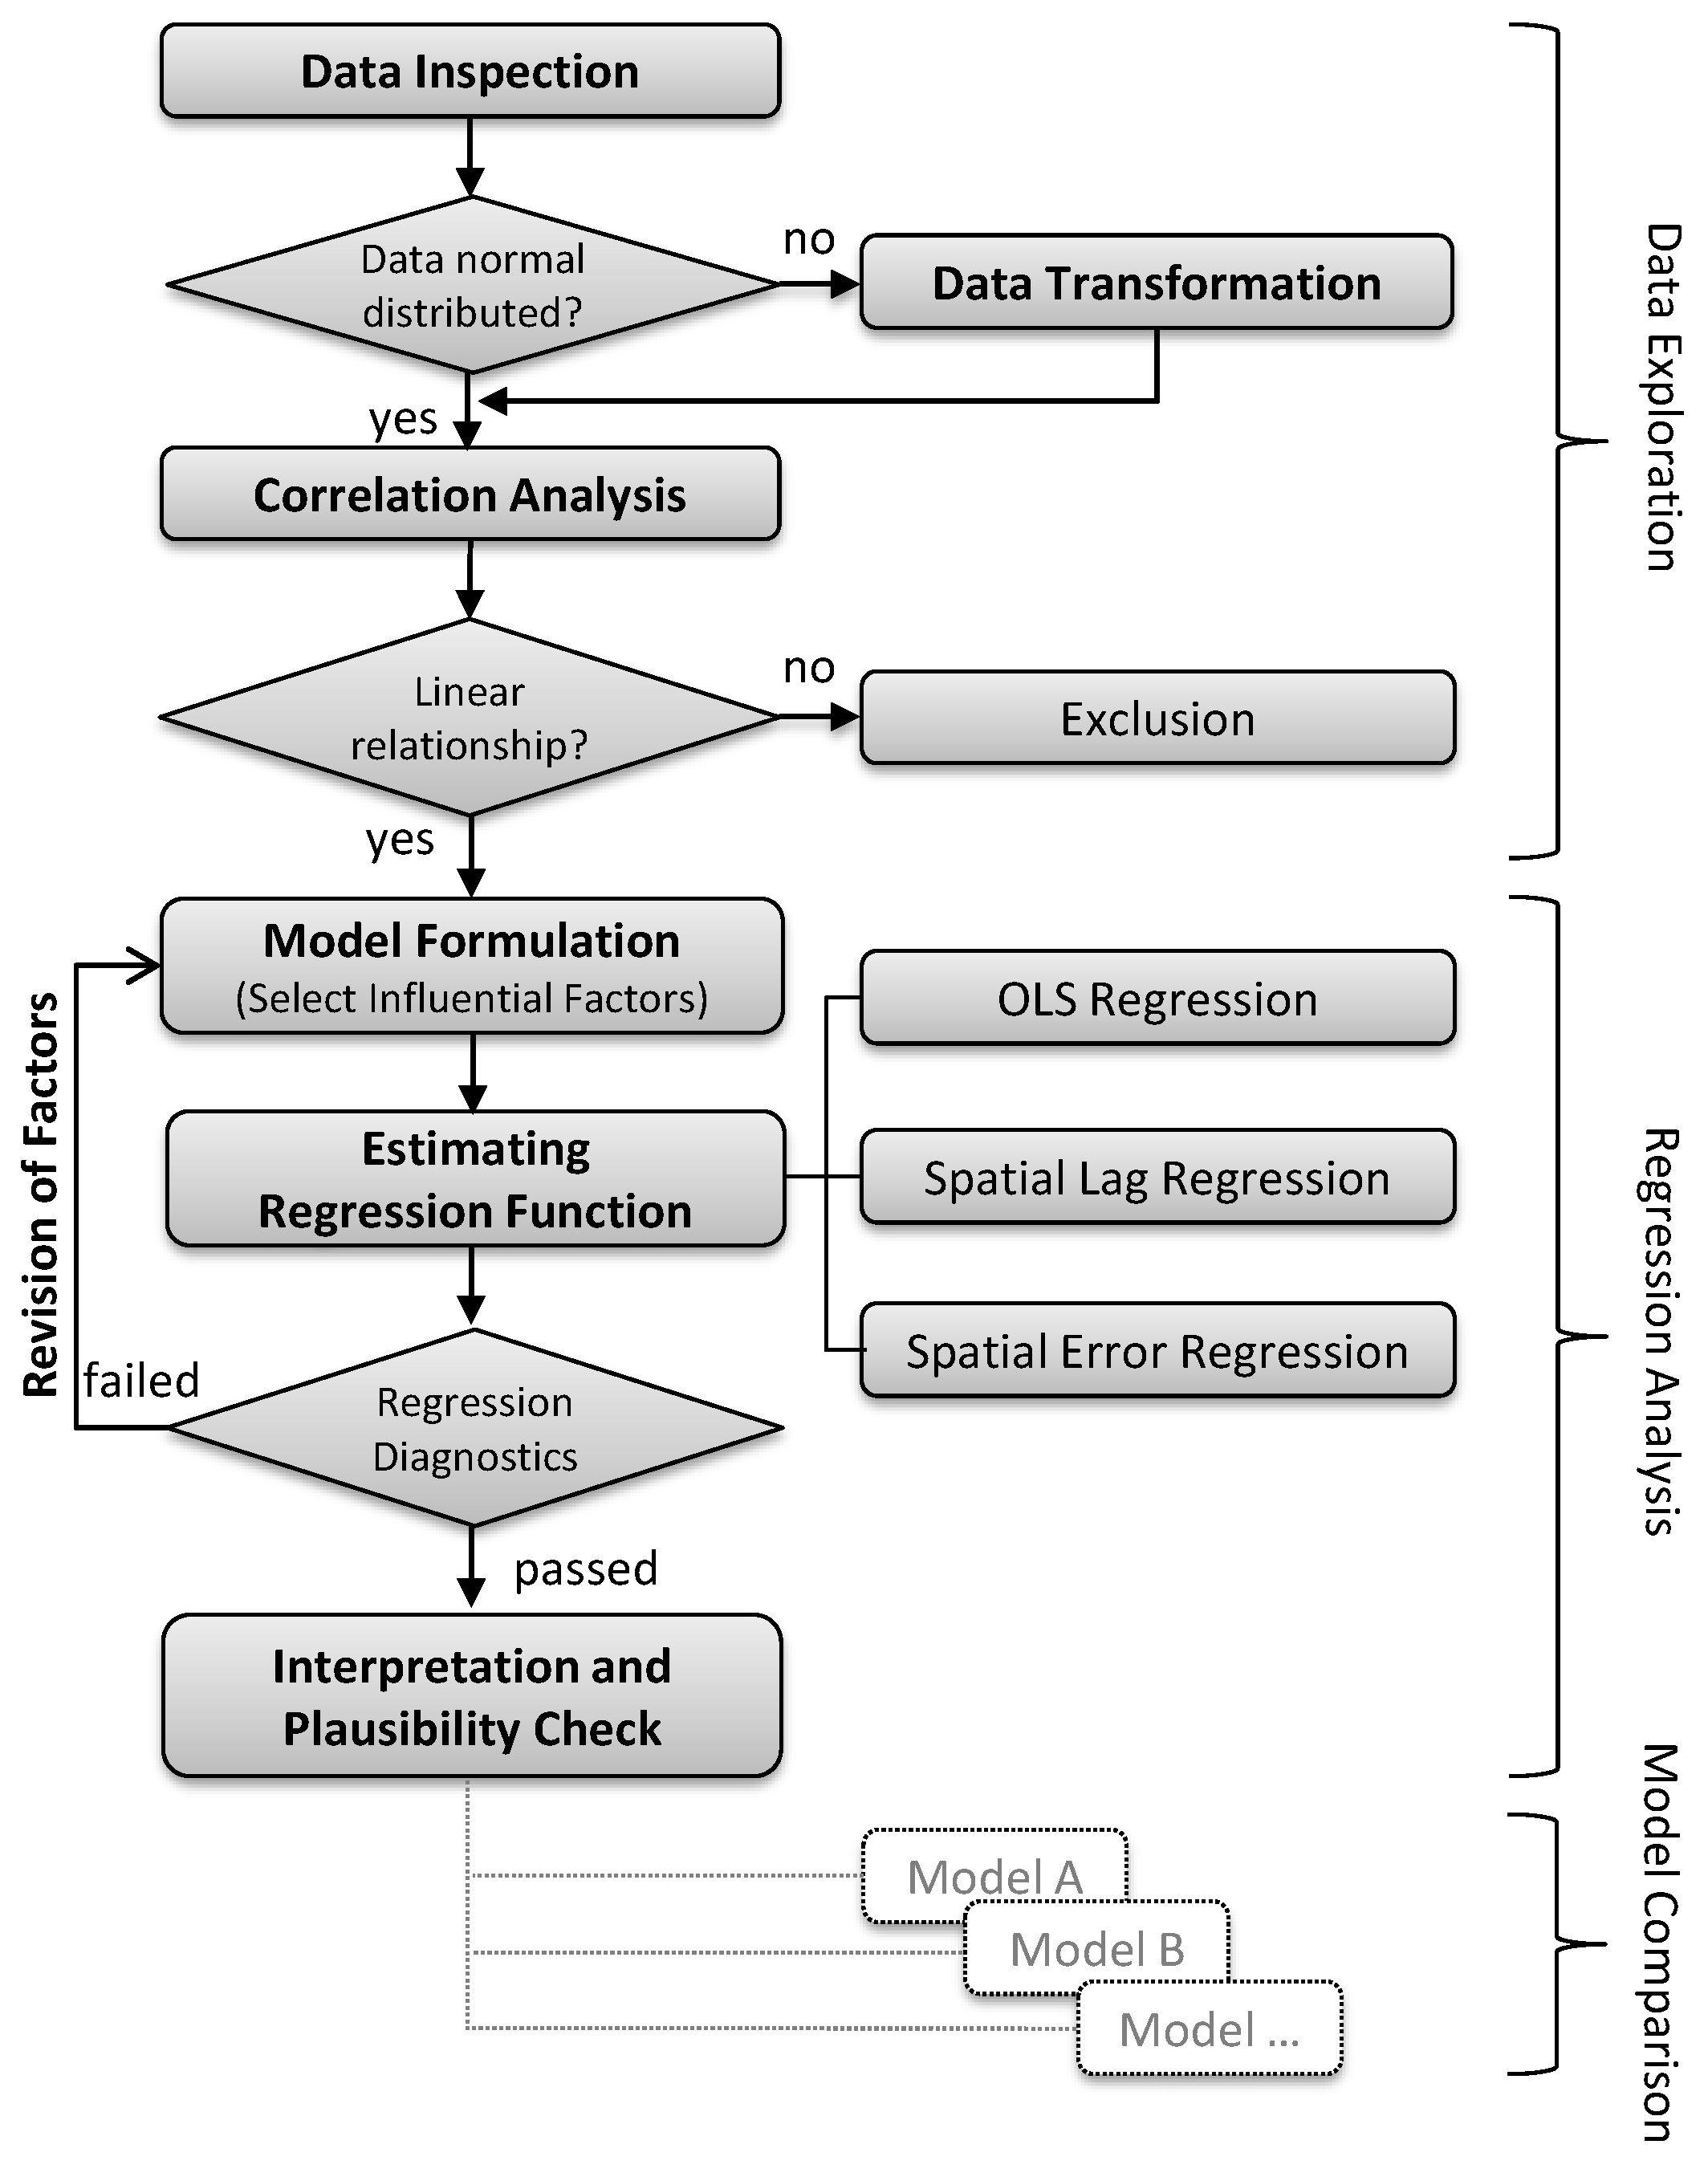
In 2010, there were n = 11 , 669 municipalities and n = 16 states. In order to uncover interdependencies in regard to soil sealing, statistical data were captured for 11,441 municipalities in Germany and around 220 variables calculated (see Table 2). In compiling this database, attention was paid to producing a set of results that would encompass the widest range of factors, such as demographic and social issues, mobility, the spatial context, the land and real estate market, as well as the economy and public policy. Table 2 shows these various dimensions, as well as the total number of derived variables and the primary data sources. Each dimension is illustrated by means of some thematic examples.
Complete datasets could not be obtained for n = 120 municipalities in the year 2010 due to restrictions of data protection and problems of data availability. In addition, there were n = 228 so-called “unincorporated areas”, which are generally forested areas, lakes and larger rivers.

5. Methods

In this paper we undertake a comprehensive data inspection and apply several regression techniques in order to investigate the interdependency between a dependent variable (e.g., degree of soil sealing) and one or more independent variables (e.g., influential factors). Relevant procedural steps are described in Figure 2.
Data exploration consists of data inspection, data transformation and correlation analysis. The aim here is to understand the distribution of each variable and to discover dependencies between several variables. Data are inspected and distributions analyzed by means of statistical methods and visualization techniques (histograms, density plots, quantile-quantile plots) [51,52,53,54]. Transformation processes and the so-called “ladder of power” can be applied to the data in order to ensure the required linear correlations between the dependent and independent variables within the regression analysis, as well as to reveal skewed distributions [52]. In this way, it is possible to describe nonlinear correlations, to make distribution patterns more symmetrical and to reduce the spread of data points [52]. The objective of the correlation analysis is to identify the strength and direction of the relationship between two variables. If the relationship is approximately linear, the Pearson product-moment correlation coefficient can be used [52,53]. Furthermore, scatter plots are a useful visual tool to analyze the relationship between two variables.
In this study, three different models of regression analysis (ordinary least squares regression, spatial lag regression and spatial error regression) are applied in order to determine which model is best suited to describing the correlations within the data. Ordinary least squares regression (OLS) is a linear regression model using the least-squares estimation to fit the model. It assumes an approximately linear dependence between the dependent and independent variables. This method applies an approach of minimizing the sum of the squared residuals [52].
The regression equation is created by an iterative process and has to be checked for validity and consistency after every model fit. The F-test is used to examine the overall validity and significance. The significance of the F-test indicates that the null-hypothesis can be rejected (i.e., that all slope coefficients of a model are 0), and thus, the model possesses some explanatory value. The significance of the regression coefficients is determined by the t-test, which is calculated by dividing the regression coefficients by the standard deviation. The null-hypothesis also indicates that the independent variables do not significantly influence the dependent variable. In the case at hand, the null-hypothesis is rejected for all independent variables, which therefore are seen to significantly influence the dependent variable. Such regression diagnostics is necessary to ensure that the required model assumptions are met. Multicollinearity in regression equations increases the standard deviation and hence can have the effect that independent variables are declared to be statistically non-significant. The severity of multicollinearity can be tested by the variance inflation factor (VIF). If the value for a variable is larger than 10, then this can potentially be a source of multicollinearity. A further criterion for the detection of multicollinearity is the so-called condition number. If the condition number is higher than 30, then the regression model can be affected by multicollinearity between the independent variables.
In statistical approaches, data should be statistically independent. However, data subject to spatial analysis are often found to be spatially autocorrelated, which means that a variable is found to cluster in space [55]. This reflects Waldo Tobler’s first law of geography: “Everything is related to everything else, but near things are more related than distant things.” [56]. To test data for spatial dependence, we can apply Moran’s I to calculate global autocorrelation and the local indicator of spatial association (LISA) for local autocorrelation [57]. On this basis, spatial patterns in variables and their conduct (e.g., values that are spatially near are more similar) can be detected and visualized. Moran’s I can measure the global spatial autocorrelation, which is the correlation of a variable with itself, by applying a matrix of weights [58]. Anselin [59] defined LISA as an indicator of the extent of significant spatial clustering of similar values around an observation, determining that the mean of LISA is proportional to the global indicator of spatial association. LISA can identify local hotspots and can be used to detect clustering. The local Moran’s I can be visualized in a choropleth map showing potential spatial clustering and its significance. In a multiple regression with several independent variables, the primary focus is to determine which of these most strongly influences the dependent variable. Standardization of the regression coefficients allows the strength of their influence on the independent variables to be compared by removing the various units of measurement.
Spatial regression deals with spatial effects such as spatial dependence and spatial heterogeneity [57,60]. The spatial lag and the spatial error model consider the fact of autocorrelation in linear models. Thus autocorrelation can compromise the statistical explanatory power. Spatial lag models are basically the OLS model with an additional term of a weights matrix and an autoregressive factor ρ, which determines the strength of the spatial autoregressive relation between y i and j W i j y j [61]. This model assumes autocorrelation in the dependent variable and includes an autoregressive term for the spatial autocorrelation [62]. The spatial error model assumes autocorrelation in the error term [61]. The Lagrange multiplier tests [63] provide information about whether spatial dependence exists and, if so, whether a lag or error model are more appropriate. Based on the OLS residuals, the Lagrange multipliers tests examine for a missing lag variable (LM (lag)) and for dependencies in the error term (LM (error)). In the case of significant results for both tests, the robust lag model determines which regression model is best suited.
A regression model’s goodness-of-fit is determined by the coefficient of determination R 2 with the value range [0, 1], where 1 is a perfect fit. A few model assumptions must be verified in a linear regression, mostly through examination of the residuals. First, the residuals should be normally distributed, otherwise the statistical F-test and t-test are invalid. Second, the residuals should be independent, i.e., they should not show autocorrelation, which otherwise causes inefficiency in the least square estimation and incorrect calculation of the standard deviation, also leading to a false determination of significance. Third, the independent variables should not be correlated (a phenomenon called multicollinearity), as this reduces the precision of the estimators. If residuals do not have the same constant variance, then heteroscedasticity occurs, producing the same inefficiency as with autocorrelation [52]. An often used criterion to determine the model fit is the Akaike information criterion (AIC). AIC tries to minimize the trade-off between goodness-of-fit and degrees of freedom [64]. It can be used for model selection and comparison, where the model with the lowest AIC performs best.

6. Results

The aim in this section is to extend our understanding of how influential factors can impact the degree of soil sealing by examining the results of an investigation at the level of Germany’s municipalities in which classical linear regression, as well as spatial regression methods are applied.

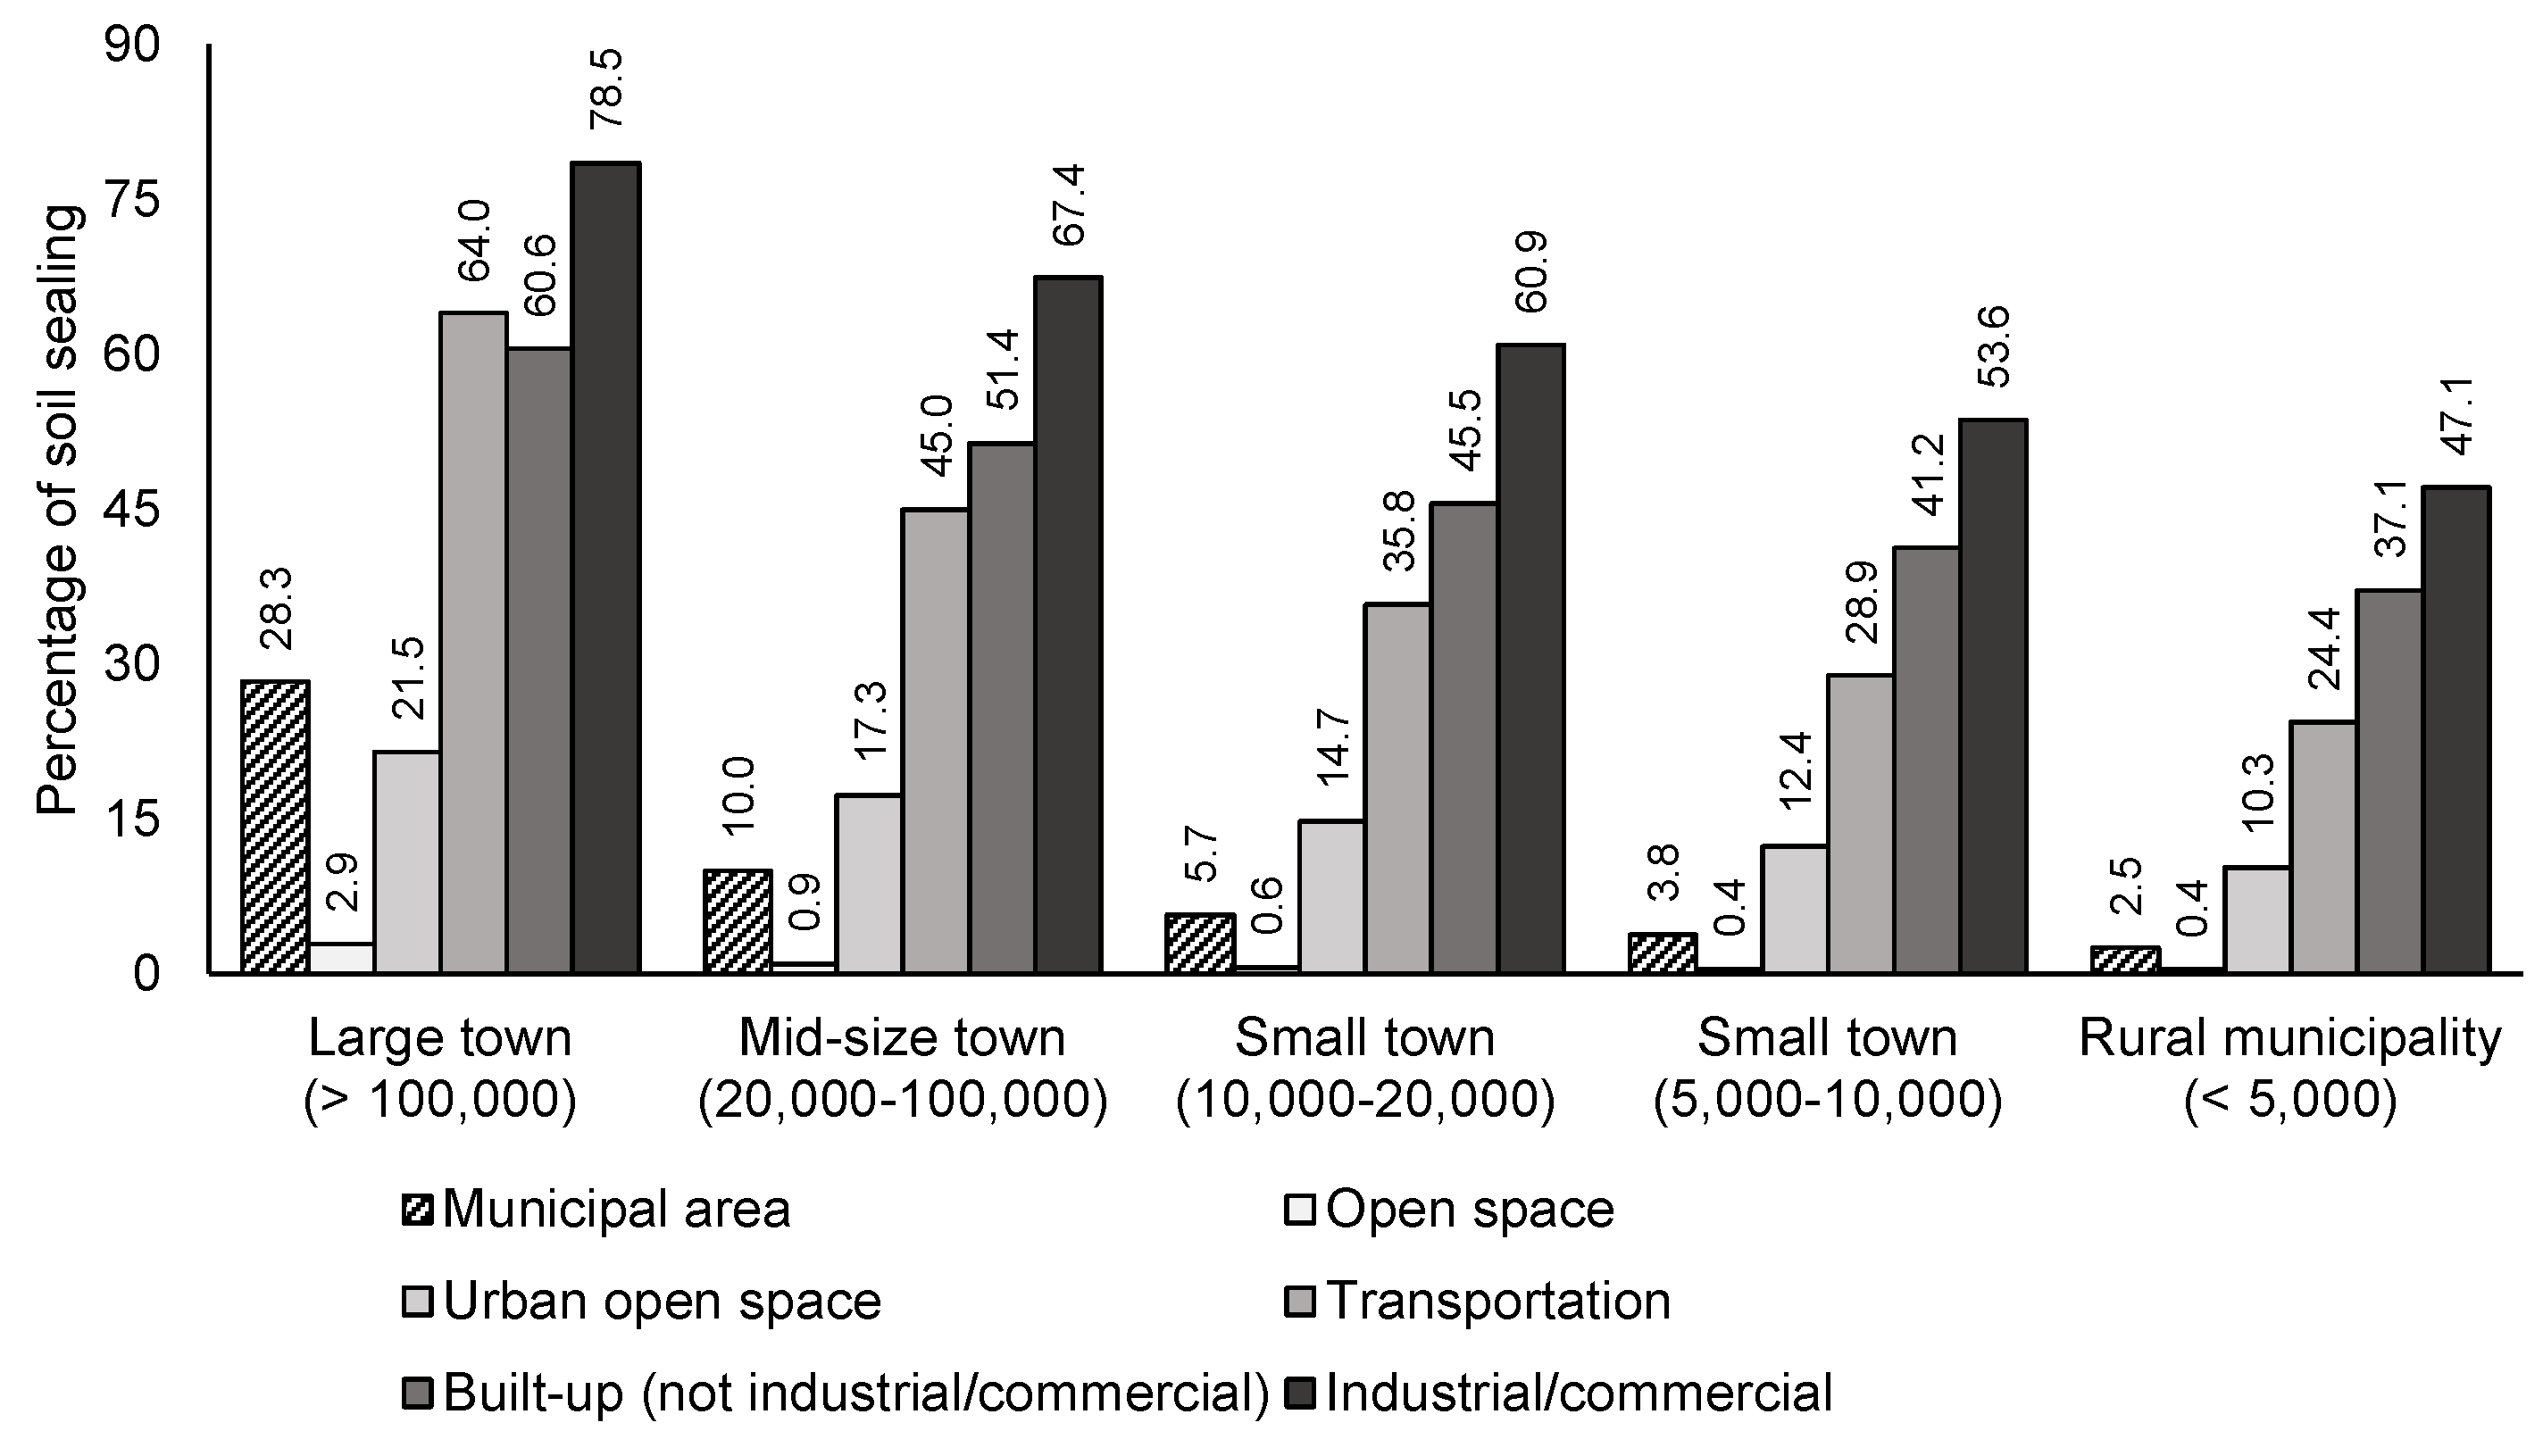
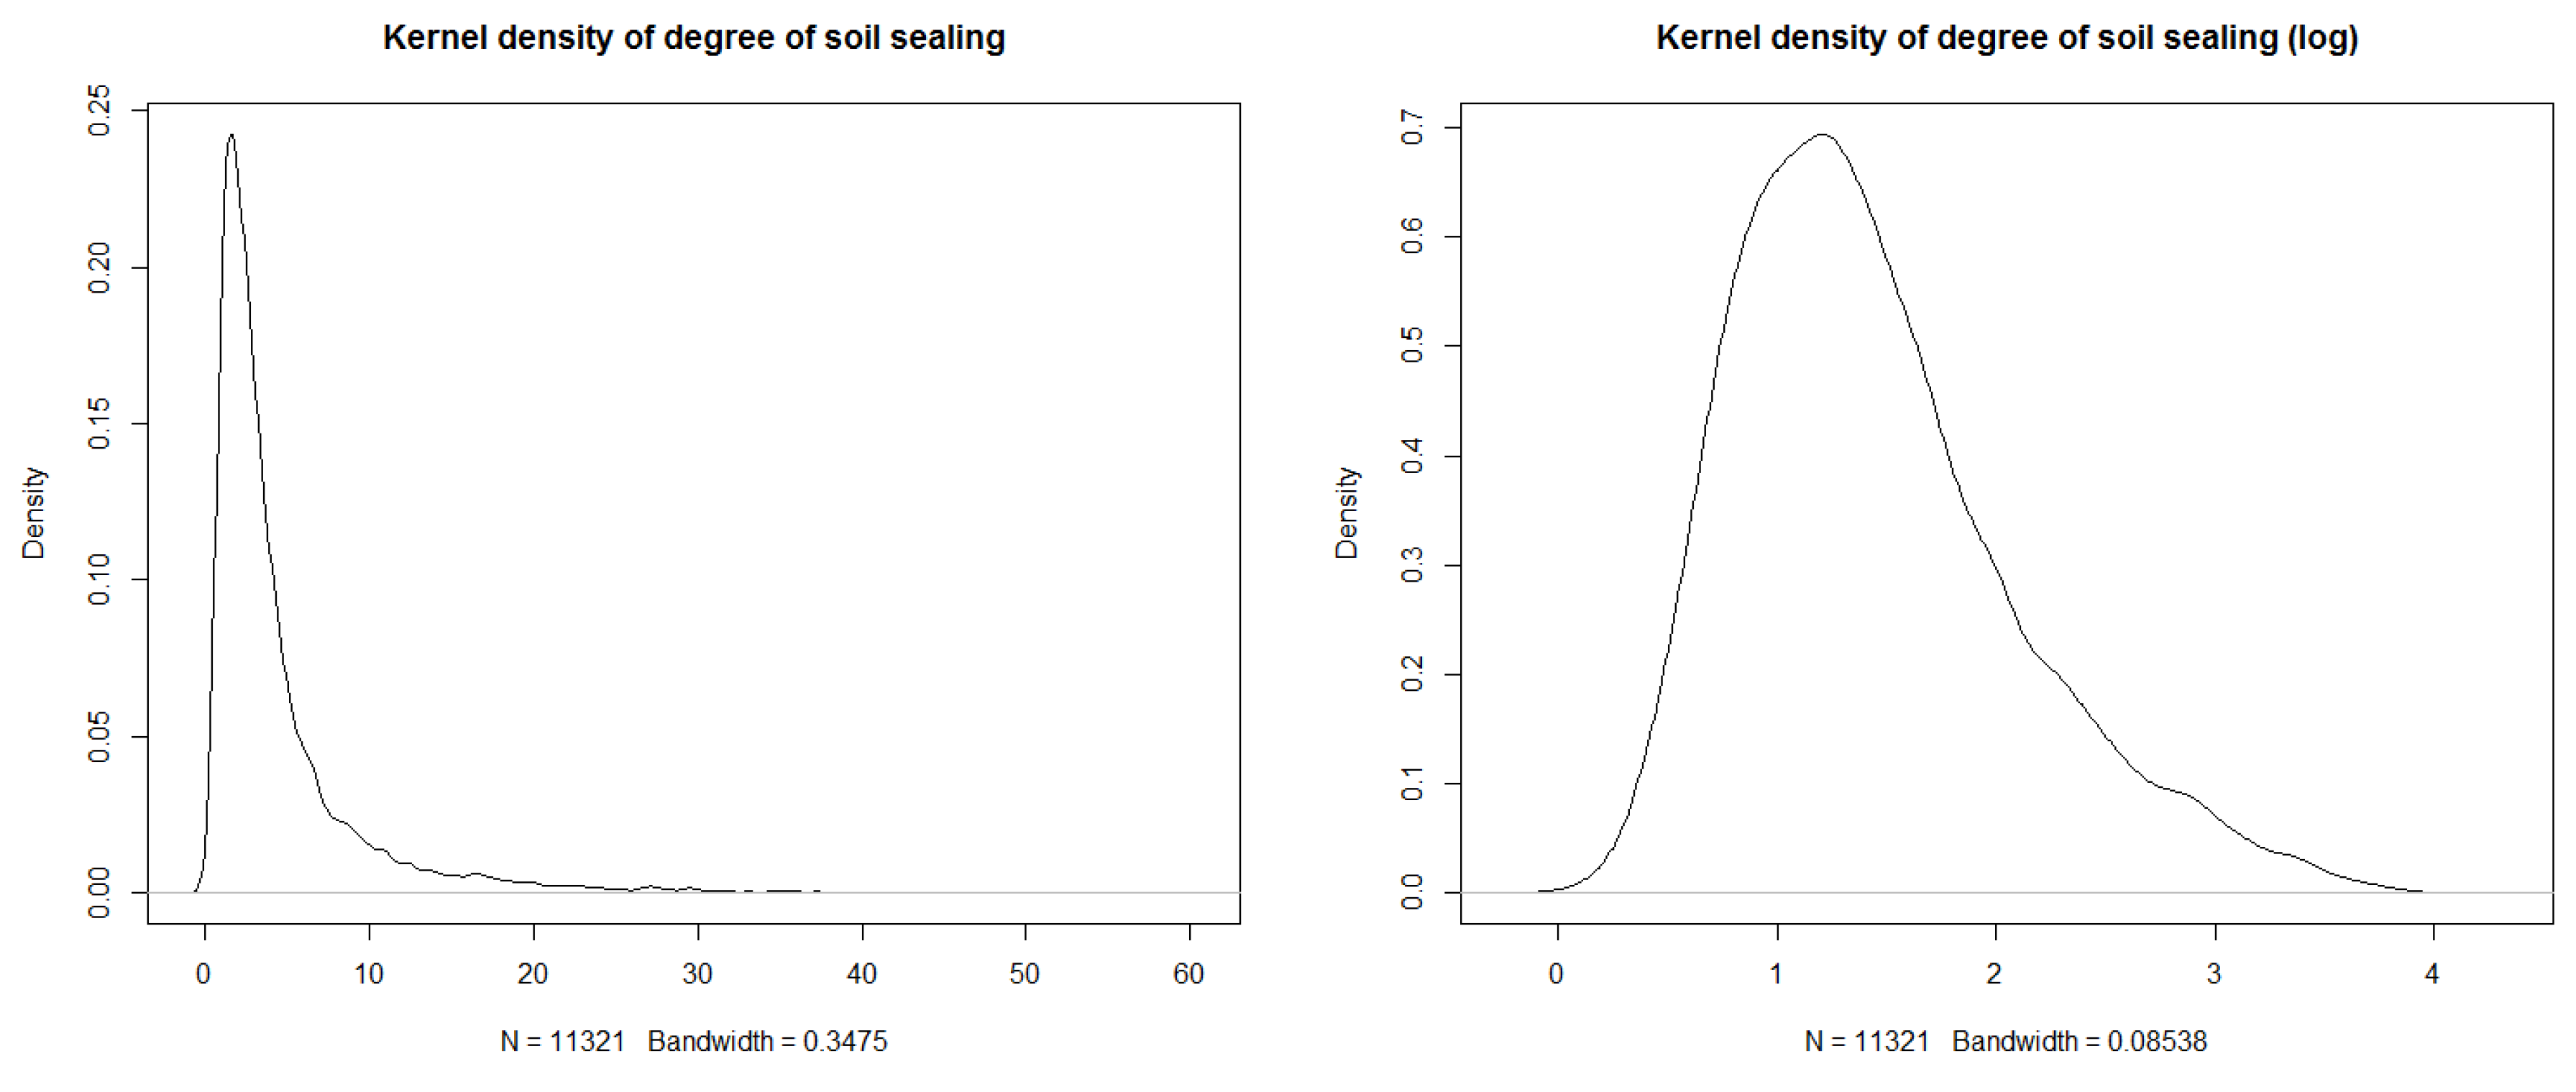
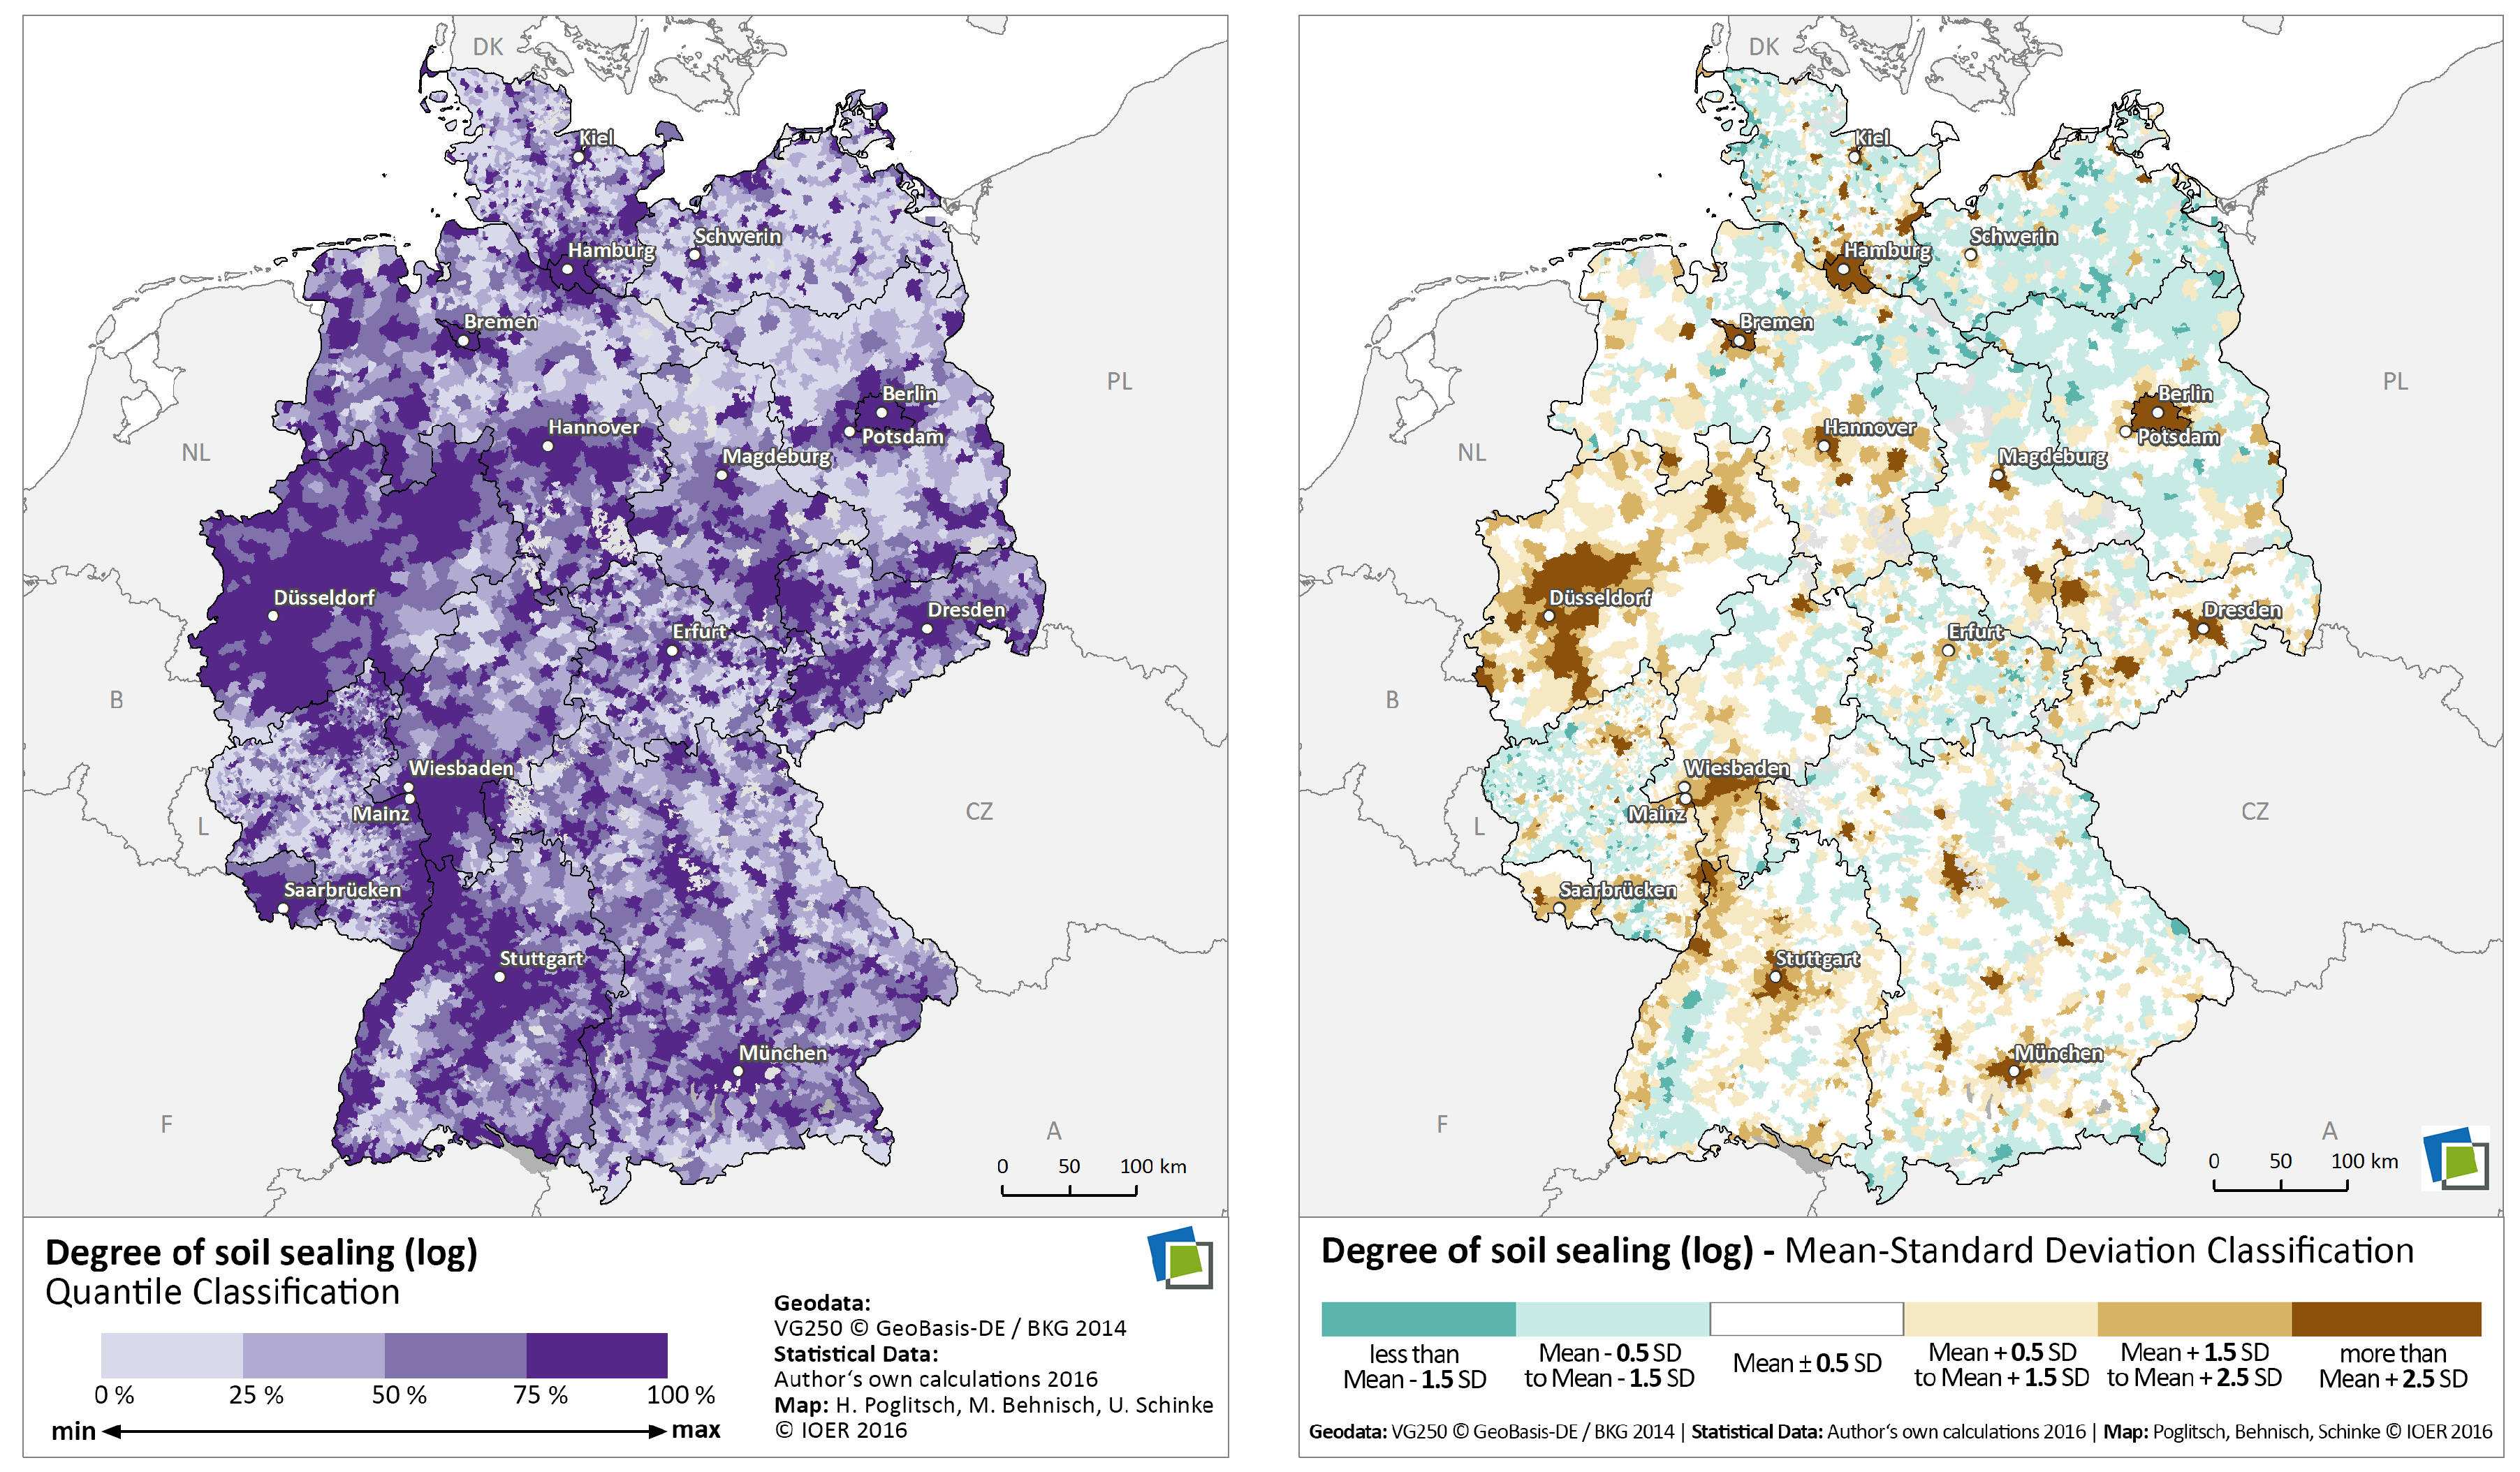
6.1. Data Inspection

Data exploration will be illustrated using the example of the dependent variable degree of soil sealing at the level of Germany’s municipalities. Initially, a hypothesis was formulated on the expected distribution, which could then be either verified or rejected. The distribution of the proportion of soil sealing was assumed to be right-skewed, i.e., only a few municipalities have a high degree of soil sealing, and in contrast, a high number display a lower degree of soil sealing. Table 3 shows the distribution measures for the analysis. By considering the median and mean, we can verify the positive skew.
The normal QQ-plot (cf. Figure 3, left) plots the theoretical distribution against the data. This shows that the data do not follow a straight line and therefore are not normally distributed.
The empirical cumulative distribution function (ECDF) provides a good statistical inference. Here, we clearly see an uneven distribution, with just a small group of German municipalities having a degree of soil sealing above 20% R 2 (cf. Figure 3, right).

6.2. Data Transformation

Statistical models such as correlation and linear regression analysis make a number of key assumptions. Often, the variables do not sufficiently meet these assumptions. Therefore, in some cases, data must be transformed to ensure more symmetric distributions and to ensure linear correlation between two variables ([52]). The family of powers and that of roots (−1/X, log(X), X, X2, X3) are two useful techniques to transform data. A positive skew can be transformed by descending the ladder of power, and a negative skew can be smoothed out by ascending the ladder of power. Transformation measurements will also be illustrated using the example of the variable degree of soil sealing. Figure 4 shows the kernel density of soil sealing. It is a smooth reproduction of the data. The distribution attributes of the logarithmized data are more regular in form.
The two maps in Figure 5 illustrate the degree of soil sealing for all municipalities in Germany. On the left, we see a quantile map of soil sealing. The interquartile range covers 50% R 2 of the data, i.e., the range between Q1 and Q3 (raw data: 1.614%–4.959%) (see Table 2). The highest values for soil sealing (upper quartile: 4.959% R 2 < soil sealing < 59.560% R 2 ) are observed in densely-populated cities (e.g., Berlin, Dresden, Stuttgart) and urban agglomerations (e.g., Rhine-Main area, North Rhine-Westphalia). The map on the right illustrates the deviation from mean of the degree of soil sealing. Here, the data should be near-normally distributed. A contrasting picture emerges of central municipalities (e.g., Germany’s urban regions) and peripheral regions (sparsely built-up regions, e.g., Black Forest, Alpine foothills, Palatinate Forest, Eifel, Uckermark, Mecklenburg-Western Pomerania).
Figure 6 illustrates average values of soil sealing differentiated according to the size of municipalities and specific land-use classes. Differences between major cities and rural municipalities are obvious. The highest values are found in industrial/commercial areas followed by other built-up and transportation areas.

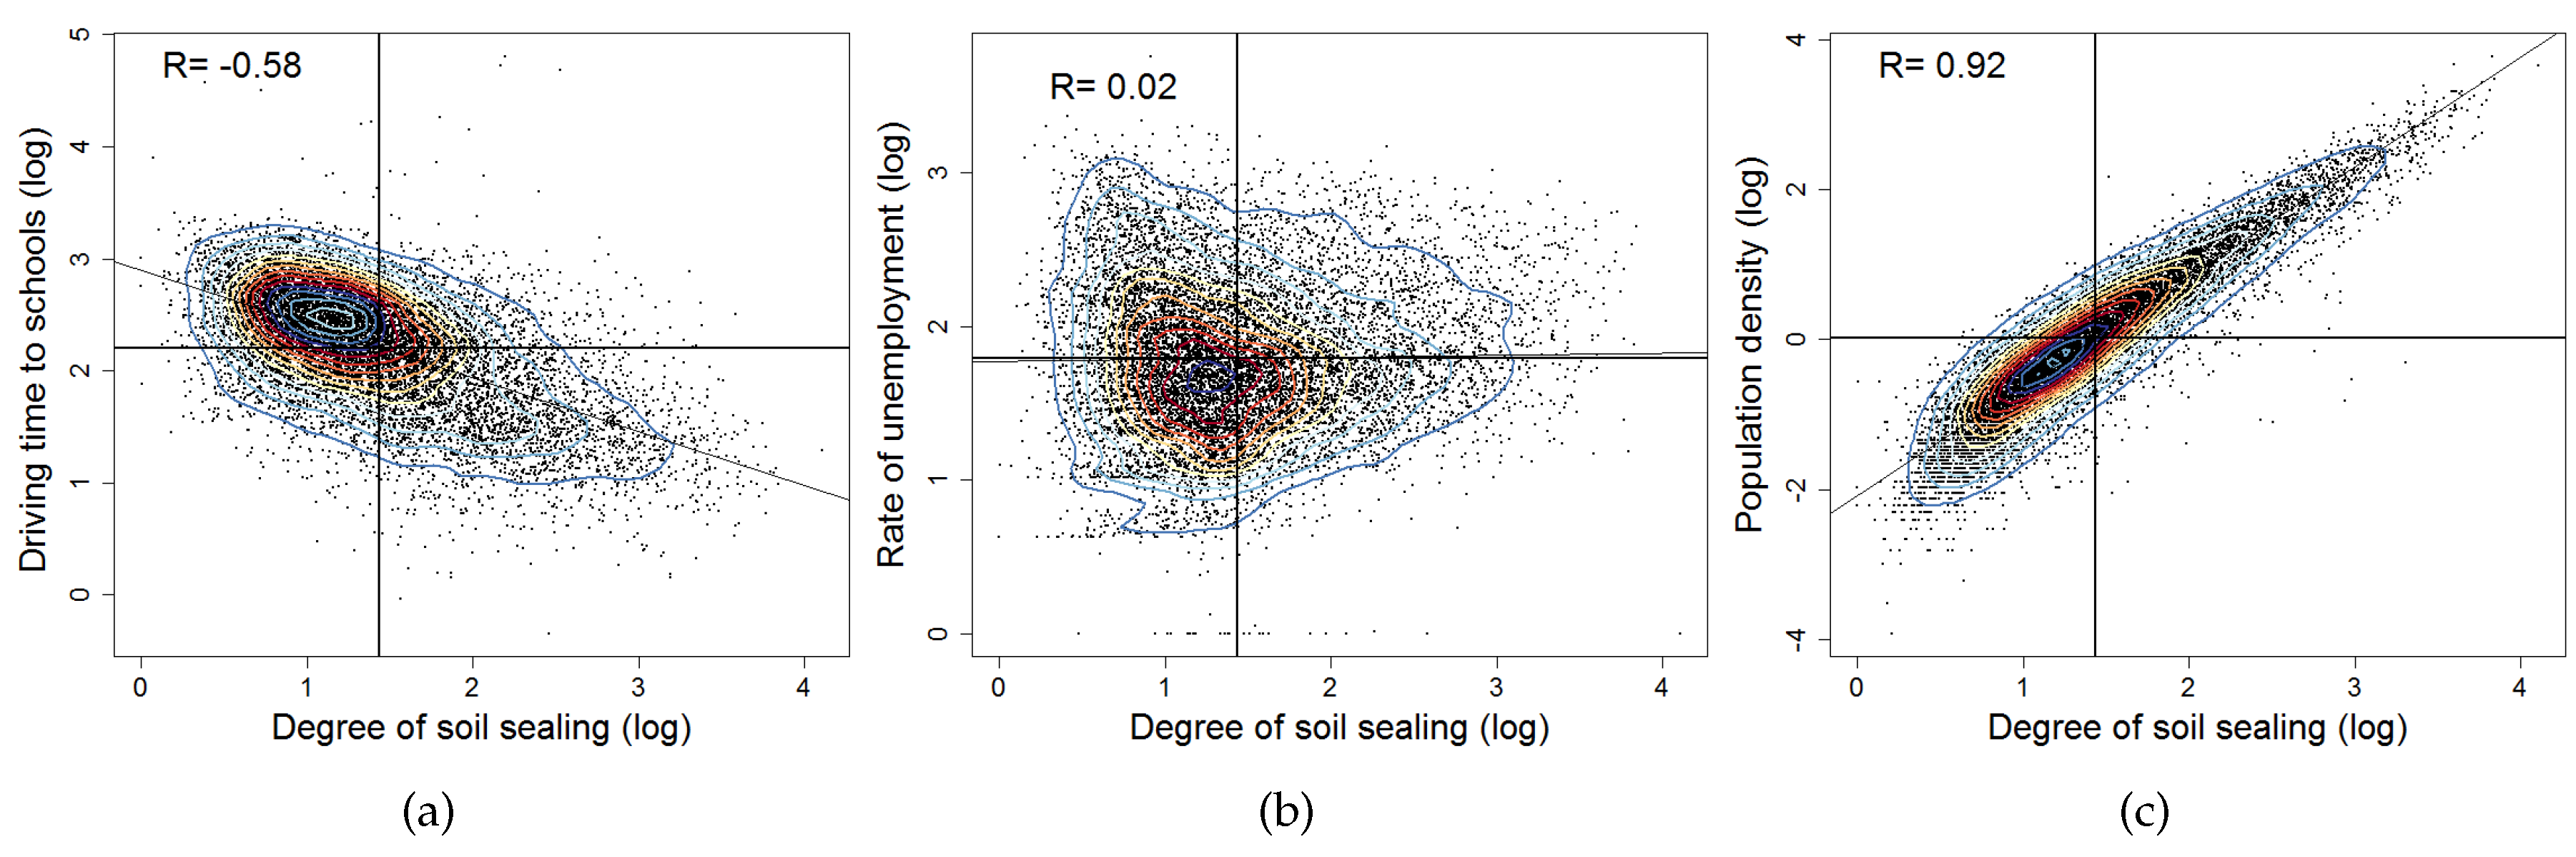
6.2.1. Correlation Analysis

As a result of the previous data inspection, 138 variables were classified as non-normally distributed ( n = 48 ) or those with unusual observations/missing data ( n = 90 , e.g., hospital beds per 1000 inhabitants or percentage of military areas). On the basis of Pearson product-moment correlation, it was possible to select those variables from Table 2 that were strongly correlated with the dependent variable degree of soil sealing. Pearson product-moment correlation can be applied because the data of n = 83 variables was near-normally distributed. Examples of negative, no and positive correlation are illustrated in Figure 7. Here, we see that as the degree of soil sealing increases, the driving time to schools has a tendency to decrease (negative correlation), the rate of unemployment is unaffected (no correlation), while the population density also increases (positive correlation).
Several other variables show an approximately linear bivariate relationship with soil sealing. Regarding the total number of normally distributed variables ( n = 83 ), Table 4 lists a total of 25 influential factors with an absolute correlation value above 0.5. The table indicates the labels, as well as the units and the transformation used to make distribution patterns more symmetrical and to reduce the spread of data points. Alongside moderate or strongly-correlated influential factors, some additional factors are presented in Table 4: the typical commuting distance ( r = 0 . 43 ), the driving time to regional centers ( r = 0 . 41 ), the driving time to motorways ( r = 0 . 4 ), the driving time by truck to cargo centers ( r = 0 . 4 ) and the percentage of vacation homes ( r = 0 . 29 ). The selection of additional factors follows further content-related considerations (cf. Hypotheses 2 and 3 in Table 1).

6.2.2. Regression Analysis

In order to investigate the complex bundle of influential factors on the degree of soil sealing, several regression models are devised to reflect diverse thematic backgrounds. The aim is to explain the spatial distribution of the dependent variable as influenced by the various independent variables. Data inspection and transformation, as well as content-related considerations led to the pinpointing of 30 variables (cf. Table 4) suitable for regression analysis. The presented Models A–D meet the following conditions: high model precision realized by the coefficient of determination R 2 along with low complexity, i.e., the explanation for the proportion of sealed soil to municipal area (log) should be described using as few variables as possible (see Section 5, e.g., [52]).

6.2.3. Ordinary Least Squares Model

Initially, relatively simply models were established (see Table 5) in order to inspect the various density values (Model A, cf. Hypothesis 1 in Table 1) and to consider the transport connections (accessibility) of municipalities (Model B, cf. Hypothesis 3 in Table 1) on an individual basis.
A model of the daytime population density, the density of flats and the road network density was found to be well correlated with the degree of soil sealing (see Table 5, Model A). Only a partial correlation could be determined in the case of the accessibility of municipalities (see Table 5, Model B).
When developing more thematically-complex model equations, it was found that those density values highly correlated with soil sealing (see Figure 7) strongly influence the coefficient of determination in the regression function (see Table 5, Model C). If the population density is included in the estimation of the regression equation, then standardization of the variables shows that additional variables have a comparatively low influence on soil sealing (e.g., schools, trade tax, vacation homes, buildings 3-X). The relative significance of the influential factors is indicated by the standardized variables (cf. Table 5, Model C: Standardized Beta).
A further model was created (cf. Table 5, Model D) to take into account both the road network density and the settlement density, as well as additional frequently-discussed influential factors. As expected, the degree of soil sealing is strongly influenced by the expansion of the transportation network. Furthermore, a complex bundle of diverse factors showing variable influence on the degree of soil sealing is also illustrated: e.g., tax capacity, job centrality, commuting distance, buildings 3-X.

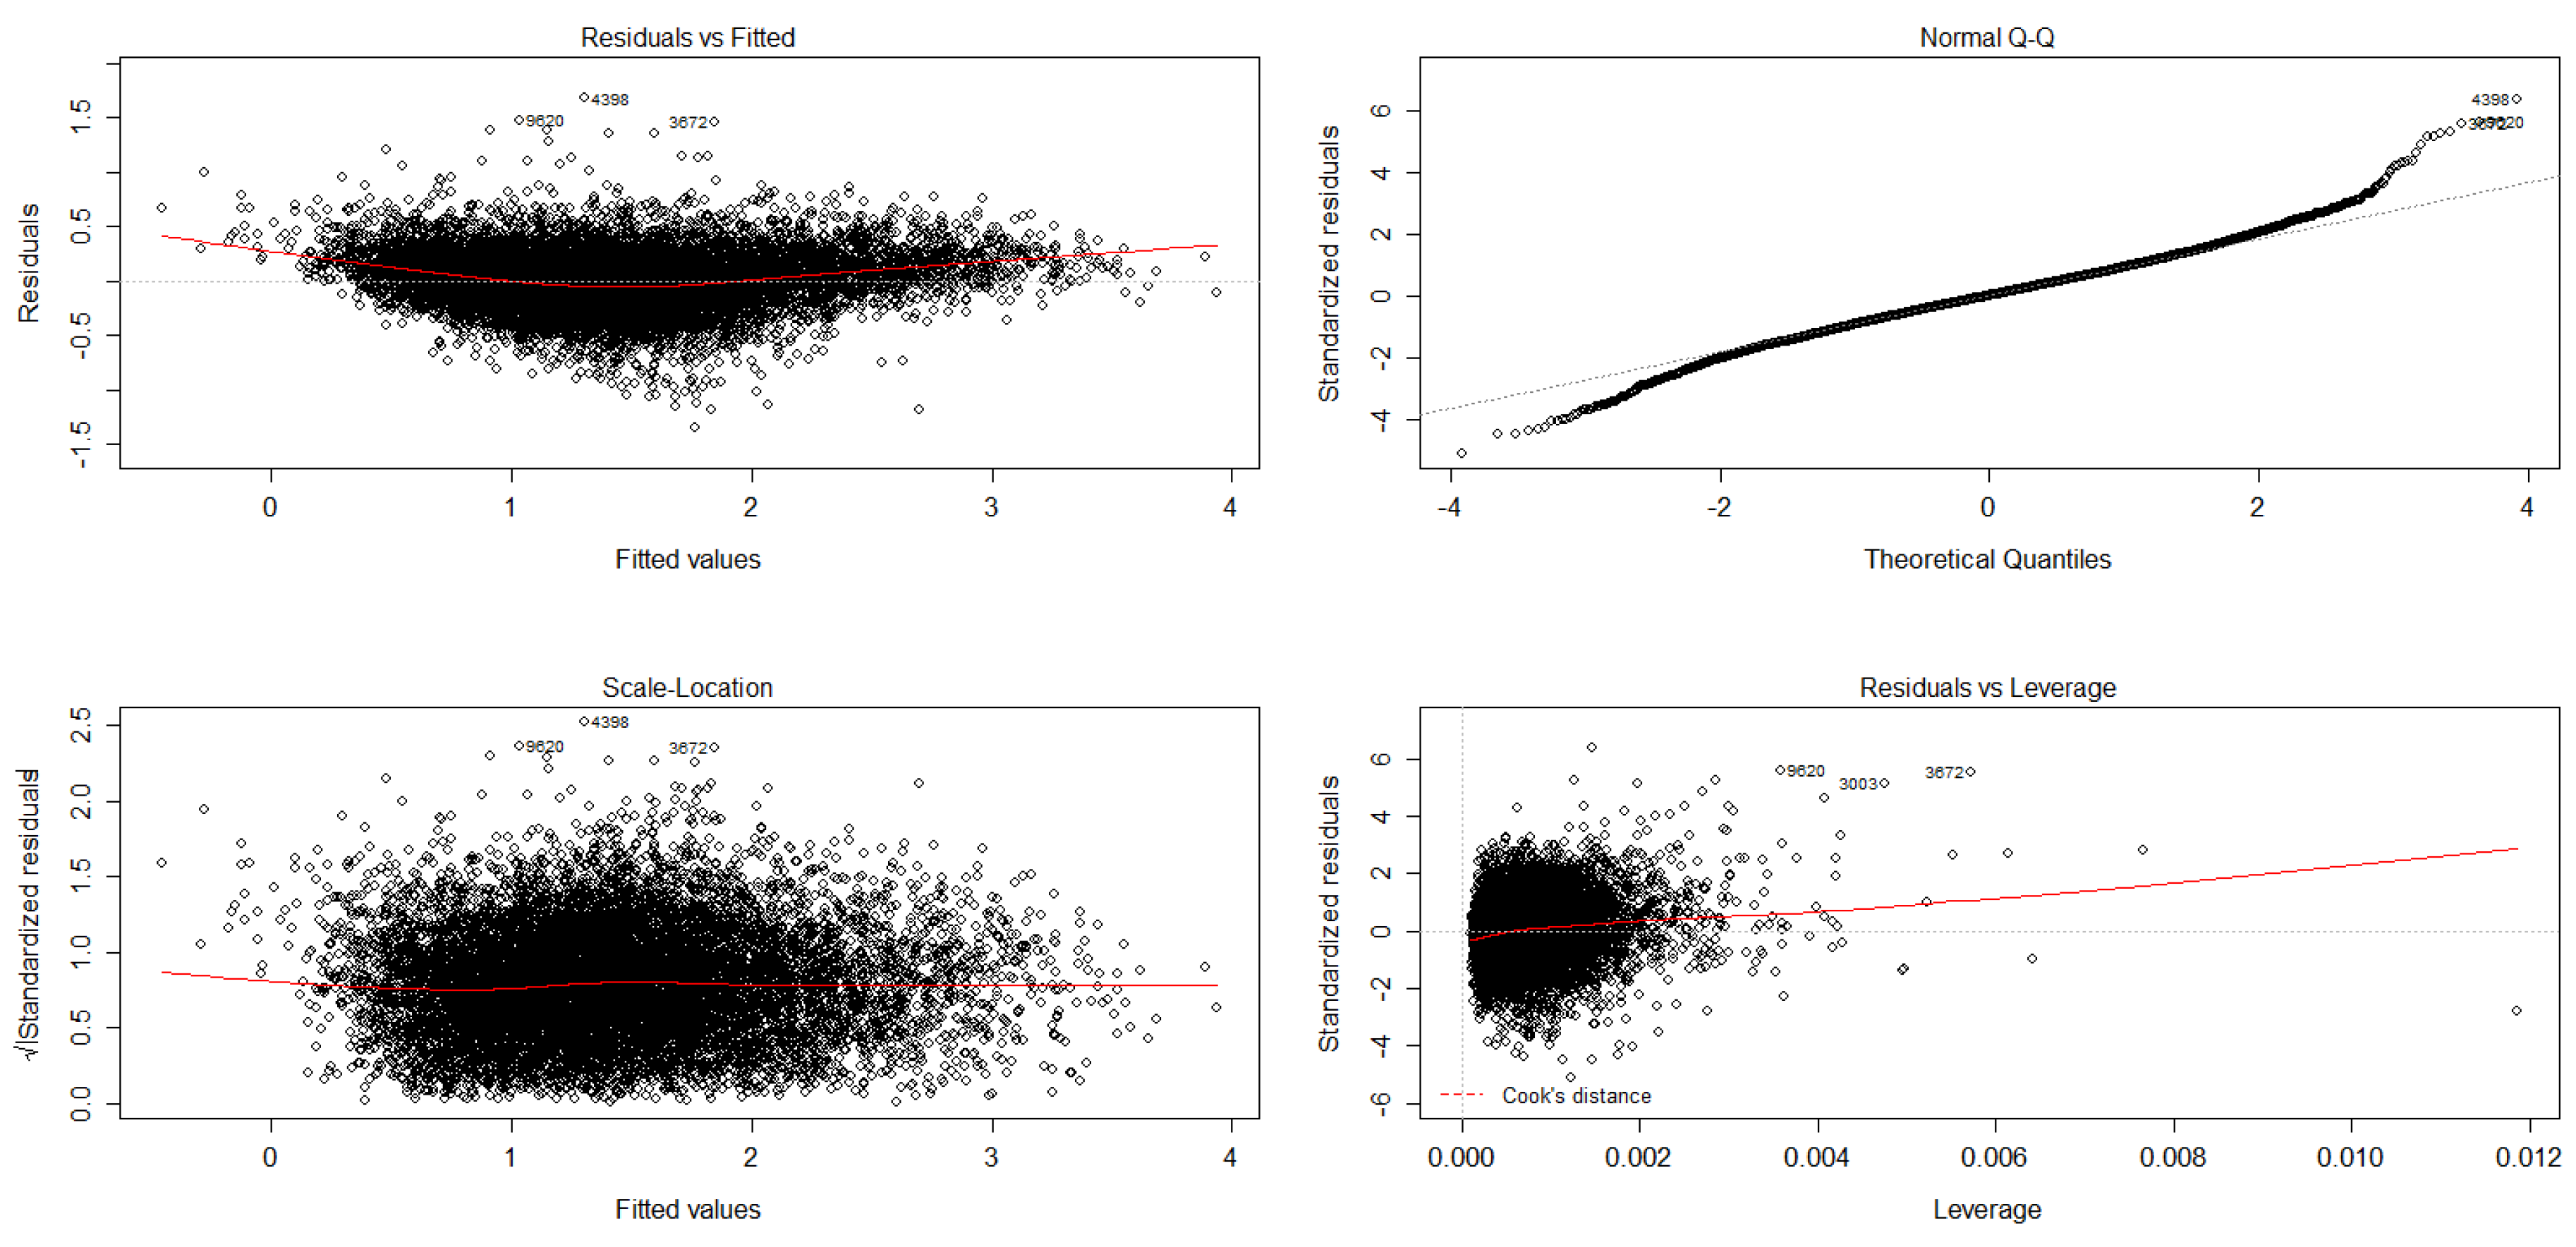
6.2.4. Regression Diagnostics

The process of regression diagnostics will be illustrated using Model D. Figure 8 provides an evaluation of this model, largely by considering residuals. On the top left, we see the residuals plotted against the fitted values. This serves to check the heteroscedasticity. The residuals should be evenly distributed around the zero line with no obvious pattern. According to the model assumptions, residuals should be normally distributed. The QQ-plot on the top right confirms this normal distribution. The scale-location (bottom left) also serves to check the heteroscedasticity by searching for patterns in the residuals, which cannot be detected here. The final illustration (bottom right) serves to check for influential observations (values higher than one), which can have a large impact on the estimations of the regression equation.
Every model was tested for the variance inflation factor (VIF) and the condition number. The VIF for every variable in both models was less than four. The condition number of the models lay under the conservative value of 30 (Model A = 28.6, Model B = 28.5, Model C = 25.2 and Model D = 26.5). In Model D, the variable with the strongest influence on the degree of soil sealing is the road network density, followed by the settlement density and the municipal tax capacity. The un-standardized regression coefficients measure the influence that one independent variable shows with respect to the dependent one while the other independent factors are kept constant [52]. For the presented Model D, this means that an increase in the road network density by one unit with no change in the other independent variables leads to an increase in the degree of soil sealing of 1.104 units ([52], p. 100). In the following section, we present regression models that take explicit account of spatial autocorrelations with the aim of producing more efficient estimates.

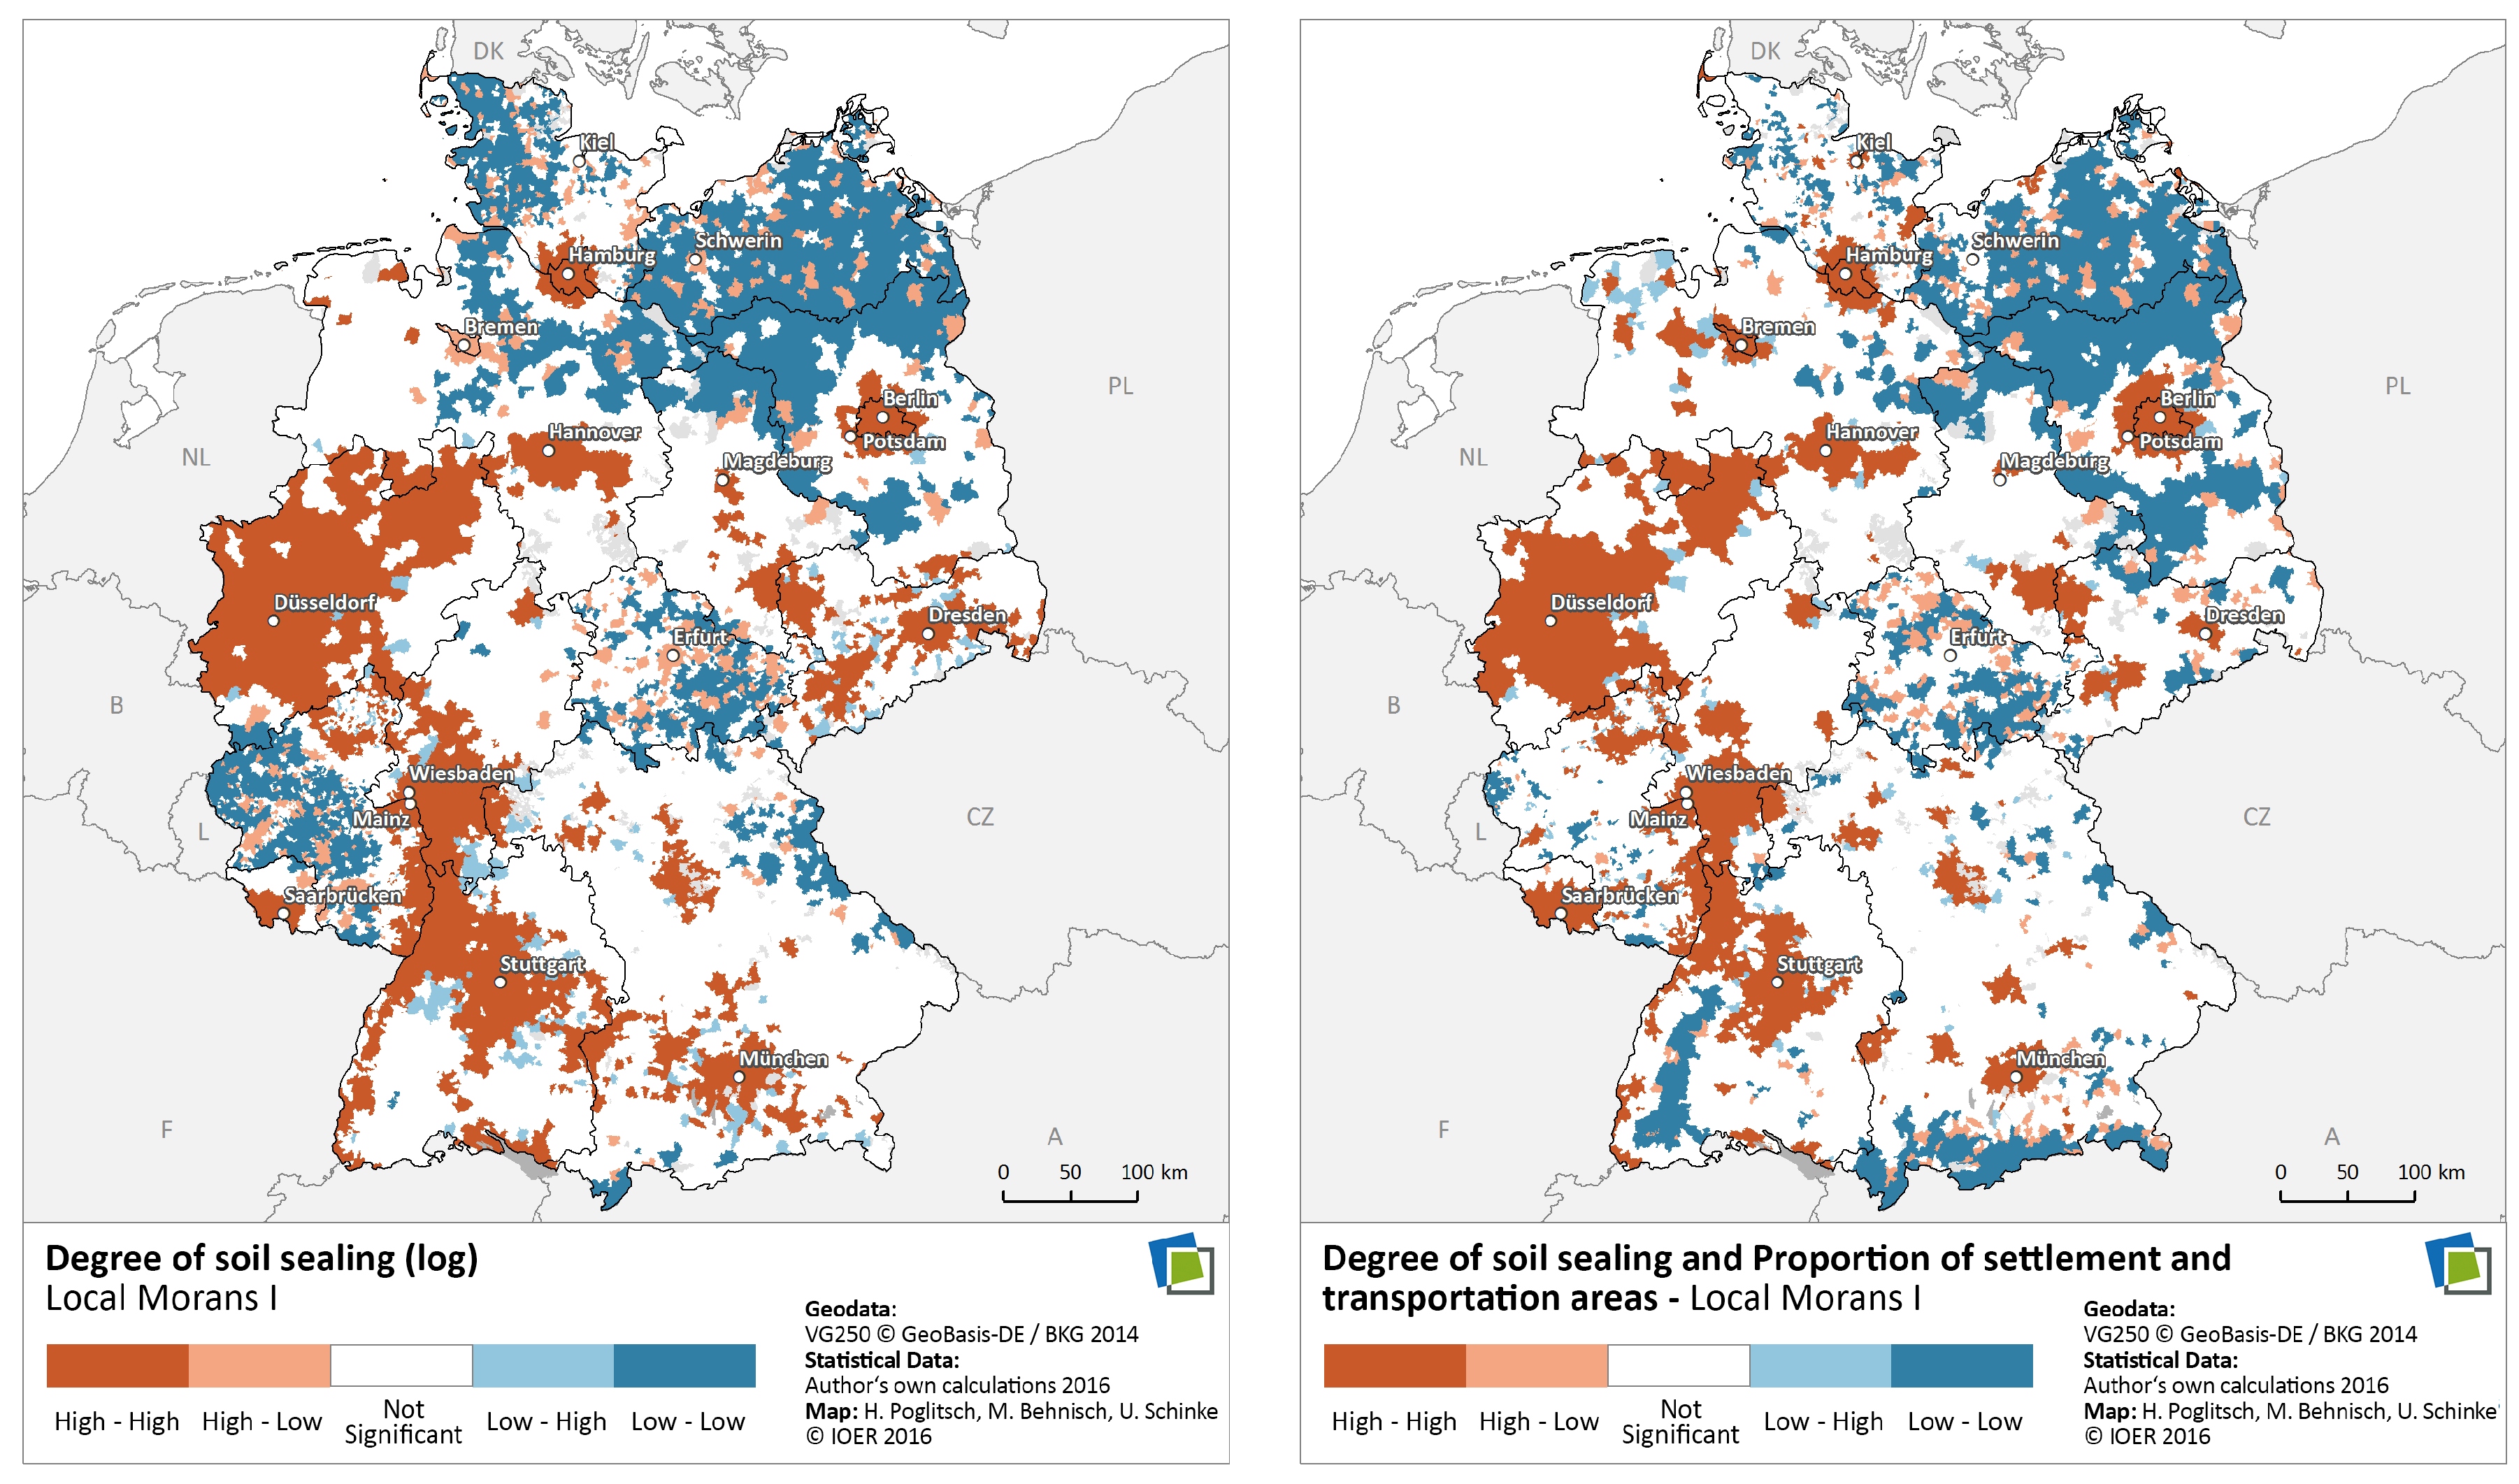
6.2.5. Spatial Regression Analysis

One common assumption in statistical investigations is that spatial data are independent. In the case at hand, this means that the observed municipal units display no neighborhood effects or interdependencies. While spatial autocorrelations may undermine statistical findings in linear regressions, they can also be included in the model calculations as additional information. Spatial simultaneous autoregressive regression takes account of spatial dependences in models (either in the dependent variable or in the residuals) [57]. Spatial regression is applied in order to estimate the influential factors with no distortion. The spatial lag and the spatial error model consider the fact of autocorrelation in linear models (see Section 5 for further details).
The Durbin–Watson test and Moran’s I can be used to investigate whether spatial autocorrelation is given. Global testing shows autocorrelation in the degree of soil sealing with a value 0.54 at significance 0.001. This leads us to conclude that soil sealing is clustered at many locations and that adjacent observations are more greatly affected than distant observations. In order to determine the locations of the autocorrelation, the local Moran’s I can be calculated and the results visualized (see Figure 9).
The calculation is in terms of inverse distance (adjacent municipalities have a greater influence than municipalities that are further apart), as well as Euclidean distance, defined as the straight-line distance between two points. LISA shows the presence of spatial clusters or outliers with a statistically-significant confidence level of 95% R 2 . The clusters high-high and low-low represent positive autocorrelations, whereas low-high and high-low are negative autocorrelations. High-high represents municipalities with a high degree of soil sealing, which are surrounded by municipalities with similarly high levels of soil sealing. Low-low, on the other hand, indicates a low degree of soil sealing with surrounding municipalities also displaying low sealing. High-low indicates a high degree of soil sealing surrounded by low values, and low-high low values surrounded by high values [64]. The presentation of the bivariate local Moran’s I reveals similar clustering of two variables. In Figure 9, we note similar geographical distributions in the case of the degree of soil sealing and the proportion of settlement and transportation area. Clusters of high values in both variables are termed high-high clustering, while clusters of low values are termed low-low clustering.
The results of spatial regression are presented in Table 6. Comparing the spatial lag and spatial error models, it is obvious that both models improve on the original OLS model. The goodness-of-fit of the spatial regression model can be characterized by pseudo- R 2 , determined by the maximum-likelihood estimation of this approach. A direct model comparison is not attempted using the coefficient of determination R 2 , but instead via the AIC. The AIC values show that the spatial error model has the best model fit in every regression model. This leads us to suspect autocorrelations in the residuals.
For the purpose of illustration, we compare the autocorrelation of the models using the example of the spatial error regression of Model D by examining Moran’s I of the residuals. Figure 10 shows Moran’s I scatter plots of the “prediction error” and “residuals” of the spatial error regression. In these scatter plots, the standard error is plotted against the error derived from the weighting matrix. The respective quadrants reveals the four autocorrelation groups with high-high and low-low correlation (above right, below left) for positive autocorrelation and the other two quadrants for negative correlation. By comparing the values of Moran’s I, we can determine whether the introduction of the autoregressive term serves to reduce autocorrelation. If we ignore autocorrelation, the value of Moran’s I is 0.52, a value that approximately corresponds to that of the OLS regression model at 0.48. Taking into account the autocorrelation (by introducing the autoregressive term) gives a value of −0.05.
Figure 11 visualizes the residuals of the regression models in order to reveal potential systematic over- or under-estimates and, hence, autocorrelations. These can be mapped using data from the covariance matrix of the regression coefficients or the estimated values and the residuals at every regression point. In this way, the degree of reduction in the autocorrelation can be visually inspected. Here, we clearly see a considerable reduction in the autocorrelation through the introduction of the autoregressive term in the spatial regression models, constituting a major improvement over the OLS model. We conclude that the model fit can be greatly improved by taking explicit account of spatial dependencies.

7. Discussion

In order to limit the degree of soil sealing by means of spatial planning instruments, it is first necessary to obtain information on likely influential factors. In view of the constantly increasing mass of analyzable data, it is becoming ever more difficult to formulate individual hypotheses. Some spatial patterns may remain hidden if an overly narrow or biased approach is adopted. Due to these problems, it can happen that complex datasets are not examined with sufficient thoroughness, i.e., not all possible aspects are considered. Consequently, interesting interdependencies may be ignored. Against this backdrop, the present study adopts the method of urban data mining [65,66] to reveal logical or mathematical and partly complex descriptions of patterns and regularities inside a set of geospatial data. A large number of variables ( n = 220 ) was collected and inspected. On this basis, correlation and regression analyses were undertaken in order to identify diverse bundles of variables that characterize the degree of soil sealing. As a result, 25 variables were identified that have an approximately linear bivariate relationship with soil sealing.
For example, the hypothesis that the extent of sealed surface in Germany’s municipalities is dependent on the density of settlements and/or a high level of economic activity has been confirmed (cf. Hypothesis 1 in Table 1). The following measures of density are significant in this regard: e.g., population density ( r = 0 . 92 ), road network density ( r = 0 . 86 ), settlement density ( r = 0 . 75 ), density of flats ( r = 0 . 75 ), daytime population density ( r = 0 . 7 ) and housing density ( r = 0 . 65 ). The tax capacity ( r = 0 . 72 ) and municipal revenues from commercial taxes ( r = 0 . 5 ) are also correlated with the extent of soil sealing (cf. Hypothesis 5 in Table 1), as is (transport) accessibility. Driving times to schools ( r = 0 . 58 ) are clearly correlated to soil sealing and, thus, serve as a specific indicator for the development of infrastructure in a region (cf. Hypothesis 3 in Table 1).
Currently, it is difficult to determine a clear dependency between lifestyle and consumption patterns (living space per inhabitant/household, journeys between home, work, shops and leisure areas) and the degree of soil sealing. There is only a moderate correlation between living space per inhabitant ( r = 0 . 58 ) and the degree of soil sealing and a similar (negative) correlation between the average commuting distance and soil sealing ( R 2 = 0 . 43 ). Other variables should be taken into account in order to investigate the assumed relationships more precisely (cf. Hypothesis 5 in Table 1). Regarding the formulated hypotheses on tourism infrastructure (cf. Hypothesis 2 in Table 1), we note that the percentage of vacation homes in a municipality is not a useful influential factor to characterize soil sealing in a pan-German study. The dependencies between soil sealing and this variable are relatively weak when considering all of Germany’s municipalities ( R 2 = 0 . 29 ). Thus, it is recommended that analysis be conducted at a different/smaller spatial scale and that supplementary variables be used as indicators for tourism infrastructure. Furthermore, no strong dependency could be identified between soil sealing and the attractiveness of the landscape or the underlying topography (cf. Hypothesis 9 in Table 1). There is only a very weak correlation between relief diversity and the degree of soil sealing. In future investigations, terrain slope might be a suitable variable to investigate the assumed relationship more precisely.
In regard to the dimensions of public policy (cf. Hypothesis 10 in Table 1), only very weak correlations were found with the degree of soil sealing. Here, further data must be gathered to permit quantitative analysis. Currently, such influences cannot be suitably illustrated, even if they are doubtless of considerable importance. Small-scale analyses are likely to be the best approach to uncovering potential dependencies.
Regarding methodology, the presented process of data analysis can be broken down into several stages: selecting the target data, pre-processing the data, applying transformations if necessary, performing correlation and regression analysis to extract relationships and then interpreting and assessing the results. Theory-driven data selection and, in particular, close data inspection, including transformation measurements, are required to ensure good quality results. The presented approach leads to a deeper understanding of the distribution of each variable. It was observed that most of the selected variables follow a log-normal distribution. Against this background, the mean and standard deviation are appropriate measures to distinguish variable characteristics. For example, it was possible to distinguish between six different soil sealing classes and to discern finer spatial patterning at the level of German municipalities (central vs. peripheral municipalities). Due to the confirmation that data are normally distributed, the strength and direction of the relationship could be measured using Pearson’s correlation coefficient. The data analytical process used scatter plots to check for linear dependence between the independent and dependent variables as a precondition for the ordinary least squares regression. In previous studies, ordinary least squares regression has often been applied to explain soil sealing or more general land consumption properties. In some cases, stepwise regression has been used to identify so-called relevant variables. In contrast to such approaches involving stepwise regression, here we have applied correlation measurements and visual techniques, such as scatter plots, in combination with substantive considerations. Furthermore, several different spatial regression approaches have been presented in this article to investigate the complex bundle of influential factors. These are the spatial lag model and the spatial error model. Such spatial regression methods possess a high explanatory value by incorporating various spatial characteristics in the model, such as spatial autocorrelation.
Furthermore, geographically-weighted regression (GWR) should be discussed as a powerful technique to study influential factors at the local level. Through the use of local statistics, non-stationarity can be detected to show how several administrative units can serve to characterize the whole study area. Non-stationarity implies that phenomena can vary over space, and hence, it is necessary to deal with their spatial distribution [57]. GWR is a local regression model that estimates new coefficient values for each unit, contrary to the OLS and SAR, which estimate one equation for the whole study area [67]. In this way, GWR addresses non-stationarity directly by providing a range of regression coefficients over the study area. However, it is rather difficult to create a model encompassing a large number of variables for the entire national territory of Germany. In order to devise such a model, the authors stress the importance of employing regression diagnostics, as well as the need to diagnose model collinearity, e.g., variance inflation factor, condition indexes (for more information, see [68,69,70,71]). Under the prerequisite of small-scale data on influential factors, future work should focus on GWR applications in selected study areas (e.g., urban regions, other soil sealing hotspots). Furthermore, other spatial interpolation approaches (e.g., regression kriging/cokriging) might be appropriate to get a deeper understanding of influential factors at the local level [72].
In general, this paper has attempted to provide an overview of methodological approaches and related challenges. In the future, depending on the availability of new datasets, it should be possible to conduct deeper analysis into the influential factors of soil sealing at fixed time points (static perspective), as well as examining changes in the extent of soil sealing along multidimensional pathways (dynamic perspective).
The recently published remote sensing data of the European Environment Agency (EEA) opens up new avenues to apply the techniques presented here to other European study regions in order to analyze the complex bundle of influential factors for the time frames 2006, 2009 and 2012. This will doubtless reveal differences between Europe’s various spatial units. Future comparative studies, as well as case studies should be undertaken to determine whether the values for sealed surfaces calculated for municipalities from EEA data are reliable.

8. Conclusions

The presented data analysis aims to identify and quantify influential factors (driving forces, determining factors) for soil sealing using an up-to-date, high-resolution dataset. In this way, it provides for more accurate investigation of the various dimensions of soil sealing, including socio-demographic, economic, infrastructural, topographic and planning-related factors. The chosen study units were Germany’s cities and municipalities, which constitute the smallest administrative units ( n = 11 , 441 ).
Data on sealed surfaces (ratio of sealed area to municipal area) were provided by the IÖR Monitor on Settlement and Open Space Development since 2013 [73]. We have given an overview of the steps needed to derive the indicator degree of soil sealing. Building on this, additional steps were the data inspection, as well as the classification of the extent of soil sealing in Germany’s municipalities. In combination with additional statistical data and multidimensional regression models (e.g., ordinary least squares regression, spatial lag model, spatial error model), the direction of influence and the intensity of various influential factors on soil sealing were investigated. These types of findings can support information and evaluation instruments when attempting to observe and investigate (both quantitatively and qualitatively) current land use structures and their changes at diverse spatial levels.

Acknowledgments

The authors have made use of data provided by the Federal Institute for Research on Building, Urban Affairs and Spatial Development, the Umweltbundesamt, the Federal Statistical Office and Statistical Offices of the Länder for the analysis of soil sealing and its influential factors. The authors are also grateful for data provided by the Federal Agency for Cartography and Geodesy and the European Environment Agency. Further, the authors thank colleagues at the Leibniz Institute of Ecological Urban and Regional Development (IÖR) for the calculation of indicators and the fruitful cooperation.

Author Contributions

Martin Behnisch conceived and designed the study and analyzed the data in collaboration with Hanna Poglitsch. Hanna Poglitsch was further responsible for statistical data collection and related geovisualization. Tobias Krüger was responsible for geoprocessing the soil sealing data distributed by the EEA. Tobias Krüger also did the literature study of relevant remote sensing data and documents. The manuscript was written in collaboration.

Conflicts of Interest

The authors declare no conflict of interest.

References

  1. Lexer, W. Zerschnitten, versiegelt, verbaut?—Flächenverbrauch und Zersiedelung versus nachhaltige Siedlungsentwicklung. In Fachtagung zur Stadtökologie “Grünstadtgrau”; Selbstverlag: Wien, Österreich, 2004; pp. 35–45. [Google Scholar]
  2. BMVBS/BBSR. Einflussfaktoren der Neuinanspruchnahme von Flächen; Forschungen Heft 139; BMVBS/BBSR: Bonn, Germany, 2009. [Google Scholar]
  3. Haber, W.; Bückman, W. Nachhaltiges Landmanagement, Differenzierte Landnutzung und Klimaschutz; Technische Universitätsverlag: Berlin, Germany, 2013. [Google Scholar]
  4. Siedentop, S.; Heiland, S.; Lehmann, I.; Hernig, A.; Schauerte-Lüke, N. Nachhaltigkeitsbarometer Fläche—Regionale Schlüsselindikatoren Nachhaltiger Flächennutzung für die Fortschrittsberichte der Nationalen Nachhaltigkeitsstrategie (Nachhaltigkeitsbarometer Fläche); Selbstverlag: Bonn, Germany, 2006. [Google Scholar]
  5. Haase, D.; Nuissl, H. Does urban sprawl drive changes in the water balance and policy? The case of leipzig (Germany) 1870–2003. Lands. Urban Plan. 2007, 80, 1–13. [Google Scholar] [CrossRef]
  6. Heber, B.; Lehmann, I. Beschreibung und Bewertung von Bodenversiegelung in Städten; Selbstverlag: Dresden, Germany, 1996. [Google Scholar]
  7. Lafortezza, R.; Carrusc, G.; Sanesia, G.; Davies, C. Benefits and well-being perceived by people visiting green spaces in periods of heat stress. Urban For. Urban Green. 2009, 8, 97–108. [Google Scholar] [CrossRef]
  8. Lassen, C. Unzerschnittene verkehrsarme Räume in der Bundesrepublik Deutschland. Nat. Landsch. 1979, 54, 333–334. [Google Scholar]
  9. Prokop, G.; Jobstmann, H.; Schönbauer, A. Overview of Best Practices for Limiting Soil Sealing or Mitigating its Effects in EU-27; Final Report of a study contracted by the European Commission, DG Environment; European Communities: Brussels, Belgium, 2011. [Google Scholar]
  10. Scalenghea, R.; Marsan, F.A. The anthropogenic sealing of soils in urban areas. Lands. Urban Plan. 2009, 90, 1–10. [Google Scholar] [CrossRef]
  11. Arlt, G.; Gössel, J.; Heber, B.; Hennersdorf, J.; Lehmann, I.; Thinh, N.X. Auswirkungen Städtischer Nutzungsstrukturen auf Bodenpreis und Bodenversiegelung; IÖR Schriften Band 34; Sächsiches Druck und Verlagshaus: Dresden, Germany, 2001. [Google Scholar]
  12. Martin, C.; Eiblmaier, M. (Eds.) Lexikon der Geowissenschaften; Spektrum Akademischer Verlag: Heidelberg, Germany, 2002.
  13. EEA, European Environmental Agency. Imperviousness products 2006/2009: Technical Note on HR Imperviousness Layer Product Specification; European Environmental Agency: Copenhagen, Denmark, 2010. [Google Scholar]
  14. Blum, W.E.H. Challenges for European soil protection under interdisciplinary aspects. In Europäischer Bodenschutz: Schlüsselfragen des nachhaltigen Bodenschutzes; Lee, Y.H., Bückmann, W., Eds.; Universitätsverlag: Berlin, Germany, 2008; pp. 81–94. [Google Scholar]
  15. Breuste, J.H. Structural analysis of urban landscapes for landscape management in German cities. In Ecology of Cities and Towns; McDonnell, M.J., Hahs, A.K., Breuste, J.H., Eds.; University Press: Cambridge, UK, 2009; pp. 355–379. [Google Scholar]
  16. Acevedo, W.; Taylor, J.L.; Hester, D.J.; Mladinich, C.S.; Glavac, S. Rates, Trends, Causes, and Consequences of Urban Land-Use Change in the United States; USGS Information Services: Denver, CO, USA, 2006; p. 70. [Google Scholar]
  17. Frie, B.; Hensel, R. Schätzverfahren zur Bodenversiegelung: UGRdL-Ansatz. In Statistische Analysen und Studien NRW, Band 44; Landesamt für Datenverarbeitung und Statistik NRW; Selbstverlag: Düsseldorf, Germany, 2007; pp. 19–32. [Google Scholar]
  18. Meinel, G.; Hernig, A. Erhebung der bodenversiegelung auf grundlage des ATKIS-Basis-DLM- möglichkeiten und grenzen. Photogramm. Fernerkund. Geoinform. 2006, 3, 195–204. [Google Scholar]
  19. Braun, M.; Herold, M. Mapping impervious surface using NDVI and linear spectral unmixing of ASTER data in the Cologne-Bonn region (Germany). SPIE Proc. 2004, 5239, 274–284. [Google Scholar]
  20. Kübler, A. Kommunale Bodenschutzkonzepte—Bewertung, Monitoring und Management von Bodenressourcen, Vorgestellt am Beispiel Stuttgart; Neue Möglichkeiten der Nachhaltigkeit im Kommunalen Bodenschutz durch Kombination von Bodenbewertung, Bodenindikatoren und Strategien zur Haushälterischen Bewirtschaftung Lokaler Bodenressourcen. Ph.D. Thesis, Universität Stuttgart, Stuttgart, Germany, 2004. [Google Scholar]
  21. Goetzke, R.; Over, M.; Braun, M. A method to map land-use change and urban growth in North Rhine-Westphalia (Germany). In Proceedings of the 2nd Workshop of the EARSeL SIG on Land Use and Land Cover, Bonn, Germany, 6–7 May 2006; pp. 102–111.
  22. Esch, T.; Himmler, V.; Schorcht, G.; Thiel, M.; Wehrmann, T.; Bachofer, F.; Conrad, C.; Schmidt, M.; Dech, S. Large-area assessment of impervious surface based on integrated analysis of single-date Landsat-7 images and geospatial vector data. Remote Sens. Environ. 2009, 113, 1678–1690. [Google Scholar] [CrossRef]
  23. Heldens, W.; Esch, T.; Heiden, U.; Dech, S.; Chockalingam, J. Potential of hyperspectral remote sensing for characterisation of urban structure in Munich. In Proceedings of the EARSeL Joint Workshop, Bochum, Germany, 5–7 March 2008; pp. 94–103.
  24. Wu, C.; Murray, A.T. Estimating impervious surface distribution by spectral analysis. Remote Sens. Environ. 2003, 84, 493–505. [Google Scholar] [CrossRef]
  25. Li, M.; Zang, S.; Wu, C.; Deng, Y. Segmentation-based and rule-based spectral mixture analysis for estimating urban imperviousness. Adv. Space Res. 2015, 55, 1307–1315. [Google Scholar] [CrossRef]
  26. Munafò, M.; Norerob, C.; Sabbic, A.; Salvati, L. Soil sealing in the growing city: A survey in Rome, Italy. Scott. Geogr. J. 2013, 126, 153–161. [Google Scholar] [CrossRef]
  27. Villa, P. Mapping urban growth using Soil and Vegetation Index and Landsat data: The Milan (Italy) city area case study. Landsc. Urban Plan. 2012, 107, 245–254. [Google Scholar] [CrossRef]
  28. Sunde, M.G.; He, H.S.; Zhou, B.; Hubbart, J.A.; Spicci, A. Imperviousness Change Analysis Tool (I-CAT) for simulating pixel-level urban growth. Landsc. Urban Plan. 2014, 124, 104–108. [Google Scholar] [CrossRef]
  29. Maucha, G.; Büttner, G.; Kosztra, B. European Validation of GMES FTS Soil Sealing Enhancement Data; Final draft; European Environment Agency: Copenhagen, Denmark, 2010. [Google Scholar]
  30. Maucha, G.; Büttner, G.; Kosztra, B. Europeanvalidation of GMES FTS soil sealing enhancement data. In Proceedings of the 31st EARSeL Symposium Prague: Remote Sensing and Geoinformation not only for Scientific Cooperation, Prague, Czech Republic, 30 May–2 June 2011; pp. 223–238.
  31. Ranalli, F.; Salvati, L. Complex patterns, unpredictable consequences: The distribution of sealed land along the urban-rural gradient in Barcelona. Documents d’Anàlisi Geogr. 2015, 61, 393–408. [Google Scholar] [CrossRef]
  32. Tombolini, I.; Munafòa, M.; Salvati, L. Soil sealing footprint as an indicator of dispersed urban growth: A multivariate statistics approach. Urban Res. Pract. 2015, 9, 1–15. [Google Scholar] [CrossRef]
  33. Artmann, M. Driving forces of urban soil sealing and constraints of ist management—Cases of leipzig and munich (Germany). J. Settl. Spat. Plan. 2013, 4, 143–152. [Google Scholar]
  34. Artmann, M. Spatial dimensions of soil sealing management in growing and shrinking cities—A systemic multiscale analysis in Germany. Erdkunde 2013, 67, 249–264. [Google Scholar] [CrossRef]
  35. Cabral, P.; Santos, J.; Augusto, G. Monitoring urban sprawl and the national ecological reserve in Sintra-Cascais, Portugal: Multiple OLS linear regression model evaluation. J. Urban Plan. Dev. 2011, 137, 346–353. [Google Scholar] [CrossRef]
  36. Mann, S. Was beeinflusst die flächenversiegelung? Agrarforschung 2008, 15, 184–189. [Google Scholar]
  37. Morelli, V.G.; Salvati, L. Ad Hoc Urban Sprawl in the Mediterranean City: Dispersing a Compact Tradition? Edizioni Nuova Cultura: Rom, Italy, 2010. [Google Scholar]
  38. Navarro Pedreño, J.; Meléndez-Pastor, I.; Gómez Lucas, I. Impact of three decades of urban growth on soil resources in Elche (Alicante, Spain). Span. J. Soil Sci. 2012, 2, 55–69. [Google Scholar]
  39. Vanderhaegen, S.; De Munter, K.; Canters, F. High resolution modelling and forecasting of soil sealing density at the regional scale. Landsc. Urban Plan. 2015, 133, 133–142. [Google Scholar] [CrossRef]
  40. Xiao, R.; Su, S.; Zhang, Z.; Qi, J.; Jiang, D.; Wu, J. Dynamics of soil sealing and soil landscape patterns under rapid urbanization. Catena 2013, 109, 1–12. [Google Scholar] [CrossRef]
  41. Thinh, N.X.; Arlt, G.; Heber, B.; Hennersdorf, J.; Lehmann, I. Evaluation of urban land-use structures with a view to sustainable development. Environ. Impact Assess. Rev. 2002, 22, 475–492. [Google Scholar] [CrossRef]
  42. Levia, D.F. Farmland conversion and residential development in North Central Massachusetts. Land Degrad. Dev. 1999, 9, 123–130. [Google Scholar] [CrossRef]
  43. Mann, S.; Zingg, E. Stand und Dynamik der Flächenversiegelung in der Schweiz. Raumforsch. Raumordn. 2009, 67, 45–53. [Google Scholar] [CrossRef]
  44. Kretschmer, O.; Ultsch, A.; Behnisch, M. Towards an understanding of land consumption in Germany—Outline of influential factors as a basis for multidimensional analyses. Erdkunde 2015, 69, 267–279. [Google Scholar] [CrossRef]
  45. Salvati, L.; Forino, G. A “laboratory” of landscape degradation: Social and economic implications for sustainable development in peri-urban areas. Int. J. Innov. Sustain. Dev. 2014, 8, 232–249. [Google Scholar] [CrossRef]
  46. Territorial Agenda of the European Union 2020: Towards an Inclusive, Smart and Sustainable Europe of Diverse Regions. Gödöllő, Hungary, 2011. Available online: http://www.eu2011.hu/files/bveu/documents/ TA2020.pdf (accessed on 15 April 2016).
  47. Müller, K.; Steinmeier, C.; Küchler, M. Urban growth along motorways in Switzerland. Landsc. Urban Plan. 2010, 98, 3–12. [Google Scholar] [CrossRef]
  48. EEA, European Environmental Agency. Urban Sprawl in Europe—The Ignored Challenge; European Environment Agency Report 10/2006; European Environmental Agency: Copenhagen, Denmark, 2006. [Google Scholar]
  49. Walz, U.; Stein, C. Indicators of hemeroby for the monitoring of landscapes in Germany. J. Nat. Conserv. 2014, 22, 279–289. [Google Scholar] [CrossRef]
  50. Bundesamt für Kartographie und Geodäsie (BKG, Federal Agency for Cartography and Geodesy). Available online: http://www.geodatenzentrum.de/docpdf/vg250.pdf (accessed on 10 June 2016).
  51. Behnisch, M.; Ultsch, A. Knowledge discovery in spatial planning data—A concept for cluster understanding. In Computational Approaches for Urban Environments; Geotechnologies and the Environment Series 13; Helbich, M., Arsanjani, J.J., Leitner, M., Gatrell, J.D., Jensen, R.R., Eds.; Springer: Berlin, Germany, 2015; pp. 49–75. [Google Scholar]
  52. Fox, J. Applied Regression Analysis, Linear Models, and Related Models; SAGE Publications: New York, NY, USA, 1997. [Google Scholar]
  53. Hand, D.J.; Mannila, H.; Smyth, P. Principles of Data Mining; The MIT Press: Cambridge, MA, USA, 2001. [Google Scholar]
  54. Ultsch, A. Pareto density estimation: A density estimation for knowledge discovery. In Innovations in Classification, Data Science, and Information Systems, Proceedings of the 27th Annual Conference of the German Classification Society (GfKL), Cottbus, Germany, 12–14 March 2003; Baier, D., Wernecke, K.D., Eds.; Springer: Berlin, Germany, 2003; pp. 91–100. [Google Scholar]
  55. Griffith, D.A. Spatial Autocorrelation; Elsevier Inc.: Dallas, Richardson, TX, USA, 2009. [Google Scholar]
  56. Longley, P.A.; Goodchild, M.F.; Maguire, D.J.; Rhind, D.W. Geographic Information Systems and Science; Wiley: New York, NY, USA, 2005. [Google Scholar]
  57. Anselin, L. Spatial Econometrics/Methods and Models; Springer Science & Business Media: Dodrecht, The Netherlands, 1988. [Google Scholar]
  58. Getis, A. Spatial autocorrelation. In Handbook of Applied Spatial Analysis; Fischer, M.M., Getis, A., Eds.; Springer: Berlin, Germany; pp. 255–278.
  59. Anselin, L. Local indicators of spatial association—LISA. Geogr. Anal. 1995, 27, 93–115. [Google Scholar] [CrossRef]
  60. Anselin, L.; Bera, A. Spatial Dependence in Linear Regression Models. In Handbook of Applied Economic Statistics; Marcel Dekker, Inc.: New York, NY, USA, 1998; pp. 237–289. [Google Scholar]
  61. Fischer, M.; Wang, J. Spatial Data Analysis/Models, Methods and Techniques; Springer: Heidelberg, Germany, 2011. [Google Scholar]
  62. Kissling, D.; Carl, G. Spatial autocorrelation and the selection of simultaneous autoregressive models. Glob. Ecol. Biogeogr. 2008, 17, 59–71. [Google Scholar] [CrossRef]
  63. Anselin, L. Lagrange multiplier test diagnostics for spatial dependence and spatial heterogeneity. Geogr. Anal. 1988, 20, 1–17. [Google Scholar] [CrossRef]
  64. Lloyd, C. Local Models for Spatial Analysis; CRC Press: Boca Raton, FL, USA, 2011. [Google Scholar]
  65. Behnisch, M. Urban Data Mining; KIT Scientific Publishing: Karlsruhe, Germany, 2008. [Google Scholar]
  66. Behnisch, M.; Ultsch, A. Urban data mining: Spatiotemporal exploration of multidimensional data. Build. Res. Inf. 2009, 37, 520–532. [Google Scholar] [CrossRef]
  67. Fotheringham, A.; Brunsdon, C.; Charlton, M. Geographically Weighted Regression: The Analysis of Spatially Varying Relationships; John Wiley & Sons Ltd.: New York, NY, USA, 2002. [Google Scholar]
  68. Brundson, C.; Charlton, M.E.; Harris, P. Living with Collinearity in Local Regression Models. Available online: http://www.geos.ed.ac.uk/ gisteac/proceedingsonline/GISRUK2012/Papers/presentation-9.pdf (accessed on 15 April 2016).
  69. Wheeler, D.; Tiefelsdorf, M. Multicollinearity and Correlation Among local Regression Coefficients in Geographically Weighted Regression; Springer: Berlin, Germany, 2005. [Google Scholar]
  70. Wheeler, D.; Paez, A. Geographically Weighted Regression. In Handbook of Applied Spatial Analysis; Fischer, M.M., Getis, A., Eds.; Springer: Berlin, Germany, 2010; pp. 461–486. [Google Scholar]
  71. Wheeler, D. Visualizing and diagnosing coefficients from Geographically Weighted Regression models. In Geospatial Analysis and Modelling of Urban Structure and Dynamics; Jiang, B., Yao, X., Eds.; Springer: Berlin, Germany, 2010; pp. 415–436. [Google Scholar]
  72. Wackernagel, H. Multivariate Geostatistics: An Introduction with Applications, 3rd ed.; Springer: Berlin, Germany, 2010. [Google Scholar]
  73. Krüger, T.; Meinel, G.; Schumacher, U. Land-use monitoring by topographic data analysis. Cartogr. Geogr. Inf. Sci. 2013, 40, 220–228. [Google Scholar] [CrossRef]
Figure 1. Processing of European soil sealing data.
Ijgi 05 00132 g001
Figure 2. Procedural steps to investigate soil sealing and the complex bundle of influential factors.
Ijgi 05 00132 g002
Figure 3. Distribution of the degree of soil sealing: normal QQ-plot (left) and empirical cumulative distribution function (ECDF)-plot, (right).
Ijgi 05 00132 g003
Figure 4. Kernel density of the degree of soil sealing at the municipal level.
Ijgi 05 00132 g004
Figure 5. Distribution of the degree of soil sealing at the municipal level.
Ijgi 05 00132 g005
Figure 6. Average sealed surfaces of classified municipalities.
Ijgi 05 00132 g006
Figure 7. Scatter plots of selected independent variables and their correlation index R. (a) Moderate negative correlation. (b) No correlation. (c) Strong positive correlation.
Ijgi 05 00132 g007
Figure 8. Regression diagnostic of Model D.
Ijgi 05 00132 g008
Figure 9. Local Moran’s I.
Ijgi 05 00132 g009
Figure 10. Moran’s I of the spatial error residuals for Model D.
Ijgi 05 00132 g010
Figure 11. Residuals comparison of the regression model for Model D.
Ijgi 05 00132 g011
Table 1. Hypotheses on the degree of soil sealing and the complex bundle of influential factors.
HypothesisDimensionSource
1. Soil sealing is particularly high in densely-populated municipalities with/or areas showing high economic activity. It is observed that the migration of people and businesses from core settlement areas or from less attractive regions leads to high levels of vacant and derelict buildings, with underlying soils remaining sealed.Demographic and social issues, economy[2,11,31,40,45,46]
2. Tourism infrastructure shows a very heterogeneous spatial dimension, indicating a weak correlation with soil sealing for the pan-German study.Demographic and social issues[36,46]
3. The degree of soil sealing is higher for areas that enjoy good transport connections. The expansion of transport infrastructure closely determines the degree of soil sealing.Mobility[2,26,39,47]
4. Municipalities with a surplus of inbound commuters presumably show an increased soil sealing in commercial and traffic areas, though this is not true of residential areas.Mobility[44]
5. Soil sealing in commercial and settlement areas is driven by municipal revenues in the form of trade and income taxes.Economy[33]
6. Lifestyles and consumption patterns (e.g., living space per household/inhabitant, journeys between home, work, shops and leisure areas) influence demand for new developments and, thus, are correlated with soil sealing.Land and real estate market[2,33,48]
7. If a municipality has a large proportion of economic sectors with a low specific demand for land, then the degree of soil sealing will be smaller.Land and real estate market[2]
8. The greater the influence of human activity on a landscape (reflecting the concept of hemeroby), the higher the degree of soil sealing.Spatial context[40,49]
9. Natural features, such as topographical restrictions, can influence the spatial distribution of settlement areas/sealed surfaces.Spatial context[2,36]
10. The degree of soil sealing largely depends on the category of land protection (regulation of land use by federal and regional planning authorities). Subsidies for urban reconstruction and rural development are provided to restrict the extent of soil sealing.Politics[2]
Table 2. Overview of Statistical Data and Variables.
DimensionCountExamplesData Sources
Demographic and Social Issues30Population Density, Gender Proportion, Births, Inward and Outward Migration, Migration Balance by Age Groups, Intensity of TourismFederal Institute for Research on Building, Urban Affairs and Spatial Development (BBSR), Regional Database Germany
Economy53Employees, Job Offers, Debts and New Debts, Tax Revenues per 1000 Inhabitants, Unemployment RateBBSR, Regional Database Germany, Federal Employment Agency
Land and Real Estate Market90Building Area, Residential Buildings and Dwellings, Living Space per Inhabitant, Dwelling Sizes, Age Groups of Residential Buildings, Newly-Constructed Buildings, Vacancy Rate, Household Size and Structure, Tenancy Ratio, Purchasing PowerIÖR Monitor, BBSR, Microm, Regional Database Germany
Mobility6Share of Daily Migration, Average Commuting Distance, Job Market CentralityBBSR
Politics6Administrative Fragmentation, Funding per 1,000 Inhabitants (e.g., Urban Development Funding)Federal Office for Economic Affairs and Export Control
Spatial Context36Travel Time by Car and Trucks to Selected Places (Highways, Regional Centers, Airports, etc.), Hemeroby, Relief Diversity, Road Network Density, Air PollutantsIÖR Monitor, Federal Environmental Agency, BBSR, Federal Statistical Office
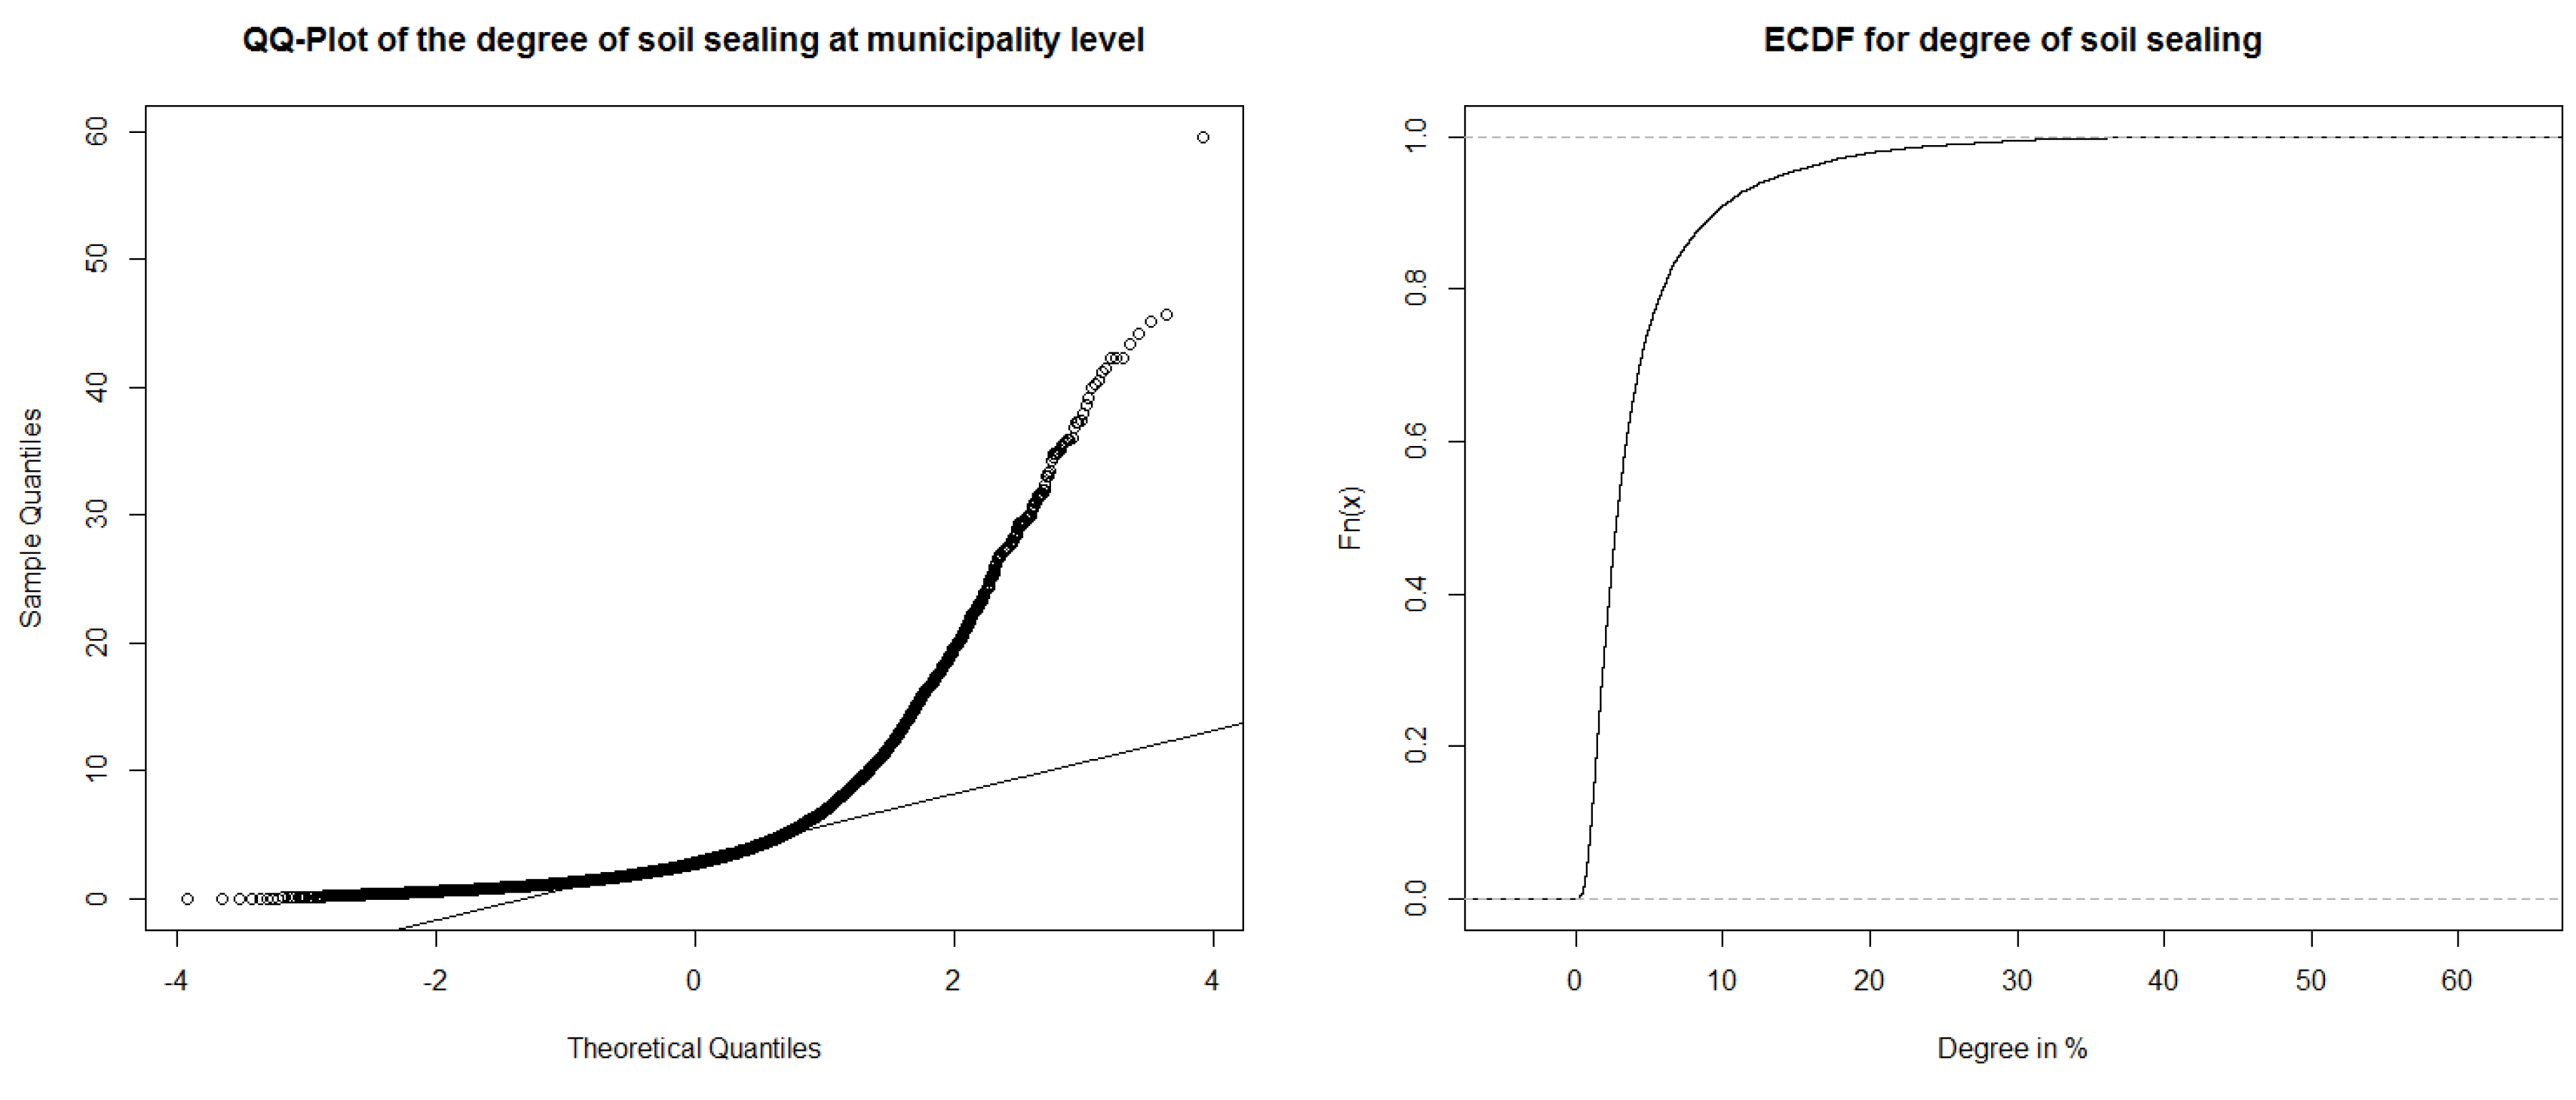
Table 3. Distribution of soil sealing as a percent for municipalities.
Min1st QuantileMedianMean3rd QuantileMax
0.0001.6142.7674.3554.95959.560
Table 4. Independent variables used in the regression models (d = data, Corr. = correlation value r).
VariableShortcutUnitTransformCorr.
Demographic and social issues
Population densityP-density p e r s o n / h a log0.92
Population absoluteP-absolutelog0.70
Percentage of vacation homesVacation homes%log ( d + 1 ) −0.29
Economy
Municipal tax capacity per inhabitantTax capacity E u r o / p e r s o n log ( d + 1 ) 0.72
Employees at the place-of-residenceResidencelog0.70
Employees at the place-of-workWorklog0.65
Property Tax A per inhabitantProperty tax E u r o / i n h a b i t a n t log(d + 10)0.64
Percentage of employees at the place-of-workWorking employees%−0.55
Income of trade tax per inhabitantTrade tax E u r o / p e r s o n log ( d + 1 ) 0.50
Percentage of industrial and commercial areaIndCom%log ( d + 1 ) 0.54
Spatial context
Settlement and transportation arealand consumption%log0.90
Road network densityRoad densitykm/km 2 log ( d + 1 ) 0.86
Density of use of transport infrastructureT-densityperson/km 2 log0.79
Settlement densityS-densityperson/halog0.75
Utilization DensityUtilization densityperson/halog0.72
Daytime population densityD-densityperson/halog0.70
Driving time to schoolsSchoolsminuteslog−0.58
Driving time to hospitalsHospitalsminuteslog−0.50
Driving time to regional centersRegional centersminuteslog−0.41
Driving time to motorwaysMotorwaysminuteslog−0.40
Driving time by truck to cargo centersCargo centersminuteslog−0.40
Land and real estate market
Density of flatsF-density%log0.75
Housing densityH-densitybuildings/halog0.65
Building area per 1000 inhabitantbuilding areaha/inhabitantlog ( d + 1 ) 0.59
Living space per inhabitantLiving spacem 2 /inhabitantlog ( d + 100 ) 0.58
Residential buildings per 1000 inhabitantsBuildings/inhab.log0.58
Percentage of multifamily housesBuildings 3-X%log ( d + 1 ) 0.55
Mobility
Perc. of out-commutersOut-commuters% x 2 0.56
Job market centralityJob centrality%log ( d + 1 ) 0.53
Typical commuting distanceCommutingkm−0.43
Table 5. OLS regressions models (Regression coefficient = B e t a , Standardized regr. coeff. = S t a n d . B e t a ).
VariableModel A: DensityVariableModel B: Driving Time
BetaStand. Beta BetaStand. Beta
Intercept−0.678
Intercept−0.443Schools−0.423−0.351
D-Density−0.0680.065Hospitals−0.242−0.180
F-Density0.0850.264Regional Centers−0.195−0.152
Road Density1.1950.640Motorways−0.074−0.084
Cargo Centers−0.219−0.177
R 2 0.79 R 2 0.46
AIC4277.05 AIC15188.50
VariableModel C: Influential Factors IVariableModel D: Influential Factors II
BetaStand. Beta BetaStand. Beta
Intercept1.092 Intercept−0.678
P-Density0.5130.816Vacation Homes−0.068−0.081
Vacation Homes−0.037−0.045Buildings 3-X0.0750.091
Buildings 3-X0.0430.053Job Centrality0.0400.093
Job Centrality0.0360.085Commuting0.0030.028
Commuting0.0040.031S-Density0.1850.171
Schools−0.023−0.019Road Density1.1040.590
Trade Tax0.0310.061Tax Capacity0.0440.120
R 2 0.86 R 2 0.83
AIC−402.22 AIC1907.54
Table 6. Comparison of the regression results.
OLS RegressionSpatial Lag RegressionSpatial Error Regression
Model APseudo- R 2 0.790.810.89
AIC4277.053201.11−1165.53
Model BPseudo- R 2 0.460.570.61
AIC15,188.5013,128.412,301.5
Model CPseudo- R 2 0.860.870.92
AIC−402.22−750.01−4581.8
Model DPseudo- R 2 0.830.850.91
AIC1907.541099.9−3344.02

