2.1. Related Work on AP Selection
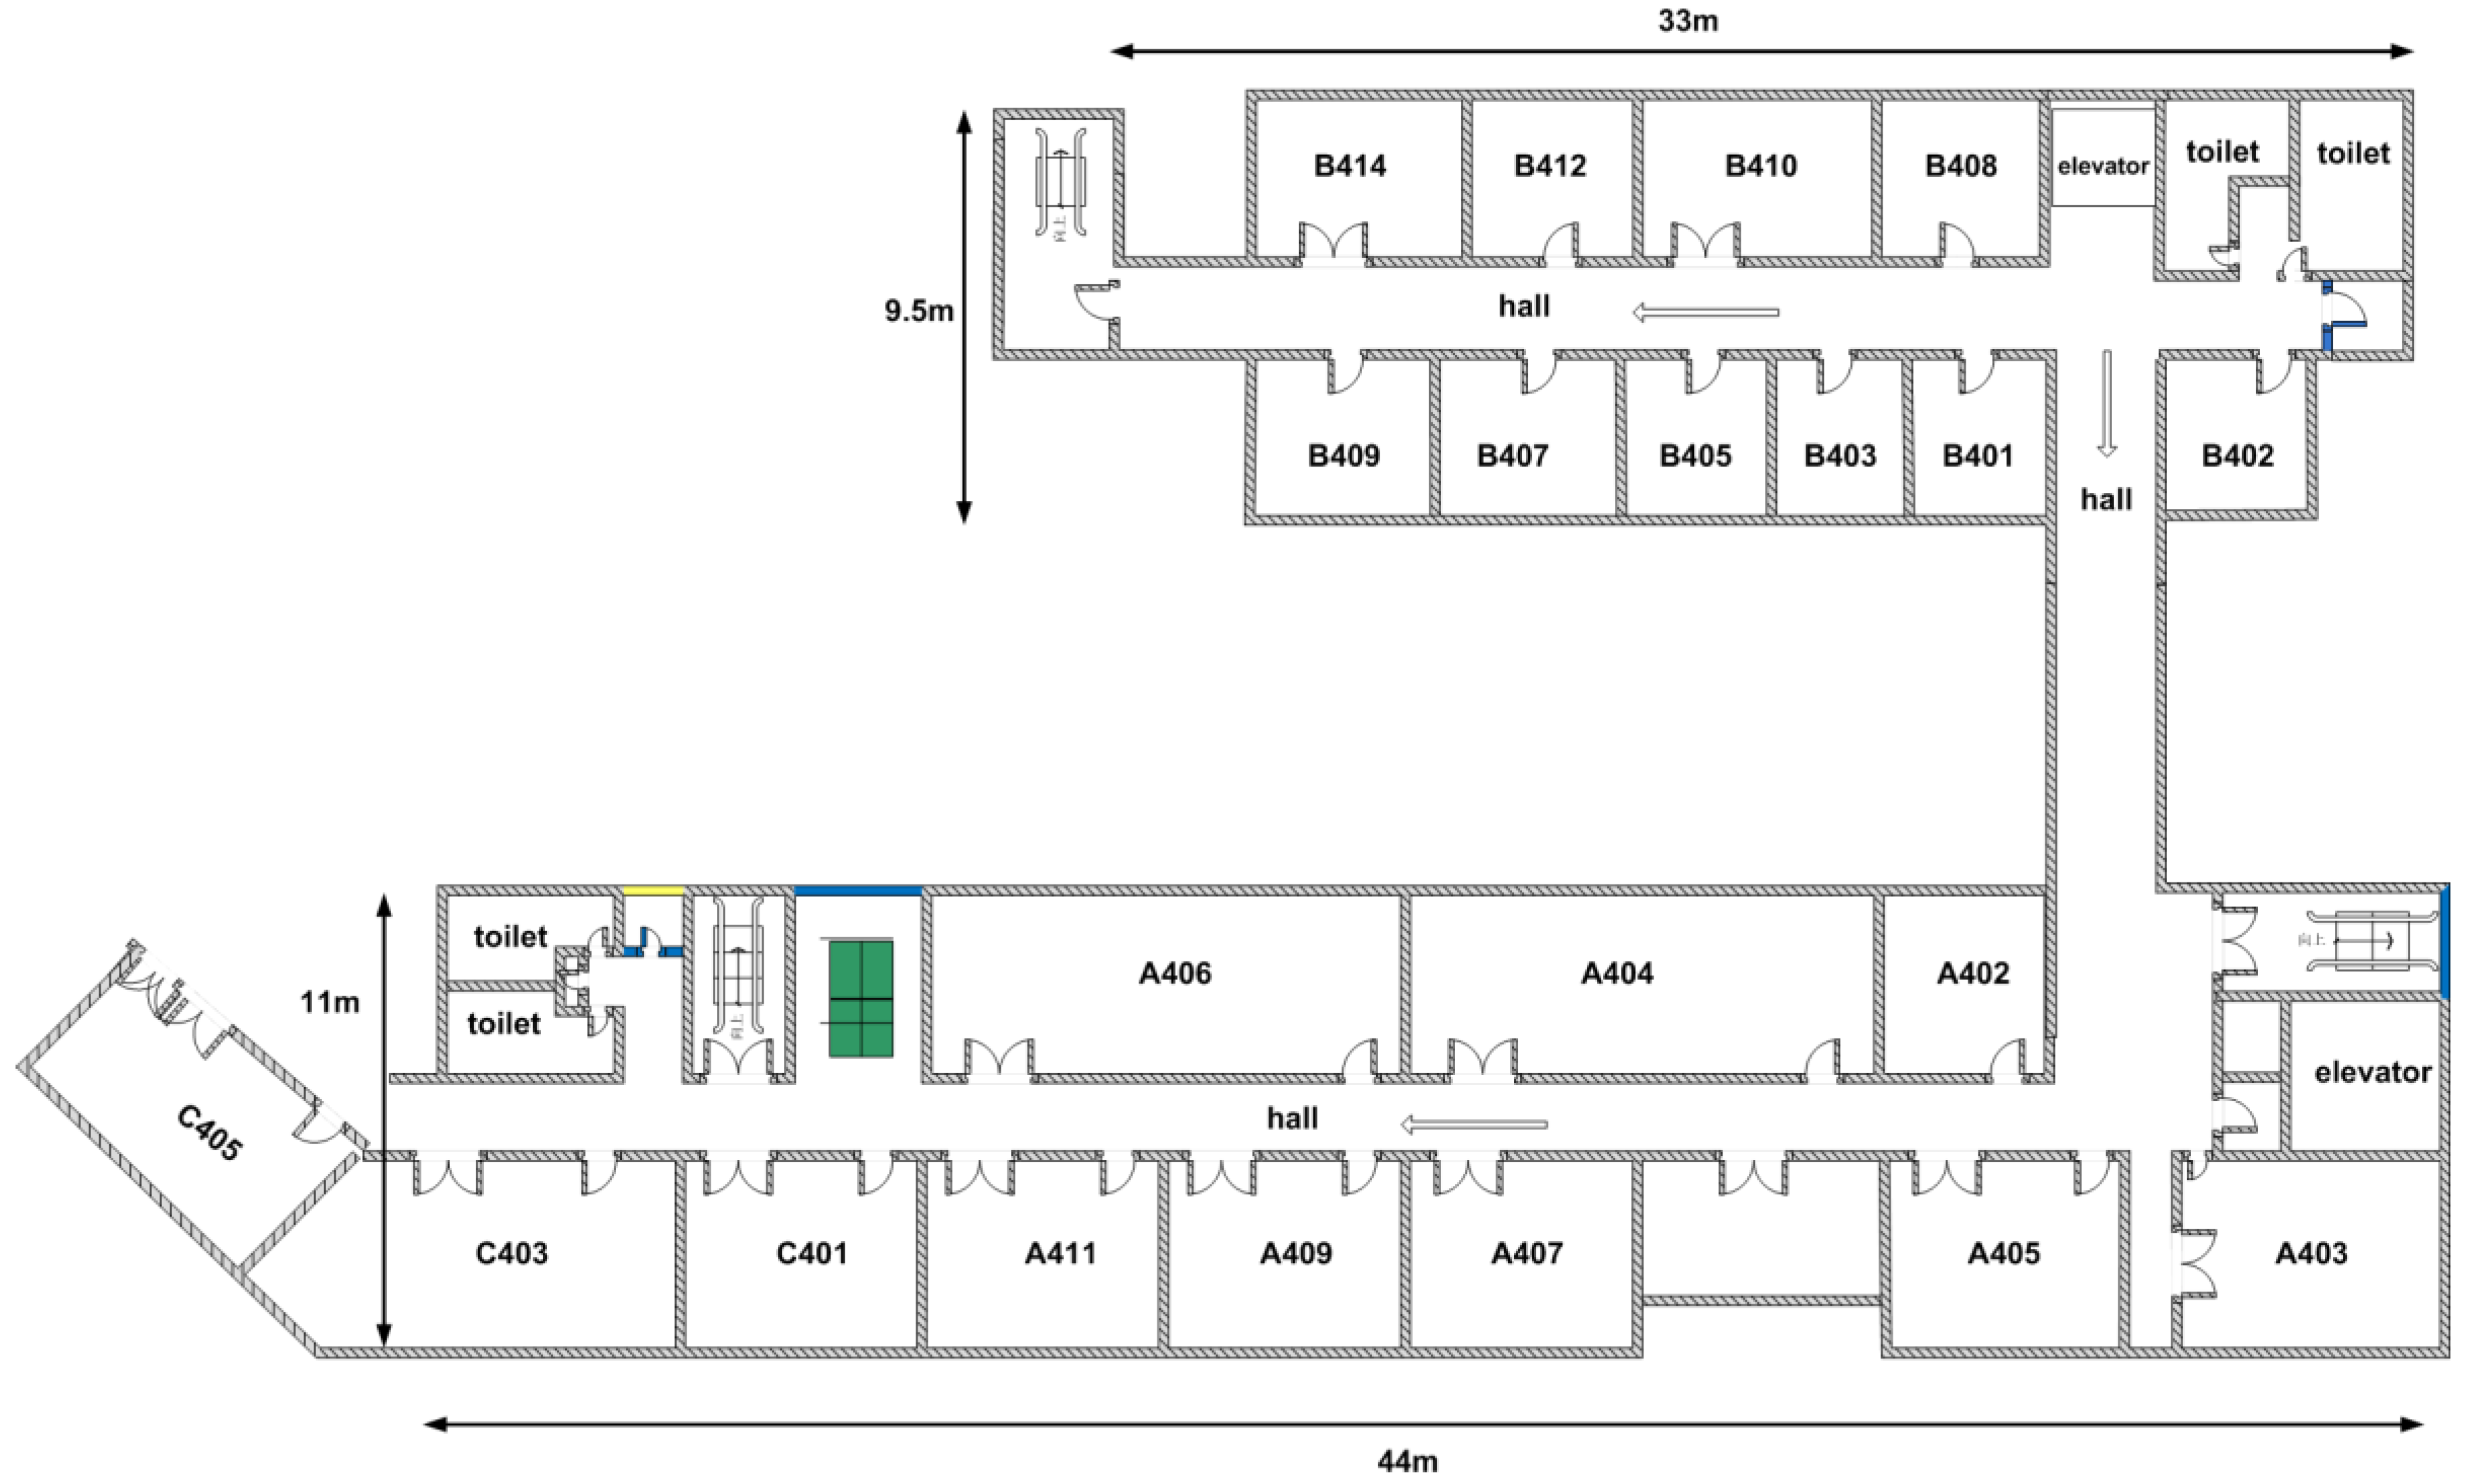
Pervasive wireless LAN facilities make WLAN indoor positioning technology feasible. However, sometimes, too many APs also increase the computational complexity and positioning difficulty. The number of detectable APs can often be up to 20 in all kinds of indoor environments, such as shopping malls, campuses, offices or homes. As an example,
Table 1 shows the average number of detectable APs of at a certain location in different indoor environments of the China University of Mining and Technology (CUMT) campus during working and non-working hours, respectively. Moreover, owing to the severe multipath effect of indoor signal propagation, the detectable AP set varies with the observation time and position. It has been pointed out that not all of the detectable APs can be utilized for positioning [
15]. There are such APs that either act as a noise factor or play a redundant role in positioning. This inspires researchers to focus on the AP selection strategy for screening out the subset of APs that are necessary and sufficient for positioning and discarding the noisy and redundant ones.
Youssef et al. [
16,
17,
18] have proposed the MaxMean method, which selects the first
k strongest APs. In fact, they intuitively believe that the APs appearing most frequently in samples are needed. According to their analysis, the APs with the highest average signal strength are those that appear most frequently. This method is simple and effective; however, it may not be that complete in some circumstances. Specifically, since the wireless LAN hardware in a real environment is usually provided by several different manufactures, the average levels of signal strength received from them can be quite different. The MaxMean method is apt at discarding these APs with low average signal strength, which may appear frequently and contribute to positioning. Chen et al. [
19] have provided the InfoGain method based on the information theory measure. The information gain, regarded as a measure of discriminative capabilities, is calculated for each AP and then ranked in a descending order. The first
k APs corresponding to the highest information gain are finally selected. Lin et al. [
20] have provided a group-discrimination-based AP selection method, which exploits the risk function from support vector machines (SVMs) to estimate the positioning capabilities for the AP group.
2.2. Proposed LocalReliefF-C AP Selection Method
Fusing the well-accepted feature selection algorithm ReliefF with the measure of the Pearson correlation coefficient, we have put forward a novel AP selection method called LocalReliefF-C, which can effectively estimate the positioning capability for each AP and determine the significant correlation between every two APs, which are potentially redundant. It can improve the positioning accuracy and reduce the computational overhead for positioning systems by means of discarding redundant APs and obtaining the set of the best-discriminating APs.
Up to now, several machine learning models have been applied to indoor positioning, such as naive Bayes, SVM, decision tree induction and neural networks [
20,
21]. Fingerprinting indoor positioning can be viewed as a multi-class classification problem in the machine learning field. The records of the fingerprint database correspond to training instances, while reference locations correspond to class labels. In a machine learning way, location estimation is actually to determine the class for the given new instance. Feature selection in machine leaning is the process of selecting a subset containing relevant features to use in model construction [
22]. There are both similarities and differences between AP selection and feature selection. Even so, we still believe that with each AP viewed as a feature, it makes sense to introduce a classic feature selection method into AP selection for positioning.
Relief is a well-accepted feature selection method for the two-class classification problem. It has the advantage of being simple to implement and having high running efficiency [
23,
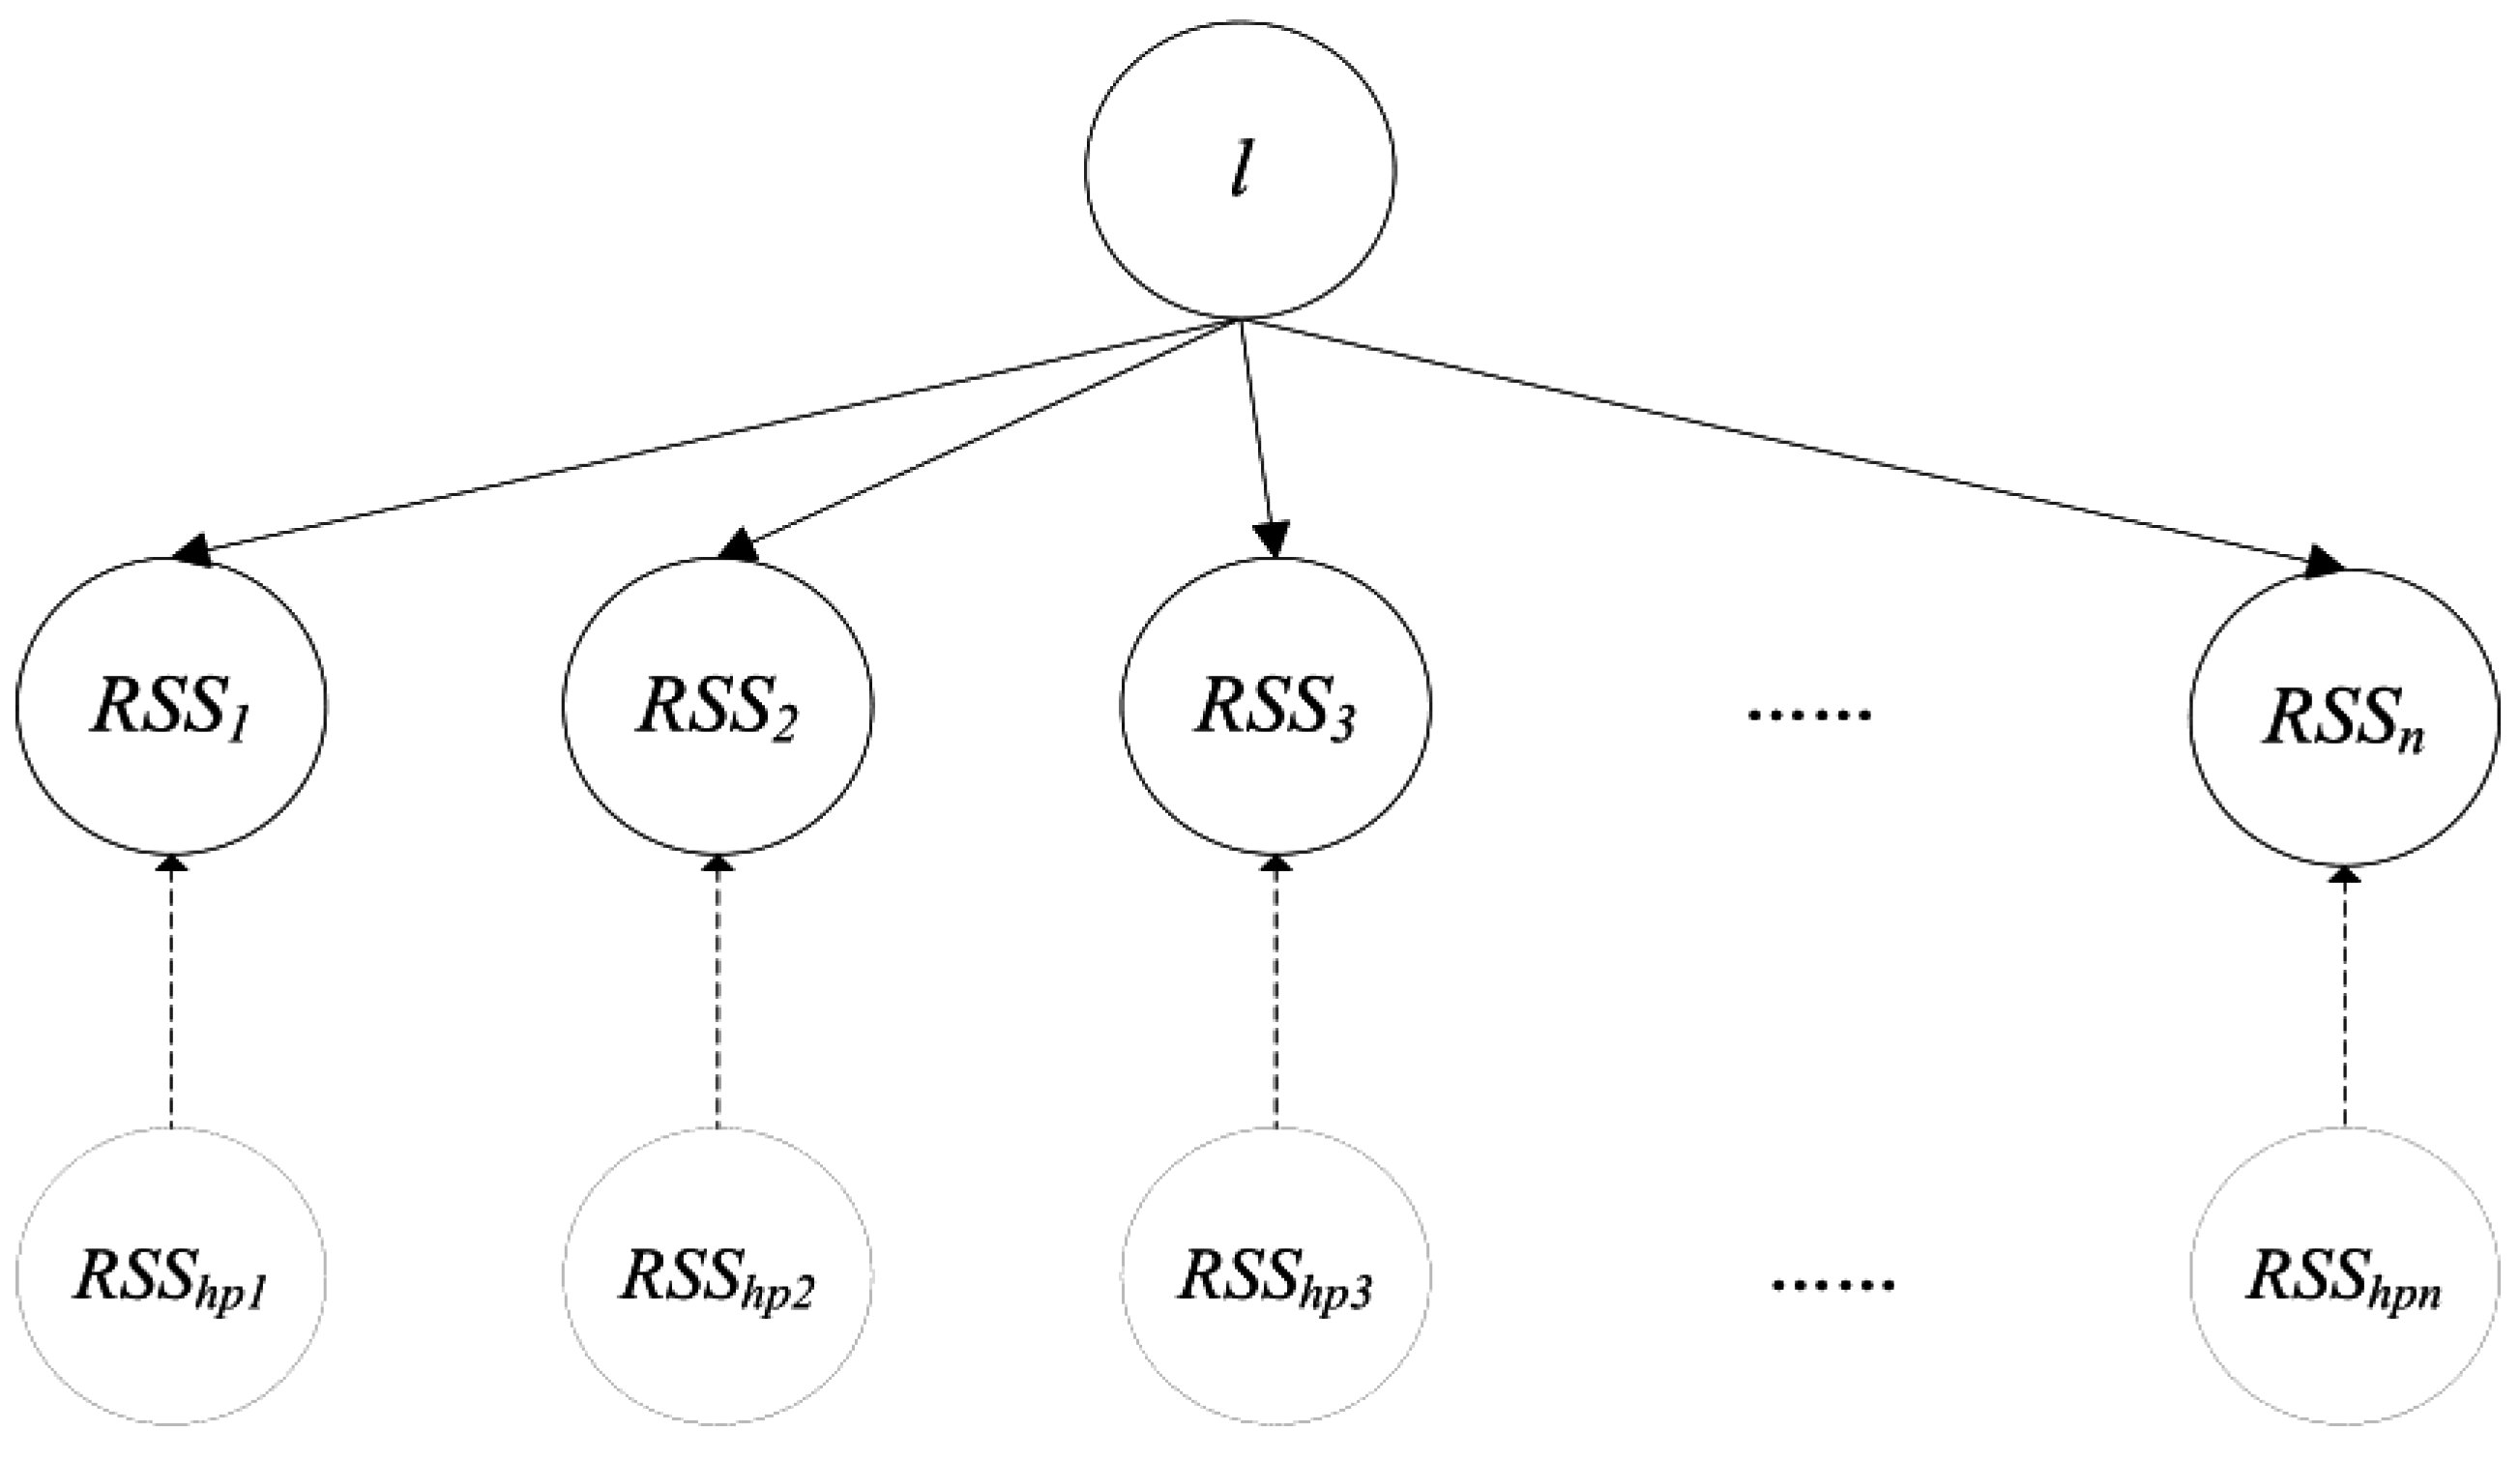
24]. Its core idea is to select the subset of features with the best discriminating capability. The discriminating capability of each feature is represented by a weight, which is calculated according to how well the values of the feature can separate instances similar to each other. Concretely, from all of the training instances, Relief randomly chooses an instance
and finds two of its nearest neighbors: one from the same class, called nearest hit
H, and the other from the different class, called nearest miss
M. The process of choosing a random instance is iterated
m times. In each iteration, according to the values of
,
and
H, the algorithm updates the weight
for each feature
as follows:
where:
In Equation (2), the function diff calculates the value difference on feature A of instances and . The result is divided by for the reason of normalization. The algorithm considers that good features should make instances of the same class close and instances of different classes far. As shown in Equation (1), when instances and H have different values on , this means that feature separates two instances of the same class. That is not desirable: hence, we decrease the weight . On the other hand, when and M have different values of , this means that separates two instances with different class values. That is desirable, so we increase the weight .
ReliefF, an improved algorithm of Relief, can deal with the feature selection problem for multi-class classification [
24]. We utilize it to evaluate the discriminating capability of each AP. It differs from Relief in several aspects. First of all, it searches for
k nearest hits from the same class and also
k nearest misses from each of the different classes. Next, it takes into account each different class
and uses the instances proportion
as its contribution factor, where
indicates the number of instances of class
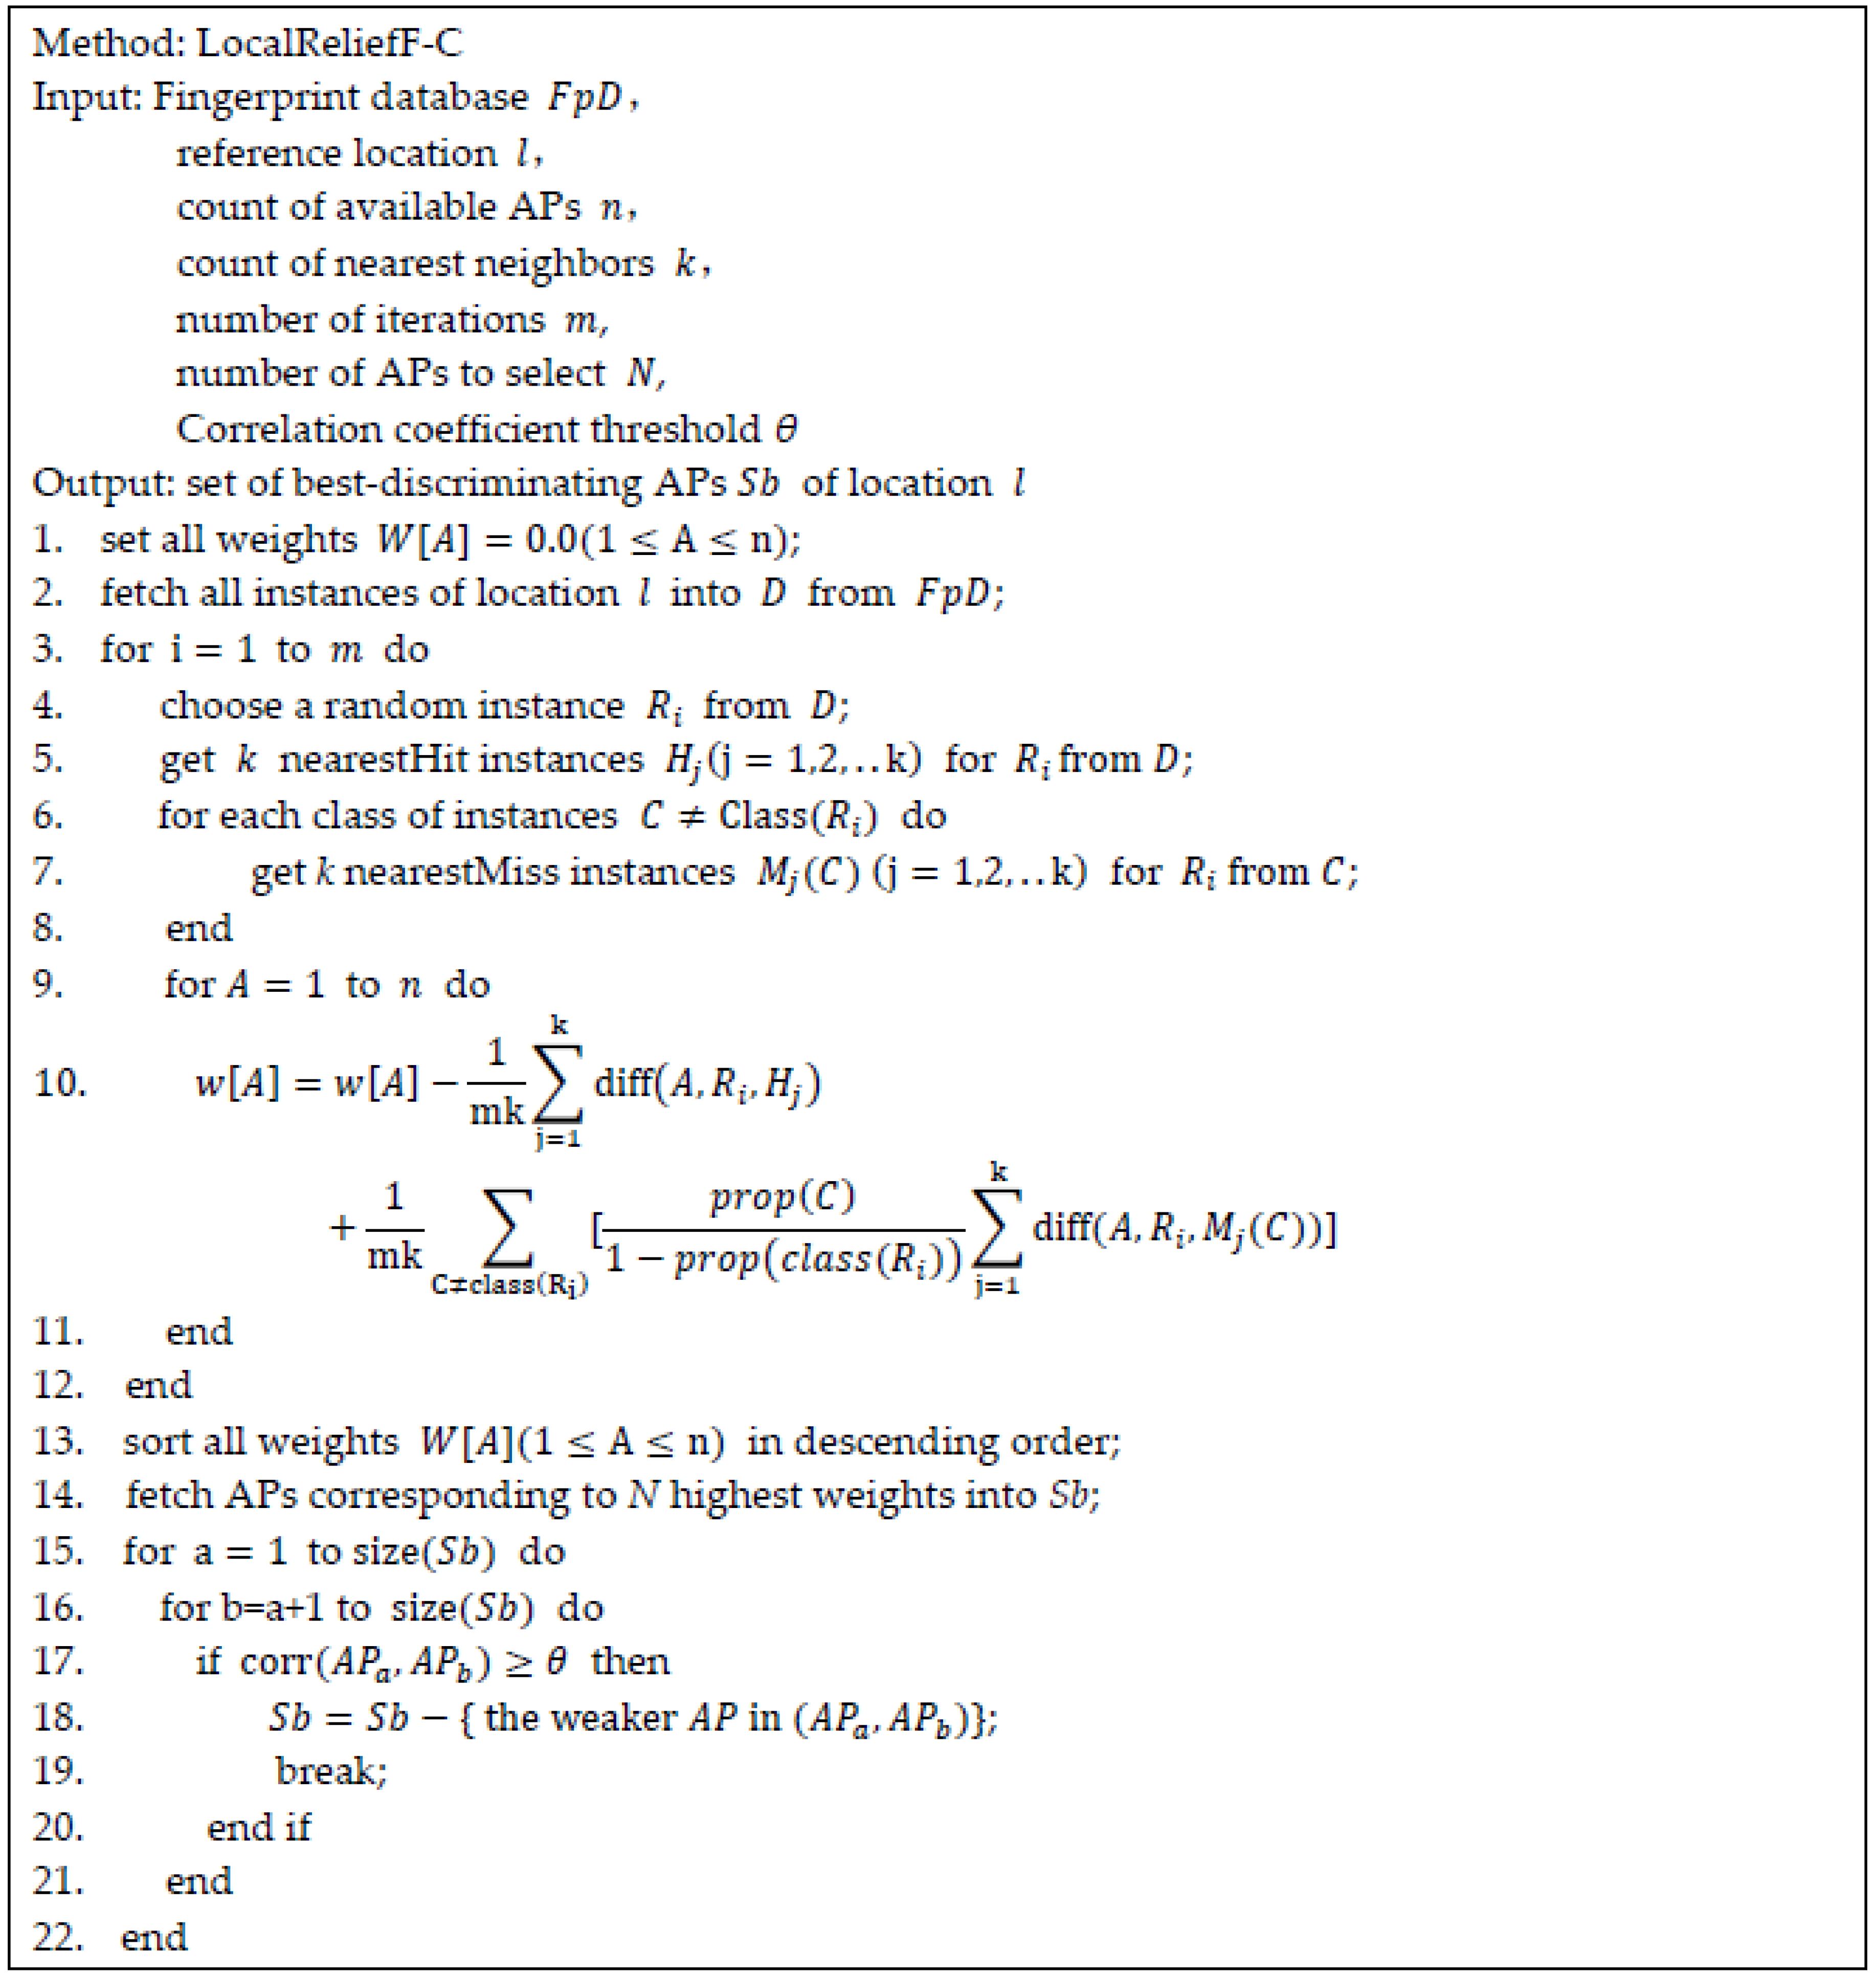
divided by the total number of all instances. Finally, it updates feature weights depending on the weighted contribution of all of the nearest hits and nearest misses. The detailed process of ReliefF is given in
Figure 1 (Lines 3–14).
One disadvantage of ReliefF is that it will select all of the APs with high positioning capability even though some of them are redundant for each other. Aiming at removing redundant APs and obtaining a set of the best-discriminating APs just sufficient for positioning, we have exploited the Pearson correlation coefficient, which is a measure of the degree of linear dependence between two random variables [
22]. It is defined as the covariance of two variables divided by the product of their standard deviations. The formula is as follows:
The Pearson correlation coefficient ranges between −1 and 1. Given two APs, we calculate
, which is the correlation coefficient of their RSS vectors, and compare the absolute value of
with
, the threshold that we set. If
is greater than
, it is assumed that the two APs are significantly correlated, namely redundant for each other. Typical values for
are given in
Section 5.
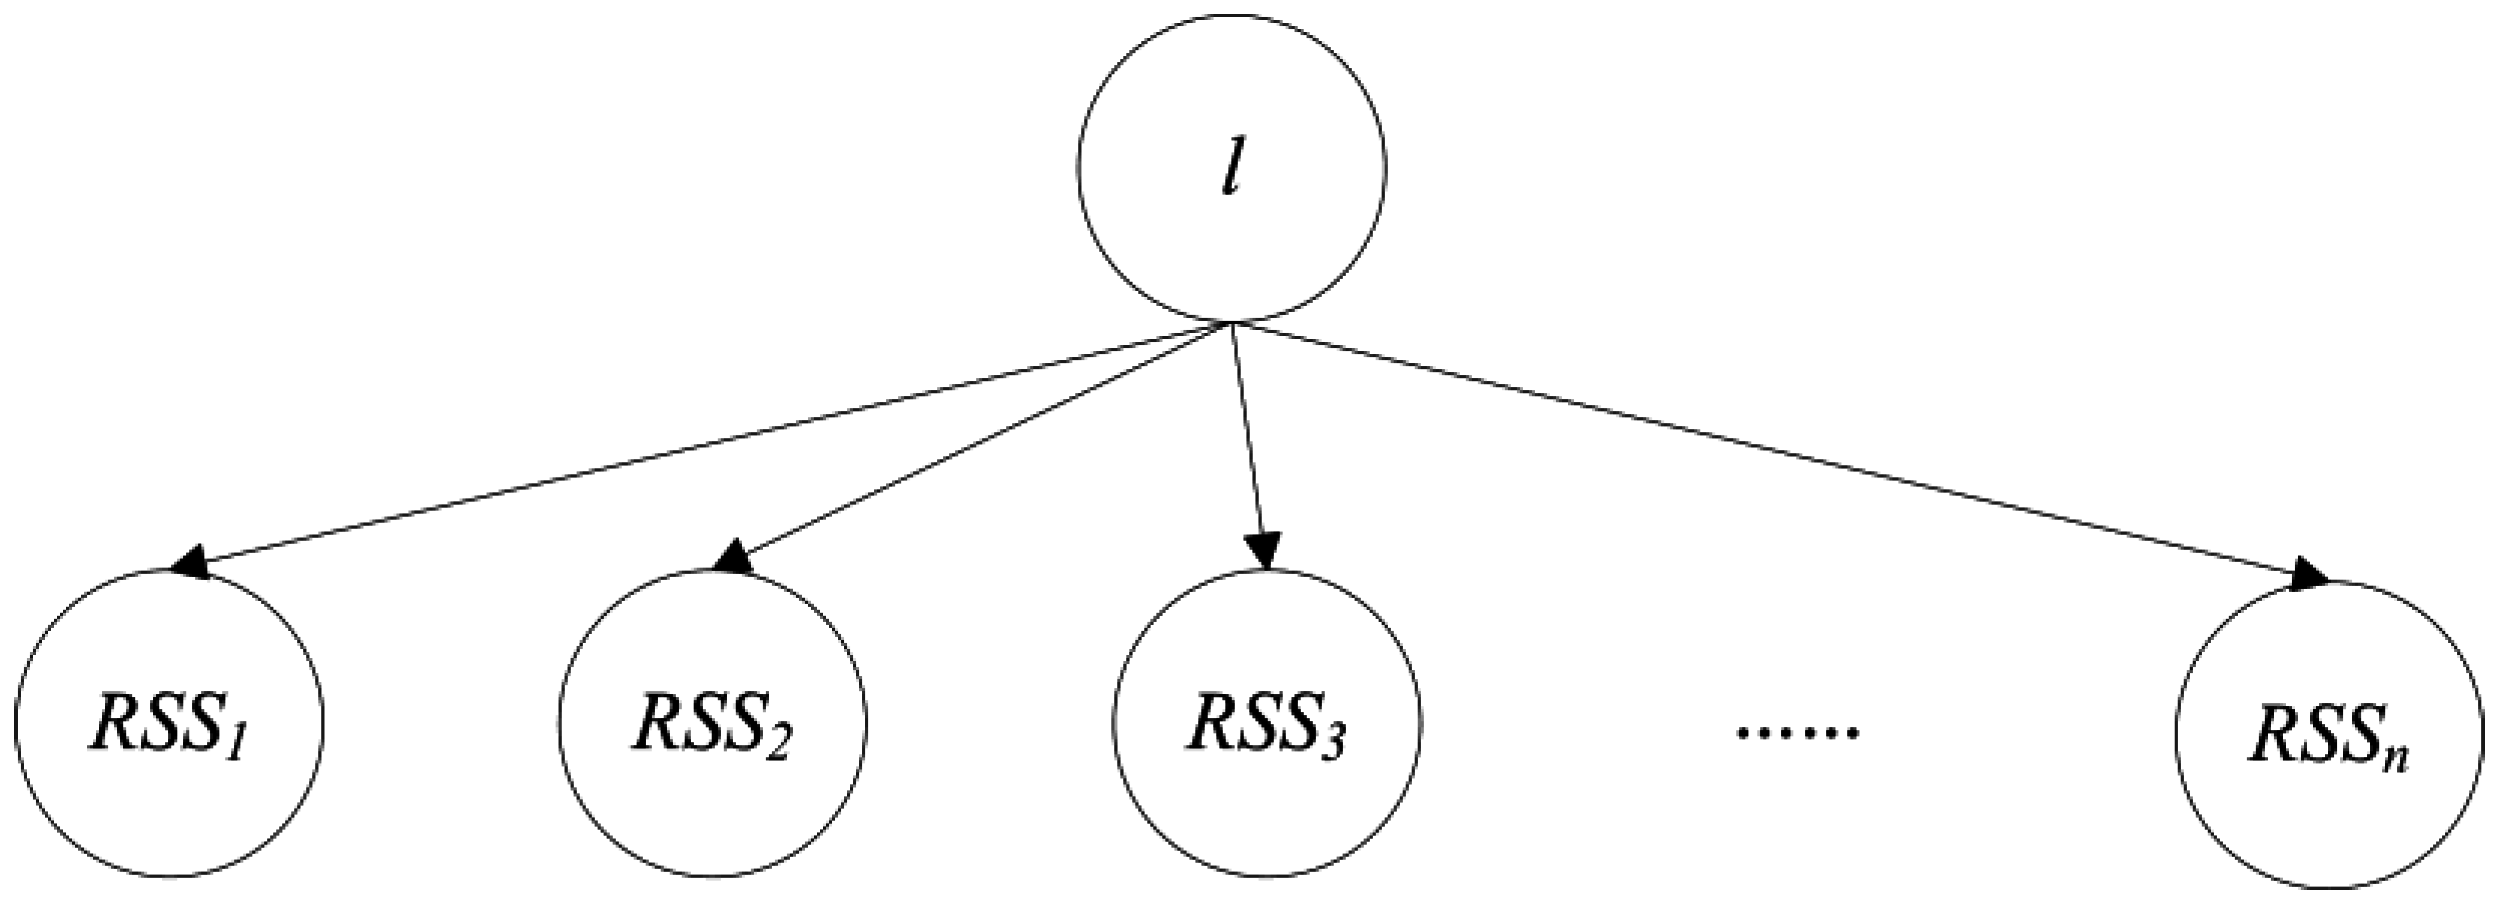
In order to give a detailed description of LocalReliefF-C, the definition of the database is firstly made as follows:
where
represents the i-th instance and
U indicates the count of all of the instances;
refers to the reference location, namely the class label of instances;
, which is an
-dimension vector consisting of the received signal strengths from each AP at the reference location
; and
refers to the count of available APs. In the machine learning method, each AP is treated as a feature. A weight
W is assigned to each AP, which measures its discriminating ability, namely the positioning capacity. The pseudo-code of LocalReliefF-C is displayed in
Figure 1. The method firstly calculates the weight for each AP (Lines 1–12), then sorts the weights in a descending order and, finally, retains the
N of the APs in the set
Sb that correspond to the
N highest weights (Lines 13–14). Afterwards, it traverses the set
Sb to calculate the correlation coefficients for every two APs and obtains the final set of best-discriminating APs after removing the redundant ones (Lines 15–22).
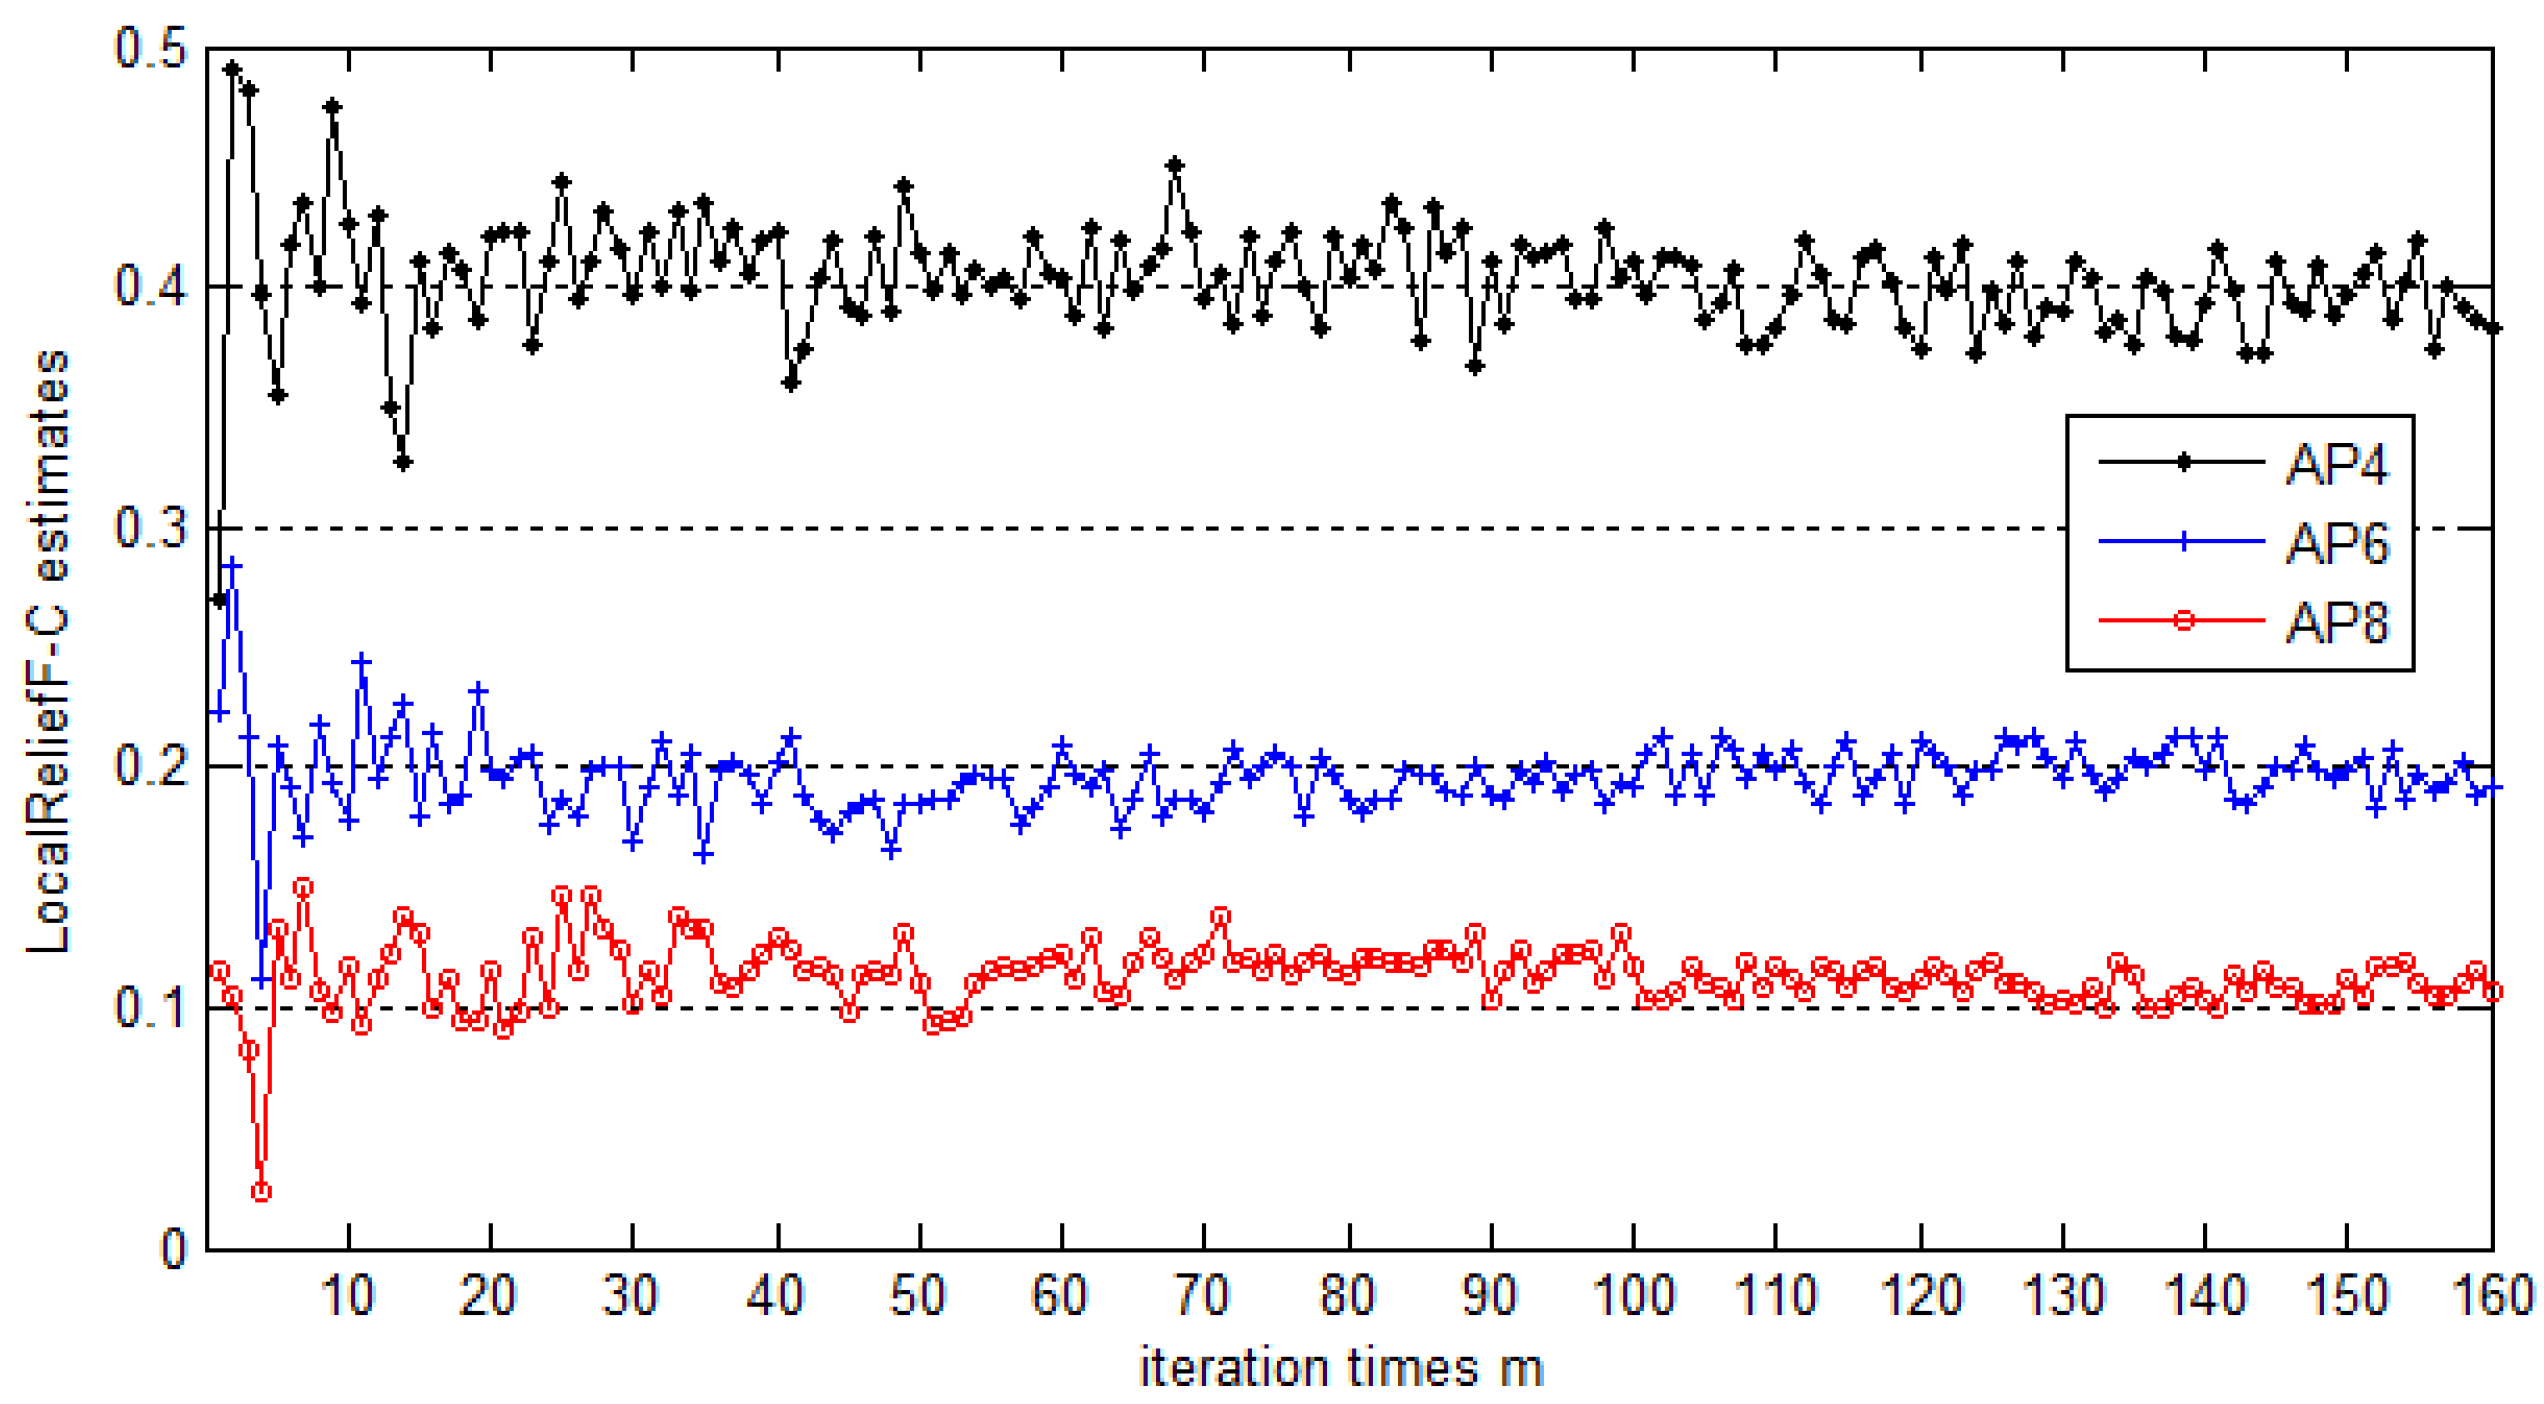
In
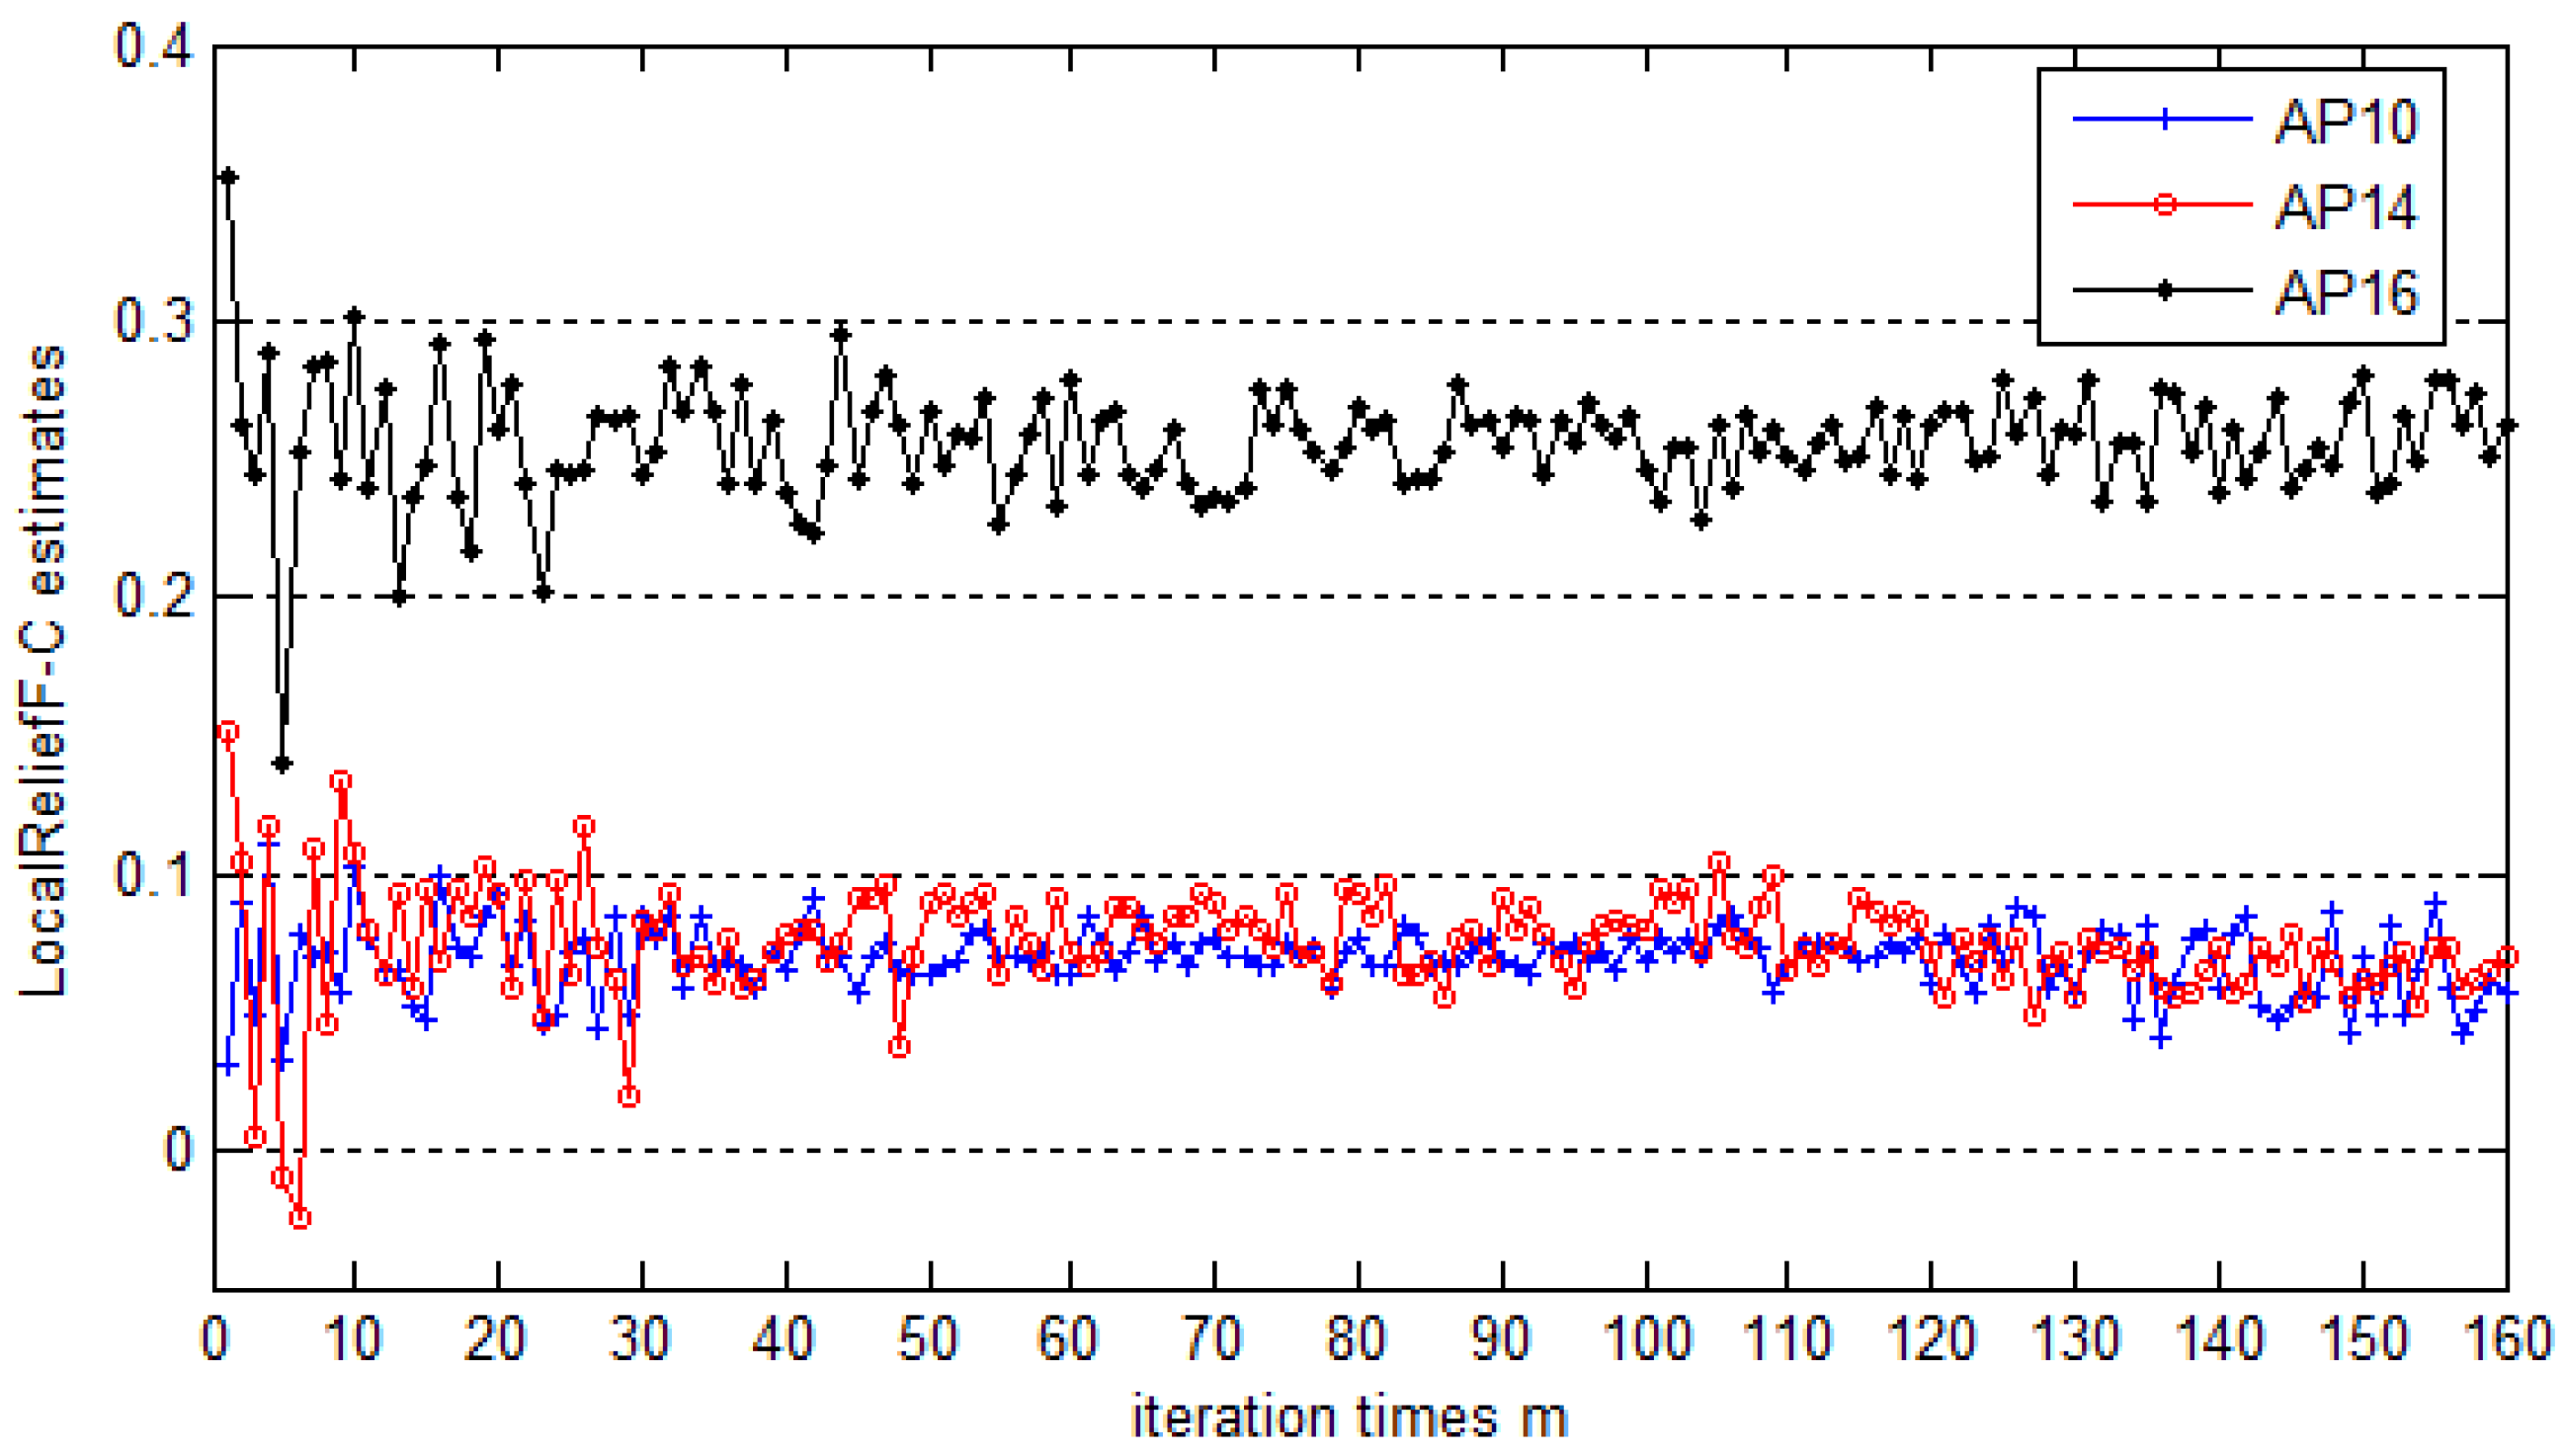
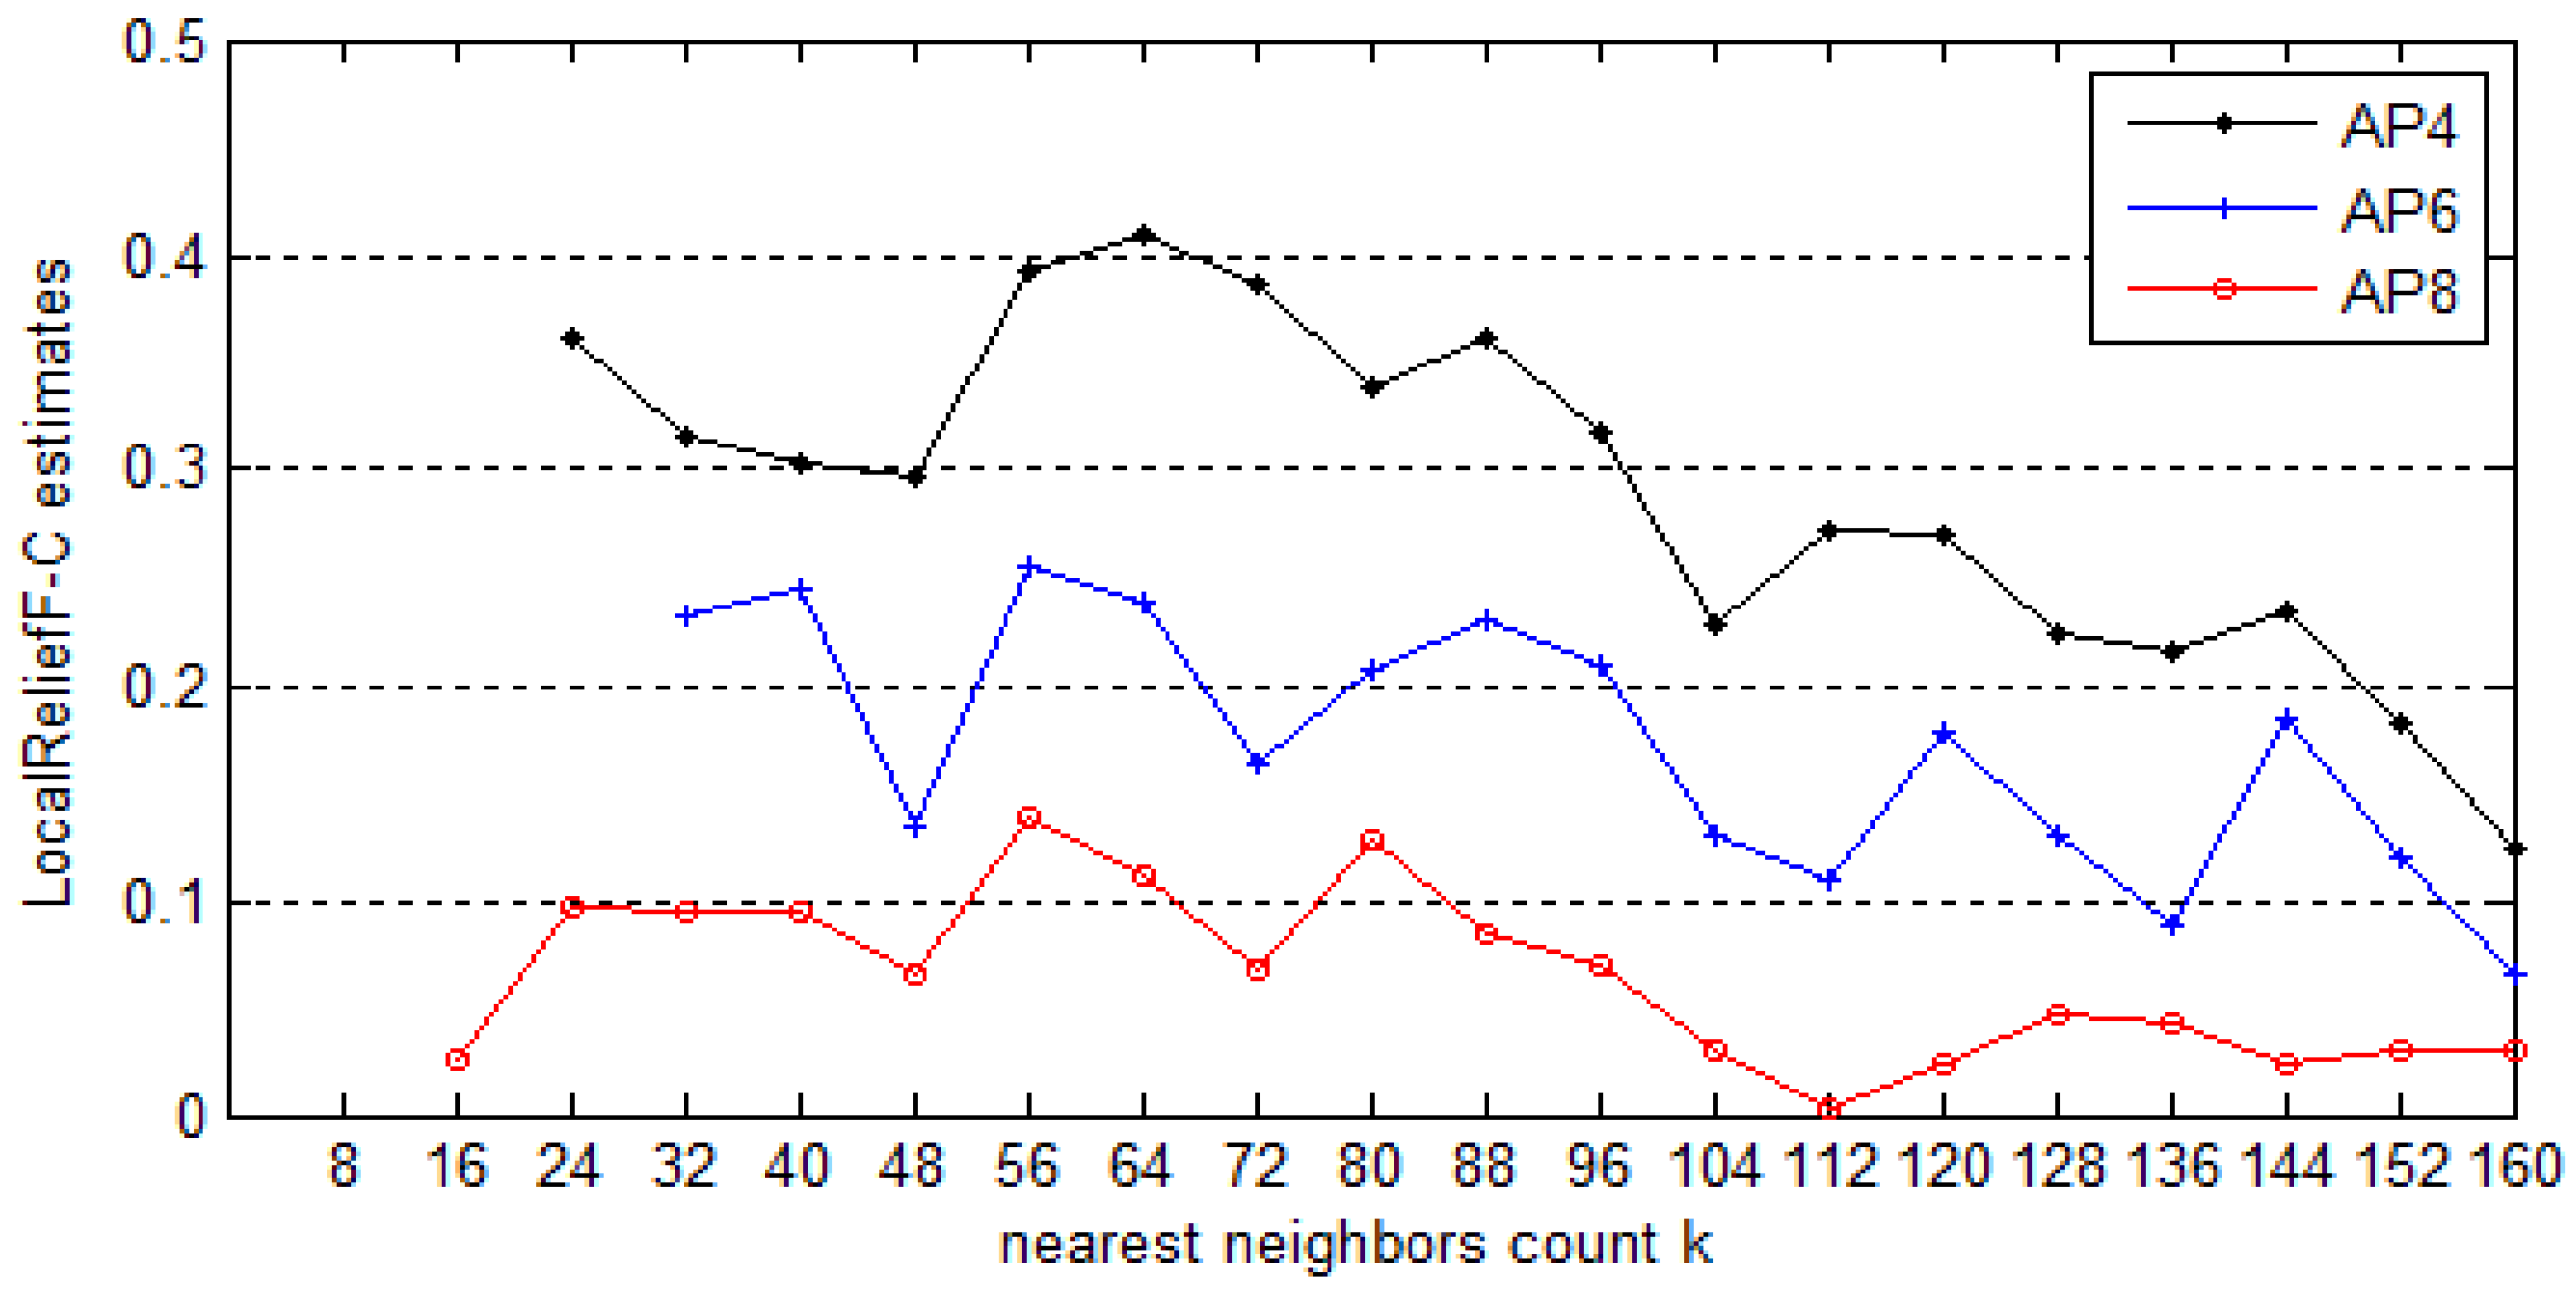
Figure 1, the parameter
k represents the count of nearest neighbors, while
m indicates the number of iterations. Usually, estimated weights climb to maximum values when
k lies in some proper range and then decrease with the increase of
k. In essence,
m represents the coverage degree of the instance space for the algorithm. The greater
m is, the better the performance is. However, the computational complexity of the algorithm increases with the increase of parameter
m. Both of the parameters
m and
k should be set properly. Their typical values are given in
Section 5. The parameter
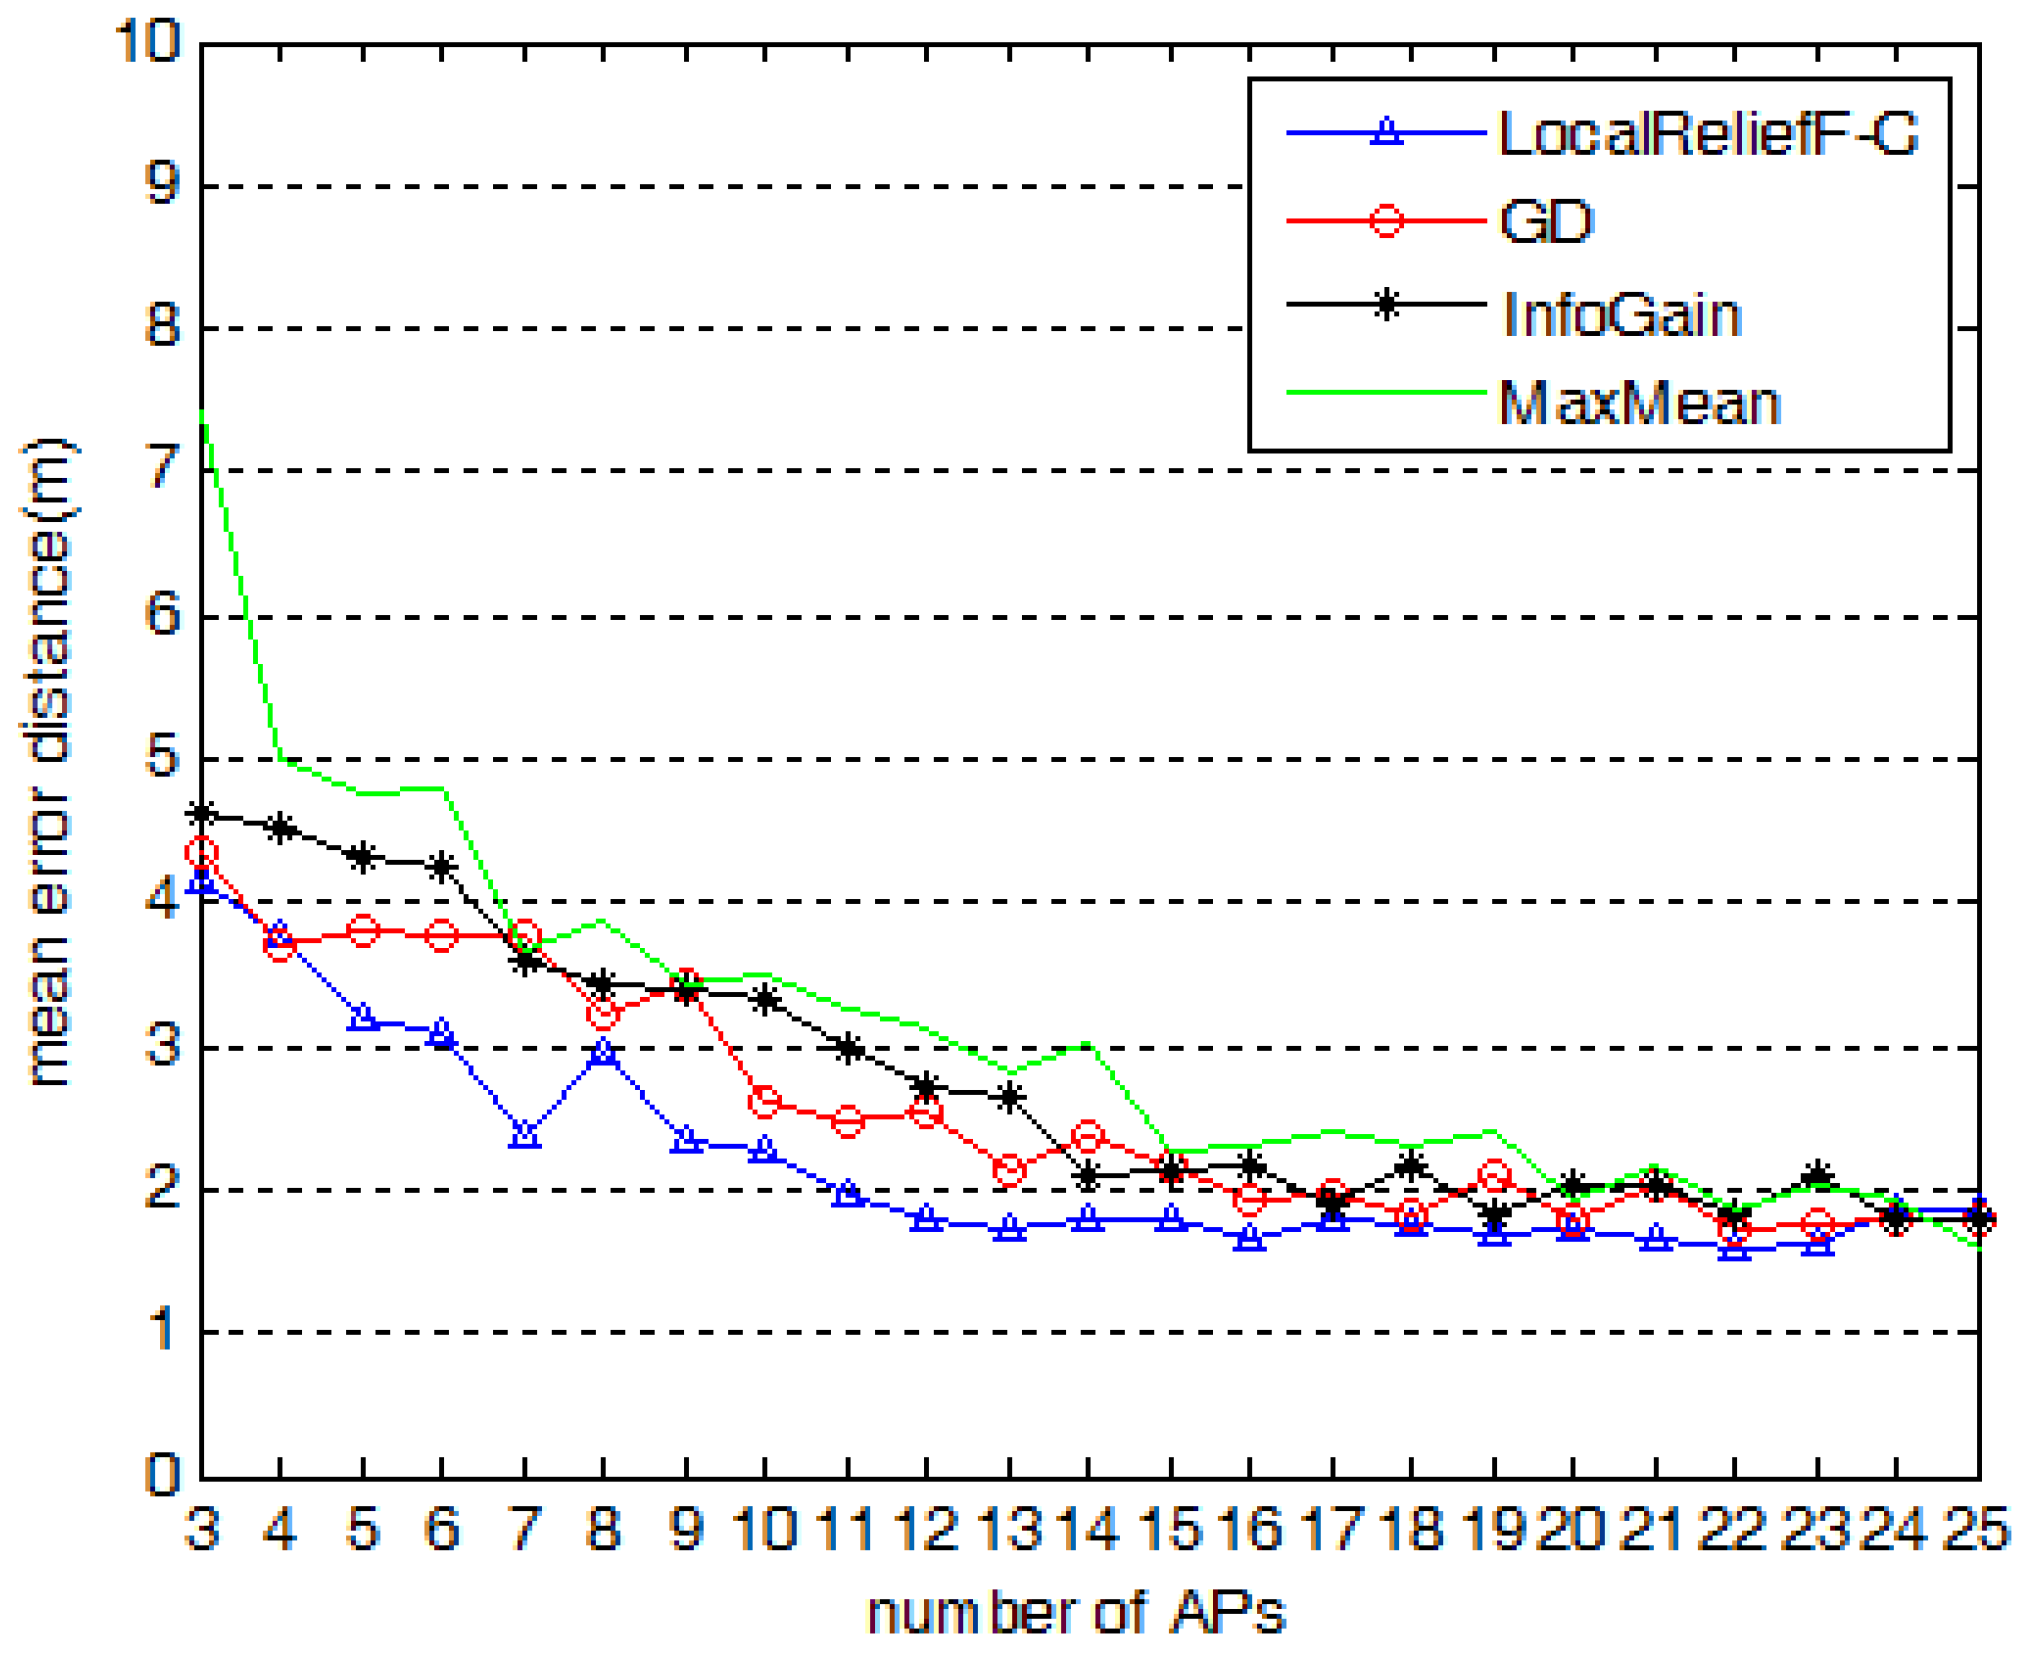
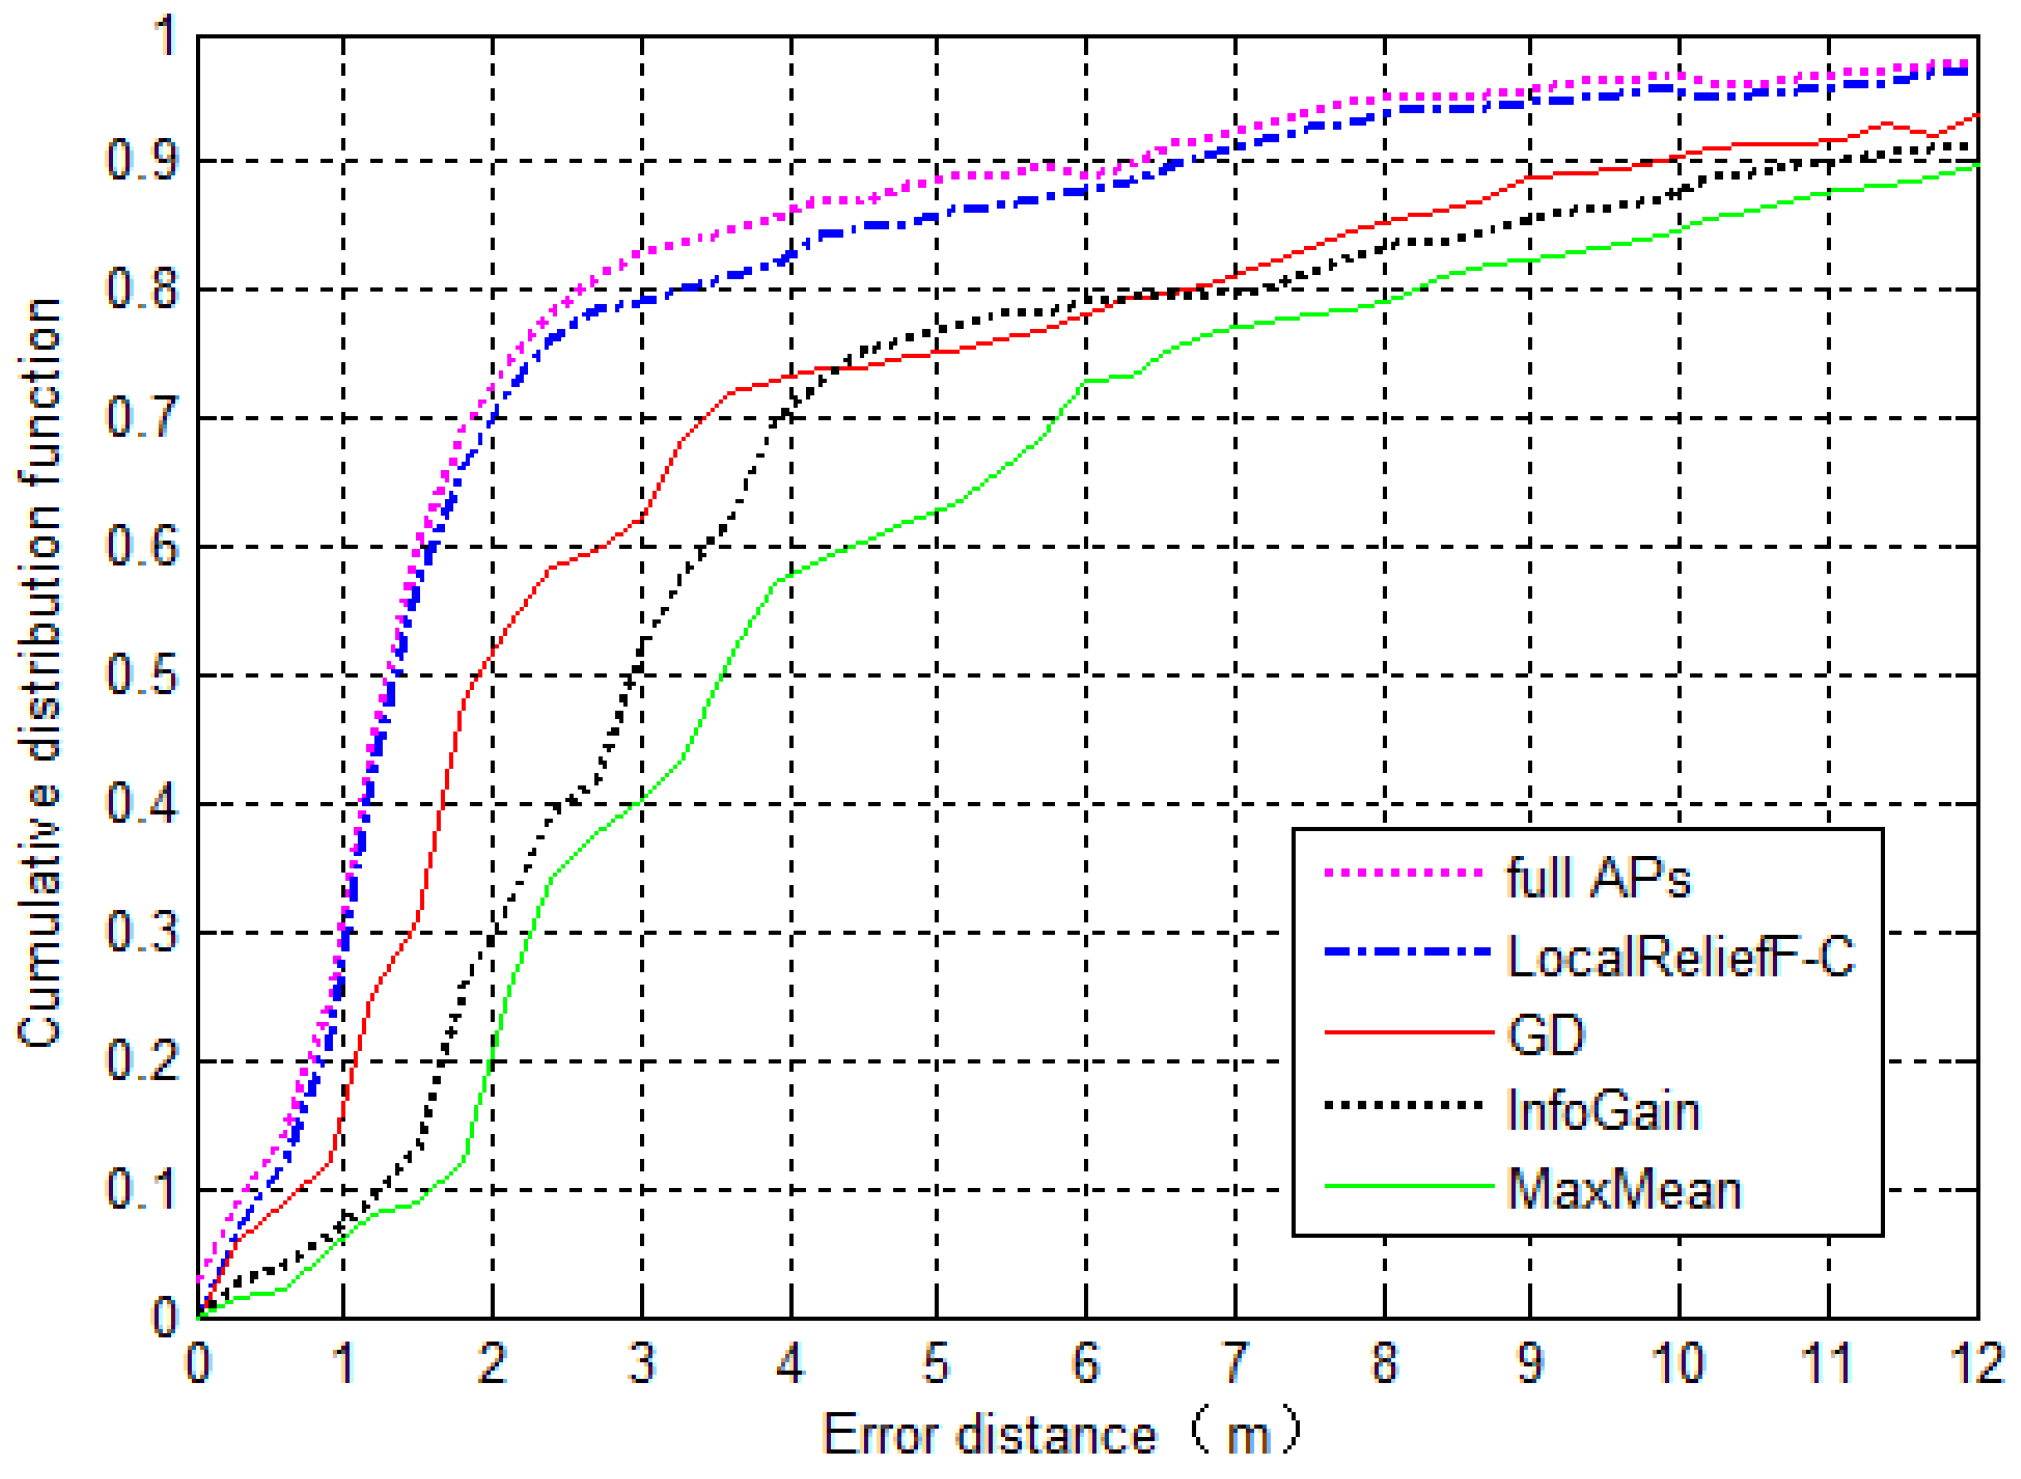
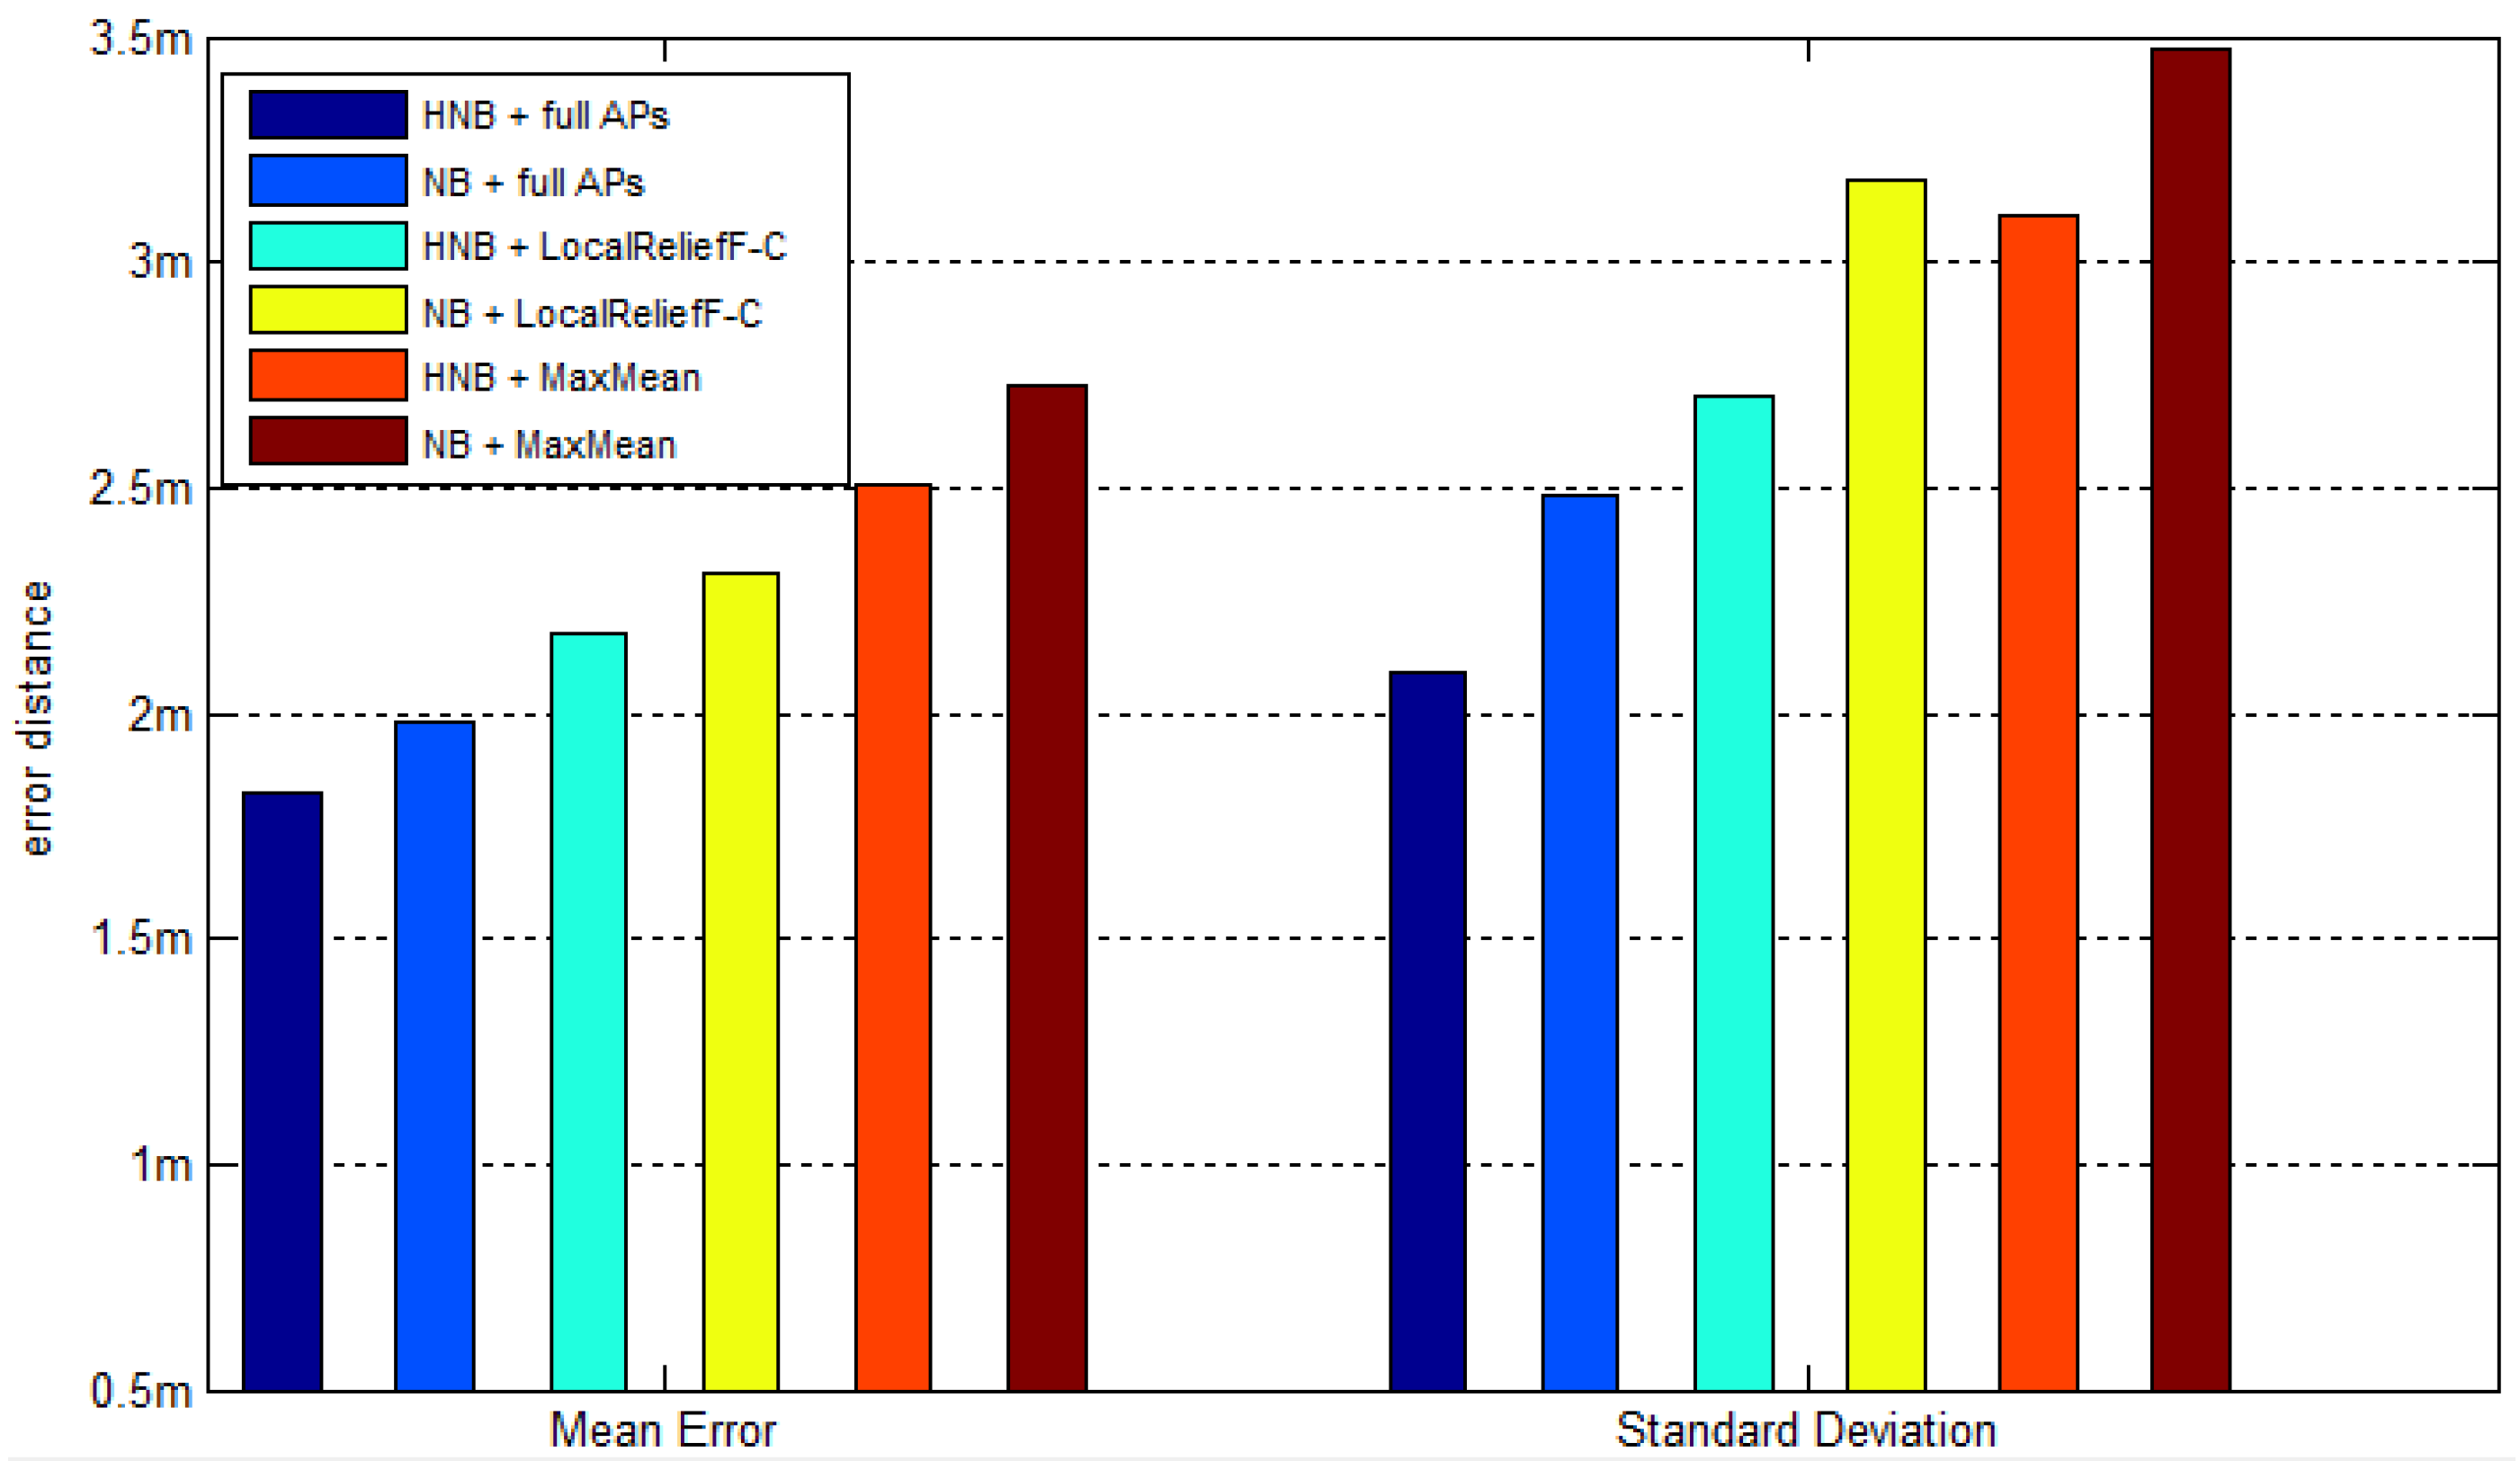
N represents the number of APs to select, which is closely related to the positioning accuracy.
Section 5.4 gives the proposed value of
N and makes the comparison of positioning accuracy between systems using different AP selection methods. In addition, note that in order to find the
k nearest neighbors, we choose the Manhattan distance to measure the distance between two instances. This is defined as the sum of the difference of each feature. Given two instances
, their Manhattan distance is calculated as follows:
Additionally, we have also utilized the well-known Euclidean distance instead of the Manhattan distance. The result shows that it does not make a significant difference for the sorting result of APs’ weights. Furthermore, another point worth noting is that the sets of best-discriminating APs vary with the reference locations, which is just the same as the situation of the strongest AP set in [
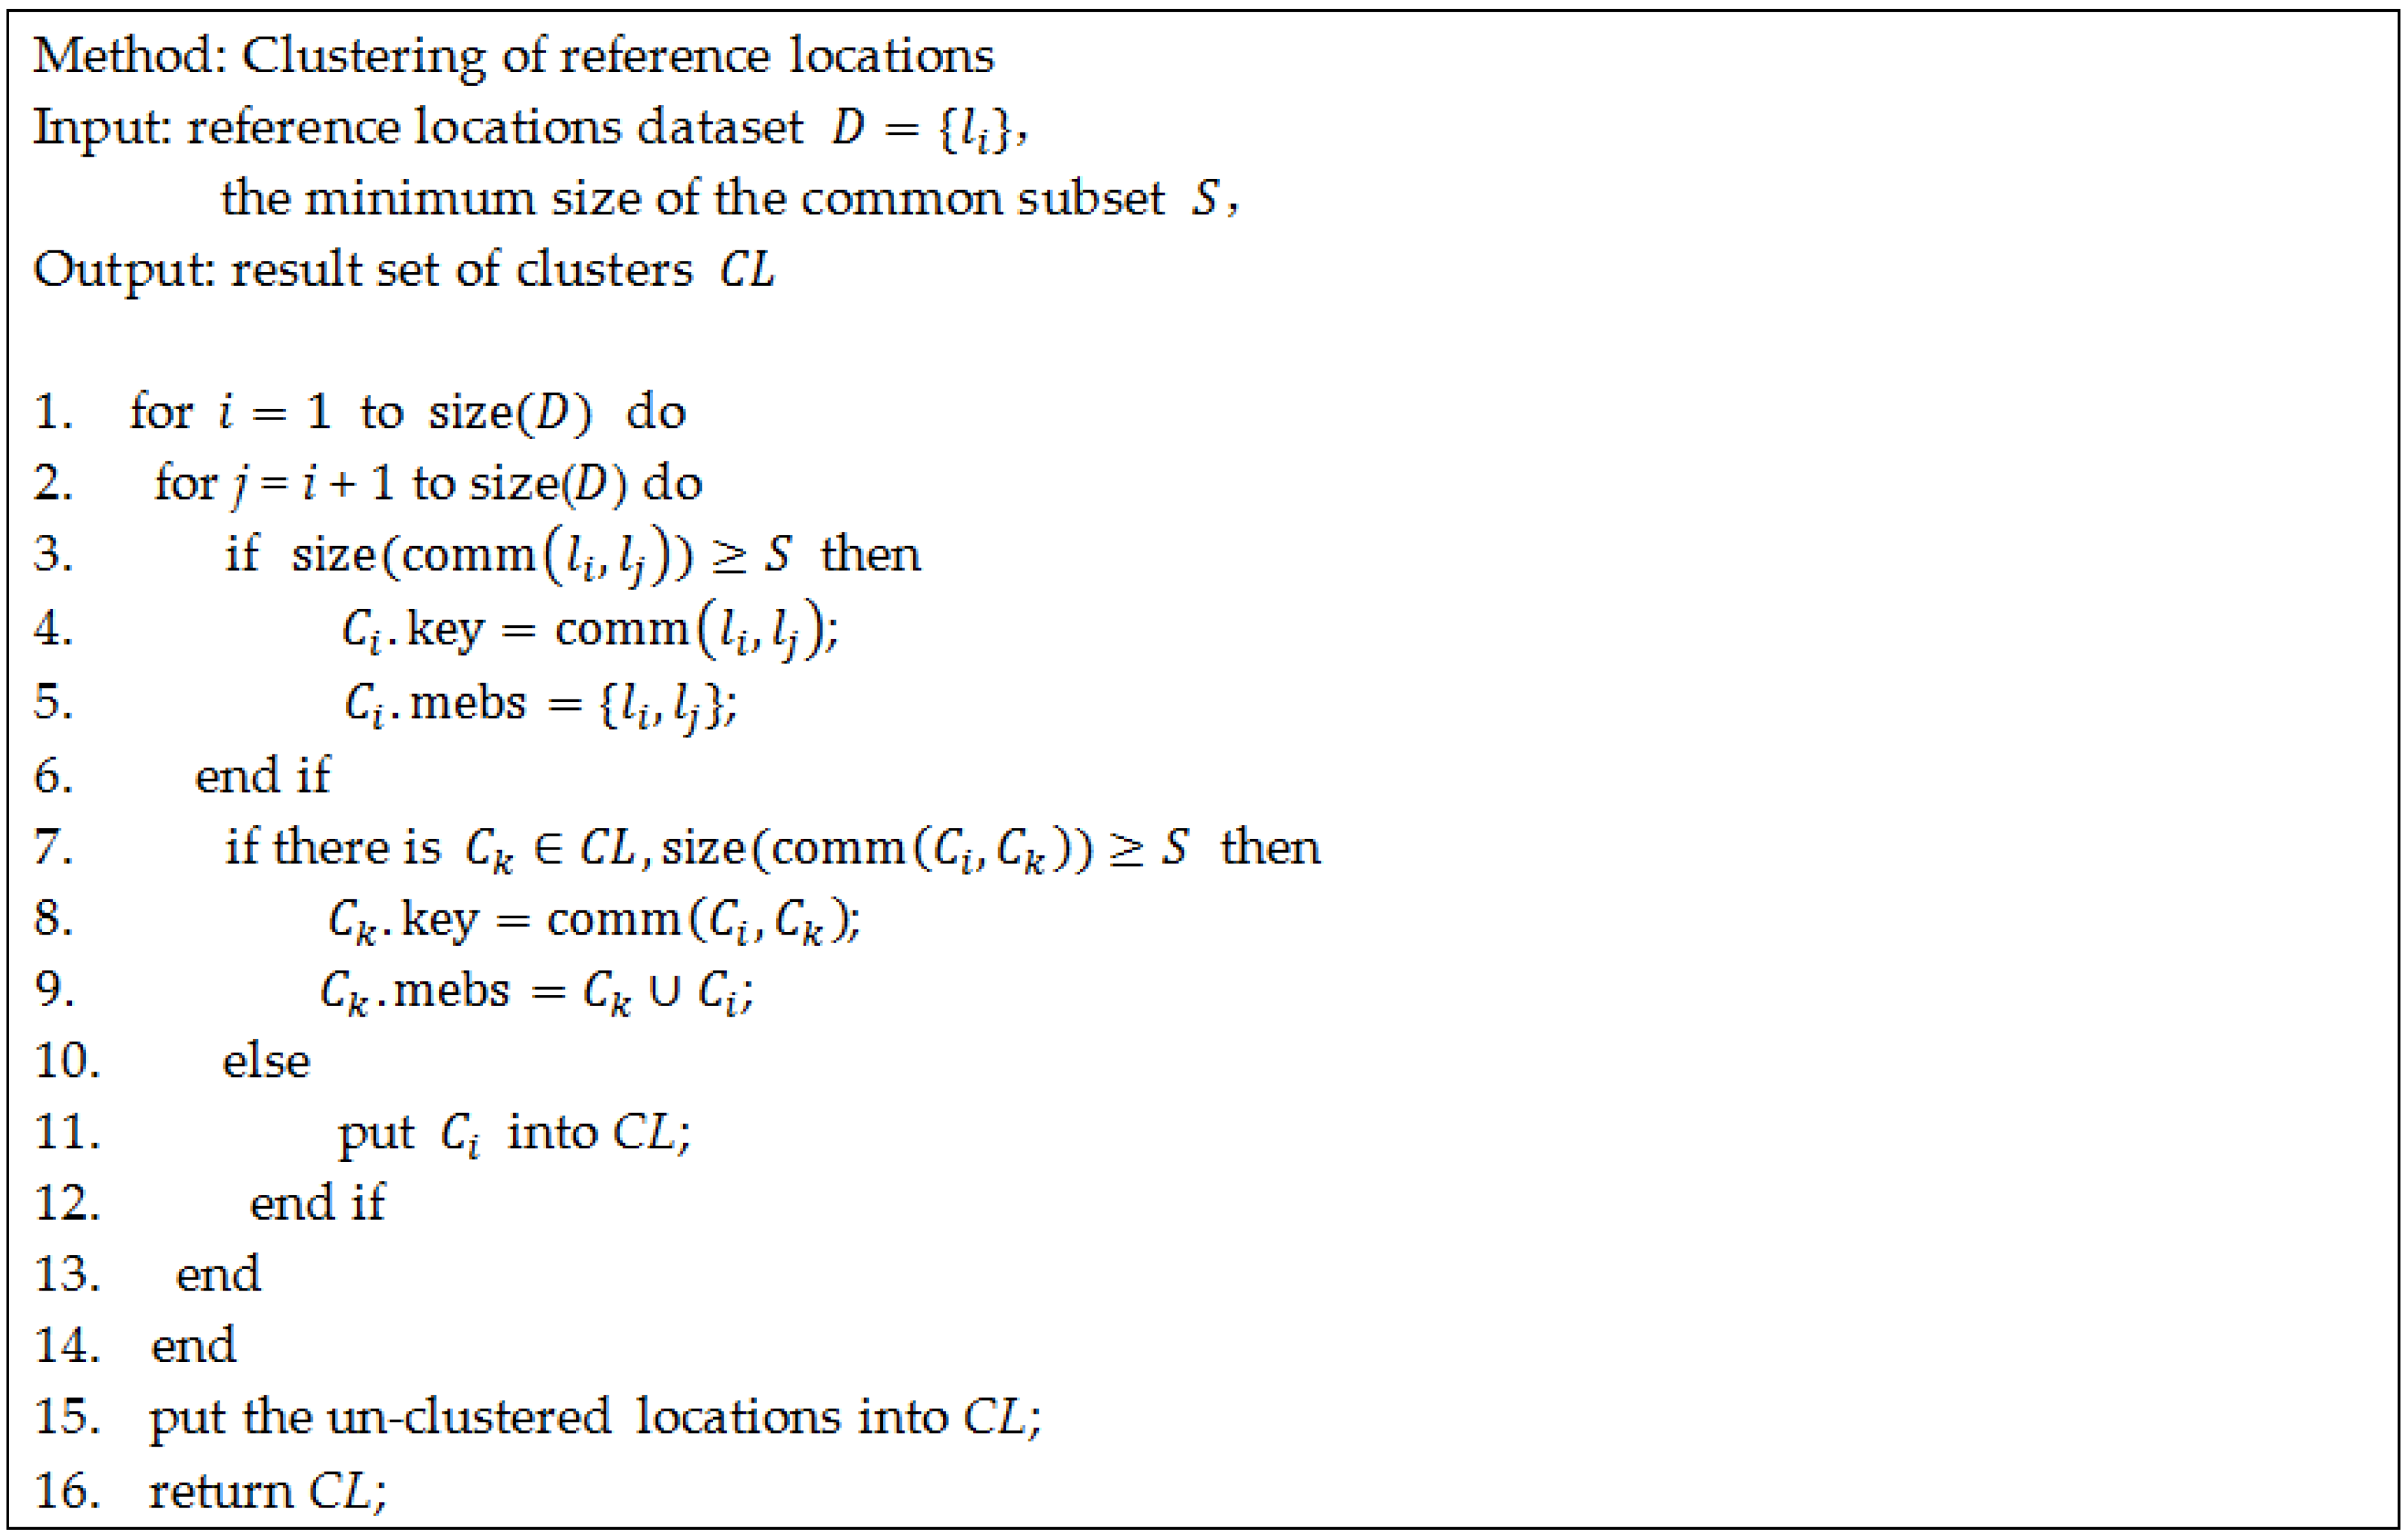
16]. In order to get the different sets of best-discriminating APs of reference locations, LocalReliefF-C improves the process of sampling of ReliefF. It randomly chooses samples in a localized instance space corresponding to the given reference location rather than the whole instance space, as shown in Lines 2–4 of
Figure 1. This is why the term ‘local’ is added to the name of our proposed method. Afterwards, all of the obtained sets of best-discriminating APs are used as a basis for the following clustering process of reference locations.


