Article

A Sensor Web and Web Service-Based Approach for Active Hydrological Disaster Monitoring

1
State Key Laboratory of Information Engineering in Surveying, Mapping and Remote Sensing (LIESMARS), Wuhan University, 129 Luoyu Road, Wuhan 430079, China
2
Key Laboratory of Poyang Lake Wetland and Watershed Research, Ministry of Education, Jiangxi Normal University, Nanchang 330022, China
3
School of Remote Sensing and Information Engineering, Wuhan University, 129 Luoyu Road, Wuhan 430079, China
4
Collaborative Innovation Center of Geospatial Technology, 129 Luoyu Road, Wuhan 430079, China
*
Author to whom correspondence should be addressed.
ISPRS Int. J. Geo-Inf. 2016, 5(10), 171; https://doi.org/10.3390/ijgi5100171
Submission received: 27 May 2016 / Revised: 13 September 2016 / Accepted: 21 September 2016 / Published: 24 September 2016
(This article belongs to the Special Issue Geosensor Networks and Sensor Web)

Abstract

:
Rapid advancements in Earth-observing sensor systems have led to the generation of large amounts of remote sensing data that can be used for the dynamic monitoring and analysis of hydrological disasters. The management and analysis of these data could take advantage of distributed information infrastructure technologies such as Web service and Sensor Web technologies, which have shown great potential in facilitating the use of observed big data in an interoperable, flexible and on-demand way. However, it remains a challenge to achieve timely response to hydrological disaster events and to automate the geoprocessing of hydrological disaster observations. This article proposes a Sensor Web and Web service-based approach to support active hydrological disaster monitoring. This approach integrates an event-driven mechanism, Web services, and a Sensor Web and coordinates them using workflow technologies to facilitate the Web-based sharing and processing of hydrological hazard information. The design and implementation of hydrological Web services for conducting various hydrological analysis tasks on the Web using dynamically updating sensor observation data are presented. An application example is provided to demonstrate the benefits of the proposed approach over the traditional approach. The results confirm the effectiveness and practicality of the proposed approach in cases of hydrological disaster.

1. Introduction

In the big data era, Earth observation technologies provide powerful capabilities to obtain enormous amounts of diverse geospatial data in an on-demand and continuous fashion [1]. For example, the NASA Earth Observing System Data and Information System (EOSDIS) collects approximate 22 terabytes of data per day via orbital and airborne sensors [2]. Hundreds of Earth-observing satellites are currently in orbit and performing various observation tasks. These satellites, such as Landsat, MODIS, and the GF series, play an important role in monitoring regional water resources by collecting many spatial, spectral, radiation, and time-scale observation products that reflect chlorophyll, suspended solids, and turbidity in the water [3]. The Geospatial Data Abstraction Library (GDAL) is widely used to access and process raster and vector geospatial data [4]. It is an open-source geospatial library that supports the translation and processing of data in common geospatial formats such as GeoTIFF, Arc/Info ASCII Grid, and ESRI Shapefile. The integration of the enhanced GDAL with geographic information systems (GIS) can facilitate the processing of Earth observation data [5]. Hydrological Earth observations can be processed to support the monitoring and analysis of hydrological disasters, such as flood disasters and water pollution. The entire data processing workflow can be accomplished locally or remotely using distributed information infrastructures such as spatial data infrastructures or cyberinfrastructures. Traditionally, desktop GIS software (e.g., ENVI or GRASS) or tools are usually used to process data step by step [6,7]. In a remote approach, large volumes of data and powerful computing resources are encapsulated as services with standard interfaces and protocols to enable Web-based sharing and automatic access, thus significantly enhancing the ability to use online/near-line data over the Web and allowing the widespread automation of data analysis and computation [8].
The Open Geospatial Consortium (OGC) has developed a number of specifications for standardizing geospatial Web services, including the Web Coverage Service (WCS), Web Map Service (WMS), Web Feature Service (WFS), and Web Processing Service (WPS) standards [9]. Consequently, various sensors, geospatial data, and geoprocessing functions can be wrapped into such services according to these standards to promote the widespread sharing of and on-demand access to these resources in a distributed environment. Geospatial Web services can be used in various application domains to enable automatic monitoring and analysis [10]. The complex geoprocessing associated with existing geospatial data and geoprocessing services can be implemented as service chains to perform complex data analysis and computations [11,12,13].
Hydrological disasters can cause tremendous losses of life and property [14,15]. These hazards are defined as violent, sudden, and destructive changes occurring on land, at sea, or in the atmosphere and are characterized as emergency events [16]. Active hydrological disaster monitoring is important for discovering hazard states and tracking their evolution. Formulating strategies for hydrological disaster monitoring includes not only the development of hydrological models and programs but also the integration of Web-related technologies and traditional hydrological methods. For example, the Simulation of Hydrological Extreme Events (SHEE) software has been developed to display, analyse and interpret hydrological processes (e.g., spatial and temporal rainfall distributions, soil moisture states and water routing tendencies) in watersheds based on records of rainfall and flow [17,18]. Traditional distributed hydrological models, such as the TOPography-based hydrological MODEL (TOPMODEL) [19], the MIKE SHE model [20] and grid-based distributed hydrological models (GB models) [21], are continually being improved to enhance their performance and practicality for predicting watershed runoffs, simulating water flows and forecasting floods [22,23,24]. With advancements in Web-related technologies, Web service technologies have begun to be used in hydrological risk management and disaster monitoring to provide an integrated solution for disaster warning, data collection, data processing, and results visualization. Adhering to the Web service approach, TOPMODEL has been implemented in the form of Web services that can be easily accessed through the OGC WPS interface and protocol over the web [25,26,27]. A rainfall–runoff model LISFLOOD [28], which is a GIS-based distributed model, has been proposed for the simulation of runoff and flooding in hydrological processes [29]. DP Ames et al. have presented the design and implementation of a Web service-based software package named HydroDesktop for discovering, downloading, managing, visualizing, and analysing hydrological data [30]. Several researchers are committed to introducing specific data platforms (e.g., the Malawi Spatial Data Platform (MASDAP)) that couple GIS technologies with hydrological processes to perform step-by-step analyses [31]. Sensor Web technologies can provide real-time or near-real-time observations to support disaster management [32]. The OGC Sensor Web Enablement (SWE) framework is employed in hydrological hazard monitoring and is used to make multi-source heterogeneous Sensor Web resources (e.g., sensors, sensor services, observations, and events) available on the Web [33]. To meet the requirements for the monitoring of various hydrological scenarios, these Sensor Web resources are executed in on-demand combinations to enable users to access hydrological information in a timely fashion. The contribution of this paper is to integrate the SWE and WPS components to allow hydrological observations to be linked to appropriate geoprocessing services on demand to perform active processing.
Once a hydrological hazard event occurs, a key challenge is to achieve a timely response to that event and perform automatic geoprocessing for hydrological disaster monitoring. This paper presents a Sensor Web and Web service-based approach for active hydrological disaster monitoring. The proposed approach leverages Sensor Web and Web service technologies and adopts an event-driven mechanism for the online processing of hydrological hazard information. The design and implementation of hydrological Web services are presented. The services are chained into workflows and executed using a workflow engine to enable complex hydrological hazard analyses. The hydrological disaster event of interest is input into an existing workflow tool for automatic triggering of the service chains. Compared with the traditional hydrological analysis approach, the proposed approach supports active event-based processing. An application example is provided to demonstrate the benefits of this approach.
The remainder of the article is organized as follows. Section 2 describes the user requirements of the proposed system and presents the relevant materials and methods. Section 3 introduces the system design and implementation for the proposed approach. Section 4 presents the case study. An evaluation and discussion are presented in Section 5. Conclusions and guidelines for future work are given in Section 6.

2. Materials and Methods

2.1. User Requirements

Traditionally, hydrological users download data into desktop computers and use desktop image processing software to process these data. The process of generating decision support information, such as turbidity maps, is often laborious, inefficient, and time-consuming. In addition, the process is difficult for hydrological users who have limited GIS skills and software experience. It would therefore be beneficial to adapt the traditional desktop mapping method into on-demand mapping service to reduce the resource costs and skill requirements on the end-user side.
Information infrastructure technologies (e.g., Sensor Webs, geospatial Web services, and Web-based workflows) offer new tools for hydrological mapping. Hydrological maps can be delivered on demand by chaining distributed geospatial services. These services are chained into workflows and executed using a workflow engine to enable complex hydrological hazard analyses and timely response to hydrological events. To meet the needs of users with different levels of background knowledge and computer skills, different types of service chaining should be developed. The OGC Abstract Service Architecture identifies three types of service chaining: transparent chaining, translucent chaining, and opaque chaining [34]. Transparent chaining, also called user-defined chaining, is often adopted by professionals who are skilled in geospatial analysis and the use of geospatial services. They are able to manage the execution of the chains by themselves. In translucent chaining, also called workflow-managed chaining, workflow engines control the service chains. The invocation of services is hidden, and users focus on the formulation of business-level workflows. In opaque chaining, users are completely separated from the backend workflows and services. In the context of hydrological disaster analysis, domain experts can design workflows using workflow tools operating in drag-and-drop mode. These workflow tools bind and invoke services to enact workflows. Once a workflow has been archived and can be accessed as a whole as a new service, general users or decision-makers can use that workflow in the opaque chaining approach by invoking the new service.
Earth observation technologies coordinated with Sensor Webs can support real-time or near-real-time data provision. Distributed geospatial data obtained from Earth observations can be accessed through standard geospatial data services. To perform complex and real-time hydrological monitoring tasks, it is necessary not only to share data and geoprocessing functions over the Web but also to coordinate sensor observations and geoprocessing functions in an event-based manner. The automatic geoprocessing of hydrological hazard events is urgently needed by experts to help them react as soon as possible. An event-driven mechanism can help to achieve this goal.

2.2. Sensor Web and Event-Driven Mechanism

A Sensor Web is a collaborative observation system that is composed of heterogeneous sensors and associated systems [35]. The OGC Sensor Web Enablement (SWE) Architecture defines a set of standard information models and service interfaces for discovering, publishing, and collecting Sensor Web resources [36]. The SWE specifications include the Observations and Measurements (O&M), Transducer Markup Language (TML), Sensor Model Language (SensorML), Sensor Observation Service (SOS), Sensor Planning Service (SPS), Sensor Event Service (SES), and Web Notification Service (WNS) standards. This technology is playing a more and more significant role in disaster management and environmental monitoring [37]. It allows the on-demand provision of real-time or near-real-time observations, thereby enabling live geoprocessing to support a timely response to hydrological hazard events.
Figure 1 shows the typical use of Sensor Web services. In the context of hydrological disaster management, they can be used for event subscription, sensor tasking and observation access. Each user should first register a WNS ID to receive notifications. They can subscribe to certain hydrological events, such as cases in which the water turbidity exceeds a given threshold. The processes by which sensor observations are collected can be divided into two types. One type is based on regular time intervals, and the other is based on notifications from a WNS service. In the example of Figure 1, SOS1 is defined to provide in situ sensor observations at regular time intervals. The SES will continuously monitor observations from in situ sensors obtained through SOS1. When it finds observations exceeding a specified threshold, it will notify users through the WNS. Users can assign satellite sensors observations tasks through the SPS. When the planned sensors are in place, the SPS will instruct the WNS to send a message to the users. Users can then submit GetObservation requests to SOS2 to obtain remote sensing observations. These observations are automatically sent to the WPS for live geoprocessing.
Generally, an event is defined as anything that occurs or is triggered by certain factors [38]. In the Sensor Web environment, each observation can be defined as an event. There are four logical layers in the event processing flow, namely, the event generator, the event channel, the event processing engine and the downstream event-driven activity [39]. The event-driven method can play an important role in the management and monitoring of hydrological disasters [40]. Figure 2 illustrates the event-driven mechanism. Users can subscribe to an event with certain filter criteria [41]. These filter criteria will be further encoded as an event pattern that defines rules, such as filters, for event processing. These filters, such as sensor identifiers and observation properties, can be used by the event generator. Sensor observations can be made available in real time or near real time through the SOS interface. These observations are retrieved by regularly sending GetObservation requests to an SOS and then are parsed to produce observation events. These observation events are pushed into an event channel and compared with the threshold specified in the event pattern. An SES can perform filtering based on various criteria, such as threshold values (e.g., a sediment concentration equal to 50 mg/L). Once some observations have passed the threshold, the detection of an event is alerted, and the SES will work with a WNS to activate new sensor observations and geoprocessing workflows. Such an event-driven mechanism is adopted in the proposed approach for hydrological event processing.
The proposed system for active hydrological monitoring relies on standards-based interoperable services. The OGC Web Service standards, including the Sensor Web standards, are typically adopted when developing hydrological Web services [37]. The event-driven mechanism is implemented based on Sensor Web standards such as SOS, SES, and WNS. The processing of the sensor observations follows the WPS standard, which specifies a standard interface and protocol for offering geospatial processing functionalities to clients over the Web. The provision of services following these standards allows the plug-and-play implementation of hydrological Web services and improves the flexibility of service binding for geoprocessing workflows.

3. System Design and Implementation

3.1. Architecture Design

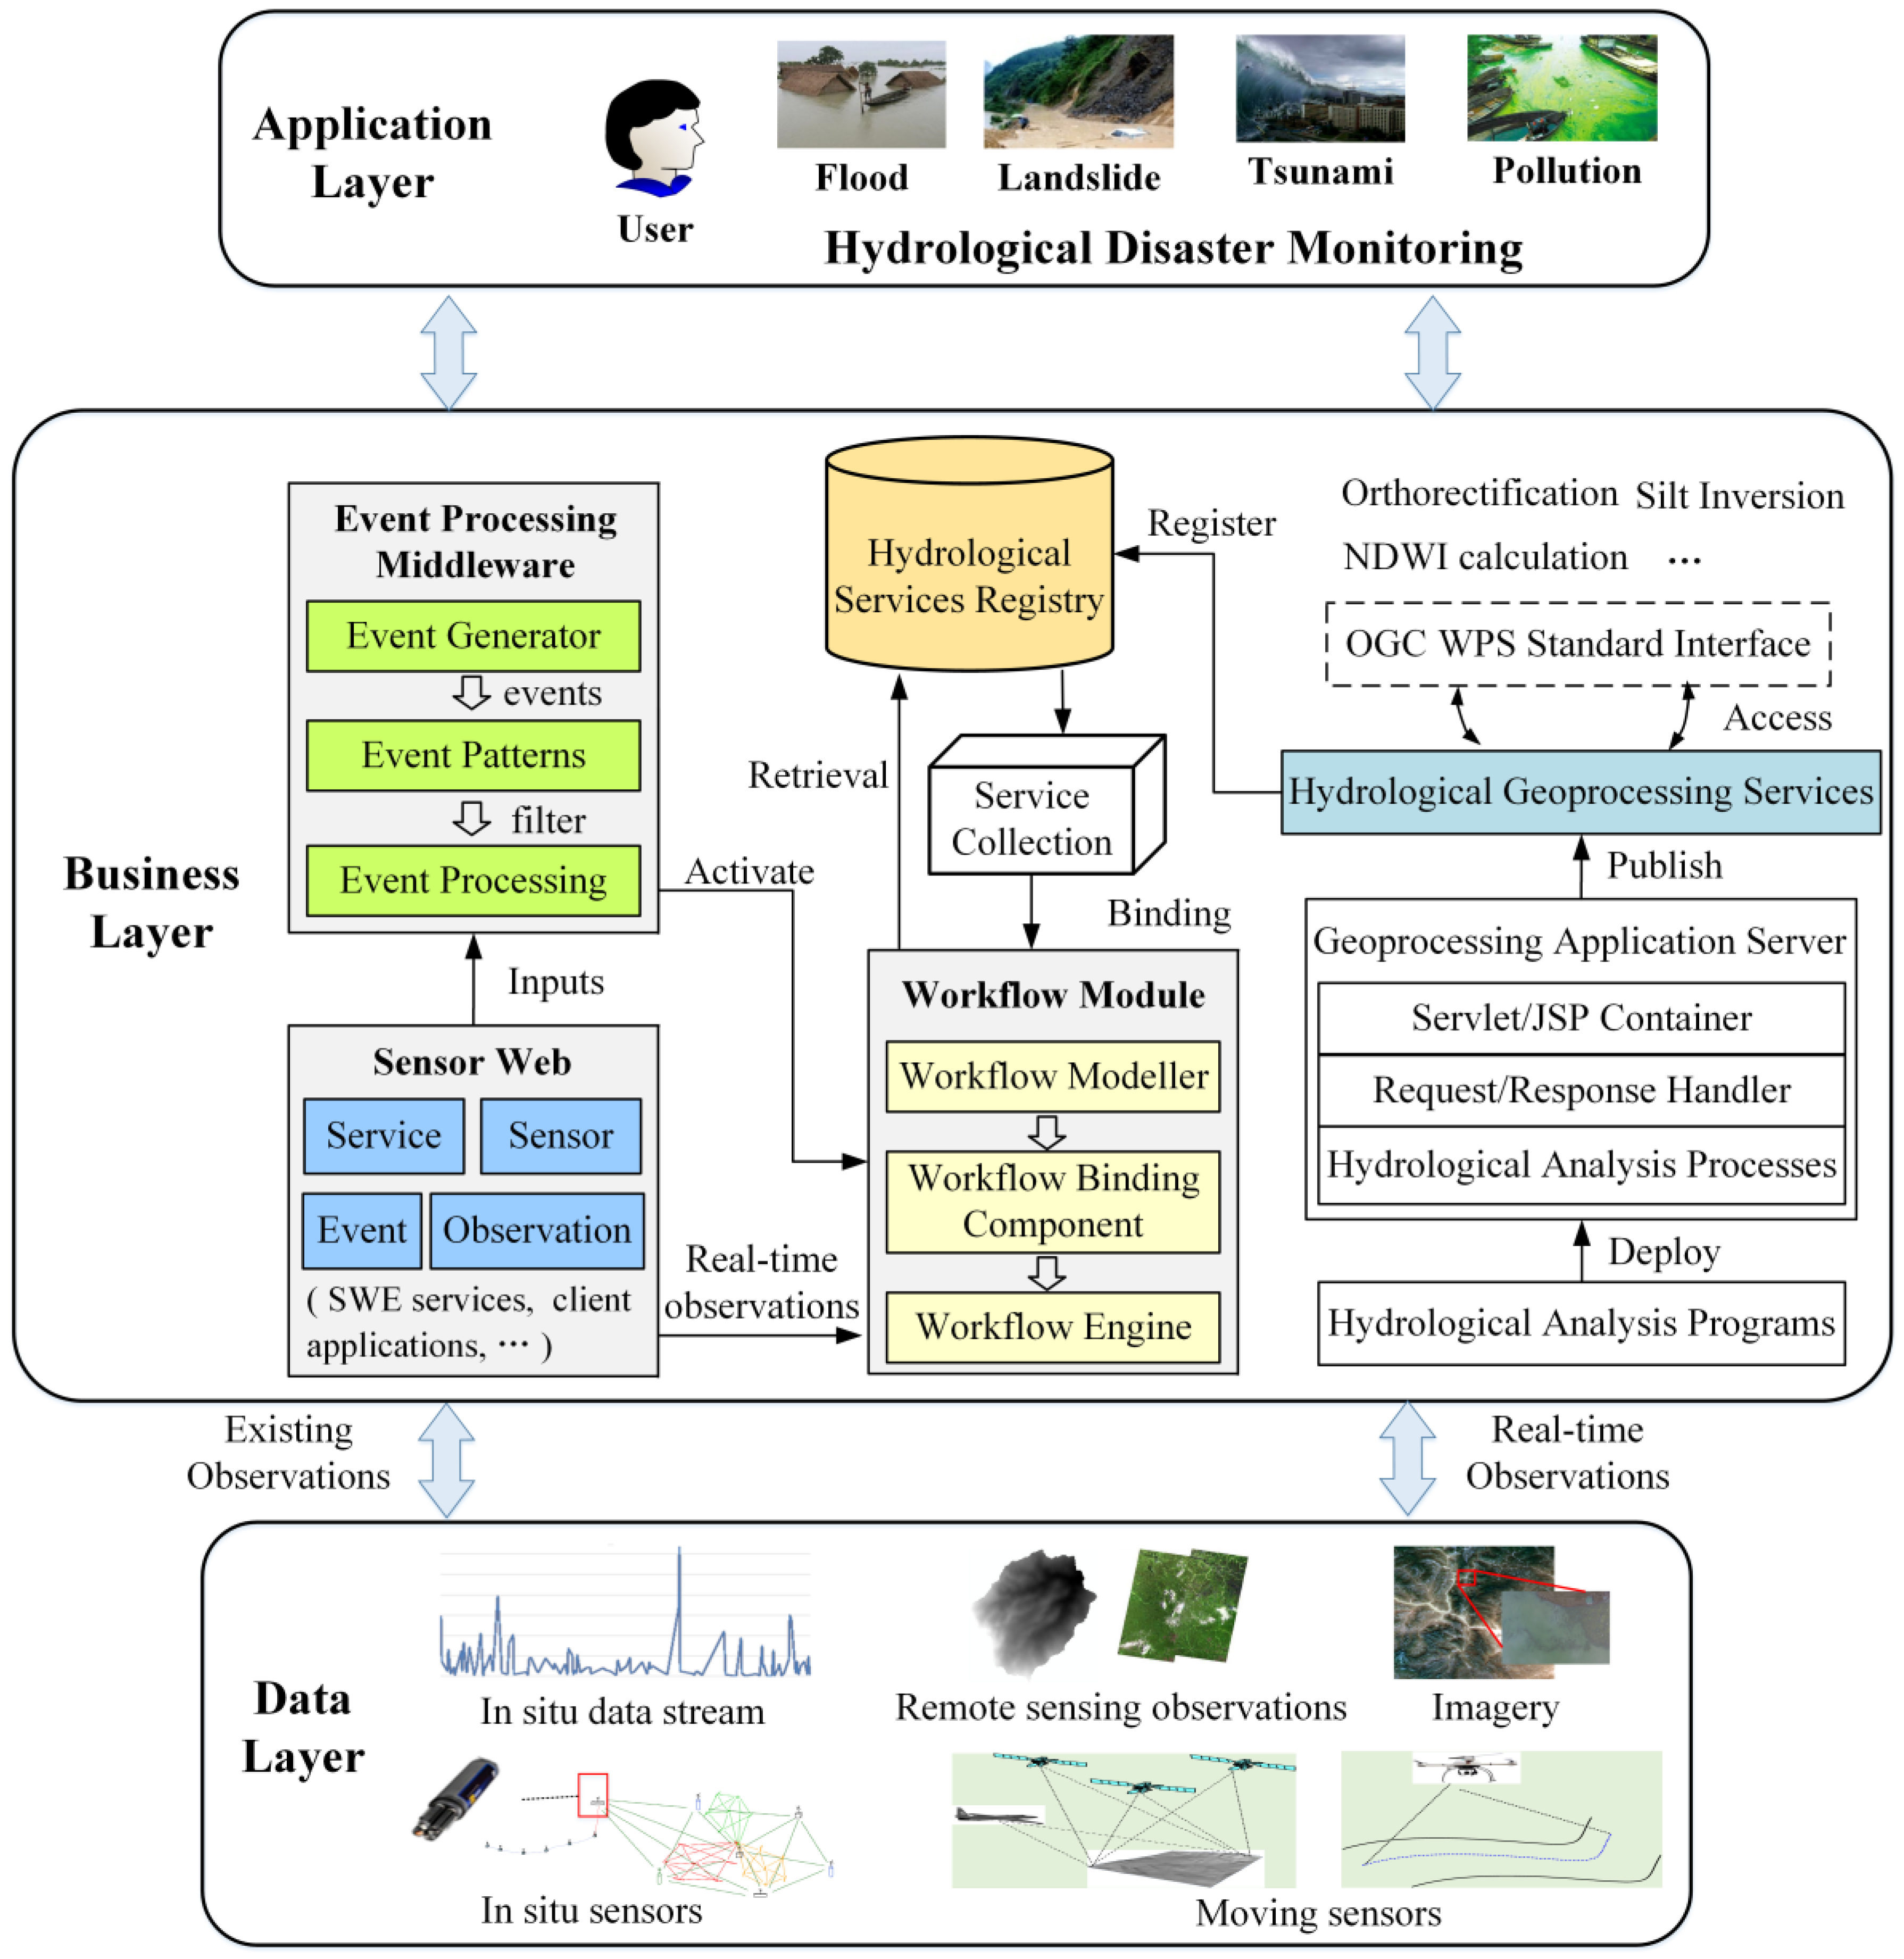
Figure 3 shows the architecture of the Sensor Web-enabled hydrological Web service system. The system not only allows hydrological analysis functions to be wrapped as geoprocessing services following the OGC WPS standard but also enables event-driven integrated geoprocessing on the Web for active hydrological disaster monitoring. A three-tier architecture is adopted in the system, including application, business, and data tiers.
The data tier is responsible for the management and release of real-time and historical observation data from the Sensor Web. Sensor systems in the emerging information cyberinfrastructure can provide various observations from in situ and remote sensors. These observations can be retrieved and accessed using standard operations such as GetObservation requests via the SOS interface. Observation data and data URLs are returned to clients based on standard information transmission protocols.
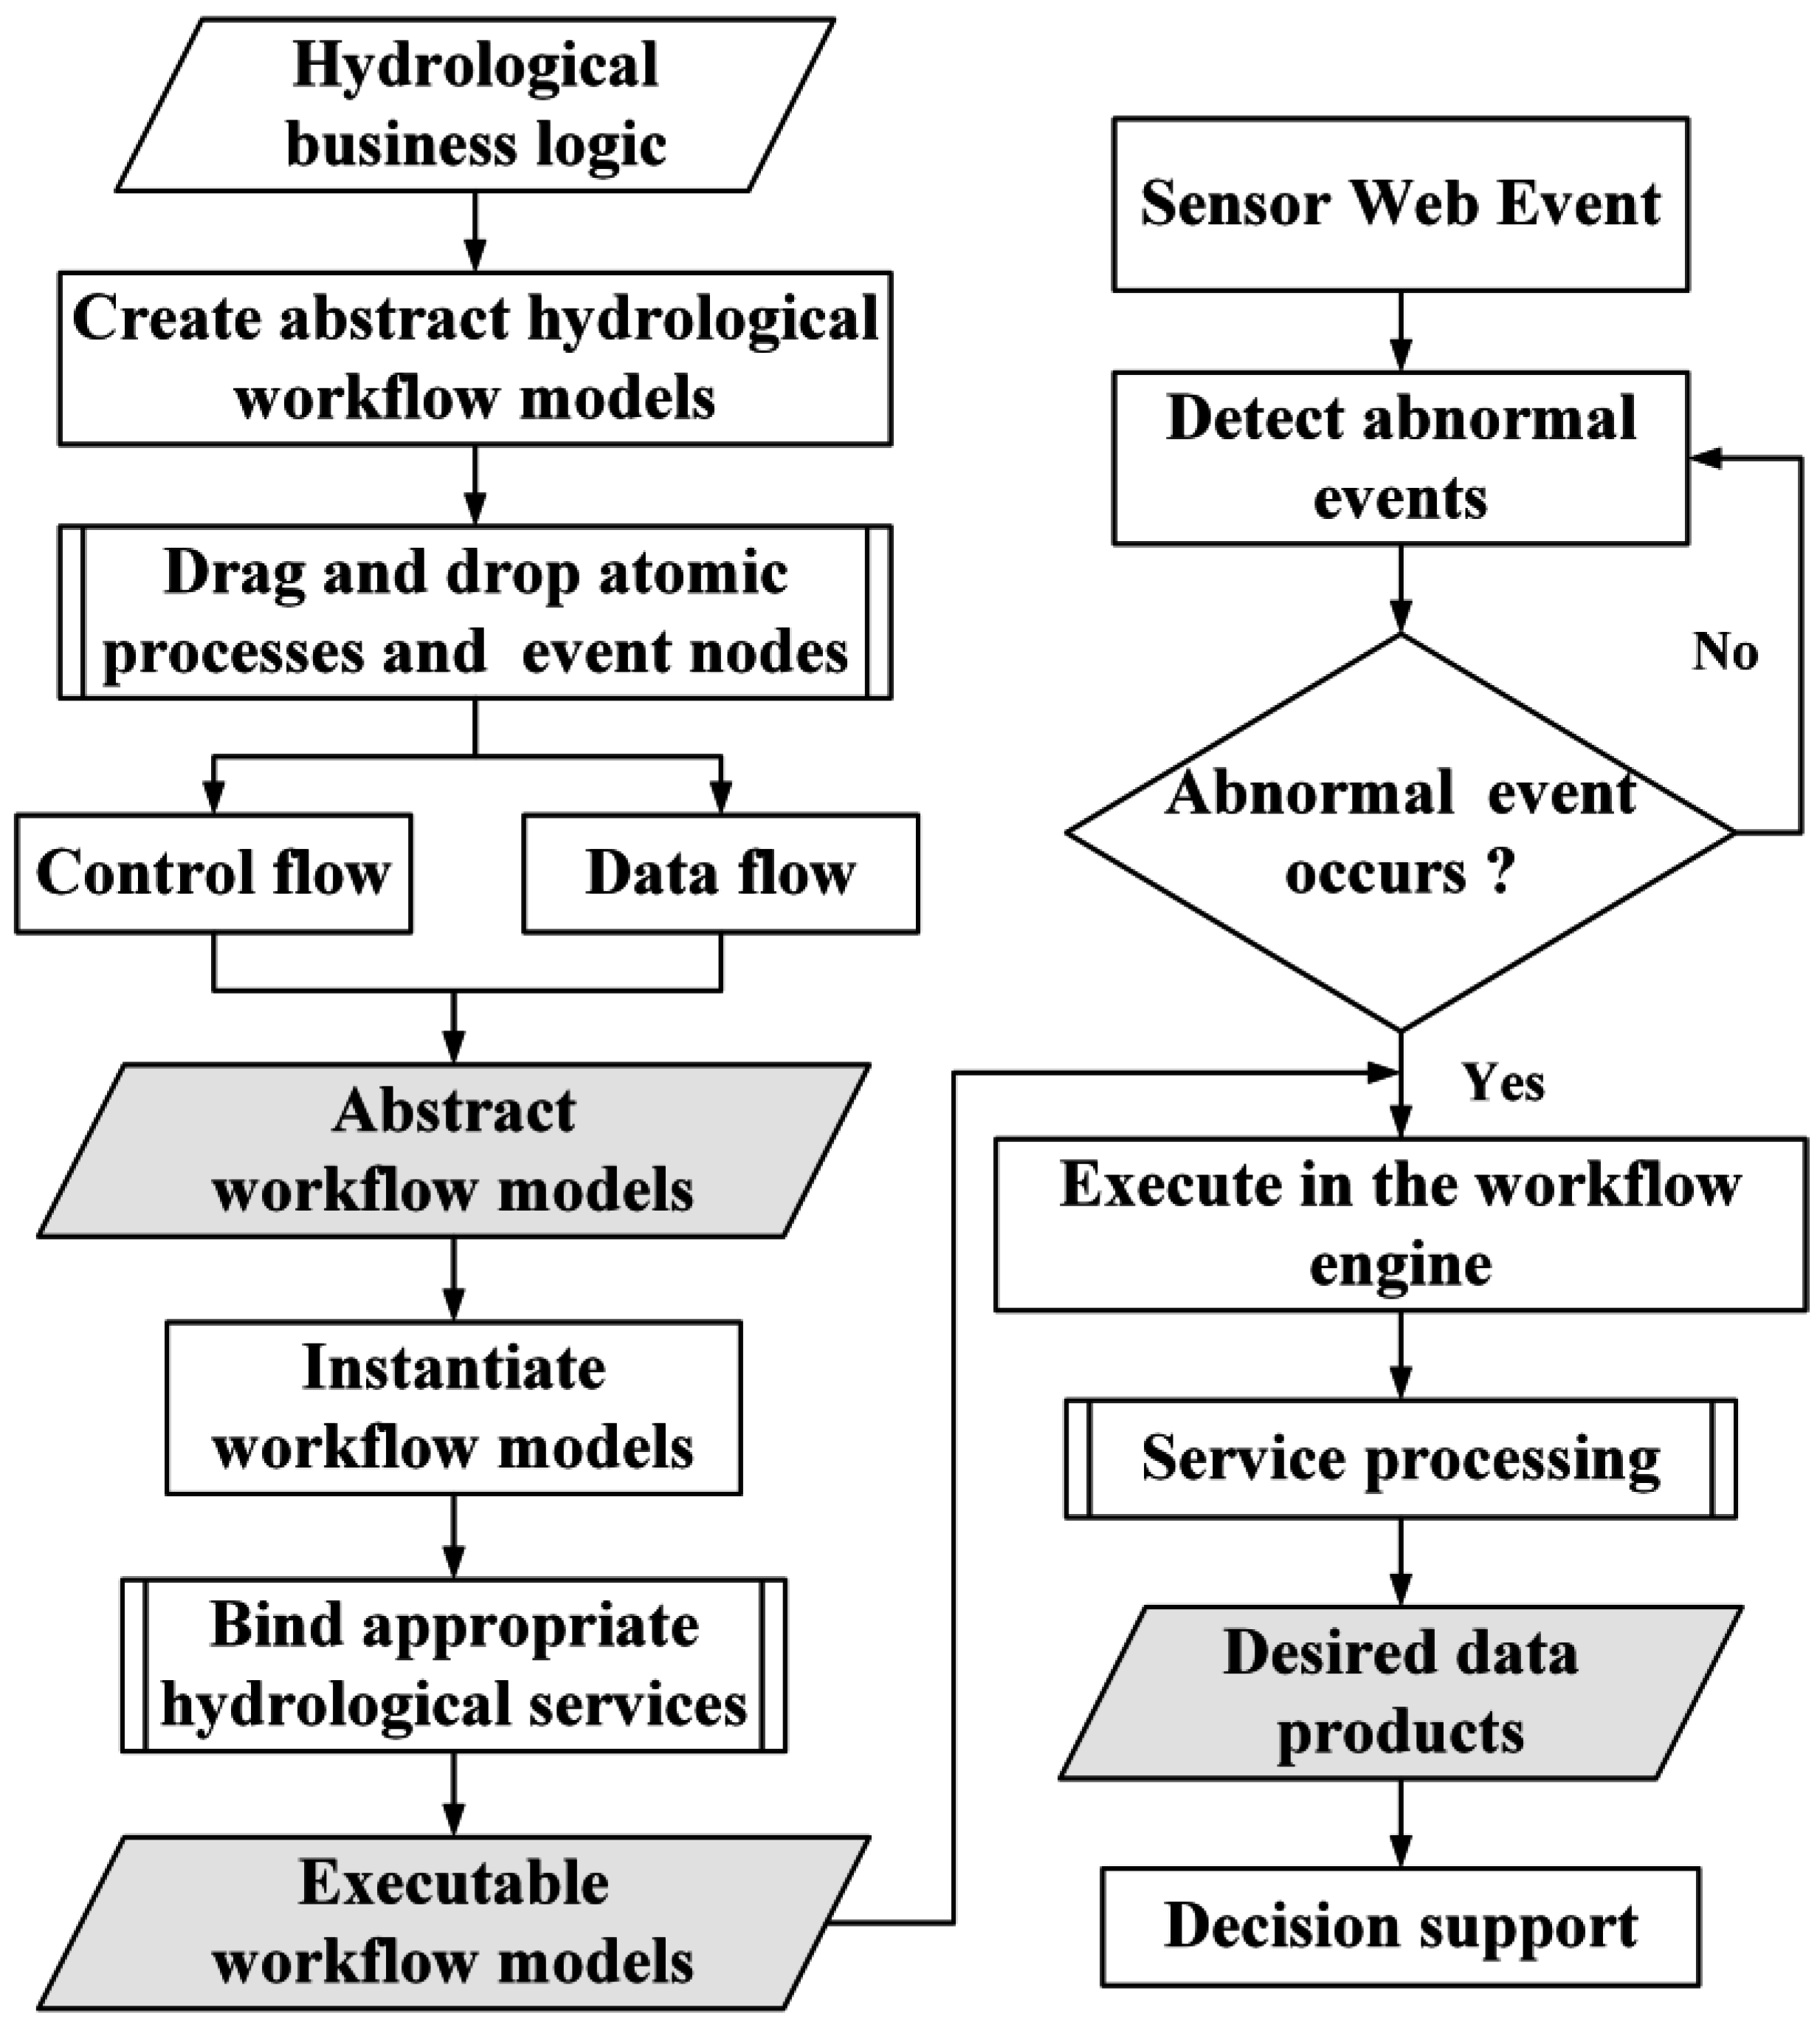
The business tier focuses on the integration of hydrologic services. For the realization of active hydrological disaster monitoring using the proposed Sensor Web and Web service-based approach, the core component is the event processing middleware. It takes hydrological events from the Sensor Web as inputs, processes them in accordance with event patterns, and activates geoprocessing workflows to generate live products. When an abnormal event is detected, new observations can be tasked and acquired in time. These observations will be delivered to the workflow module. The workflow module includes three sub-components: the workflow modeller, the workflow binding component, and the workflow engine. The workflow modeller generates an abstract process model consisting of the control flows and data flows among atomic processes. The workflow binding component instantiates this abstract process model into a concrete workflow or executable service chain by binding the atomic processes to services. The executable workflows or service chains are then executed by the workflow engine to generate on-demand data products. When observations are sent to workflows, those workflows can be activated to perform live geoprocessing, thereby providing timely decision support information when specific hydrological hazard events occur.
The hydrological analysis functions are accessed through the OGC WPS standard interface. On the internal side, hydrological geoprocessing processes are implemented by calling APIs of the algorithm libraries in existing GIS software systems. Legacy hydrological analysis functions, in the form of geoprocessing services, are deployed on a Web geoprocessing application server. The request/response messages for these hydrological processing services can be parsed by either a servlet or JSP container. Then, the WPS operations specified in the messages will be processed in the WPS request/response handling module. The execution of these processes will call the necessary hydrological analysis programs. These hydrologic geoprocessing services can be published in a registry and discovered on the Web. Users can design workflow models via a workflow designing tool, and these models can later be transformed into executable workflows by binding the hydrological geoprocessing services discovered from the registry. By using interoperable interfaces, hydrological analysis services can be coordinated with Sensor Web services and existing OGC data services to compose workflows for active hydrological monitoring.
The application tier, also known as the client tier, provides a customized interface for interacting with users. Users can invoke services, integrate workflows, issue tasks to sensor systems, collect observations, and visualize geoprocessing results through clients on this tier.

3.2. Implementation

The Web services for hydrological analysis were developed according to the OGC WPS specification version 1.0.0. These services are written based on the JAVA Development Kit (JDK) to enable cross-platform deployment and are deployed onto an Apache Tomcat in a 64-bit Linux operating environment. The services are developed by wrapping existing hydrologic analysis algorithms from legacy software.
  • GDAL provides a set of APIs for reading and writing remote sensing imagery. In this implementation, it is used to realize the functionalities of orthorectification, geometric calibration, and resampling. The orthorectification service will be adopted in the later turbidity extraction geoprocessing.
  • Several processing algorithms (e.g., radiometric calibration, Normal Differential Water Index (NDWI) calculations, and silt inversion) are listed in Appendix B. These algorithms can derive appropriate data products. Their corresponding C++ programs are packaged as Dynamic-Link Libraries (DLLs). Other algorithms can reuse processing functions in legacy components, e.g., GRASS scripts.
  • The above DLLs are finally exposed as Web services via the Java Native Interface (JNI). JNI [42] can make Java code directly call the methods written in other programming languages, including C++. The hydrological analysis processes, which are implemented based on JNI and DLL, include the NDWI calculation and silt inversion functions used for turbidity extraction. Commands/scripts from legacy software can also be wrapped using the JAVA runtime exec method.
The hydrological analysis process for remote sensing imagery consists of two steps: The first is pre-processing the raw images. The second step is conducting the specific hydrological analysis model on the pre-processed images. Both steps depend on the existing mathematical models or algorithms. These algorithms can be connected and integrated to achieve an advanced hydrological hazard analysis. The algorithms were initially written in C++ and were wrapped using JAVA. Take the task of extracting the turbidity in Poyang Lake as a demonstration to introduce the mathematical algorithms applied when calculating the total suspended sediment concentration (TSSC) from GF-1 imagery. The image pre-processing step often includes processes like orthorectification, radiometric calibration, and atmospheric correction.
A common method for Orthorectification is the Rational Polynomial Coefficient (RPC) camera model which takes Digital Elevation Model (DEM) data as input. The RPC model resamples (longitude, latitude, and height) object coordinates into the (line, sample) coordinates. The equation of the model is [43]:
( L ,   S ) = R P C ( Υ ,   ϕ ,   H )
where L is the line of the input image, S is the sample index, Υ is the longitude, ϕ is the latitude, and H is the orthometric height.
A radiometric calibration method can be applied to process imagery with the aid of the calibration coefficients of the WFV2 sensor on the GF-1 satellite [44,45]. The following Equation (2) is used to convert remotely sensed DN values into at-satellite radiances:
L s a t λ = G a i n × D N + B i a s
where L s a t λ is the at-satellite spectral radiance in the given spectral band ( W · m 2 · sr 1 · μ m 1 ), G a i n represents the gain for the given spectral band ( W · m 2 · sr 1 · μ m 1 ), B i a s is the offset for the given spectral band ( W · m 2 · sr 1 · μ m 1 ), and D N is the calibrated pixel grey value.
The COST model is employed to do atmospheric correction [46,47]. It not only corrects the effects caused by the Sun’s zenith angle, solar radiance and atmospheric scattering but also accounts for atmospheric absorption. Its equation is:
R λ = π × D 2 × ( L s a t λ L h a z e λ ) / E s u n λ cos 2 θ
where λ is the wavelength, R λ is the spectral reflectance of the surface, D is the distance between the Earth and the Sun, L s a t λ is the at-satellite spectral radiance in the given spectral band, L h a z e λ is the atmospheric path radiance, E s u n λ is the Exo-atmospheric solar irradiance, and θ is the Sun’s zenith angle.
After image pre-processing, the NDWI calculation, mask building, and silt inversion steps can be linked into a workflow to calculate TSSC. The NDWI, which aims to highlight water features in remote sensing imagery, is calculated by Equation (4). The values of the NDWI range from −1 to 1. Open water surfaces usually have negative values [48].
N D W I = ( G r e e n N I R ) / ( G r e e n + N I R )
In the formula, Green denotes the green band and NIR means the near-infrared radiation band.
Finally, the value of TSSC can be calculated from the results of atmospheric correction for bands 2 and 3 [49]. The formula is
T S S C = 0.4023 e ( 46.457 X )
X = ( R λ   ( λ b 2 c e n t r e ) + R λ   ( λ b 3 c e n t r e ) ) R λ   ( λ b 3 c e n t r e ) / R λ   ( λ b 2 c e n t r e )
where λ is the wavelength, R λ is the spectral reflectance of the surface, λ b 2 c e n t r e is the central wavelength for band 2 of the GF-1 satellite, λ b 3 c e n t r e is the central wavelength for band 3, and X is a factor calculated by combining the R λ values in bands 2 and 3 obtained from the GF-1 sensor. The procedure is organized and summarized in the following Algorithm 1.
Algorithm 1. Calculate the Total Suspended Sediment Concentration (TSSC) in the Study Area.
Input:
An image pre-processed and represented by a 3-D matrix;
Main algorithm:
  • Clip the inputted image to generate a sub-image of the study area;
  • Calculate the NDWI value of the sub-image using Equation (4);
  • Binarize the result of the NDWI calculation according to a specified threshold (threshold equals to 0) by assigning 1 to those pixels with negative NDWI values and 0 to the rest;
  • Perform mask building for the band-by-band multiplication of the binary image with the pre-processed GF-1 image to extract water areas;
  • Calculate the total suspended sediment concentration (TSSC) using Equation (5).
Output:
 An image whose pixel values are the calculated TSSC results.
Figure 4 illustrates the design and implementation of a Web processing service wrapper for the publication of new hydrological analysis services using scripts and DLL functions. Both legacy and new executable hydrological analysis programs are invoked using the JAVA code wrapper by calling shell scripts or JNI interfaces. The list of algorithms is maintained in an internal algorithm store. HTTP requests for WPS GetCapabilities, DescribeProcess, and Execute operations can be processed by servlets and request/response handlers. For example, when a user submits an Execute POST request to a WPS server, the XML document will be parsed to extract the required parameters (e.g., process identifiers). By comparing the identifiers with the algorithms in the internal algorithm store, the appropriate processes can be located. After the completion of geoprocessing, the results will be delivered to the response handler to generate XML responses according to the output data types specified in the response of the DescribeProcess operation.
The 52North Sensor Web community has developed a series of open-source server software for five kinds of SWE services and also client applications [50]. This software is adopted in the Sensor Web service implementation. The workflows are supported by an open-source geoprocessing workflow tool named GeoJModelBuilder [27], which can be used to create and execute workflow models based on user requirements. 
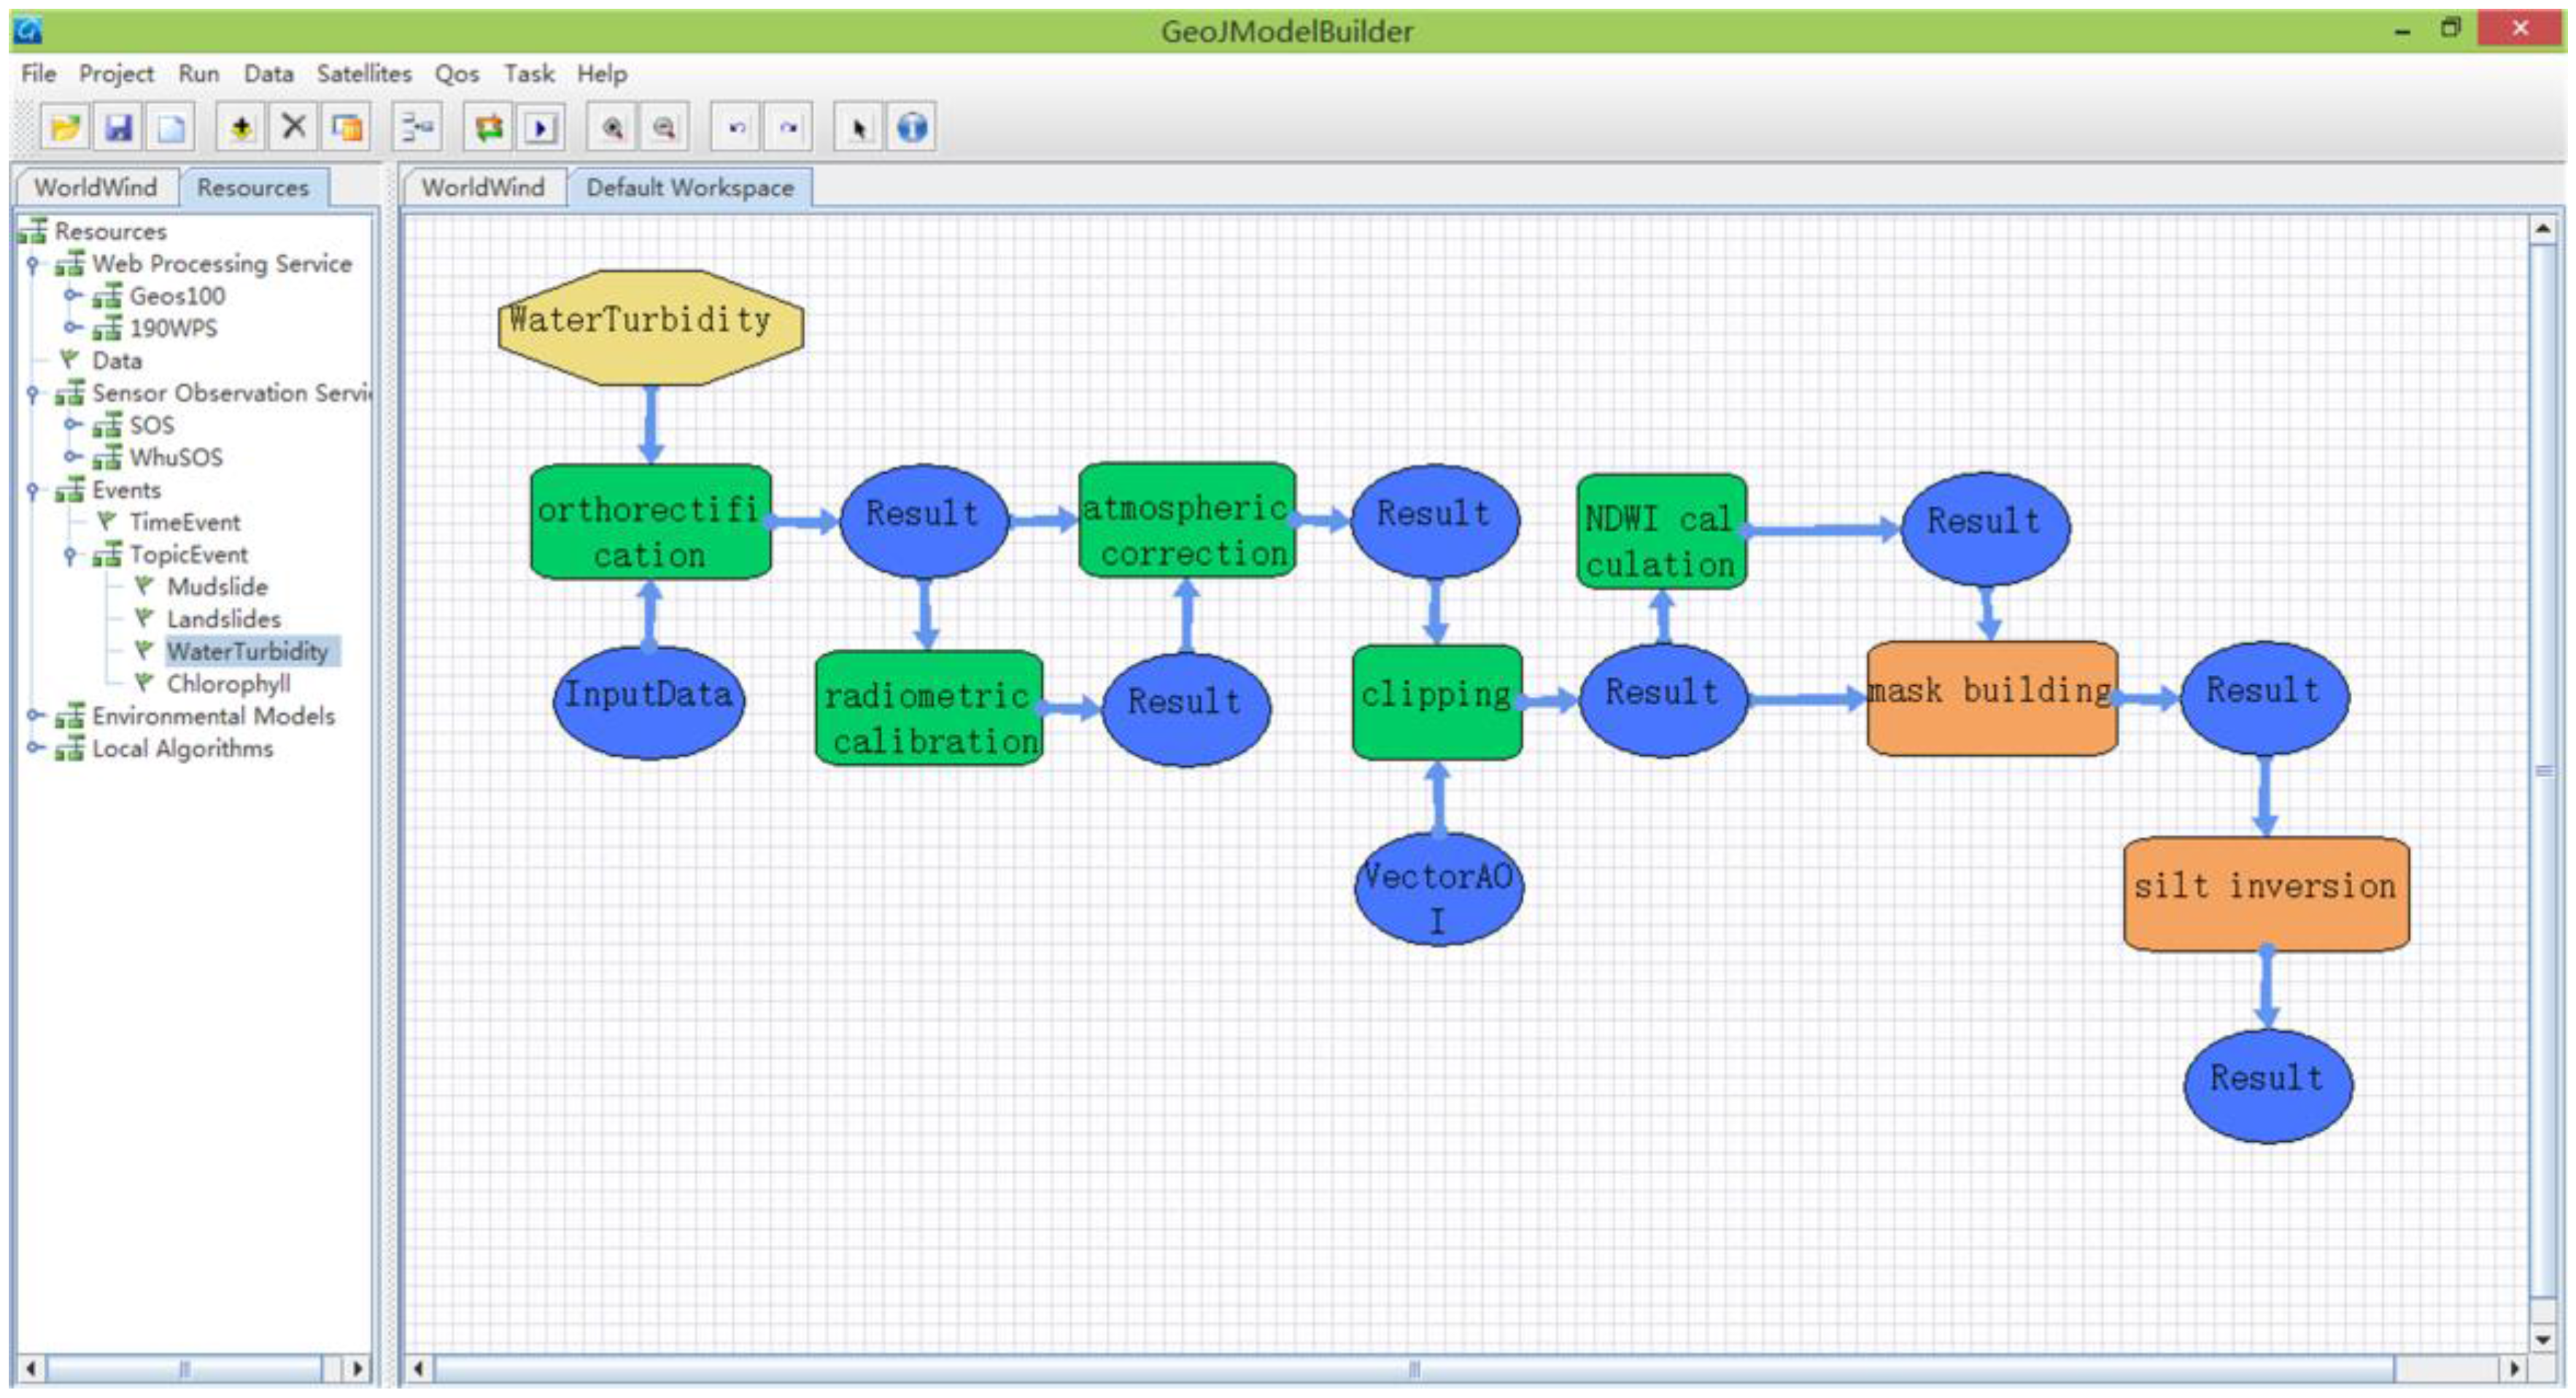
Figure 5 illustrates the process of workflow-based hydrological service chaining. First, an abstract hydrological workflow model is created according to hydrological business logic. The models are designed by dragging and dropping operations using the workflow tool. The abstract workflow model is then instantiated into an executable service chain by binding hydrological services, such as orthorectification, radiometric calibration, and atmospheric correction services. The workflow tool also supports Sensor Web events as nodes in the models. When an event occurs, the workflow model will be automatically activated, and the chaining result will be executed by the workflow engine to generate the desired data products to support timely decision-making.
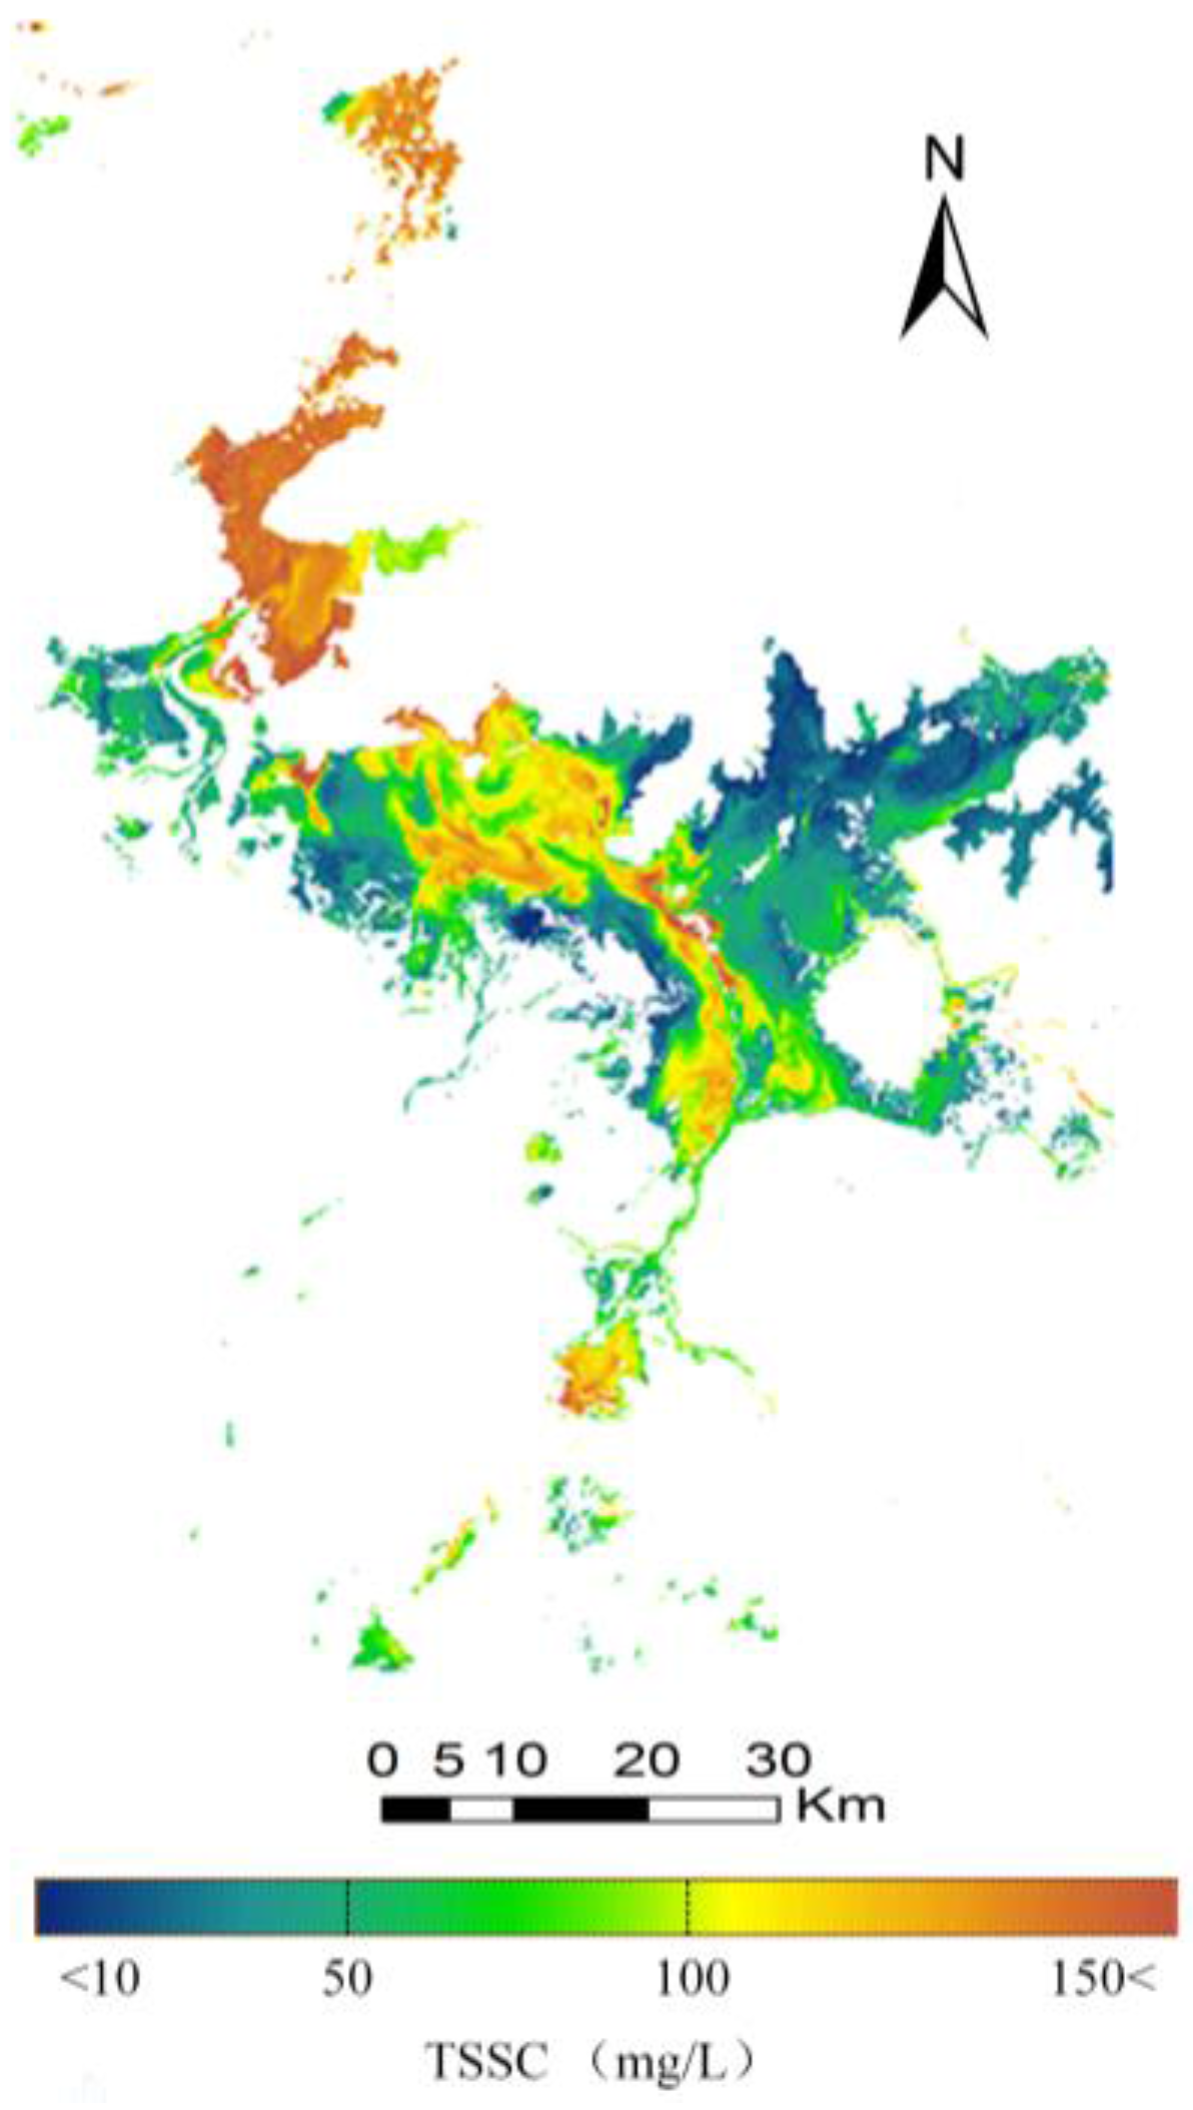
4. Case Study

The implemented system has been used for hydrological disaster monitoring. Because of the significance of suspended sediment concentrations in enabling timely warnings of floods and other hydrological disasters, a case of turbidity extraction for Poyang Lake, Jiangxi Province, China, was selected for study. Poyang Lake is the largest fresh water lake in China, and it is located in the middle section of the Yangtze River [51]. The period from April to September is the rainy season in this region. During that period, water from the Yangtze River and several other connected tributaries flows into this lake, which frequently causes flood disasters in the region [49]. Floods usually result in excessive sediment concentrations in water bodies [52,53]. The total suspended sediment concentration (TSSC) can be regarded as a quality indicator of water turbidity [54].
This case study demonstrates the use of the proposed approach to monitor excessive sediment concentrations in the study region based on observations recorded by the Chinese GF-1 satellite during the flood risk period. The implemented system was used to generate thematic images representing sediment concentration, which can be used to support subsequent decision-making. The hydrological monitoring process enabled by the implemented information infrastructure technologies, including Sensor Web technologies, geospatial services, and the proposed workflow management approach, is illustrated in 
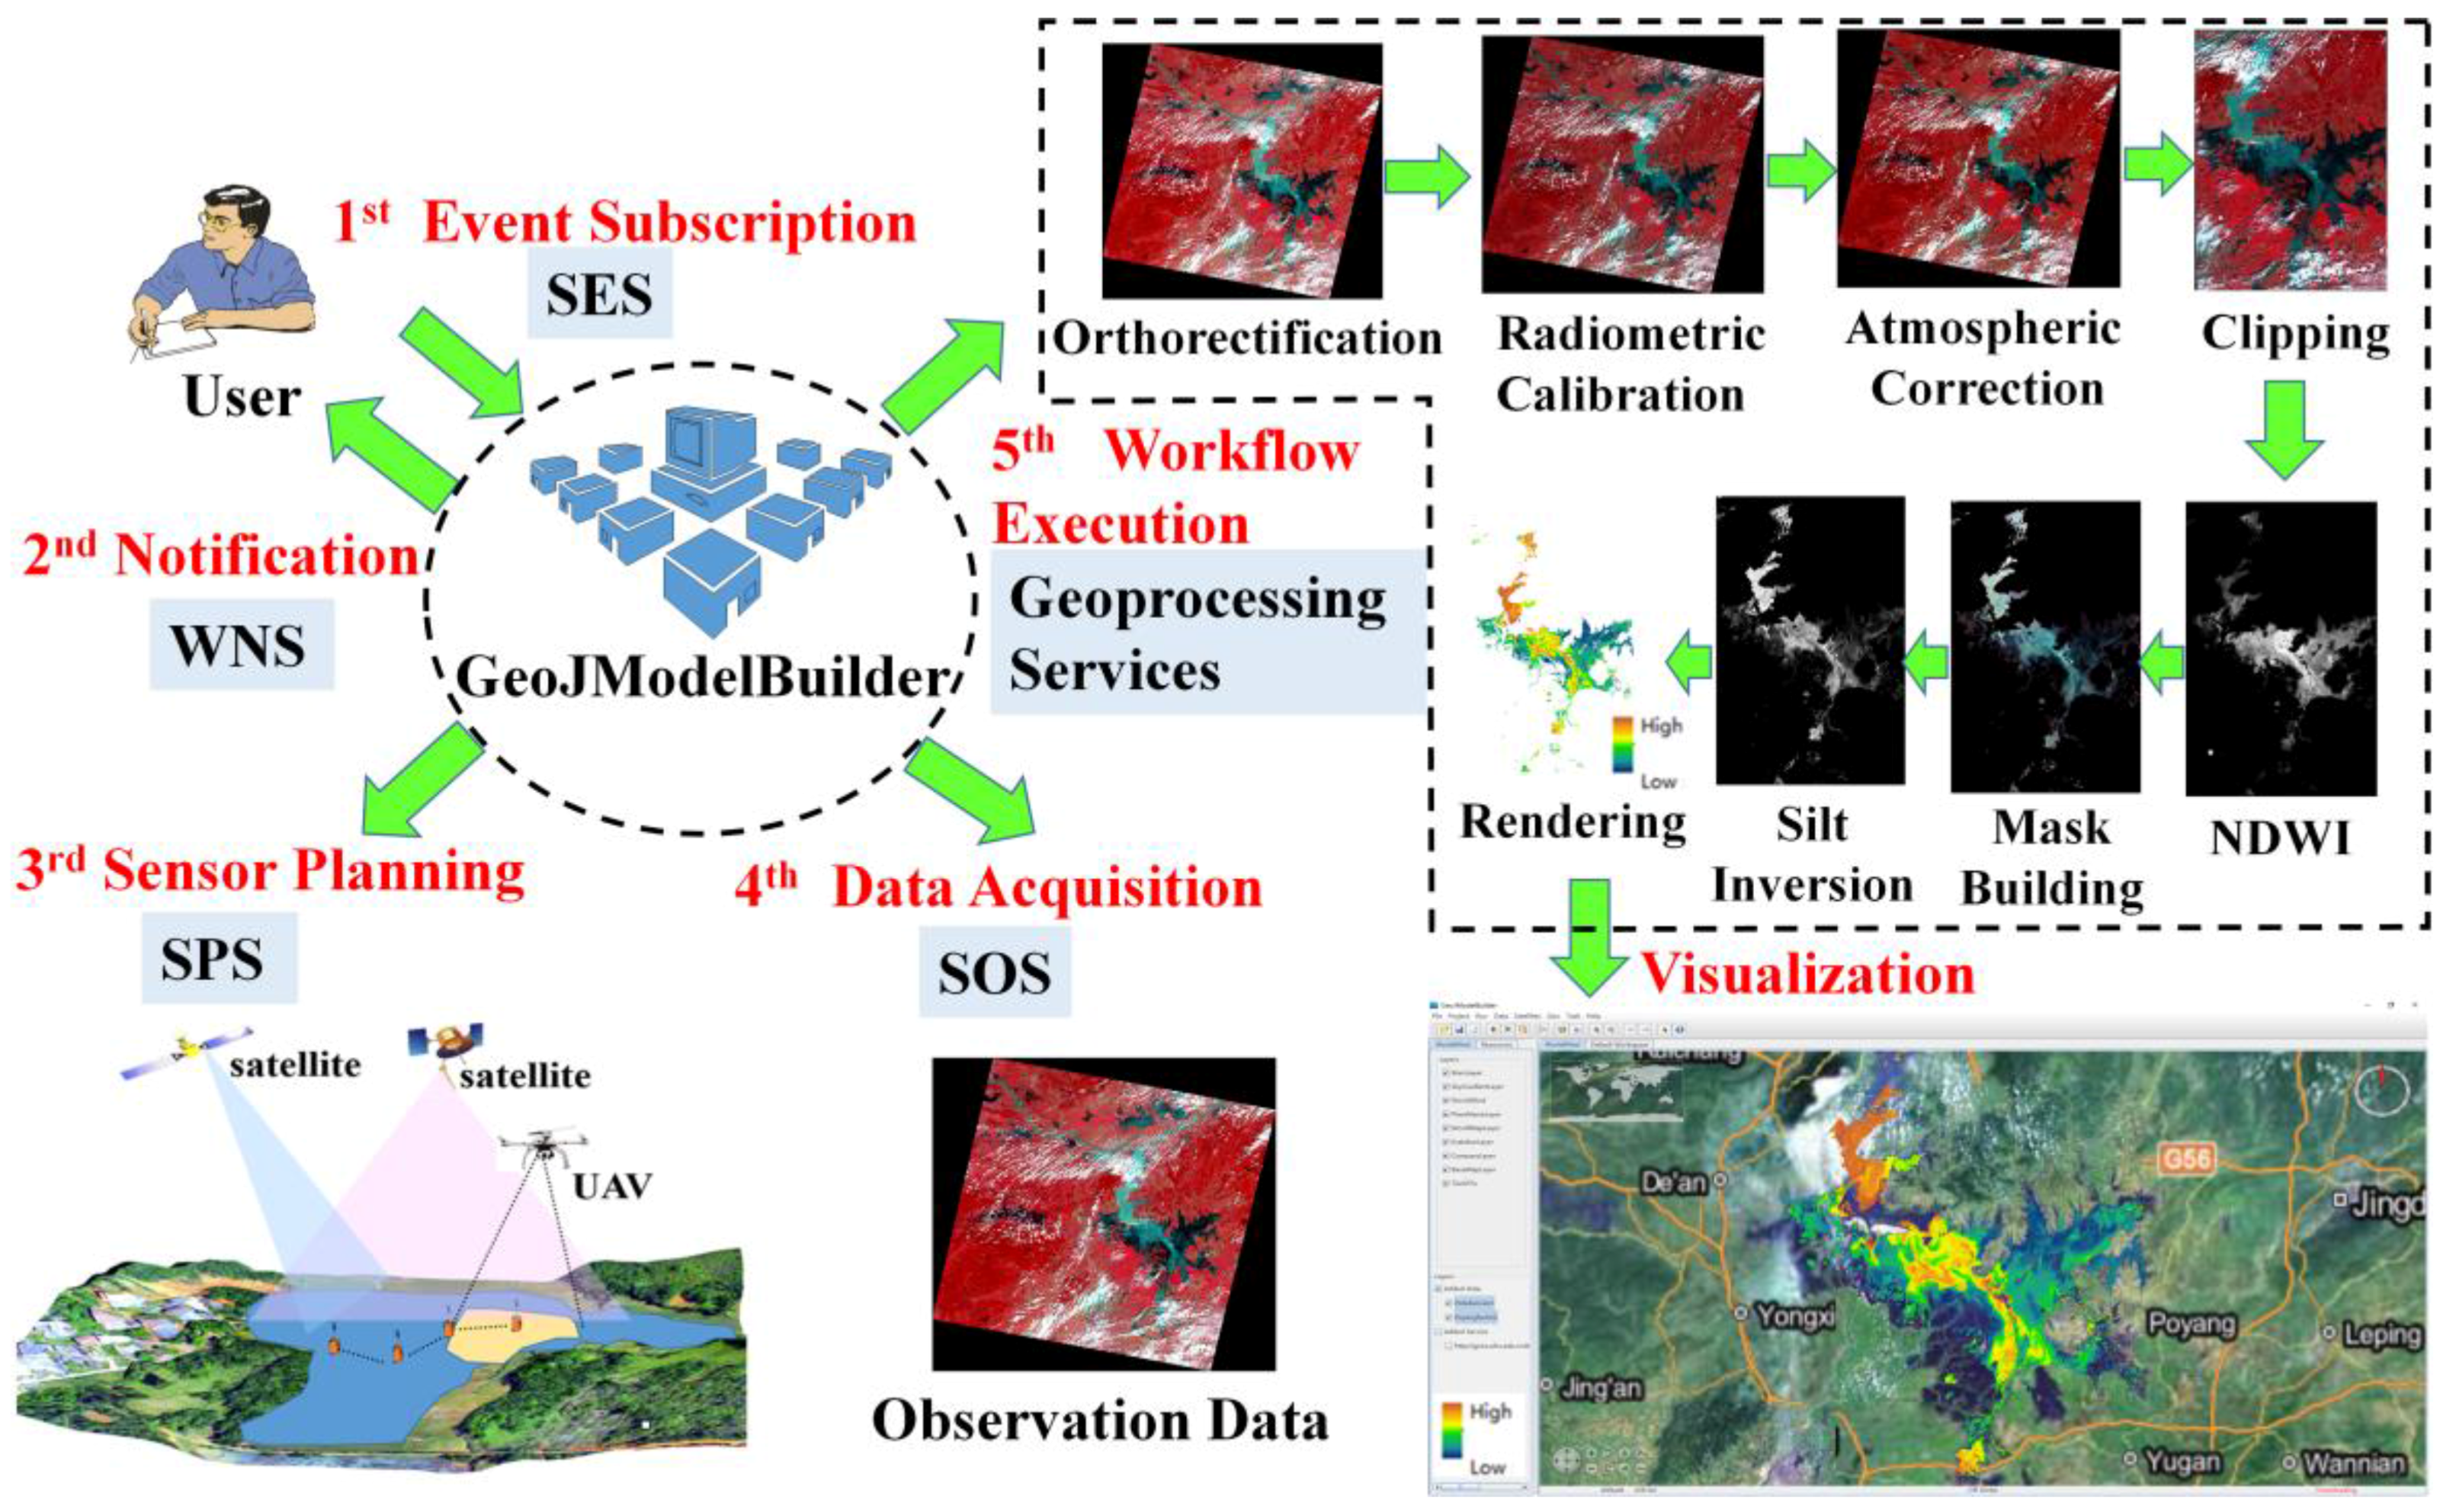
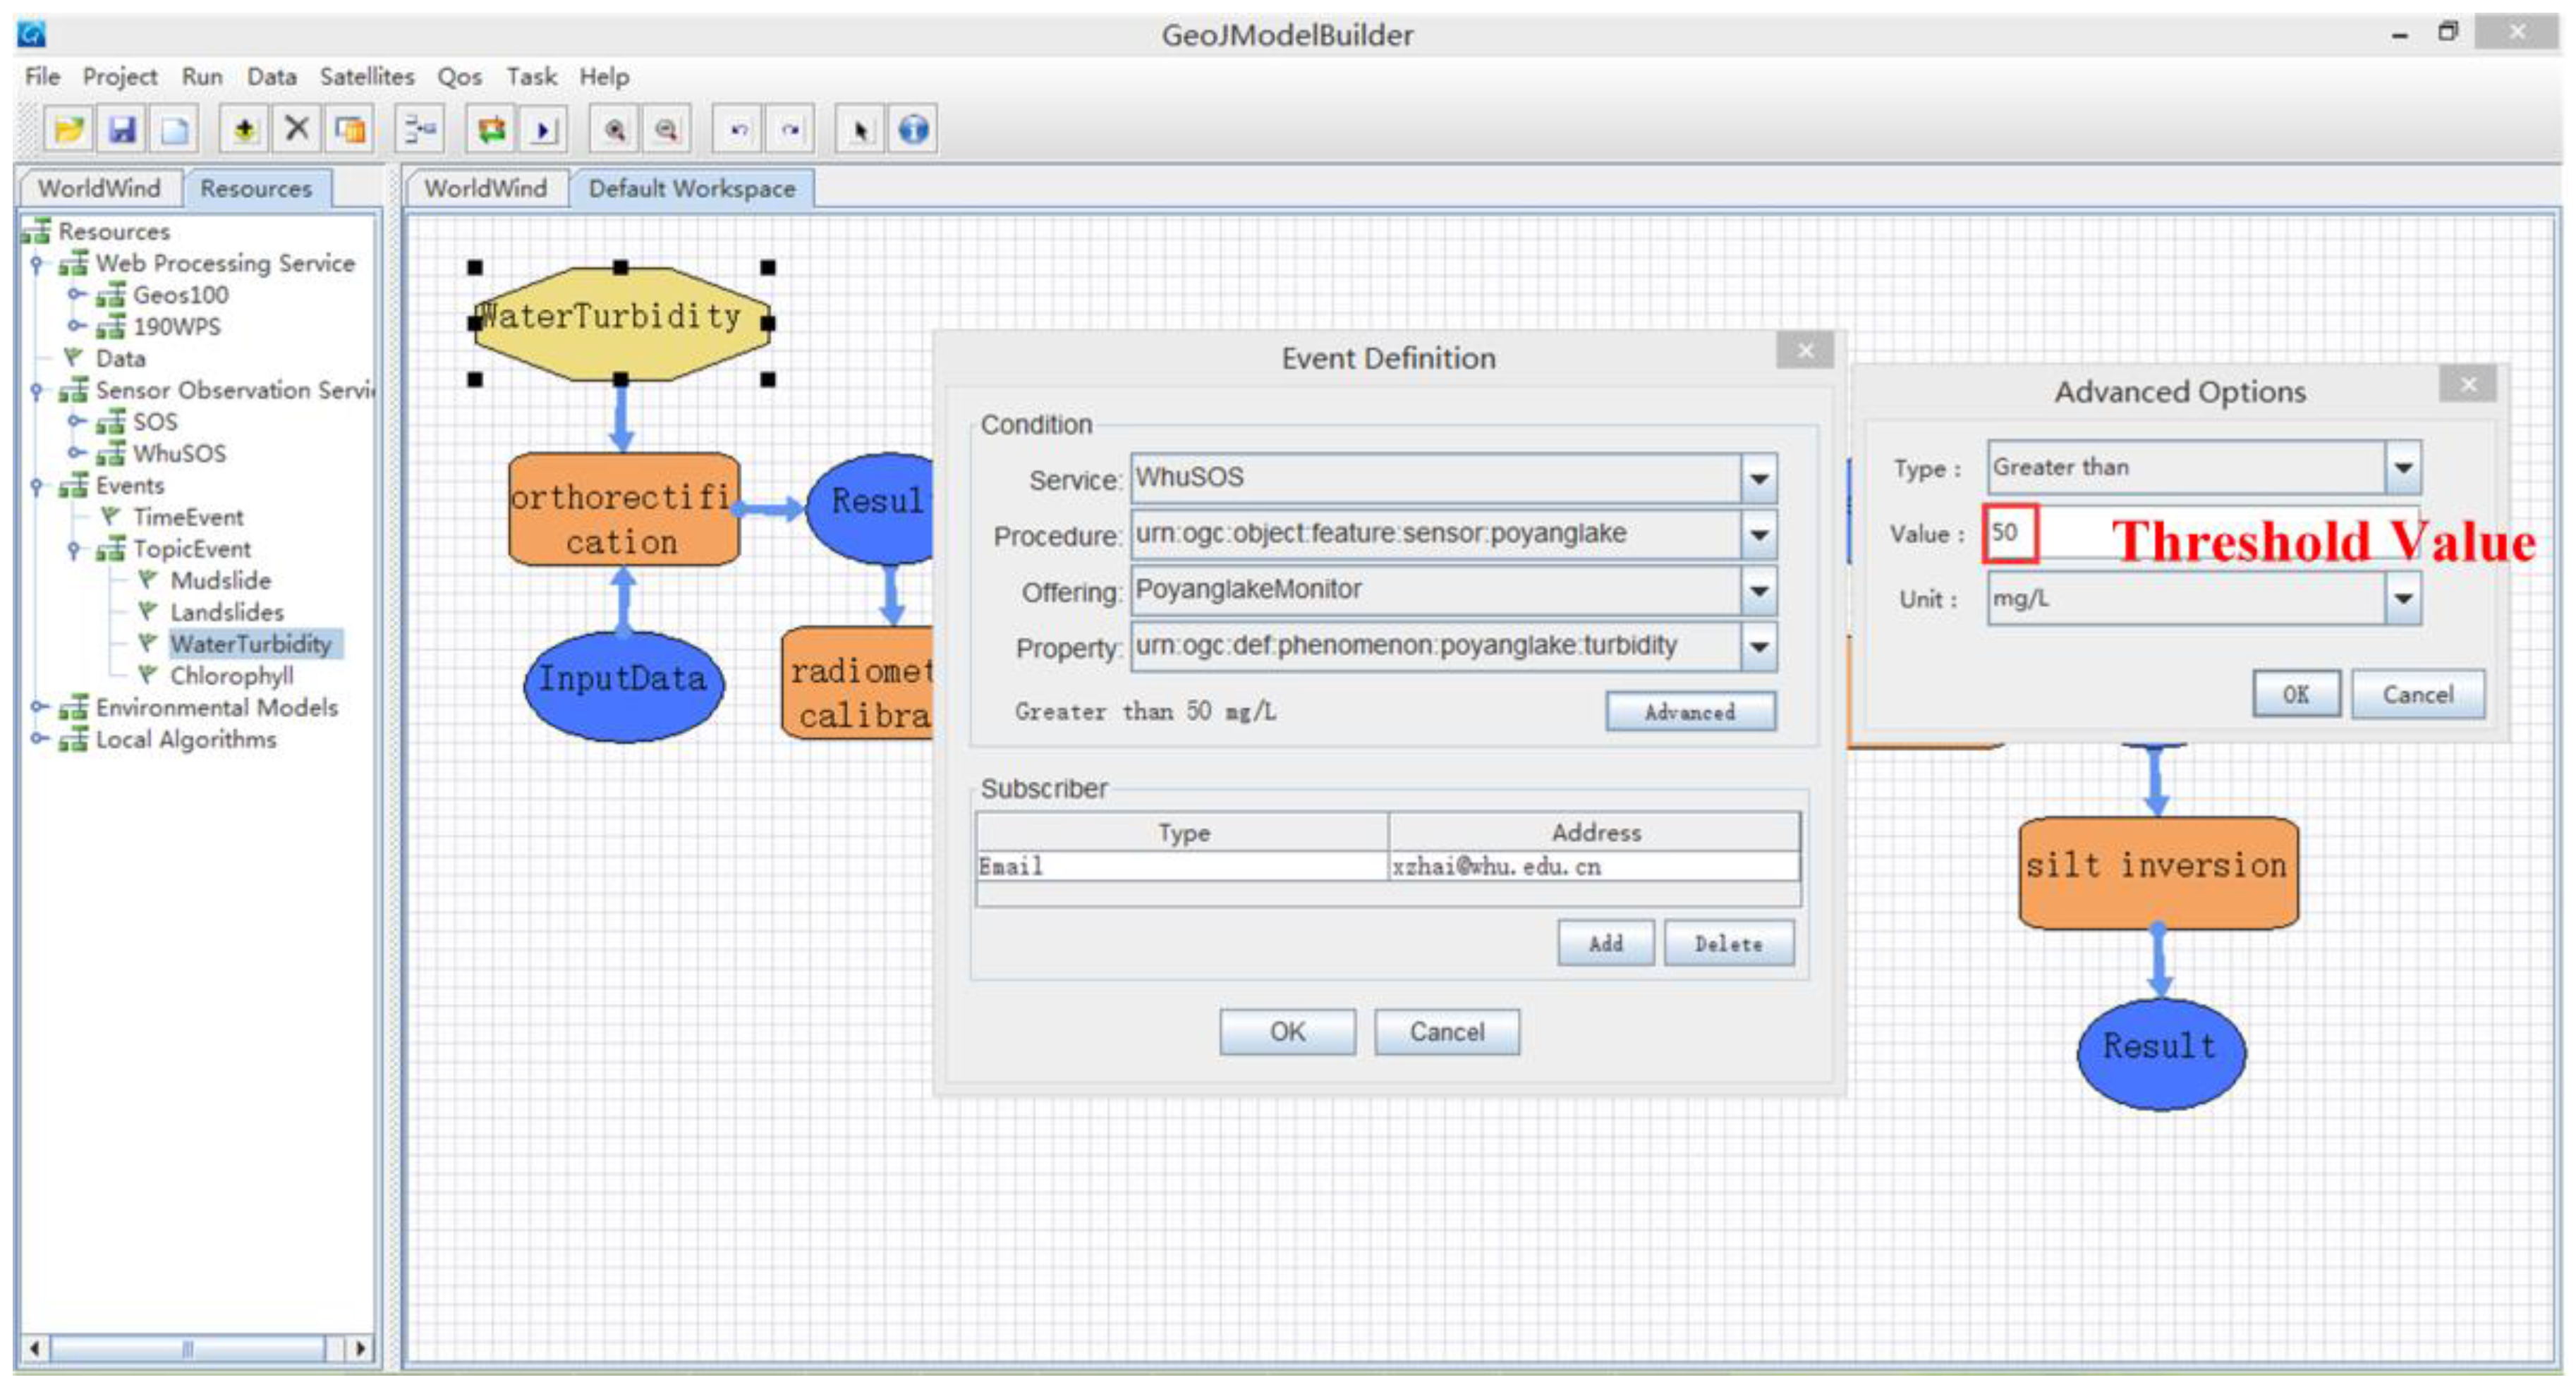
Figure 6. Translucent or opaque service chaining in GeoJModelBuilder was used to compose a workflow model for turbidity extraction. As a starting point, a “Water Turbidity” node was added into the workflow for the active triggering of the turbidity extraction process. Distributed observation, data and geoprocessing resources available over the Web were linked into the model in the same way.
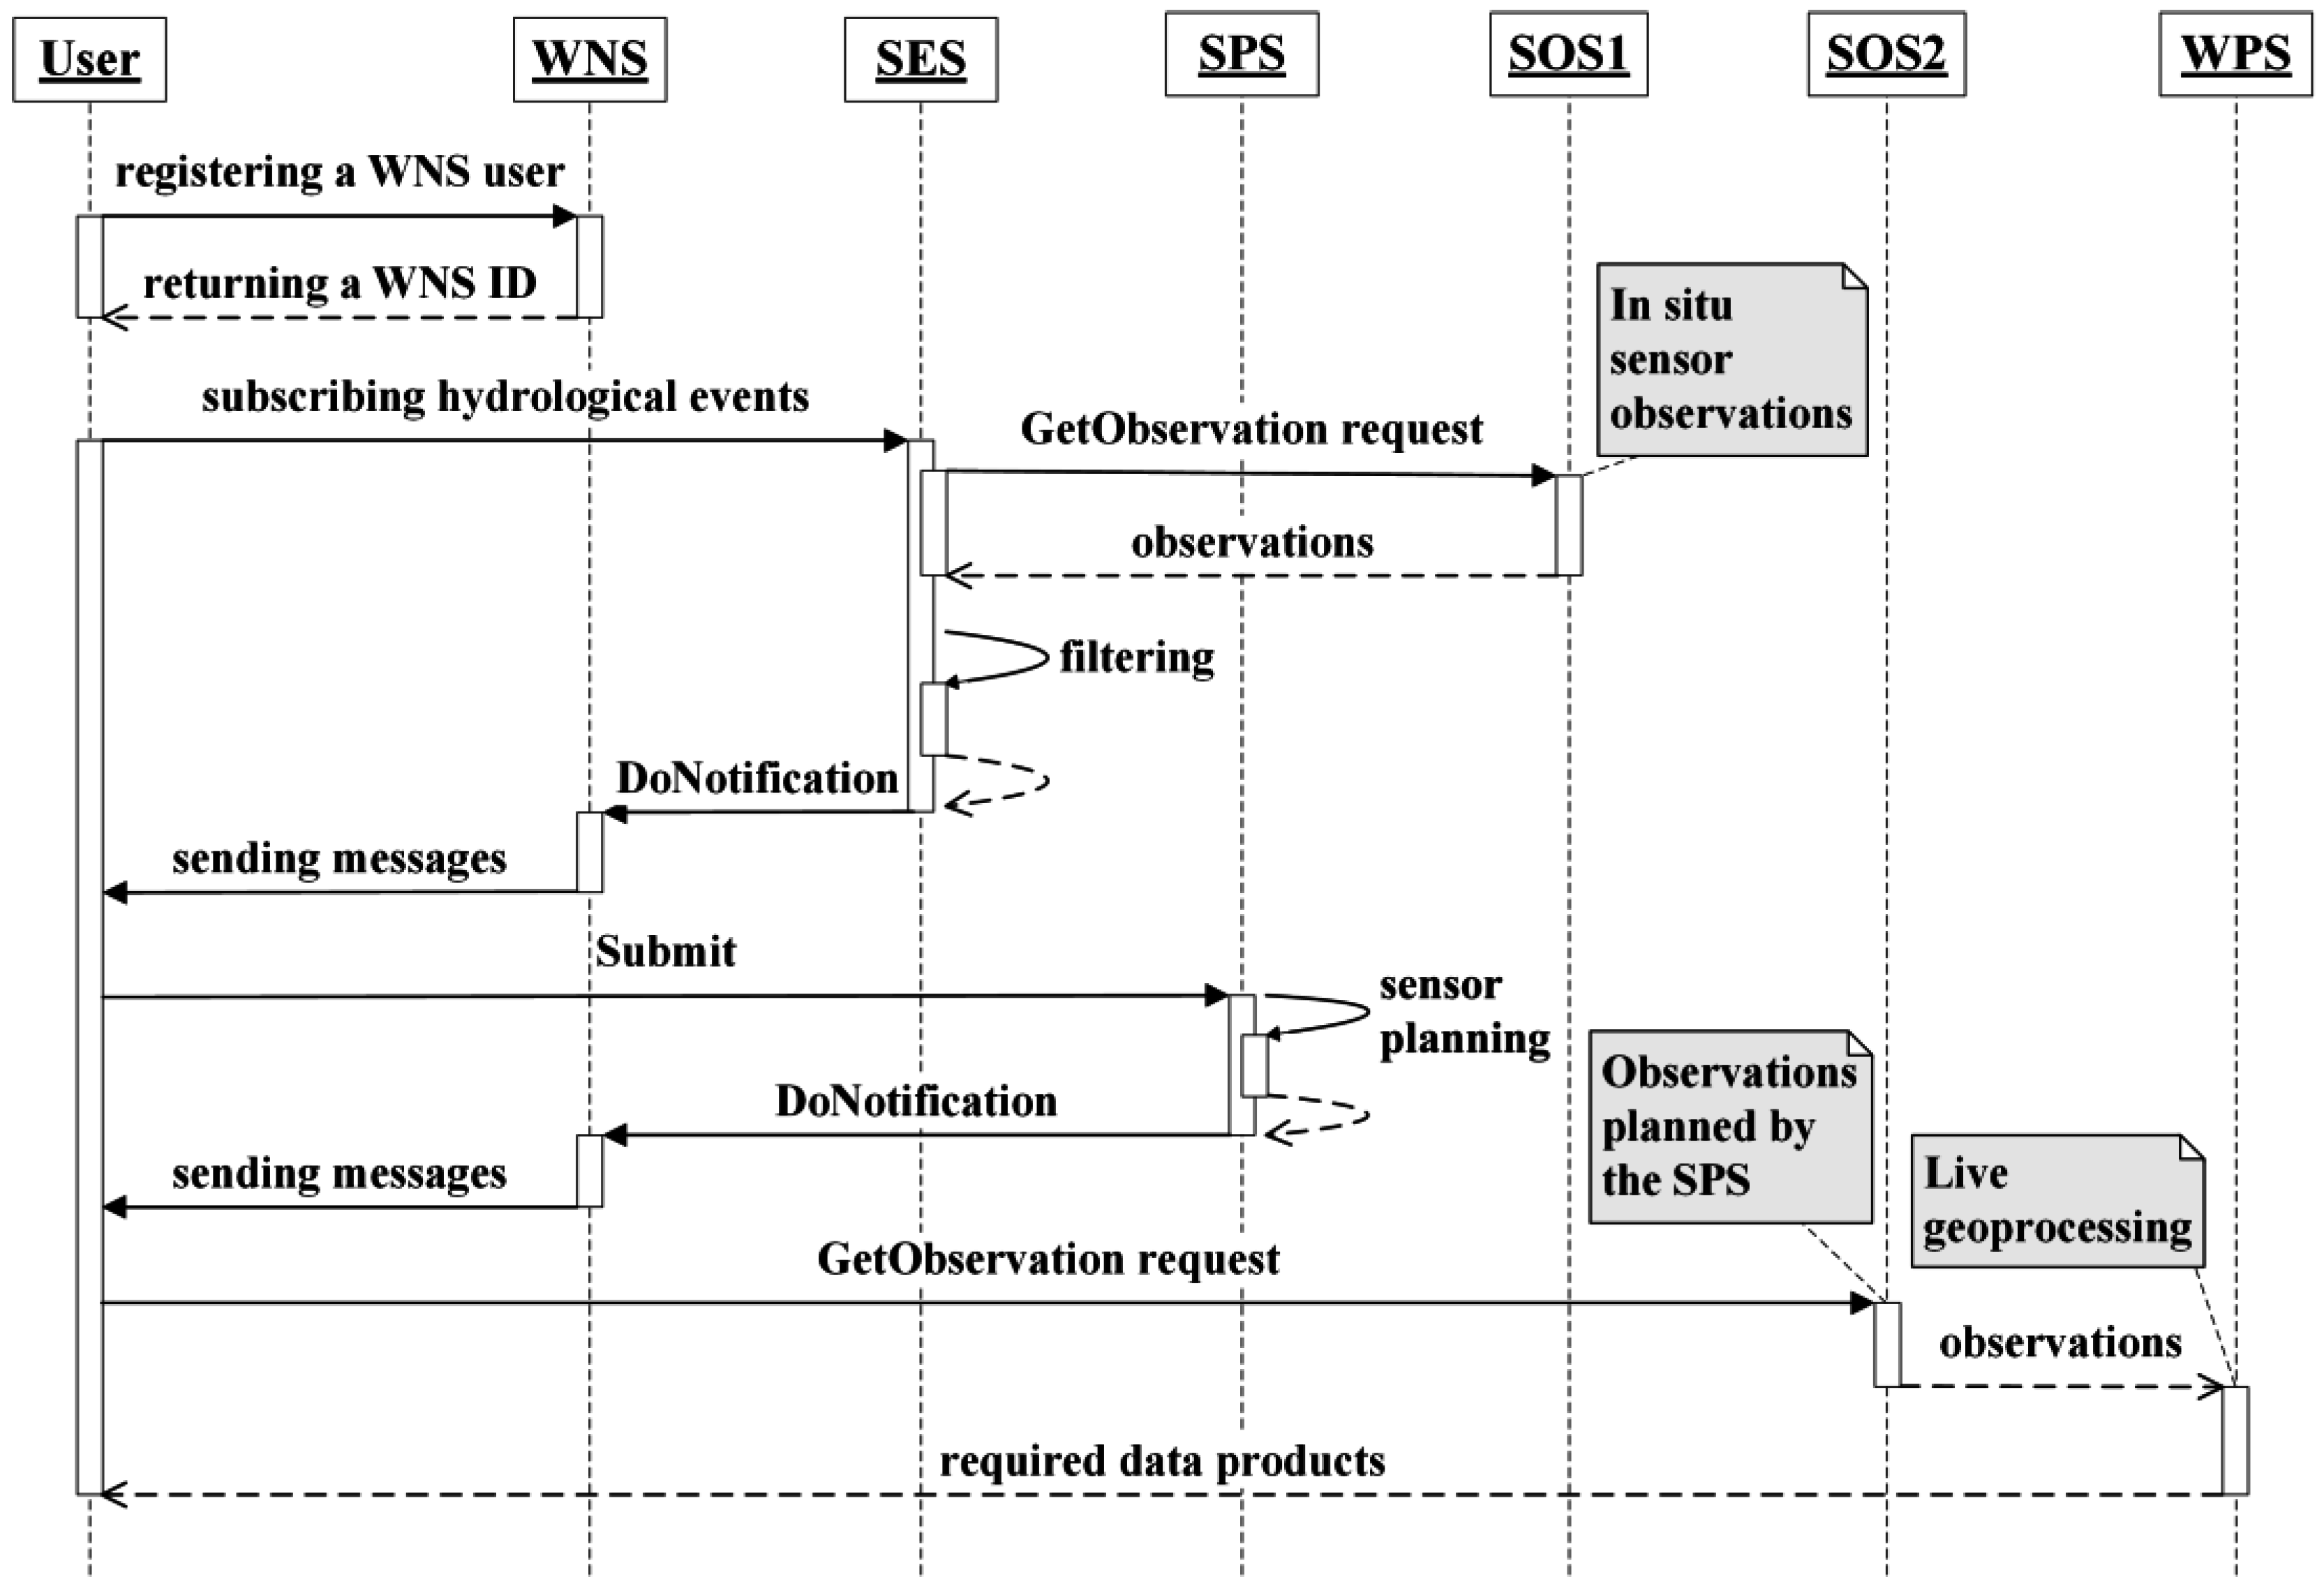
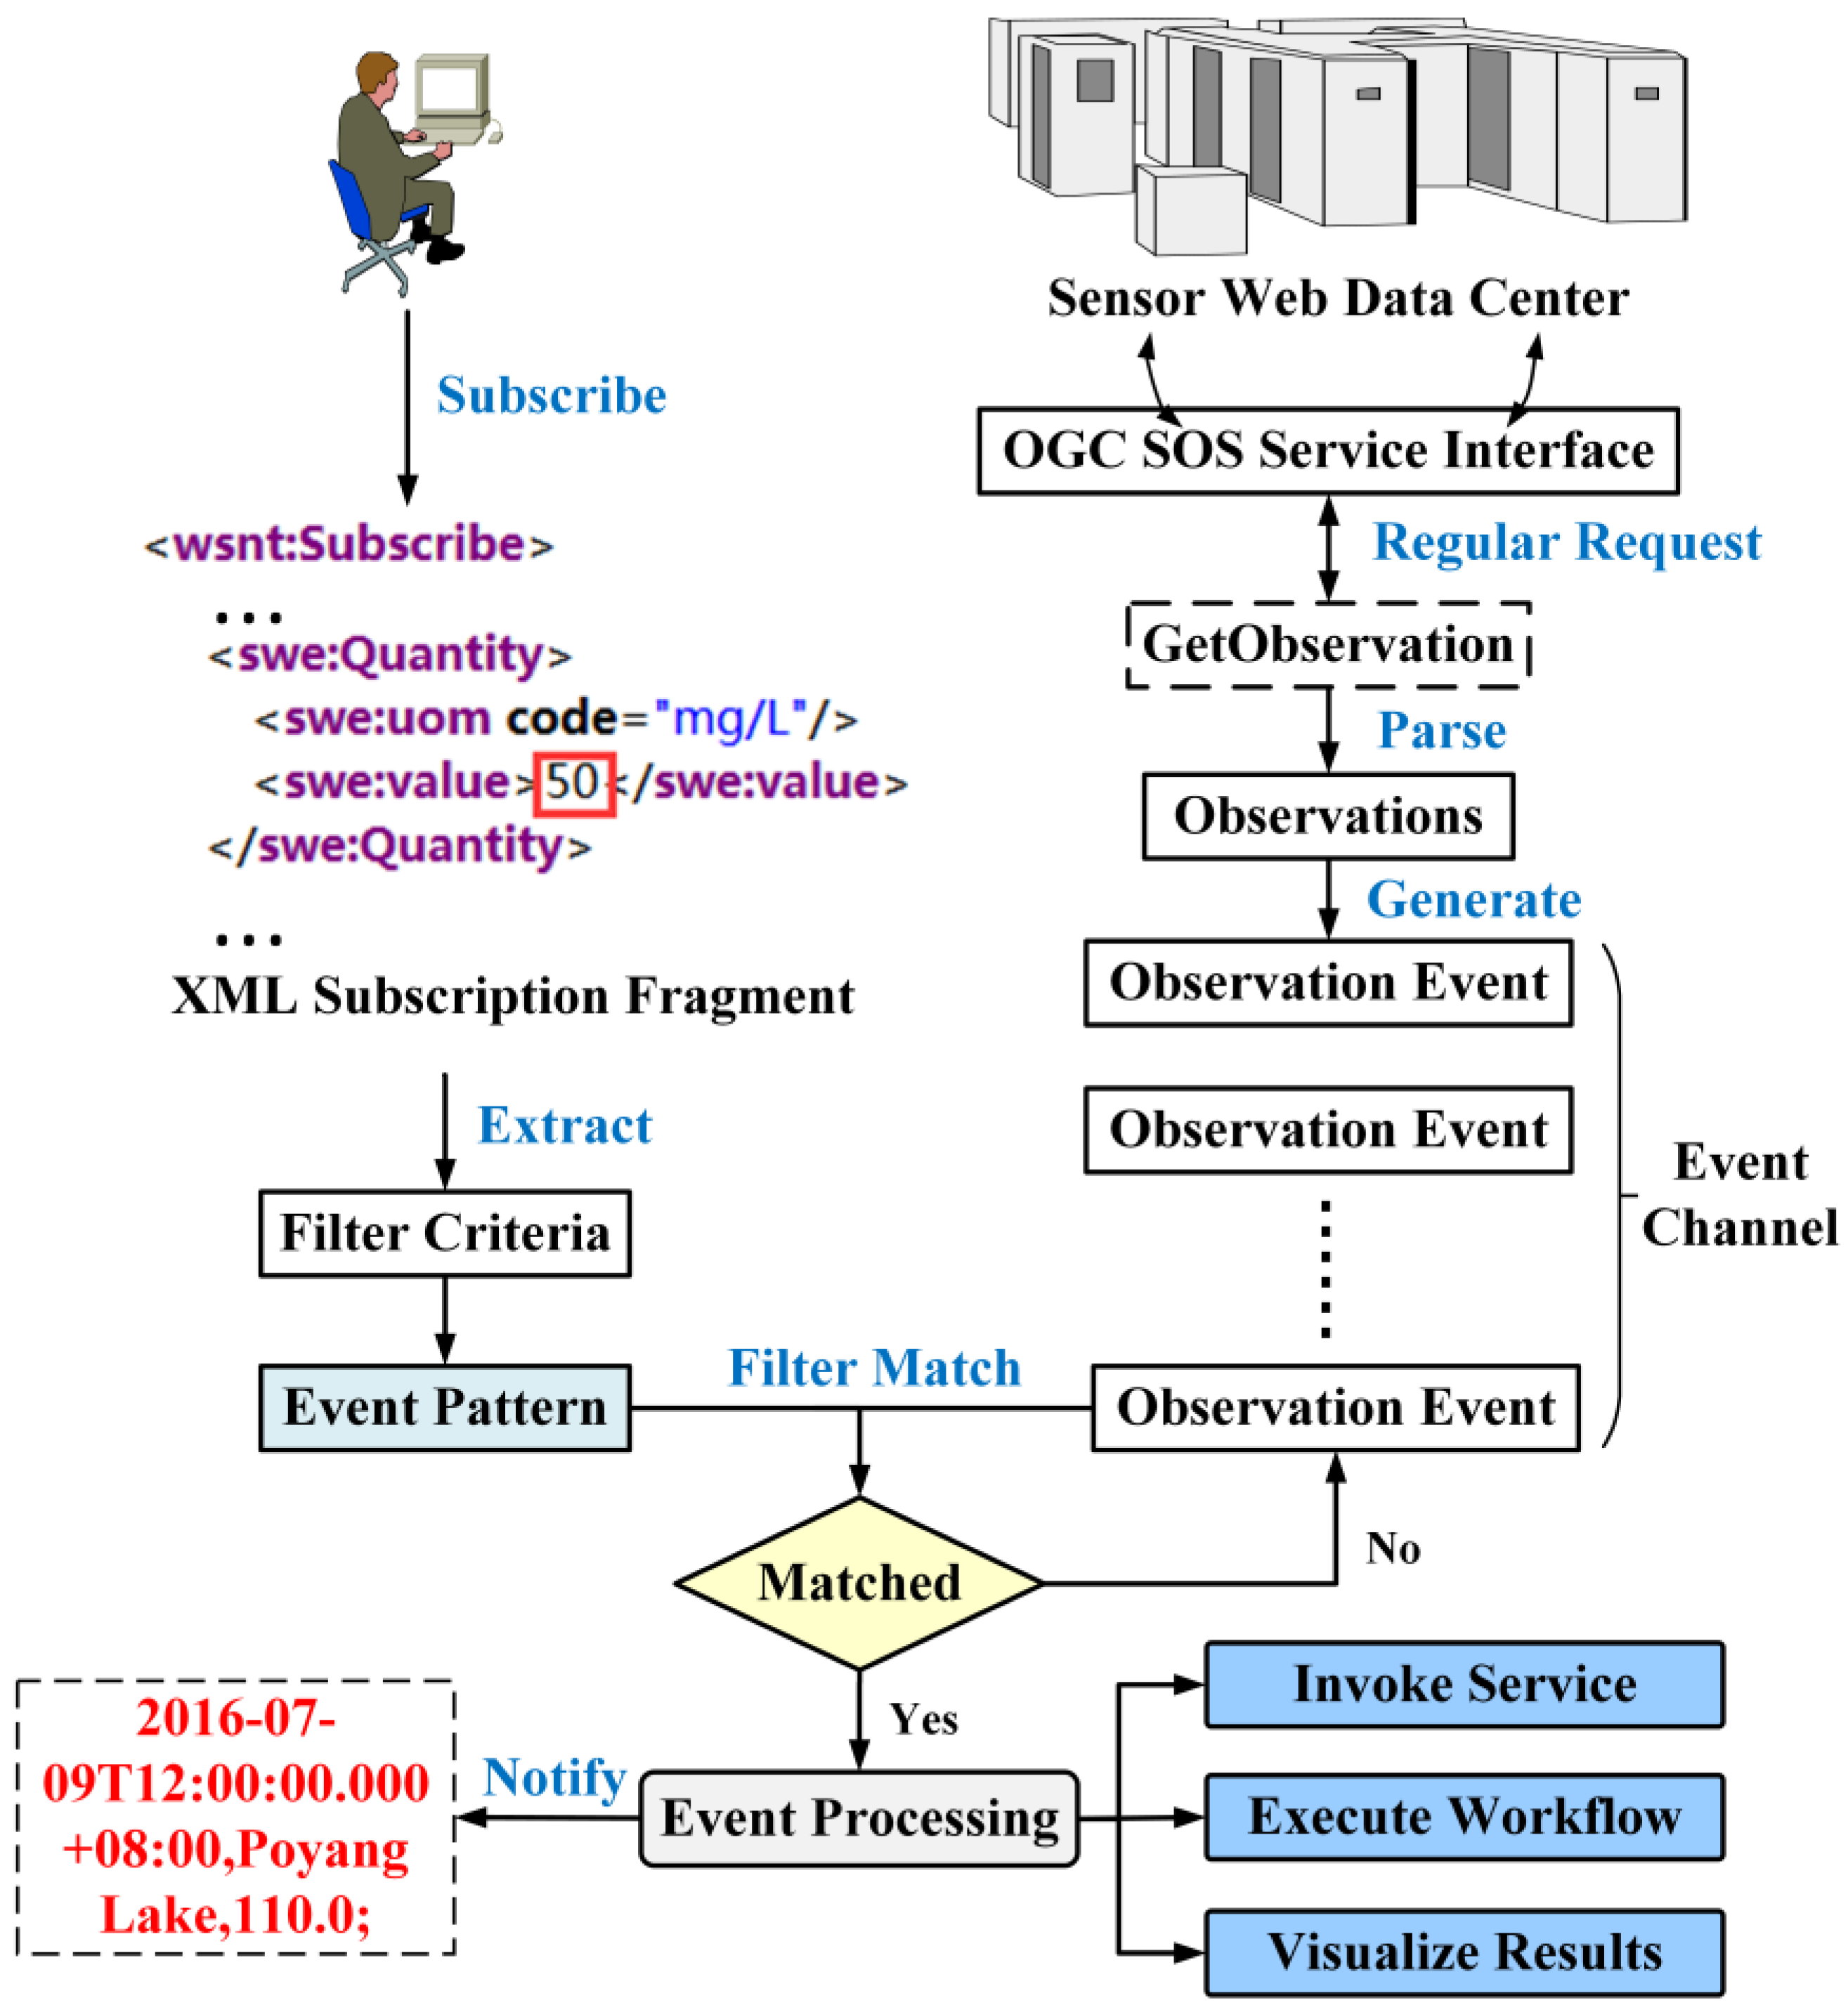
In the excessive sediment concentration monitoring, the first step is to subscribe water turbidity events in Poyang Lake through an SES. As Figure 7 shows, users subscribe via a request window by specifying certain filter conditions (sensor identifier, observation property and threshold value) and choose to receive messages from a WNS. All parameters are organized in a set order to generate a standard Subscribe XML request. When the request is received by the SES, an event generator middleware will be regularly activated to send GetObservation requests to an SOS to retrieve in situ sensor observations of the region. Every new observation is treated as an event. 
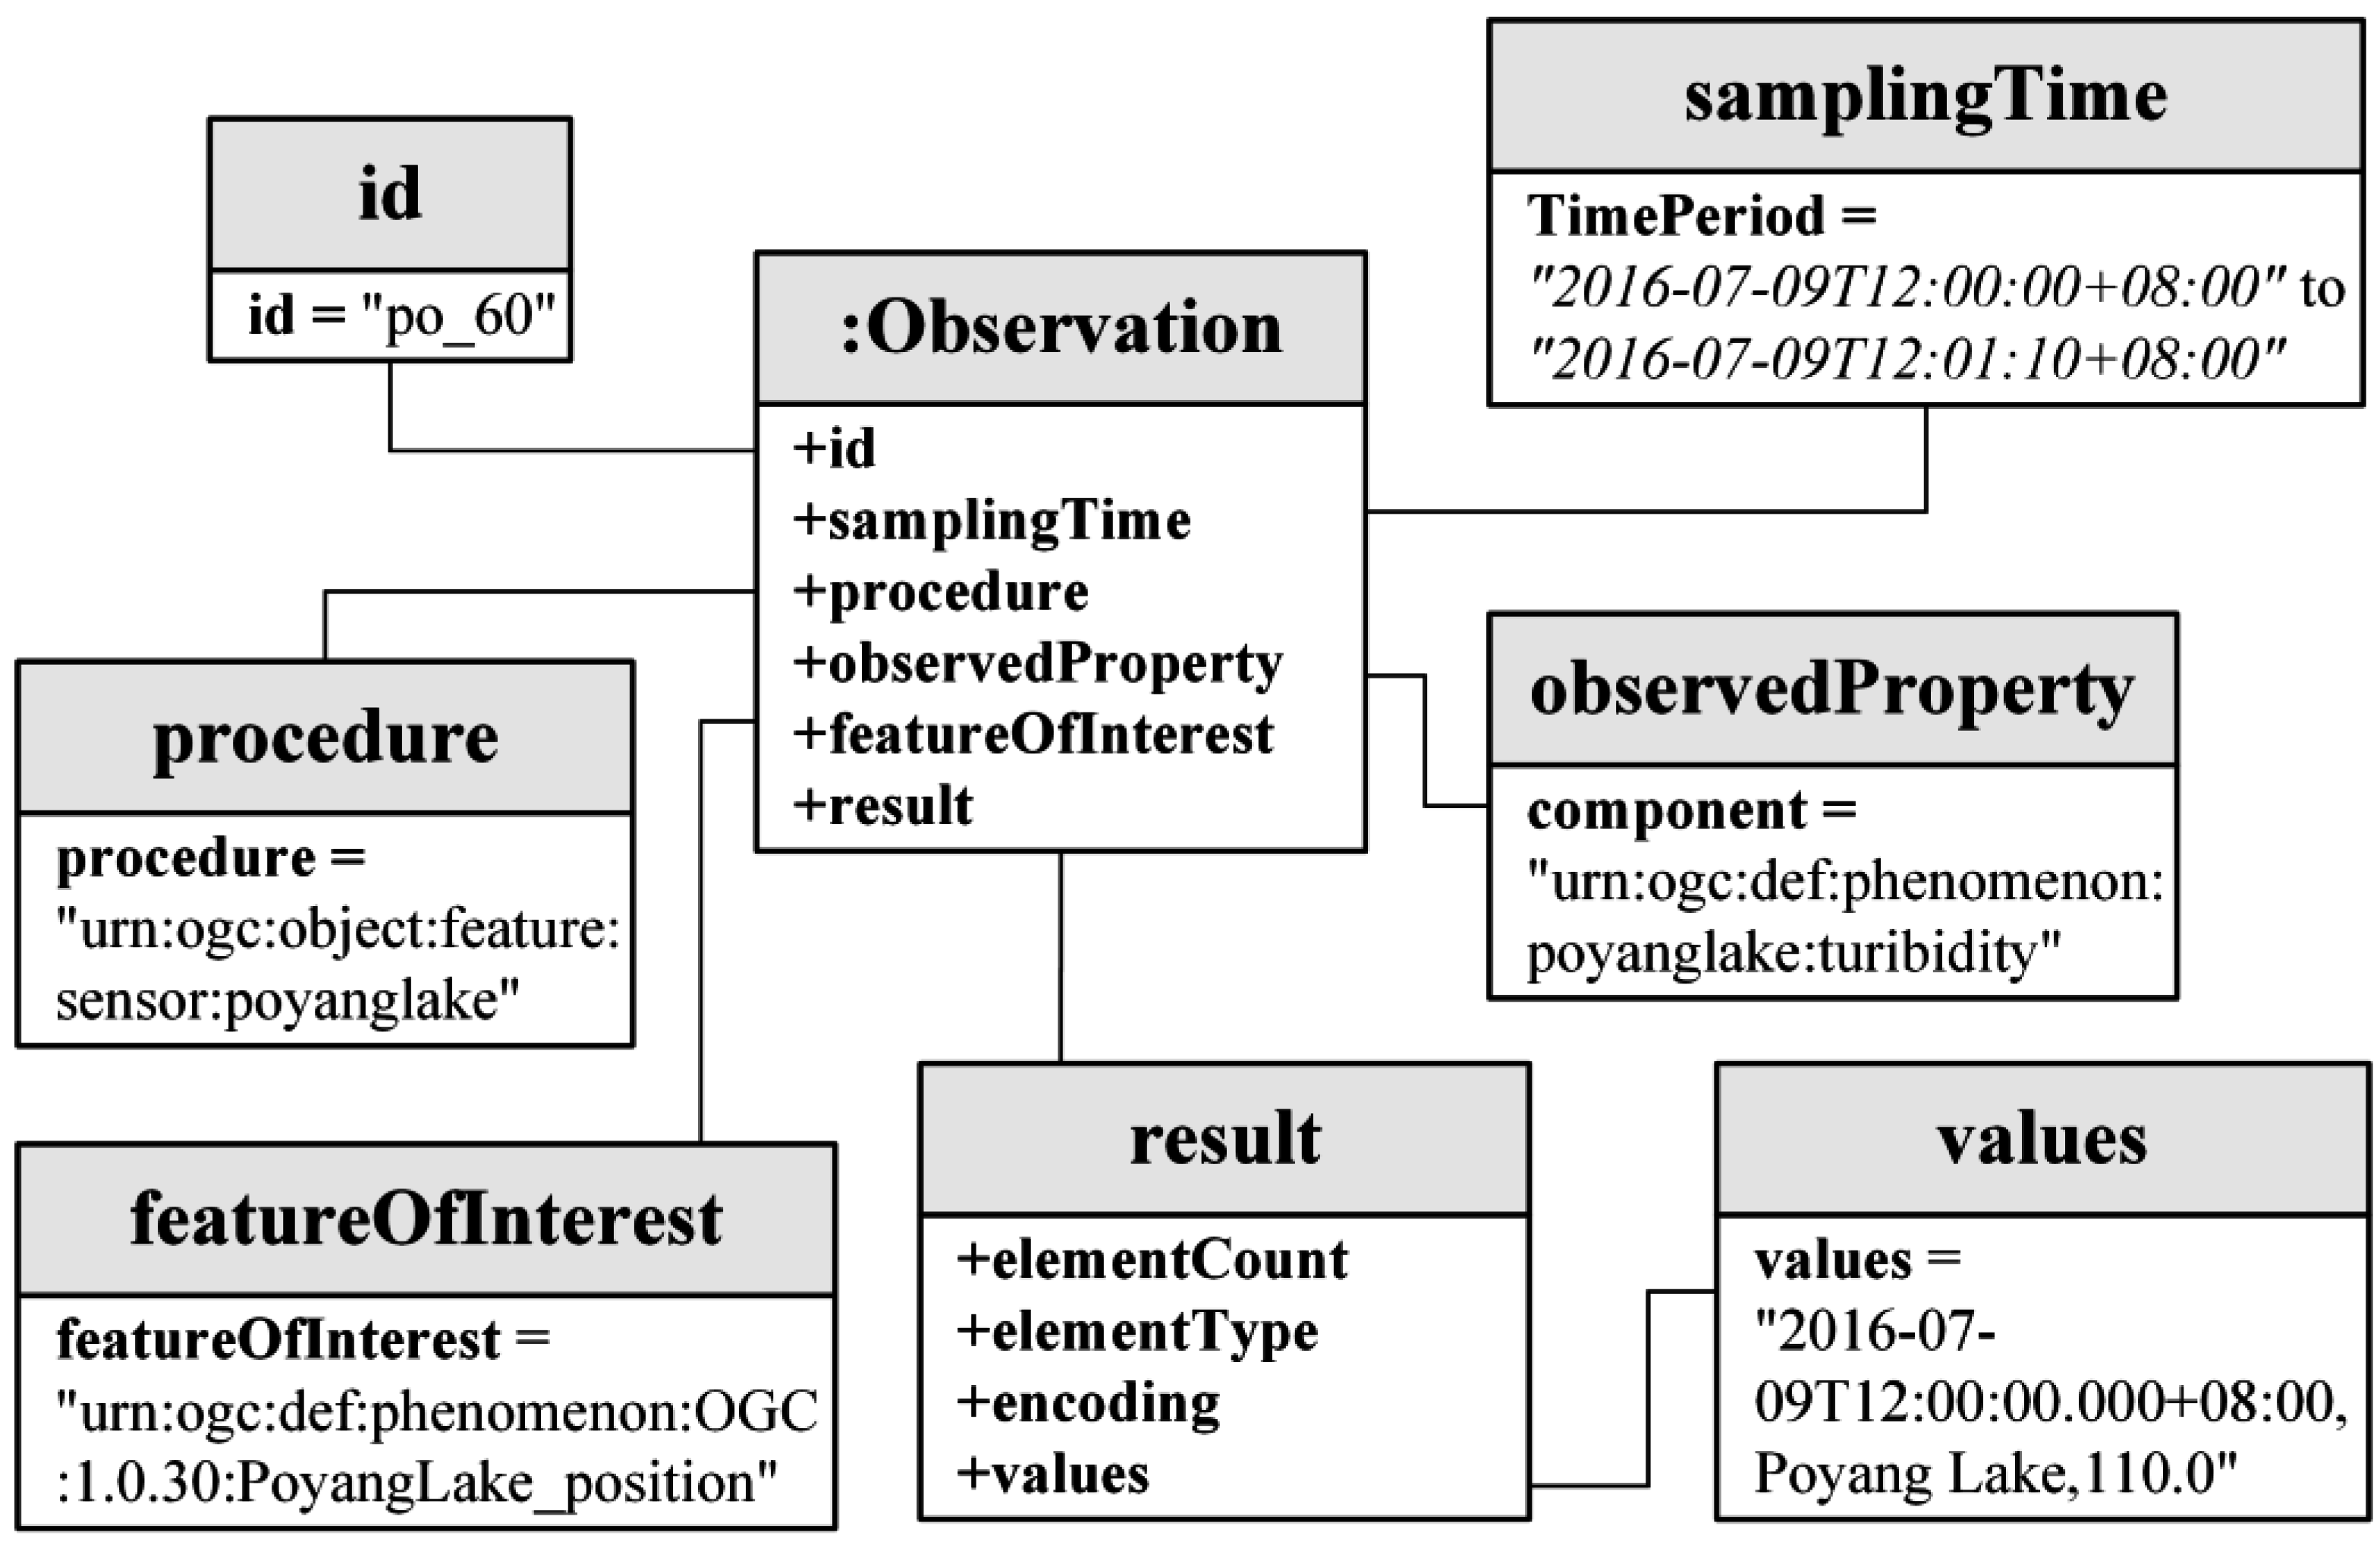
Figure 8 shows an instance of the Observation class. The child node in the Contents is the Observation class, which describes one sensor observation using the following elements: id, samplingTime, procedure, observedProperty, featureOfInterest, and result. The TSSC values for the observation are recorded in the result node. According to the event-driven mechanism described in Section 2, observations are pushed into an event channel and compared with event patterns. The values of the child nodes, such as procedure, observedProperty and result, are used to perform filter matching.
When a sediment concentration received from the in situ sensors exceeds the threshold (greater than 50 mg/L), an alert will automatically be sent to subscribers by the WNS. The SES delivers a DoNotification request to the WNS, which will then notify subscribers via a specified means, such as email. The abnormal observation contents are included in the notification message. Once the message is received, the responder workflow begins to plan and schedule sensor resources for coordinated observations among multi-source sensors, such as satellites or unmanned aerial vehicles (UAVs). The next step is to access the new observation data through the SOS. Remote sensing data from Earth observations are provided by the SOS instead of needing to be manually downloaded. Because an SOS can provide real-time or near-real-time observations, it can avoid the time delays incurred in manual operations and communication. The remote sensing data will be automatically sent to the “Water Turbidity” workflow for live geoprocessing. Finally, the hydrological geoprocessing workflow will be automatically executed to process the new observations.
This case study demonstrates that the event-driven service method is able to assist with event subscription, detection, notification and response in a real flooding scenario. The proposed approach can reduce the complexity of hydrological resource retrieval, spatial analysis processing, information extraction, message notification and map generation compared with the traditional manual monitoring approach. Users often process local remote sensing data manually using desktop analysis software. Using the proposed approach, however, users need not check observations on a regular basis to recognize when an anomaly has occurred.

5. Evaluation and Discussion

5.1. Evaluation

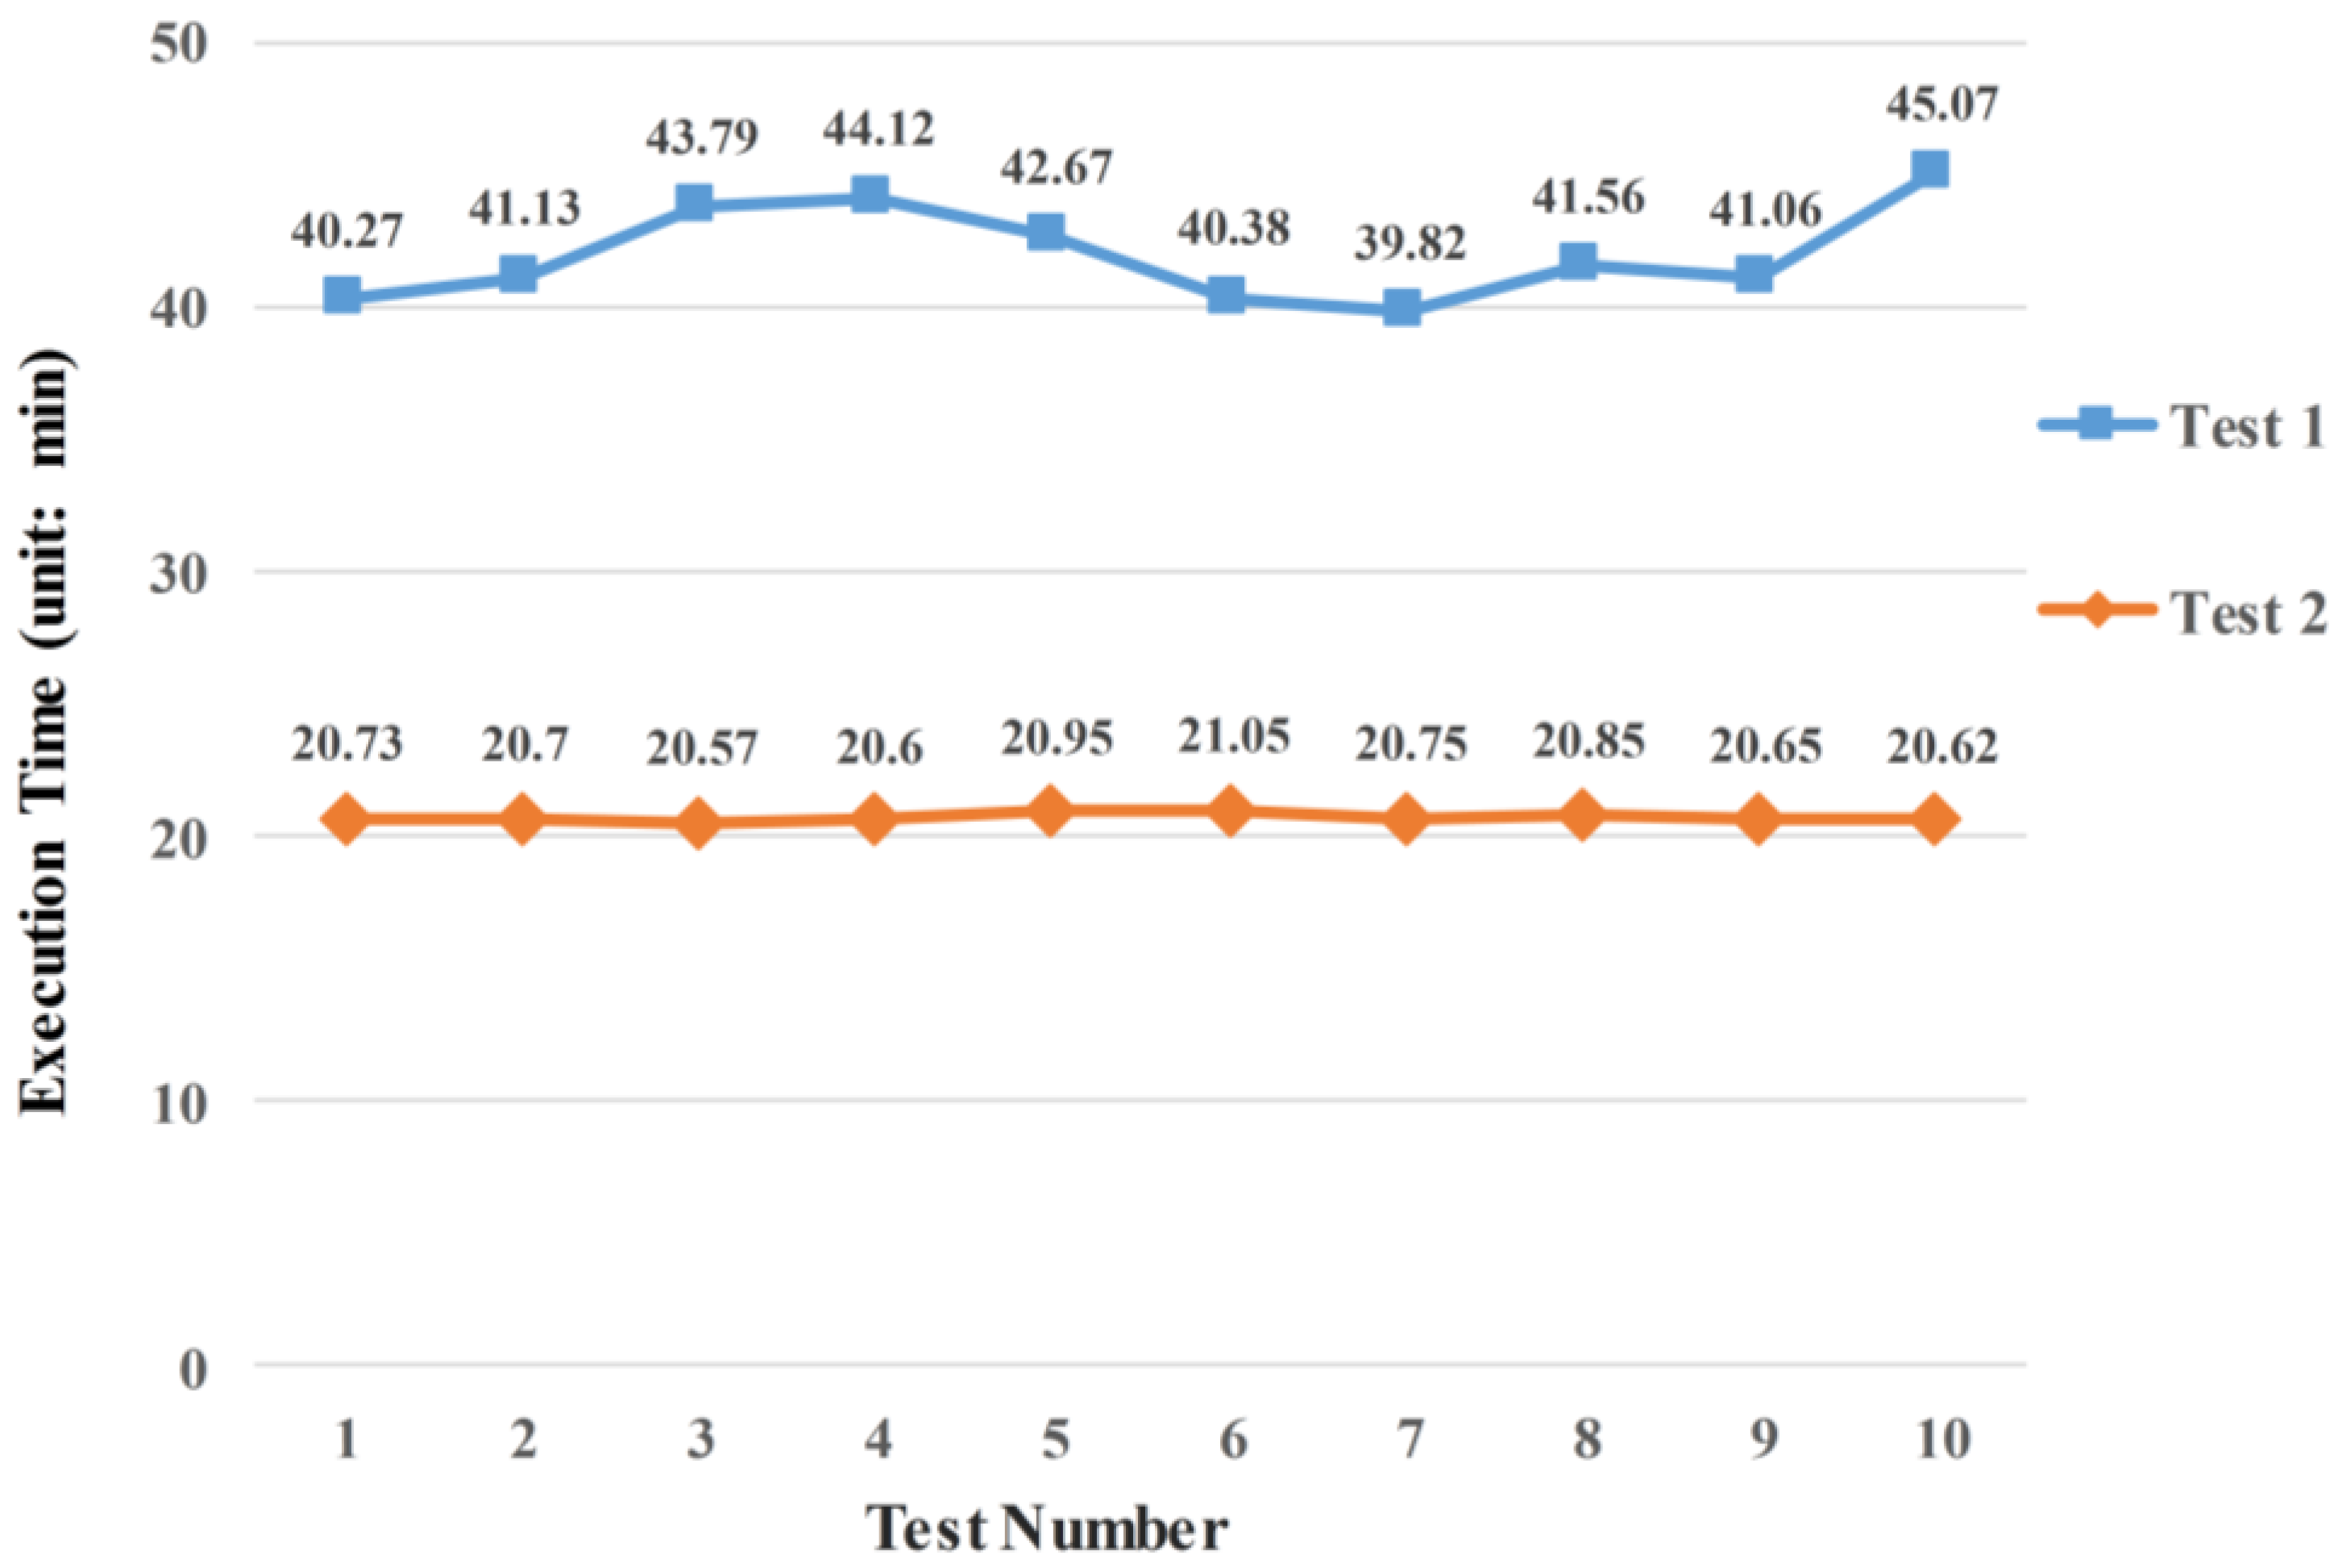
To evaluate the effectiveness and practicality of the proposed approach, we performed two experiments. One was to compare the processing performance between the traditional manual hydrological processing method and the event-driven service approach. The other was to assess the execution efficiency by executing the turbidity extraction workflow/services on different servers. The input observation was obtained from the sensors on the Chinese GF-1 satellite. For the chosen example observation recorded on 21 September 2014, the image volume is 0.98 GB. The turbidity extraction workflow includes the following processes: orthorectification, radiometric calibration, atmospheric correction, clipping, NDWI calculation, mask building, and silt inversion.
Figure 9 illustrates the performance results in the first experiment. Both Test 1 and 2 are performed on regular personal computers (PCs), each equipped with a 3.60 GHz Intel(R) Core(TM) i7 processor and 8.0 GB of memory, running the Microsoft Windows 10 operating system. Traditionally, hydrological users often use a local approach, in which they manually process data using desktop GIS software or tools. In the manual approach (Test 1), ten graduate students with sufficient background knowledge and computer skills were invited to participate in the experiment. They were trained to perform the necessary manual operations using desktop GRASS software. The time cost (e.g., 40.27 min) by each student in Test 1 was recorded, starting from when the input data is opened in the GRASS software and ending at the completion of all the operations. In the workflow approach (Test 2), the executable workflow for turbidity extraction was performed ten times using services deployed on distributed PCs on a local network. The execution time (e.g., 20.73 min) for each execution of the workflow in Test 2 was recorded, starting from the invocation of the workflow and ending with the return of the response. To avoid contingency effects, each execution time for the proposed approach was calculated as the average of the time costs of ten executions of the workflow. Figure 9 illustrates the obtained performance results. Compared with the proposed approach, the time curve for the manual approach shows significant fluctuations because of the variations in operation proficiency from person to person. The performance of the proposed approach is relatively stable because it is conducted automatically by computers, with little human intervention. Based on the results of the experiments, it can clearly be concluded that the proposed approach exhibits superior performance compared with the traditional method in terms of saving time and effort and shortening the wait times for endpoint consumers of hydrological disaster information.
The performance was further improved when the hydrological analysis services were migrated to high-performance computing servers. Figure 10 presents the results of performance tests conducted with the turbidity extraction services deployed on new servers (Test 3) with Intel(R) Xeon(R) E5-2692v2 2.20 GHz processors and 32.0 GB of memory, running Linux Ubuntu 12.04. These tests were performed in the same pattern with Test 2 to determine the actual effects on time costs. As shown in Figure 10, the time cost for executing the turbidity extraction workflow on high-performance servers is much lower than that for execution on PCs. The reason is that in this case, the Web services can automatically take advantage of remotely distributed computational resources, retrieve observations from various sources and perform hydrological analyses on them, following the previously designed steps of the workflow model. It should also be noted that the experiments were conducted over a local area network (LAN) with a speed of 1 Gbps. For a wide area network (WAN) with a lower transmission speed and a narrower bandwidth, additional optimized strategies will be necessary for the deployment of services on different servers; for example, several services may need to be deployed on a single server, or certain services may require servers with better connections. This task is beyond the scope of the current paper and will be studied in the future.

5.2. Discussion

Based on the experiment, the proposed workflow approach can offer several benefits for hydrological disaster management, compared with the traditional method in Test 1. Table 1 provides a comparison of the two approaches.
(1) From the perspective of hydrological users, the proposed approach provides a convenient and user-friendly way for users to interact with elementary hydrological analysis capabilities and utilize them in real hydrological disaster monitoring cases. The complexity of the technical details is hidden behind the workflow models, thereby significantly lowering the barrier to entry for users. The standardized service interfaces allow workflow models to be used to assemble hydrological services into workflows for complex tasks in a plug-and-play fashion. By contrast, traditional manual processing can only be performed by professionals with rich background knowledge and computer programming skills.
(2) From the perspective of hydrological services, the service-oriented hydrological analysis approach does not rely on any specific software or programs installed on users’ personal machines. The analysis can be conducted remotely via Web services. The use of standard interfaces allows various hydrological service providers to contribute reusable service modules that can be dynamically integrated into large Web-executable workflow models for use by others in the community as part of the implementation of the system as a whole.
(3) From the viewpoint of hydrological workflows, the proposed service approach achieves automated hydrological processing through an event-driven workflow execution process. By contrast, traditional manual methods require a high level of professional skill from endpoint users and are highly time-consuming and prone to error. The workflows automate the execution of business logic and can produce on-demand hydrological data products more quickly, with little or no manual intervention and fewer opportunities for error, which is especially beneficial for monitoring on-going hydrological disasters.
(4) From the viewpoint of knowledge management, existing workflow models allow analysts to interactively construct new, more complex workflow models. The knowledge of hydrological modellers is formulated and stored during the construction of workflow models. Through the sharing, reuse and addition of workflow models and service chains, this community-involved and open approach allows the system to grow and become more intelligent, gaining more powerful capabilities, as knowledge is continuously shared and accumulated. As knowledge about various aspects of a hydrological disaster becomes more certain, the results of the even-driven processing workflow will also become more accurate and reliable.

6. Conclusions and Future Work

This paper introduces an approach for developing a Web service system to support active hydrological disaster monitoring in a distributed Web environment. It presents a comprehensive design and implementation of automated real-time geoprocessing services for the processing of hydrological hazard information. By means of the integration of Sensor Web services, geoprocessing Web services and workflow technologies, the approach not only provides an interoperable and agile solution for performing hydrologic analyses in a community-involved, distributed Web environment but also allows reusable hydrological service modules to be accessed and linked together in an event-driven manner. The proposed system performs more automatic and intelligent data processing to facilitate the response of hydrological disaster decision-makers to hydrological hazard events and provide them with decision support based on sensor observations in a timely manner.
Future work will focus on improving the capabilities of the system and on applying it to the physical sensor networks deployed in Poyang Lake. As the lake is the largest fresh water lake in China, sensor networks have been widely installed in this area for active hydrological monitoring. We will further enrich the developed hydrological analysis services with more sophisticated domain-specific algorithms. In addition, we will apply event-driven processing to more different types of sensors in Poyang Lake to support more complex event-driven patterns.

Acknowledgments

We are grateful to anonymous reviewers for their constructive comments and suggestions. The work was supported by National Natural Science Foundation of China (91438203 and 41271397), Hubei Science and Technology Support Program (2014BAA087), and Key Laboratory of Poyang Lake Wetland and Watershed Research Jiangxi Normal University Ministry of Education (JXS-EW-08).

Author Contributions

Xi Zhai and Peng Yue conceived the experiments, designed the method, and wrote the paper. Peng Yue contributed the experiment data, supplied computing infrastructure and acted as corresponding author. Xi Zhai and Mingda Zhang performed the experiments and analyzed the data.

Conflicts of Interest

The authors declare no conflict of interest.

Appendix A. Process of Workflow Execution and Visualization for TSSC Calculations

Figure A1 shows the execution and monitoring of the processes included in the workflow. The rounded boxes in the workflow diagram represent geoprocessing services. The ellipses represent inputs or outputs of the services. When the execution of a geoprocessing service is complete, the colour of the corresponding rounded box will turn green.
Figure A1. The execution and monitoring of the processes executed as part of the turbidity extraction geoprocessing workflow.
Ijgi 05 00171 g011
Figure A2 presents a visualization of a set of TSSC calculation results. Generally, high TSSCs are found in many of the estuaries in the study region, and the TSSC values increase from south to north. These findings can largely be attributed to heavy rainfall and runoff from other rivers, which can lead to vast quantities of suspended sediment, as the northern part of the lake is closer to the Yangtze River than is the southern part. Topography and sand dredging activities may also affect the sediment concentrations.
Figure A2. A thematic image of the sediment concentrations in Poyang Lake.
Ijgi 05 00171 g012

Appendix B. Algorithms Used in TSSC Calculations

The detailed procedure of the RPC model is shown as Algorithm B1.
Algorithm B1. RPC Orthorectification
Take a DEM as input data;
for each P in an DEM:
  • Calculate (X, Y) coordinate of P;
  • Convert (X, Y) to ( Υ , ϕ );
  • Interpolate DEM at ( Υ , ϕ ) to obtain H ;
  • Add geoid height: h = H + N ;
  • Calculate image coordinates with RPC equation: ( L ,   S ) = R P C ( Υ , ϕ ,   H ) ;
  • Interpolate the input DEM at ( L , S ) to determine the D N value of P;
where P identifies a pixel, Υ is the longitude, ϕ is the latitude, and H is the orthometric height, N is the geoid height, h is the ellipsoidal height, L is the line of the input image, S is the sample index, D N is the pixel grey value.
Output:
An image in GeoTIFF format.
The details of the radiometric calibration method are represented as Algorithm B2.
Algorithm B2. Radiometric Calibration
Take the calculation result of Orthorectification as input data;
for each band:
  • Convert remotely sensed DN values to at-satellite radiance based on the gain and bias with radiometric calibration equation: L s a t λ = G a i n × D N + B i a s ;
where L s a t λ is the at-satellite spectral radiance in the given spectral band ( W · m 2 · sr 1 · μ m 1 ), G a i n represents the gain for the given spectral band ( W · m 2 · sr 1 · μ m 1 ), B i a s is the offset for the given spectral band ( W · m 2 · sr 1 · μ m 1 ), and D N is the calibrated pixel grey value.
Output:
An image in GeoTIFF format.
The details of the atmospheric correction are given as Algorithm B3.
Algorithm B3. Atmospheric Correction
Take the calculation result of radiometric calibration as input data;
 Select the COST model to do atmospheric correction;
 Calculate the minimum spectral radiance: L minimum = L min + QCAL × ( L max L min ) / Q C A L max ;
 Calculate the blackbody radiation: L blackbody = 0.01 × E s u n λ × cos 2 θ / ( π × D 2 ) , usually the blackbody radiation equals 1% of the blackbody radiation of each band;
 Calculate the atmospheric path radiance ( L h a z e λ ) with the equation:
L h a z e λ = L minimum L blackbody ;
L h a z e λ = L min + QCAL × ( L max L min ) / Q C A L max 0.01 × E s u n λ × cos 2 θ / ( π × D 2 ) ;
 Calculate the spectral reflectance of the surface ( R λ ) with the COST equation:
R λ = π × D 2 × ( L s a t λ L h a z e λ ) / E s u n λ cos 2 θ ;
where Q C A L is pixel grey value of any band, Q C A L max represents the Maximum grey value, L min is the lower limit of spectral radiance, L max is the upper limit of spectral radiance, E s u n λ is the Exo-atmospheric solar irradiance, and θ is the Sun’s zenith angle, D is the distance between the Earth and the Sun, L s a t λ is the at-satellite spectral radiance in the given spectral band.
Output:
An image in GeoTIFF format.
The calculation procedure of the NDWI is described as Algorithm B4.
Algorithm B4. NDWI Calculation
Transform an input image into a pixel matrix (PM);
Define an output image matrix ( P N D W I ) to store the calculation results of N D W I ;
for i ← 1 to X-axis size of PM:
 for j ← 1 to Y-axis size of PM:
  Extract water area with N D W I equation:
   P N D W I [ i ,   j ] = ( P M 2   [ i ,   j ] P M 4   [ i ,   j ] ) / ( P M 2   [ i ,   j ] + P M 4   [ i ,   j ] ) ;
where P N D W I [ i ,   j ] is the pixel value of i th row and j th column in P N D W I ,   P M 2   [ i ,   j ] is the pixel value of i th row and j th column of band 2 in PM, P M 4   [ i ,   j ] is the pixel value of i th row and j th column of band 4 in PM.
Output:
An image in GeoTIFF format.
The details of the binarization calculate is listed as Algorithm B5.
Algorithm B5. Binarization
Take the calculation result of N D W I as input data;
Transform the input image into a pixel matrix ( P N D W I );
Define a matrix ( P B i n a r i z a t i o n ) to store the calculation results of B i n a r i z a t i o n ;
for i ← 1 to X-axis size of P N D W I :
 for j ← 1 to Y-axis size of P N D W I :
  if P N D W I [ i ,   j ] < 0:
    P B i n a r i z a t i o n [ i ,   j ] ← 1 △ water area
  else:
    P B i n a r i z a t i o n [ i ,   j ] ← 0 △ non-water area
where P N D W I [ i ,   j ] is the pixel value of i th row and j th column in P N D W I , P B i n a r i z a t i o n [ i ,   j ] is the pixel value of i th row and j th column in P B i n a r i z a t i o n .
Output:
An image in GeoTIFF format.
The procedure of the mask building is described as Algorithm B6.
Algorithm B6. Mask Building
Take the calculation result of B i n a r i z a t i o n   and a pre-processed image as input data;
Transform the binary image into a pixel matrix ( P B i n a r i z a t i o n ) and transform the pre-processed image into a pixel matrix ( P i m a g e );
Define a matrix ( P W a t e r ) to store the water extraction results;
Traverse all pixels in input images and perform band-by-band multiplication of the binary image with the pre-processed image to calculate the true pixel values in water area;
for i ← 1 to X-axis size of P B i n a r i z a t i o n :
 for j ← 1 to Y-axis size of P B i n a r i z a t i o n :
  for k ← 1 to band number of the pre-processed image:
     P W a t e r [ k ,   i ,   j ] P B i n a r i z a t i o n [ i ,   j ] × P i m a g e [ k , i ,   j ] ;
where P B i n a r i z a t i o n [ i ,   j ] is the pixel value of i th row and j th column in P B i n a r i z a t i o n , P i m a g e [ k , i ,   j ] is the pixel value of k th band, i th row and j th column in P i m a g e , P W a t e r [ k ,   i ,   j ] is the true pixel value of k th band, i th row and j th column in P W a t e r .
Output:
An image in GeoTIFF format.
The algorithm procedure of the silt inversion is described as Algorithm B7.
Algorithm B7. Total Suspended Sediment Concentration (Silt Inversion)
Take the calculation result of mask building as input data;
Transform the input image into a pixel matrix ( P W a t e r );
Define a matrix ( P T S S C ) to store the calculation results of TSSC.
for i ← 1 to X-axis size of P W a t e r :
 for j ← 1 to Y-axis size of P W a t e r :
P T S S C [ i ,   j ] ← 0.4023exp(46.457 × ( P W a t e r [ 2 ,   i ,   j ] + P W a t e r [ 3 ,   i ,   j ] ) × P W a t e r [ 3 ,   i ,   j ] / P W a t e r [ 2 ,   i ,   j ] ))
where P W a t e r [ 2 ,   i ,   j ] is the pixel value of 2 nd band, i th row and j th column in P W a t e r , P W a t e r [ 3 ,   i ,   j ] is the pixel value of 3 rd band, i th row and j th column in P W a t e r , P T S S C [ i ,   j ] is the pixel value of i th row and j th column in P T S S C .
Output:
An image in GeoTIFF format.

Appendix C. Process of Publishing a Web Processing Service Using Dynamic Link Library

The basic procedure of publishing a Web processing service is given as Algorithm C1.
Algorithm C1. Publishing a Web Processing Service Using Dynamic Link Library
  • Take export the C++ program as dynamic link library;
    (1)
    Create a JAVA class and compile this class;
    (2)
    Use the javah commend to generate the head file;
    (3)
    Write implementation to the head file in C++;
    (4)
    Export to dynamic link library;
  • Export to dynamic link library;
  • Load this library in Java;
  • Algorithm implementation;
    (1)
    Confirm input and output parameters;
    (2)
    Finish set method for input parameter and get method for output parameter;
    (3)
    Add execute method using JAVA codes;
  • Publish the algorithm as service;
    (1)
    Confirm service name, input and output parameters;
    (2)
    Add “DescribeProcess“ xml document;
    (3)
    Algorithm registration: add the algorithm name in the configuration file “config/common_algorithms.properties”;
    (4)
    Deployed the compiled JAVA classes to a Tomcat server;

References

  1. Yue, P.; Zhang, C.; Zhang, M.; Zhai, X.; Jiang, L. An SDI approach for big data analytics: The case on sensor web event detection and geoprocessing workflow. IEEE J. Sel. Top. Appl. Earth Observ. 2015, 8, 4720–4728. [Google Scholar] [CrossRef]
  2. Stefanov, W.L.; Vanderbloemen, L.A.; Lawrence, S.J. The I4 online query tool for earth observations data. In Proceedings of the International Space Station (ISS) Research and Development Conference, Boston, MA, USA, 7–9 July 2015.
  3. Guo, H.-D.; Zhang, L.; Zhu, L.-W. Earth observation big data for climate change research. Adv. Climat. Chang. Res. 2015, 6, 108–117. [Google Scholar] [CrossRef]
  4. Geospatial Data Abstraction Library (GDAL). Available online: http://www.gdal.org/ (accessed on 26 July 2016).
  5. Jiang, Y.; Sun, M.; Yang, C. A generic framework for using multi-dimensional earth observation data in GIS. Remote Sens. 2016, 8. [Google Scholar] [CrossRef]
  6. Neteler, M.; Bowman, M.H.; Landa, M.; Metz, M. Grass GIS: A multi-purpose open source GIS. Environ. Model. Softw. 2012, 31, 124–130. [Google Scholar] [CrossRef]
  7. ENVI. Available online: http://www.harrisgeospatial.com/ProductsandSolutions/GeospatialProducts/ENVI.aspx (accessed on 24 August 2016).
  8. Yue, P.; Baumann, P.; Bugbee, K.; Jiang, L. Towards intelligent giservices. Earth Sci. Inform. 2015, 8, 463–481. [Google Scholar] [CrossRef]
  9. Open Geospatial Consortium Standards. Available online: http://www.opengeospatial.org/docs/is (accessed on 26 July 2016).
  10. Deng, M.; Di, L.; Han, W.; Yagci, A.L.; Peng, C.; Heo, G. Web-service-based monitoring and analysis of global agricultural drought. Photogramm. Eng. Remote Sens. 2013, 79, 929–943. [Google Scholar] [CrossRef]
  11. Sun, Z.; Yue, P.; Di, L. Geopwtmanager: A task-oriented web geoprocessing system. Comput. Geosci. 2012, 47, 34–45. [Google Scholar] [CrossRef]
  12. Yue, P.; Gong, J.; Di, L.; Yuan, J.; Sun, L.; Sun, Z.; Wang, Q. GEOPW: Laying blocks for the Geospatial processing Web. Trans. GIS 2010, 14, 755–772. [Google Scholar] [CrossRef]
  13. Zhao, P.; Di, L. Geospatial Web Services: Advances in Information Interoperability; IGI Global: Hershey, PA, USA, 2010. [Google Scholar]
  14. Beran, M.A.; Arnell, N.W. Climate change and hydrological disasters. In Hydrology of Disasters; Springer: Berlin/Heidelberg, Germany, 1996; pp. 41–62. [Google Scholar]
  15. Guha Sapir, D.; Vos, F.; Below, R.; Ponserre, S. Annual Disaster Statistical Review 2010. The Numbers and Trends; Cred: Brussels, Belgium, 2011. [Google Scholar]
  16. Natural Disaster. Available online: https://en.wikipedia.org/wiki/Natural_disaster (accessed on 23 May 2016).
  17. Mateo-Lázaro, J.; Sánchez-Navarro, J.A.; García-Gil, A.; Edo-Romero, V. Flood frequency analysis (FFA) in Spanish catchments. J. Hydrol. 2016, 538, 598–608. [Google Scholar] [CrossRef]
  18. Mateo-Lázaro, J.; Sánchez-Navarro, J.A.; García-Gil, A.; Edo-Romero, V. SHEE program, a tool for the display, analysis and interpretation of hydrological processes in watersheds. In Mathematics of Planet Earth; Springer: Berlin/Heidelberg, Germany, 2014; pp. 303–307. [Google Scholar]
  19. Beven, K.; Kirkby, M.J. A physically based, variable contributing area model of basin hydrology/un modèle à base physique de zone d’appel variable de l’hydrologie du bassin versant. Hydrol. Sci. J. 1979, 24, 43–69. [Google Scholar] [CrossRef]
  20. Yang, D.; Herath, S.; Musiake, K. Comparison of different distributed hydrological models for characterization of catchment spatial variability. Hydrol. Process. 2000, 14, 403–416. [Google Scholar] [CrossRef]
  21. Crosta, G.; Frattini, P. Distributed modelling of shallow landslides triggered by intense rainfall. Nat. Hazard Earth Syst. 2003, 3, 81–93. [Google Scholar] [CrossRef]
  22. Metcalfe, P.; Beven, K.; Freer, J. Dynamic Topmodel: A new implementation in r and its sensitivity to time and space steps. Environ. Model. Softw. 2015, 72, 155–172. [Google Scholar] [CrossRef]
  23. Zhang, Z.; Zimmermann, N.; Poulter, B. Modeling spatial-temporal dynamics of global wetlands: Comprehensive evaluation of a new sub-grid topmodel parameterization and uncertainties. Biogeosciences 2016, 13, 1387–1408. [Google Scholar] [CrossRef]
  24. Liu, J.; Zhu, A.-X.; Qin, C.-Z.; Wu, H.; Jiang, J. A two-level parallelization method for distributed hydrological models. Environ. Model. Softw. 2016, 80, 175–184. [Google Scholar] [CrossRef]
  25. Castronova, A.M.; Goodall, J.L.; Elag, M.M. Models as Web services using the open geospatial consortium (OGC) Web processing service (WPS) standard. Environ. Model. Softw. 2013, 41, 72–83. [Google Scholar] [CrossRef]
  26. Vitolo, C.; Buytaert, W.; El-Khatib, Y.; Gemmell, A.; Reaney, S.; Beven, K. Cloud-Enabled Web Applications for Environmental Modelling; AGU Fall Meeting Abstracts; NASA: Greenbelt, MD, USA, 2012. [Google Scholar]
  27. Yue, P.; Zhang, M.; Tan, Z. A Geoprocessing Workflow system for environmental monitoring and integrated modelling. Environ. Model. Softw. 2015, 69, 128–140. [Google Scholar] [CrossRef]
  28. De Roo, A. Lisflood: A rainfall-runoff model for large river basins to assess the influence of land use changes on flood risk. In Ribamod: River Basin Modelling, Management and Flood Mitigation. Concerted Action; European Commission, EUR: Brussels, Belgium, 1999; Volume 18287, pp. 349–357. [Google Scholar]
  29. Van der Knijff, J.; Younis, J.; de Roo, A. Lisflood: A GIS-based distributed model for river basin scale water balance and flood simulation. Int. J. Geogr. Inform. Sci. 2010, 24, 189–212. [Google Scholar] [CrossRef]
  30. Ames, D.P.; Horsburgh, J.S.; Cao, Y.; Kadlec, J.; Whiteaker, T.; Valentine, D. Hydrodesktop: Web services-based software for hydrologic data discovery, download, visualization, and analysis. Environ. Model. Softw. 2012, 37, 146–156. [Google Scholar] [CrossRef]
  31. Cristofori, E.I.; Balbo, S.; Camaro, W.; Pasquali, P.; Boccardo, P.; Demarchi, A. Flood risk web-mapping for decision makers: A service proposal based on satellite-derived precipitation analysis and geonode. In Proceedings of the 2015 IEEE International Geoscience and Remote Sensing Symposium (IGARSS), Milan, Italy, 26–31 July 2015; pp. 1389–1392.
  32. Zhai, X.; Zhu, X.; Lu, X.; Yuan, J.; Li, M.; Yue, P. Metadata harvesting and registration in a geospatial sensor web registry. Trans. GIS 2012, 16, 763–780. [Google Scholar] [CrossRef]
  33. Jirka, S.; Bröring, A.; Stasch, C. In Applying OGC sensor web enablement to risk monitoring and disaster management. In Proceedings of the GSDI 11 World Conference, Rotterdam, The Netherlands, 15–19 June 2009.
  34. Percivall, G. The Opengis® Abstract Specification-Topic 12: Opengis® Service Architecture Version 4.3; OpenGIS® Project Document; OGC: Wayland, MA, USA, 2002. [Google Scholar]
  35. Liang, S.H.; Croitoru, A.; Tao, C.V. A distributed geospatial infrastructure for sensor web. Comput. Geosci. 2005, 31, 221–231. [Google Scholar] [CrossRef]
  36. Robin, A. SWE Common Data Model Encoding Standard; OGC: Wayland, MA, USA, 2011. [Google Scholar]
  37. Botts, M.; Robin, A.; Davidson, J.; Simonis, I. OGC Sensor Web Enablement: Architecture Document; Discussion Paper Version 1; Open Geospatial Consortium Inc.: Wayland, MA, USA, 2006. [Google Scholar]
  38. Luckham, D.; Schulte, R. Event Processing Glossary—Version 1.1; Event Processing Technical Society: New York, NY, USA, 2008. [Google Scholar]
  39. Michelson, B.M. Event-Driven Architecture Overview; Patricia Seybold Group: Bridgewater, MA, USA, 2006. [Google Scholar]
  40. Sharma, V.K.; Rao, G.S.; Amminedu, E.; Nagamani, P.; Shukla, A.; Rao, K.R.M.; Bhanumurthy, V. Event-driven flood management: Design and computational modules. Geo-Spat. Inform. Sci. 2016, 19, 39–55. [Google Scholar] [CrossRef]
  41. Everding, T.; Echterhoff, J. Event Pattern Markup Language (EML); Open Geospatial Consortium Inc.: Wayland, MA, USA, 2008. [Google Scholar]
  42. Liang, S. The JAVA Native Interface: Programmer’s Guide and Specification; Addison-Wesley Professional: Boston, MA, USA, 1999. [Google Scholar]
  43. Dial, G.; Grodecki, J. RPC replacement camera models. Int. Arch. Photogramm. Remote Sens. Spat. Inform. Sci. 2005, 34, 7–11. [Google Scholar]
  44. Zeng, Q.; Zhao, Y.; Tian, L.; Chen, X. Evaluation on the Atmospheric Correction Methods for Water Color Remote Sensing by Using HJ-1A/1B CCD Image—Taking Poyang Lake in China as a Case. Spectrosc. Spect. Anal. 2013, 33, 1320–1326. [Google Scholar]
  45. Lu, D.; Mausel, P.; Brondizio, E.; Moran, E. Assessment of atmospheric correction methods for Landsat TM data applicable to amazon basin LBA research. Int. J. Remote Sens. 2002, 23, 2651–2671. [Google Scholar] [CrossRef]
  46. Chavez, P.S. Image-based atmospheric corrections-revisited and improved. Photogramm. Eng. Remote Sens. 1996, 62, 1025–1035. [Google Scholar]
  47. Wang, J.; Lv, X.; Zhou, Y. Retrieval of suspended sediment concentrations in the turbid water of the Upper Yangtze River using Landsat ETM+. Chin. Sci. Bull. 2007, 52, 234–240. [Google Scholar] [CrossRef]
  48. McFeeters, S.K. The use of the normalized difference water index (NDWI) in the delineation of open water features. Int. J. Remote Sens. 1996, 17, 1425–1432. [Google Scholar] [CrossRef]
  49. Yu, Z.; Chen, X.; Zhou, B.; Tian, L.; Yuan, X.; Feng, L. Assessment of total suspended sediment concentrations in Poyang Lake using HJ-1a/1b CCD imagery. Chin. J. Oceanol. Limnol. 2012, 30, 295–304. [Google Scholar] [CrossRef]
  50. North Sensor Web Community. Available online: http://52north.org/communities/sensorweb/ (accessed on 26 July 2016).
  51. Guo, H.; Hu, Q.; Jiang, T. Annual and seasonal streamflow responses to climate and land-cover changes in the Poyang Lake Basin, China. J. Hydrol. 2008, 355, 106–122. [Google Scholar] [CrossRef]
  52. Pierson, T.C. Hyperconcentrated flow—Transitional process between water flow and debris flow. In Debris-Flow Hazards and Related Phenomena; Springer: Berlin/Heidelberg, Germany, 2005; pp. 159–202. [Google Scholar]
  53. Williams, G.P. Sediment concentration versus water discharge during single hydrologic events in rivers. J. Hydrol. 1989, 111, 89–106. [Google Scholar] [CrossRef]
  54. Hu, C.; Chen, Z.; Clayton, T.D.; Swarzenski, P.; Brock, J.C.; Muller-Karger, F.E. Assessment of estuarine water-quality indicators using MODIS medium-resolution bands: Initial results from Tampa Bay, FL. Remote Sens. Environ. 2004, 93, 423–441. [Google Scholar] [CrossRef]
Figure 1. Using Sensor Web services for hydrological disaster monitoring. SOS1 makes in situ sensor observations available for active monitoring and event detection. SOS2 is a service for providing observations planned by the SPS, which later can be sent to the WPS for geoprocessing.
Ijgi 05 00171 g001
Figure 2. The event processing flow in an event-driven mechanism for hydrological disaster monitoring.
Ijgi 05 00171 g002
Figure 3. The architecture of the proposed Sensor Web-enabled hydrological Web service system.
Ijgi 05 00171 g003
Figure 4. A wrapper for hydrological analysis programs.
Ijgi 05 00171 g004
Figure 5. Flowchart diagram illustrating the process of workflow-based hydrological service chaining.
Ijgi 05 00171 g005
Figure 6. The process of data monitoring and processing for the detection of excessive sediment concentrations.
Ijgi 05 00171 g006
Figure 7. The graphical user interface for event subscription in the turbidity extraction case.
Ijgi 05 00171 g007
Figure 8. An instance of the Observation class.
Ijgi 05 00171 g008
Figure 9. Performance tests of turbidity extraction achieved via manual operations and the proposed approach.
Ijgi 05 00171 g009
Figure 10. Performance tests of turbidity extraction on different servers.
Ijgi 05 00171 g010
Table 1. The advantages of the proposed approach.
CategoryTraditional MethodProposed Approach
WorkloadHeavyLight
Resource utilizationLocal resourcesDistributed resources
AutomationManual processingAutomatic processing
TimeLongShort
Professional skillsHighLow
Error proneOftenRarely
UsabilityLowHigh
Knowledge sharingLowHigh

