1. Introduction
Urban areas are recognized as playing a critical role in the regional economy, correlated with the growth of GDP and population, as appears in urbanized areas like China [
1]. Recently, an increase in the number of households has been associated with an increase in space for housing [
2]. Furthermore, there is a systematic dependence of urban productivity on city population size [
3]. If current trends in population density continue and all areas with high probabilities of urban expansion undergo change, then by 2030, urban land cover will increase by 1.2 million km
2 [
4].
A Study by Bettencourt [
5] shows that social life in the city increases with population size, where innovation growth is fueled by population growth. However, rapid urbanization and dramatic economic growth lead to a significant urbanization effect on the climate, based on analysis of impacts of land-use changes in surface temperature in urbanized areas [
6,
7]. In contrast, decreasing population growth could provide 16%–29% of the emissions reductions suggested to be necessary by 2050 to avoid dangerous climate change [
8]. Furthermore, a study by Bonfils and Lobell shows that irrigation expansion has had a large cooling effect on summertime average daily daytime temperatures [
9].
Studies on urbanization have been done by many researchers [
10,
11,
12], one of the most comprehensive studies is the work of Taubenböck [
13]. He analyzed 12 mega-cities on four continents, and found the different dimensions, dynamics and patterns across the analyzed mega-cities. Another study analyzed new shapes of the urban landscape through mapping dynamics and patterns of urbanization [
14]. The study revealed the evolution of cities from a polynuclei area to a mega-region.
However, from all the studies mentioned above, there is no optimized virtual geo-library system to disseminate the geo-spatial information that is available online and accessible from anywhere. Preparing geo-spatial information is important in documenting the extent of the earth's surface phenomena in a region, to investigate the distribution, types, pattern, recurrence and statistics of failures, to determine natural-hazard and human-disaster susceptibility, vulnerability and risk, and to study the evolution of landscapes and human-environment interaction that will shape the future.
New and emerging techniques based on remote sensing technologies, aerial photogrammetry, and terrestrial survey, promise to facilitate the production of the geo-spatial dataset, reducing the time and resources required for their compilation and systematic update.
Virtual geo-library development represents a natural answer to the growing requests for dissemination and use of geographical information data. This system originates from a combination of web technology and the Geographical Information System (GIS), which is a recognized technology that is mainly composed of data handling tools for storage, recovery, management and analysis of spatial data.
The purpose of this research study is to increase the Geo-literacy level of local people in their urban environment. Geo-literacy is a way of spatial thinking [
15,
16]; an ability to visualize and interpret location, relationship between location, movement, distance, direction, and landscape change through space, earth surface phenomena; an ability to understand human-environment interaction and finally shape the way of thinking about higher awareness of disaster. Such literacy is necessary for Indonesians. Here we propose the concept of Virtual Geo-library, which is a geo-spatial information system based on information infrastructure technology to study the earth surface phenomena. The main differences between traditional cartography and geovisualization is that the former focuses on the design and use of maps for the communication of known information, whereas the latter emphasizes the discovery of unknown information with the development of highly interactive maps and associated tools for data exploration and finally construct the spatial knowledge.
Geovisualization concerns the development of theories and methods to facilitate knowledge construction through visual exploration and analysis of spatial data and the implementations of visual tools for subsequent knowledge retrieval, synthesis, communication, and use [
17].
Earth observation can help to provide the geospatial data. Technologies for processing, storing, analyzing and visualizing geospatial data have advanced greatly in recent years and enable in building national and global Spatial Data Infrastructures (SDI). These new developments can contribute to improving prediction and monitoring of the environment. However, these technologies are still not fully exploited in urbanized environment management. The successful implementation of geospatial technologies requires a solid base of political support, laws and regulations, institutional responsibility, and trained people. Knowledge should be transferred from geoscience specialists and international bodies to professionals and decision makers working on environmental management with different technological backgrounds.
The specific objectives of this study are as follows:
To measure the urbanization process in Malang City, Indonesia.
To understand the better process of land use transformation in Malang City, Indonesia.
To create a new version of virtual geo-library for better geovisualization and geospatial data dissemination.
To provide all stakeholders with the innovative solution of ongoing problems.
2. Methodology
2.1. Study Area
Malang city is located in the East Java Province, Indonesia. Malang is the second largest city in East Java Province after Surabaya City. The city population, based on the 2010 Census, was 820,243 [
18]. Malang has a total area of 252,136 km
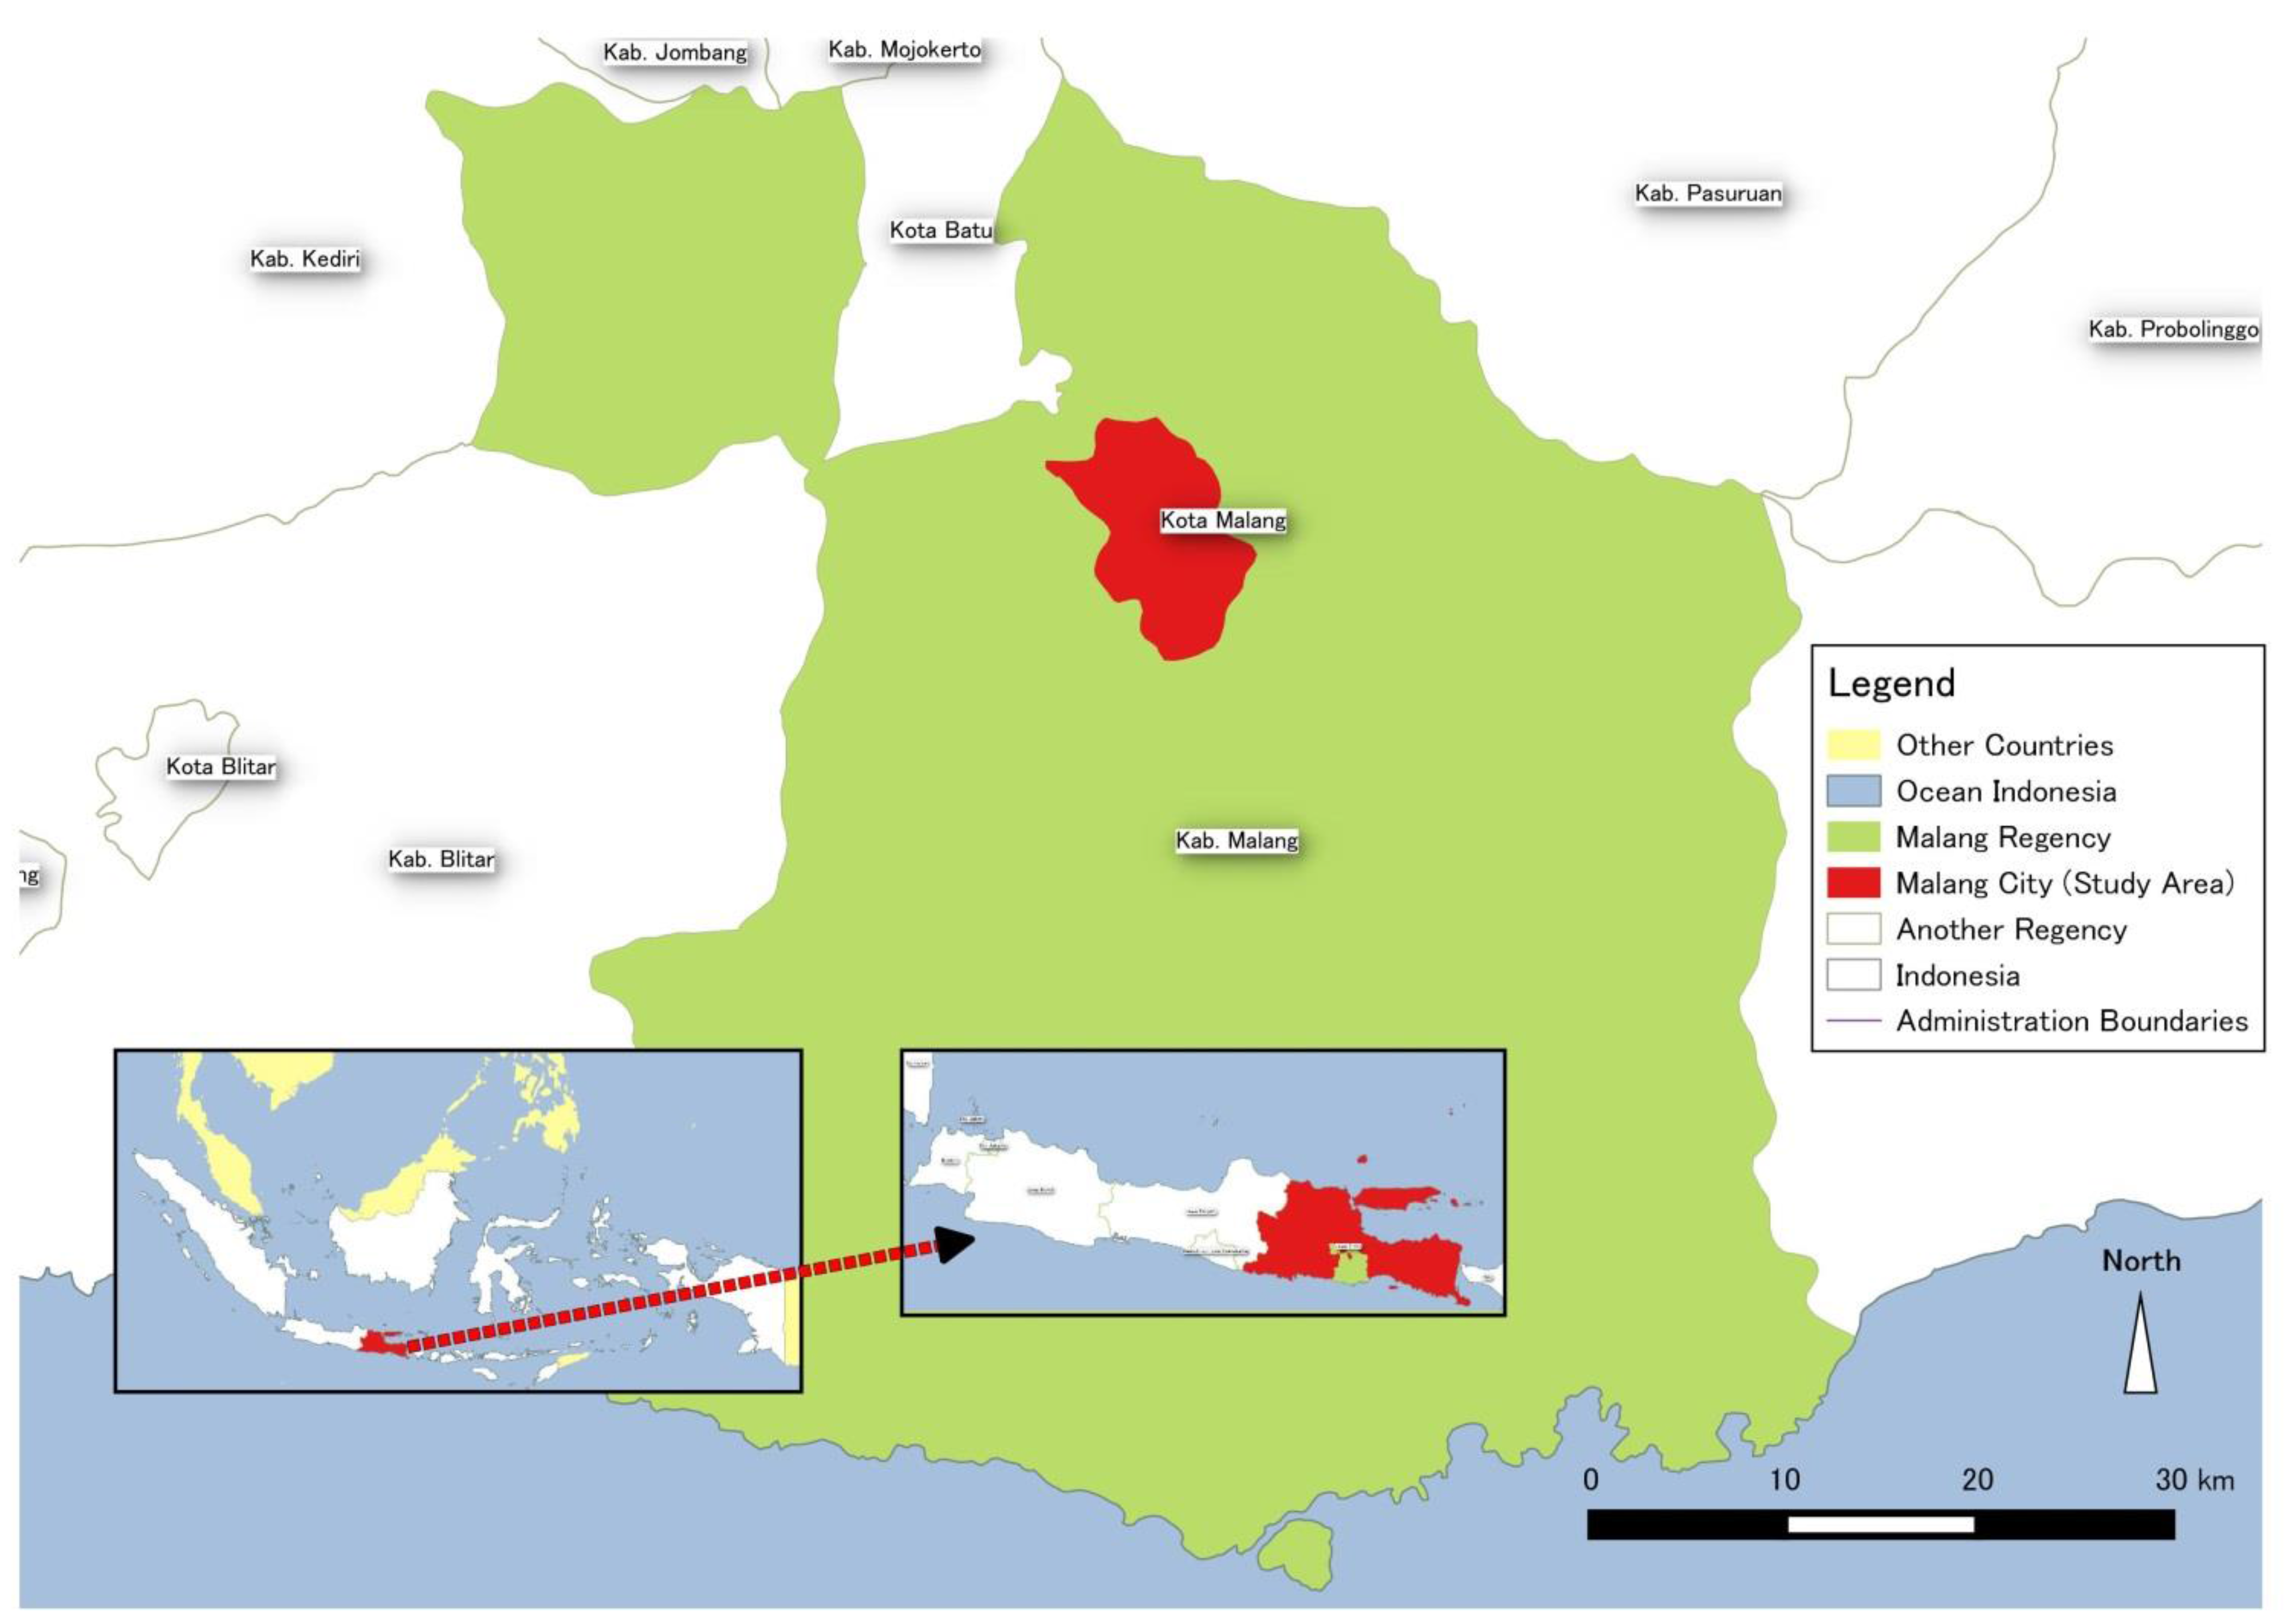
2. Malang City is an enclave located within Malang Regency (
Figure 1).
Malang City has been marked with steady economic and population growth. Further, along with population growth came urbanization. The government could not control the urbanization process, which led to the building of shanty towns along the rivers, rail tracks, and recently occupied higher lands.
2.2. Data
The analysis of urban land use transformation in this study was derived from four satellite sensors: Landsat 4, Landsat 5 TM, Landsat 7 ETM+ and Landsat 8 OLI [
19]. There is no difference in pixel resolution between Landsat 8 OLI and the other sensor that was used in this study; we only used the 30 m pixel resolution for consistency. Date acquisition of each sensor is shown in the
Table 1.
Figure 1.
Study area, Malang City is an enclave located within Malang Regency.
Figure 1.
Study area, Malang City is an enclave located within Malang Regency.
Table 1.
Date of acquisition of the satellite images used in this study.
Table 1.
Date of acquisition of the satellite images used in this study.
| Sensor | Acquisition |
|---|
| Landsat 4 TM | 28 March 1989 |
| Landsat 5 TM | 29 July 1996 |
| Landsat 7 ETM+ | 4 August 2001 and 5 August 2007 |
| Landsat 8 OLI | 1 September 2014 |
2.3. Land Cover Extraction
The main software used for analyzing the data is QGIS. We employed the SVM (Support Vector Machine) algorithm to extract the urban land use information, which is available from Orfeo ToolBox in QGIS. SVM is well known in the field of machine learning and pattern recognition, therefore it was introduced in the context of remote sensing [
20,
21,
22,
23,
24].
SVM provides good classification results from complex and noisy data. SVM is a classification system derived from statistical learning theory. It separates the classes with a decision surface that maximizes the margin between the classes.
There are four types of kernels available in SVM classifier: linear, polynomial, radial basis function (RBF), and sigmoid. The default is the radial basis function kernel, which works well in most cases. The mathematical representation of each kernel is listed below:
Linear
K(xi,xj) = xiTxj
Polynomial
K(xi,xj) = (gxiTxj + r)d, g > 0
RBF
K(xi,xj) = exp(-g||xi −: xj||2), g > 0
Sigmoid
K(xi,xj) = tanh(gxiTxj + r)
where:
g is the gamma term in the kernel function for all kernel types except linear.
d is the polynomial degree term in the kernel function for the polynomial kernel.
r is the bias term in the kernel function for the polynomial and sigmoid kernels.
g, d, and r are user-controlled parameters, as their correct definition significantly increases the accuracy of the SVM solution.
To employ SVM algorithm, we must first have ROIs (Region of Interests) selected to use as training pixels for each class. The more pixels, the better the results. The knowledge-based [
20] method is used to assign segmented ROIs. In this study, we employed RBF kernel in SVM classifier.
Before land cover classification, a 5-class classification system was designed with consideration of the land use properties of the study area as urban, bare land, agricultural land, forest and water.
2.4. Land Cover Classification Validation
The extensive field work survey was conducted from January to February, 2015 to verify points using the Trimble Juno 3B handheld GPS (Global Positioning System). Next, we generated confusion matrices to calculate Kappa coefficients (k) and to derive overall accuracy. We obtained overall accuracy assessment of 0.78 (see
Table 2) for the land cover year 2014. Unfortunately, we only provided the accuracy of land use for year 2014, since there are no datasets available to assess the accuracy of land use for other periods of analysis.
Table 2.
Accuracy assessment result.
Table 2.
Accuracy assessment result.
| Class/Region | Urban | Bare land | Agriculture | Forest | Water |
|---|
| Urban | 75.00% | 5.00% | 4.00% | 4.00% | 8.00% |
| Bare land | 7.00% | 72.00% | 4.00% | 7.00% | 4.00% |
| Agriculture | 5.00% | 9.00% | 77.00% | 9.00% | 9.00% |
| Forest | 3.00% | 4.00% | 9.00% | 76.00% | 3.00% |
| Water | 1.00% | 1.00% | 2.00% | 4.00% | 78.00% |
| Overall kappa = 0.78 | | | | | |
| Overall classification accuracy = 78.39% | | | | | |
2.5. Analysis of Land Use Transformation
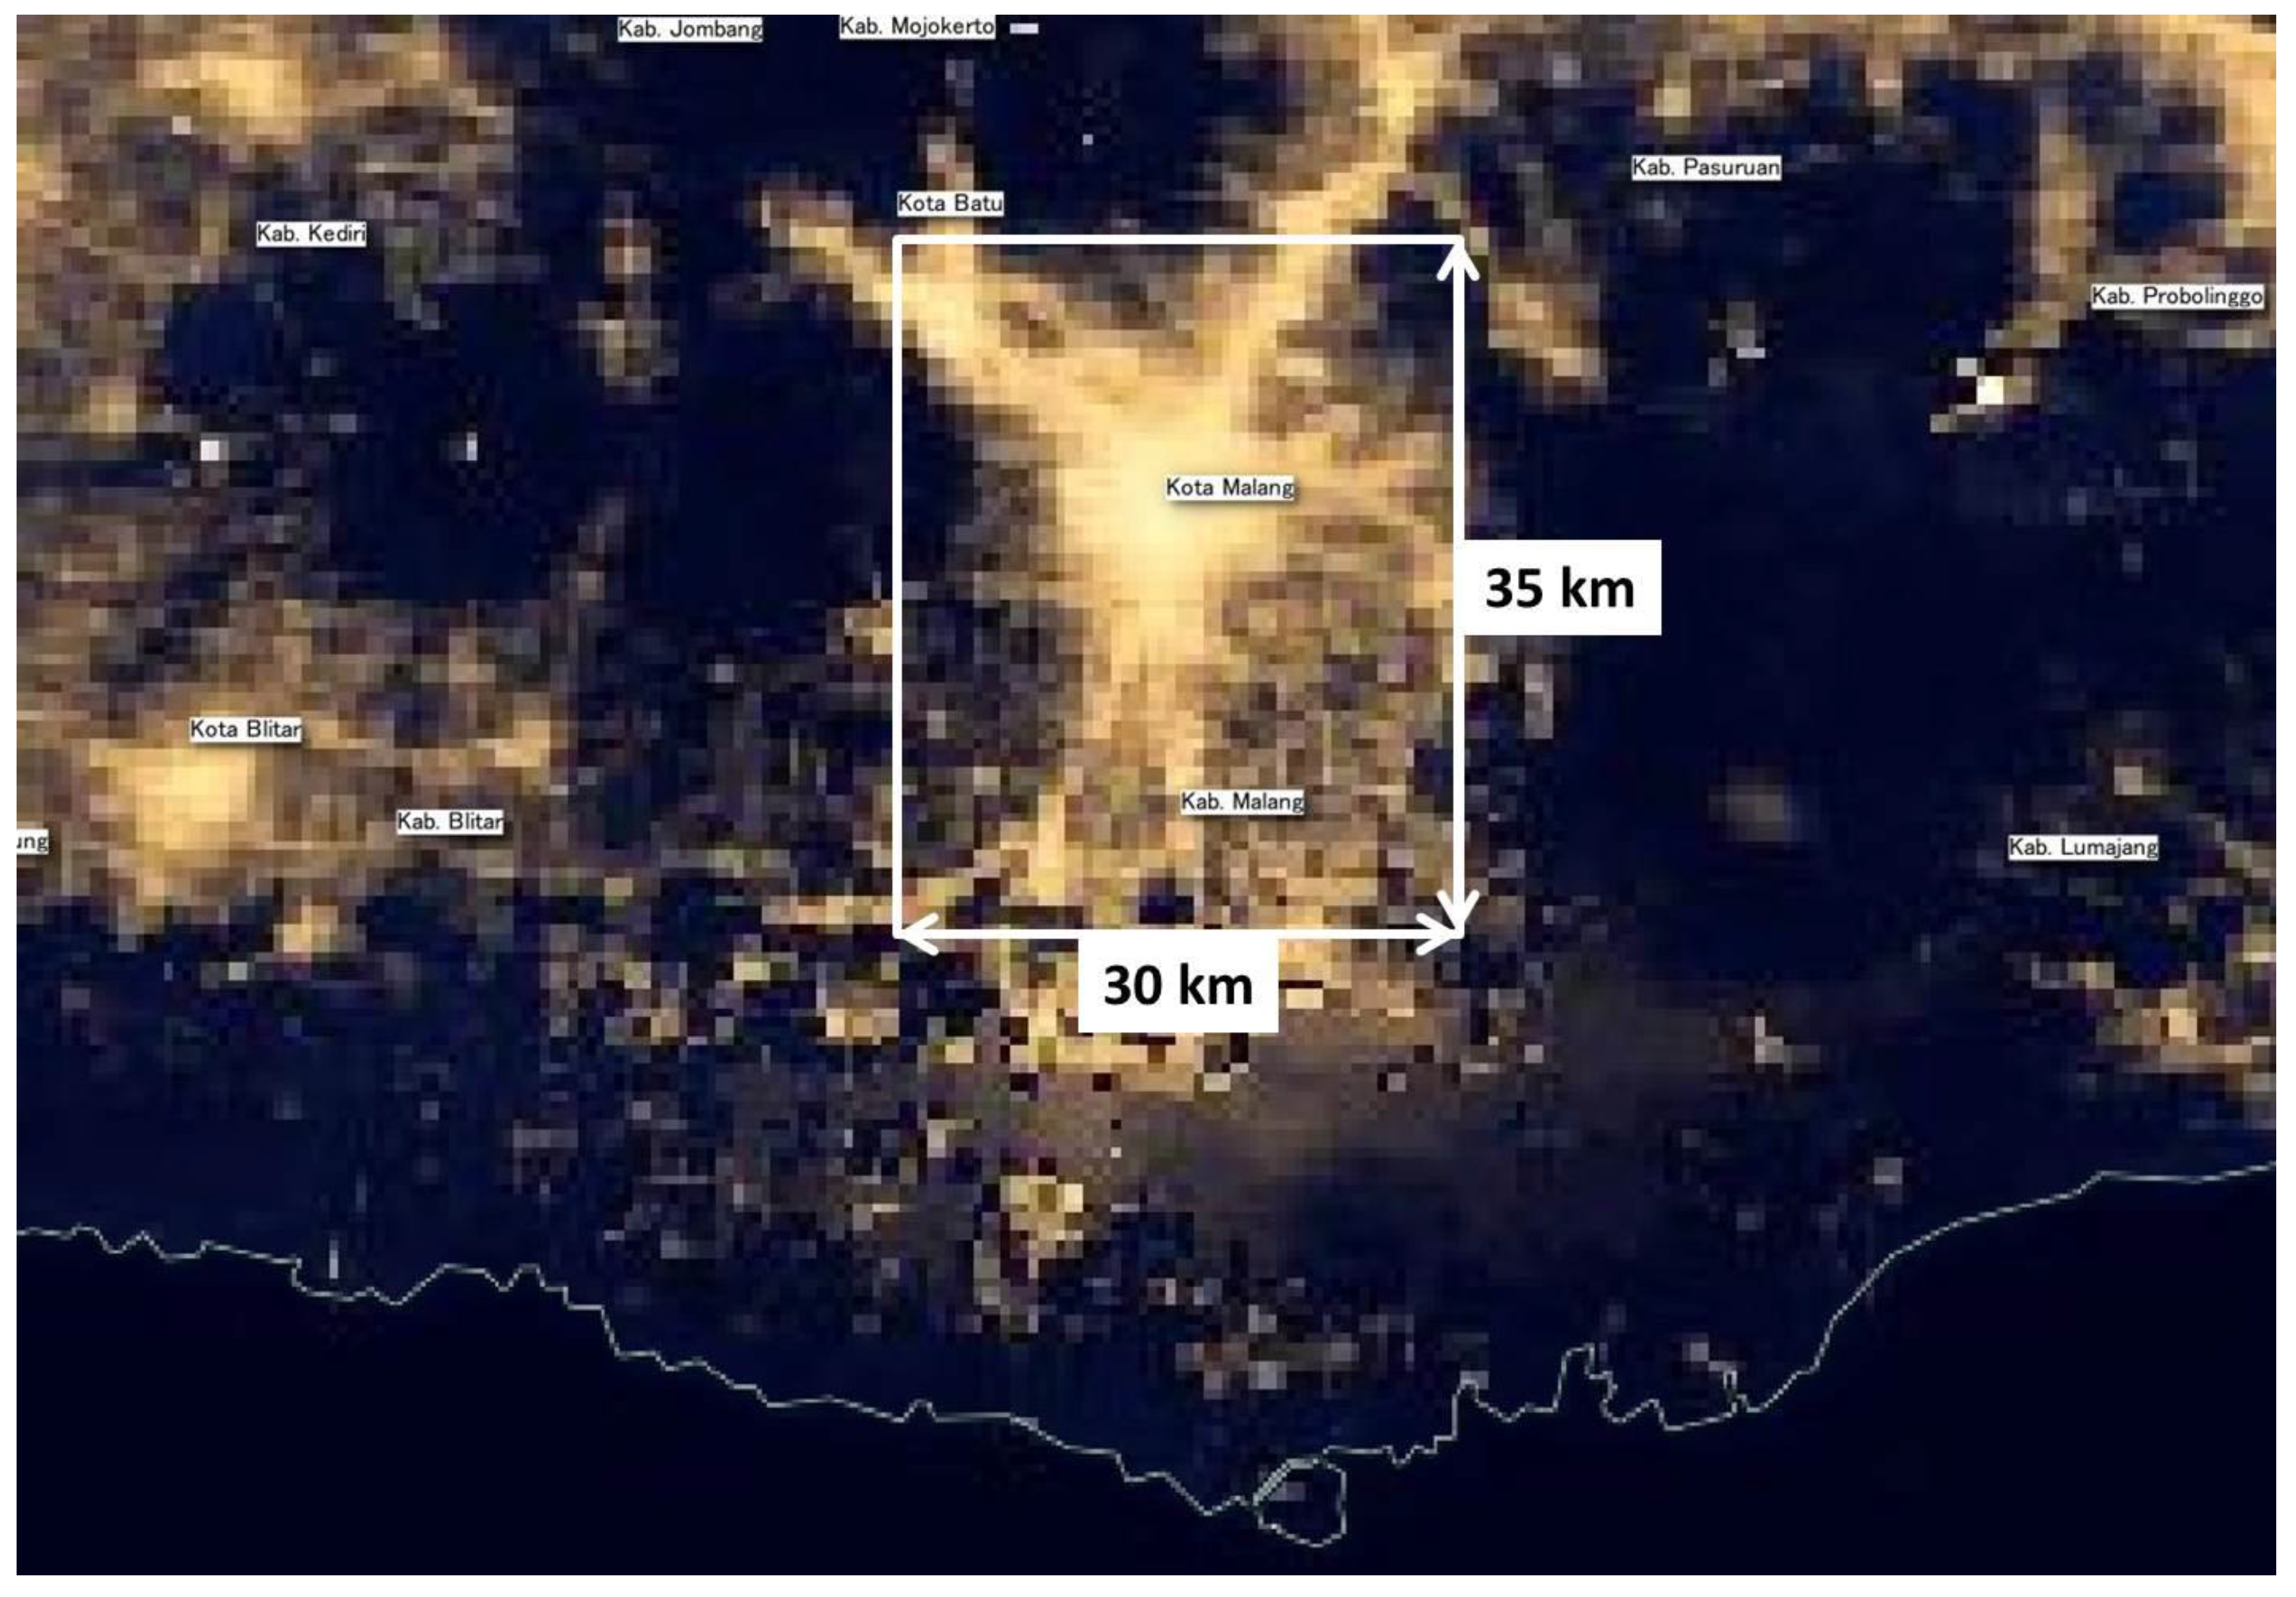
To assess the urban land use transformation, we compared all periods of analysis using map overlay method. Initial state map and final state map were compared to get change detection statistics. Instead, based on the administration boundary, the analysis of urban land use transformation in this study was done within the study area of 30 × 35 km. The scale of analysis of urban land use transformation in this study is based on night-time light images of the study area (
Figure 2), acquired from Suomi-NPP VIIRS (Visible Infrared Imager Radiometer Suite) sensor [
25]. We chose the urban night-time lights as the boundary of analysis since the urbanization extent is clearer than administration boundary-based. Cartographic design was done using QuantumGIS (QGIS) open source software.
Figure 2.
The scale of analysis based on night-time lights images acquired from Suomi-NPP VIIRS (Visible Infrared Imager Radiometer Suite) sensor [
25].
Figure 2.
The scale of analysis based on night-time lights images acquired from Suomi-NPP VIIRS (Visible Infrared Imager Radiometer Suite) sensor [
25].
2.6. Virtual Geo-Library Development
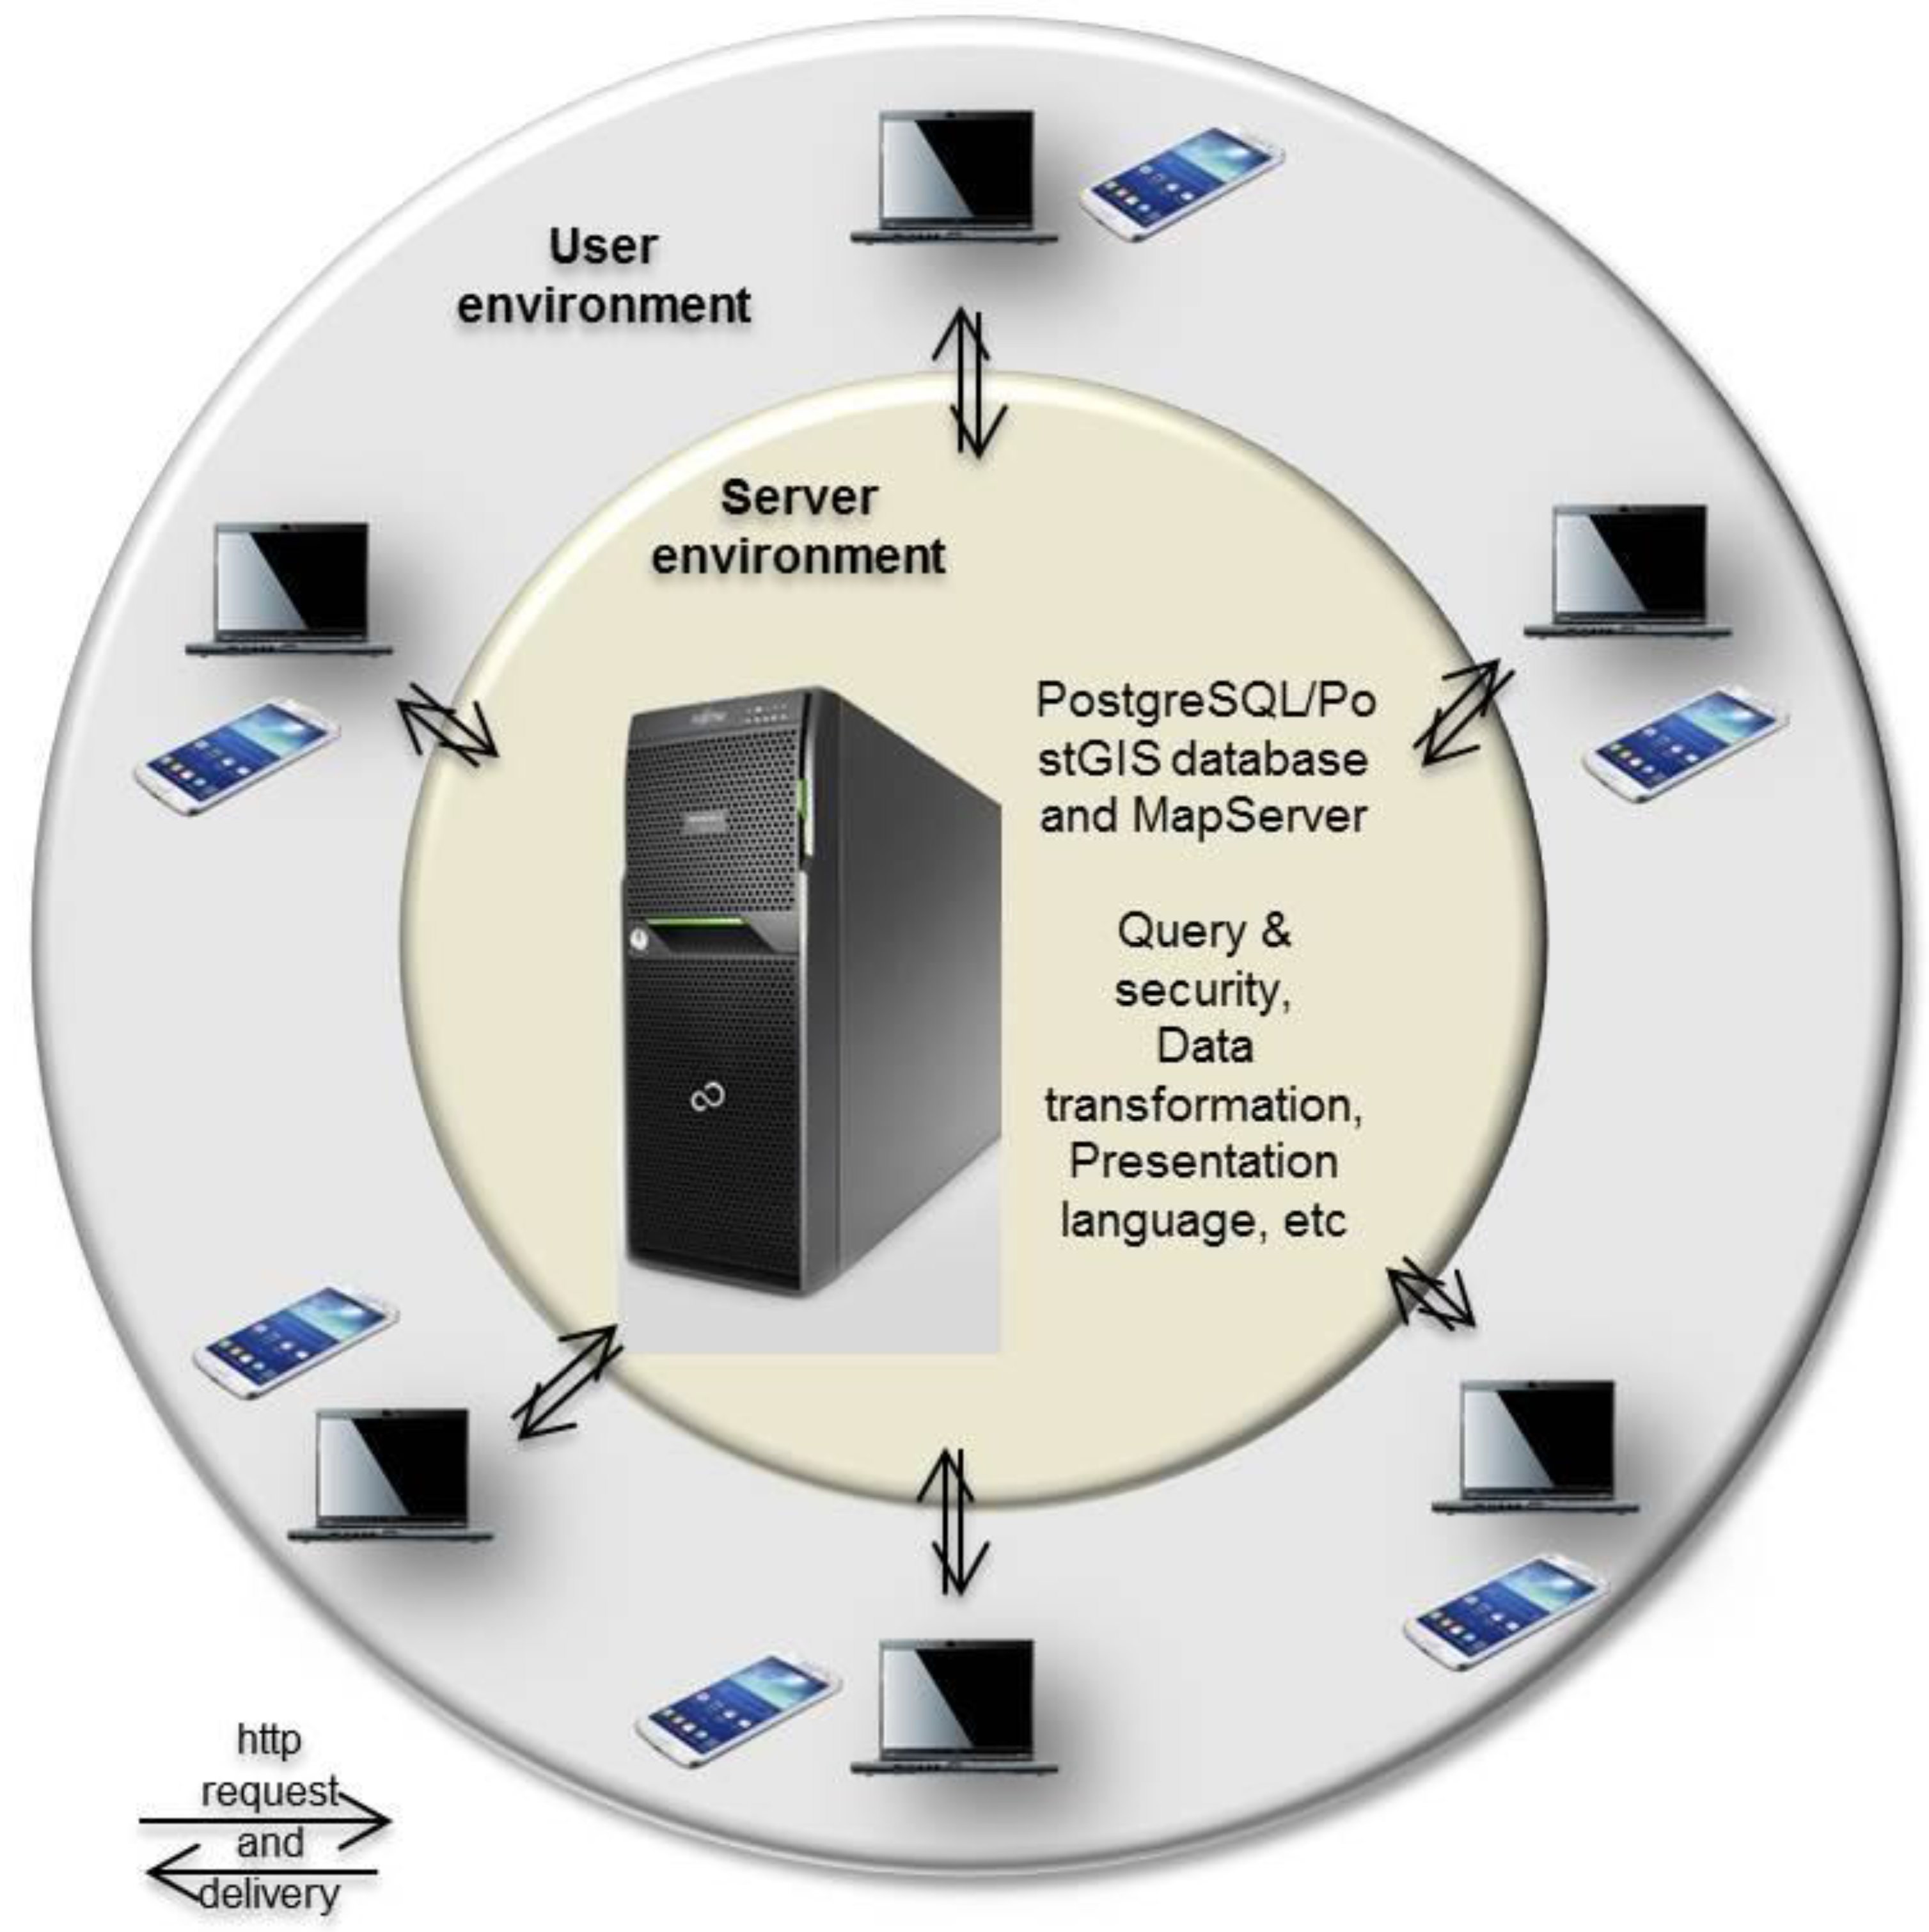
Our objective is to develop an interactive WebGIS and geodatabase for land use transformation in urbanized areas as well as human-environment interaction by providing maps and data in the virtual geo-library services. We used a Map Server that provides a web map service (WMS) using the same libraries as the QGIS, both are open source software. Java, HTML and Active Server Pages were used to customize our application. Our Web-based tool facilitates was used to share information globally, provide end-users a cost-saving solution to access up-to-date spatial datasets customized for a specific topic (that is, urbanization) to users with low education level and limited GIS knowledge.
The development of a virtual geo-library system consists of client viewer and server components (
Figure 3). The interface of client viewer is designed using HTML, CSS, and JavaScript; all of which are employed to facilitate the process of user input/request or to transfer them to the MapServer. The MapServer processes requests for maps and related information, and performs one or more map service functions such as image and metadata services. In this virtual geo-library, image services are used for generating image-based map output according to the user request. The MapServer handles incoming requests, tracks map services on the MapServer, and hands off requests to the Spatial Server.
Figure 3.
The architectural system of virtual geo-library.
Figure 3.
The architectural system of virtual geo-library.
The standard HTML viewer template is used in the Client Viewer to provide an interface of the WebGIS with the basic mapping functions, including map display, pan, zoom in/out, navigation, and other functions. The most frequently used tools include visualization tools (zoom in, zoom out, pan), map tool, and print out tool. With these tools, the user can effectively perform operations that are very helpful for their urban environmental monitoring.
Public users can access the application freely but cannot update, change, or modify the information. Only the authorized administrator could update the latest information. All users can get tabular data information from this application with an analysis tool. Further, they will be able to print out the map of urbanization with print out tool. With this virtual geo-library, all stakeholders have access from anywhere and anytime to the latest information available.
3. Result and Discussion
3.1. Private Housing Industry Development and Land Sources
The uncontrolled urbanization is happening due to the growth of the housing industry that occupied agricultural areas in the lowlands. As a result, diminishing farmland, and surrounded by the residential housing “cluster” type, fragmented agricultural land then appears in many locations.
Urban land change shows a major increase and mainly converted from agricultural land. The change of residential land shows that one big part increased, while another large area increased and changed from crop land. The change of crop land also shows a decrease and has been converted to urban, residential, and housing industry.
Urbanization does not only occur in the lowlands, but also in the highlands, this is evidenced by the growing number of urban areas cover of ~21% in 2001 to ~40% in 2014. The majority occurred in the highlands. While the rate of urbanization from 1989 to 1996 period is ~5%.
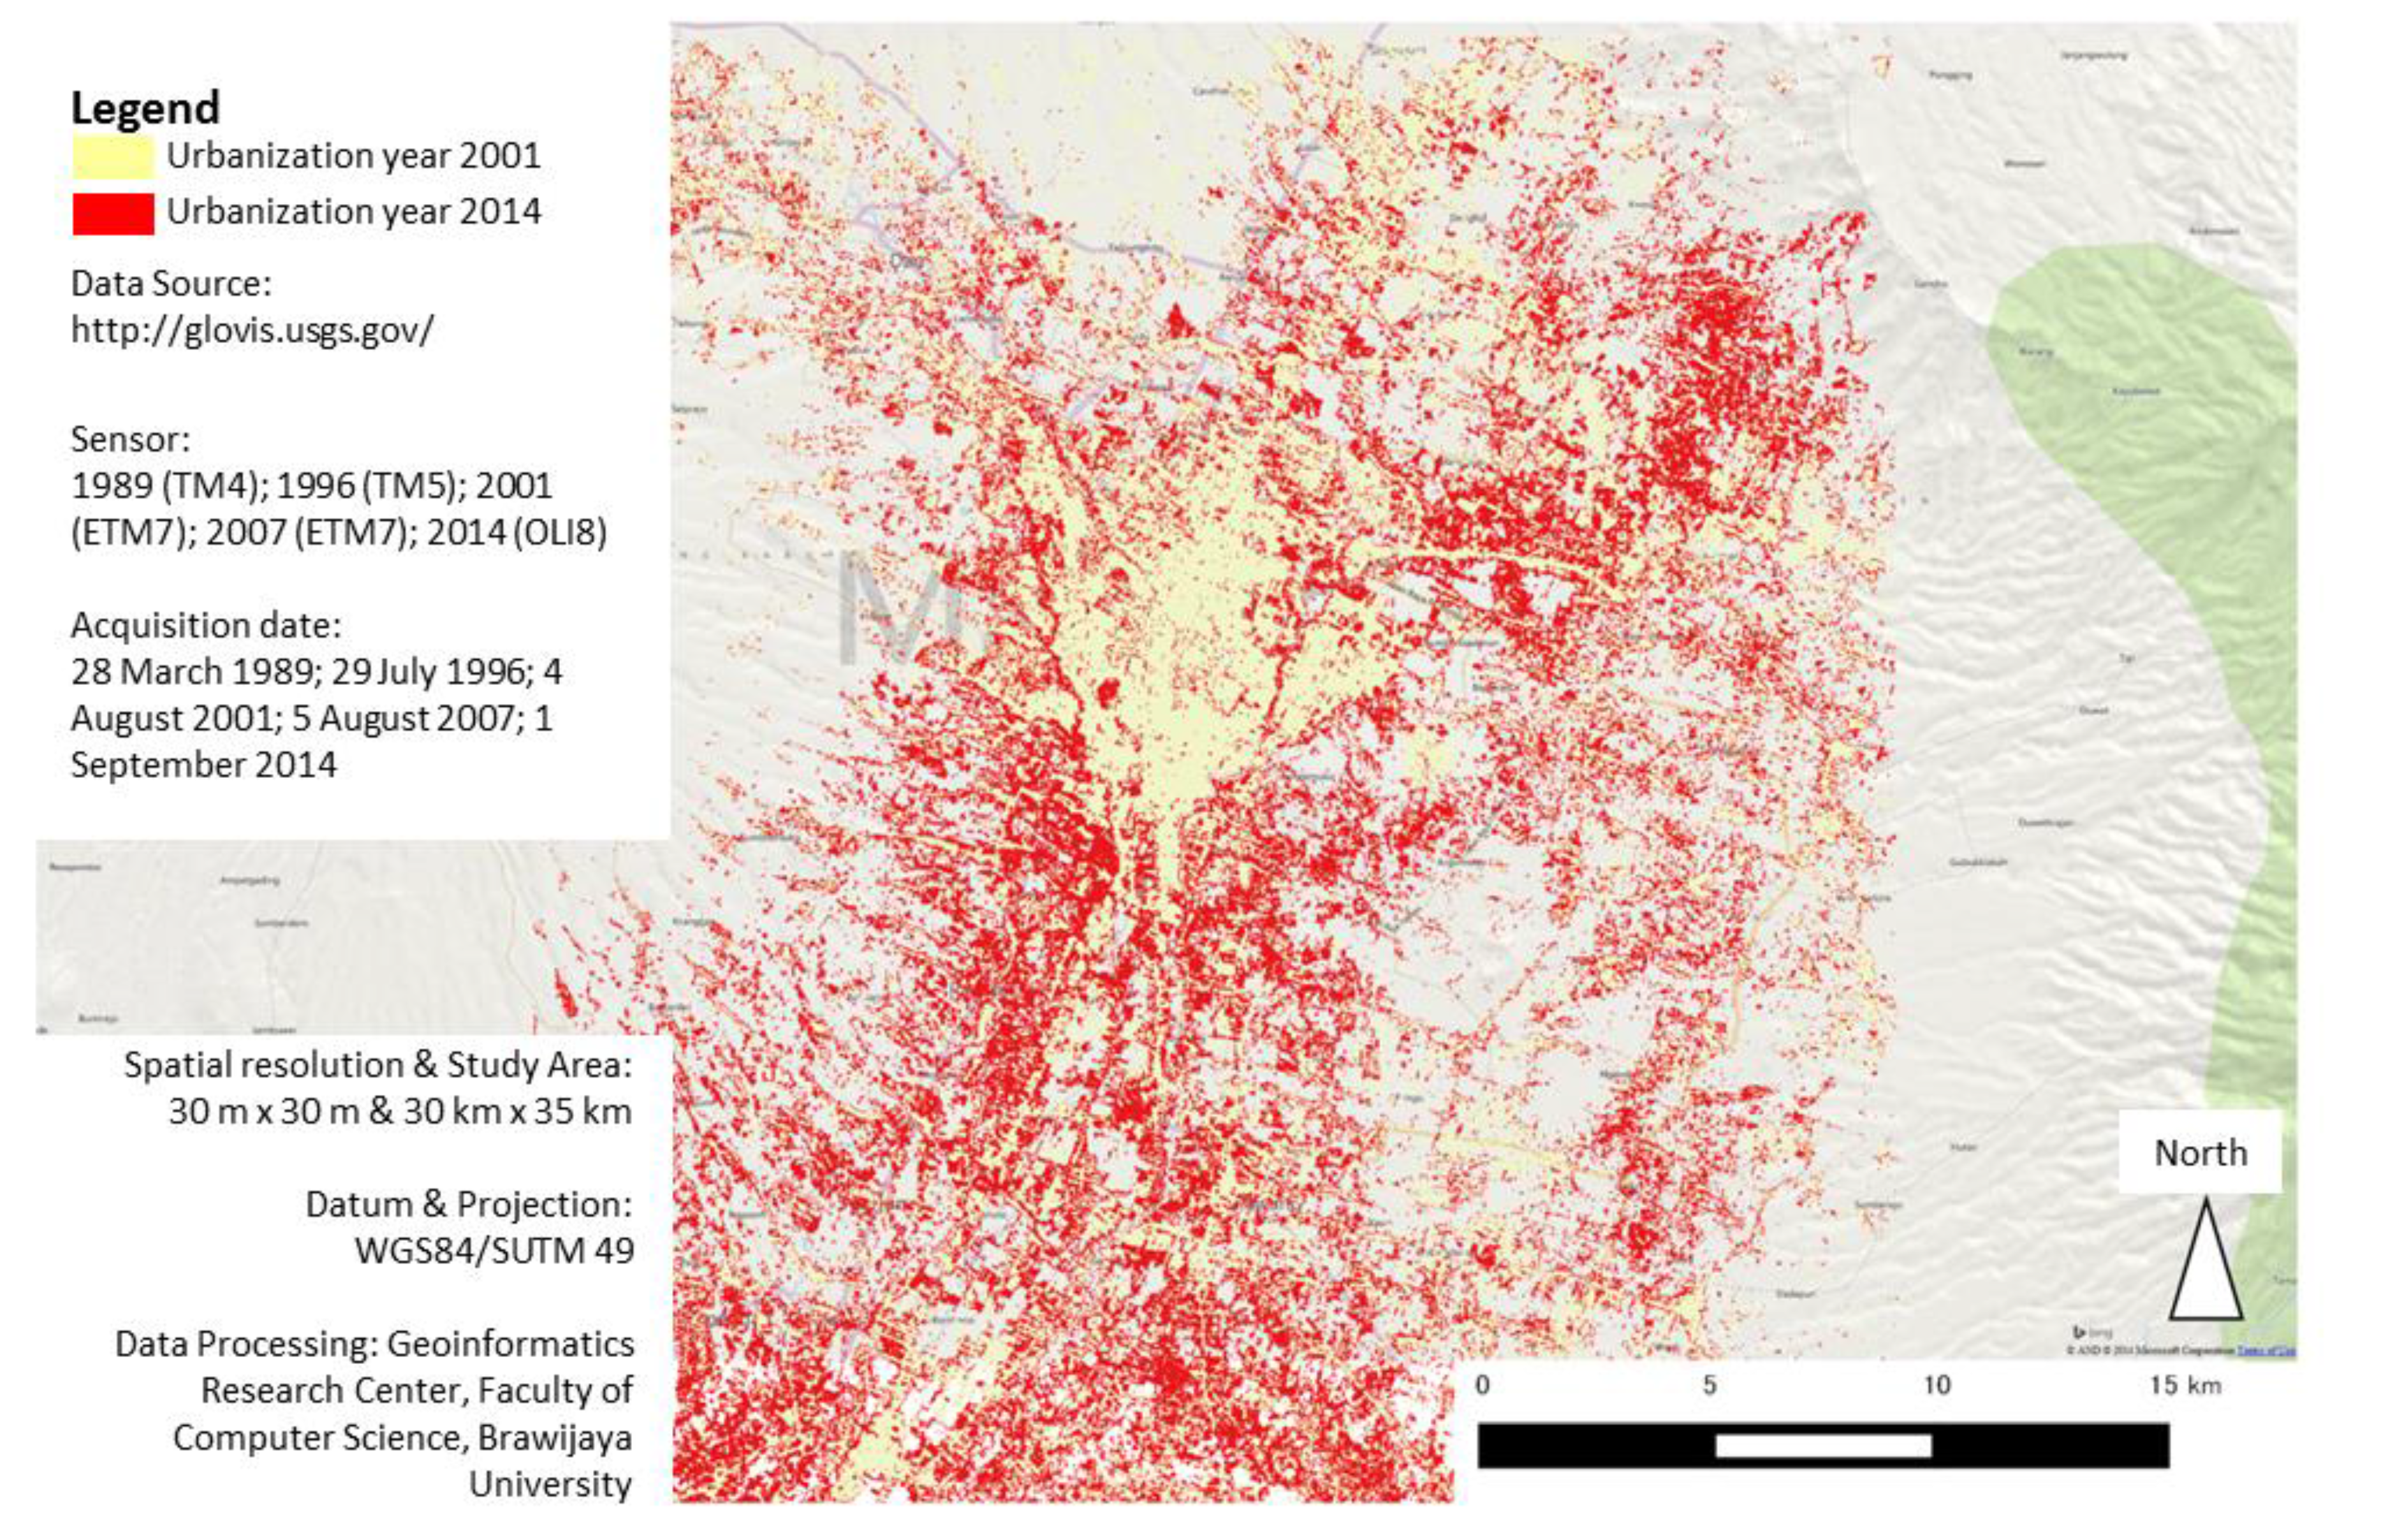
Figure 4.
Cartographic design of urbanization process in Malang City, East Java.
Figure 4.
Cartographic design of urbanization process in Malang City, East Java.
3.2. Agriculture Land Loss and Move to Higher Land
Agriculture land cover decreased in lowland but dramatically increased in higher land. This phenomenon appears since the farmers who lost their job, then transfer the farm to the higher land. As a result, forest cover conversion to agricultural land in the highlands takes place rapidly, from only ~3% in 2001, to ~16% in 2014. While the forest cover has steadily decreased from ~75% in 1989, ~73% in 1986, ~64% in 2001, and drastically reduced to ~22% in 2014. For the year 1989 to 1996, the rate of forest conversion to agricultural land is lower than ~2%.
3.3. Virtual Geo-Library Tools
There are two main important tools that have been developed in the system; (1) Print menu, and (2) Analysis menu. The print menu was developed to enable users to analyze the urbanization process through the cartographic map (
Figure 4). Users will be able to choose which period of urbanization, and type of paper, and define the scale. When users click the “Print” menu the new window will appear and the map will be able to print out a hard copy.
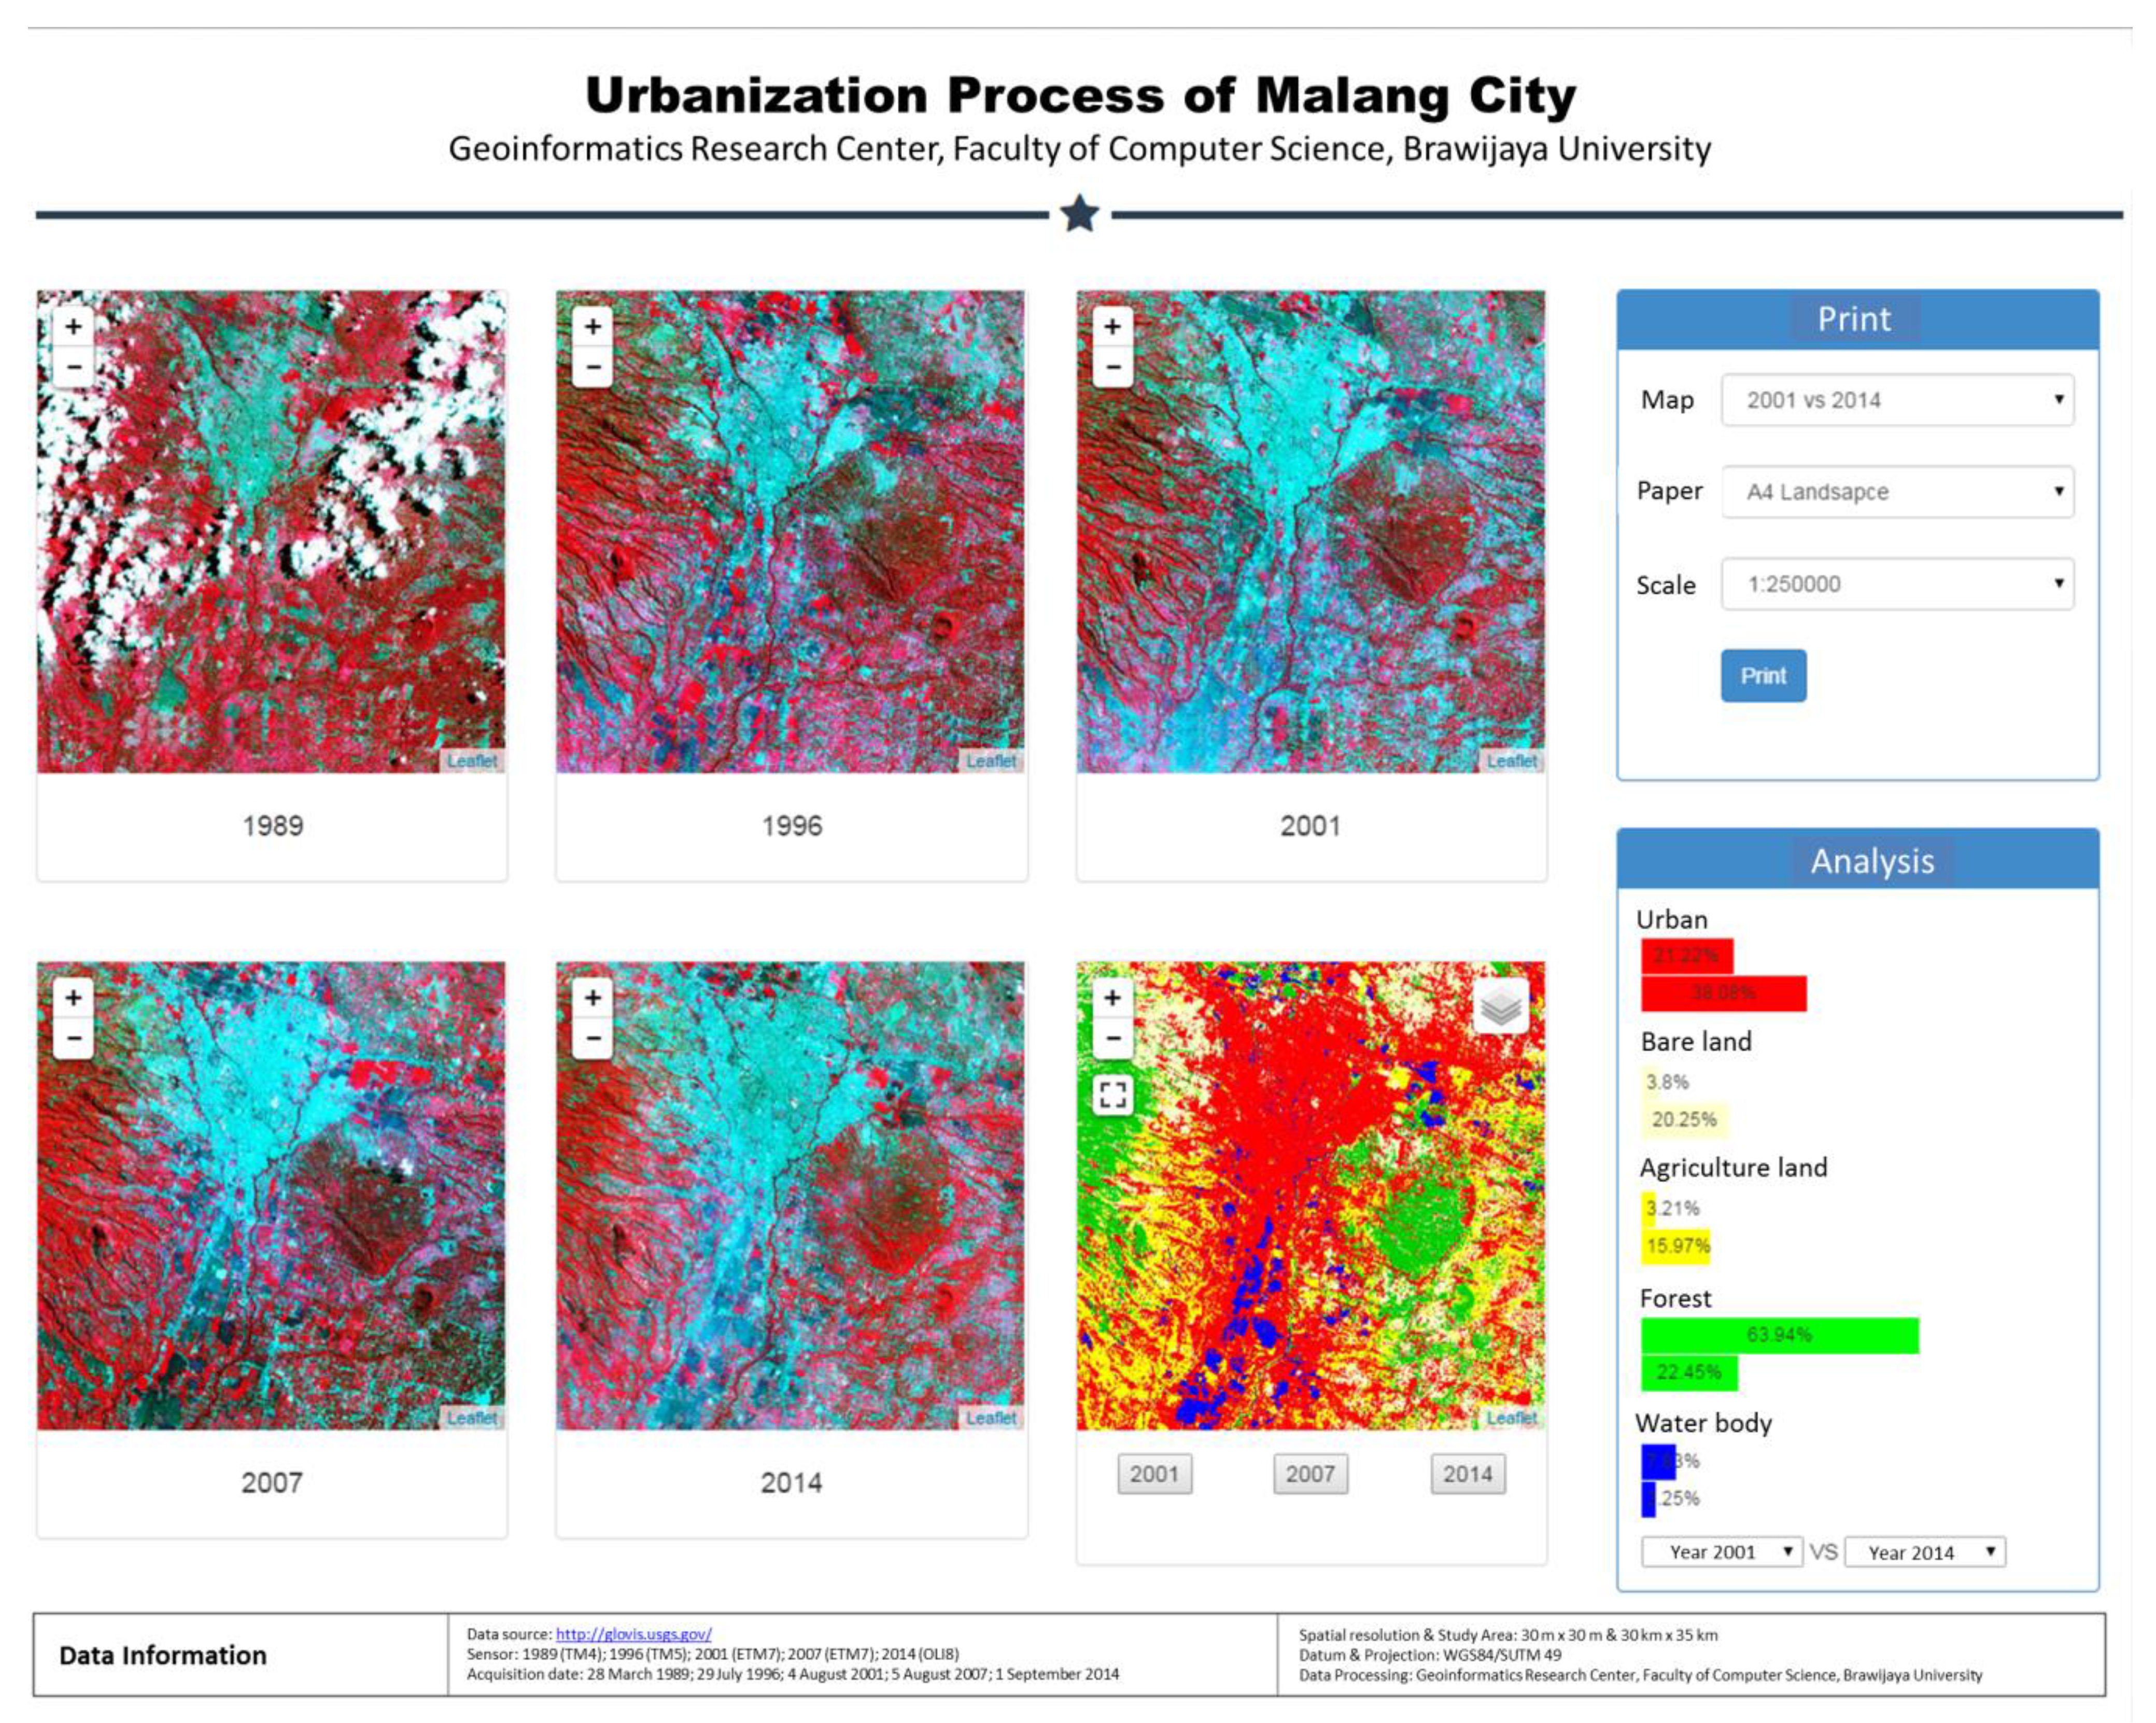
Figure 5.
Graphical User Interface (GUI) of virtual geo-library.
Figure 5.
Graphical User Interface (GUI) of virtual geo-library.
The analysis menu enables the policy makers and urban planner the power to conduct the analysis of land use changes from five different periods (1989–2014). From the dropdown menu, the user will be able to choose which period will be compared and get the information about the urban land use transformation in percentage. The Graphical User Interface (GUI) of the virtual geo-library is shown in
Figure 5. For practical examples, it will be easier for policy makers to understand the best policy to be applied in specific areas to forbid any development in higher lands for high class residential, and urban planners will be able to easily decide which specific urban area needs more urban green space for urban inhabitants.
4. Conclusions
Results obtained in this study show that in Malang City, urbanization is happening in uncontrolled situations. Fragmented agricultural land appears in many locations and is currently occupying higher lands. The housing industry has also been increasingly occupying higher land recently. The forest cover has steadily decreased from ~64% in 2001, and drastically reduced to ~22% in 2014. The new-innovative virtual geo-library opens a new window and analysis tool for all stakeholders.
By providing virtual geo-library, local people will develop their geo-literacy based on their local knowledge and combined with scientific findings, disasters can be mitigated and environmental issues can be anticipated. Their historical land use transformation will be documented in virtual geo-library system. Additionally, this system will be updated every five years, and made accessible from anywhere, so that this information is highly valuable to the local people in particular, and for others who need information about the region as well. Increasing data availability provide unprecedented opportunities and challenges for the research of spatial knowledge.
The innovation of this system is that the system is supported by local languages. Another innovative aspect of this system is the use of existing technologies combined with free open source software. Optimalization of free tools like QGIS, Java, HTML and Map Server could reduce the cost of software licenses needed to implement the application.
This system will provide valuable data not only to farmers, local government, and researchers, but it can also help to broaden public awareness and development of sustainable management. The virtual geo-library also has another point plus the possibility of increasing the accountability for planning officers, since almost everyone with internet access could verify land use change in a given place and to question the planning decisions made on specific sites in the city.
This study offers much help to manage other earth resources in a more sustainable way, with less expensive software and methods of geospatial data collections and processing, and supported with advance technologies of geospatial data dissemination and delivery. Furthermore, this virtual geo-library brings geo-literacy to non-specialized people from outside the fields of specialized geo-information science as long as they are connected to the Internet with their smart phone, tablet, or notebook. This system also provides useful interaction and directions to policy makers and urban planners to create a better urban area.


