Article

Q-SOS—A Sensor Observation Service for Accessing Quality Descriptions of Environmental Data

1
Institute for Bio- and Geosciences, Agrosphere Institute, Forschungszentrum Jülich GmbH, 52425 Jülich, Germany
2
North GmbH, Martin-Luther-King-Weg 24, 48155 Münster, Germany
*
Author to whom correspondence should be addressed.
Current Affiliation: CSIRO Mineral Resources Flagship, PO Box 1130, Bentley, WA 6102, Australia
ISPRS Int. J. Geo-Inf. 2015, 4(3), 1346-1365; https://doi.org/10.3390/ijgi4031346
Submission received: 25 February 2015 / Revised: 9 July 2015 / Accepted: 30 July 2015 / Published: 10 August 2015
(This article belongs to the Special Issue Open Geospatial Science and Applications)

Abstract

:
The worldwide Sensor Web comprises observation data from diverse sources. Each data provider may process and assess datasets differently before making them available online. This information is often invisible to end users. Therefore, publishing observation data with quality descriptions is vital as it helps users to assess the suitability of data for their applications. It is also important to capture contextual information concerning data quality such as provenance to trace back incorrect data to its origins. In the Open Geospatial Consortium (OGC)'s Sensor Web Enablement (SWE) framework, there is no sufficiently and practically applicable approach how these aspects can be systematically represented and made accessible. This paper presents Q-SOS—an extension of the OGC's Sensor Observation Service (SOS) that supports retrieval of observation data together with quality descriptions. These descriptions are represented in an observation data model covering various aspects of data quality assessment. The service and the data model have been developed based on open standards and open source tools, and are productively being used to share observation data from the TERENO observatory infrastructure. We discuss the advantages of deploying the presented solutions from data provider and consumer viewpoints. Enhancements applied to the related open-source developments are also introduced.

1. Introduction

A Sensor Web is an infrastructure comprising web-accessible sensors from various providers. The open nature of the Web means data acquisition, processing and delivery are usually carried out in a distributed and autonomous manner [1]. Each data providers may process and assess the quality of datasets differently before publishing them online. Quality control (qc) aims at measuring and controlling the quality of a data so that it meets the needs of users [2], such as by quantifying the uncertainties in the data and by detecting erroneous data so that they may either be corrected or flagged. The qc process can be implemented before, during or after datasets are created [3]. This paper focuses on quality assessment of observation data, a control that takes place after the data are produced. For example, in a water level data series generated by a stream gage, there might be missing values due to a logger's malfunction, erroneous spikes, or values beyond acceptable thresholds. These affected measurements should be verified and flagged accordingly. While data quality assessment emphasizes identifying and fixing data defects, it often requires contextual information to support the process. These so-called provenance or lineage descriptions covers processes and entities involved in data acquisition and processing. For example, a simple quality flag (“suspicious”) does not convey sufficient information about problems in computed discharge. We may want to know who flagged the data and which rating curves were used to calculate the data. All these aspects show that observation data should be accompanied with relevant information describing how their values were produced, assessed and derived. This enables data consumers to better interpret the data products and select datasets that would better suit their applications. Data providers can use this information to validate how well their datasets meet the criteria set out in a data management plan, and to handle current and future questions regarding data changes [4].
The OGC’s SWE framework [5] enables unified access to web-enabled sensors, their descriptions, and observation data through standardized service interfaces. The Observations & Measurements (O&M) model refers to the complex ISO19139 (http://www.iso.org/iso/catalogue_detail.htm?csnumber=32557) standard for providing quality information, however relevant examples or implementations are missing. In fact, Serral and Masó consider this mechanism as very rudimentary and that it needs to be explored further [6]. Specifically, it is unclear how various aspects of data quality (e.g., quality flags and levels) associated with different sensing applications can be represented in relation to existing observation concepts, and then made accessible to users via the standard service. There are several Sensor Web projects that focus on data quality. Nevertheless, to the best of the authors' knowledge, the integration of quality assessment information of heterogeneous environmental data into the Sensor Web still is not fully realized. For example, some approaches [7,8,9] primarily address quality measures and the uncertainties of observation data. Others [10,11,12] partially capture data assessment descriptions at a very general level or are limited to specific sensing applications. For more examples, see Section 2.3.
In this paper, we present solutions (an observational data access service and a data model) for integrating information about data quality assessment into the Sensor Web. The Q-SOS is an extension of the OGC’s Sensor Observation Service (SOS) that allows for the retrieval of observation data together with quality assessment and relevant contextual descriptions. These descriptions are represented in a data model that is extended from the CUAHSI (The Consortium of Universities for the Advancement of Hydrologic Science) Observations Data Model (CUAHSI-ODM) [13]. One important aspect in modeling data quality is granularity, i.e., the level of details at which quality information of observation data is specified, e.g., at a time instant or a time interval for a given time series, or a collection of several data series. Data granularity may subject to the context of use. For example, in surface observational practice, the granularity of quality-controlled data required varies by applications, for instance minutes for aviation, hours for agriculture, and days for climate description [14]. To give another example, at least hourly records from a weather station are required to identify the occurrence of blizzards at a station. In the context of SOS servers, the quality information can be specified in a SensorML file if it refers the whole sensing process or in an O&M document if it applies to measurement values. Our data model considers both levels of granularities. We represent quality descriptors at the level of individual measurements, whereas the associated contextual information (e.g., operation and maintenance of sensors and access control) are provided at the level of sensors.
The preliminary versions of the service and the data model have been introduced as components of the common data quality control framework described in [15,16]. This paper contains new and revised materials that were not published previously. First, it includes a comparison of existing approaches for communicating quality information in the Sensor Web. Second, it covers the enhancements applied to the service and the data model. For example, the data model has been extended to capture contextual information, e.g., operation and maintenance, processing descriptions, access control, and controlled vocabularies (Subsection 4.1). This paper also describes how the service has been enhanced not only to capture the outcomes of data assessment and their metadata but also to support data requests based on quality filters. In addition, a description of the supporting service developed (i.e., a web processing service) is also included. Finally, the paper also includes the results by means of applying the components developed to assess and publish open observation data from the Terrestrial Environmental Observatories (TERENO) [17].
The paper is organized in the following way: Section 2 discusses the related work, and Section 3 introduces the spatial data infrastructure of TERENO. This is followed by a description of the design and the implementation of the solutions in Section 4. Section 5 concludes with the contributions of the solutions developed and future work.

2. Basic Concepts and Related Work

This section presents the basic concepts used in this paper and gives a comparison of related work in developing quality-aware services for the Sensor Web.

2.1. OGC Sensor Web Enablement (SWE) Framework

The SWE framework comprises service and information models to support discovery and access of sensors and their data in the Web [5]. The service model refers to a set of web service specifications, whereas the information model consists of conceptual models and XML encodings. This paper focuses on the Sensor Observation Service (SOS) [18], a standardized Web service interface specification for pull based access to observation data. This means that SOS clients can send information requests to SOS servers (usually via the Web) to retrieve certain observation data. The core interface of the specification comprises three basic operations. First, a service's description is requested with the GetCapabilities operation, then sensor metadata can be retrieved with the DescribeSensor operation, and finally observation datasets are accessed by filter parameters with the GetObservation operation. The outputs of these operations are XML-formatted documents such as GetCapabilities response as well as Sensor Model Language (SensorML) [19] and O&M [20] documents respectively. The O&M data model represents the basic observation concepts and is used to interpret observation data returned by a SOS server. The model defines observation as an event, whose result (e.g., 12.8 °C) is an estimate of the value of a phenomenon (e.g., surface water temperature) of a feature of interest (e.g., Lake Erie), obtained using a specified procedure (e.g., sensor buoy). It also suggests that a result value can be associated with a resultQuality that refers to the quality elements defined in the ISO19139 standard. However, for the requirements resulting from our use cases (e.g., providing quality flags covering various domains) the ISO model is not suited as it is intended to cover much more complex quality information. The choices were also influenced in part by the experience of other projects requiring the entry of detailed metadata describing quality information with the ISO model. We decided to follow a simple and pragmatic approach as opposed to the ISO model with inherent complexity. As our aim is at representing various aspects of data quality assessment we develop our data model based on the CUAHSI-ODM. For our implementation we rely on database views to relate our data model to the standard O&M model (see Section 4.2).

2.2. Quality Descriptors

There are two main quality descriptors supported by the developed service—data processing levels and data quality flags. Data processing levels indicate different status of data handling. For instance, level 1 includes raw data, level 2 refers to flagged data, whereas the next level suggests derived data. There are several classifications of data levels of environmental data as proposed by Earth Observing System (EOS) Standard Data Product (SDP) (http://nsidc.org/data/icebridge/eos_level_definitions.html), Consortium of Universities for the Advancement of Hydrologic Science (CUAHSI) (http://his.cuahsi.org/), Atmospheric Thematic Center (https://icos-atc-demo.lsce.ipsl.fr/node/34) and Earthscope (http://www.earthscope.org/science/data/access/). While each data providers may have their own data levels, our data processing levels are kept simple, but remain consistent with the practice of other data systems (see Section 4.1).
Flagging is a procedure of adding a quality tag to an observation value. Data quality flags imply the outcome of a quality test, which may either be computer- (e.g., automatic evaluation procedures) or human-generated (e.g., visual inspections). Quality flags have been defined in common vocabularies addressing data quality, e.g., QualityML [21], or in data flag schemes, e.g., the World Ocean Circulation Experiment (WOCE)'s quality codes for water sampling [22]. Some quality flag schemes are single-level lists and indicates the overall data quality, e.g., OceanSITES (www.oceansites.org/docs/oceansites_user_manual_version1.2.doc), COS Data Quality Flags (http://www.stsci.edu/hst/cos/pipeline/cos_dq_flags) and SeaDataNet (http://www.seadatanet.org/Standards-Software/Data-Quality-Control). Other flagging schemes consist of two-levels. Here, the primary level includes generic flags, e.g., good, unevaluated, suspicious and bad. The secondary level is application-specific and extends the primary level flags by indicating, (i) the results of individual quality tests applied, e.g., failed gradient check; or (ii) data processing history, e.g., interpolated values; or (iii) background events affecting data values, e.g., icing event. In the context of TERENO, we need a common, domain-independent quality flags that can be used by different sensing applications. Therefore, following [23], we adopted a two-level flag scheme (see Section 4.1).

2.3. Existing Quality-Enabled Sensor Observation Services

Table 1 summarizes existing approaches for communicating quality information in the Sensor Web. Note that the discussion below is centered around the SOS; other OGC standard services, although supported by these approaches, are not covered here.
Several projects address different aspects of data quality; nonetheless, the integration of data assessment information into the Sensor Web is not fully accomplished. For example, consider UncertWeb [9] and INTAMAP [7], which mainly focus on the uncertainties of observation data. An exception to the above generalization is the Sensors Anywhere (SANY) project [24], which develops an open Sensor Service Architecture (SensorSA) to support the development of sensor-based environmental applications. The architecture focuses on three quality aspects (uncertainty, measurement and data preparation process, and quality assurance), and suggests that depending on the granularity of the information, these aspects can be specified in a SensorML or in an O&M document. While implementation of the first aspect is shown by encoding uncertainty information with UncertML, the second aspect of the measurement context is missing. The similarity between SANY and our approach is that both represent quality descriptors at the level of individual measurements so that they can be utilized directly by client applications. However, the former approach only specifies metadata of one type of quality descriptor (quality flags). The quality flag convention is not extensible, and thereby cannot be associated with data from various sensing applications. In contrast, our approach supports more than one quality descriptor and a two-level flag scheme. SANY’s observation service uses the procedure to represent data processing levels, for example, raw data and automatically assessed data. While a data processing activity itself can be considered conceptually as a procedure, it is not shown how this is linked to actual sensors and offerings within the implementation. Note that in the O&M specification, a procedure can be an instrument, an algorithm or a process involved in estimating the value of an observed property. The EO2HEAVEN project [8] emphasizes all three quality aspects as specified by SANY; however, its specification only covers the representations of data uncertainty that are adapted from SANY. It is not fully specified how quality details are associated with measurement contexts to support data validation. It should also be mentioned that the European FP7 project EO2HEAVEN has contributed to the development of the Sensor Web Client (http://52north.org/communities/sensorweb/clients/SensorWebClient/) and the 52°North SOS (http://52north.org/communities/sensorweb/sos/) project. We have extended the client and applied it with the developed service (see the data inspection tool in Subsection 4.3).
Some approaches partially handle quality assessment information. For example, the NOAA Integrated Ocean Observing System (IOOS) [25,26] provides interoperable access to oceanographic data from various sources. Similar to our approach, their Sensor Observation Service (http://sdf.ndbc.noaa.gov/sos/) implementation is based on the 52°North SOS reference implementation. Among the observed properties supported by the service, only ocean current measurements are accompanied by a set of nine quality flags (e.g., 0 specifies quality not evaluated and 1 represents a failed quality test) indicating the outcomes of quality tests. Nevertheless, the metadata of these flags are not included in the response; therefore, one cannot interpret the quality details. We include the metadata of quality descriptors in the same O&M document returning the observed values. Further, it is also possible to obtain an extended version of the metadata via the implemented Web Processing Service (WPS). The NOAA-IOOS also addresses the need to incorporate differing quality flags for the same property, measured by different models of sensors [26], which has been covered by our approach. The authors are also involved in the Quality Assurance of Real-Time Ocean Data (QARTOD) to OGC (Q2O) initiative (http://q2o.whoi.edu/). The similarity between Q2O and our approach lies in the fact that both approaches have used the OGC's SWE specifications to capture information about data quality assessment. Q2O focuses on representing sensor components, processing chains and quality tests applied to in-situ oceanographic data through SensorML documents [11,27]. Our data model captures these aspects as well as other contextual information required for assessing the data (see Section 4.1). Depending on the granularity of the information, we specify these aspects in SensorML documents (e.g., sensing descriptions) or in O&M documents (e.g., quality flags). Modeling quality tests as processes in SensorML documents as in Q2O is noteworthy, but is not the primary focus of our research. Q2O proposes two basic flags (e.g., pass and fail) indicating the outcomes of a quality test (e.g., varianceTest). We have adopted a two-tiered quality flagging scheme in our approach so that data flags of a wide range of sensing applications in our observatory can be specified. Q2O has developed formal vocabularies (ontology) defining parameters, quality tests and flags. In the same direction, we plan to transform the controlled vocabularies described in our database into formal specifications. This is particularly useful to handle semantic ambiguities when integrating TERENO observation data into other external data systems.
Concerning data requests, Bastin et al. [9] describe how to retrieve data with uncertainty concepts, and how to specify the results in a common format (UncertML) in O&M. Our service is of a similar manner, but handles data requests with quality filters (e.g., data level and quality flags) and the resulting assessment outcomes are appended to the observed values encoded in the O&M response of the SOS. The GeoViqua [6,28] project focused on methodologies for enhancing the GEOSS Common Infrastructure with quality-centric data discovery and visualization. It addressed three main aspects of data quality, including measurement uncertainties, end-user reviews of data usage, and provenance information associated with the data creation. Our approach complements the last aspect by developing a quality-aware observational data model and an observation service. Our ongoing work focuses on representing user feedback on the quality of published data as proposed by the project.
Table 1. Related work on integrating quality information into the Sensor Web.
Related WorkApplicationQuality AspectsQuality RepresentationNotes
SANY [24]Environmental risk managementMeasurement and data preparation process, measurements uncertainty, and quality assuranceUncertainty information is specified with a block of UncertML embedded in SensorML and O&M documents. Basic quality flags are defined in the om:metadata section.The SOS is one of the OGC services supported by the SensorSA.
EO2HEAVEN [8]Environmental factors and human healthMeasurements uncertaintyThe mechanism to encode uncertainties is adapted from SANY.A lightweight profile of the SOS for in-situ sensors is introduced.
IOOS [25]OceanographyQuality flags indicating the outcomes of quality testsA series of nine numeric values representing the results of quality tests are attached to each observed values in an O&M document.It is planned to develop SensorML profiles for quality tests based on approaches proposed by Q2O.
Q2O [11,27]QA/QC standards for in-situ ocean sensorsQuality flags, quality tests, and measurement contexts (sensor characteristics and histories, operational environments) related to ocean sensorsThe sensing systems, the workflow processes for measurements and the quality evaluation procedures are characterized using SensorML documents.Common vocabularies for quality tests and flags, parameters and bibliographic references have been developed.
UncertWeb [9]Uncertainty- enabled Model WebData sets with uncertain values and associated uncertainty information (e.g., accuracy metadata)UncertML is used to model and encode the uncertainties in an O&M document.An uncertainty-enabled NetCDF profile (NetCDF-U) has been produced.
GeoViQua [6,28]Quality-aware search and evaluation tools for the GEOSS Common InfrastructureThe producer model extends ISO 19115 and 19157 with traceability, discovered issues, reference datasets and data quality reports. The consumer model focuses on user feedback.The quality model adopts ISO standards for metadata (19115) and quality (19157) with extensions for UncertML and O&M.The integration of quality information with KML and Web Map Service is also supported.

3. Terrestrial Environmental Observatories (TERENO)

TERENO, a research infrastructure initiative of the Helmholtz Association, aims at establishing an observatories network to study the long-term effects of climate and land use changes [17]. The initiatives comprises four observatories: Northeastern German Lowland, Harz/Central Lowland, Eifel/Lower Rhine Valley, and Bavarian Apls/Pre-Alps. Each observatory is currently being operated and maintained by a different Helmholtz institution. Observation data from the four observatories are made available via OGC-compliant web-services.
We developed the spatial data infrastructure TEreno Online Data RepOsitORry (TEODOOR) to manage and disseminate observation data from the Eifel/Lower Rhine observatory (Figure 1). Table 2 summarizes the sensors deployed in the observatory. Apart from the TERENO-owned sensors, the data infrastructure also hosts data from external agencies. For example, the Eifel Rur observatory also includes a total of 65 stations (runoff and climate) belonging to the Wasserverband Eifel-Rur. In Figure 1, the data parser and the data processor import data series from various sensing systems and convert them to meaningful values, i.e., applying scaling factors and performing calculations. Data and metadata are stored in a PostGIS database, and are accessible via OGC-compliant web-services. The TEODOOR web portal (http://teodoor.icg.kfa-juelich.de) consumes the services, and acts as a front-end that supports data discovery, visualization and download [29]. Observation data from the rest TERENO observatories can also be discovered via the same portal.
Figure 1. TEODOOR data infrastructure.
Ijgi 04 01346 g001
There are three ways in which observation datasets are processed and assessed within our data infrastructure. First, automatically imported data go through automated quality checks (e.g., thresholds values) and are released to the public domain after a visual inspection has been performed. Examples of automatically imported data are those from weather stations and river gages. The second type of data importing involves manually uploaded data that are processed and assessed externally, and then imported into the data infrastructure. These datasets are complex and require proprietary tools to transform the raw data into usable data records, e.g., eddy flux data. They are published online when they are approved to be released by the principal investigators. The third importing mechanism works in a similar way as automatically imported data, but in this case the measurements are not visually inspected but are rather downloaded again from the data infrastructure to be quality assessed using an evaluation method developed by the responsible scientist. In this case, the data infrastructure supports a mechanism to update the flagging information upon completing the quality assessment.
Table 2. Sensors deployed at the Eifel/Lower Rhine observatory.
Sensor TypesNumber of SensorsObserved Values
Climate stations, soil moisture networks and water gages589980,000 obs/day
Eddy covariance7 stations133,000,000 observations/day
Lysimeters36285,000 observations/day
Weather radar2 devices576 rasters/day
Samples-1–2 soil sampling campaigns/year, 1 water sampling trip/week

4. Representing and Publishing Quality Assessment Information of TERENO Observation Data

This section describes the two main components (the data model and the Q-SOS) which have been developed based on common standards and open source tools.

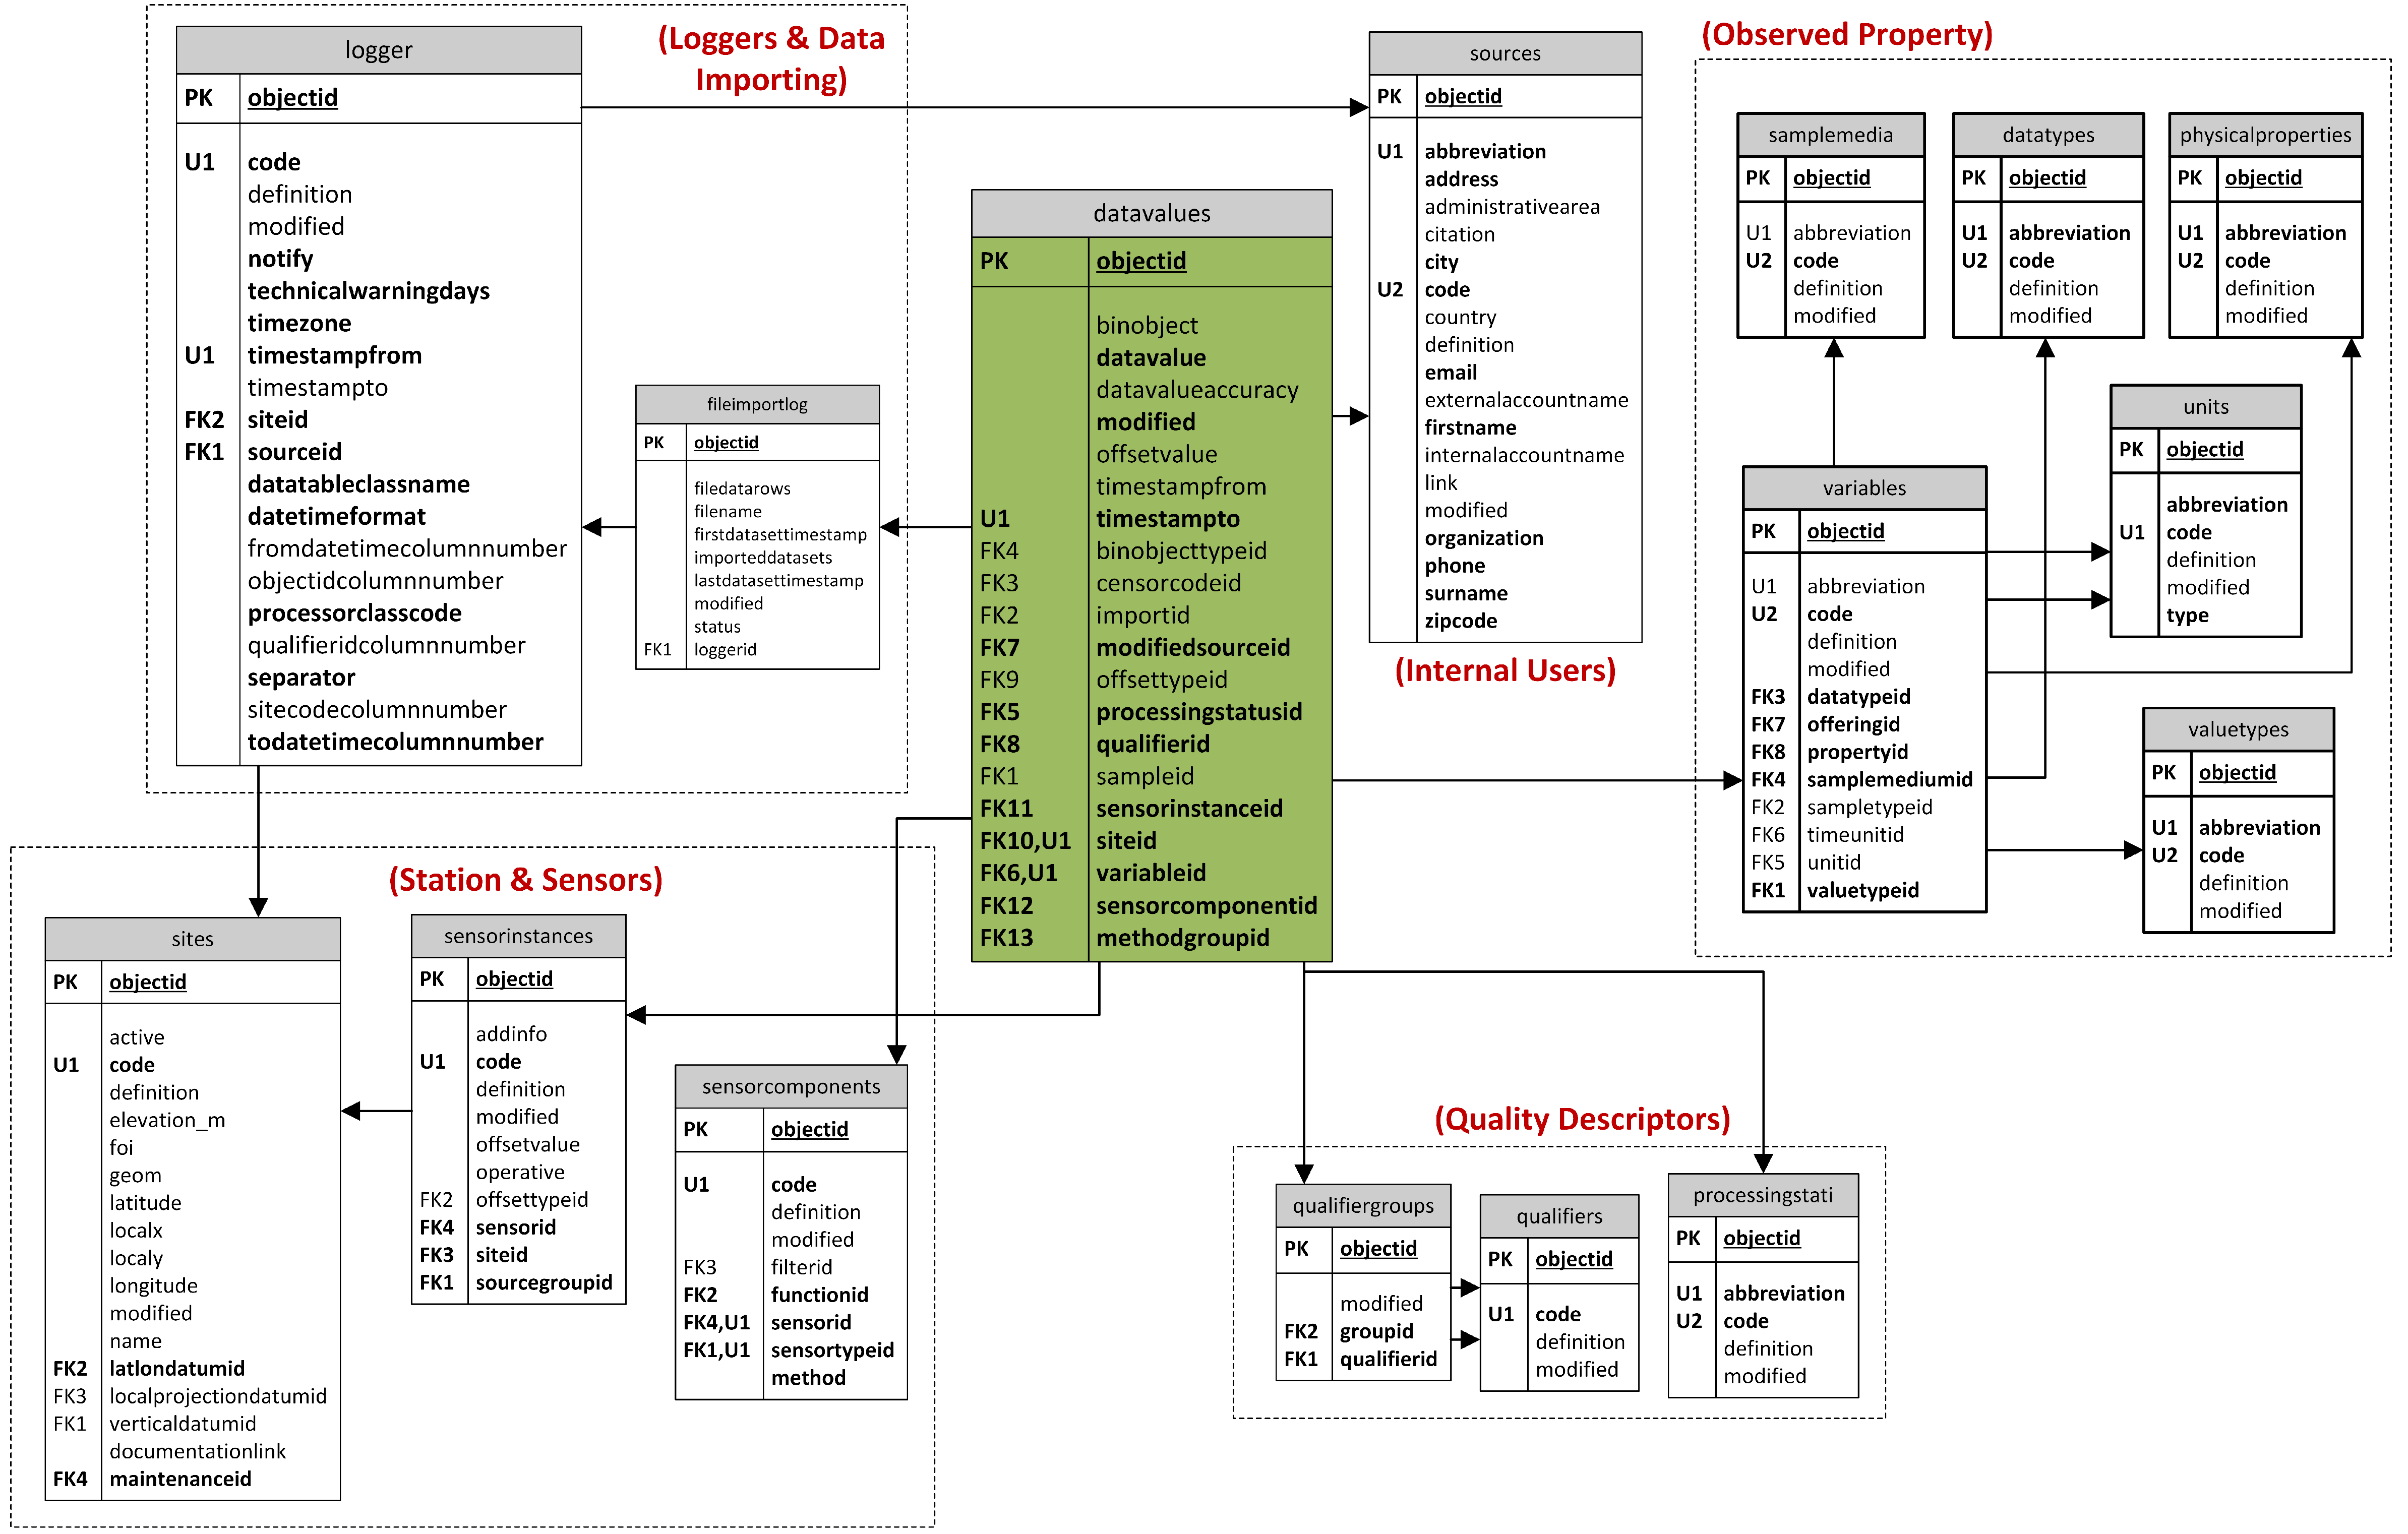
4.1. Observation Data Model

Figure 2, Figure 3 and Figure 4 depict partial views of the model. Our contribution consists of an extension of the existing CUAHSI-ODM model to capture various aspects related to data quality taking place at different stages of data collection, import and processing, and data assessment, as described below:
(a)
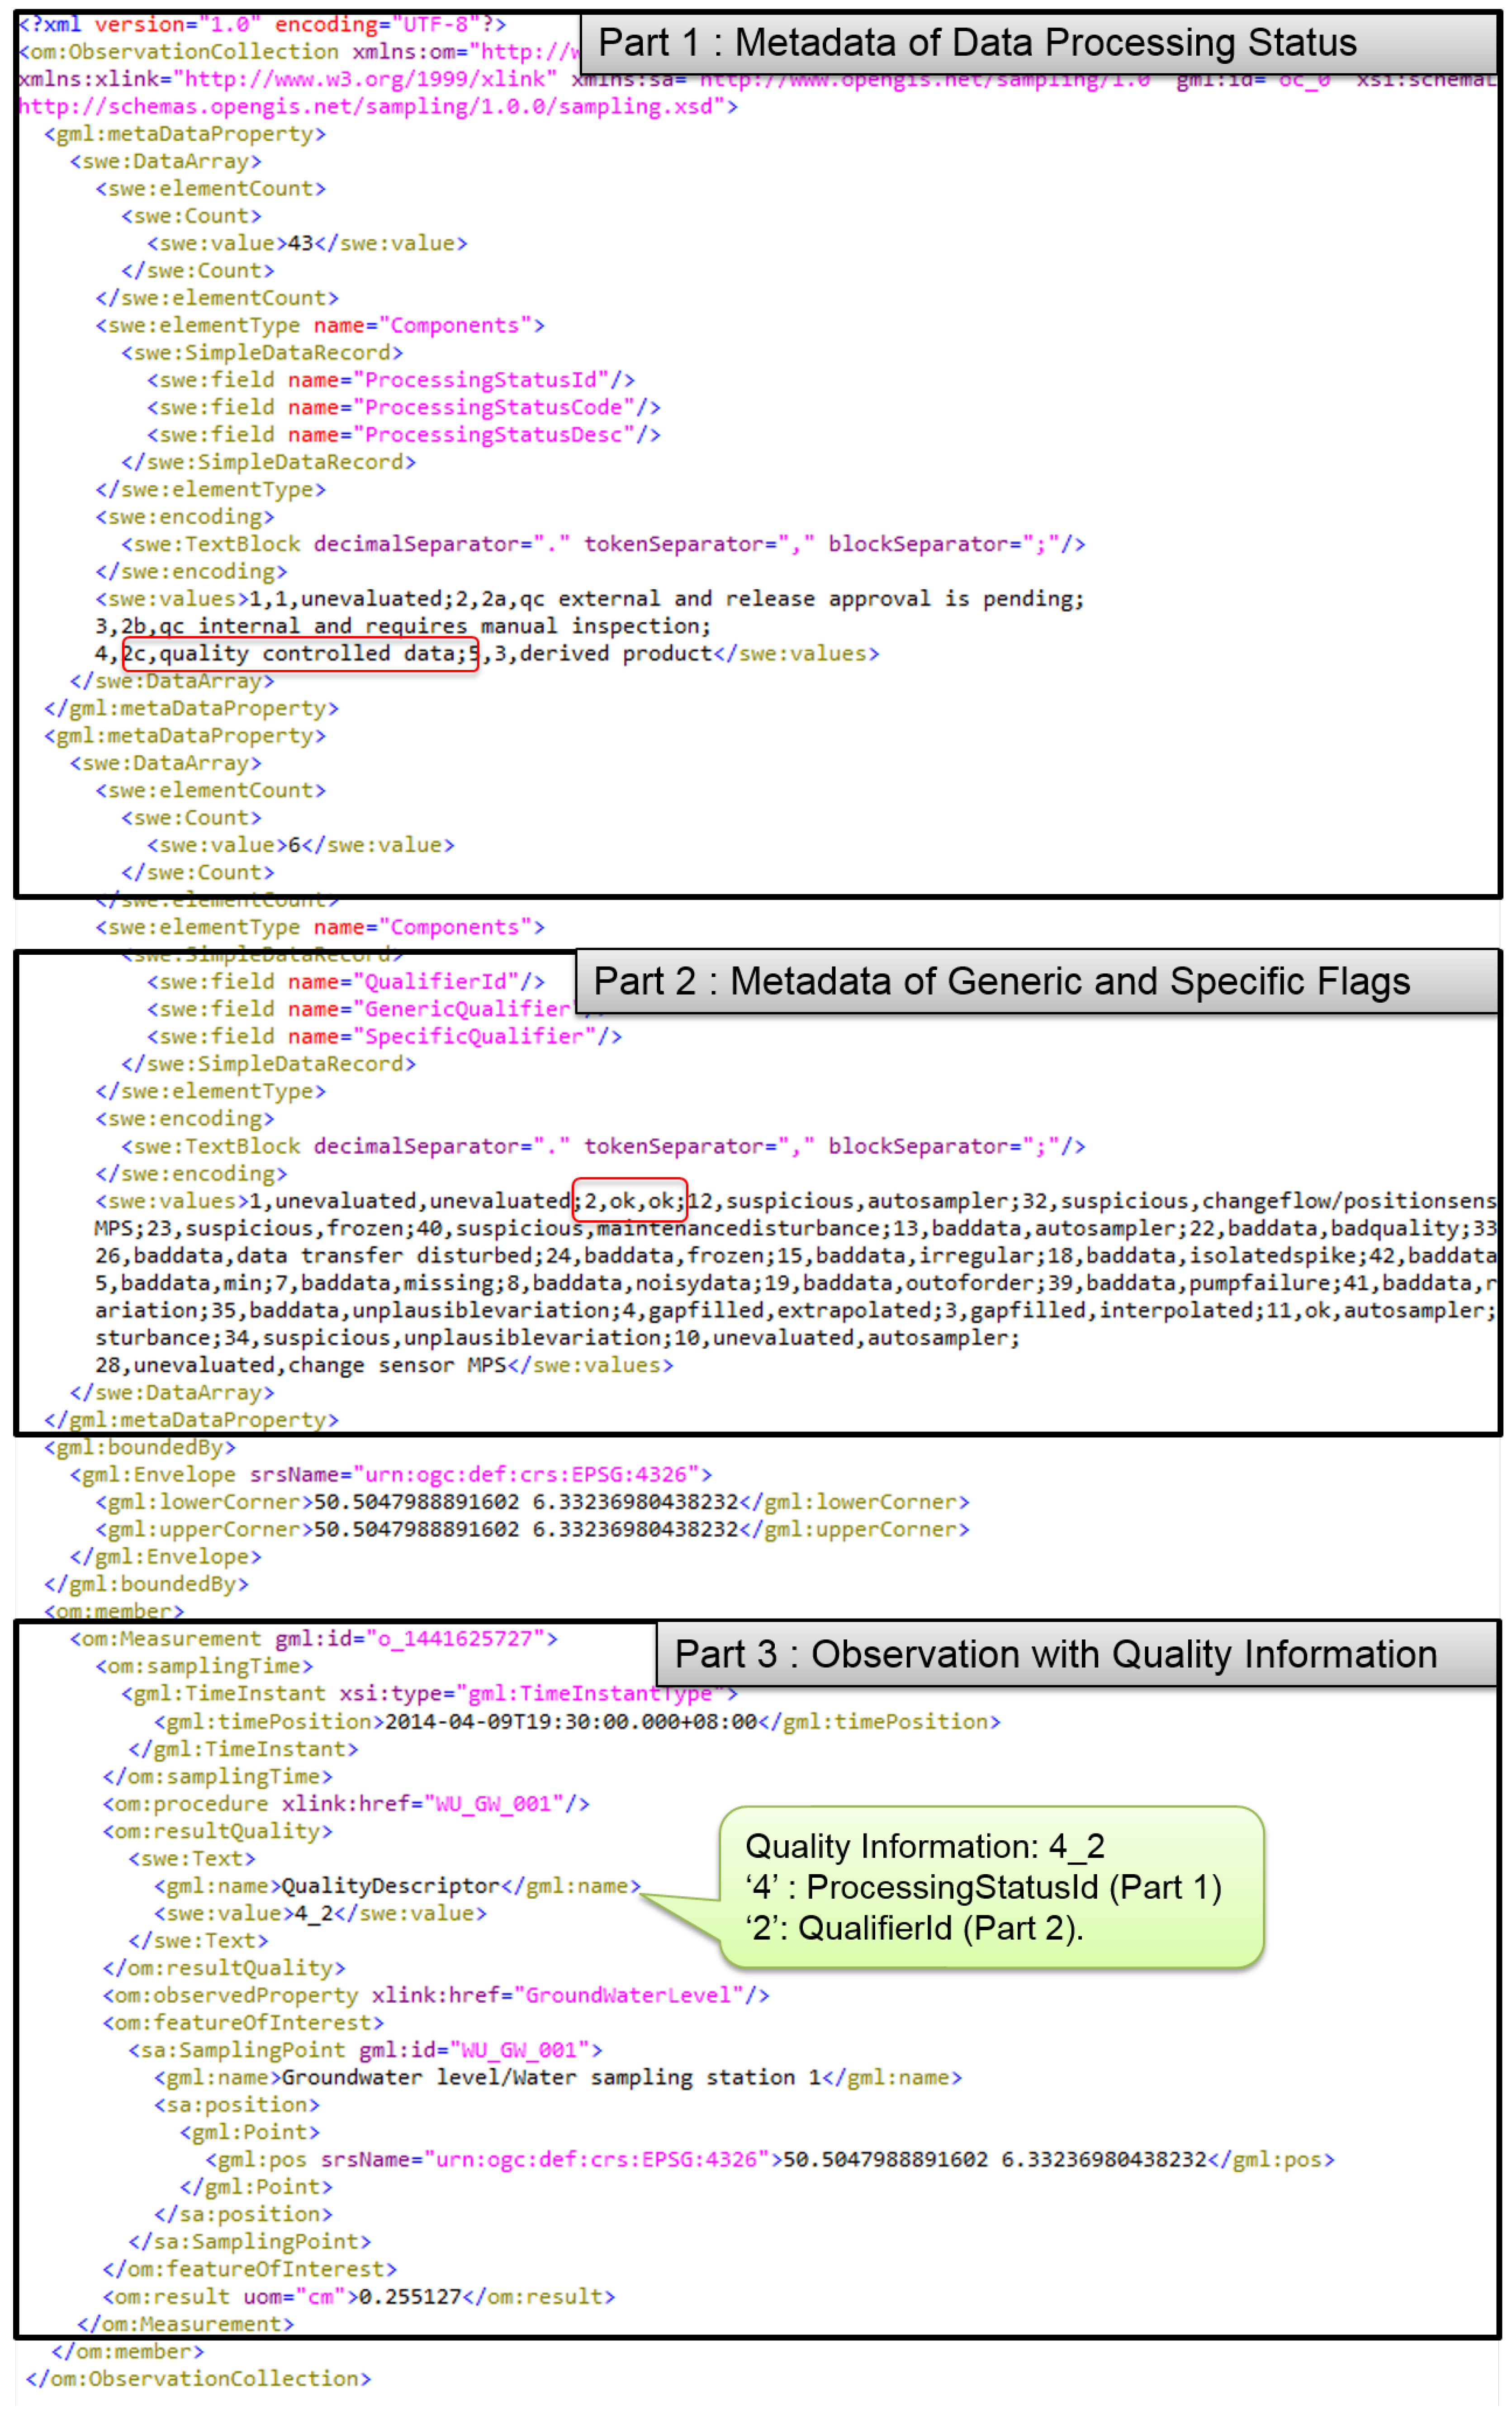
[Data Quality Assessment] Figure 2 shows the tables associated with observation values. For each observation value (as recorded in table datavalues), it is possible to specify by whom (modifiedsourceid), when (modified), and how it was quality checked (methodgroupid). Specifically, with the two-tier flag scheme (represented via the tables qualifiergroups and qualifier), it is possible to specify the outcome of a quality test and what leads to the problems detected within the data, e.g., baddata_sensorfrozen. The table processingstati characterizes the overall data handling status and are used to control data release. For example, in our data model, Level 1 represents unevaluated data, Level 2 comprises quality-assessed data and Level 3 consists of data derived from one or more Level 2 datasets. We have categorized Level 2 into several sub-levels (2a, 2b and 2c); see [15] for further information. Depending on the data level, the access to data either can be open to the public or restricted to certain users such as consortium partners. For instance, as indicated in the TERENO Data Policy (http://teodoor.icg.kfa-juelich.de/downloads-de/), only fully quality assessed datasets (Level 2c) are publicly available via the observation service.
(b)
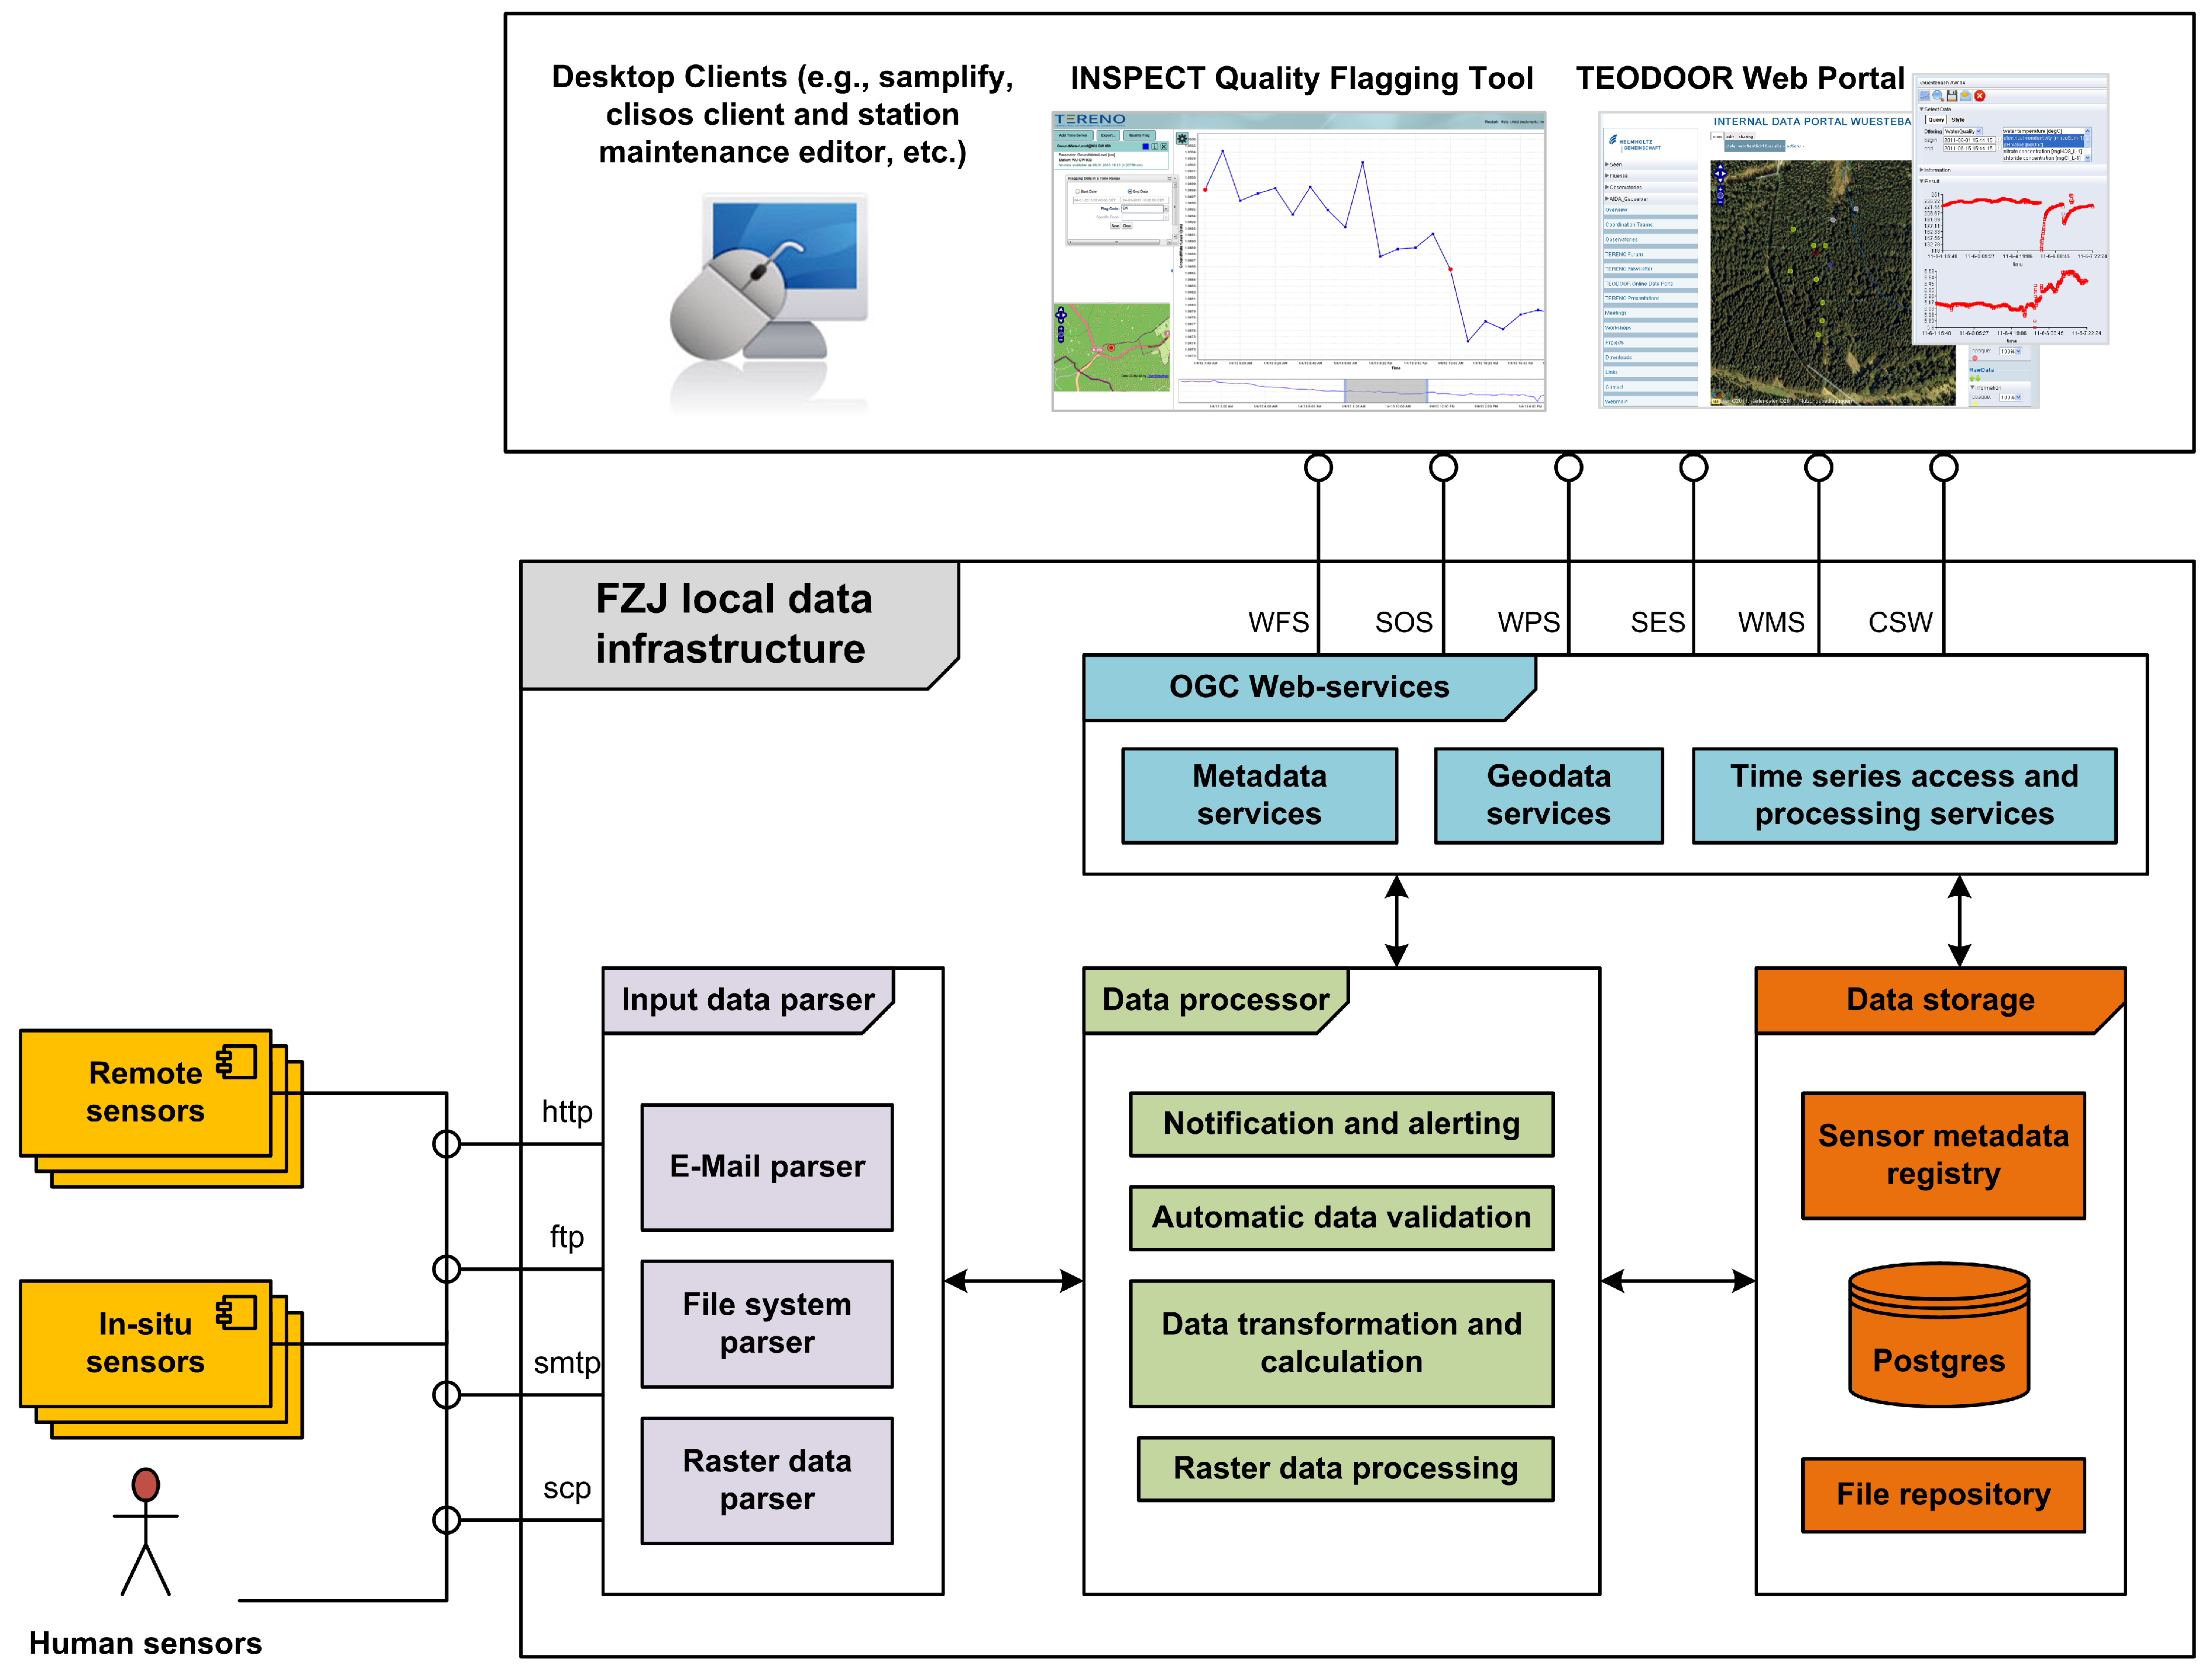
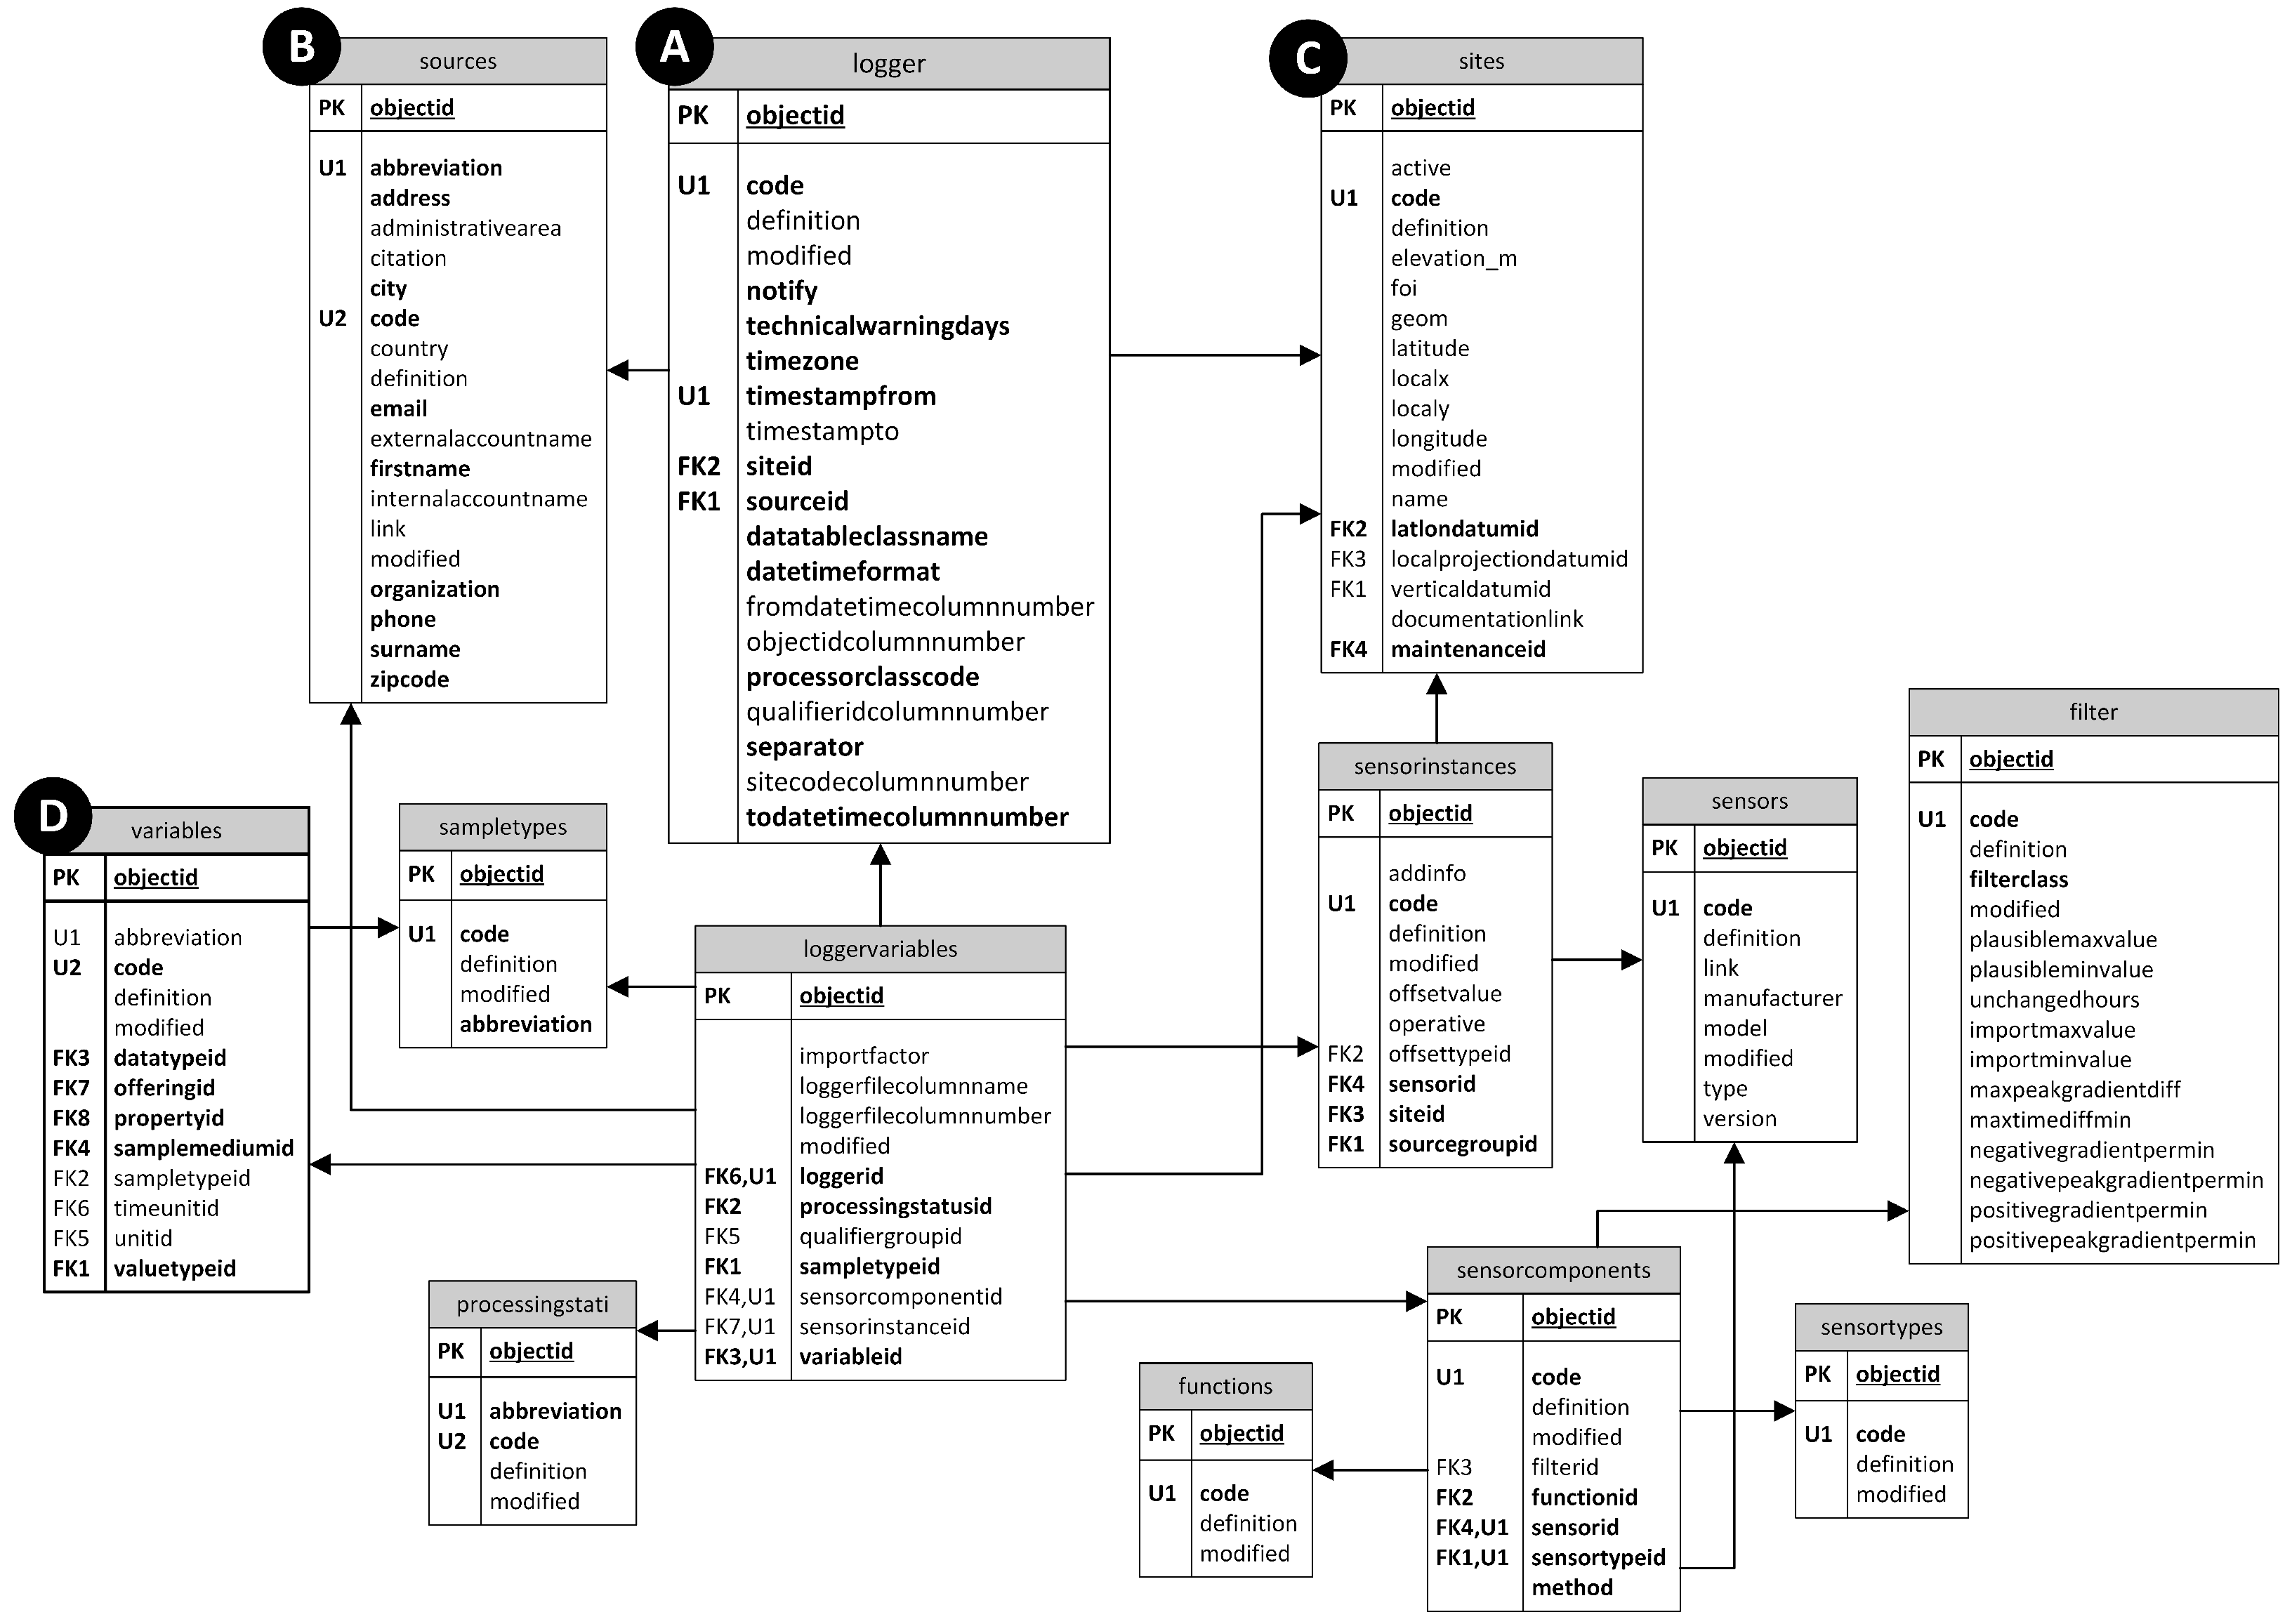
[Data Import and Processing] Data collection information includes a description of stations and their individual instruments, including manufacturer, maintenance, calibration, resolution, accuracy, observed properties and sampling intervals, etc (see C and D in Figure 2). Most of this information is encoded in a SensorML document. Data processing descriptions refer to logger configurations, calculation methods and functions, filters, issues discovered during data importing, etc (see A and C in Figure 3). These descriptions specify the documented history of measurements, and therefore are crucial to support data assessment.
(c)
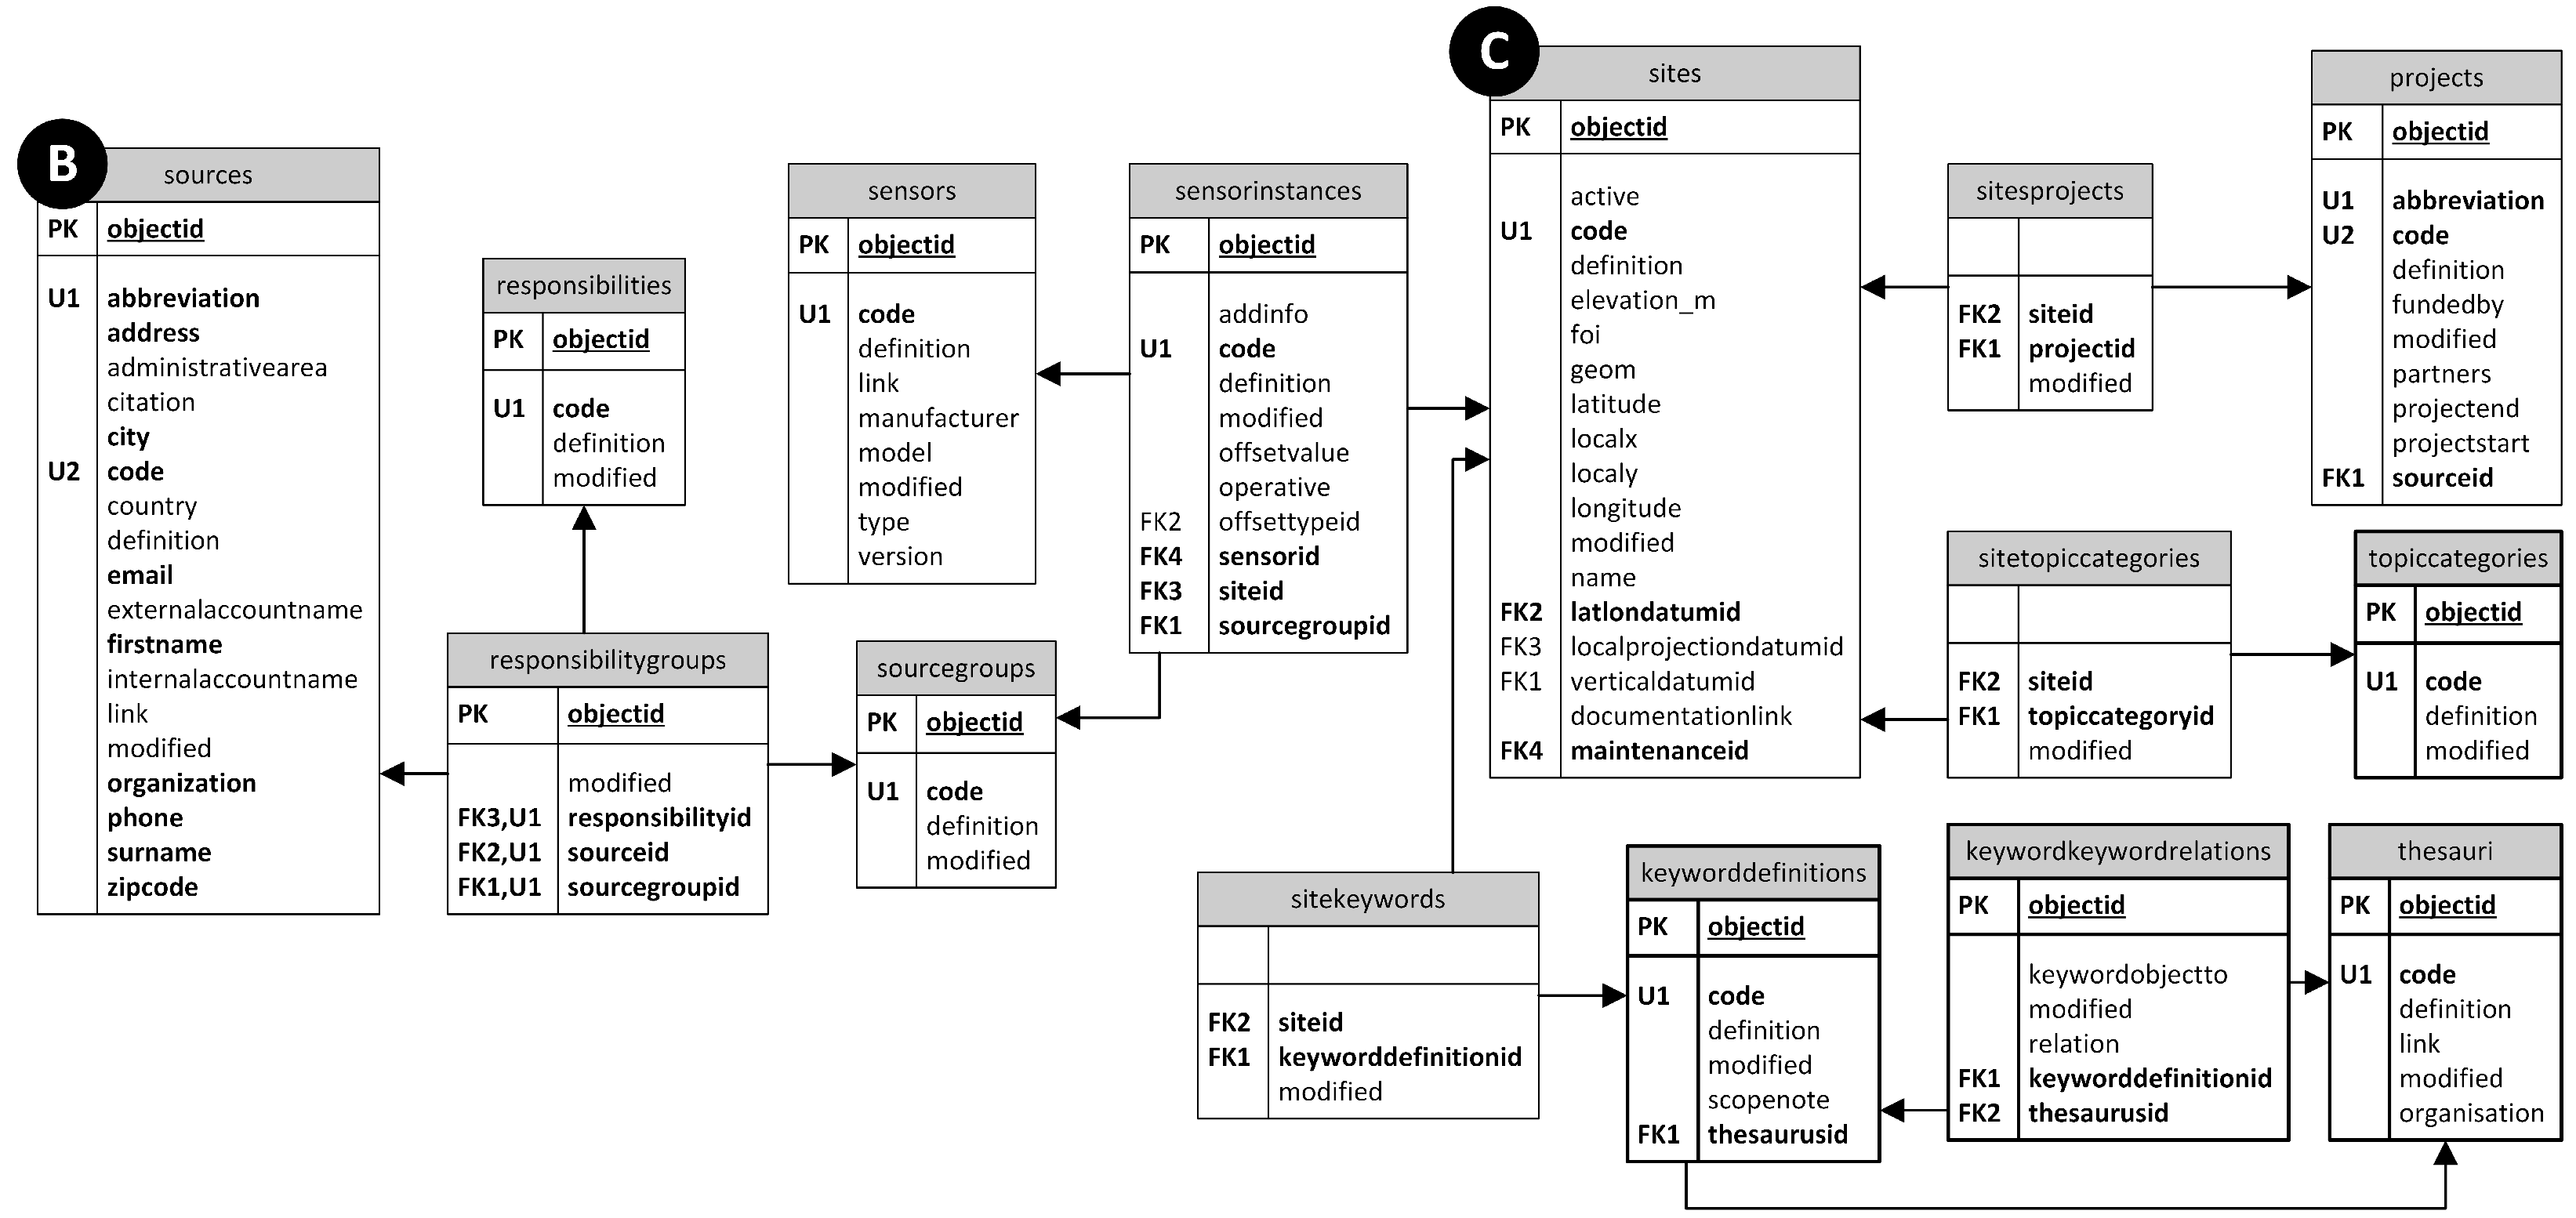
[Users and Roles] Authorization and access control refer to user profiles and groups, and help to specify roles in terms of user responsibilities. In the context TERENO, the primary users of the service are internal users involved in technical operation and maintenance, data inspection, and data release, and researchers associated with the TERENO initiative. We only store information about these users in the database (see table source). Details about public users who access the data via the web portal are not captured. Several tables have been developed to identify which internal user may access specific data and how the data may be used (Figure 4). For example, each site has several instances of sensors, and each sensorinstance only belongs to a specific sourcegroup. The table responsibilitygroup specifies the roles a user can play for a given sourcegroup. Examples of roles are technical maintenance, quality assessment and data release. Note that a user (as listed in the source table) can be assigned to one or more responsibility roles.
(d)
[Controlled Vocabularies] The original CUAHSI data model includes tables to define controlled vocabularies such as variable, sample medium, sensor code and data type. We have updated these tables and created several new vocabulary tables to ensure naming consistency when importing and processing data from various sensors, for examples, sensor types, physical properties, intended applications, keywords, topic categories and offerings. Some examples of controlled vocabularies are included in Figure 4 (see sitekeywords and sitetopiccategories, and their associated tables). In addition, the vocabularies are also used as metadata to support the discovery of relevant information. For example, we have transformed the SensorML documents generated in the above mentioned processes, to the Electronic Business Registry Information Model (ebRIM). Subsequently the metadata was imported into a catalog service based on the ebRIM (http://www.buddata-open.org/) model. With this mechanism, the TEODOOR web portal supports data discovery based on texts (e.g., sensor type, intended application and keyword), and spatial and temporal information. The reason for adopting the ebRIM profile of the Catalog Service for the Web (CSW) is that the CSW servers implementing the OpenGIS Catalogue Services Specification 2.0.2—ISO Metadata Application Profile [30] are not fully capable of supporting the requirements for standardized discovery of time series data as it can index a SOS (service), but not the SensorML descriptions.
Figure 2. Two quality information are attached to observation values supplied by the implemented service, i.e., quality flags (qualifiergroups and qualifiers) and data processing level (processingstati). The table source contains information about all users involved in sensors maintenance and operation, data processing, quality assessment and release. The details about data sensing and importing of observation values are specified in sites, variables, and fileimporting, and their associated tables.
Ijgi 04 01346 g002
Figure 3. A sensor may have one or more sensorcomponents. For a given sensor, several instances of the sensor can be created. The instances of the sensor is associated with a specific site (station). A logger is an instrument connected to the real sensor that collect observation data over time. The information specified in tables logger and loggervariables are used by the input data parsers (Figure 1) for importing data into the data infrastructure.
Ijgi 04 01346 g003
Figure 4. A sensorinstance only belongs to a specific sourcegroup. The table responsibilitygroup specifies the responsibilities (e.g., technical maintenance and data release) of a user for an instance of a sensor. The detailed information about TERENO users are included in table sources. The sites also links to projects and several controlled vocabularies e.g., topiccategories and keywords.
Ijgi 04 01346 g004

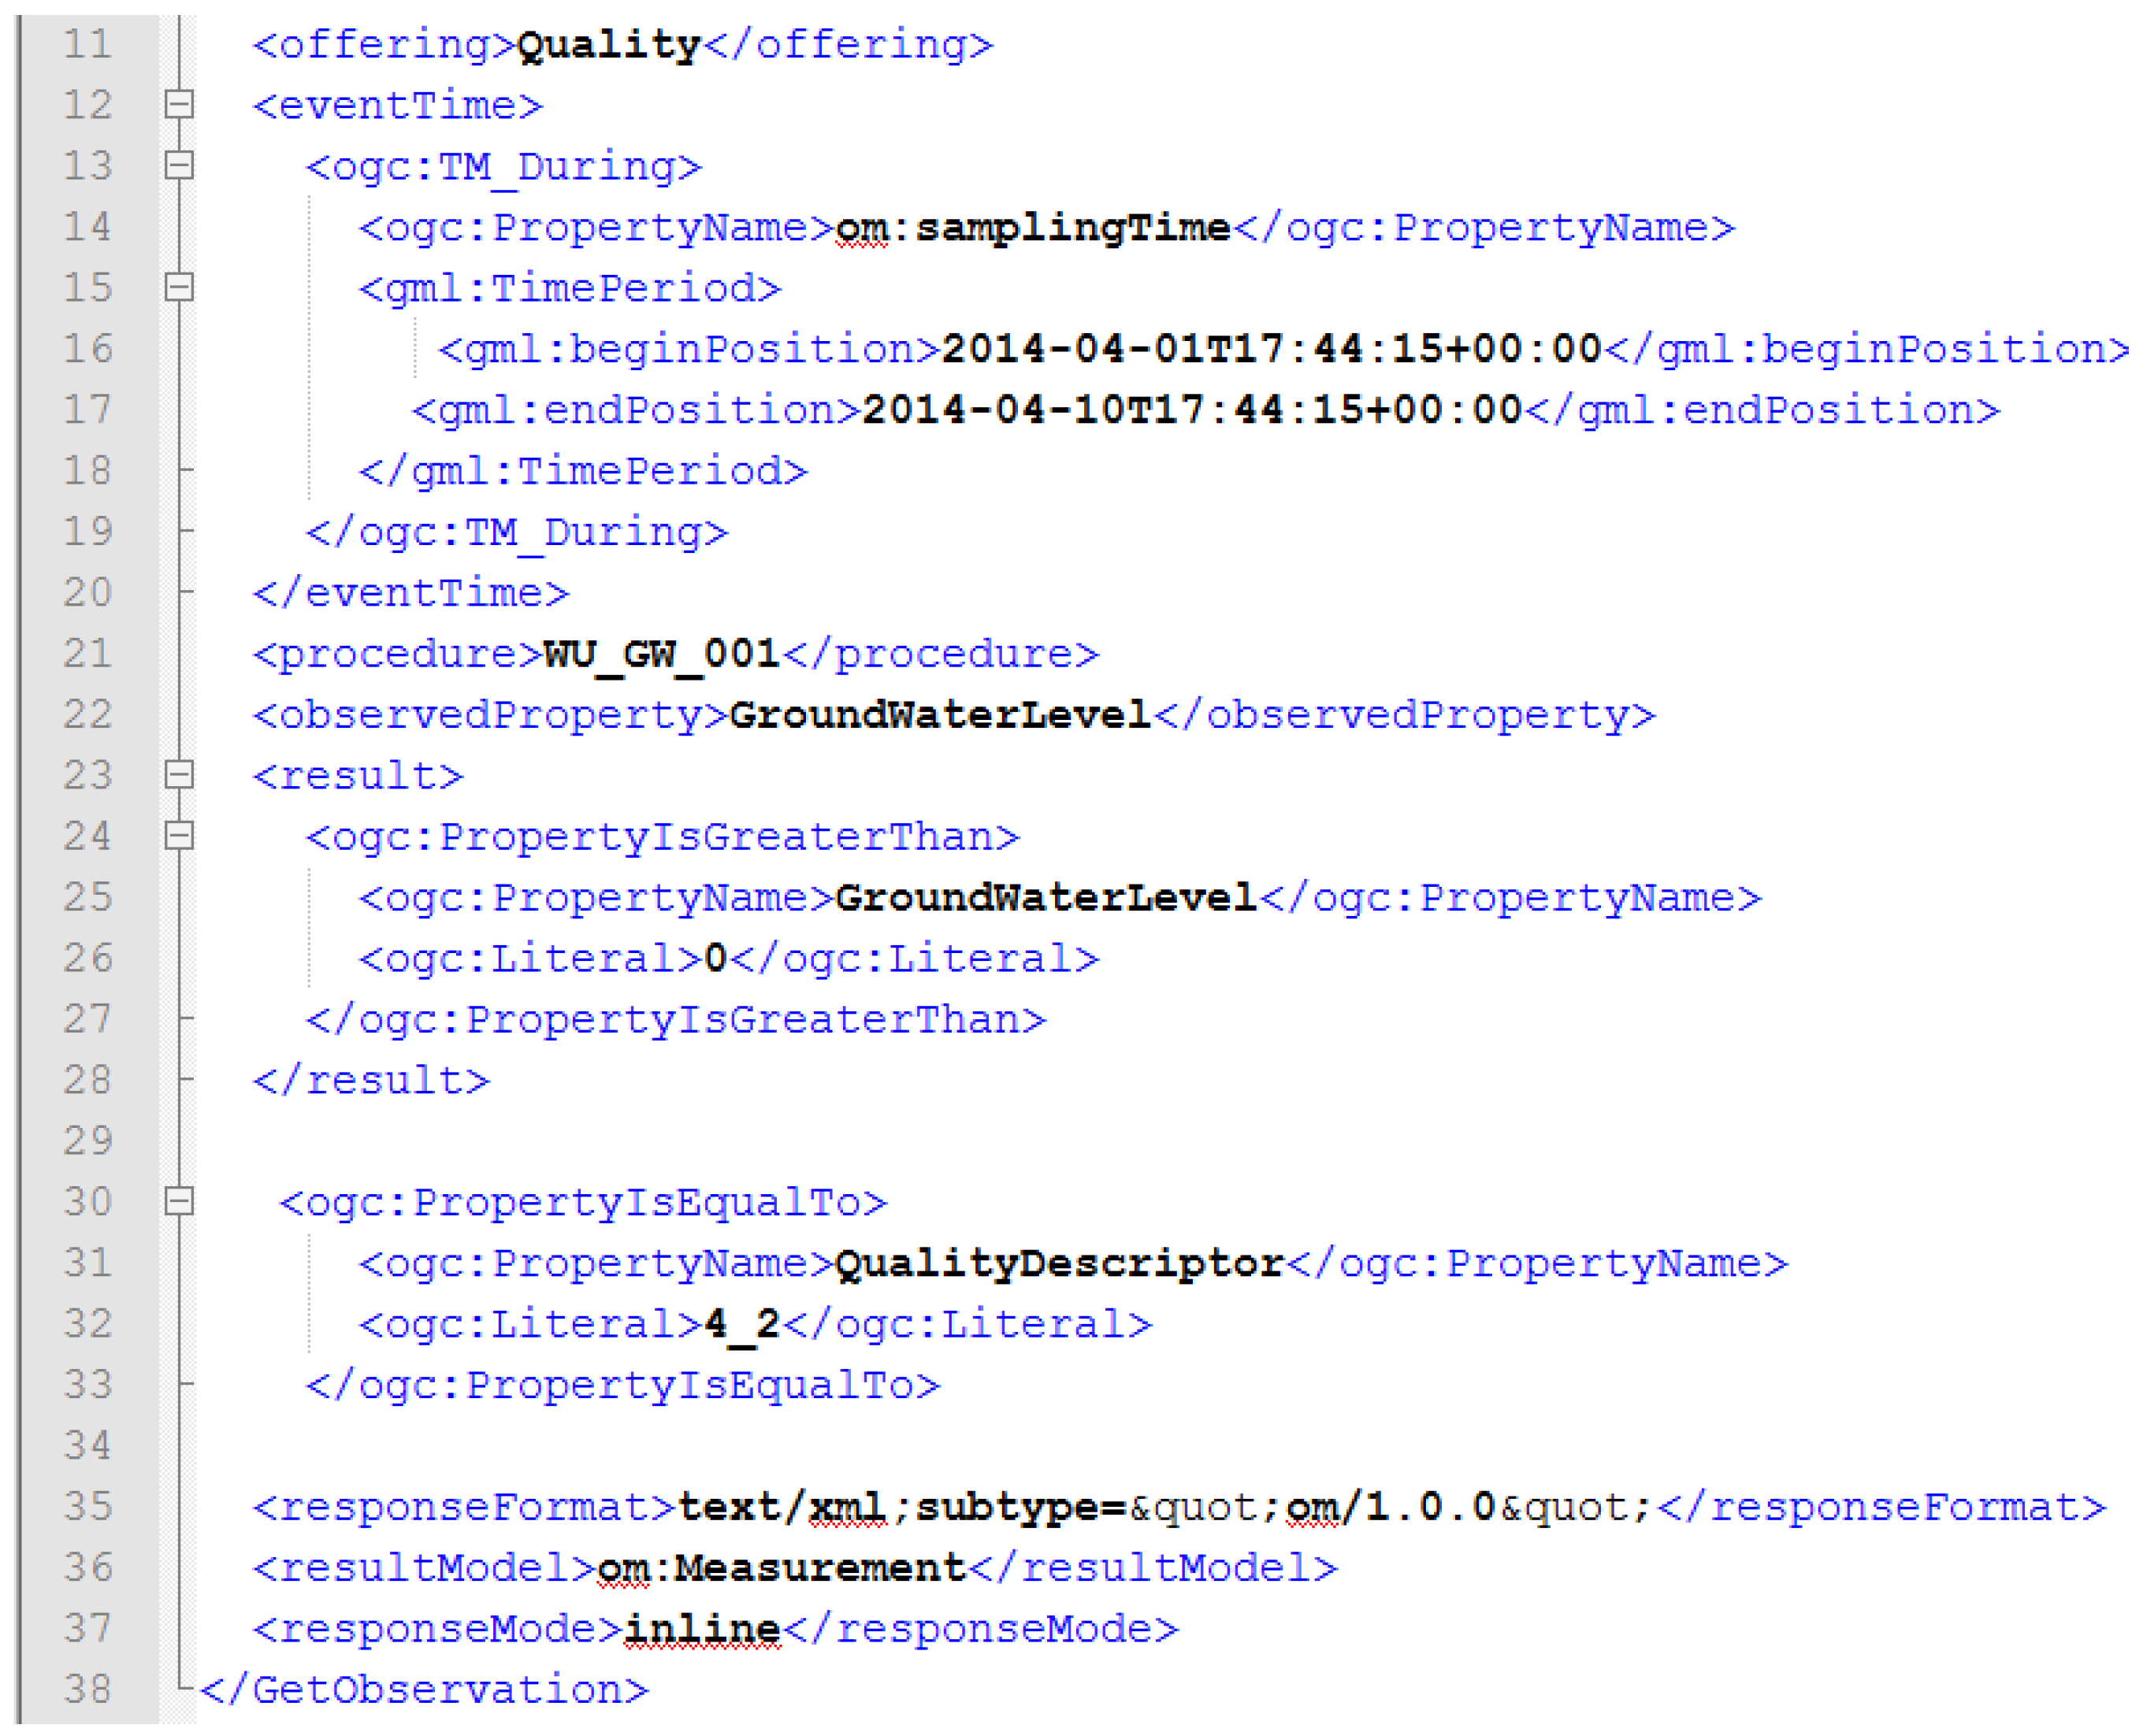
4.2. Quality-Enabled Sensor Observation Service (Q-SOS)

Since our data model is different from the default SOS (version 1.0) data model, we have created several database views to map these two models (for example, see Listing 1). The existing SOS has been modified, so that the extended SOS (Q-SOS) supplies quality descriptors and their associated metadata, besides the observation values. We have implemented several instances of Q-SOS based on the sensor groups as specified in Table 2. An example of these services is accessible at (http://ibg3wradar.ibg.kfa-juelich.de:8080/eifelrur_quality/). Figure 5 shows an excerpt of a GetObservation request that includes a quality filter on observation values generated by the WU_GW_001 station measuring the GroundWaterLevel property. The filter value (e.g., 4_2) is a concatenation of indices representing two quality descriptors which are the data processing level and the data flags separated by a delimiter (underscore). Figure 6 shows the results of the request (an O&M document). Some XML parts of the document are hidden for clarity purposes. The quality assessment information is assigned to observation values with the <om:resultQuality> section of the O&M document (see part 3 of Figure 6). The associated metadata are included in the <gml:metaDataProperty> section (compare parts 1,2 of Figure 6). It is assumed that the values forming the quality information (e.g., 4_2)) are in the same order as the metadata elements. The advantage of providing such quality information at the level of observation values is that they can be directly utilized by client applications. This has been demonstrated in Section 4.3.
Apart from the Q-SOS, a Web Processing Service (http://icg4aida.icg.kfa-juelich.de:9090/wps) based on the 52°North WPS (http://52north.org/communities/geoprocessing/wps/) implementation has been developed. The service is used to gather more detailed information about the quality descriptors and the history of a station, to update flagging information, and to approve data release. Some examples of these are demonstrated in Figure 7. The SensorML document of a given sensor includes the WPS link within the <history> section, which that returns the maintenance history of the sensor for a given time period.
Listing 1: An example of a view that produces procedures.
CREATE OR REPLACE VIEW sos.soilnetwuestebach_procedure_quality AS
 SELECT DISTINCT sites.objectid AS procedureid,
      'T'::character(1) AS hibernatediscriminator,
	  1::bigint AS proceduredescriptionformat_id,
      soilnetwuestebach_datadirectory_quality.sitecode::character
      varying(255) AS identifier,
      'F'::character(1) AS deleted,
      ('standard/'::text || soilnetwuestebach_datadirectory_quality.sitecode
      ::text)
      || '.xml'::text AS descriptionfile,
	  'F'::character(1) AS referenceflag
   FROM sos.soilnetwuestebach_datadirectory_quality,
      observationreferences.sites
  WHERE soilnetwuestebach_datadirectory_quality.siteid = sites.objectid;
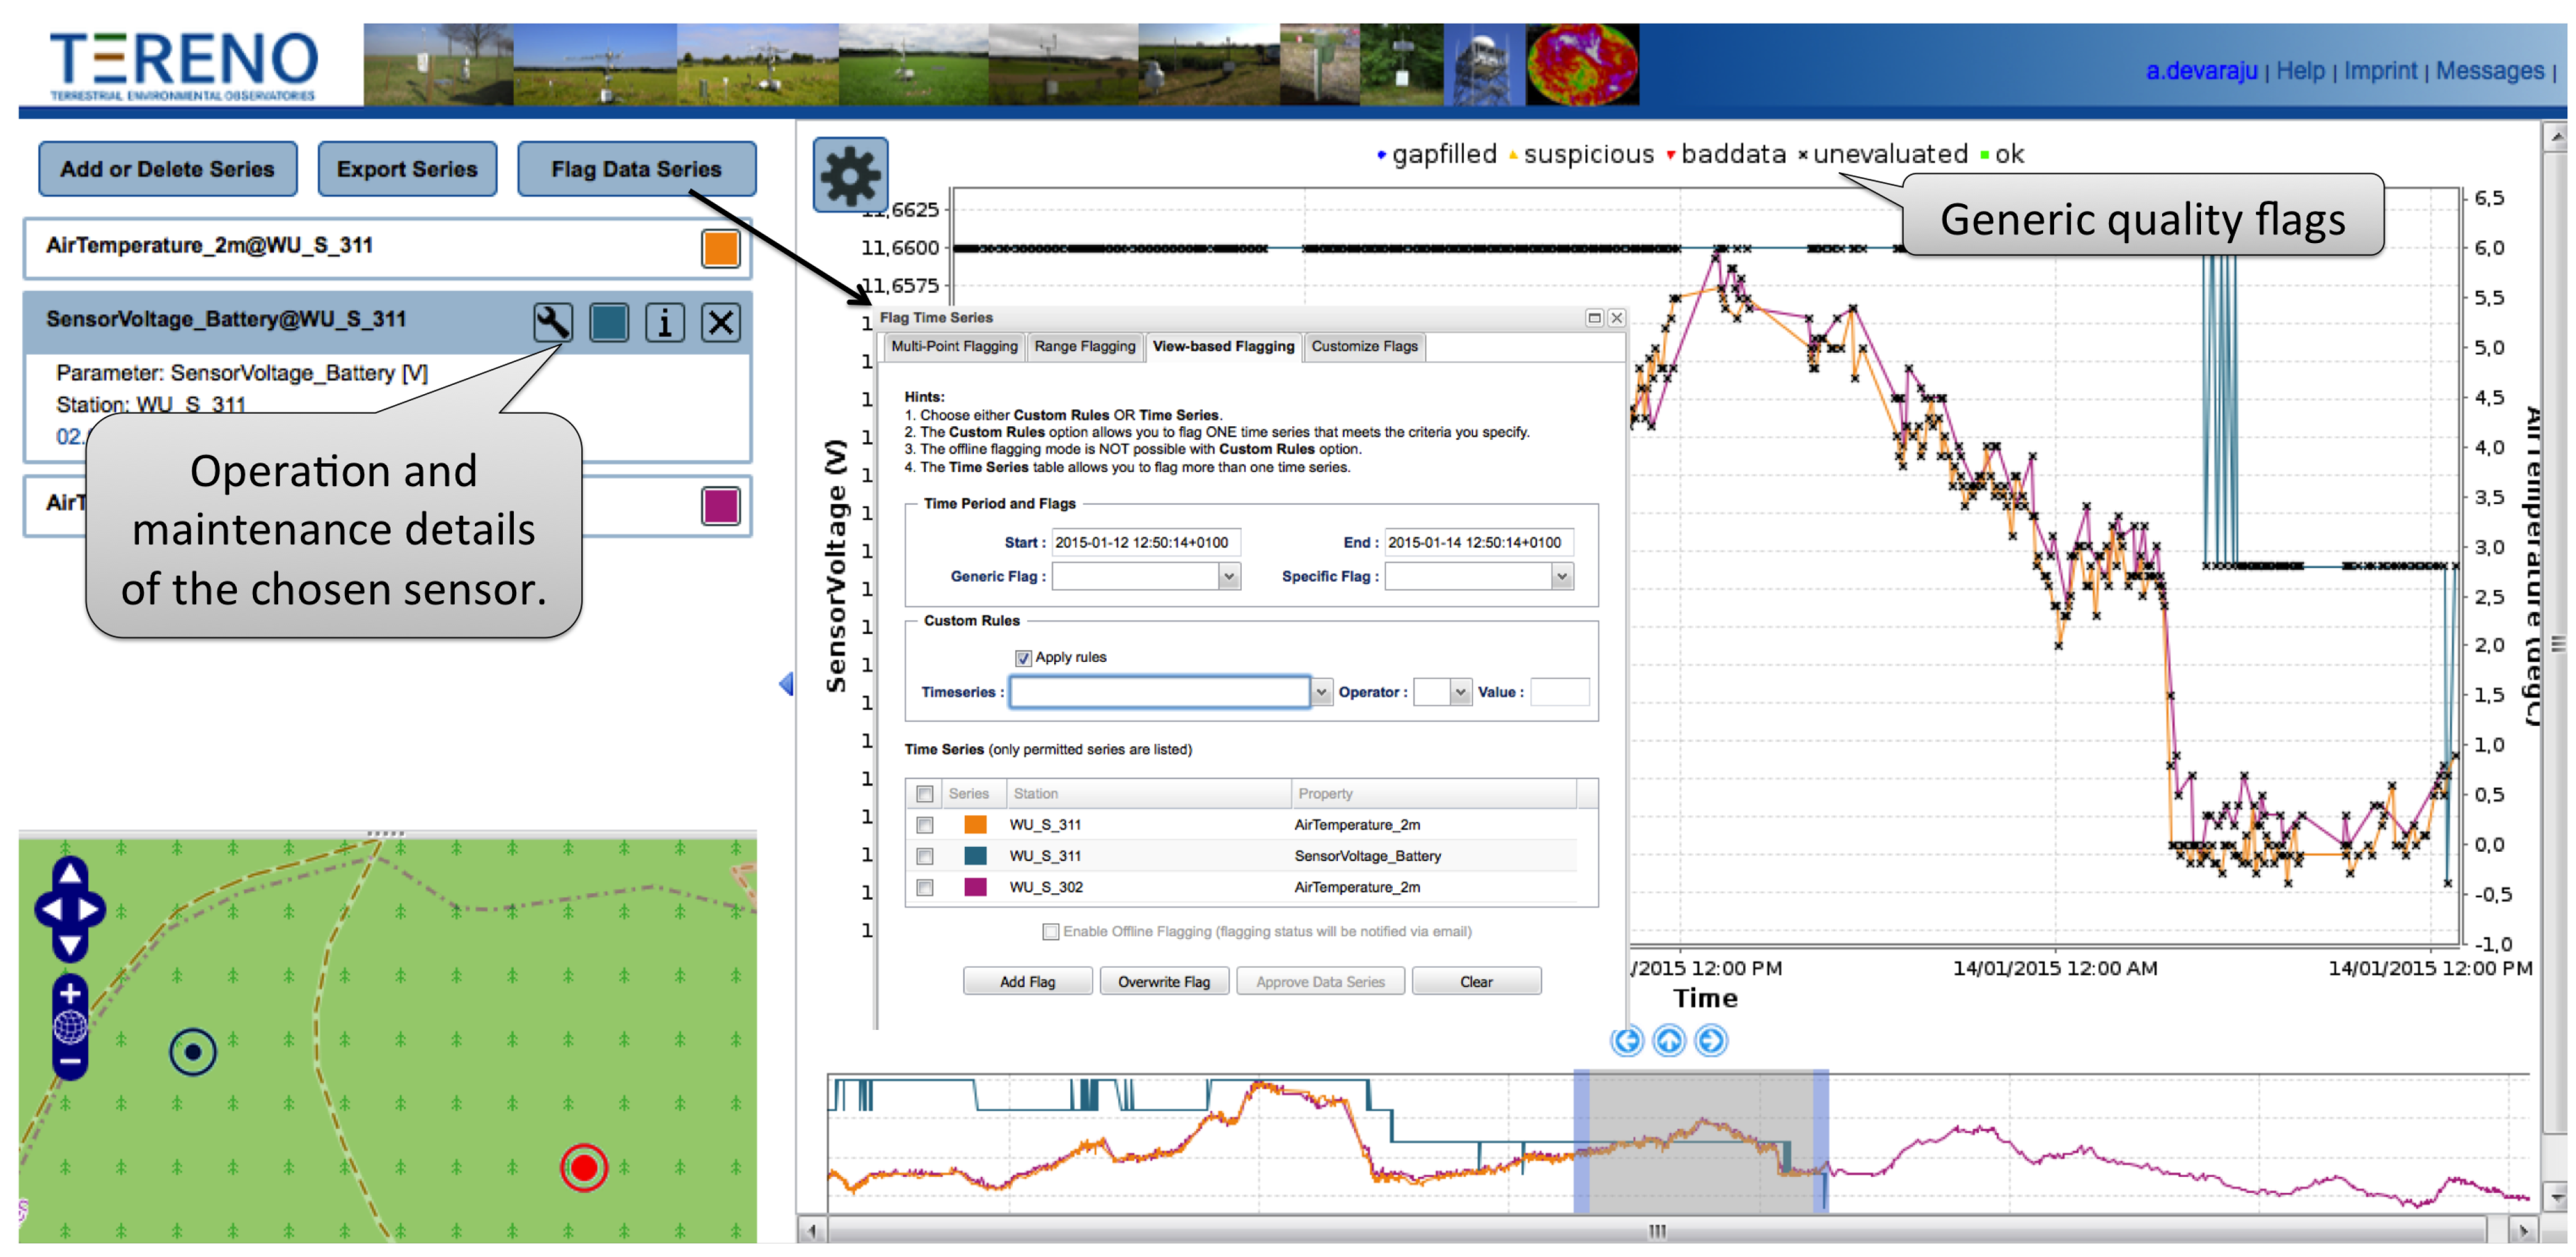
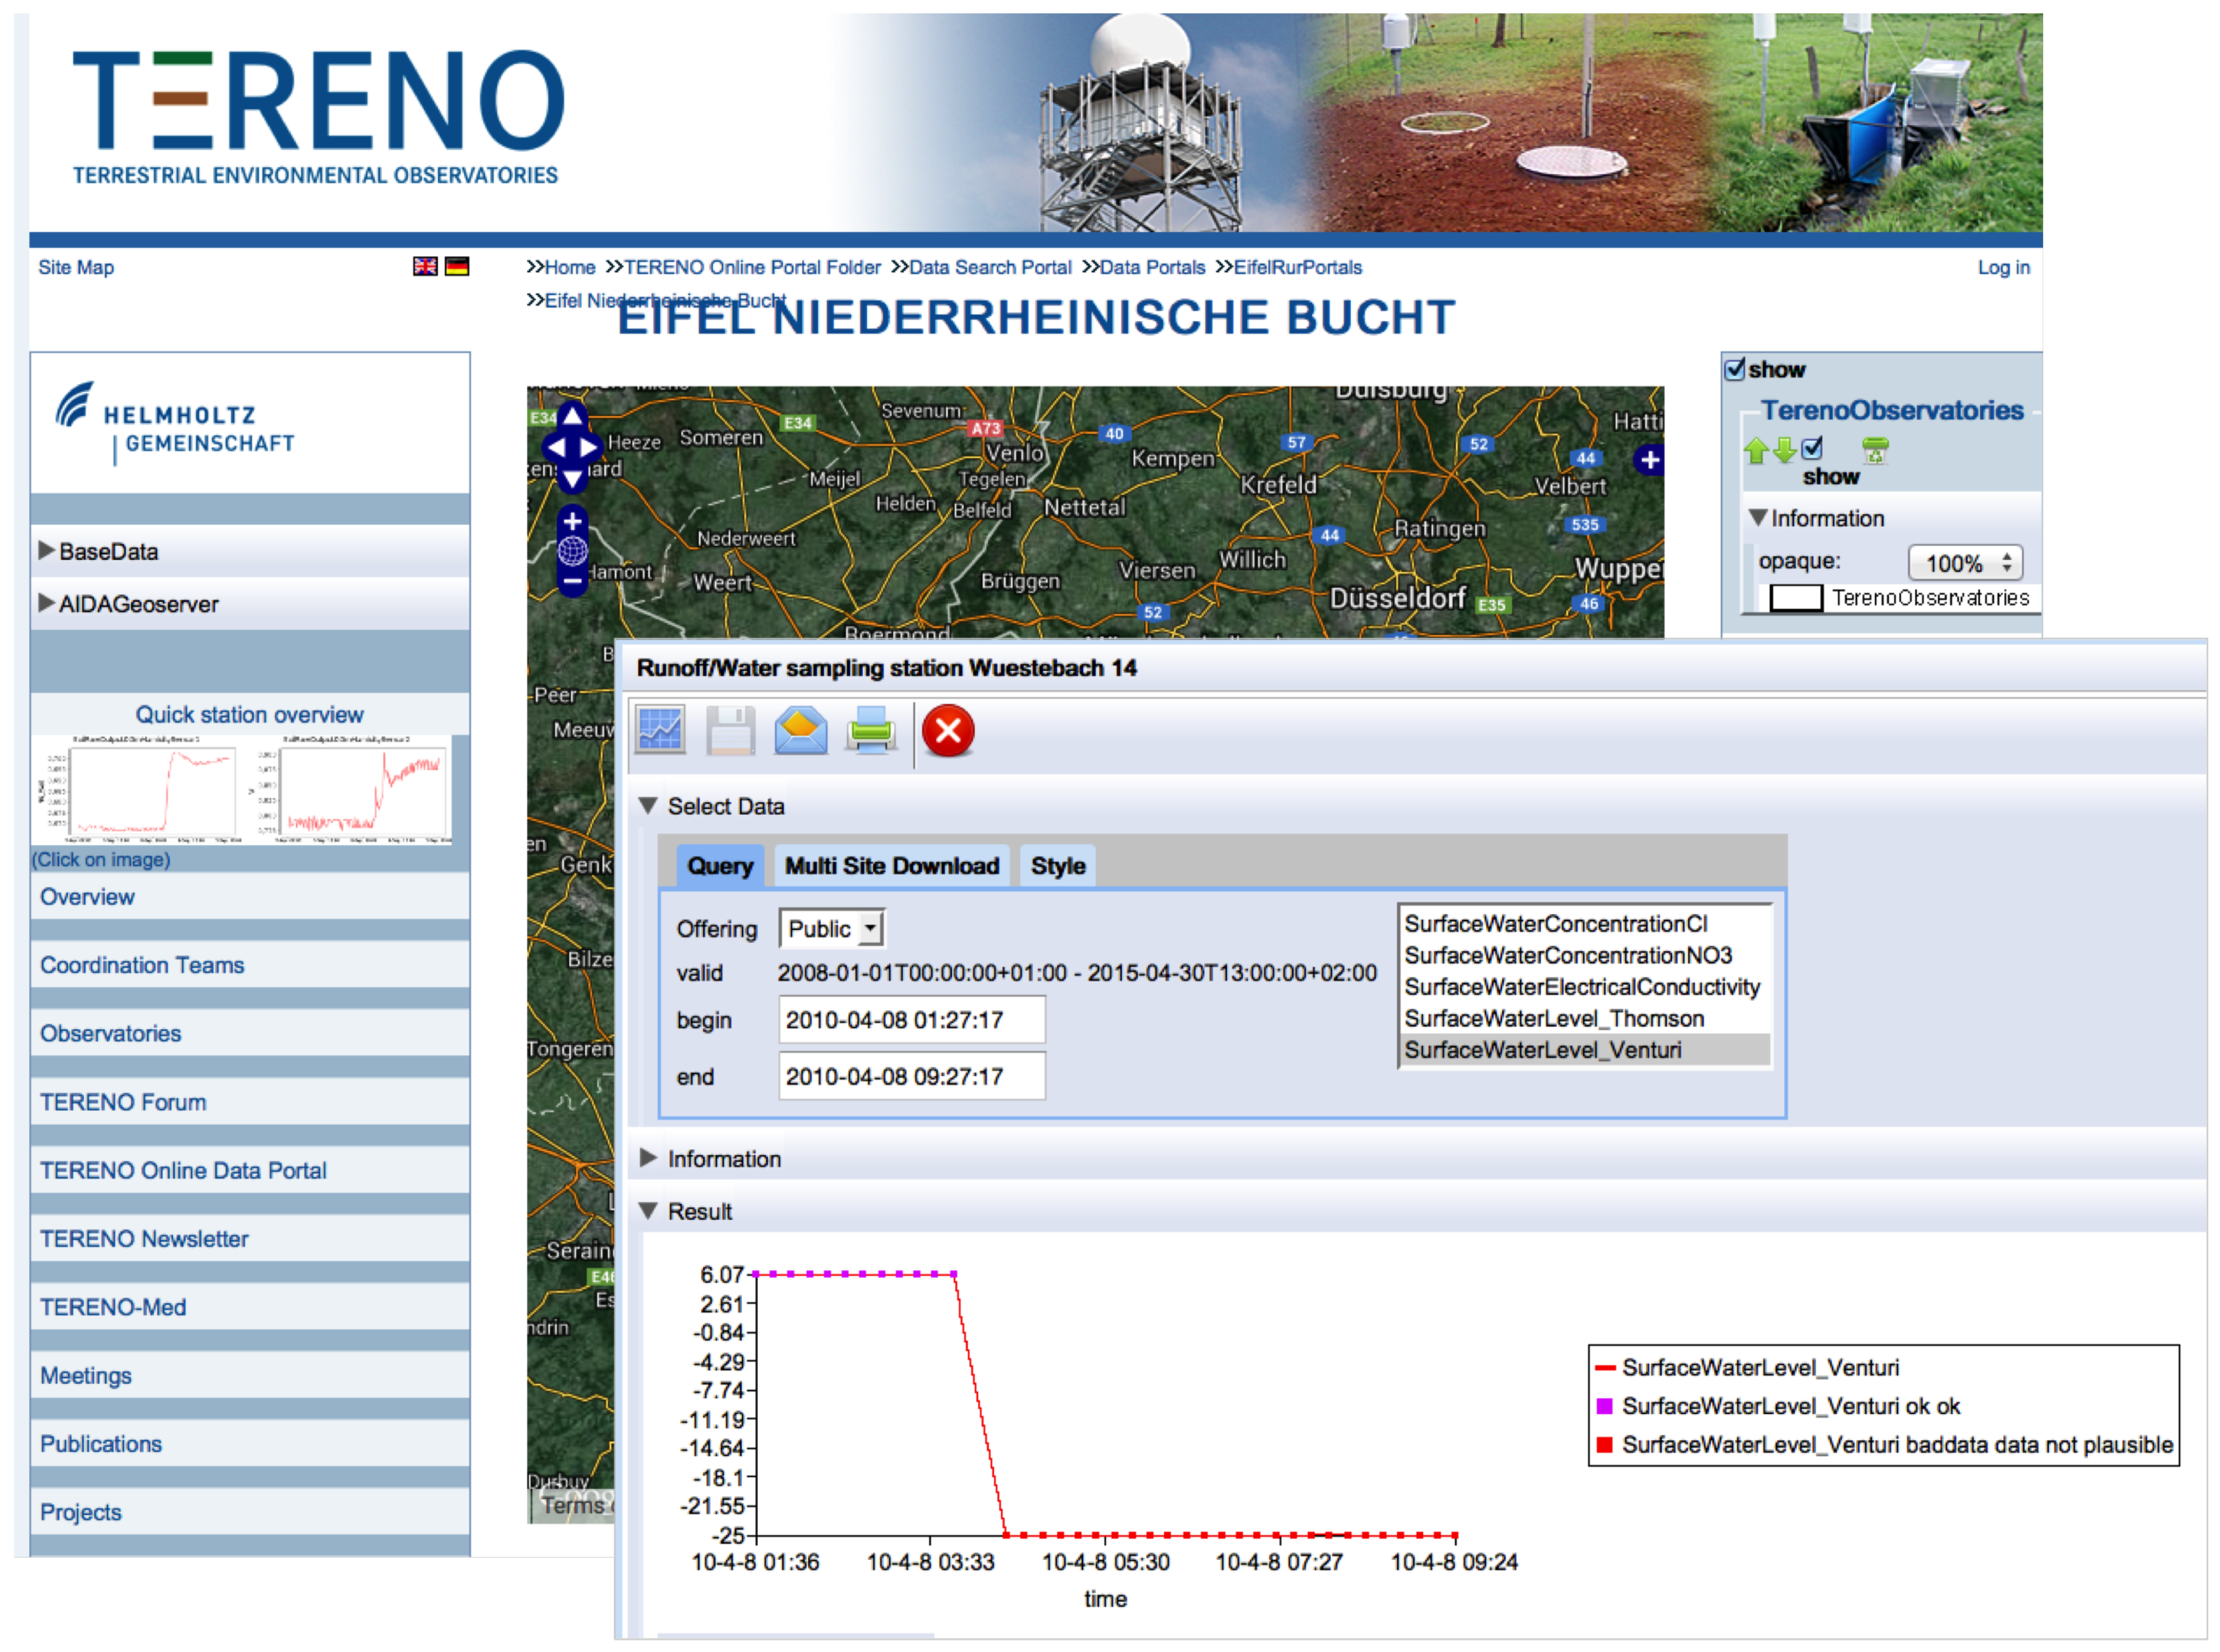
         
Figure 5. Excerpt of an GetObservation request containing a result filter based on quality information.
Ijgi 04 01346 g005

4.3. Applications

In the context of TERENO, the service has been applied in two cases. From the data provider perspective, it is used to assess the quality of observation data. From the data consumer perspective, it provides access to observation data from various sensors via applications such as the command line SOS client clisos and the TEODOOR web portal.
In the first case, the service is accessed by an online quality flagging tool (INSPECT) (Figure 7) that is based on the open source 52°North Sensor Web Client (http://52north.org/communities/sensorweb/clients/SensorWebClient/). We have extended the existing client with a data inspection module that allows users to visually assess and flag the data series based on the two-tier flagging convention (Subsection 4.1). As described in Subsection 4.1, the tool uses data access control information to allow certain operations (e.g., view series, flagging and data approval) based on the user roles and the user groups. It also retrieves the maintenance history of sensors via the implemented WPS. These functionalities demonstrate the usefulness of associating quality information with other measurement contexts to support data assessment.
In the second case, the service is employed to publish observation data along with quality information, for instance using the TEODOOR web portal. Figure 8 depicts an example of a time series of the property SurfaceWaterLevel_Venturi from the runoff sampling station Wuestebach 14 on 8th April 2010. The series is color-coded to indicate different quality flags (see the legend box of the right bottom of the Figure 8). Another example is that we have also set up an instance of the service to release data from selected soil moisture stations to the International Soil Moisture Network (https://ismn.geo.tuwien.ac.at/newsitem/new-network-tereno-2013-04-26/).
Figure 6. An example of O&M document produced by the Q-SOS that includes only fully quality assessed data (Level 2c) that are of good quality (“ok_ok” flag).
Ijgi 04 01346 g006
Figure 7. Assess data visually with the INSPECT online flagging tool.
Ijgi 04 01346 g007
Figure 8. Search and discover observation data with TEODOOR web portal. Red data points indicate bad data, whereas magenta data points indicate good data.
Ijgi 04 01346 g008
To sum up, the quality descriptors are useful to locate the datasets of interest, such as a request for data that are quality assessed and that exclude bad and suspicious values. The flags can also be used to create better visuals, for example generating time series graphs with color coding of values (see Figure 7 and Figure 8).

5. Discussion and Conclusions

The TERENO observatory network comprises observation data from various sensing applications, including technical sensors and field sampling. The challenge is to find a systematic way to control the quality of these datasets and then make them available to users in a common manner. To realize this, we have developed an observation data model, and an extension of the OGC SOS 1.0 standard that supports the retrieval of observation data with quality descriptions. The difference with our data model as compared to existing observation data models lies in the fact that our model represents various aspects of data quality assessment, ranging from the selection and maintenance of sensors to the final assessment of data. The model characterizes data sensing and processing that are useful to deduce information about the causes of data variability. It supports a two-level flag scheme to cater flag systems of different sensing applications, and processing levels to ease assessment and accessibility of data. Another advantage is that differing quality flags applicable for the same property measured by different sensor models can also be represented. Although the data model focuses on TERENO observation data, the concepts are extensible and can be applied to timeseries data from other sensing applications.
Unlike the conventional 52°North SOS implementation, the Q-SOS has been designed to supply observation data with quality descriptors. We have looked at options available in the SOS interface and concluded that adding the quality descriptors and their metadata in the same O&M document is the preferred method as the quality information can be directly used by client applications in terms of data filtering and visualization. The Q-SOS represents metadata of descriptors at a general level; the quality-aware WPS can be used to obtain more detailed information.
Overall, both model and service have played an important role in supporting data inspection and dissemination in the context of TERENO. This has been demonstrated through the working examples described in Section 4.3. They are congruent with prior work as they have been designed and implemented by adapting existing specifications (e.g., SWE and CUAHSI), and by extending open source tools (e.g., 52°North's SOS implementation and Sensor Web Client). We plan to publish the Q-SOS, the quality-aware WPS and the quality flagging tool under the 52°North GitHub repository. We believe this can promote re-usability of the solutions developed.
Even though the SOS 2.0 standard is available since 2012, our work is still based on the SOS 1.0 standard. The reason for this lies in the requirements of the TERENO project. As important design decisions had to be taken before SOS 2.0 standard and its service implementation were made available, it was not able to adopt the more recent SOS 2.0 standard. Recently, we have successfully created database views to map our data model to the SOS 2.0 model. The next step is to extend the service implementation to represent quality information of observation values.
The future work focuses on implementing the user feedback model proposed by [6,28] as part of our data quality management framework. The feedback information from data consumers gives a better insight into application and assessment of published datasets. For example, consider descriptions about a scientific analysis in which the datasets were used, and any discovered issues related to the quality of the published datasets. Data providers can use this information to handle erroneous data and improve their data collection and processing methods.
Another interesting line of work to pursue is developing an ontology representing quality descriptors (e.g., quality flags and tests) to handle naming ambiguities, resulting the discovery of observation data published from different sources. A related study in this direction is that of [31], who developed informal quality flag mappings between 15 widely-used flag standards in the oceanographic domain. Another work is by [11] , who suggested the use of ontology to link quality tests of marine data between different authorities.

Acknowledgments

The TERENO infrastructure is funded by the Helmholtz Association and the Federal Ministry of Education and Research.

Conflicts of Interest

The authors declare no conflict of interest.

References

  1. Balazinska, M.; Deshpande, A.; Franklin, M.; Gibbons, P.; Gray, J.; Nath, S.; Hansen, M.; Liebhold, M.; Szalay, A.; Tao, V. Data management in the worldwide sensor web. IEEE Pervasive Comput. 2007, 6, 30–40. [Google Scholar] [CrossRef]
  2. U.S. Environmental Protection Agency. Glossary of Quality Assurance Terms and Related Acronyms; National Center for Environmental Research and Quality Assurance: Washington, D.C., USA, 1997.
  3. Hoyle, D. ISO 9000 Quality Systems Handbook (Fourth Edition); Butterworth-Heinemann: Oxford, United Kingdom, 2011. [Google Scholar]
  4. WMO. Guide to Hydrological Practice—Data Acquisition and Processing Analysis, Forecasting and Other Applications (WMO-No. 168); World Meteorological Organization (WMO): Geneva, Switzerland, 1994. [Google Scholar]
  5. Botts, M.E.; Percivall, G.; Reed, C.; Davidson, J. OGC sensor web enablement: Overview and high level architecture. In Proceedings of the Second International Conference on GeoSensor Networks (GSN 2006), Boston, MA, USA, 1–3 October 2006.
  6. Serral, I.; Masó, J. Deliverable 6.3—Assessment of Standards, Protocols and Guidelines Employed in GeoViQua. Available online: http://www.geoviqua.org/Docs/SubmittedDeliverables/D6_3_GeoViQua.pdf (accessed on 5 July 2014).
  7. Williams, M.; Cornford, D.; Bastin, L.; Jones, R.; Parker, S. Automatic processing, quality assurance and serving of real-time weather data. Comput. Geosci. 2011, 37, 353–362. [Google Scholar] [CrossRef]
  8. Brauner, J.; Bröring, A.; Bügel, U.; Favre, S.; Hohls, D.; Hollmann, C.; Hutka, L.; Jirka, S.; Jürrens, E.H.; Kadner, D.; et al. D4.14 Specification of the Advanced SWE Concepts (Issue 4)—EO2HEAVEN SII Architecture Specification Part V; Jirka, S., Ed.; EO2HEAVEN Consortium: Madrid, Spain, 2013. [Google Scholar]
  9. Bastin, L.; Cornford, D.; Jones, R.; Heuvelink, G.B.; Pebesma, E.; Stasch, C.; Nativi, S.; Mazzetti, P.; Williams, M. Managing uncertainty in integrated environmental modelling: The UncertWeb framework. Environ. Model. Softw. 2013, 39, 116–134. [Google Scholar] [CrossRef]
  10. Stuart, E.M.; Veres, G.; Zlatev, Z.; Watson, K.; Bommersbach, R.; Kunz, S.; Hilbring, D.; Lidstone, M.; Shu, T.; Jacques, P. SANY Fusion and Modelling Architecture; OGC Discussion Paper OGC 10-001; SANY Consortium: Southampton, UK, 2009. [Google Scholar]
  11. Fredericks, J.; Botts, M.; Bermudez, L.; Bosch, J.; Bogden, P.; Bridger, E.; Cook, T.; Delory, E.; Graybeal, J.; Haines, S.; et al. Integrating quality assurance and quality control into open geospatial consortium sensor web enablement. In Proceedings of OceanObs 2009: Sustained Ocean Observations and Information for Society, Venice, Italy, 21–25 September 2009.
  12. Garcia, M. NOAA IOOS Data Integration Framework (DIF)—IOOS Sensor Observation Service Install Instructions; Integrated Ocean Observing System (IOOS) Program Office: Silver Spring, MD, USA, 2010. [Google Scholar]
  13. Tarboton, D.G.; Horsburgh, J.S.; Maidment, D.R. CUAHSI Community Observations Data Model (ODM) Version 1.1 Design Specifications; The Consortium of Universities for the Advancement of Hydrologic Science: Boston, MA, USA, 2008. [Google Scholar]
  14. WMO. WMO Guide To Meteorological Instruments And Methods Of Observation—WMO-No. 8, 7th ed.; Technical Report 978-92-63-10008-5; World Meteorological Organization: Geneva, Switzerland, 2008. [Google Scholar]
  15. Devaraju, A.; Kunkel, R.; Bogena, H.; Vereecken, H. A common quality assessment framework for environmental observation data. In Proceedings of the 14th SGEM GeoConference on Informatics, Geoinformatics and Remote Sensing (SGEM2014) Conference, Albena, Bulgaria, 17–26 June 2014.
  16. Devaraju, A.; Kunkel, R.; Sorg, J.; Bogena, H.; Vereecken, H. Enabling quality control of sensor web observations. In Proceedings of the 3rd International Conference on Sensor Networks (SENSORNETS 2014), Lisbon, Portugal, 17–27 January 2014.
  17. Zacharias, S.; Bogena, H.; Samaniego, L.; Mauder, M.; Fuß, R.; Pütz, T.; Frenzel, M.; Schwank, M.; Baessler, C.; Butterbach-Bahl, K.; et al. A network of terrestrial environmental observatories in Germany. Vadose Zone 2011, 10, 955–973. [Google Scholar] [CrossRef]
  18. Bröring, A.; Stasch, C.; Echterhoff, J.E. OGC Implementation Specification: Sensor Observation Service (SOS) 2.0 (12-006); Open Geospatial Consortium Inc.: Wayland, MA, USA, 2012. [Google Scholar]
  19. Botts, M.; Robin, A. OGC Implementation Specification: Sensor Model Language (SensorML) 2.0.0; Open Geospatial Consortium Inc: Wayland, MA, USA, 2014. [Google Scholar]
  20. Cox, S. OGC Implementation Specification: Observations and Measurements (O&M)—XML Implementation 2.0; Technical Report (10-025r1); Open Geospatial Consortium Inc.: Wayland, MA, USA, 2011. [Google Scholar]
  21. Ninyerola, M.; Sevillano, E.; Serral, I.; Pons, X.; Zabala, A.; Bastin, L.; Masó, J. QualityML: A dictionary for quality metadata encoding. EGU Gen. Assem. Conf. Abstr. 2014, 16, 10452. [Google Scholar]
  22. WOCE. WHP 91-1 : WOCE Operations Manual, WOCE Report No. 68/91 ed.; World Ocean Circulation Experiment (WOCE): San Diego, USA, 1994. [Google Scholar]
  23. IOC of UNESCO. Ocean Data Standards, Vol.3: Recommendation for a Quality Flag Scheme for the Exchange of Oceanographic and Marine Meteorological Data; IOC Manuals and Guides 54 IOC/2013/MG/54-3; Intergovernmental Oceanographic Commission (IOC), UNESCO: Paris, France, 2013. [Google Scholar]
  24. Bartha, M.; Bleier, T.; Dihé, P.; Havlik, D.; Hilbring, D.; Hugentobler, M.; Iosifescu Enescu, I.; Kunz, S.; Puhl, S.; Scholl, M.; et al. Specification of the Sensor Service Architecture Version 3 (Document Version 3.1); OGC Discussion Paper OGC 09-132r1; SANY Consortium: Southampton, UK, 2009. [Google Scholar]
  25. De La Beaujardiere, J. The NOAA IOOS data integration framework: Initial implementation report. In Proceedings of the OCEANS 2008, Quebec City, QC, Canada, 15–18 September 2008.
  26. Garcia, M. IOOS Conventions for CSV Encoding - Version 1.0.0; NOAA/NWS/NDBC: Seattle, WA, USA, 2010. [Google Scholar]
  27. Bosch, J.; Fredericks, J.; Botts, M.; Cook, T.; Haines, S.; Bogden, P.; Bridger, E. Applying open geospatial consortium's sensor web enablement to address real-time oceanographic data quality, secondary data use, and long-term preservation. In Proceedings of the 2009 OCEANS MTS/IEEE Biloxi—Marine Technology for Our Future: Global and Local Challenges, Biloxi, MS, USA, 26–29 October 2009.
  28. Díaz, P.; Masó, J.; Sevillano, E.; Ninyerola, M.; Zabala, A.; Serral, I.; Pons, X. Analysis of quality metadata in the GEOSS Clearinghouse. Int. J. Spat. Data Infrastruct. Res. 2012, 7, 352–377. [Google Scholar]
  29. Kunkel, R.; Sorg, J.; Eckardt, R.; Kolditz, O.; Rink, K.; Vereecken, H. TEODOOR: a distributed geodata infrastructure for terrestrial observation data. Environ. Earth Sci. 2013, 69, 507–521. [Google Scholar] [CrossRef]
  30. Voges, U.; Senkler, K. OpenGIS Catalogue Services Specification 2.0.2—ISO Metadata Application Profile (OGC 07-045); Open Geospatial Consortium Inc: Wayland, MA, USA, 2007. [Google Scholar]
  31. Schlitzer, R. Oceanographic Quality Flag Schemes and Mappings between Them (Version 1.4); Alfred Wegener Institute for Polar and Marine Research: Bremerhaven, Germany, 2013. [Google Scholar]

