Abstract
The relevance of geographic information to mobile users must be evaluated by taking into account the usage context. This paper assumes that emerging Location-based Social Networks (LBSNs) contain contextual information rich enough to be used in order to contextualize such an evaluation process. This assumption is demonstrated through an exploratory analysis of a Foursquare check-in dataset, which reveals the impacts of two contextual factors—temporal and spatial—on mobility patterns. This paper then proposes an approach that may be used to contextualize the evaluation of geographic information’s relevance. The proposed algorithm links a priori relevance to the contextualized relevance using the hidden impacts of contextual factors. Improved performance from the experiments carried out confirms the validity of the proposed approach, as well as the benefits of utilizing contextual information within the relevance evaluation process.
1. Introduction
Thanks to advances in telecommunications technology and the introduction of portable communication devices, the use of geographic information has recently been extended beyond desktop computers to include mobile devices. However, the exciting mobility features that come along with such technology have also brought with them challenges in terms of the utilization of geographic information. On the one hand, mobile users are usually in the middle of certain tasks or activities such as walking or way finding, and so cannot spend as much time as desktop users staring at their screens and reading. On the other hand, this new and dynamic mobile environment is having a huge impact on user behavior. For example, a user might be interested in different kinds of tourist attractions at different times (e.g., during the day or at night) or over different spaces (e.g., in business or entertainment areas).
Therefore, geographic information retrieving systems for mobile users should be able to understand the usage context, so as to evaluate the geographic information’s contextual relevance. By taking the usage context into account, such as the location, task and time, both the computing resources and the users’ mental resources can be saved, enhancing the information perception.
The usage context is, however, not easy to collect because of the context’s heterogeneous and dynamic nature. Normally, such information is collected either by explicitly asking a user to fill-out a form or answer specific questions, or by implicitly gathering data detected by sensors such as GPS [1]. However, these approaches tend to be costly and cumbersome. As a result, Volunteered Geographic Information (VGI) such as location-based social networks (LBSN) provides another possibility. Despite users’ general unwillingness to fill out forms, they are tending to volunteer more and more information about their experiences, interests and emotions on the web, and this information potentially includes abundant contextual information. It is hence possible to observe contextualized mobility patterns from such dataset, and so evaluate the relevance and retrieve the geographic information in a more targeted and context-aware manner.
The main aim of this paper is to reveal how one can identify the impacts of contextual features on mobility patterns using an LBSN dataset, and propose an approach to contextualize the relevance evaluation process based on these impacts. The rest of this paper is organized as follows. First, a brief overview of the related work on geographic relevance evaluations and volunteered geographic information will be given in Section 2. Thereafter, Section 3 defines the context based on the research scope, introduces the working dataset, and demonstrates the underlying mobility patterns associated with temporal and spatial context factors. Section 4 proposes an approach to contextualize the geographic relevance evaluation process, where both a priori and contextualized relevance are linked using the impacts identified in from Section 3. The approach will then be verified by through the use of experiments, after which a discussion of the results and limitations will take place in the same section. The last section concludes the study and provides an outlook for future research.
2. Related Work
Prior to the consumption by mobile users, a tremendous amount of geographic information must be consistently filtered, based on its relevance to the specific context. In this regard, it is essential to evaluate the relevance of geographic information while considering the usage context. Therefore, the first part of this section will examine the related work on evaluating geographic relevance. Since this study mainly relies on an LBSN dataset, the second part of this section will summarize the research that has been carried out into volunteered geographic information, with a special focus on LBSNs.
2.1. The Evaluation of Geographic Relevance
The notion of relevance stems from, and has been central to, the discipline of Information Retrieval (IR) for at least 40 years [2], whereby documents are ranked, filtered and retrieved based on their similarity to the query text. With the development of mobile devices, information retrieval models are now looking for more personalized ways to explore and make relevant recommendations within the mobile space. The notion of relevance has subsequently been developed into the field Geographic Relevance (GR) [3,4], to help adapt existing models to the mobile environment.
Although most existing systems base their retrieval decisions solely on queries and document collection, contextual information has been proven to be helpful with regard to information retrieval and access [5]. Location is considered the most important, and perhaps the only, criterion for determining geographic relevance [6]. Reichenbacher et al. [7], however, argue that location and simple spatial concepts (e.g., buffers around the user’s position) which provide a binary information filter are insufficient when used alone. In this regard, they proposed a conceptual framework to be used to assess geographic relevance through an abstraction of distance, whereby both spatial and non-spatial distances, such as conceptual and semantic distances, could be captured. Building on this knowledge, De Sabbata and Reichenbacher [8] developed a probabilistic model which computes the distance value for each dimension, and subsequently, the similarity between the user context and geographic objects. In their later study, De Sabbata and Reichenbacher [9] extended the existing criteria establishing a set of 29 criteria for relevance assessment.
Problems with the existing approaches are two-fold. First, although researchers have noted the importance of context, collecting contextual information is not easy. As mentioned earlier, contexts are usually collected from user inputs and using sensors. Information gathered from a user input can be multifaceted, but requires a user’s cooperation. Further, the data is difficult to keep up-to-date, and does not represent any spatiotemporal dynamics. On the other hand, the contexts detected by sensors can be in real time. However, the types of context gathered may be limited, and it is not always cheap and convenient to deploy sensors. Secondly, once contextual information has been collected, the system used needs rules to be applied so that it knows how to respond to different contexts, and these may be inflexible and time consuming.
Therefore, this paper attempts to bypass these problems with the help of data mining techniques. Based on users’ historical records in LBSNs, the contextualized mobility patterns can be uncovered, which means the relevance of the geographic information can be assessed in a context-aware way.
2.2. Potentials of Volunteered Geographic Information
The power of “the crowd” in creating spatial data has been well recognized over recent years. With a clear goal and usable tools, volunteer crowds can create impressive spatial data that can be used across a number of fields. For example, a detailed OSM base map for Haiti, one otherwise not widely available, was developed by volunteers shortly after the 2010 Haiti Earthquake (see OpenStreetMap—Project Haiti [10]), and a Twitter Crawler for Typhoon Haiyan was quickly initiated to support disaster relief workers [11]. The abovementioned datasets, taken from either crowding mapping projects (OSM) or social media (Twitter tweets), can both be considered forms of Volunteered Geographic Information (VGI), because they are all created on a volunteer basis and cover the spatial dimension.
The potential of such kinds of VGI dataset have not only been recognized within the crisis management sector; these datasets are penetrating our everyday lives and changing the landscape of geographic computing. They provide not only geographic locations, but also the semantics and contexts of the spatial data captured. Therefore, such kinds of VGI data have recently been widely used in a variety of applications and services, such as the identification of human activity hotspots, recommendations for locations and routines, revelations on human mobility patterns, and the detection of social events.
For example, based on the assumption that popular landmarks and streets tend to attract more visitors, Flickr geo-referenced images and Foursquare geo-referenced check-ins can help describe travel recommendations and provide users with the most interesting and popular landmarks, the best travel routes, or both [12,13,14,15,16]. In addition, bearing in mind that social events such as parades, festivals and concerts tend to occur in certain places at certain times, Twitter and Flickr are often used to detect social events by observing the semantic attributes of posts or images, together with the temporal and spatial attributes [17,18,19,20,21]. In addition, as an alternative to the often-used data sources such as mobile phone records or GPS trajectories, Flickr geo-referenced images or Foursquare geo-referenced check-ins can also be used to investigate human mobility patterns [12,13,22,23,24,25,26]. Such kinds of volunteered geo-referenced data generated from social media can describe mobility patterns from a much broader perspective, without any space or time restrictions.
The potential of VGI data for research purposes can be extended still further. In our paper, we will examine the potential for LBSN data to reveal user mobility patterns under different contexts, and thereby contribute to a contextualized geographic relevance evaluation process.
3. Understanding Context
In this section, we will first define the notion of context within our research scope, and then introduce the working dataset, i.e., Foursquare check-in data. The last part of this section will explore the impacts of context on mobility patterns using statistical techniques.
3.1. Definition
The notion of context has in the past been considered from a number of different perspectives, including that of linguistics, e-commerce, advertising and mobile computing. The use of context has therefore been drawn from various definitions, each of which is to a great extent dependent on a specific application domain. For example, context in linguistics suggests a frame that surrounds a focal event [27], such as the cultural setting, the situation of speech and shared background assumptions, while for mobile computing systems, researchers commonly conclude that location, time, user characteristics, physical conditions (light, noise level, weather and surroundings, etc.) constitute typical context elements [28,29]. As noted by Garcia, Duranti, and Goodwin [27], “the term means quite different things within alternative research paradigms, and indeed even within particular traditions seems to be defined more by situated practice, by use of the concept to work with particular analytic problems.”
The relevance of a piece of geographic information to a mobile user cannot be properly understood unless one considers the associated contextual frame within which the decision making is embedded. A number of factors are involved in this frame, such as the user’s location, mood or task, and whether he or she is accompanied or not. In this paper, we will focus on two of the most crucial contextual factors:
- (1)
- Temporal. Users tend to have typical mobility patterns over different time periods. Temporal context can be considered on different scales, such as by the season, the days of the week, hours in a day etc. In this paper, we use the last scale, that is, the hours in a day.
- (2)
- Spatial. Researchers have confirmed that urban regions typically comprise different functional configurations, such as residential, educational and business, which typically influence the user’s behavior [30]. In this paper, we will observe such influences within administrative postal regions.
It should be noted here that although these two factors represent interesting and crucial aspects of mobile usage, they do not comprise all the aspects. One could always include more factors; however, it is not wise to include everything. The two factors included in this paper serve to demonstrate our approach, and this approach could easily be extended to integrate further contextual factors.
3.2. Foursquare: Exemplar of Location-Bassed Social Networks
Before moving to specifics, the Foursquare dataset referred to throughout this paper is briefly introduced here.
Nowadays, mobile users tend to share their experiences and interests on the web a lot through rich media data applications such as Foursquare. With more than 50 million users and over 6 billion check-ins by August 2014, Foursquare is one of the most popular LBSNs. One of the most important features that distinguishes Foursquare from other location-sharing services is that it is based on semantically named and categorized venues, instead of the automatic and continuous update of geographical locations [31]. Foursquare also provides a hierarchy [32] for venue categorization, which includes 10 first-level categories and more than 400 second-level categories.
Each time a user checks in at a venue, a check-in object will be created in the database, which covers the profile of the user (including ID, name, gender, photo, friends and home city), the profile of the venue (the id, name, category, location and updated statistics), as well as the profile of the check-in event (timestamps, location, attached text messages and opinions on the venue). Based on the application programming interface (API) used by Foursquare, it is relatively easy to extract venue profiles. Except for the id and gender, the profile of a user is, unfortunately, not visible to non-friends, to protect user privacy. The access policy regarding the profiles of check-in events is a bit more complicated. If check-ins are sent to public feeds such as Twitter, they are accessible with a Foursquare signature; otherwise, they are also only visible to friends.
Based on this privacy protection policy, in this paper a public and anonymous subset of Foursquare check-ins from New York City is mined over 150 days from 1 February to 30 June 2014. The dataset involves 42,045 users who created 566,420 check-ins within the specified spatial and temporal ranges. Statistics show that only 1.1% of all the users have on average at least one check-in per day (i.e., 150 check-ins over 150 days; see Figure 1a), and this 1.1% of users creates 21.6% of the total check-in records (see Figure 1b). In addition, according to our data, about 10% of the total increases in the Foursquare database in shown in our dataset, which suggests that approximately 10% of the total Foursquare check-ins are published via Twitter feeds and therefore open to public scrutiny.
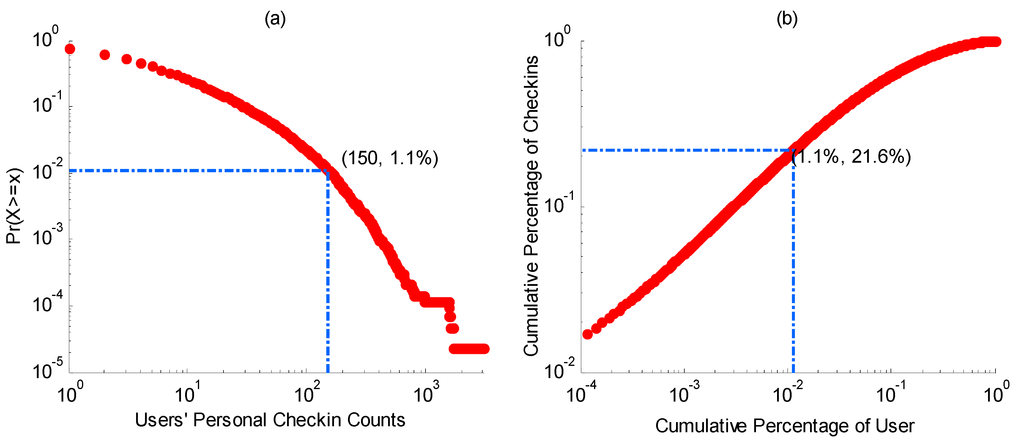
Figure 1.
Cumulative distribution function (CDF) of user’s personal check-in counts (a) and users’ cumulative contributions to the check-in dataset (b).
Figure 1.
Cumulative distribution function (CDF) of user’s personal check-in counts (a) and users’ cumulative contributions to the check-in dataset (b).

3.3. Revealing Contextual Influences on Mobile Users
The value of such volunteered information from our perspective lies in the hypothesis that the data can contain some latent usage contexts that are otherwise difficult or expensive to obtain. A check-in event made by a user will inevitably reveal some contextual information about that specific check-in, and a series of check-ins can help describe a contextualized mobility pattern and/or the personalized interests of a user. For example, each single check-in object is a real-time record of the event creator’s position. Therefore, it contains explicit information about the user’s situation [28] and context during the check-in event. It may also help imply what the user was doing (e.g., dining), for example, if the check-in happens at dinner time in a restaurant. The user might also post several words within this record, which might suggest their mood, who they are accompanied by, and their opinion of the location, in this case the restaurant. Further, after analyzing the check-ins made by the same user over several months, one might be able to establish what kinds of food the user prefers, and whether or not they go to the gym every Friday evening. In general, using data mining techniques, we can gather an abundance of implicit contextual information relatively easily.
To establish the impacts of temporal factors, the distribution of user check-in categories over a 24-h period is depicted in Figure 2. Each circle connects the hourly average number of check-ins for each category, and the resulting differences in the circles’ shapes reveal people’s changing interests towards different types of geographic information within particular hourly slots. For example, “Food” has two distinct peaks, at 1 pm (shorter) and 7 pm (longer), which is consistent with humans’ normal dining behavior. Categories like “College and University”, “Professional and Other places” and “Shop and Service” have noticeably convex profiles during the day, while “Nightlife Spot” and “Residence” peak at night. These observations coincide with our general understanding of the daily behavior of city dwellers, and demonstrate that temporal factors have a significant influence on mobile users’ preferences for different types of geographic information. Thus, there is a need to contextualize the process used to evaluate geographic relevance among mobile users.
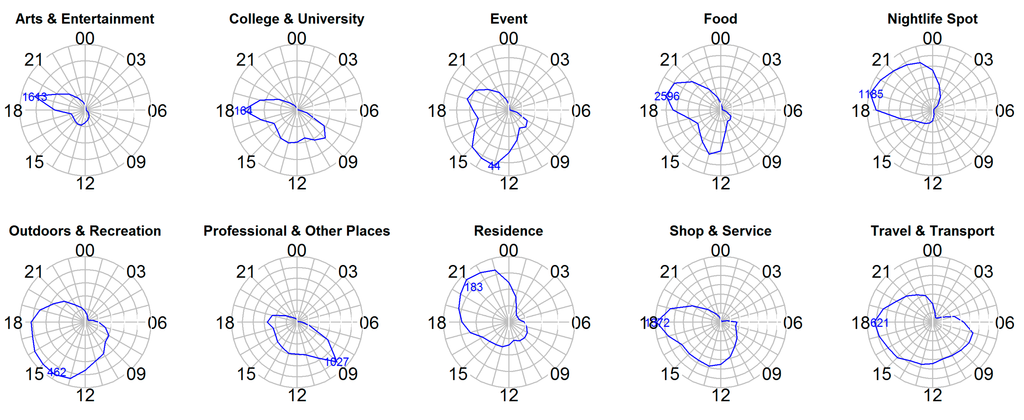
Figure 2.
Users’ check-in behaviors per hour and over a 24-h period for each category.
Figure 2.
Users’ check-in behaviors per hour and over a 24-h period for each category.
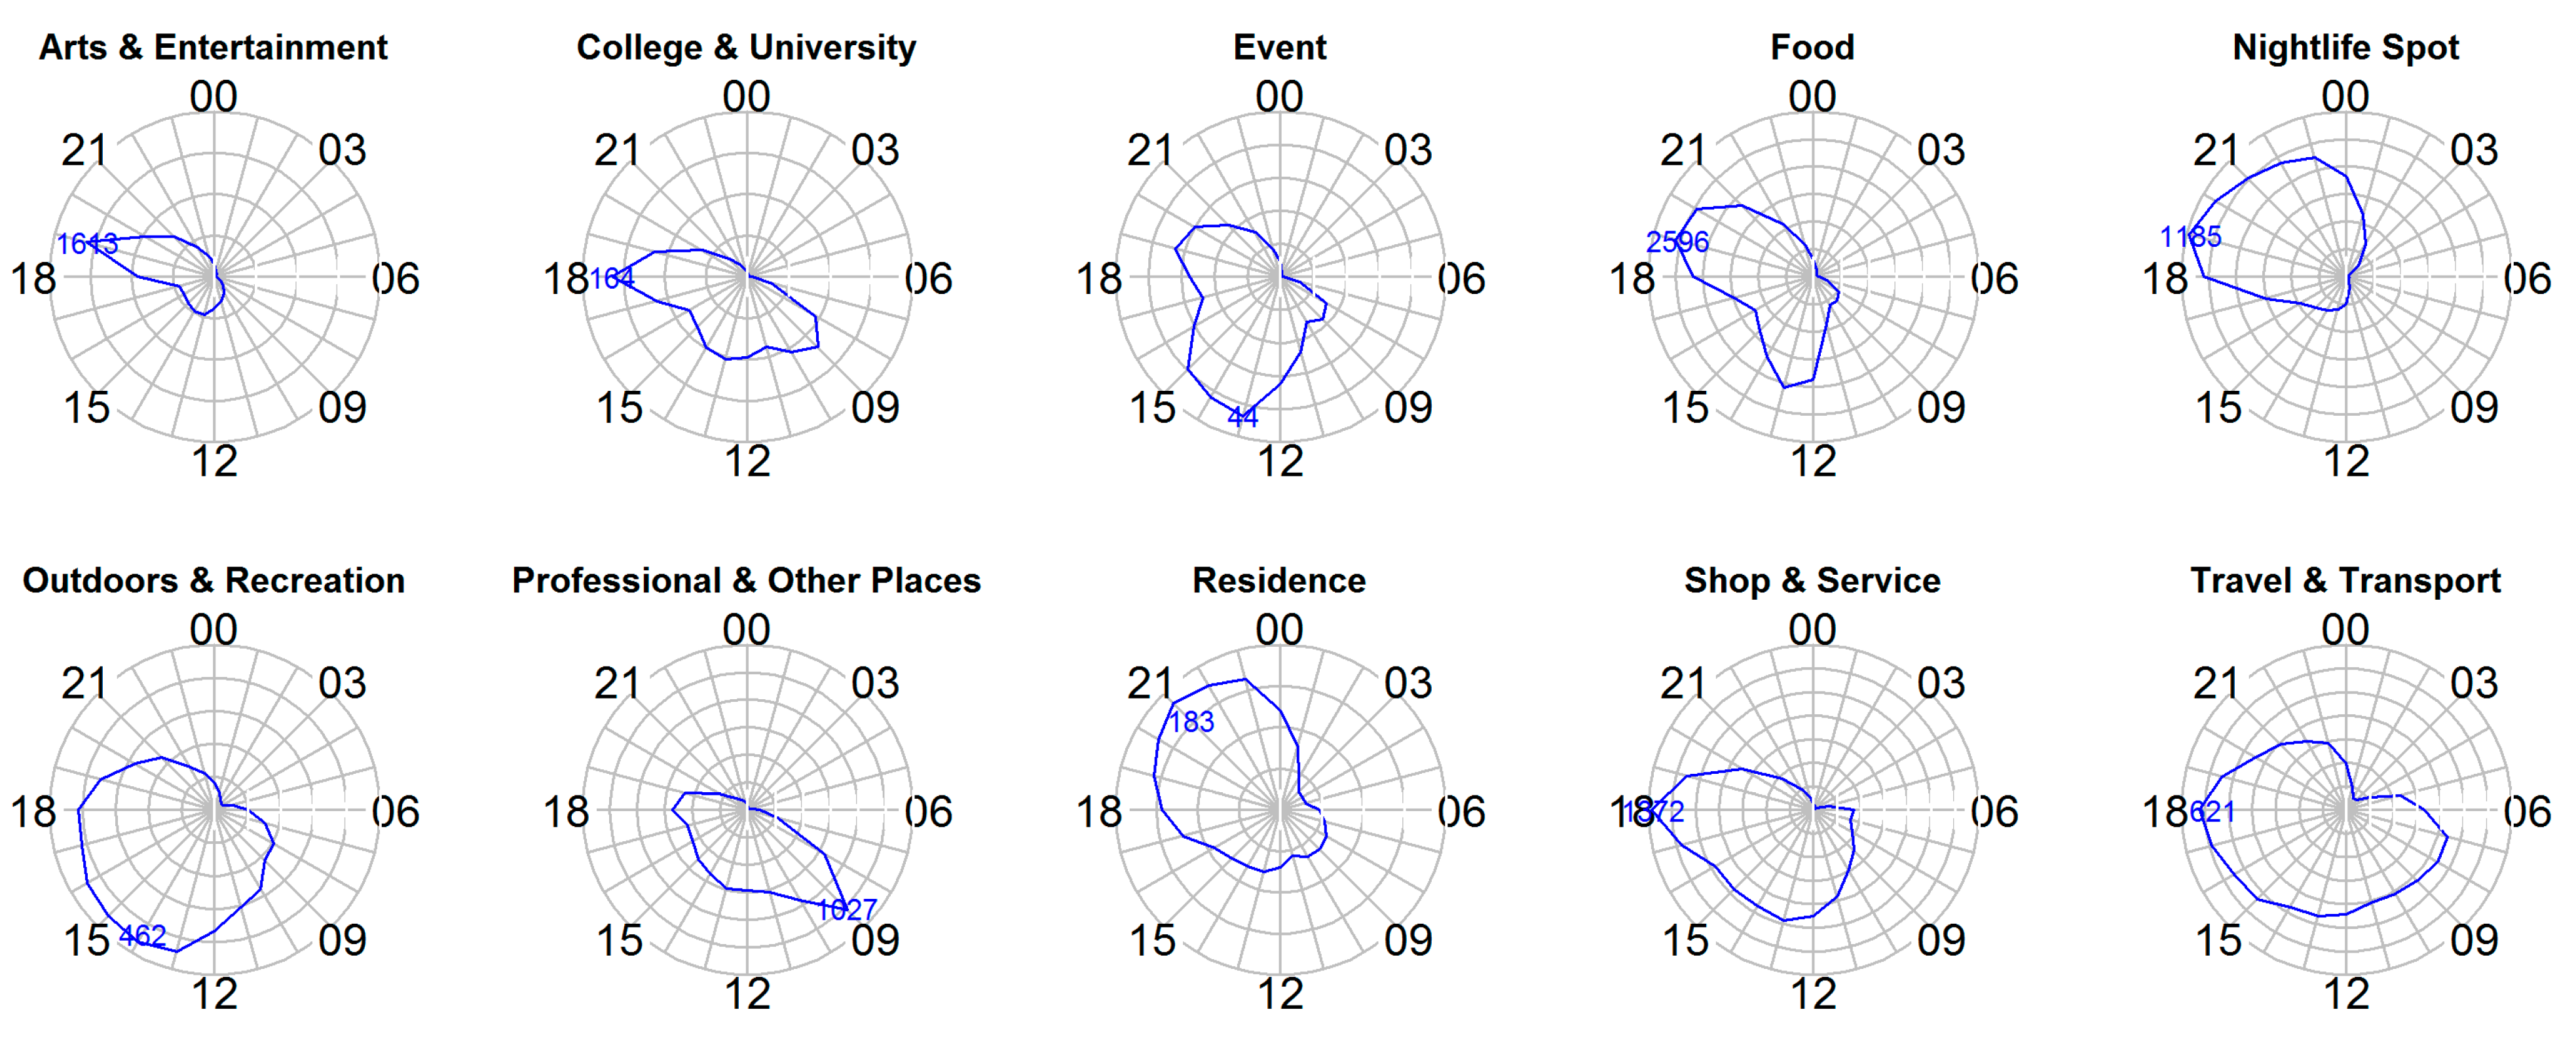
To reveal mobile users’ space-based categorical preferences, Figure 3 shows the dominant category within each administrative postal region of New York City based on the users’ check-ins.
Figure 3.
Dynamics of functional configurations within New York City.
Figure 3.
Dynamics of functional configurations within New York City.

Despite the dominance of the category ‘Food’ across the entire check-in dataset, the map shows users do not express the same interests across spatial contexts, since different urban areas typically possess different function configurations. For instance, the regions around the small island (i.e., Broad Channel in Jamaica Bay) are typically dominated by “Travel and Transport” and “Outdoor and Recreation”, while the downtown regions (i.e., Manhattan) exhibit a much more complex functional configuration covering almost all possible categories. However, one can still distinguish the main eating, shopping and education areas within this comprehensive downtown region.
Beyond all doubt, the spatial context does not just impact upon the users’ preferences for one single category which is believed to be the most dominant. As well as this dominant category, each postal region also possesses some other complementary functions to a varying extent. Therefore, the spatial context can be better represented by using the probability distribution of all constitutive categories in a given spatial region.
4. Contextualized Geographic Relevance Evaluation
Up to this point, only the 10 first-level categories are used, in order to improve graphic demonstration. As stated earlier, Foursquare uses a category hierarchy to organize its venues, and the same analysis can be performed with higher-level categories in order to create a fine-grained user dynamics profile under different contexts. In this section, the second-level category, which includes 383 sub-categories in the study’s New York City dataset, will be deployed.
In Section 4.1 and Section 4.2, we propose an approach to be used to contextualize the evaluation of geographic relevance, with Section 4.1 explaining the contextualization process. While this process is explained based on two types of context, namely the temporal and spatial, the contextualization process could be easily extended to integrate more context types. Section 4.2 differentiates global patterns from individual patterns, and explains the approach used to integrate both patterns for different use cases. Section 4.3 verifies the proposed approach based on the same Foursquare check-in dataset as when using the 383 sub-categories.
4.1. Contextualization
The research problem for this study can be formulated so as to determine the level of relevance of a certain type of geographic information to the targeted user, and given both the temporal context (hour of the day) and the spatial context (postal code).
Under the hypothesis that the temporal context is independent of the spatial one (event T = i, is independent of event S = j), the probability of a certain category (C = k) being relevant to the user under the temporal context T = i and spatial context S = j should be:
The conditional joint probability distribution is unknown to us, but its expectation can be written as follows, considering the contingency table distribution:
Therefore,
where and can be considered the relevance scores based on temporal and spatial factors respectively, and the denominator can be regarded as a priori relevance score.
Equation (3) can also be written as:
The equations can hence be more intuitively interpreted as: “The probability expectation of users checking in at category is a mutual effect of a priori global probability, given the contextual impacts of time and space”.
Given the scope of this paper, only spatial and temporal contexts are taken into consideration. However, Equation (3) could easily be extended to N independent contexts as follows:
where is a set of contextual factors, and represents the relevance of a certain category (C = k) having been contextualized by a contextual factor .
4.2. Global and Individual Patterns
An analysis of the check-in dataset given in Figure 1 shows that only 1.1% of all users create on average more than one check-in per day, while the check-ins from these 1.1% users constitute 21.6% of the entire dataset. This suggests that we have a very small number of users with a rich individual history; most have little individual data available. Although a person’s individual history is undoubtedly valuable when wishing to profile individual patterns, the global knowledge collected from a large group of users will be especially useful when such users have a limited history or even no history. Therefore, our approach will leverage both the individual patterns created by specific users, and the global patterns created by all the users in a group. All the relevance scores can then be computed in pairs.
Thus, the temporally contextualized relevance score required in Equation (3) for a targeted user u, can be computed for both the global and individual versions as follows:
where Φ(condition) and Φu(condition) are the total number of check-ins, under the condition specified in the brackets, made by all the users and one single user u respectively.
Similarly, for the spatially contextualized relevance score in Equation (3), we have:
And for a priori relevance score in Equation (3):
As a consequence, Equation (3) together with Equation (6) to Equation (8) give the overall contextualized relevance score for the geographic information belonging to the category (C = k).
4.3. Experimental Results
Based on the assessed relevance, a list of the highest relevance scores can be generated to predict the relevance of a specific type of geographic information under the given temporal and spatial contexts. The list can then be compared against a user’s actual visits to verify the performance of our approach.
The experiment is set up by splitting the entire 5 months’ dataset into a learning dataset (first four months containing 471,061 records) and a reference dataset (the last month, containing 95,359 records). The global and individual patterns will be studied from the learning dataset, and the studied patterns will be applied to make predictions for the 95,359 records. The predictions are then compared against the actual visits made in the reference dataset. For comparison, each record will generate four groups of predictions:
- Group 1: Learn global patterns from the learning dataset, and predict, without a context, the record to be predicted;
- Group 2: Learn individual patterns from the learning dataset, and predict without a context;
- Group 3: Learn global patterns from the learning dataset, and predict with a context;
- Group 4: Learn individual patterns from the learning dataset, and predict with a context.
The results are shown in Figure 4. The x-axis gives the length of the prediction list required to obtain the correct prediction.
Figure 4a shows that with the length of prediction being 1 (the very first attempt), Group 4 (bottom-right in Figure 4a) gives correct predictions for 30% out of all 95,359 learned individual pattern and contextual information. Meanwhile, for Group 3 (top-right in Figure 4a), the learned global patterns and contextual information are also quite accurate, with an approximate 20% level of correctness at the first attempt. In contrast, performance levels without taking into consideration contextual information are about 15% lower for both the global and individual cases. Figure 4b shows the same results for accumulative correctness. This shows that, for example, to achieve 50% correctness, the four groups would need to attempt 22, 11, 7 and only 4 times respectively. Hence, Figure 4 illustrates the importance of considering contextual information when evaluating relevance.
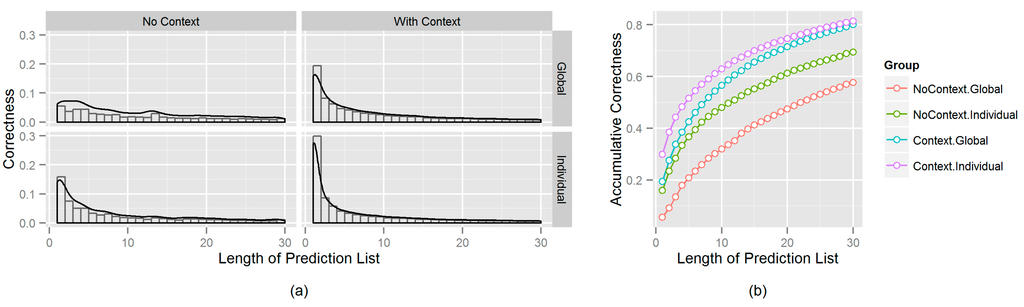
Figure 4.
Comparisons of prediction correctness between the groups in independent (a) and accumulative (b) scales.
Figure 4.
Comparisons of prediction correctness between the groups in independent (a) and accumulative (b) scales.
Furthermore, the figure also shows the power of collective wisdom as part of the global pattern. Numerous research studies on personalized prediction or recommendation systems [15,33,34] suggest that because users prioritize personal preferences over geographic information, un-personalized predictions (those containing no individual information) are much less reliable than personalized ones. In the case of check-in data and using our algorithm, this statement is seen to be true when no contextual information is used (Group 1), but not true when the contextual information is included (Group 3). In fact, Group 3 (global pattern with contexts) outperforms Group 2 (individual knowledge without any contexts) and catches up with Group 4 (individual knowledge and contexts) quickly (see Figure 4b). This finding will be of particular interest when considering future research, as check-in datasets as well as other social media datasets are often too sparse to guarantee that individual information will be available (especially with restrictions made on certain contexts). Note that even individual pattern calculations actually use global patterns when necessary (see Equations (6)–(8)). Figure 4 shows that contextualized global information could be extremely useful for the relevance evaluation process, and especially among inactive users.
Figure 5 further shows the relations between correctness (Group 4, with the length of prediction listed as 5), the prediction target (Category) and the two contexts (Time and Space).
Figure 5a shows that the proposed approach preserves both some uncommon categories and the general popularity of the categories (the linear relations between the number of times a category appears within the learning data and in the predictions). However, the algorithm yields better correctness among the more popular categories, since the larger points are mainly distributed in the upper right-hand corner.
Figure 5b,c show the relations between correctness, the number of appearances (i.e., the number of check-ins) within the learning data and the ‘unalikeability’ associated with a specific temporal or spatial context. Unalikeability is an analogical concept of variation. While variation measures how much the observations differ from the mean for the quantitative data, unalikeability measures how often the observations differ from one another for the qualitative data [35]. The coefficient of unalikeability is implemented following Kadar and Perry’s research which measured the variability of categorical data [35]. The indicator varies on a scale from 0 to 1. A coefficient of unalikeability of 0 means all observations are the same, while a higher coefficient indicates more unalike observations.
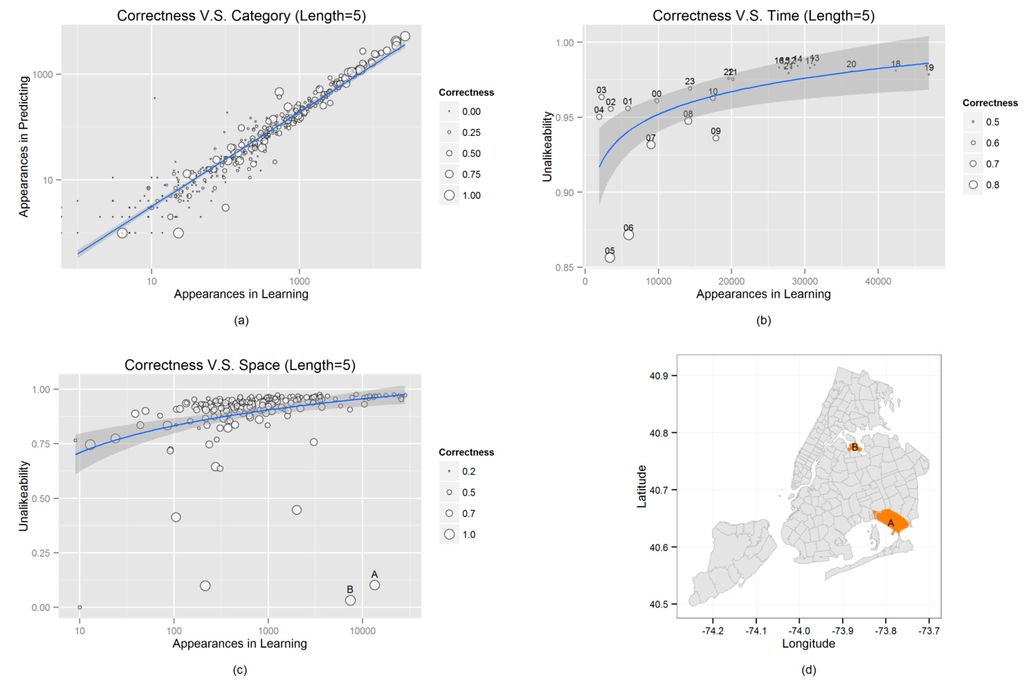
Figure 5.
Relations between correctness and check-in category (a), time (b) and space (c) respectively. Subplot (d) mapped the two outliers in subplot (c) in the real geographic space.
Figure 5.
Relations between correctness and check-in category (a), time (b) and space (c) respectively. Subplot (d) mapped the two outliers in subplot (c) in the real geographic space.
Although the intuitive perception would suggest that a larger number of learning data would yield a better level of correctness, Figure 5b,c show otherwise, with most of the larger points sitting on the left side of the x-axis. The reason for this is revealed after plotting the unalikeability of these bubbles against the y-axis. Both figures then represent a log-linear relation that suggests more check-ins have a higher coefficient of unalikeability, which means human activity under more active time or space conditions tends to be more heterogeneous. For example, in Figure 5b, correctness is low in the afternoon (1–5 pm) despite there being a large amount of learning data, because people reveal quite diverse behaviors (for example, working, shopping, dining and traveling) during that time. In contrast, correctness is much higher in the morning (5–6 am) with a much smaller amount of learning data, since the activities able to be carried out as such a time are rather limited e.g., only traveling.
In addition, from Figure 5c, this phenomenon also exists in a less significant form for spatial context, with larger points mostly located on the left of the main sequence, and with smaller points to the right. However, there are several noticeable outliers. The bottom right-hand corner of the graph has several points (marked with “A” and “B”) that show a rather large number of check-ins, but quite low unalikeability. As a consequence, these points are large and have high correctness levels. After plotting the two outliers back on to the map (see Figure 5d), the reason is revealed immediately. Region A contains John F. Kennedy International Airport, while Region B contains LaGuardia Airport, the two busiest airports in the United States [36]. Hence, human activities in these two regions tend to be highly active (high check-in numbers) but also homogenous (low unalikeability), and the level of correctness is therefore quite high for both regions.
5. Conclusions and Future Work
In the mobile environment, it is crucial to filter the vast amount of geographic information that exists by its geographic relevance to users before consumption activities take place, because mobile users are usually carrying out several tasks at once, and so have to understand the geographic information presented to them and make decisions based on this information within short periods of time. Any evaluation of the relevance of geographic information requires a comprehensive understanding to exist of the usage context, and for a comprehensive mechanism to be used to adapt to this context. The dynamic and heterogeneous nature of context brings great challenges in this regard.
The emerging LSBN tools are an example of volunteered geographic information, and provide a new option when wishing to resolve the information filter problem. It is believed that a location-based check-in event made by a user happens within certain contexts, those which can be identified within datasets to a certain degree. Furthermore, by observing a series of check-in histories, certain contextualized mobility patterns can be uncovered, so guiding the relevance evaluation process.
This paper demonstrates this hypothesis by considering two contextual factors, i.e., temporal and spatial factors. The analysis of a 150-day Foursquare check-in dataset for New York City reveals interesting mobility patterns, those impacted by two key factors, these being temporal and spatial factors. The paper then proposes an approach to evaluate the relevance of geographic information, using an algorithm to link a priori relevance score with the contextualized relevance score, and using the identified temporal and spatial factors’ impacts on mobility patterns. The contextualized result in the experiment performs better than the priori one, using either learned global patterns or individual patterns, and this result proves the benefits of considering contextual factors when evaluating the relevance of geographic information to mobile users. The proposed approach also proves the effectiveness of using the collective wisdom to be found within global patterns when evaluating relevance for new users, and when no individual knowledge is held.
Although the discussion in this paper is restricted to two contextual factors, the proposed approach could easily be extended to cover more such factors, as long as these factors can be considered independent of each other. However, any postulation of independence is not always satisfied, since there tend to be interactions between different contextual factors. For example, weather and mood are both contextual factors, and mood may be impacted by the weather. For contextual factors where interactions must be considered, the proposed approach could be further improved, and this will be an integral part of our future research efforts.
Acknowledgments
We would like to express our thankfulness to the anonymous reviewers. By providing their valuable comments on this paper they contributed towards the improvement of our work. Furthermore, we are grateful to the China Scholarship Council (CSC) for providing the funding for the doctoral studies in GIScience research group of University Heidelberg.
Author Contributions
Ming Li and Yeran Sun conceived the study. Ming Li designed the experiments and wrote the paper. Hongchao Fan served as the doctoral advisor for this work and revised the manuscript.
Conflicts of Interest
The authors declare no conflict of interest.
References
- Meng, L. The state of the art of map-based mobile services. In Map-based Mobile Services: Design, Interaction and Usability; Meng, L., Zipf, A., Winter, S., Eds.; Springer: Berlin, Germany, 2008; pp. 1–12. [Google Scholar]
- Mountain, D.M. Geographic information retrieval in a mobile environment: Evaluating the needs of mobile individuals. J. Inf. Sci. Eng. 2007, 33, 515–530. [Google Scholar] [CrossRef]
- Raper, J. Geographic relevance. J. Doc. 2007, 63, 836–852. [Google Scholar] [CrossRef]
- Reichenbacher, T. The concept of relevance in mobile maps. In Location Based Services and TeleCartography; Springer: Berlin, Germany, 2007; pp. 231–246. [Google Scholar]
- Adomavicius, G.; Tuzhilin, A. Context-aware recommender systems. In Recommender Systems Handbook; Springer: New York, NY, USA, 2011; pp. 217–253. [Google Scholar]
- Kaasinen, E. User needs for location-aware mobile services. Pers. Ubiquitous Comput. 2003, 7, 70–79. [Google Scholar] [CrossRef]
- Reichenbacher, T.; Crease, P.; De Sabbata, S. The concept of geographic relevance. In Proceedings of the 6th International Symposium on LBS & TeleCartography, Nottingham, UK, 2–4 September 2009.
- De Sabbata, S.; Reichenbacher, T. A probabilistic model of geographic relevance. In Proceedings of the 6th Workshop on Geographic Information Retrieval—GIR ’10, Zurich, Switzerland, 18–19 February 2010.
- De Sabbata, S.; Reichenbacher, T. Criteria of geographic relevance: An experimental study. Int. J. Geogr. Inf. Sci. 2012, 26, 1495–1520. [Google Scholar] [CrossRef]
- ItoWorld OpenStreetMap - Project Haiti on Vimeo. https://vimeo.com/9182869 (accessed Apr 27, 2015).
- Reimer, A.; Neis, P.; Rylov, M.; Schellhorn, S.; Sagl, G.; Resch, B.; Porto, J.; Zipf, A. Erfahrungsbericht: Crisis mapping zum Taifun Hayan. In Proceedings of Geoinformatik 2014, Hamburg, Germany, 26–28 March 2014.
- Girardin, F.; Fiore, F.; Ratti, C.; Blat, J. Leveraging explicitly disclosed location information to understand tourist dynamics: A case study. J. Locat. Based Serv. 2008, 2, 41–56. [Google Scholar] [CrossRef]
- Jankowski, P.; Andrienko, N. Discovering landmark preferences and movement patterns from photo postings. Trans. GIS 2010, 14, 833–852. [Google Scholar] [CrossRef]
- Ji, R.; Gao, Y.; Zhong, B.; Yao, H.; Tian, Q. Mining flickr landmarks by modeling reconstruction sparsity. ACM Trans. Multimed. Comput. Commun. Appl. 2011, 7. [Google Scholar] [CrossRef]
- Majid, A.; Chen, L.; Chen, G.; Mirzaa, H.T.; Hussain, I.; Woodward, J. A context-aware personalized travel recommendation system based on geotagged social media data mining. Int. J. Geogr. Inf. Sci. 2013, 27, 662–684. [Google Scholar] [CrossRef]
- Sun, Y.; Fan, H.; Bakillah, M.; Zipf, A. Road-based travel recommendation using geo-tagged images. Comput. Environ. Urban Syst. 2015, in press. [Google Scholar]
- Becker, H.; Naaman, M.; Gravano, L. Learning similarity metrics for event identification in social media. In Proceedings of the 3rd ACM International Conference on Web Search and Data Mining, New York, NY, USA, 3–6 February 2010; pp. 291–300.
- Chen, L.; Roy, A. Event detection from flickr data through wavelet-based spatial analysis. In Proceedings of the 18th ACM Conference on Information and Knowledge Management, Hongkong, China, 2–6 November 2009; pp. 523–532.
- Lee, R.; Sumiya, K. Measuring geographical regularities of crowd behaviors for Twitter-based geo-social event detection. In Proceedings of the 2nd ACM SIGSPATIAL International Workshop on Location Based Social Networks, San Jose, CA, USA, 3–5 November 2010; pp. 1–10.
- Liu, X.; Troncy, R.; Huet, B. Using social media to identify events. In Proceedings of the 3rd ACM SIGMM International Workshop on Social Media, Scottsdale, AZ, USA, 28 November–1 December 2011; pp. 3–8.
- Pan, C.; Mitra, P. Event detection with spatial latent Dirichlet allocation. In Proceedings of the 11th Annual International ACM/IEEE Joint Conference on Digital Libraries, Ottawa, ON, Canada, 13–17 June 2011.
- Cho, E.; Myers, S.A.; Leskovec, J. Friendship and mobility: User movement in location-based social networks. In Proceedings of the 17th Acm Sigkdd International Conference on Knowledge Discovery and Data Mining—Kdd ’11, San Diego, CA, USA, 21–24 August 2011; p. 1082.
- Scellato, S.; Noulas, A.; Mascolo, C. Exploiting place features in link prediction on location-based social networks. In Proceedings of the 17th ACM SIGKDD International Conference on Knowledge Discovery and Data Mining, San Diego, CA, USA, 21–24 August 2011; pp. 1046–1054.
- Noulas, A.; Scellato, S.; Lambiotte, R.; Pontil, M.; Mascolo, C. A tale of many cities: Universal patterns in human urban mobility. PLoS ONE 2012, 7, e37027. [Google Scholar] [CrossRef] [PubMed]
- Wei, L.; Zheng, Y.; Peng, W. Constructing popular routes from uncertain trajectories. In Proceedings of the 18th ACM SIGKDD International Conference on Knowledge Discovery and Data Mining, Beijing, China, 12–16 August 2012; pp. 195–203.
- Bao, J.; Zheng, Y.; Mokbel, M. Location-based and preference-aware recommendation using sparse geo-social networking data. In Proceedings of the 20th International Conference on Advances in Geographic Information Systems, Redondo Beach, CA, USA, 07–09 November 2012; pp. 199–208.
- Garcia, A.; Duranti, A.; Goodwin, C. Rethinking Context: Language as an Interactive Phenomenon; Cambridge University Press: Cambridge, UK, 1993; Volume 22. [Google Scholar]
- Reichenbacher, T. Mobile Cartography—Adaptive Visualization of Geographic Information on Mobie Devices. Ph.D. Thesis, Technischen Universität München, Munich, Germany, 2004. [Google Scholar]
- Henricksen, K.; Indulska, J.; Rakotonirainy, A. Modeling context information in pervasive computing systems. IEEE Pervasive Comput. 2002, 79–117. [Google Scholar]
- Batty, M. The size, scale, and shape of cities. Science 2008, 319, 769–771. [Google Scholar] [CrossRef] [PubMed]
- Cramer, H.; Rost, M.; Holmquist, L.E. Performing a check-in: Emerging practices, norms and “conflicts” in location-sharing using foursquare. In Proceedings of the 13th International Conference on Human Computer Interaction with Mobile Devices and Services, Stockholm, Sweden, 30 August–2 September 2011; pp. 57–66.
- Foursquare Category Hierarchy. https://developer.foursquare.com/categorytree (accessed on 1 May 2015).
- Liu, X.; Liu, Y.; Aberer, K.; Miao, C. Personalized point-of-interest recommendation by mining users’ preference transition. In Proceedings of the 22nd ACM International Conference on Conference on Information & Knowledge Management, San Francisco, CA, USA, 27 October–1 November 2013; pp. 733–738.
- Souffriau, W.; Vansteenwegen, P.; Vertommen, J.; Berghe, G.V.; van Oudheusden, D. A personalized tourist trip design algorithm for mobile tourist guides. Appl. Artif. Intell. 2008, 22, 964–985. [Google Scholar] [CrossRef]
- Kader, G.D.; Perry, M. Variability for categorical variables. J. Stat. Educ. 2007, 15. [Google Scholar]
- Wikipedia. List of the Busiest Airports in the United States. Available online: http://en.wikipedia.org/wiki/List_of_the_busiest_airports_in_the_United_States (accessed on 4 March 2015).
© 2015 by the authors; licensee MDPI, Basel, Switzerland. This article is an open access article distributed under the terms and conditions of the Creative Commons Attribution license (http://creativecommons.org/licenses/by/4.0/).