Article

Interactive Presentation of Geo-Spatial Climate Data in Multi-Display Environments

1
Computer Graphics, University of Rostock, Albert-Einstein-Str. 22, 18059 Rostock, Germany
2
Potsdam Institute for Climate Impact Research (PIK), Telegrafenberg, 14473 Potsdam, Germany
3
Fraunhofer IGD Rostock, Joachim-Jungius-Str. 11, 18059 Rostock, Germany
*
Author to whom correspondence should be addressed.
ISPRS Int. J. Geo-Inf. 2015, 4(2), 493-514; https://doi.org/10.3390/ijgi4020493
Submission received: 15 December 2014 / Revised: 9 February 2015 / Accepted: 10 March 2015 / Published: 7 April 2015
(This article belongs to the Special Issue Recent Developments in Cartography and Display Technologies)

Abstract

:
The visual analysis of complex geo-spatial data is a challenging task. Typically, different views are used to communicate different aspects. With changing topics of interest, however, novel views are required. This leads to dynamically changing presentations of multiple views. This paper introduces a novel approach to support such scenarios. It allows for a spontaneous incorporation of views from different sources and to automatically layout these views in a multi-display environment. Furthermore, we introduce an enhanced undo/redo mechanism for this setting, which records user interactions and, in this way, enables swift reconfigurations of displayed views. Hence, users can fluently switch the focus of visual analysis without extensive manual interactions. We demonstrate our approach by the particular use case of discussing geo-spatial climate data.

1. Motivation and Background

One challenge when analyzing spatio-temporal data is defined as “reach the user” [1]. In this regard, lightweight and easily usable software should be provided, and collaborative settings should be observed. Our paper contributes to the latter issue by supporting a group of users to discuss and interactively inspect geo-spatial data in a multi-display environment.
As described by Nacenta et al. [2], there are a number of different environment topologies. In this work, we are focusing on topologies of multiple large display devices, such as projector screens and large monitors, that are utilized to show textual and graphical content to an audience. We combine this topology with a bring-your-own-device (BYOD) scenario, in which multiple presenters use their individual laptops or tablets to steer which content should be displayed on these displays. These contents are typically shown to support a particular stance or fact brought up by a presenter and, thus, change over time, as a joint talk or discussion progresses. We term this ongoing succession of creating and updating view compositions of various contents a “presentation”. In particular, we are concentrating on presentations, which are created and adapted by multiple persons, incorporate contents from different sources and which utilize the topology of multiple displays to simultaneously show multiple views. The contents of such presentations can be prepared beforehand or can be spontaneously created; for example, to underline an answer given to an offhand question from the audience.
Previous approaches for presentations in multi-display environments primarily focus on presenter-oriented scenarios. That means that they assume that one or more presenters show a presentation and moderate the discussion afterwards (see, e.g., [3]). In this paper, we aim at discussion-oriented scenarios. Here, changing topics of interest determine the course of discussion and, therefore, influence which data should be currently displayed in which views. These scenarios require a certain level of assistance to adequately support the users. We introduce two novel concepts to address this challenge:
  • An approach for an assisted presentation of ad hoc provided contents on multiple displays; this computes and updates views and view arrangements.
  • An enhanced undo/redo mechanism for an assisted interaction that records and structures the discussions and, thereby, allows switching back and forth between different views with regard to changing topics of interest; this distinguishes three different aspects—users, displays and objects; in this way, it also supports selective take back and rebuilding.
We developed a general solution to assist presentation and interaction, which can be applied in different settings. However, we designed a particular system with regard to the use case of a panel discussion about the impact of climate change among scientists from several domains (e.g., ecology, physics, biology, geology, mathematics). They compare data and projections based on different models and parameterizations; they search for geographical locations with extreme values and inspect whether certain regions exceed given thresholds. These tasks are solved by exploring several images at once that could hardly be displayed on only one output device and, thus, require multi-display environments. Furthermore, by discussing the images, the scientists come up with new insights, which, in turn, raise new questions. Hence, further data and views will be necessary, but in the same way, it could also be required to go back to previously shown contents. This requires an appropriate undo/redo mechanism that supports a smooth back and forth.
The paper is organized as follows: Section 2 describes the background and briefly explains the use case. Section 3 introduces the concept of assisted presentation. We focus on the automatic layout of views and the ad hoc integration of new content (new maps and new data views). Section 4 introduces the enhanced undo/redo mechanism. We show how undo or selective take back, as well as redo or selective rebuild support smooth switches between presentations and how the visualization of the recorded interactions supports the selection of particular views of interest. Section 5 briefly describes the implementation of our concepts and discusses the use case. Section 6 concludes the paper and gives an outlook on further work.

2. Background and Related Work

In this section, we briefly describe related work (Section 2.1) and introduce the use case of a climate impact discussion (Section 2.2).

2.1. Background

Andrienko et al. provide a comprehensive overview about the specifics of visually analyzing spatial temporal data [1]. They describe challenges, fundamental approaches and open research issues. However, they do not address the particular aspect of presenting and discussing geo-spatial data.
There exist different solutions to support presentations. Typically, so-called slideware, like Microsoft PowerPoint, is utilized. However, slideware is “entirely presenter-oriented and not content-oriented, not audience-oriented” [4]. Hence, slideware has been the subject of studies investigating the influence on presentation style and learning behavior in classrooms [5]. It has been shown that academic instructors should apply different presentation techniques using traditional blackboards or whiteboards, as well [6].
With multiple and larger displays, presenters are also able to show contents side by side in order to compare different concepts or to provide context to currently moderated presentation parts. Therefore, information presentation by different views on large or multiple displays was investigated by several authors [3,712]. These systems can handle inputs of multiple users and provide assistance to automatically arrange views on displays. However, as their main focus lies on sharing views, underlying content structures are mostly not considered when it comes to creating layouts on multiple displays. Furthermore, there are approaches that allow splitting single views (e.g., web pages [13] or slides [14] ) into multiple parts and showing these parts on different displays.
There also exist first presentation systems that support the simultaneous display of multiple slides on large interactive screens and in multi-display environments [1416]. Depending on the used approach, contents are either organized with respect to a prepared temporal ordering, similar to classic slideware (see, e.g., [14,17]), or with respect to the subject matter, resulting in a content-oriented modeling (see, e.g., [18,19]).
Supporting and recording discussions requires both a temporal structuring of views and a content-oriented modeling.
Beside presentation, there exist different approaches, which address the inspection of views by multiple users. Recently, Mahyar and Tory introduced a tool that supports the communication in collaborative sense-making by revealing relationships between collaborators’ findings. In this way, awareness of each other’s activities can be maintained [20].
We address this issue with an enhanced undo/redo mechanism that records and structures all activities. Recording the history of interactions can support various tasks, like providing orientation in mining scenarios [21], coordinating discussions, creating reports and summarizing findings [22]. Hence, recovery and rebuild facilities are important features to enhance the usability and manageability of complex interactive systems [23]. Architectural and interface issues for recording and visualizing interaction histories have been investigated previously [24].
However, in discussion scenarios, undo/redo functionality should distinguish between different aspects: multiple persons interact with multiple views that are displayed on multiple displays. This requires an undo functionality that is able to revoke or restore changes for every user, display and view independently. That means it should observe personal, regional and object-based activities. Different approaches have been developed that consider either personal [25,26], regional [27,28] or object-based [23] undo/redo. Only a few approaches address the combination of personal, regional and/or object-based undo, but they are tailored to document editing. For large display environments, Seifried et al. [27] utilize a combination of personal and regional undo.
Over the last few years, there has been a substantial amount of work on geospatial information and its display in multi-display environments that resulted in many outstanding specialized systems and techniques [2933]. Their diversity underlines the importance of this subject and the need for scalable and practical solutions in this area. We address this need with our multi-presenter approach, which does not require specialized hardware. Instead, it combines existing displays with existing graphical and textual representations of geospatial information in an ad hoc fashion to support a dynamically-evolving presentation as a back and forth between multiple speakers.

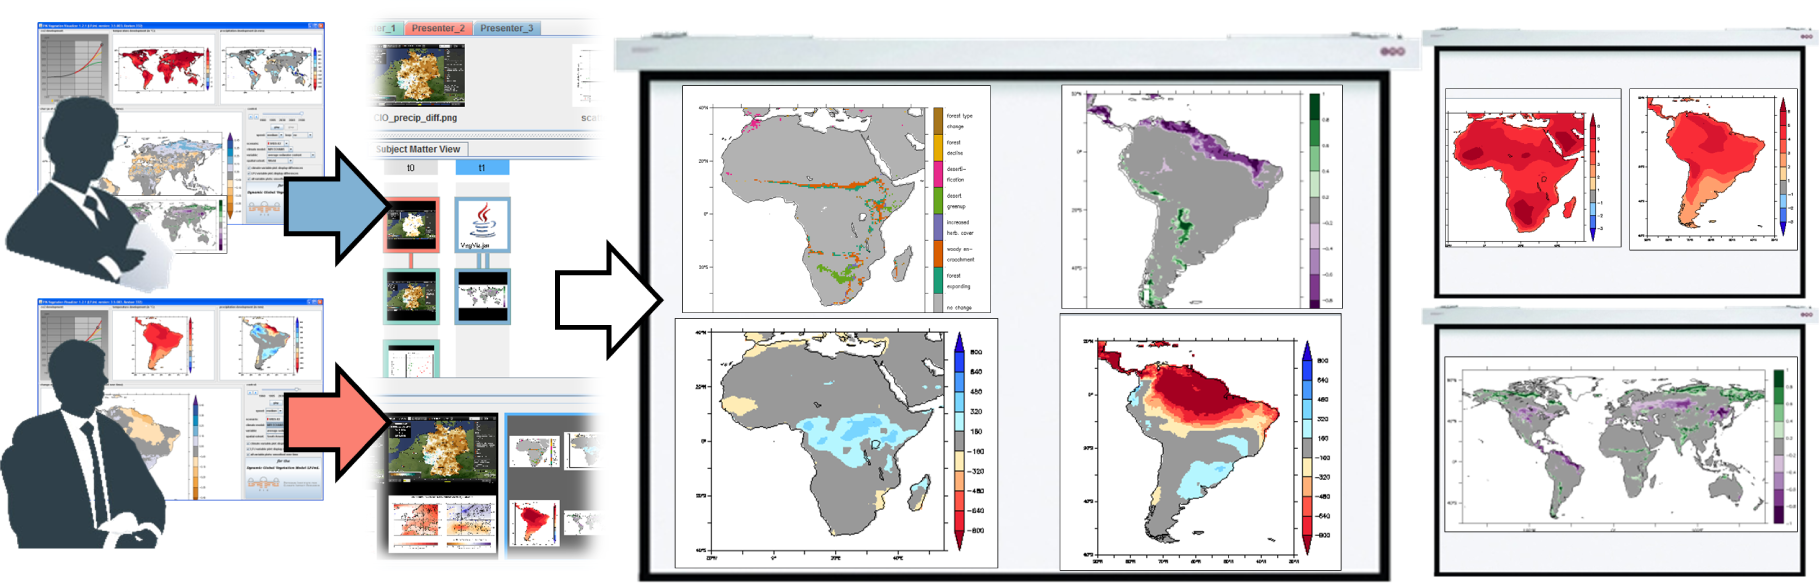
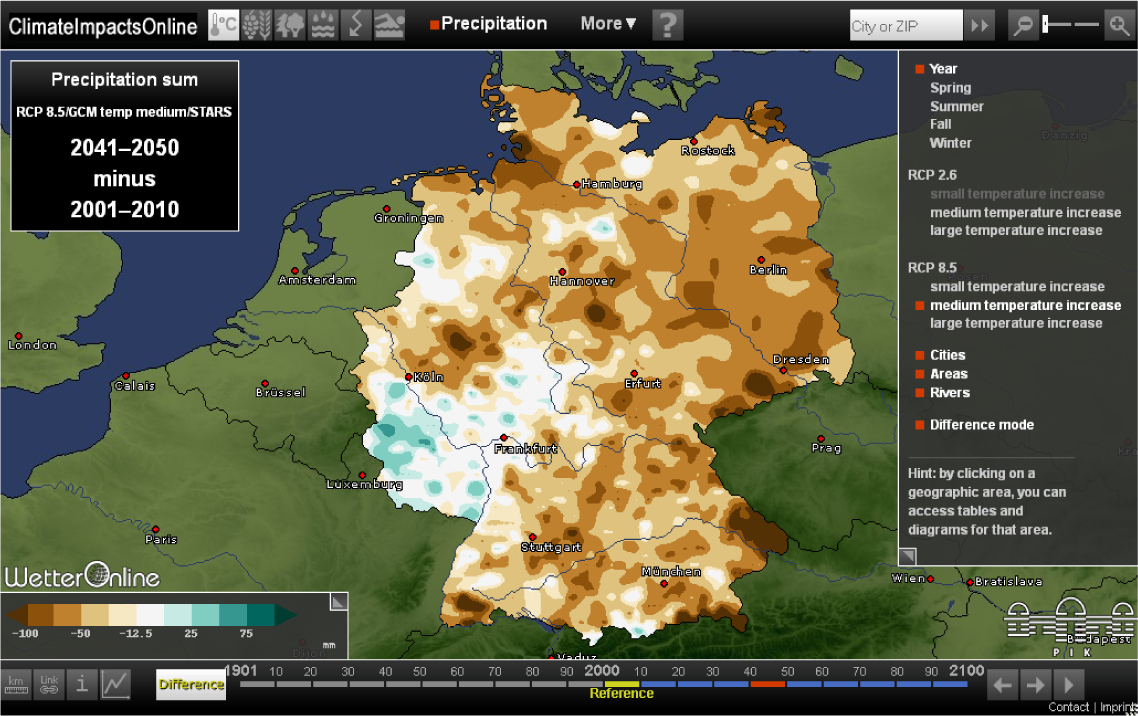
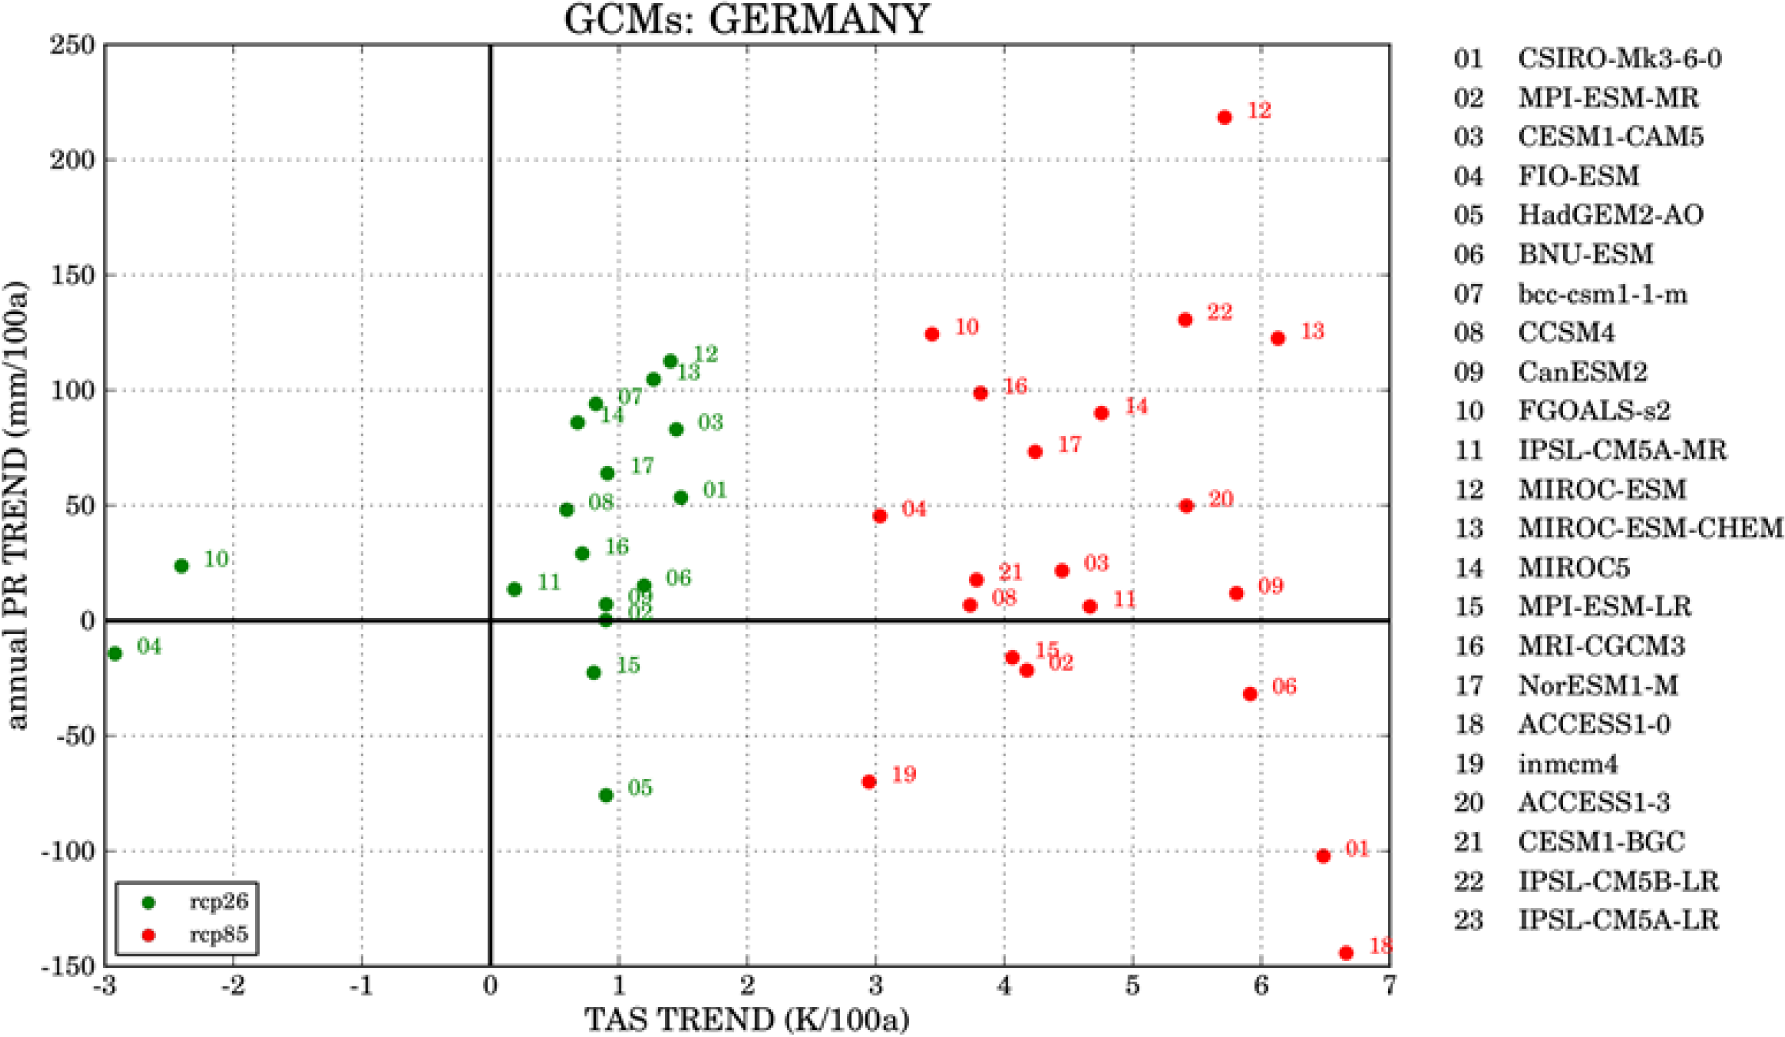
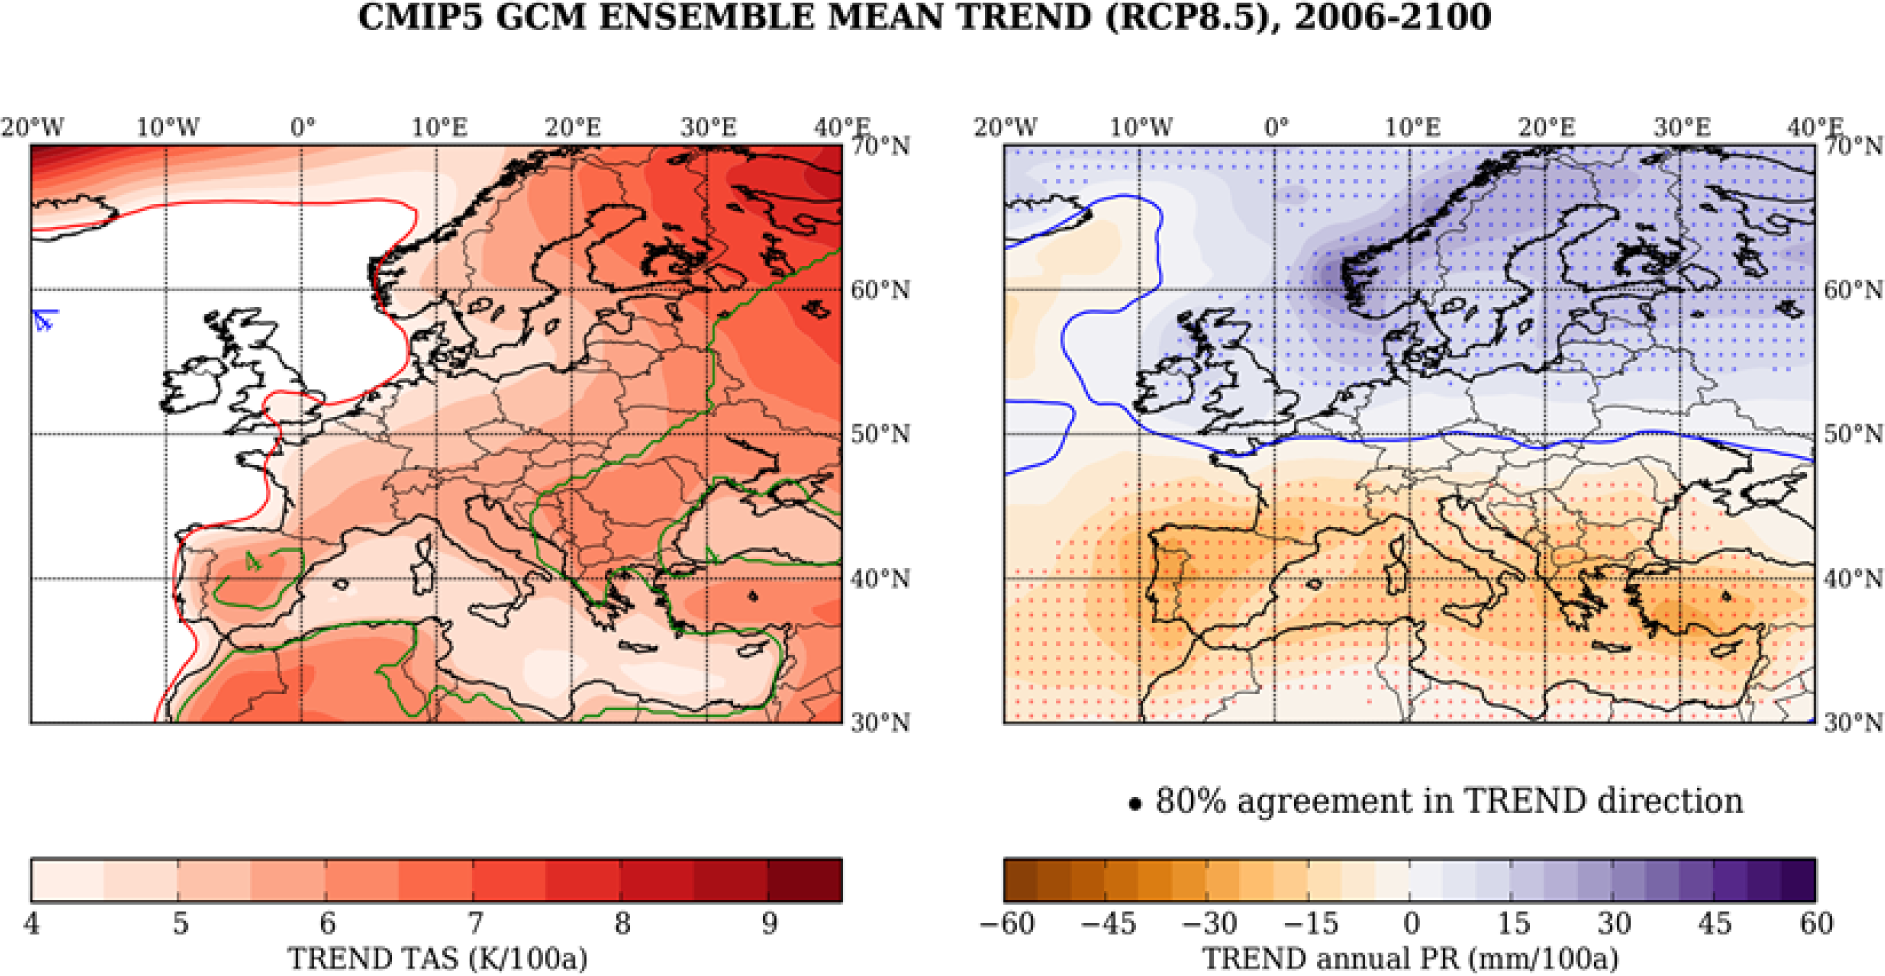
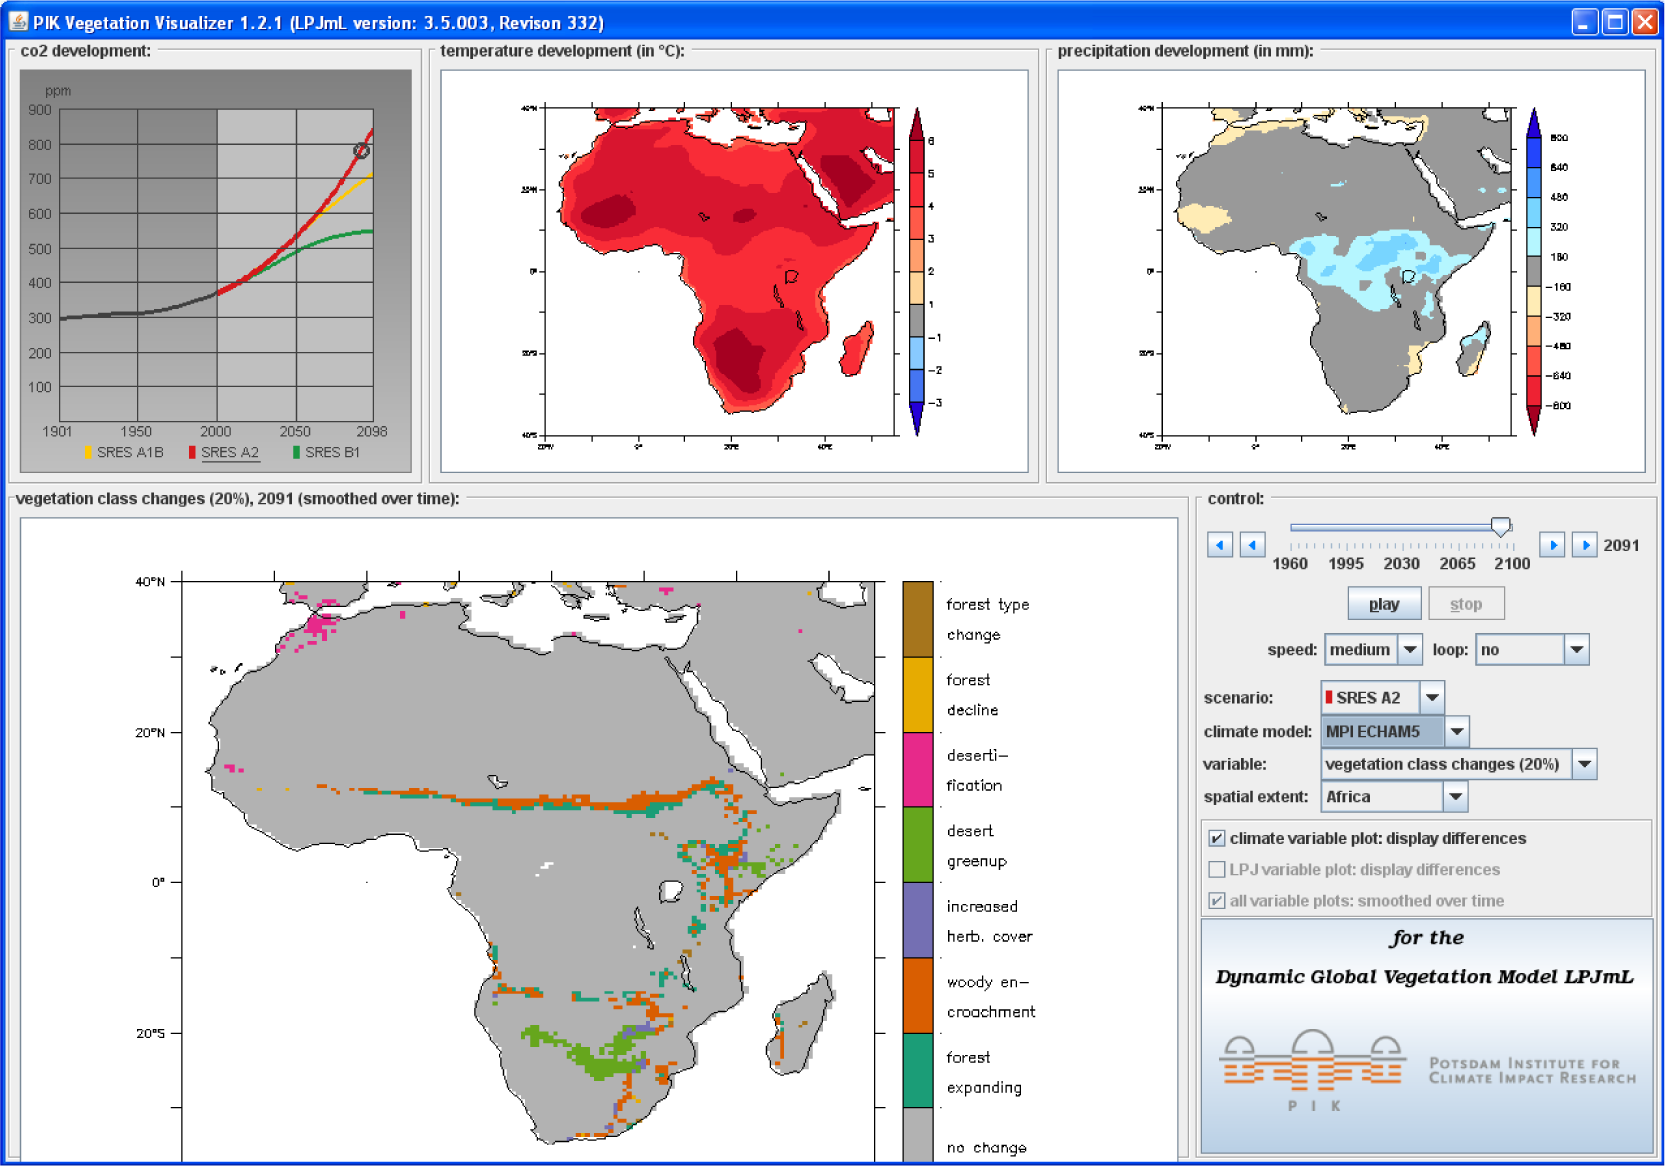
2.2. Application Scenario: Climate Impact Panel Discussion

When communicating issues of climate change, a variety of complex scientific aspects need to be broken down into comprehensible facts to ensure their understanding by non-expert listeners. Because of the multitude of sectors affected by climate change (e.g., agriculture, forestry, ecosystems, economy), several experts are required to communicate domain-dependent observations and results and to interrelate them with the results from other disciplines.
Hence, a panel discussion on the impact of climate change is typically chaired by several experts from different domains, and the knowledge of the audience typically ranges from uninformed listeners to hearers with a partial knowledge in this field (e.g., scientific journalists, policy makers or even climate skeptics).
In this scenario, visualization of geo-spatial data plays a key role to provide information, like individual effects of climate forcings, in an understandable way. For creating such views, interactive visual tools, like the OECD ClimateExplorer [34], the Vegetation Visualizer [35] or climate web portals [36], are used to represent geo-spatial data with respect to different spatial scales (e.g., global, continental or national scale) and with respect to multiple time scales. However, switching between tools, slides and documents contributed by different persons and shown on various output devices requires one to manually connect projectors and devices.
We aim to support this scenario with an assisted presentation that allows multiple experts to combine their knowledge by simultaneously showing multiple visualizations and integrating views on demand. An undo/redo mechanism can help to facility the switch between different views. Therefore, the described use case can strongly benefit from our approach of assisted presentation and interaction.

3. Assisted Presentation

We aim at discussion-oriented scenarios, particularly at panel discussions. Here, panelists provide different slides and views from visualization tools to introduce the topic to be discussed. Moreover, people from the audience might participate in the information exchange and can add further views, as well. We address this problem with an assisted presentation approach that consists of two steps; a manual content gathering (Section 3.1) and an automatic display configuration to avoid manual switches of devices (Section 3.2).

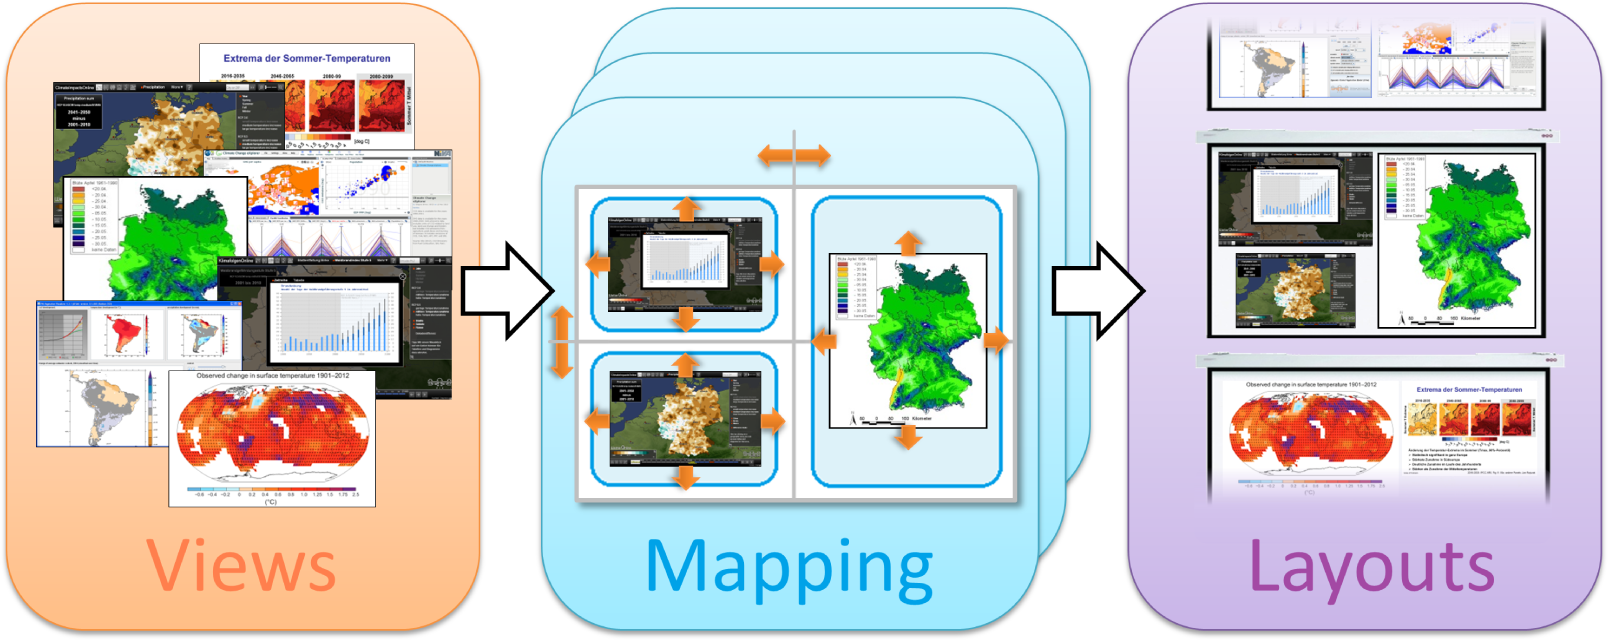
3.1. Gathering and Linking of Contents

Three problems need to be addressed to provide the manual content gathering: (i) providing and storing the contents; (ii) relating different content parts to each other; and (iii) selecting those content parts that should be simultaneously displayed and ordering them by time points. We address these issues as follows:
Providing the content: Different content parts are stored in a so-called content pool. An easy-to-use interface enables the access to the content pool. The interface can be shown on each personal device of the participants (laptop, tablet or others). Hence, each participant can easily assign his or her locally-saved files to the content pool by drag and drop. The files (e.g., a map, a data view, a web page or a PowerPoint file) are visually encoded by small thumbnails and organized with regard to the participants. Therefore, all parts and contributors of the content pool are visible and can be used on demand (see Figure 1, top).
Relating content parts: All content parts of a particular participant are automatically linked. However, there are further meaningful relations with regard to time, space and semantics. The participants can easily define these links by drawing connector lines between different content parts via the same user interface as above (see Figure 1, middle). These defined links will be used by the second step, the automatic display configuration.
Temporal links influence the presentation layout of successive time points. They describe the transitions between different views. More specifically, a link between two content parts C1 and C2 leads to a direct replacement of C1 by C2. That means that C2 is more or less displayed at the same position as C1. Therefore, temporal links contribute to layouts that are reasonably stable over time.
Spatial links influence the distribution of views on multiple displays at a certain time point. Content parts, which are connected by spatial links, are drawn in spatial proximity.
Semantic links connect content parts belonging to the same topic. For example, if a participant adds a table with data of interest to a particular map of a panelist, this data will be connected via such a link to the map.
Ordering of content parts: We introduce a layered structure, which defines a partitioning of content parts with regard to presentation time. Each layer contains those parts that should be shown simultaneously. Successive layers are linked. Switching from one layer to the next replaces the old contents with views from the new layer. Participants can assign their files to a particular layer by drag and drop. Furthermore, they can click a layer to select a particular presentation of views (see Figure 1 bottom). A noteworthy feature of the layer bar is its ability to include views that are generated on-the-fly. For doing so, a tool can be connected with a particular view of a layer by drawing a line. Clicking this view in the layer bar will automatically start the connected tool. In this way, a novel view can be generated, and the old content will be replaced by the new one. Currently, three different tools can be connected: (i) a lens tool that allows for enlarging regions of interest; (ii) a data visualization tool that generates visual representations of 3D data and underlying features; and (iii) a web browser that allows access to websites, particularly to relevant web-based presentation tools in the field of climate impact research (e.g., Vegetation Visualizer or OECD-Viewer; see Section 5).
The described functionality, provided by an easily usable interface, enables multiple panelists and participants to integrate content parts from different sources and to link views with regard to different aspects. These manually gathered contents and specified links control the next step, the automatic presentation on multiple displays.

3.2. Layout and Display

All views of the current layer need to be distributed and represented on the available displays. To this end, two steps needs to be carried out: an automatic mapping that decides which views are shown on which displays and an automatic layout that computes the spatial arrangement (position and size) of different views on the same display. These results of these automatic computations provide the necessary assistance for the presentation process. The participants do not need to take care about connecting beamers and devices, and they do not need to arrange layouts. They only provide content, and in this way, they specify what shall be presented. They also define constraints to control how the content will be presented, but the presentation itself is automatically organized.
Our approach is based on a previously-developed infrastructure (see Section 5) that considers physical properties, such as user position and the field of view, to automatically determine layouts in a smart meeting room [37]. We extend this approach in particular to support spatial analysis by observing Tobler’s first law of geography: “Everything is related to everything else, but near things are more related than distant things” [38]. Thus, the layout is constrained by the defined spatial, temporal and semantic links.
We determine a suitable layout under these constraints by optimization. The quality, which will be maximized, is defined as the weighted sum of the spatial proximity quality Qs, the temporal quality Qt and the display quality Qd. Users can adjust the weights α, β and γ to steer the influence of spatial, temporal and display quality on the layout generation. Otherwise, all weights are assumed to be equal.
M a x : Q = α Q s + β Q t + γ Q d
  • The spatial proximity quality Qs is based on the spatial links Ei of the current layer. The quality is high if positions pv1 and pv2 of all connected views v1, v2 are close to each other.
    Q s = ( v 1 , v 2 ) E i 1 + p v 1 p v 2 s d
    The term sd denotes the maximal distance of the displays of the environment.
  • The temporal quality Qt considers a subset Ep of temporal links Et. Ep consists of links that connect the views of the currently shown layer Vi to the views of the previously shown layer Vi−1.
    E p = E t ( V i × V i 1 ) Q t = ( v 1 , v 2 ) E p 1 p v 1 p v 2 s d
  • The display quality Qd quantifies the visibility of each view. For each display, we assume a visibility factor d(v) that rates how well users can see views on this screen. This factor is based on display size, display position in the room and viewing direction of the audience. For further information, we refer to [37]. We assume that with increasing view size sv, views are likely more visible. In case of restricted display space, views with higher relevance values f(v) should get more space.
    Q d = v V i d ( v ) ( f ( v ) ( s v s d ) 2 + 2 f ( v ) ( s v s d ) )
Using the formal definition, we can calculate mappings and layouts that, in combination, maximize Q. For doing so, we systematically create different mappings. Each mapping describes a possible distribution of views to displays. For each distribution, we create a layout. A layout is calculated by solving the quadratic optimization problem that maximizes Q on a display level. For this, we investigate different relative view arrangements on a display. Finally, we determine the best solution by evaluating Q for the combination of mappings and layouts.
In order to speed up the computations, we apply a branch and cut algorithm that utilizes heuristics that overestimates the achievable qualities of mappings and reuses previously calculated layouts for similar view combinations. Depending on the number of links between views and the number of views, within the same layer, computation times vary greatly. In general, our solution is able to create and evaluate layouts for about 15 views within 0.2 s to 0.8 s. Typically, this is shorter than the time that is used to discuss the views. While a layer of views is being displayed, the layout of the subsequent layer is already calculated. In this way, smooth updates are supported. This process is illustrated in Figure 2. Moreover, a video (see http://youtu.be/IDnEpcg9zZE) demonstrates the whole approach of assisted presentation.

4. Assisted Discussions

During the panel discussion, topics of interest change and new content will be provided by different participants, which leads to new views and view arrangements on different displays. To provide assistance for the course of discussion, we record these changes by an enhanced undo/redo mechanisms. “Enhanced” means that we not only ensure a back and forth of activities, but also support selective take back and rebuilding with regard to three different aspects: contents, participants and displays. Section 4.1 explains our undo/redo concept, whereas Section 4.2 describes the visualization of activities.

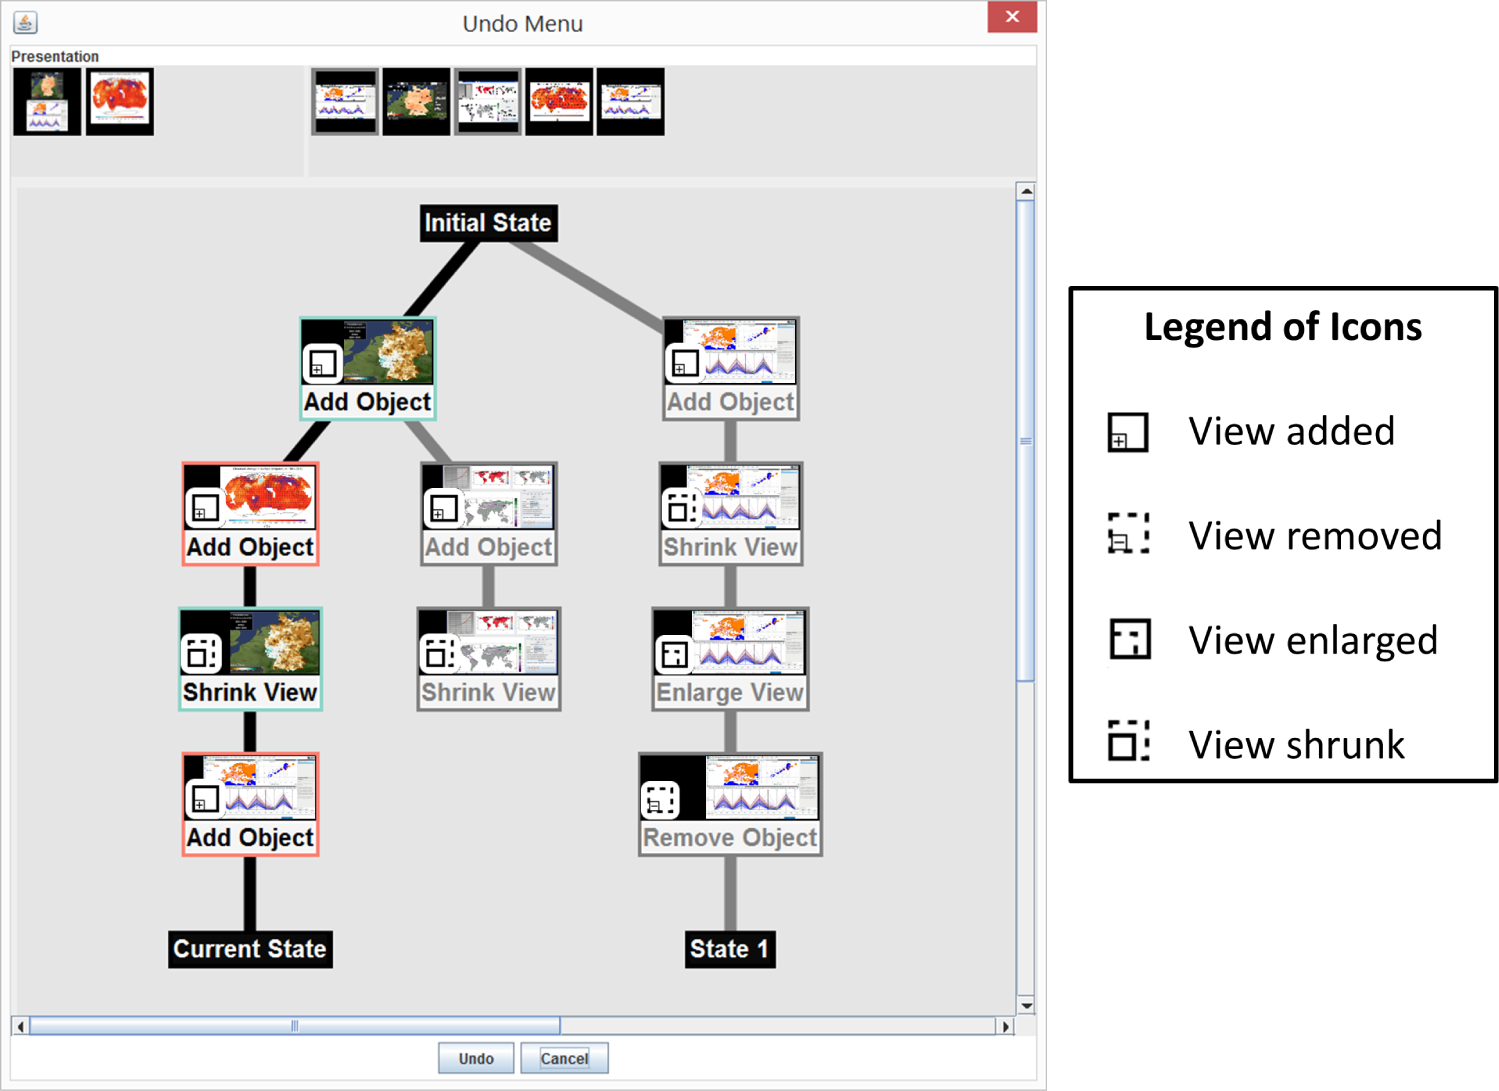
4.1. Global and Selective Undo/Redo

With the global undo/redo, a temporal navigation of activities is possible. Global undo supports going back to previous discussion topics by showing previous view arrangements. This might be necessary to answer a particular question. Global redo supports resuming a point of interest. Global undo/redo is linear and affects the whole setting.
In contrast, selective undo/redo does not influence the whole presentation. It is carried out only with regard to a certain aspect; e.g., a certain person, view or display. For example, this allows showing an old view in the context of new contents. Selective take back regarding views is specifically important, since we support on-the-fly generation of new content. Such a generation process can require multiple attempts to find adequate parameterizations.
Based on Sun’s AnyUndo [39], we utilize a non-linear selective undo/redo model. Each change is linked to the executing participant, the respective display and the affected view(s). This allows individual histories for each person, region (display) and view to be created. We automatically decide which kind of history should be used by observing how users specify an undo action. If the undo action is directly executed on a display, we use the regional history. An undo action on the user interface of a personal device refers to the personal history. If views are selected, we will apply view histories. For more sophisticated undo actions, different kinds of histories can be combined. For example, if a participant selects a view and calls an undo action on his device, only adaptations performed by this person to the selected view will be considered.
Dealing with selective undo/redo requires maintaining the consistency of application states [25]. In general, a selective undo action could lead to an incorrect state. However, if undo or redo actions are carried out, we apply the undo/redo handling of Sun [39] to consistently revoke or restore changes. In addition, we make sure that the resulting state is also displayable by applying our automatic layout algorithm that is able to create layouts for any set of views. This ensures that our undo/redo mechanism always leads to consistent presentation states.
To sum up, with the selective undo, participants can quickly revoke smaller changes without thinking about the required interaction to recall a previous change.

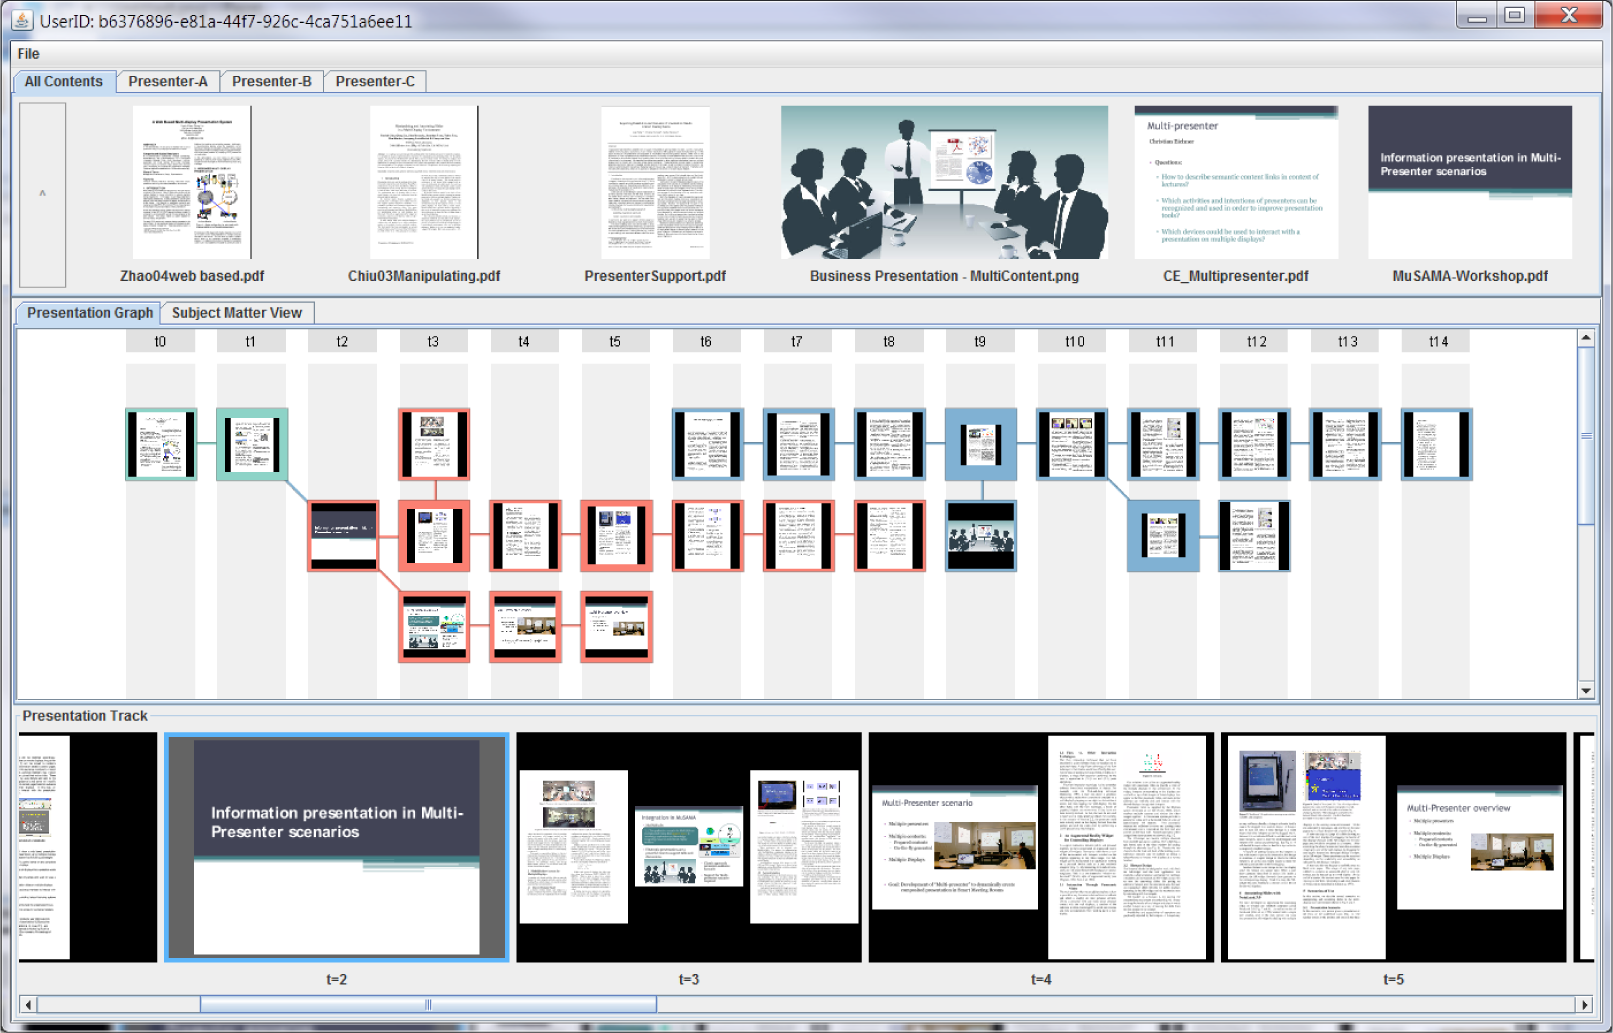
4.2. Visualization of Activities

To communicate the history of activities and to allow for selecting individual actions, we provide a visualization of the history. Starting with the initial state, changes regarding the presentation status are visualized. Two specific states, the “initial state” and the “current state”, are emphasized. Activities have been applied are on a path between these designated states. Each activity is depicted by an icon communicating the change of the affected view. The person of an interaction is communicated by color coding the border of the icon. In addition, a label describes the change. Along a path from the initial state to the current state, changes are sorted by time. Since we allow a selective undo, the history is not a single path, but a tree. Branching paths mark previously applied, but revoked adaptations. By executing undo actions, changes are removed from the current path and are shifted to a branch. Executing redo actions reintegrates these actions from the branch into the path of the current state.
Moreover, participants can directly jump to different representation states by double clicking onto an action. In this case, all actions on the path between the initial state and the selected action are applied to layout the views. In this way, participants can quickly switch between several presentations that support different topics.
In the course of a discussion, the history can become large. Therefore, filters can be applied to show selective histories; e.g., which only consist of changes from a certain user or which only affect a certain view.
The history visualization can be shown on personal devices, but also on the displays of the room. It provides a good overview of the discussion threads, the used views and the participating actors. Figure 3 shows an example of a smaller history tree.
The recording and visualization of activities supports the participants with the recap of the different topics of their discussion, but also in selecting previous activities in a targeted manner. Hence, we speak about assisted discussion.

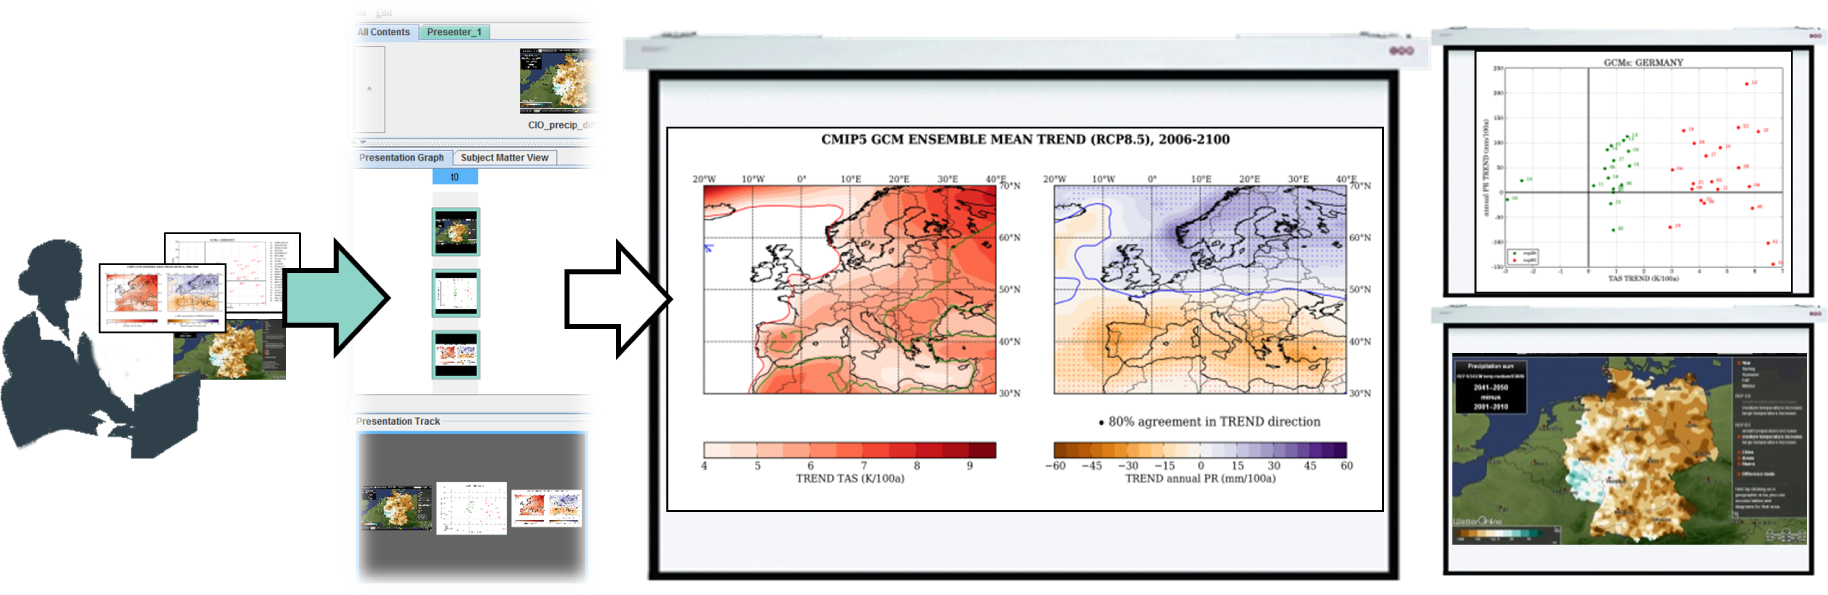
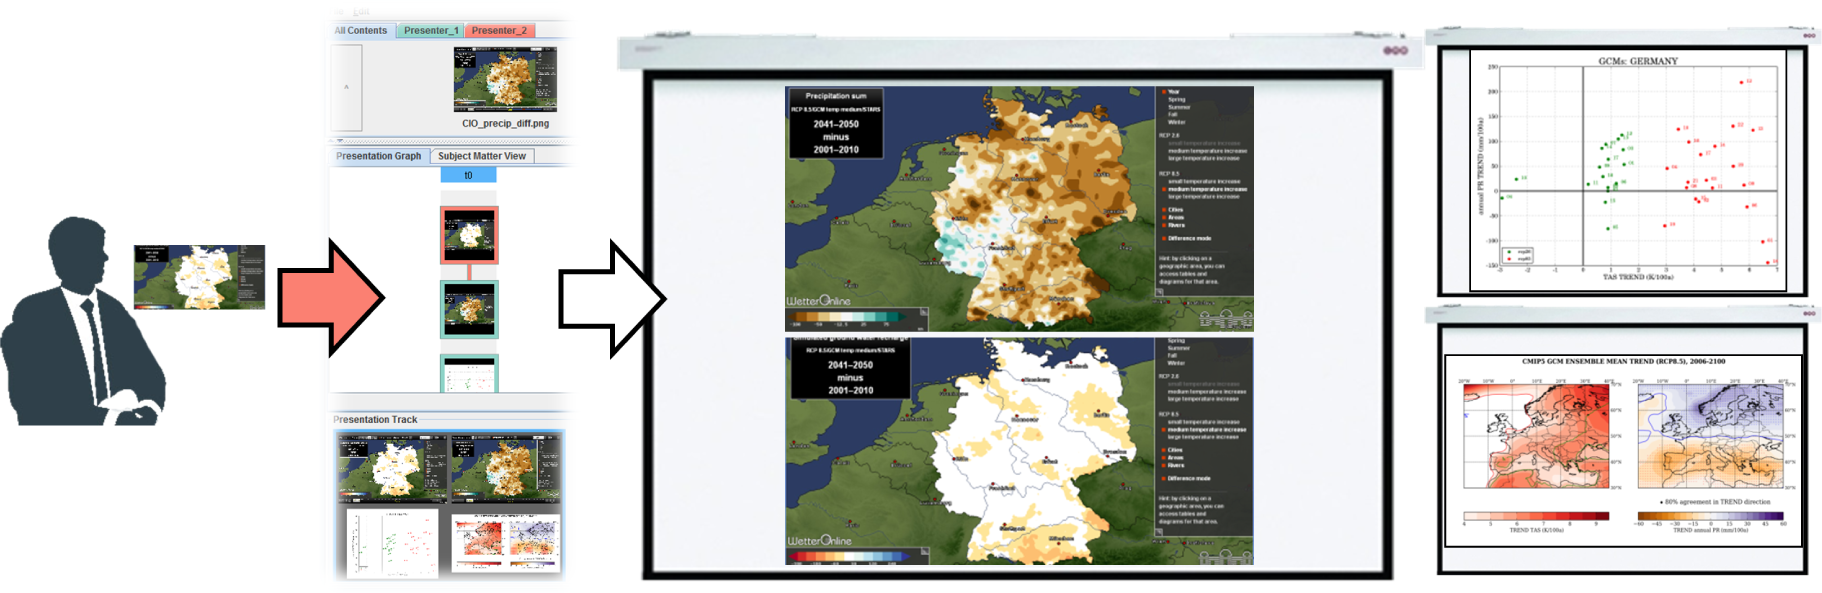
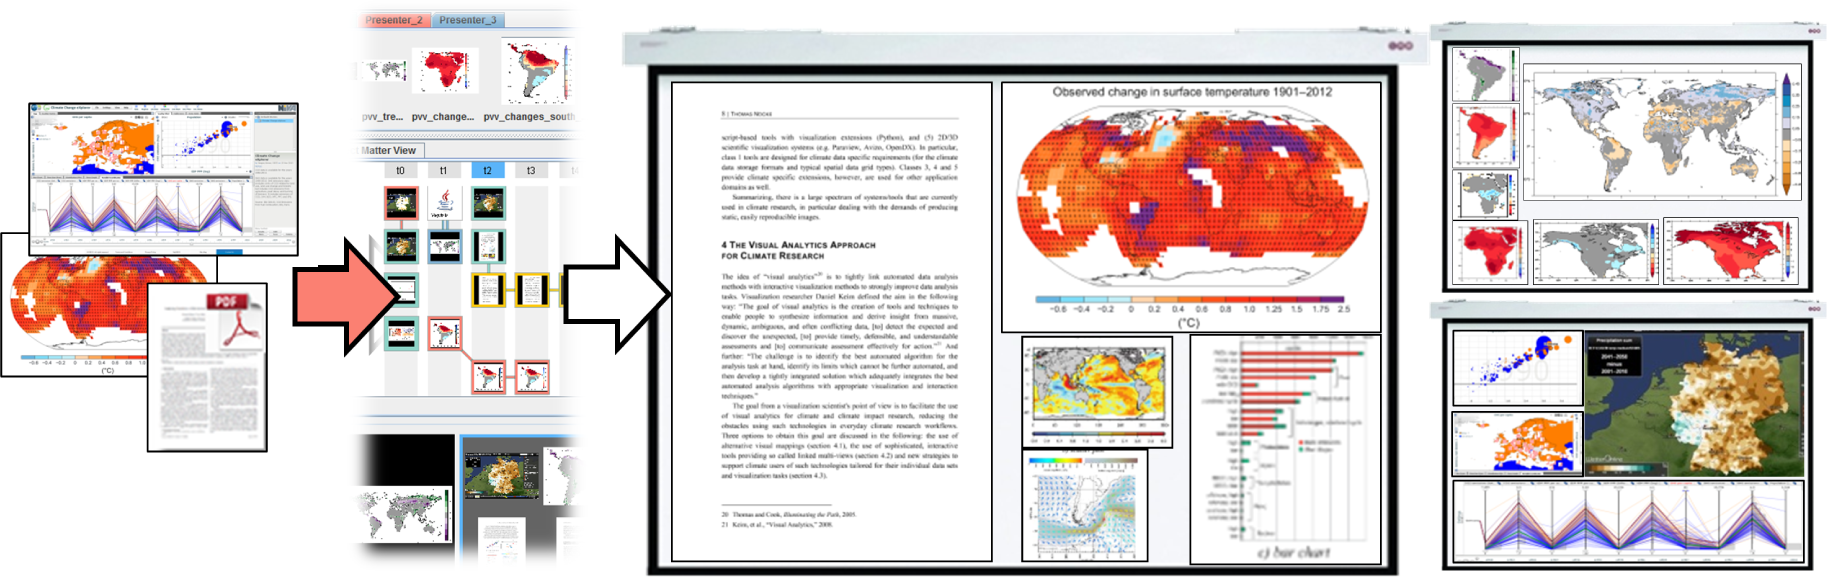
5. Implementation and Use Case

We have implemented the concept of assisted presentation and interaction. Section 5.1 introduces our assistance tool. We have discussed the unique opportunities it provides with people from the field of climate impact research. They acknowledged the relevance of our concept to their line of research, which led to our tool being currently installed in their presentation environment. Section 5.2 describes the possible application of assisted presentation and discussion in the context of climate impact research.

5.1. Implementation

We implemented a Java tool that allows for creating, displaying and moderating assisted presentations and discussions in multi-display environments. The tool consists of two functional blocks:
  • Middleware
    It has two tasks: (i) data exchange; and (ii) integration of personal devices. It is based on the middleware Helferlein [40,41]. The communication is realized by Ethernet or WiFi.
  • User component:
    This has two parts: (i) a display; and (ii) a personal editor component.
    • – The display component realizes the access to the displays in a multi-display environment. An instance of this software runs on all personal devices that are connected to output devices, like projectors or large display walls. Hence, views from the connected devices can be represented on the displays of the environment.
    • – The personal editor component provides the user interface, as described in Section 3. If an instance of this software is installed on a personal device, the user can contribute to the assisted presentation and discussion.
In order to enable on-the-fly-generated content by different application tools, the output of these tools is published as views and integrated into the middleware. These views are recognized by the personal editor components and automatically appear in the content pool. Hence, they can be used for presentation. For example, a web browser wrapper allows incorporating any kind of website as a view into the middleware. In this way, assuming a locally-installed browser (e.g., Mozilla Firefox or Microsoft Internet Explorer) can handle Flash, Java or HTML5, we can show web content and interact with it.

5.2. Use Case

In this section, we describe a typical panel discussion of experts about climate impacts in Germany and envision how it can be supported by our assistance tool. The used views can be found in the Appendix of this paper. The example was specified in close collaboration with the domain experts.
The setting is the following: Three panelists (a regional climate expert, a forestry and a hydrology expert) lead a discussion about the state-of-the art and their recent research regarding climate impacts in Germany. They prepared slides beforehand, but they will also gather geo-spatial data on demand by two sources: the interactive presentation tool Vegetation Visualizer [42] and the web portal [36].
The course of the panel discussion could be the following:
First, the regional climate expert discusses extreme precipitation events. For doing so, she loads three slides that she created beforehand into the content pool: (i) a view of the spatial precipitation distribution for Germany; (ii) a scatterplot of potential temperature and precipitation change in different global climate models; and (iii) a context view of projected European temperature and precipitation distributions from the latest IPCC report (see Figure 4). The slides are displayed through the automatic mapping and layout functionality, and the climate expert starts her introductory talk by discussing these slides.
The hydrologist joins in the discussion, referring directly to a certain part of the presentation. To underpin his concern, he puts a view from the web portal (illustrating “ground water recharge”) into the content pool and defines a semantic link to the precipitation view of the climatologist (see Figure 5). Therefore, both views are shown side by side on the same display. This allows an in-depth discussion of this specific issue. In doing so, additional data are required. Hence, the hydrologist connects his view with the web browser to gather further views from the web portal on-the-fly. These views are integrated into the presentation, as well. The associated semantic links ensure spatial proximity, whereas the scatterplot and the context view are temporarily pushed to more distant displays.
After finishing the discussion of this particular aspect, the climate expert uses the undo functionality to reset the presentation to her original slides and continues her talk.
Only after a while, a person from the audience has a specific question with respect to the previous discussion. Using the redo functionality, the climate expert switches back to the layout with the views of the web portal, and both experts, the hydrologist and the climate expert, answer the question from the audience. Another undo returns to the original slides, and the climate expert again continues her explanations.
Afterwards, the forestry expert addresses the question of whether the situation in Germany and Europe is more complicated compared to other world regions. He puts his slide, an overview of worldwide risks, into the content pool, defines a new layer with this view and connects the view to the Vegetation Visualizer tool. Using this interactive tool on his personal device, he creates further views that are automatically integrated into the presentation. He explains how climate-related risks in Africa and South America are expected to develop in comparison to Europe.
Furthermore, the hydrology expert starts his own instance of the Vegetation Visualizer to provide an alternative point of view (see Figure 6). He addresses disparities in the scarcity of water in different world regions, providing multiple different views of “soil water content” within the same layer. His views are automatically integrated into the presentation, as well.
Both experts explain their views and create further views of different world regions and driving global climate models with different parameter settings. During these discussions, they go back and forth using selective undo and redo to only affect their own contents. Hence, the view of potential forest dieback in the Amazonian stays visible all the time as a context display during the discussion about German forests led by the forestry expert.
A person from the audience has a recent article about this issue. He activates an instance of the assistance tool on his personal device, drags the article into the content pool and assigns it to the current layer (see Figure 7). In this way, it will be presented. Therefore, he shares his information with all people. During the discussion, further people from the audience integrate thematic maps and other material into the presentation. Hence, at the end, the slides of the experts are extended by additional files from the audience.
It is noteworthy that all switches of the presentation as described above are supported by the undo/redo mechanism and that they do not require manual connections of projectors and devices.

6. Conclusions

In this paper, we focused on presenting and discussing geo-spatial data. We introduced the approach of assisted presentation and discussion to support this issue. Assisted in this context means that the user has full control about what should be presented and which constraints should influence the how of presenting. Based on this, our assistance tool automatically computes the display and arrangement of views in a multi-display environment.
Two particular features should be emphasized: (i) the on-the-fly generation of new content by connecting tools to views; and (ii) the on-the-fly integration of content from different persons.
We have first experiences with using our tool in the Studium Optimum project, which aims to improve teaching and learning conditions at the University of Rostock. We got positive feedback, particularly with regard to the easy-to-use interface. Moreover, in cooperation with a domain expert (one author of this paper), we developed a setting of using our tool in the context of climate impact research. However, in future work, we focus on further investigations regarding the applicability. At the Potsdam Institute for Climate Impact Research, the tool will be activated during a meeting of experts, and we will collect informal feedback about how our assistance tool supports real settings. In addition, during the summer term, 2015, our assistance tool will be applied in a seminar of cognitive scientists. They are interested in getting to know how novel technical opportunities influence and/or might improve learning skills, as well as teaching. Based on these two evaluations, we will adapt and extend the assistance tool.

Acknowledgments

This research is supported by the German Research Foundation (DFG) within the research training group GRK 1424 MuSAMA (Graduiertenkolleg 1424 Multimodal Smart Appliance Ensembles for Mobile Applications), by the federal state of Mecklenburg-Vorpommern and EFRE (Europäischer Fonds für Regionale Entwicklung) within the project “Basic and Applied Research in Interactive Document Engineering and Maritime Graphics” and by the Federal Ministry for Education and Research via the Potsdam Research Cluster for Georisk Analysis, Environmental Change and Sustainability (PROGRESS). Moreover, the authors thank Arne Neuber for implementing the undo/redo functionality.

Appendix: Views of the Use Case

This Appendix contains screenshots of the views and tools that the experts in the use case (see Section 5.2) utilize during the panel discussion (Figures 815).

Author Contributions

CE and HS designed the research; CE performed the research and developed the software; HJS and TN performed the task analysis that formed the basis for the use case; CE, HS and TN wrote the paper, which was further revised by HJS; all authors read and approved the final manuscript.

Conflicts of Interest

The authors declare no conflict of interest.

References

  1. Andrienko, G.; Andrienko, N.; Demšar, U.; Dransch, D.; Dykes, J.; Fabrikant, S.; Jern, M.; Kraak, M.J.; Schumann, H.; Tominski, C. Space, time, and visual analytics. Int. J. Geogr. Inf. Sci. 2010, 24, 1577–1600. [Google Scholar]
  2. Nacenta, M.; Aliakseyeu, D.; Subramanian, S.; Gutwin, C. A comparison of techniques for multi-display reaching, Proceedings of the ACM Conference on Human Factors in Computing Systems, Portland, OR, US, 2–7 Apr 2005; ACM: New York, NY, USA, 2005; pp. 371–380.
  3. Radloff, A.; Luboschik, M.; Schumann, H. Smart views in smart environments, Lecture Notes in Computer Science, Proceedings of 11th International Symposium on Smart Graphics, Bremen, Germany, 18–20 July 2011; Springer: Berlin Heidelberg, Germanys, 2011; 6815, pp. 1–12.
  4. Tufte, E.R. The Cognitive Style of PowerPoint: Pitching Out Corrupts Within, 2nd ed; Graphics Press: Cheshire, CT, USA, 2006. [Google Scholar]
  5. Levasseur, D.G.; Sawyer, J.K. Pedagogy meets PowerPoint: A research review of the effects of computer-generated slides in the classroom. Rev. Commun. 2006, 6, 101–123. [Google Scholar]
  6. Lanir, J.; Booth, K.S.; Findlater, L. Observing presenters’ use of visual aids to inform the design of classroom presentation software, Proceedings of the ACM SIGCHI Conference on Human Factors in Computing Systems, Florence, Italy, 5–10 April 2008; ACM: New York, NY, USA, 2008; pp. 695–704.
  7. Tan, D.S.; Meyers, B.; Czerwinski, M. WinCuts: Manipulating arbitrary window regions for more effective use of screen space, Proceedings of ACM SIGCHI Conference on Human Factors in Computing Systems, Vienna, Austria, 24–29 April 2004; ACM: New York, NY, USA, 2004; pp. 1525–1528.
  8. Koike, H.; Nakanishi, Y.; Sato, Y. EnhancedTable: Supporting small meetings in ubiquitous and augmented environment, Lecture Notes in Computer Science, Proceedings of 5th Pacific Rim Conference on Multimedia, Tokyo, Japan, 30 November–3 December 2004; Springer: Berlin/Heidelberg, Germany, 2004; 3331, pp. 97–104.
  9. Izadi, S.; Brignull, H.; Rodden, T.; Rogers, Y.; Underwood, M. Dynamo: A public interactive surface supporting the cooperative sharing and exchange of media, Proceedings of the 16th Annual ACM Symposium on User Interface Software and Technology, Vancouver, Canada, 2–5 November 2003; ACM: New York, NY, USA, 2003; pp. 159–168.
  10. Badam, S.K.; Elmqvist, N. PolyChrome: A cross-device framework for collaborative web visualization, Proceedings of the Ninth ACM International Conference on Interactive Tabletops and Surfaces, Dresden, Germany, 16–19 November 2014; ACM: New York, NY, USA, 2014; pp. 109–118.
  11. Biehl, J.; Baker, W.; Bailey, B.; Tan, D.; Inkpen, K.; Czerwinski, M. IMPROMPTU: A new interaction framework for supporting collaboration in multiple display environments and its field evaluation for co-located software development, Proceedings of the Conference on Human Factors in Computing Systems (CHI 2008), Florence, Italy, 5–10 April 2008; ACM: New York, NY, USA, 2008; pp. 939–948.
  12. Wigdor, D.; Jiang, H.; Forlines, C.; Borkin, M.; Shen, C. WeSpace: The design development and deployment of a walk-up and share multi-surface visual collaboration system, Proceedings of the SIGCHI Conference on Human Factors in Computing Systems, Boston, MA, USA, 4–9 April 2009; ACM: New York, NY, USA, 2009; pp. 1237–1246.
  13. Yang, J.; Wigdor, D. Panelrama: Enabling easy specification of cross-device web applications, Proceedings of 2014 SIGCHI Conference on Human Factors in Computing Systems, Toronto, ON, Canada, 26 April 26–1 May 2014; ACM: New York, NY, USA, 2014; pp. 2783–2792.
  14. Lanir, J.; Booth, K.S.; Tang, A. MultiPresenter: A presentation system for (very) large display surfaces, Proceedings of the 16th ACM International Conference on Multimedia, Vancouver, Canada, 26–31 October 2008; ACM: New York, NY, USA, 2008; pp. 519–528.
  15. Liu, Q.; Kimber, D.; Zhao, F.; Huang, J. Framework for effective use of multiple displays. Proc. SPIE 2005. [Google Scholar] [CrossRef]
  16. Kurihara, K.; Igarashi, T. A flexible presentation tool for diverse multi-display environments, Lecture Notes in Computer Science, Proceedings of the 11th IFIP TC 13 International Conference on Human-Computer Interaction, Rio de Janeiro, Brazil, 10–14 September 2007; Springer: Berlin/Heidelberg, Germany, 2007; 4662, pp. 430–433.
  17. Zhang, H.; Liu, Q.; Lertsithichai, S.; Liao, C.; Kimber, D. A presentation authoring tool for media devices distributed environments, Proceedins of the IEEE International Conference on Multimedia and Expo, Taipei, Taiwan, 27–30 June 2004; IEEE: Washington, DC, USA, 2004; 3, pp. 1755–1758.
  18. Spicer, R.; Lin, Y.R.; Kelliher, A.; Sundaram, H. NextSlidePlease: Authoring and delivering agile multimedia presentations. ACM Trans. Multimed. Comput. Commun. Appl. 2012, 8, 53. [Google Scholar]
  19. Kuikkaniemi, K.; Lehtinen, V.; Nelimarkka, M.; Vilkki, M.; Ojala, J.; Jacucci, G. Designing for presenters at public walk-up-and-use displays, Proceedings of the 8th International Conference on Tangible, Embedded and Embodied Interaction, Munich, Germany, 16–19 February 2014; ACM: New York, NY, USA, 2013; pp. 225–232.
  20. Mahyar, N.; Tory, M. Supporting communication and coordination in collaborative sensemaking. IEEE Trans. Vis. Comput. Graph 2014, 20, 1633–1642. [Google Scholar]
  21. Kreuseler, M.; Nocke, T.; Schumann, H. A history mechanism for visual data mining, Proceedings of the IEEE Symposium on Information Visualization, Austin, TX, USA, 10–12 October 2004; IEEE: Washington, DC, USA, 2004; pp. 49–56.
  22. Sarvghad, A.; Mahyar, N.; Tory, M. History tools for collaborative visualization, Proceedings of the Workshop on Collaborative Visualization on Interactive Surfaces, Atlantic City, NJ, USA, 11 October 2009; LMU Munich: Munich, Germany, 2009; pp. 21–23.
  23. Zhou, C.; Imamiya, A. Object-based nonlinear undo model, Proceedings of the 21st International Computer Software and Applications Conference, Washington, DC, USA, 11–15 August 1997; IEEE: Washington, DC, USA, 1997; pp. 50–55.
  24. Heer, J.; Mackinlay, J.; Stolte, C.; Agrawala, M. Graphical histories for visualization: Supporting analysis, communication, and evaluation. IEEE Trans. Vis. Comput. Graph 2008, 14, 1189–1196. [Google Scholar]
  25. Ressel, M.; Gunzenhäuser, R. Reducing the problems of group undo, Proceedings of the International ACM SIGGROUP Conference on Supporting Group Work, Phoenix, AZ, USA, 14–17 November 1999; ACM: New York, NY, USA, 1999; pp. 131–139.
  26. Abowd, G.D.; Dix, A.J. Giving undo attention. Interact. Comput. 1992, 4, 317–342. [Google Scholar]
  27. Seifried, T.; Rendl, C.; Haller, M.; Scott, S. Regional undo/redo techniques for large interactive surfaces, Proceedings of the ACM SIGCHI Conference on Human Factors in Computing Systems, Austin, TX, USA, 5–10 May 2012; ACM: New York, NY, USA, 2012; pp. 2855–2864.
  28. Prakash, A.; Knister, M.J. A framework for undoing actions in collaborative systems. ACM Trans. Comput.-Hum. Interact. 1994, 1, 295–330. [Google Scholar]
  29. Forlines, C.; Esenther, A.; Shen, C.; Wigdor, D.; Ryall, K. Multi-user, multi-display interaction with a single-user, single-display geospatial application, Proceedings of the 19th Annual ACM Symposium on User Interface Software and Technology, Montreux, Switzerland, 15–18 October 2006; ACM: New York, NY, USA, 2006; pp. 273–276.
  30. Schneider, B.; Tobiasz, M.; Willis, C.; Shen, C. WALDEN: Multi-surface multi-touch simulation of climate change and species loss in Thoreau’s woods, Proceedings of the 2012 ACM International Conference on Interactive Tabletops and Surfaces, Cambridge, MA, USA, 11–14 November 2012; ACM: New York, NY, USA, 2012; pp. 387–390.
  31. Seyed, T.; Costa Sousa, M.; Maurer, F.; Tang, A. SkyHunter: A multi-surface environment for supporting oil and gas exploration, Proceedings of the 2013 ACM International Conference on Interactive Tabletops and Surfaces, St Andrews, UK, 6–9 October 2013; ACM: New York, NY, USA, 2013; pp. 15–22.
  32. Shakeri, Hossein; Abad, Z.; Anslow, C.; Maurer, F. Multi surface interactions with geospatial data: A systematic review, Proceedings of the Ninth ACM International Conference on Interactive Tabletops and Surfaces, Dresden, Germany, 16–19 November 2014; ACM: New York, NY, USA, 2014; pp. 69–78.
  33. Chokshi, A.; Seyed, T.; Marinho Rodrigues, F.; Maurer, F. ePlan multi-surface: A multi-surface environment for emergency response planning exercises, Proceedings of the Ninth ACM International Conference on Interactive Tabletops and Surfaces, Dresden, Germany, 16–19 November 2014; ACM: New York, NY, USA, 2014; pp. 219–228.
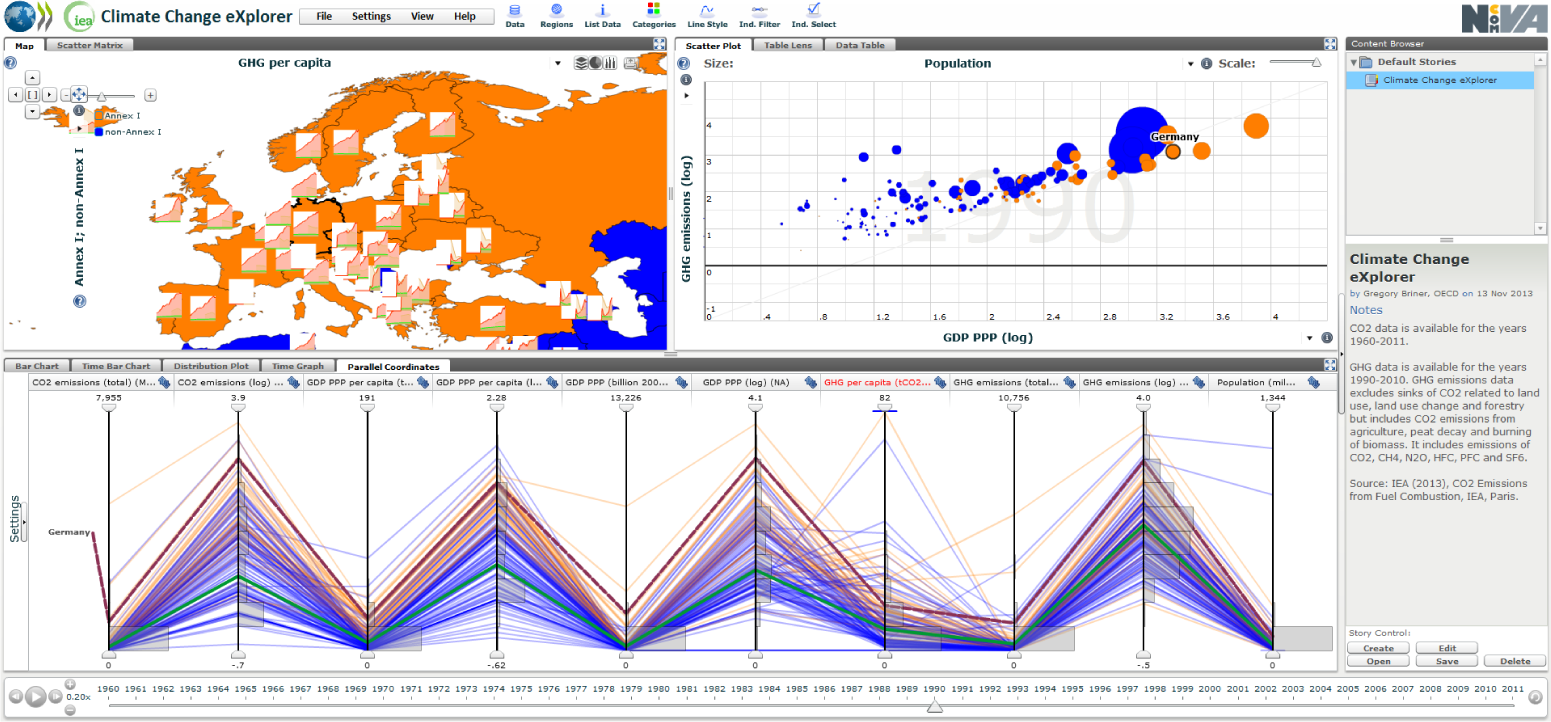
  34. Climate Change eXplorer. Available online: http://webnet.oecd.org/climatechange/ accessed on 16 March 2015.
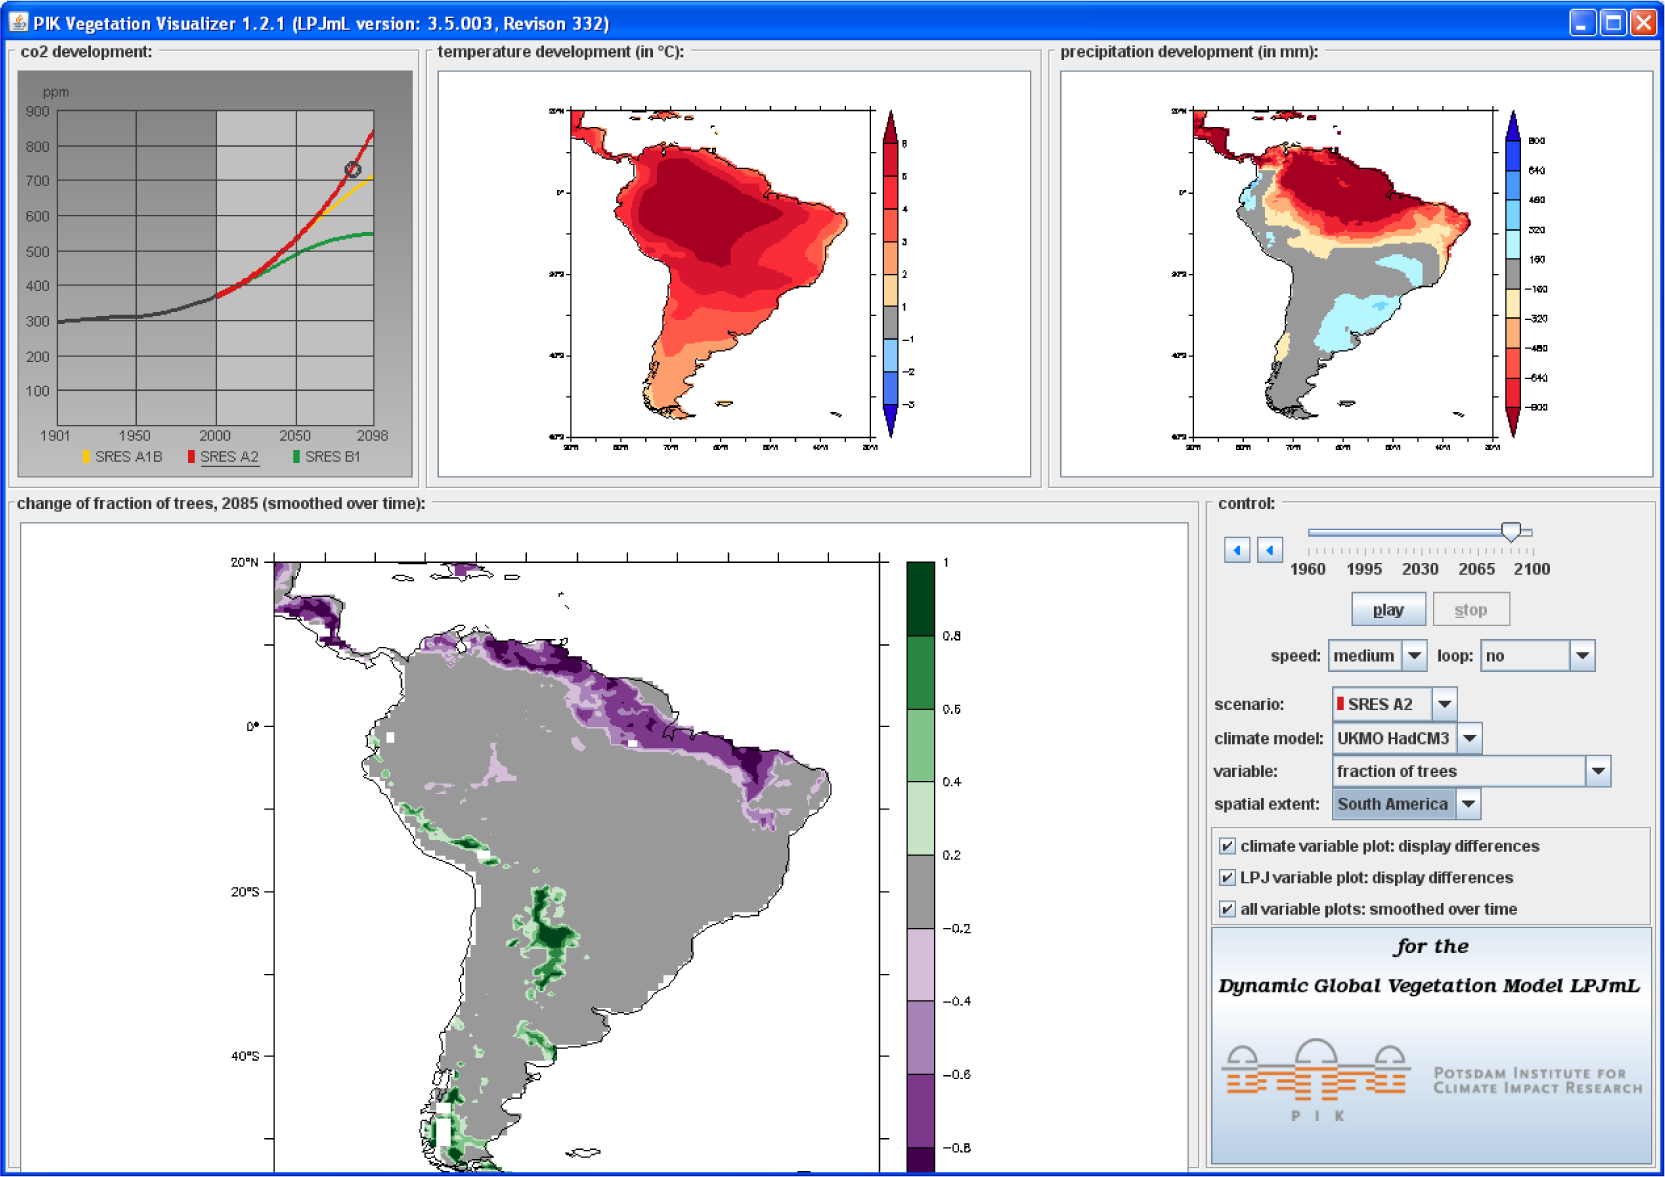
  35. Nocke, T. Video PIK Vegetation Visualizer. Available online: https://www.pik-potsdam.de/members/nocke/video-pvv/view accessed on 16 March 2015.
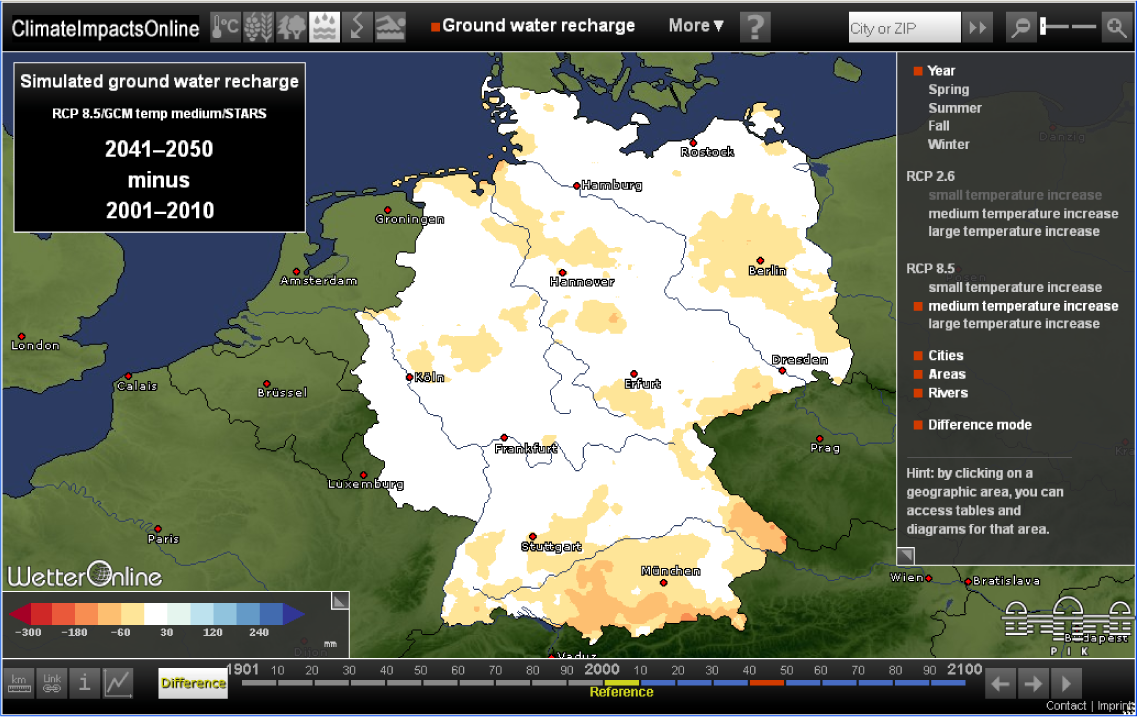
  36. ClimateImpactsOnline. Available online: http://www.climateimpactsonline.com accessed on 16 March 2015.
  37. Radloff, A.; Luboschik, M.; Sips, M.; Schumann, H. Supporting display scalability by redundant mapping, Lecture Notes in Computer Science, Proceedings of 7th International Symposium, ISVC 2011, Las Vegas, NV, USA, 26–28 September 2011; Springer: Berlin/Heidelberg, Germany, 2011; 6938, pp. 472–483.
  38. Tobler, W. A computer movie simulating urban growth in the Detroit region. Econ. Geogr 1970, 46, 234–240. [Google Scholar]
  39. Sun, C. Undo any operation at any time in group editors, Proceedings of the ACM Conference on Computer Supported Cooperative Work, Philadelphia, PA, USA, 2–6 December 2000; ACM: New York, NY, USA, 2000; pp. 191–200.
  40. Bader, S.; Kirste, T. An Overview of the Helferlein-System; Technical Report CS-03-12; Institute for Computer Science, University of Rostock: Rostock, Germany, 2012. [Google Scholar]
  41. Bader, B.; Nyolt, M. A context-aware publish-subscribe middleware for distributed smart environments, Proceedings of the IEEE International Conference on Pervasive Computing and Communications Workshops, Lugano, Switzerland, 19–23 March 2012; IEEE: Washington, DC, USA, 2012; pp. 100–104.
  42. Nocke, T.; Heyder, U.; Petri, S.; Vohland, K.; Wrobel, M.; Lucht, W. Visualization of biosphere changes in the context of climate change, Proceedings of the 2nd International Conference Information Technology and Climate Change, Berlin, Germany, 25–26 September 2008; Trafo Wissenschaftsverlag: Berlin, Germany, 2009; pp. 29–36.
  43. Hoffmann, P. Potsdam Institute for Climate Impact Research (PIK); Potsdam, Germany, Unpublished work; 2015. [Google Scholar]
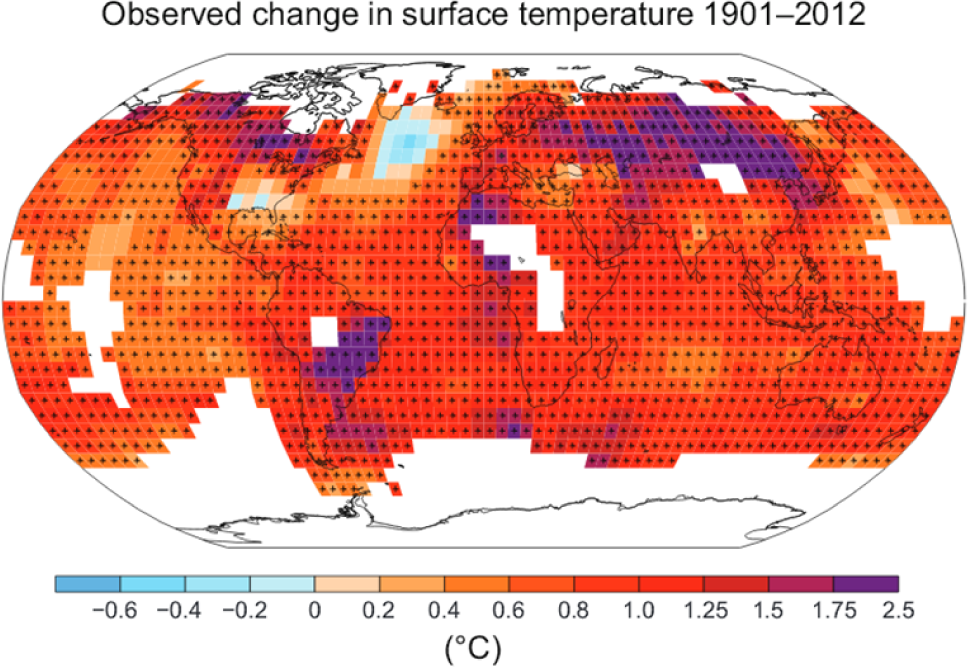
  44. Fifth Assessment Report—Climate Change 2013. Available online: http://www.ipcc.ch/report/ar5/wg1/ accessed on 16 March 2015.
Figure 1. Screenshot of the user interface. The content pool is represented at the top. Participants can publish contents by dragging them into this region. The relation between content parts is depicted at the center of the screen. By drag and drop, participants can put content parts from the content pool into this region and link them via connector lines. Content parts of different participants are distinguished by color. The layers are shown at the bottom. Contents of this layer are successively shown on the available displays. The current layer is highlighted by a blue border.
Ijgi 04 00493f1
Figure 2. Illustration of the layout generation. Views are mapped to the displays. For each display, we create a layout by maximizing the quality function Q. The best layout for all displays is used to show the views.
Ijgi 04 00493f2
Figure 3. Screenshot of the undo interface. The main view in the middle shows a visualization of a branching interaction history. Participants can use this history to switch to previous views by double clicking on an item of a branching path. The individual displays of the multi-display environment are depicted in the upper left corner by icons showing the currently displayed views. All previously used views are displayed at the upper right part of the undo interface. Participants can select displays or views to apply regional and/or object-based filters to the history.
Ijgi 04 00493f3
Figure 4. The regional climate expert loads her slides in the content pool. The slides are shown on the displays of the room.
Ijgi 04 00493f4
Figure 5. Situation after the hydrologist joins the discussion. Linked views are shown side by side on the same display.
Ijgi 04 00493f5
Figure 6. The forestry expert provides a slide of the worldwide risks and starts the Vegetation Visualizer tool to generate further views of Africa and South America. The hydrologist joins in by starting his own instance of the same tool. The on-the-fly generated views from both experts are simultaneously displayed.
Ijgi 04 00493f6
Figure 7. Persons from the audience provide additional information by integrating articles, maps and other generated views. In this way, they can share information with other persons and contribute to a discussion.
Ijgi 04 00493f7
Figure 8. View of the spatial precipitation distribution for Germany. Screenshot taken from ClimateImpactsOnline [36].
Ijgi 04 00493f8
Figure 9. View from ClimateImpactsOnline [36] illustrating ground water recharge in Germany.
Ijgi 04 00493f9
Figure 10. Scatterplot of potential temperature and precipitation change in different global climate models [43]. (copyright Peter Hoffmann, PIK)
Ijgi 04 00493f10
Figure 11. Context view of projected European temperature and precipitation distributions [43]. (copyright Peter Hoffmann, PIK)
Ijgi 04 00493f11
Figure 12. Screenshot of the Vegetation Visualizer tool [42] used to generate views of Africa showing temperature development, precipitation development and changes of vegetation class.
Ijgi 04 00493f12
Figure 13. Screenshot of the Vegetation Visualizer tool [42] used to generate views of South America showing temperature development, precipitation development and changes in the fraction of trees.
Ijgi 04 00493f13
Figure 14. Screenshot of the climate explorer web tool [34] used to visualize emission data.
Ijgi 04 00493f14
Figure 15. Map showing changes in surface temperature (IPCC AR5 WG1 Figure SPM.1b p.6 [44]).
Ijgi 04 00493f15

