1. Introduction
Computing the similarity of concepts in a knowledge-representation structure is a cornerstone for a wide variety of advanced tasks in geographic information science (GIScience), geographic information retrieval, geoparsing, natural language processing and artificial intelligence. In this article, we combine network similarity and lexical similarity measures into a hybrid measure in order to compute the similarity of geographic concepts in graph-based structures that represent geographic knowledge, showing empirically that both aspects of similarity increase the performance. Because of their simplicity and their adherence with human semantic intuition, graphs have been the most popular knowledge-representation structure over the past 30 years [
1]. A wide variety of geographic knowledge bases rely on some form of graph-based representation, ranging from gazetteers, geo-databases, location-based social media and wikis, to the linked open data cloud that emerged from Semantic Web research [
2] (
http://lod-cloud.net).
At the core, these structures can be seen as geo-knowledge graphs (GKGs). In this article, we define a GKG as a representational artifact that contains geographic concepts, their mutual relations, and their lexical descriptions. GKGs do not necessarily attach formal constraints to their concepts and relations. Please note that GKG is a general term that does not refer to Google’s Knowledge Graph (
http://googleblog.blogspot.com/2012/05/introducing-knowledge-graph-things-not.html). Formally, a GKG is a directed graph whose vertices correspond to concepts and whose edges are relations. Lexical descriptions of concepts are associated with vertices. Hence, such knowledge-representation structures are ubiquitous: even websites can be seen as GKGs, in which each page is a concept, and hyperlinks represent a generic, unspecified relation. More complex logic formalisms, such as conceptual graphs and ontologies, still contain GKGs.
Traditionally, knowledge-representation artifacts were built by experts for specific scientific or engineering purposes, such as the lexical database WordNet [
3] and the artificial intelligence project Cyc (
http://www.cyc.com). With the emergence and sophistication of volunteered geographic information (VGI) [
4], GKGs are often characterized by highly variable coverage and quality [
5]. GeoNames (
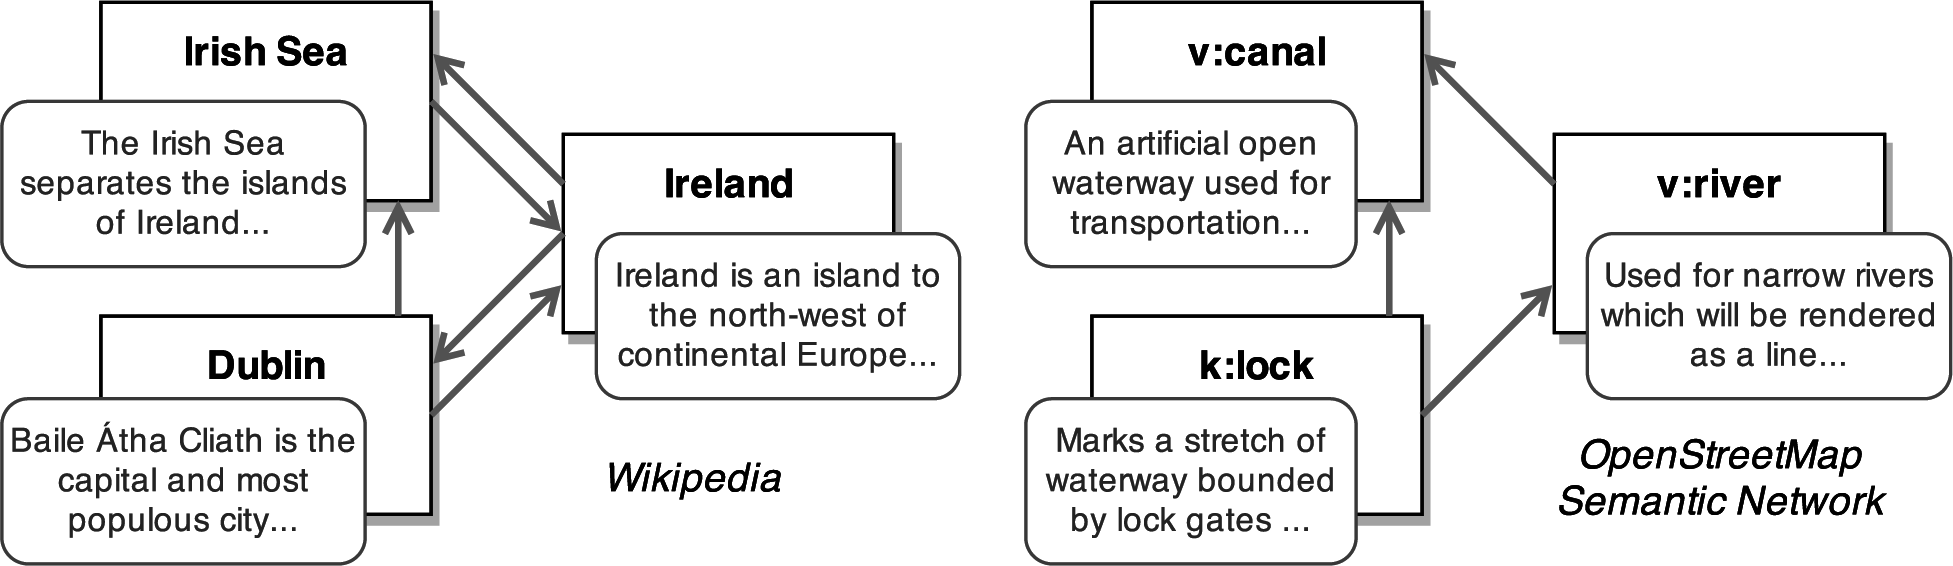
http://www.geonames.org) can be seen as a GKG, in which the gazetteer entries are concepts connected through hierarchical and other relations. GKGs are found in the hyperlinked graph of Wikipedia articles, as well as in cartographic projects, such as OpenStreetMap, which focuses on spatial vector data (see
Figure 1).
In the context of such knowledge-representation graphs, given two concepts in a GKG (or in different GKGs), a semantic similarity measure aims at quantifying their similarity as a real number, typically normalized in the interval ∈ [0, 1]. Typically, the computation of semantic similarity is not an end in itself, but is an intermediate task necessary to enable other tasks. For example, in a given GKG, the concepts “river” and “canal” might have similarity 0.75, whilst “river” and “restaurant” score only 0.05. If a measure mimics human judgment to a sufficient degree, these similarity values can be used for query relaxation in geographic information retrieval, including canals in the results for a query aimed at rivers, as well as for conceptual alignment, detecting high similarity between different representations of the concept river in two geo-databases [
6,
7].
In our previous work, we investigated the application of network-based and lexical similarity measures to compute the semantic similarity of geographic concepts, in the context of a crowdsourced semantic network [
8–
10]. The original contribution of this article builds upon and extends this body of work in several respects. First, we devise a hybrid semantic similarity measure, the network-lexical similarity measure (NLS), which combines two pillars of the similarity of concepts in GKGs. We define the first pillar as the concept’s topological location,
i.e., its structural relations with other concepts. The second pillar is based on the semantic similarity of concepts’ lexical definitions, expressed in natural language. NLS combines network and lexical similarity measures, and both aspects contribute to increasing the cognitive plausibility of the measure,
i.e., the ability of the measure to mimic human judgments. To the best of our knowledge, NLS is the first approach to semantic similarity that combines these two aspects.
Second, the cognitive plausibility of NLS is thoroughly evaluated on a real-world GKG, the OpenStreetMap (OSM) Semantic Network [
5], which contains about 5000 concepts extracted from crowdsourcing project OpenStreetMap. This GKG allows a detailed assessment of NLS in the context of a geographic knowledge-representation artifact, enabling a critical discussion on the limitations of network and lexical similarity measures. As ground truth, this evaluation utilizes the geo-relatedness and similarity dataset (GeReSiD) [
10], providing a more reliable and extensive evaluation, and allows a detailed comparison of the measures. These results are compared with those obtained with the dataset used to evaluate the matching-distance similarity measure (MDSM) [
11]. The empirical results of this study further the assessment of the cognitive plausibility of network and lexical measures and confirm the high cognitive plausibility of NLS, which consistently outperforms both network and lexical measures.
The remainder of this article is organized as follows. Section 2 surveys relevant literature on semantic similarity. Section 3 outlines NLS, the proposed hybrid measure of semantic similarity. Subsequently, a detailed empirical evaluation of the measure is presented and discussed (Section 4). We conclude with a summary and discussion of directions for future research (Section 5).
2. Background
Semantic similarity is a specific type of semantic relatedness, based on subsumption relations (
is a) [
10]. For example, “fuel” is semantically related to “car”, while “bus” is semantically related and similar to “car”. Given the fundamental nature of semantic similarity, it is difficult to provide a definition without circularity, and several terms have been used to discuss it. “Semantic distance” is used to refer to the distance between two concepts represented in a geometric semantic model [
12]. Depending on what attributes and relations are considered, semantic similarity can be computed as inversely proportional to semantic distance. Furthermore, the term “semantic association” is used to define semantic relatedness, in particular in human memory retrieval processes. “Taxonomical similarity”, on the other hand, is equivalent to semantic similarity [
13]. In a GKG, concepts are connected through relations that express their general semantic relatedness.
In the context of GIScience, measures of semantic similarity and relatedness are widely applied in geographic information retrieval, data mining and geo-semantics [
6,
14]. Specific measures of semantic similarity tailored to geographic concepts have emerged [
15]. Rodríguez and Egenhofer [
11] have extended Tversky’s ratio model, taking context explicitly into account, by selecting a subset of features based on user needs. Janowicz
et al. [
14] have developed a similarity measure for geographic concepts based on description logic (DL), a family of Semantic Web languages. Such measures can only be applied to concepts expressed in specific formalisms, such as DL. Hence, in the context of GKGs, these measures are not directly applicable, and different approaches are needed.
2.1. Network Similarity Measures
This section describes existing techniques to compute the similarity of vertices in graphs, the first component of NLS. These approaches to similarity are based on some form of structural distance between nodes, such as edge counting, sometimes adding additional parameters to weight the paths [
16]. Such network-based techniques have been applied to well-defined, expert-generated semantic networks in which the edges are expressed in some formal semantics, such as WordNet. However, the GKGs we are focusing on do not present such a semantically-rich structure, but encode knowledge in the form of simple graphs of inter-linked objects. Given the popularity of networks in many fields, several algorithms have emerged to identify similar objects exclusively on their link patterns in graphs that do not explicitly formalize relations.
Small [
17] devised the seminal “co-citation” algorithm. Given a graph representing scientific articles and their mutual references, this measure models the similarity between two given papers by the frequency in which they are cited together. Extending co-citation to a recursive form, Jeh and Widom [
18] created SimRank, an approach to calculating vertex similarity in directed graphs. The underlying circular intuition is that two objects can be considered similar if they are referenced by similar objects. The P-Rank algorithm [
19] further extends co-citation by taking into account outgoing links. Previous network similarity algorithms, such as the original co-citation [
17], Coupling [
20] and Amsler [
21], are specific cases of P-Rank. In our previous work, we showed that, when applied to geographic concepts, SimRank and P-Rank tend to reach higher plausibility than the other network measures [
8].
2.2. Lexical Similarity Measures
The general objective of lexical similarity measures is the quantification of the similarity of two lexical units, typically as a real number. A lexical unit can be either an individual word, a compound word or a segment of text [
22]. Approaches to compute the semantic similarity of individual words (as opposed to larger semantic entities) can be classified into two main families: knowledge-based and corpus-based. Knowledge-based techniques utilize manually-generated artifacts as a source of conceptual knowledge. Under a structuralist assumption, most of these techniques observe the relationships that link the terms, assuming, for example, that the ontological distance is inversely proportional to the semantic similarity [
23]. WordNet [
3] has been used to compute lexical similarity with a variety of methods, as shown in
Table 1 [
24–
30]. These measures obtain varying plausibility depending on the context and can be combined into ensembles to obtain higher plausibility [
31]. Corpus-based techniques, on the other hand, do not need explicit relationships between terms and compute the semantic similarity of two terms based on their co-occurrence in a large corpus of text documents [
32,
33].
Semantic similarity can be computed between segments of texts, in a linguistic problem called “paraphrase detection”. For example, the sentence “Any trip to Italy should include a visit to Tuscany to sample their wines” bears high semantic similarity with and is a paraphrase of “Be sure to include a Tuscan wine-tasting experience when visiting Italy”. To tackle this issue, Corley and Mihalcea [
34] developed a knowledge-based bag-of-words technique to paraphrase detection, which relies on some of the WordNet measures. In our previous work, we developed a similarity measure geared towards lexical definitions [
9]. In terms of precision, the knowledge-based measures generally outperform the corpus-based ones [
35]. Although numerous semantic similarity measures exist, to the best of our knowledge, no hybrid measure has been proposed that combines network and lexical similarity for GKGs. The next section outlines NLS, our approach to filling this knowledge gap.
3. The Network-Lexical Similarity Measure
The general problem that network-lexical similarity measure (NLS) aims at solving is the quantification of semantic similarity in a GKG. Formally, a GKG is a labeled graph G(V, E, L), with a set of vertices V (concepts), a set of directed edges E (relations) and a set of labels L (lexical definitions). A labeling function V → L associates the vertices with labels. A label l ∈ L contains a segment of text and can be empty. A directed edge e ∈ E associates two nodes e = {u, v}, where u, v ∈ V. Given two concepts a and b ∈ V, the objective of a semantic similarity measure is to compute a similarity score s(a, b) ∈ ℜ. To ease their interpretation, the scores are normalized in the interval ∈ [0, 1]. It is important to note that similarity scores are not meaningful in isolation, but convey useful information when compared with other pairs of concepts.
In order to compute the semantic similarity in GKGs, NLS rests on two pillars: network similarity snet and lexical similarity slex. The network similarity of two concepts is extracted from their topological location in the graph, observing the link structure of G. On the other hand, the lexical similarity focuses on the labels in L that contain segments of text describing the concepts. Natural language processing techniques can thus be used to measure the semantic similarity of segments of text. These two perspectives on concept similarity are not mutually exclusive, and NLS considers them as complementary. NLS should be seen as a general framework to compute semantic similarity, combining complementary aspects of similarity in GKGs.
3.1. Network Similarity (snet)
The network similarity function
snet(
a, b) aims at quantifying the structural similarity of vertices in graph
G. Because GKGs do not encode the formal semantics of the relations between concepts, suitable measures have to consider edges as indicators of general relatedness. If either
a or
b is not connected to other nodes,
snet(
a, b) is undetermined, and NLS relies only on
slex(
a, b). Based on previous work on the cognitive plausibility of co-citation measures in the context of conceptual graphs, we adopt six state-of-the-art network similarity measures [
8]. In particular, we consider P-Rank, a generic co-citation algorithm [
19]. As discussed in Section 2.1, fordifferent parameters, P-Rank is equivalent to earlier algorithms, including Co-citation [
17], Amsler [
21], Coupling [
20] and SimRank [
18] and rvs-SimRank [
19]. In this context, we adopt a formulation of P-Rank in linear algebra [
8], discussing in detail the meaning and impact of its parameters (
K, λ and
C).
P-Rank is a recursive measure of similarity, based on the combination of two recursive assumptions: (1) two entities are similar if they are referenced by similar entities; and (2) two entities are similar if they reference similar entities. P-Rank is calculated iteratively, choosing a number of iterations
K ∈ [1, ∞). The higher
K, the better the approximation of the theoretical solution to P-Rank. In this context,
C is the P-Rank decay factor ∈ (0, 1). Coefficient
λ is the P-Rank in-out balance constant, in the interval [0, 1]. When
λ = 1, only the incoming links are considered, and when
λ = 0, only the outgoing links are included in the computation. Hence, we define
snet as follows:
where
K is the P-Rank maximum iterations (
K ∈ [1, ∞)). Matrix R
k is a P-Rank score matrix at iteration
k. Matrix T
i is a transition matrix of G constructed on
I(
a). In addition, T
o is the transition matrix of G constructed on
O(
a), and Θ is a diagonal matrix, so that ∀
k, when
a =
b, Θ(
a, b) + R
k(
a, b) = 1. All P-Rank iterations with
k > 0 can be expressed as a series of iterations converging to the theoretical similarity score. Based on the optimization devised by Yu
et al. [
36], the computational complexity of this measure has the upper bound
O(
n3 +
Kn2).
3.2. Lexical Similarity (slex)
The purpose of similarity function
slex(
a, b) is the quantification of the semantic similarity of two text segments
la and
lb ∈
L, which represent the lexical definition of nodes
a and
b in a GKG. Each concept is associated with a set of definitional terms
ta1…tan that describe the concept. If
la or
lb are empty,
slex(
a, b) is undetermined, and NLS has to rely only on
snet. In order to compute
slex between two segments of text, we adopt the knowledge-based technique that we developed in our previous work [
9]. The basic intuition behind this lexical similarity measure is that similar terms are described using similar terms. This bag-of-words measure computes the semantic similarity of two terms
s(
a, b) based on input parameters {
POS, C, simt, simv}: a part-of-speech (POS) filter, which consists of a set of POS tags (e.g., nouns and verbs); a corpus
C; a term similarity function
simt; and a vector similarity function
simv. The four steps of the similarity algorithm are as follows:
Given two concepts a and b, lemmatize and POS-tag their terms in labels la and lb.
Construct semantic vectors
and
, based on definitional terms having POS contained in the POS filter. For each definitional term t, retrieve weights wt from corpus C. A common approach to computing the weight of the definitional terms is the term frequency-inverse document frequency (TF-IDF). A relatively infrequent term in corpus C is expected to bear a higher weight than a frequent one.
Construct matrices
Mab and
Mba. Each cell of these similarity matrices contains a term similarity score
simt(
tai, tbj). In principle, any term-to-term semantic similarity measure might be adopted as
simt (see, for example,
Table 1).
Compute similarity score
slex(
a, b) from the similarity matrices using vector similarity
simv, based on paraphrase-detection techniques, such as those by Corley and Mihalcea [
34] or Fernando and Stevenson [
37].
Having constructed the semantic vectors
and
and the matrices
Mab and
Mba, the vector-to-vector similarity
simv in Step 4 deserves particular attention. First, an asymmetric similarity measure of semantic vectors
can be formalized as follows:
where function
ŝ returns a similarity score between a definitional term and a semantic vector, based on a similarity matrix. Two functions can be adopted as
ŝ: either
ŝcom (based on Corley and Mihalcea [
34]) or
ŝfes (based on Fernando and Stevenson [
37]). Finally, a symmetric measure
slex ∈ [0, 1] can be easily obtained from
as the average of
and
. This knowledge-based approach relying on semantic vectors enables the computation of the lexical similarity in NLS. In terms of computational complexity, the upper bound of this measure is
O(
n3). As shown in the next section, to obtain a more plausible measure of similarity in GKGs, this component of semantic similarity can be combined with the network similarity.
3.3. Hybrid Similarity (shyb)
In general, the limitations of computational approaches to the same problem can be overcome by combining them into an appropriate hybrid measure. In a GKG, some concepts might be situated in a densely-connected area of the network, while having sketchy labels. By contrast, other concepts can be poorly linked, but have richer lexical labels. This phenomenon sets upper bounds for network and lexical similarity, limiting the overall cognitive plausibility of the similarity measures.
Considering two concepts
a and
b in graph
G, we have defined a network similarity measure
snet(
a, b) and a lexical similarity measure
slex(
a, b). Both measures quantify the concept similarity with a real number in the interval ℜ ∈ [0, 1], where 0 means minimum similarity and 1 maximum similarity. In order to obtain a combined measure of similarity
shyb(
a, b), we define two combination strategies: score combination (
ssc) and rank combination (
srk). The score combination
ssc consists of the linear score combination of network and lexical similarities, weighted by a combination factor
α ∈ [0, 1]:
The rank combination
srk, on the other hand, is the linear combination of the pair rankings, normalized on the cardinality of the pair set:
where
rk is a ranking function,
P a set of concept pairs and
α is the combination factor. While
ssc is a continuous function,
srk is discrete. For example, in a set
P of ten pairs, a pair of concepts (
a, b) can have
snet = 0.7, resulting in
rk(
snet) = 3 in the pair set. The lexical score
slex = 0.45 might correspond to
rk(
slex) = 8. Fixing the value of
α to 0.5, the score combination is
ssc = 0.57. The rank combination amounts to
rkcomb = 5.5; therefore,
srk = 0.5. The next section describes an empirical evaluation of NLS in a real-world scenario.
4. Evaluation
In this section, NLS is evaluated in a real-world scenario. The key purpose of this evaluation is the validation of the intuition underlying NLS: the complementary nature of network and lexical similarity in GKGs. These empirical results indicate that the hybrid measure can overcome the limitations of network and lexical measures. As ground truth, we selected the OSM Semantic Network, a GKG, and a corresponding dataset of human-generated similarity judgments, described in the next section. In the evaluation, we show that existing WordNet-based similarity measures are not sufficient to compute the semantic similarity in the context, and we analyze in detail the performance of the two components of NLS, assessing the superior plausibility of the hybrid measure. These results are then compared with those reported in our previous work, against the dataset defined in [
11] to evaluate the matching-distance similarity measure (MDSM), a similarity measure for geographic concepts.
4.1. Ground Truth
As an evaluation testbed for NLS, we selected a GKG, the OSM Semantic Network [
8]. This GKG contains a machine-readable representation of geographic concepts, extracted from the crowdsourced cartographic project OpenStreetMap. For example, the concept canal is represented by a vertex linked to concepts waterway and river (
http://github.com/ucd-spatial/OsmSemanticNetwork). To date, the network contains about 5000 geographic concepts, linked by 19,000 edges. The OSM Semantic Network is a suitable choice, because it consists of a graph containing inter-connected concepts and whose concepts are associated with lexical descriptions. To evaluate NLS, we adopted the cognitive-plausibility approach,
i.e., the similarity judgments generated by the measure are compared against judgments obtained from human subjects.
As a set of human psychological judgments, we selected the geo-relatedness and similarity dataset (GeReSiD) (
http://github.com/ucd-spatial/Datasets) [
10]. This dataset provides a set of human-generated similarity scores
Hsc on 50 concept pairs rated by 203 human subjects, then ranked as
Hrk, covering in total 97 concepts. Because semantic relatedness is outside the scope of this study, we considered only semantic similarity judgments. Following Resnik [
16], we consider the upper bound for the cognitive plausibility of a computable measure to be the highest correlation obtained by a human rater with the dataset’s means (Spearman’s
ρ = 0.93). In other words, this upper bound represents the empirical best results that human subjects obtained when rating the similarity of the concept pairs.
Table 2 includes all 50 concept pairs, with the similarity score and ranking assigned by the human subjects, utilized in the next sections as ground truth.
4.2. WordNet-Based Experiment
This experiment aims at investigating the cognitive plausibility of WordNet-based similarity measures when applied directly to the concepts contained in GeReSiD. In order to evaluate the WordNet similarity measures directly on the concepts, the 97 OpenStreetMap concepts contained in GeReSiD were manually mapped to the corresponding WordNet synsets. The ten WordNet-based measures, summarized in
Table 1, were computed on the 50 pairs. The resulting correlations of these similarity scores with the GeReSiD human scores obtain correlations with human similarity in the range [0.53, 0.18]. While some measures obtained relatively high plausibility (e.g., hso,
ρ = 0.53), others resulted in weak correlations, showing very low cognitive plausibility. The statistically-significant results at
p < 0.05 indicate
ρ in the interval [0.33, 0.53]. The top performing measures are hso, vector and vectorp, obtaining
ρ ∈ [0.43, 0.53]. The other measures obtain a considerably lower cognitive plausibility (
ρ < 0.34), indicating no convergence towards the human-generated dataset. This experiment shows the inadequacy of WordNet-based measures applied directly to this GKG and the need for a more plausible measure.
4.3. Evaluation of Network Similarity
This section reports on the evaluation we conducted to assess the network component of NLS
snet. In order to evaluate the cognitive plausibility of co-citation measures applied to GKGs, an experiment was set up following and extending the approach that we adopted in [
8]. The scores generated by the co-citation algorithms were compared with the similarity scores of the 50 pairs contained in GeReSiD, assessing their cognitive plausibility.
Network experiment setup
As discussed in Section 3.1, the recursive co-citation algorithm P-Rank includes a number of co-citation algorithms [
19], including, among others, Coupling [
20], Amsler [
21] and SimRank [
18]. To explore the performance of these network similarity measures, the following P-Rank parameters were selected:
λ (P-Rank in-out link balance): 11 discrete equidistant levels ∈ [0, 1].
C (P-Rank decay constant): nine discrete equidistant levels ∈ [0.1, 0.9].
C = 0.95 was also included, being the optimal value for the domain [
8].
K (P-Rank iterations): 40 P-Rank iterations.
These parameters resulted in 4400 unique combinations of λ, C and K. The similarity scores were then obtained for the 50 concept pairs in GeReSiD, applying P-Rank for all of the 4400 combinations. The resulting 4400 sets of similarity scores were subsequently compared with the similarity scores of GeReSiD. The tie-corrected Spearman’s rank correlation coefficient ρ was utilized to assess the correlation between machine and human-generated scores, on the 50 pair rankings without ties.
Network experiment results
The experiment resulted in 4400 correlations between co-citation similarity scores on the OSM Semantic Network and the corresponding similarity scores in GeReSiD, with p < 0.01 in all cases. All of the correlation tests were conducted on the 50 concept pairs, with a number of ties varying from zero to nine, 2.3 on average. In order to identify general trends in the results, the correlations are grouped by the three P-Rank parameters. As K increases, the similarity scores are closer to the theoretical, asymptotic value of P-Rank. In the results, the correlations quickly converge with K ∈ [1, 10], followed by a slow decline in the interval [11, 20], with K > 20, the correlations remain stable, around the mean ρ = 0.62, with standard deviation (SD) equal to 0.1.
The constant C determines how fast the similarity decays during the iterations. When C → 0, the decay is fast, while C → 1 implies a slow decay. For all of the values of C, the average correlation remains in the range [0.55, 0.62], with SD = 0.11. Low values of C ([0.1, 0.4]) correspond to the lowest plausibility in the experiment (ρ < 0.65). The best results are obtained when C ∈ [0.5, 0.9], with a peak at C = 0.8 (ρ = 0.62) and a drop when C = 0.95. The third parameter that influences the results of P-Rank is λ, the balance between in- and out-links in the semantic network. When λ = 0, only the out-links are considered, while λ = 1 includes only in-links.
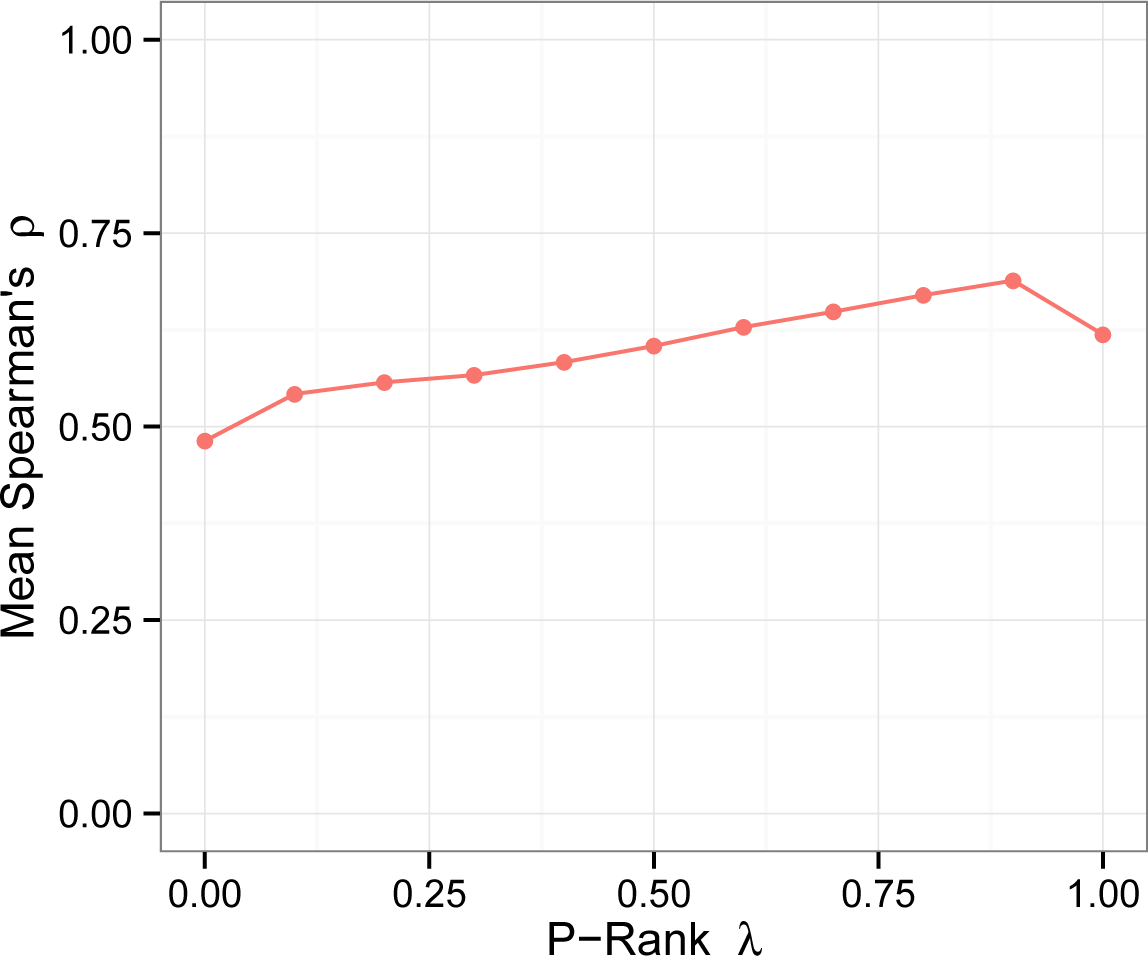
Figure 2 shows the impact of
λ on the cognitive plausibility of P-Rank. Each point on the plot represents the average of 410 correlations, falling in the range [0.48, 0.65], with
SD ≈ 0.1. The performance of the algorithms improves steadily as
λ moves from zero to 0.9, with a peak at
λ = 0.9 (mean
ρ = 0.69). When
λ = 1, the performance decreases suddenly (
ρ = 0.63), indicating that out-links provide useful information. Hence, focusing on the best approximations to the theoretical value of P-Rank (
K = 40), the most plausible results against GeReSiD are located in the intervals
C ∈ [0.5, 0.8],
λ ∈ [0.8, 0.9]. In this region, the mean correlation with the human rankings reaches
ρ = 0.73.
Table 3 summarizes the results of this evaluation, comparing the cognitive plausibility of the
snet algorithms against GeReSiD, including the results with the MDSM evaluation dataset from [
8].
Network dataset comparison
Although the GeReSiD results show substantial agreement with the MDSM evaluation dataset, differences between the two datasets exist. The optimal performance of P-Rank in GeReSiD is obtained with parameters
C = 0.8,
λ = 0.9. By contrast, the MDSM evaluation dataset is best approximated when
C = 0.9,
λ = 1, corresponding to the SimRank algorithm. The plausibility of P-Rank suddenly drops when
λ = 1 in GeReSiD, which does not occur in the MDSM evaluation dataset. This difference is due to the limited information problem that affects SimRank, as Zhao
et al. [
19] pointed out. As SimRank only relies on in-links, vertices that have only out-links cannot obtain a similarity score. The different coverage in the two datasets can also help explain these differences. While the MDSM evaluation dataset contains 29 concepts, GeReSiD covers 97 OpenStreetMap concepts, including more concepts affected by the limited information problem.
Network similarity limitations
Although optimal parameters lead to strong correlation for similarity (ρ ≈ 0.7), it is beneficial to assess the cases in which the network similarity measures show a considerable discrepancy with the human-generated rankings. When K = 40, C = 0.8 and λ = 0.9, concept pair <arts center, bureau de change> is ranked 35th in the set of 50 pairs by the human subjects, while the pair is ranked sixth by P-Rank. This wide gap is due to the high structural similarity of the two concepts, which are both linked to the key amenity, and are not densely linked to other concepts that might help the algorithm reduce their semantic similarity. The opposite case arises with two pairs <city, railway station> and <heritage item, valley>, which are ranked respectively 27th and 28th by the human subjects and are ranked 44th and 45th by P-Rank. These weak relations are not captured by the link structure in the OSM Semantic Network, and therefore, P-Rank fails to find any similarity between the pairs.
4.4. Evaluation of Lexical Similarity
This section discusses the evaluation that we have conducted on the lexical similarity component slex of NLS, outlined in Section 3.2, using GeReSiD as ground truth. This approach consists of extracting vectorial representations of the lexical definitions and then comparing them using term-to-term semantic similarity measures. The overall label-to-label similarity measure is subsequently obtained by combining the term similarity matrix using paraphrase detection techniques.
Lexical experiment setup
The experiment consists of a set of 180 combinations of the technique’s four input parameters {
POS, C, simt, simv}, detailed in
Table 4. All of the rankings generated in this phase contained no ties and were compared with the GeReSiD using Spearman’s
ρ.
Lexical experiment results
The results are summarized in
Table 5, which for each parameter reports median, quartiles and maximum
ρ. As the distributions of
ρ for the algorithm parameters tend to be heavily skewed, we adopt the median
as a robust estimator of central tendency, reporting the 25% and 75% quartiles for each parameter. As already noted in relation to the results in [
9], verbs used in isolation (POS =
VB) do not show correlation with the human dataset, resulting in
ρ ∈ [0.01, 0.16], with
p > 0.1. Similar issues apply to the
fesvector-to-vector measure, which obtained
, with
p > 0.05. Hence, these non-significant results were excluded from the analysis. For all of the other cases, the correlations were statistically significant with
p < 0.001.
Overall, the lexical component of the NLS approach to computing semantic similarity in a GKG obtains a median
, with the upper bound being ρ = 0.74. The four parameters that influence the algorithm results are {POS, C, simt, simv}. The vector-to-vector measure simv determines the strategy to compute the similarity of semantic vectors. While fes did not show satisfactory cognitive plausibility, com obtained more plausible results. The POS filter selects the terms to be included in the semantic vectors. Excluding the analysis of verbs in isolation (VB), NN and NN VBshow a very close cognitive plausibility
. The text corpus C is utilized to assign semantic weights to the terms. The cognitive plausibility obtained by the Null and OSM Wiki corpora is largely comparable
. By contrast, the corpus extracted from the Irish Independent, containing news stories, outperforms the other corpora, resulting in a higher cognitive plausibility
, showing that the non-domain-specific corpus supports the computation better than a domain-specific corpus.
The fourth parameter, which has a high impact on the results, is the term-to-term measure simt. Measures vector, path, lch and hso fall in the top tier, with an upper bound ρ≥0.7 and a median
. All of the other measures perform in a less satisfactory way, with a lower median in the interval [0.48, 0.6] and an upper bound ρ ∈ [0.56, 0.66]. After the top cluster of these four term-to-term measures, the performance drops visibly, reaching a minimum with lin (median ≈ 0.47, upper bound ≈ 0.55). The other measures (wup, res, lesk, vectorp and jcn) fall between the top four, reaching intermediate results. The lexical similarity measures slex outperform the basic WordNet-based measures, with an upper bound ρ = 0.74). The top performance is reached with the following parameters: POS = NN, C = Irish Indep, simv = com, simt = {vector, path, lch, hso}). In such cases, the cognitive plausibility ρ falls in the interval [0.61, 0.74], showing a statistically-significant strong correlation with GeReSiD.
Lexical dataset comparison
Table 5 includes the median
that we obtained with the MDSM evaluation dataset in [
9]. The cognitive plausibility obtained in these two evaluations shows common trends, but also a divergence for certain parameters. This fact is consistent with the evaluation of network similarity, in which co-citation approaches performed better on the MDSM evaluation dataset than on GeReSiD. This difference is mostly due to the structure and coverage of the MDSM evaluation dataset (29 concepts structured in five sets) and GeReSiD (97 concepts in one set). While the overall trends in the two experiments on lexical similarity are consistent, the effect of individual parameters {
POS, C, simt, simv} varies.
In particular,
simt have a major impact on the cognitive plausibility of the algorithm. A high variability can be noticed between the two experiments, which is not uncommon in the literature on semantic similarity. In a study by Budanitsky and Hirst [
38], measures
jcn, hso, lin, lch and
lesk obtain very different cognitive plausibility against two well-known similarity datasets. The measures that reach the top overall performance are
lch, path, vector and
hso, with upper bounds in the range [0.72, 0.75]. The other measures rank lower, falling in the interval [0.62, 0.69]. It is possible to notice that, although more complex measures can obtain optimal results in certain contexts, simpler shortest path-based measures, such as
path and
lch, tend to perform more reliably across the two datasets.
Lexical similarity limitations
Although slex can reach high plausibility, specific cases show high discrepancy with the human-generated similarity judgments in the set of 50 concept pairs in GeReSiD. Focusing on the best case (POS = NN, C = Irish Indep, simv = com, simt = vector, with ρ = 0.74), it is possible to observe that the pair <sea, island> is ranked 24th by human subjects and eighth by the algorithm. The definitions of these two concepts have large lexical overlap, but they are highly related (eighth in the relatedness ranking) and not similar. In this case, the algorithm mistakes relatedness for similarity.
Furthermore, <battlefield, monument> is ranked 10th by the human subjects, and only 36th by the algorithm. The concepts’ labels share only one term (military), and the other terms do not increase their similarity. Analogously, the similarity of <industrial land use, landfill> is underestimated, as it is ranked 21st by humans and 47th by the algorithm. The reason for this wide mismatch lies in the fact that the label of landfill is extremely short (“where waste is collected, sorted or covered over”) and does not contain terms that would allow the algorithm to capture some degree of similarity with the context of industrial production and waste processing. These limitations can be overcome by combining snet and slex into a hybrid measure, as shown in the next section.
4.5. Evaluation of Hybrid Similarity
As stated in Section 3.3, two methods can be used to combine snet and slex into a hybrid measure: a score combination ssc and a rank combination srk. This section describes an empirical evaluation of these two combination techniques, showing that the cognitive plausibility of such hybrid measures is generally higher than the individual network and lexical measures, supporting the intuition behind NLS.
Hybrid experiment setup
To explore the effectiveness of score and rank combination methods, a cognitive plausibility experiment was set up using GeReSiD. The most plausible cases were selected for network
snet and lexical measures
slex, based on the empirical results shown in Sections 4.3 and 4.4. As we are interested in assessing whether the combination methods are able to improve the results at the top of the range, the selection is restricted to the top 30 cases for both approaches, as a representative sample of the network and lexical measures. These top cases are not statistical outliers, but accurately reflect general trends in the empirical evidence collected in the aforementioned experiments. The experiment was set up with the following input parameters:
Combination methods: score combination ssc and rank combination srk.
Combination factor α: ten discrete equidistant levels ∈ [0, 1]. When α = 0, only the lexical measure is considered; α = 1, on the other hand, corresponds to the network measure.
Network similarity snet: 30 most cognitively plausible cases when compared with GeReSiD.
Lexical similarity slex: 30 most cognitively plausible cases when compared with GeReSiD.
For each value of α, each case of snet and slex were combined through ssc and srk. This resulted in the cognitive plausibility of 18,000 hybrid measures on the 50 concept pairs of the GeReSiD, with p < 0.001 for all of Spearman’s correlation tests, with no ties in the rankings. A hybrid measure is considered successful if it outperforms both its components snet and slex, i.e., the cognitive plausibility of the hybrid measure is strictly greater than network and lexical similarity, formally ρhyb > ρnet ∧ ρhyb > ρlex. If the hybrid measure is lower or equal to any of its components, it has failed.
Hybrid experiment results
Clear patterns emerge from the experiment results. Hybrid measures, combining network and lexical similarity, show a consistent advantage over their network and lexical components. The ranking combination
srk performs consistently better than the score combination
ssc, obtaining higher plausibility and success rate.
Table 6 summarizes the experiment results, contrasting the upper bound of
ρ obtained by
net and
lex measures in isolation, and
hyb when combined. The cognitive plausibility of hybrid measures is substantially greater than the individual measures, with a peak at
ρ = 0.84 when
α = 0.5. This empirical evidence points out that the optimal value of
α tends to fall in the interval [0.4, 0.6], drawing information evenly from the network and lexical components.
The success rate, expressed as a percentage, indicates in how many cases a hybrid measure outperformed both of the individual measures. As it is possible to notice in
Table 6, when
α ∈ [0.4, 0.6], the success rate is very high, in the interval [87.5%, 100%]. In particular, the rank combination
srk outperforms all individual measures (100%). High success rates are also observable when
α ∈ (0, 0.4), with an average success rate of 82.9%. At the other end of the spectrum (
α ∈ (0.6, 1)), the average success rate is 75%. In none of the cases under consideration was a hybrid measure lower than both its components.
The success rates reported in
Table 6 show that, overall, both components strongly contribute to the cognitive plausibility of NLS. In particular, when using ranking combination
srk with optimal values of
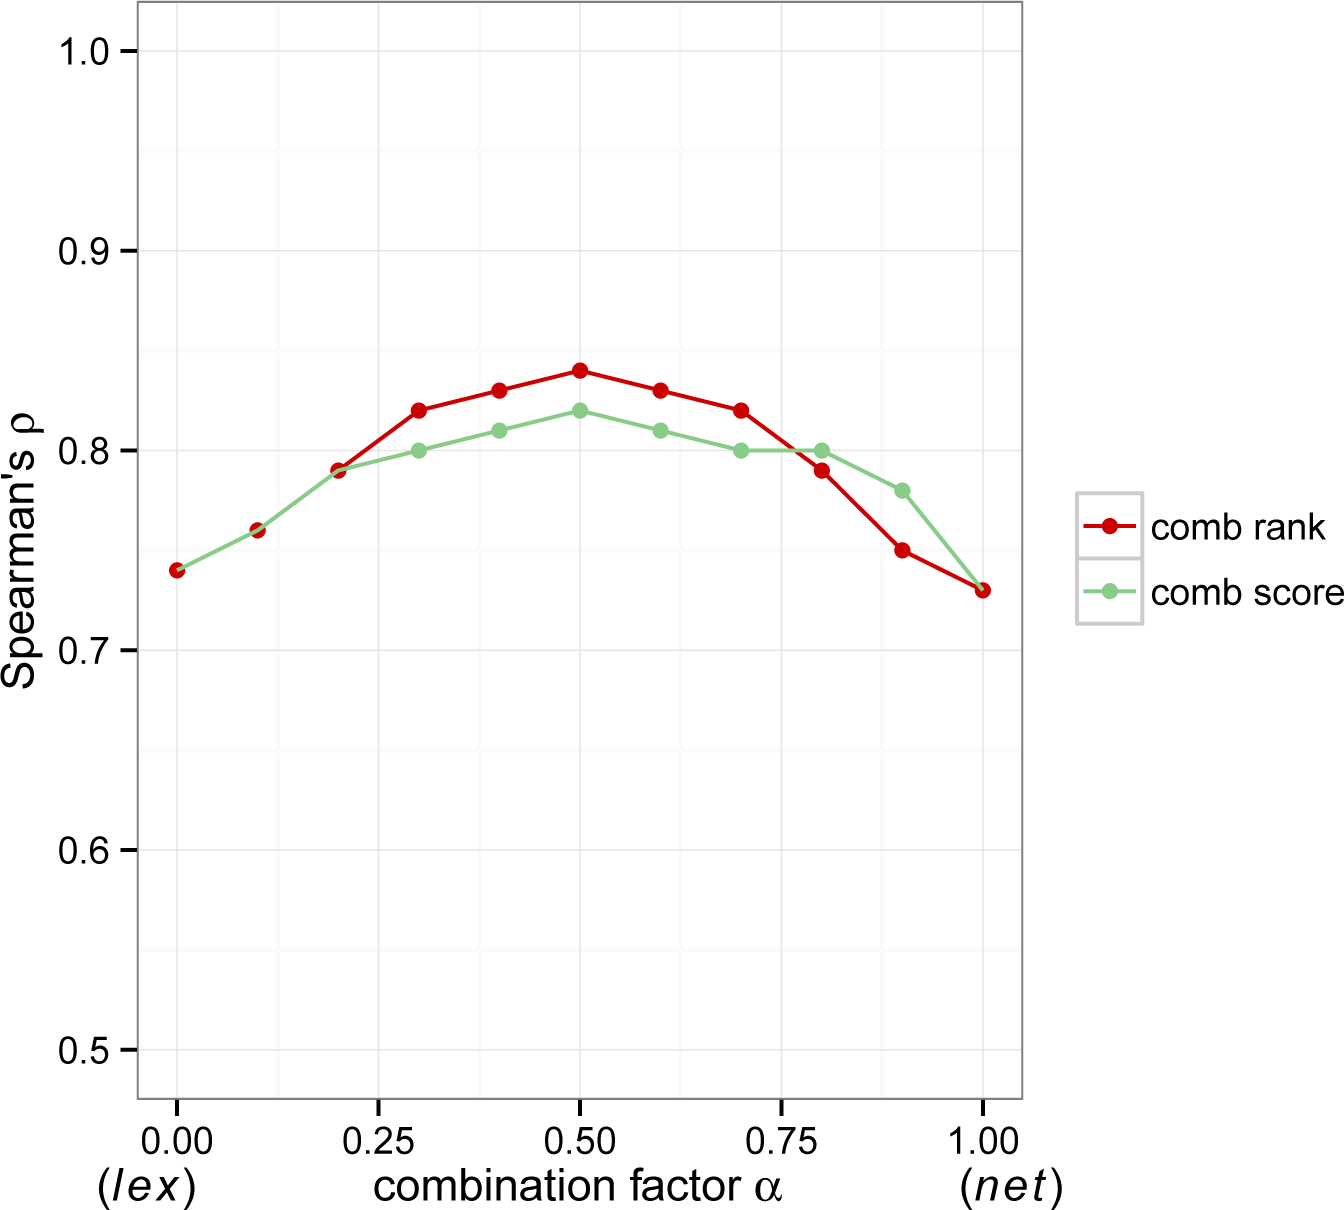
α, the hybrid measures obtain a success of >89%. The performance of NLS is depicted in
Figure 3, highlighting the impact of
α on the cognitive plausibility, adopting the two combination techniques (
ssc and
srk). The roughly symmetrical bell-shaped curves in the figure display the benefit of the hybrid measures (
α ∈ (0, 1)) over the individual measures, at the extremes of the horizontal axis (
α = 0 corresponds to lexical measures,
α = 1 to network measures).
Hybrid similarity limitations
Considering the best hybrid measures (
α = 0.5), it is possible to observe changes with respect to the rankings generated by individual measures. Only in one case do the hybrid measures fail to improve on the previous measures, ranking <
sea, island> fifth (see
Table 2 for a comparison with human rankings). In all of the other cases discussed above, the hybrid measures provide more cognitively plausible rankings: <
arts center, bureau de change> (15th), <
city, railway station> (19th), <
heritage item, valley> (28th), <
battlefield, monument> (29th), and <
industrial land use, landfill> (44th). In summary, the hybrid measures cannot fully overcome the limitations intrinsic to the data source, but they succeed, on average, in bringing the rankings closer to human judgments. Based on this body of empirical evidence, the hybrid approach is the most suitable to compute semantic similarity in GKGs.
5. Conclusions
In this article, we described network-lexical similarity measure (NLS), a measure designed to capture the similarity of concepts in GKGs, knowledge-representation structures used to represent concepts and their relations. The evaluation on the OSM Semantic Network confirmed the benefits of combining network similarity and lexical similarity into a hybrid measure, obtaining higher cognitive plausibility. Compared with the upper bounds for network measures (
ρ = 0.73) and lexical measures (
ρ = 0.74), hybrid measures reach a considerably higher upper bound (
ρ = 0.84). In order to provide practical guidelines,
Table 7 summarizes the optimal results of the network, lexical and hybrid measures.
Although NLS obtains high cognitive plausibility, overcoming the intrinsic issues of network and lexical similarities, some limitations remain to be addressed in future research. The network measures
snet that we included in this study have cubic complexity, and substantial spatio-temporal optimization is needed to apply them to large GKGs [
39]. In relation to
slex, the paraphrase-detection techniques utilized in the lexical component need optimizations to be applicable on a very large scale. In addition, WordNet has limitations in coverage and biases. The method described in
slex utilizes a bag-of-words model for the terms in the lexical descriptions. However, in many cases, the most important terms tend to be located at the beginning of the descriptions, and taking the term order into account might improve the results, especially in cases of very long and noisy lexical definitions. Furthermore, fully-corpus-based measures could be utilized in
slex to overcome NLS to increase its coverage, at the expense of some precision.
From a more cognitive viewpoint, the main limitation of NLS lies in the lack of a precise context for the computation of the similarity measure, as illustrated by Keßler [
40]. Other limitations affect the evaluation of cognitive plausibility that we have adopted in Section 4. Human subjects grasp semantic similarity intuitively, but the translation of a similarity judgment into a discrete number can be highly subjective, limiting the inter-rater agreement and the generalizability of the results [
41]. In this article, we evaluated NLS on its ability to simulate human judgments on the entire range of semantic similarity,
i.e., from very similar to very dissimilar concepts. However, many similarity applications need specifically the top-
k most similar concepts to a given concept, rather than the least-similar concepts. Given that no cognitive plausibility evaluation is fully generalizable, robust evidence can only be constructed by cross-checking different evaluations. For example, complementary indirect evaluations could focus on specific similarity-based tasks, such as word sense disambiguation and information retrieval. The approach to semantic similarity adopted in NLS can be extended to computing measures of relatedness, which have vast applicability [
38].
Our evaluation focused on the OSM Semantic Network as a GKG. While this semantic network shows typical characteristics of GKGs [
8], it is restricted to a very specific domain. Others GKGs suitable for the evaluation of NLS might be YAGO, DBpedia and other linked open datasets [
5]. Moreover, the general text corpus we used presents a regional bias, and larger, more global corpora might further improve the results. However, cognitive plausibility evaluations on large, domain-independent GKGs are difficult to design, and a trade-off between domain-specificity and result reliability has to be considered. This future work will strengthen the role of NLS as a generic approach to tackling the challenge of the computation of semantic similarity, in ubiquitous GKGs, which increasingly contain valuable knowledge that complements that of traditional geographic datasets.


