Abstract
This article explores the integration of GIS technology with urban historical studies, focusing on one case study from the 18th century, the project Historical atlas of the modern Rome. The methodology employed in this project allows for effectiveness and accuracy in historical data acquisition and integration, which enables refined analyses of socioeconomic and environmental phenomena. The approach outlined in this article allowed researchers from different disciplines—city historians, archaeologists, demographists, economists, and so on—to interpret urban phenomenologies according to different thematic keys. These interpretations were derived from archival sources that complement each other and offer diversified insights into the urban context. The techniques described in the article are based on methods of data acquisition and spatial analysis developed in a GIS environment by exploiting the effectiveness of this technology in the quantitative treatment of cartographic and documentary sources.
1. Introduction
Spatial humanities is an expanding research field within historiography [1]. Research in this discipline exploits the Geographical Information Systems (GIS) as one of the key methods for data handling, analysis and representation. Today’s spatial humanities draw on the experience of archaeology, where these methods were applied quite early, and historical geography, which has a long tradition of interdisciplinary study. Indeed, the so-called ‘spatial turn’ in historical studies [2,3] during the last few decades has stimulated integration between traditional and new research trends, obtaining often complex, but generally promising, results. In this context, the spatial component has acquired a stronger meaning, also due to the increasing awareness towards historical maps as digital cartographic supports. The possibility of integrating into a single digital platform historical sources of a different nature and origin, as well as to manage, compare and share huge amounts of information, imply the need to adopt innovative solutions. Thus, new insights, concepts and models have found application in numerous historical GIS (HGIS) projects [4]. There is no doubt that these developments bear important consequences in the field of historical research, in general, and urban history, in particular [5,6,7]. The application of logical-mathematical theory to the data structure deeply influences both the methodology of the approach to the sources and the logic of their treatment, which becomes necessarily formal [8].
In historical applications, GIS is often considered a computer program to be used as a support for visualization purposes. However, GIS is a technology. As such, it is a synthesis of hardware, software, data, personnel and protocols combined into a single paradigm, which has its power and main distinguishing features in geo-spatial analysis. GIS provides the mechanisms to allow historical data from different sources to interact and create new information. How would it be possible to integrate this complex technology within a discipline that has its own, long-standing and consolidated epistemology?
The application of GIS in urban history is subject to severe limitations, such as high levels of uncertainty related to the localization of events in space and time [9,10] and imprecise source data [11,12,13]. The latter is greatly accentuated when using GIS techniques that ‘constrain’ data to levels of precision that generally exceed those ‘naturally’ derivable from historical sources. Uncertainty in a GIS environment is treated differently when compared to historical research: GIS experts use quantitative measures based on statistical models, while historians evaluate source characteristics, their potentiality and limitations, mostly qualitatively, according to experience and knowledge of similar sources and of the historical context [14,15,16]. Nevertheless, finding solutions that suit different necessities is, most often, possible [1,17]. In this regard, the use of GIS in historical studies requires the specific and careful evaluation of every single case, strictly depending on the characteristics of archive sources to be integrated into the system [18].
Gregory et al. (2001) motivate the use of GIS in historical studies: data of different natures can be easily integrated through their location on the Earth’s surface; visualization of research outputs is more effective and enduring, thanks to advanced techniques, such as animation and virtual landscapes; GIS enables forms of spatial analysis where the coordinate locations of the features under study are an explicit part of the analysis [19].
The wealth of research on HGIS includes, amongst others, papers that introduce national historical GIS systems, such as those of Great Britain, Belgium, the United States, Russia, China, South Korea and Germany [20,21,22,23,24,25,26,27,28], and a multitude of papers covering, at different spatial and temporal scales, topics, such as demography, landscapes and land uses, economic activities, industrial development and transport networks [29].
However, scientific literature on urban HGIS is not very common. This is not surprising. The urban space, as a container of knowledge, traditions, memories and images, embodies complexity levels that are difficult to fill by historical sources. The need for maps that depict the urban structure with an elevated level of detail, as well as for spatially homogeneous descriptive sources, makes the implementation of spatial databases more difficult. Nevertheless, there are documented examples of the extensive use of HGIS at the urban level: the Social atlas of London in the 17th century [30], the project on health in 19th century London, based on Charles Booth’s inquiry [31], the Urban history of Tokyo [32], the Timemap of Sidney [33], the Virtual Kyoto project [34], the Atlas des Parisiennes [35] and trading places in London, Canada [36]. These examples show, in their diversity of intents, the versatility of GIS methods in supporting urban history research.
This paper discusses the use of eighteenth-century cartographic and documentary sources for the purpose of analyzing the characteristics and the transformation of the urban fabric of Rome within the Aurelian walls. The UNESCO site of Rome’s historical city center is universally known as a unique man-made landscape. For this reason, in-depth study of urban and archaeological heritage becomes a compelling need when physical transformations, albeit on a small-scale, “undermine” its integrity. Arising problems are closely related to the exceptional extension, stratification and density of Rome’s historical evidence. Moreover, the singularity of Rome should be considered within a national planning framework, dominated, since the second half of the 20th century, by the concept of the comprehensive preservation of built-up heritage. In this context, knowledge of the past becomes crucial for the management of the present.
The methodological aspects and the analytical results illustrated in this paper are taken from the project, Historical atlas of the modern Rome, promoted by CROMA, University Roma Tre. This project, started in early 2000s, is part of a wider platform devoted to the multidisciplinary study of Rome, which includes the use of information technology and geostatistical methods applied to urban history. It is intended as a laboratory, where researchers from different disciplines come together for a discussion to identify pertinent data and methods for the study of this extraordinary urban environment. Emerging projects are the result of a careful study of historical sources; strengths and limitations in terms of completeness, precision, accuracy and capacity for integration with other sources, are analyzed, on a case-by-case basis, thus evaluating their eventual ‘digital exploitation’. Specific methods of data acquisition, processing and analysis are developed for every single project, according to the identified historical sources and taking advantage of the experience accumulated in previous studies. Great importance is given to the dissemination of results, which, as for the case of the project, Historical atlas of the modern Rome, includes a Web-GIS application to be publically released by the end of 2014, besides the printed version of the academic research [37].
2. The Cartographic Source
In the eighteenth century, the evolution of measurement techniques based on trigonometric calculations and the codification of topography as an applied science in different European States resulted in the progressive substitution of traditional bird’s eye views with geometrically correct ichnographic representations of cities [38]. The existence of precise and reliable cartographic information represents an analytical benchmark for the discipline of urban history. It makes the use of modern information techniques possible for analyzing the urban structure and its formal and functional contents from a “geographical-thematic” perspective.
The project takes advantage of the geometric precision and the descriptive detail characterizing the “Nuova pianta di Roma”, published in 1748 by Giovanni Battista Nolli (Figure 1), in order to study the city of Rome in the 18th century and its transformations. It is the first geometrically correct bi-dimensional representation of the city characterized by an exceptionally high level of accuracy and detail. The map is expressed in Roman palms of architecture, corresponding to the scale 1:2910 in the metric system, and is divided into twelve sheets. The Nuova pianta represents a watershed for Rome’s cartography, as Nolli was the first cartographer to orient his map towards the north. He was able to make a clean cut with Rome’s traditional cartographic orientation to the east, suggested by the comfortable observation point of the city located on Gianicolo Hill. In his work, Nolli does not really observe Rome from any specific point of view: he walks through streets, alleys, gardens or vineyards, measuring angles and distances homogeneously, and transferring everything that can be measured to the preparatory drawing (disegno preparatorio)—buildings, fountains, ruins, walls, streets, gardens, embankments, shores, and so on—with an incredible level of detail.
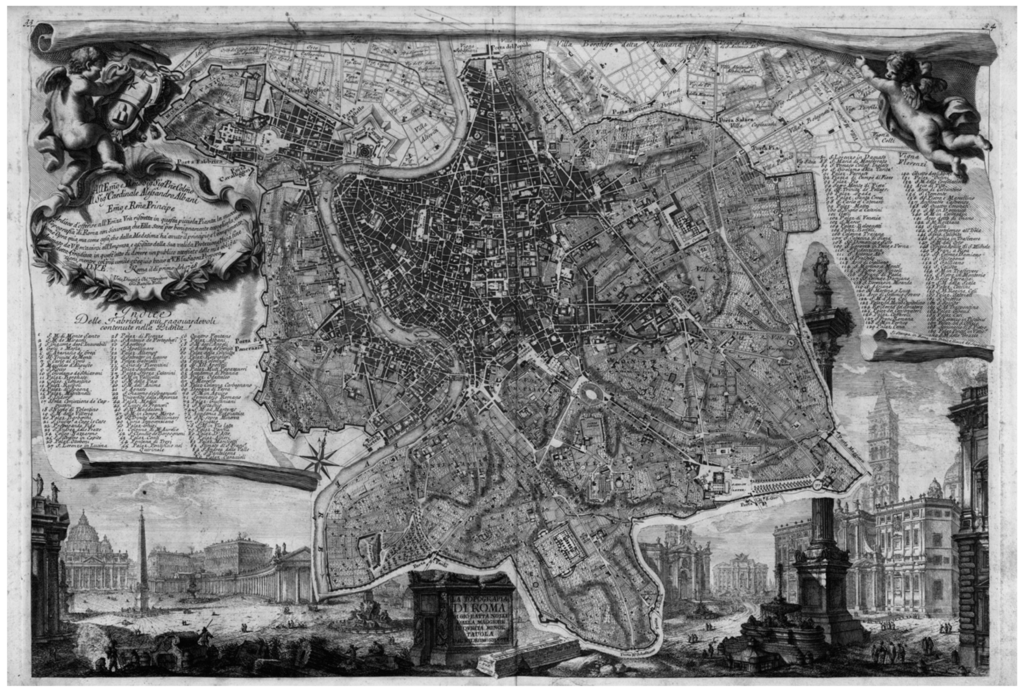
Figure 1.
Nuova pianta di Roma by G.B. Nolli, 1748.
The north-south orientation refers to the so-called “meridiana della Certosa”: an accurate sundial north-south line, inlaid in the marble floor of the church of S. Maria degli Angeli (in the Baths of Diocletian). The line was drawn in 1702 for the purpose of precisely determining the equinoxes used for fixing the Easter day of the Catholic Church [39]. Nolli was able to make his sightings refer back to this baseline or to parallels thereof placed in other parts of his drawing. This technique, coupled with the triangulation of prominent city features, such as obelisks, towers and domes, along the axis of Via del Corso, and with the use of the tavoletta pretoriana, allowing for fast and precise on-site drawings, enabled Nolli to obtain the accuracy for which his plan became famous all over Europe [40,41,42,43].
The accuracy of the Nuova pianta by far exceeds that of earlier maps of the city. It is widely known that the map served as a basis for all successive representations of Rome until the advent of the “conceptually different” aerophotogrammetric cartography. Geometric accuracy is not the only attribute of this map. It really stands out because of its wealth of detailed information. Cartographic symbols are intuitive and easy to understand: dark grey hatching for the modern building fabric and white for open space. Ancient monuments are rendered in black, indicating extant ruins, while a white outline suggests hypothetical plans of ancient monuments that no longer exist. A series of textured elongated lines are used to indicate the slopes (contours were not in common use until the turn of the 19th century). Open spaces (gardens, vineyards, orchards, and so on) are carefully rendered with different textures. Various cartographic symbols are used to indicate features that would otherwise be difficult to convey. These include drains, soldiers’ billets and apertures in the Aurelian wall circuit and cemeteries. Pictorial elements are used to represent river craft, which includes ferryboats with tethering lines, cargo craft and water mills (Figure 2).
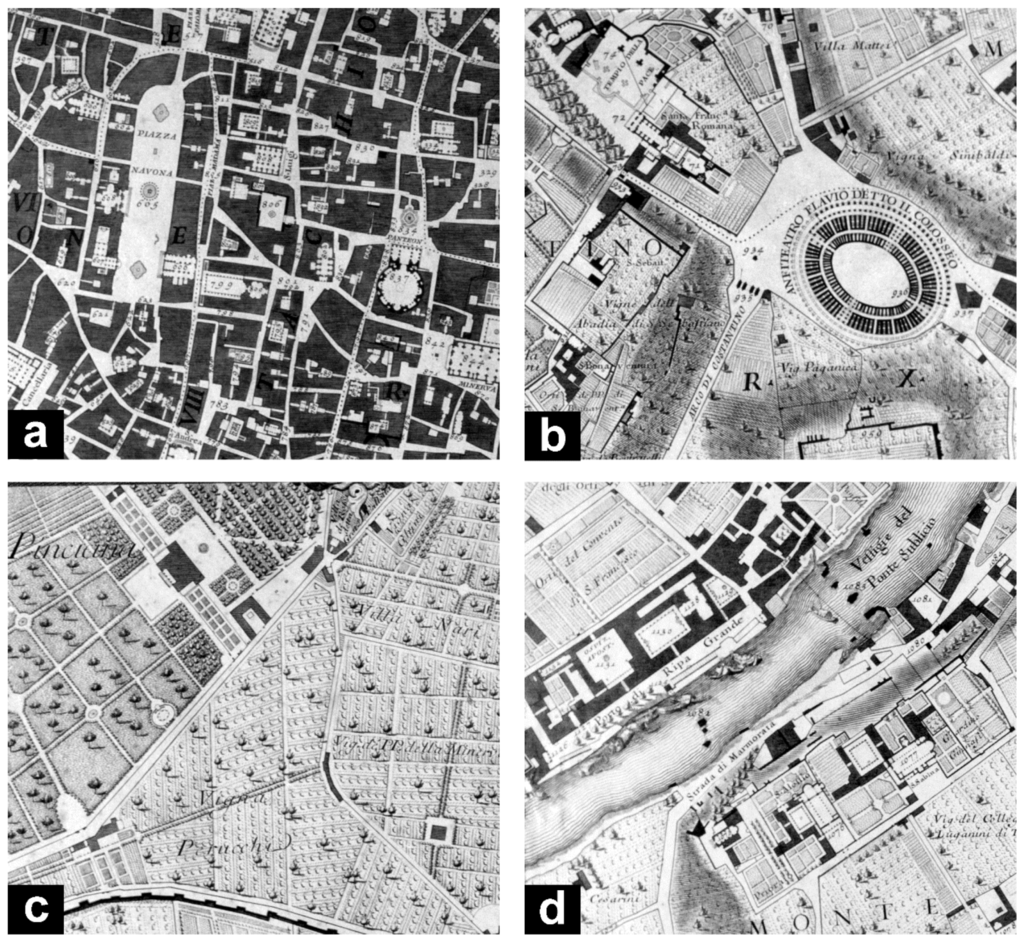
Figure 2.
Details of the map: (a) building blocks; (b) archaeology; (c) open spaces; (d) pictorial elements.
The Nuova pianta can be considered as exhaustive evidence of the image of Rome after the great urban development of the Renaissance and Baroque periods. Its planimetric detail and the indexing of all ‘important’ buildings offer a thorough overview of the eighteenth century city’s form and functions.
3. The Approach
The principal aim of the project is to study the historical environment of the city. This is achieved through the development of an analytical tool in GIS environment that is capable of integrating cartographical and descriptive historical sources to produce new information on the physical and socio-economic characteristics and on the transformations of the territory. In this context, the principal assumption was made that databases of different origin can be associated to the historical cartography of the same period. This assumption implies the transformation of historical cartographies of different epochs in “spatial containers” that would “host” thematic information derived from auxiliary historical sources.
In the case of the HGIS of Rome in the 18th century, we can rely on a cartographic product characterized by a remarkably high level of spatial accuracy that was repeatedly confirmed across 250 years. As we have seen in the previous paragraph, this exceptional accuracy is the result of a campaign of topographic measurements. The Nolli map is known to be the geometric frame of all successive large-scale cartographic representations of Rome, until the advent of cartographic products based on aerophotogrammetric surveys.
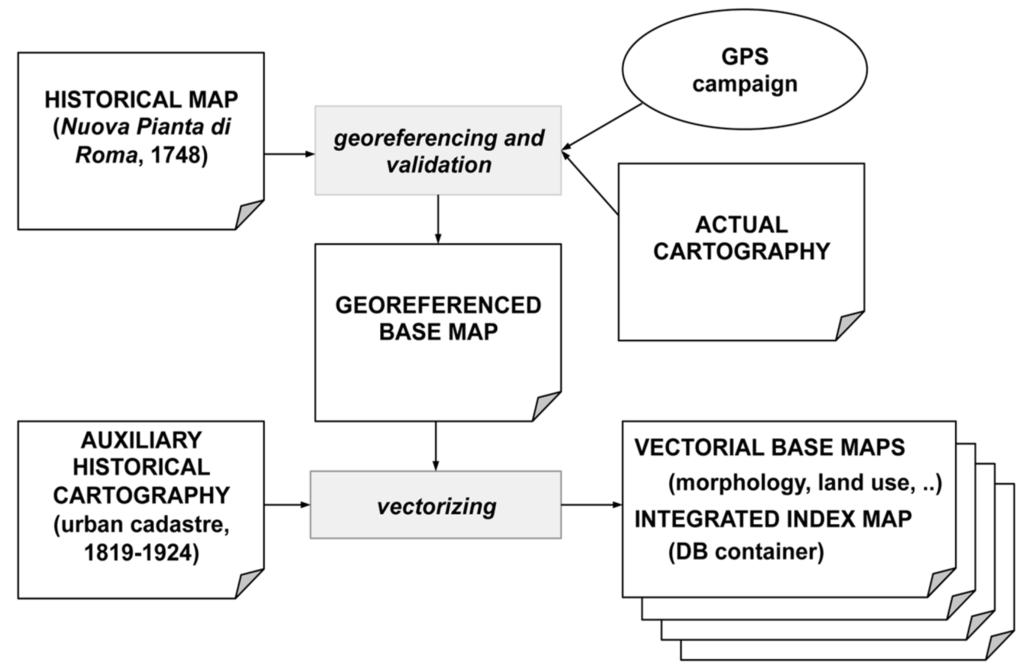
Figure 3.
The historical GIS (HGIS) based on the Nuova pianta di Roma by G.B. Nolli, 1748.
Our approach constitutes a conceptually different example of a city historical atlas if compared to other European projects that use, in most cases, cadastral maps dating to the 18th or 19th century as the basis for the topographical representation of the urban environment [44]. The use of one single cadastral base map suggests that analysis of phenomena occurring in previous or successive epochs should be conducted by modifying the base map according to other pertinent historical sources. This approach, in accordance with the guidelines of the International Commission for the History of Towns, is at the bases of different applications developed since the nineteen nineties, [45,46,47,48,49,50], and it is fully justified if we consider that cadastral maps represent, in most of the cases, the smallest scale representation of a city and are the only ones depicting the shape of every single building. In addition, operating on the same base map makes diachronic analysis easier. On the other hand, cadastral maps are not topographic maps. Their goal is to show the property system of the mapped area; for this reason, the cartographic representation is often too schematic. Topographic features are generally not shown, unless they represent specific information of a property.

Table 1.
Historical sources and their use in the Atlas of modern Rome.
| Level of Analysis | Final Product | Information Derived from the Nollli’s GIS | Information Derived from Additional Sources | Integrated Sources |
|---|---|---|---|---|
| Physical environment | Morphology of the city centre | Approximation of buildings heights | DEM of Rome’s city centre | IGM, Carta topografica d’Italia, 1:25.000, 1890 IGM, Carta topografica di Roma e dintorni, 1:5.000, 1912 |
| City image | Illustrative and descriptive files attached to each indexed building, street and square in the GIS of Rome in the 18th century | Indexed buildings, squares and streets | Database of the iconographic material of the most important features of the urban landscape, derived from the major coeval iconographic products depicting the image of the city | G. Vasi, Delle magnificenze di Roma antica e moderna, I-X, 1750–1760; G. Falda, Il nuovo teatro delle fabbriche et edificii in prospettiva di Roma moderna, I-III, 1665–1739; G.B. Piranesi, Varie vedute di Roma Antica e Moderna, 1741–1748; Antichità Romane, 1756 A. Pinelli, Acquerelli, 1832–1835 |
| Population | Population structure in parishes, in 1748 | Administrative units: parish limits | Database of the population structure in the parishes | Stati delle Anime, 1748 |
| Archaeology | Description of the archaeological vestiges of Rome in the 18th century | Indexed archaeological vestiges and other objects, identified as archaeological in the Preparatory Drawing and from the integrated source | Database of the archaeological objects | G.B. De Rossi, Note di ruderi e monumenti antichi prese da G.B. Nolli nel delineare la pianta di Roma, conservate nell’Archivio Vaticano, «Studi e documenti di storia e diritto», IV, 1883; G.B. De Rossi-G. Gatti, Note di ruderi e monumenti antichi prese da G.B. Nolli nel delineare la pianta di Roma, conservate nell’Archivio Vaticano, «Studi e documenti di storia e diritto», V, 1884. |
| Lost urban heritage | Description of the urban heritage of the 18th century, lost in successive periods | Indexed buildings, squares and streets | Database of the demolished buildings, streets and squares | Bibliographic research |
As far as it concerns the case of Rome, it appears that, unlike the Nuova pianta, the urban cadastre of the city dating to 1818–1824, was not based on a topographic campaign of measurements. Archive documents have revealed that the Roman architects, Salvi and Palazzi, members of the S. Luca Academy, in charge of the mapping project, instead of planning a measurement campaign of the city, preferred to take advantage of the Nuova pianta di Roma of 1748 by Giovanni Battista Nolli “introducing all the necessary corrections and integrations where […] any transformation might have occurred” [51]. Thus, the work started at the drawing table, by enlarging Nolli’s map to a 1:1000 scale. This procedure was then followed by fieldwork, necessary for the subdivision of the building blocks into cadastral units. The cartographic product resulting from these operations is a typical representation of parcels, in which the wealth of topographical elements characterizing the cartographic representation of Nolli’s map is lost.
The above-mentioned considerations, coupled by a series of controls on the accuracy of the two cartographic sources [52,53], brought about the choice to use Nolli’s map as a cartographic basis for the atlas of Rome in the 18th century, considering it as the best cartographic source, limiting the use of the urban cadastre as an additional compatible source containing information on the shape of the buildings. The Nuova pianta was then georeferenced and vectorized according to the criteria described in the following paragraphs. Figure 3 illustrates the workflow of the methodology adopted to create the historical GIS.
It is maybe worth mentioning that the maps of the urban cadastre have undergone a similar procedure of georeferencing and vectorization and constitute the GIS container for the atlas of Rome in the 19th century, promoted as well by CROMA, and, at present, under construction [18].
Once the GIS container is created, our methodology implies the integration of other data from coeval documentary and iconographic sources. Table 1 refers to some fully-integrated features within the HGIS of Rome in the 18th century and the respective historical sources that are at the bases of new information levels. The thematic applications developed as a result of this integration are described hereinafter.
4. Informatization Criteria
Notwithstanding the remarkable precision characterizing much of the historical cartography produced during the 18th and 19th centuries, much of it features metric errors superior to those conventionally accepted at present. The GIS techniques of calibration, georeferencing and transformation of projection makes the comparison between historical and actual cartographies possible, if we consider that the effects of the deformation of the paper support and those due to the different systems of representation and measurement can be reduced.
Georeferencing of historical maps can be done by calculating the coordinates of well-identified cartographic elements. The fastest way to determine these coordinates is by retrieving them from actual cartographies on which the same elements are visible. The procedure of “tying” historical cartography to the modern one permits the local estimation of the error and guarantees control over the georeferencing accuracy, which is necessary for the eventual redefinition of the control points.
The cartographic error of georeferenced historical maps is due to different causes, requiring detailed examination in order to evaluate its influence on the overall accuracy of the final product. The main causes of cartographic error are identified as follows:
- (1)
- deformations of the historical cartography due to problems related to the conservation of the original support and to the different projection (if any);
- (2)
- historical survey error, that is the propagation of rough errors along the survey network;
- (3)
- historical error of representation, due to the presence of non-existent details, added to the map for aesthetic reasons;
- (4)
- contemporary error of interpretation, related to the lack of detailed and uniformly distributed information on unchanged morphological features;
- (5)
- contemporary cartographic error, or rather, the inaccuracy and imprecision of contemporary cartography.
As far as it concerns the Nuova pianta, superimposition between the preliminary georeferenced historical map and actual cartography showed systematic errors occurring in different areas. This suggested the presence of ‘historical survey errors’, caused by the propagation of imprecise measurement values within the survey network. The major discrepancies remained, however, within an error level of approximately four meters. In addition, the georeferencing accuracy was affected also by the fact that official contemporary cartographies of the study area were, at the time of the project implementation, less accurate if compared to the scale of the historical map. Moreover, different cases of wrong cartographic details were identified (Figure 4).
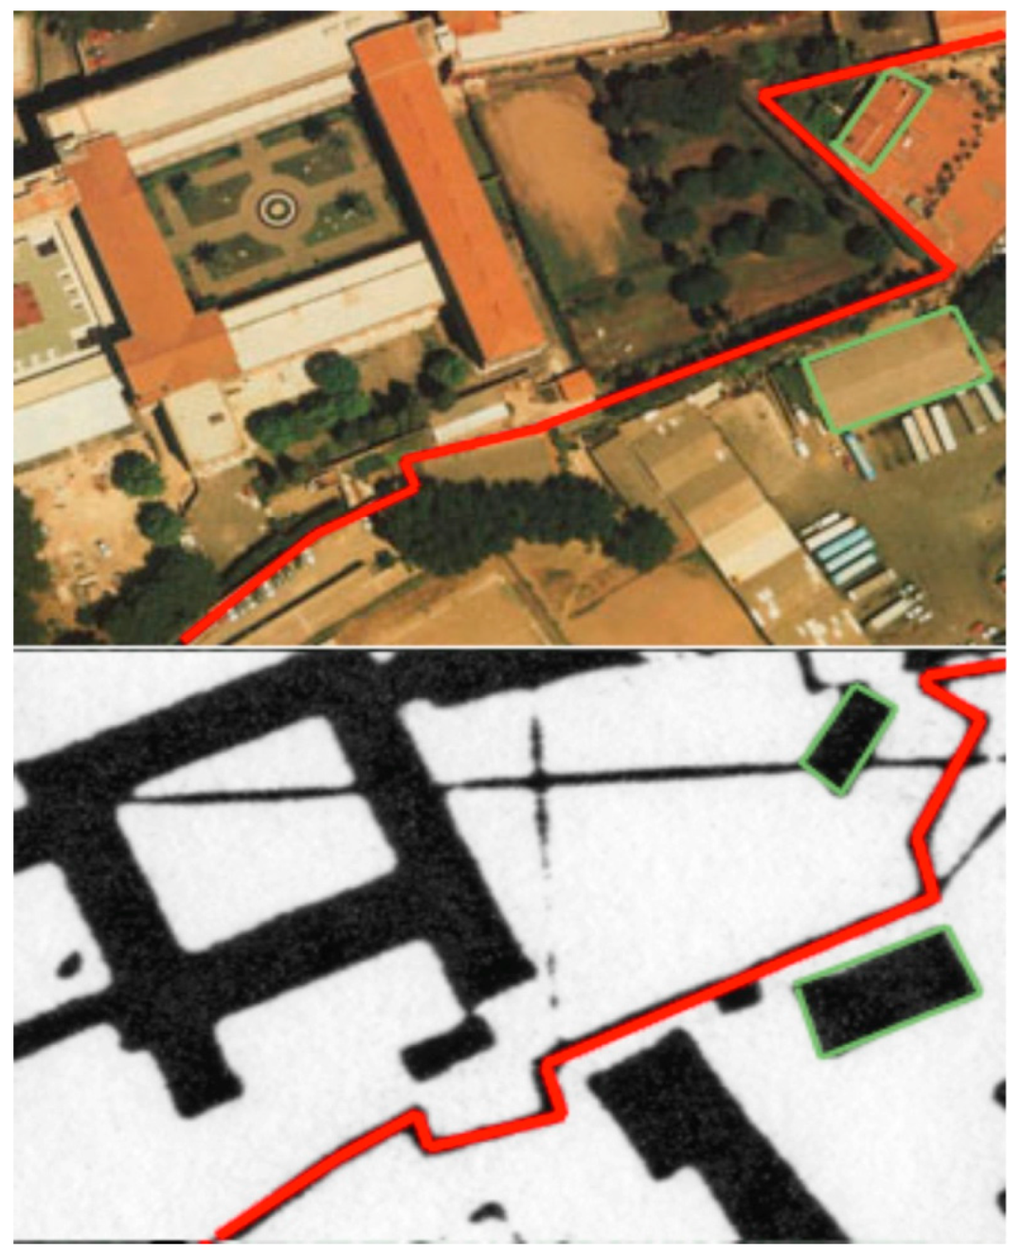
Figure 4.
Contemporary cartographic error. Aurelian walls (San Giovanni). Aerial photograph showing the real trace of the walls (white line) (top); The Regional Technical Map of Lazio, showing a wrong trace (bottom).
For these reasons, a differential GPS survey was planned for the purpose of ‘positioning’ the historical map in an absolute reference system. In the first stage, the localization of ‘correctly measurable’ points on the historical cartography was carried out. The most suitable points are those incorporated within building bodies (for example, building corners). Fountains or obelisks that may have been subject to modifications or rearrangements were considered less suitable. To guarantee good GPS coverage, building corner coordinates must be measured by accessing the top of the building. This may involve logistic problems. The first differential GPS network comprised eighteen suitable points, distributed as uniformly as possible over the city center. This enabled a preliminary evaluation of the statistical shifting parameters. The geo-referenced map, carried out by applying a first degree polynomial transformation based on these points, has given satisfactory mean residual values (Table 2).

Table 2.
Residuals of the first degree polynomial transformation applied to the historical raster map based on the GPS points.
| ID | 1 | 2 | 3 | 4 | 5 | 6 | 7 | 8 | 9 | 10 | 11 | 12 | 13 | 14 | 15 | 16 | 17 | 18 | Quadratic Mean |
|---|---|---|---|---|---|---|---|---|---|---|---|---|---|---|---|---|---|---|---|
| Residual x (m) | −7.5 | 2.6 | 2.5 | −3.3 | 1.4 | 0.3 | 0.8 | 2.0 | −0.9 | 3.6 | −7.1 | 1.2 | −0.5 | 0.3 | 0.3 | −0.2 | 1.8 | 2.8 | 0.7 |
| Residual y (m) | −5.2 | 3.1 | 0.0 | −1.2 | 5.3 | −2.7 | −3.5 | −2.6 | −0.9 | −0.5 | 0.6 | −2.4 | −1.1 | 2.8 | 2.7 | −1.8 | 8.0 | −0.7 | 0.8 |
Although the georeferencing results were beyond the initial expectations, some areas were characterized by shifts far exceeding the acceptable limits of graficism conventionally accepted for this scale of representation (0.2 mm). In addition, the acquisition of the GPS network during this phase had privileged easily accessible points mainly located in open spaces, such as squares, ruins, and so on. As a result, many densely built-up areas were inadequately covered [52].
During the second stage of the work, the densification of the GPS network took place, especially in areas showing greater shift values. Eleven new points were acquired, situated mostly on the top corners of historical buildings. In addition, 24 points of a local GPS network, named Forma Urbis, instituted by the Sovrintendenza Archeologica di Roma (Archaeological Superintendence of Rome), were acquired. These points were differentiated and compensated for, referring to two fixed stations, with sessions of 30′, and some of them were re-measured at a distance of a few days in order to validate the measurement’s repeatability. The precision of such points is to be considered geodetic. Once the GPS network was completed, the geo-referencing procedure was repeated. The results obtained by using 41 tie points showed slightly improved mean residual values (quadratic mean residuals: X = 0.62 m, Y = 0.74 m) [53].
The assessment of the real accuracy of the historical cartography was carried out during a third stage of work [54]. In the field of geographical information systems, the error that is still present after the georeferencing of a raster file is generally reported in terms of the residuals on the points used for calculating the georeferencing itself. Although the results are correlated with the overall reliability of the coordinates, they may overestimate the accuracy of the georeferenced cartography. This is due to the fact that the calculation of the transformation parameters is carried out using the well-known least squares estimator, which tends to minimize the square of the deviations on the points given as a reference. The average of the residuals on the GCPs alone may provide an estimate of the precision of the model understood as the mutual coherence of the GCPs; this means that points with a gross, but similar, error (for example, a translation) would be coherent and accurate. What is needed for the correct calculation of the accuracy of the historical maps is the deviation that can be observed on average on all of the points on the map. Thus, we used two different control point (CP) networks to evaluate the accuracy: the first network consisted of points from present-day cartography (mainly building corners), univocally recognizable in the historical cartography and distributed uniformly over the city within the walls, and the second consisted of points that were suitable for being used in the presumed operations of geodetic measurements. These points included obelisks, columns, towers and bell towers, easily visible from most of the city and easily sighted at ground level. As we expected, the level of accuracy of the historical cartography measured on the network of the presumed significant points of the city is higher than that measured on a network of randomly chosen points. This methodology allowed us to confirm the hypothesis that Nolli used a network of geodetic measurements that consisted of significant points in the city, on which the partial surveys of different sectors of the city were subsequently “georeferenced”.
The geo-referenced Nolli map constitutes a milestone in this project and the first important step towards building an HGIS of Rome in the 18th century (Figure 5).
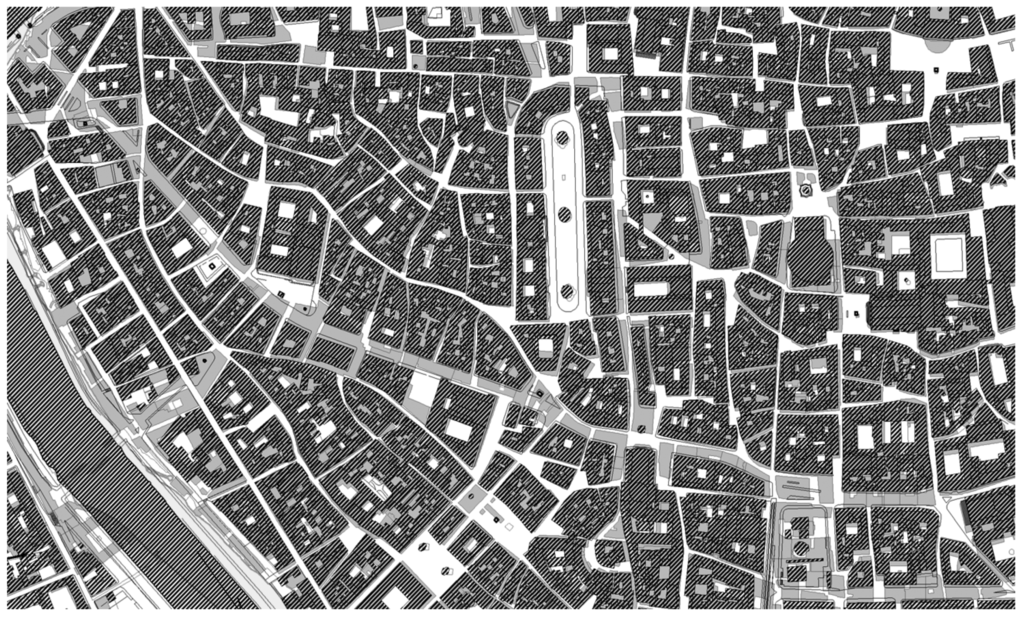
Figure 5.
Confrontation between the Nuova pianta (black hatching, vectorial format) and actual cartography.
The definition of homogeneous criteria for the interpretation of the cartographic representation of the Nuova pianta enabled us to obtain a digital product in vectorial format. This operation constituted the second important phase of the project, which was rounded off by the establishment of a “geographic container” capable of sustaining the thematic information derived from other data sources of the same period.
The vectorization procedure was conceived of in order to allow for the flexible use of cartographic data. The base map is composed of polylines that delimit the tracks just as drawn by Nolli. These are divided into classes that allow, during the polygonization phase, to obtain different map types, due to the application of exclusion masks of one or more polyline classes. In this manner, it is possible to obtain maps with different levels of spatial detail: representation of building blocks only, representation that distinguishes between solids and voids within each building block or the complete representation, including the plans of important buildings, such as churches or noble palaces, as depicted in the original map (Figure 6). This approach is useful, since it provides differentiated cartographic bases for further developing insights on the structure and consistency of the urban tissue in the 18th century. For example, the land occupation index, building consistency or the population density index can be represented by integrating data on building heights or on demography at the building block level, while detailed files can be compiled and attached to “special” buildings, whose plans are represented in the map.
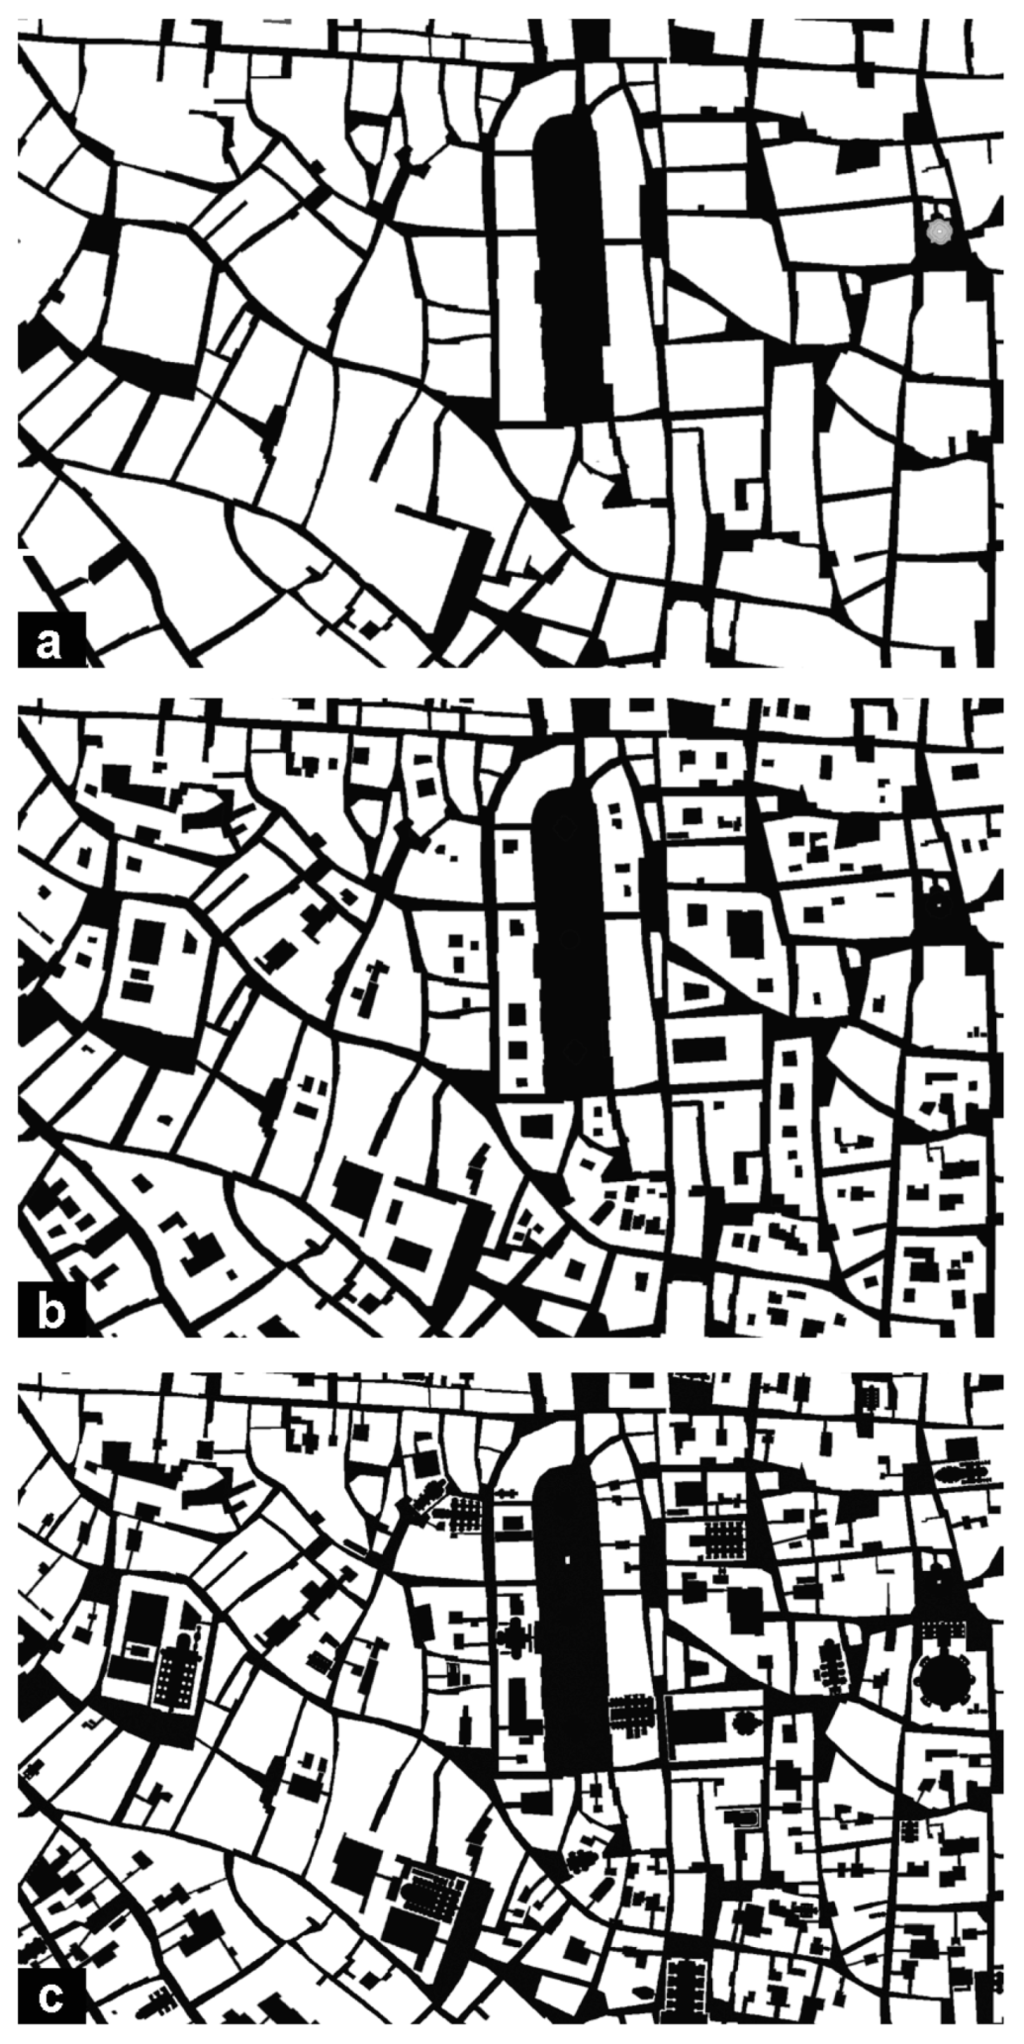
Figure 6.
Vectorization of the Nuova pianta. Level of representation of the urban structure: (a) building blocks; (b) solids and voids; (c) including the plans of churches, noble palaces, arcades and covered passages.
Thematic data integration started with the construction of a spatial database containing all of the descriptive information of the Nuova pianta. A land use map of seven classes was created by visually interpreting the cartographic symbols of the original map (Figure 7). This detailed urban structure represents the spatial “container” of our HGIS and can host additional information.
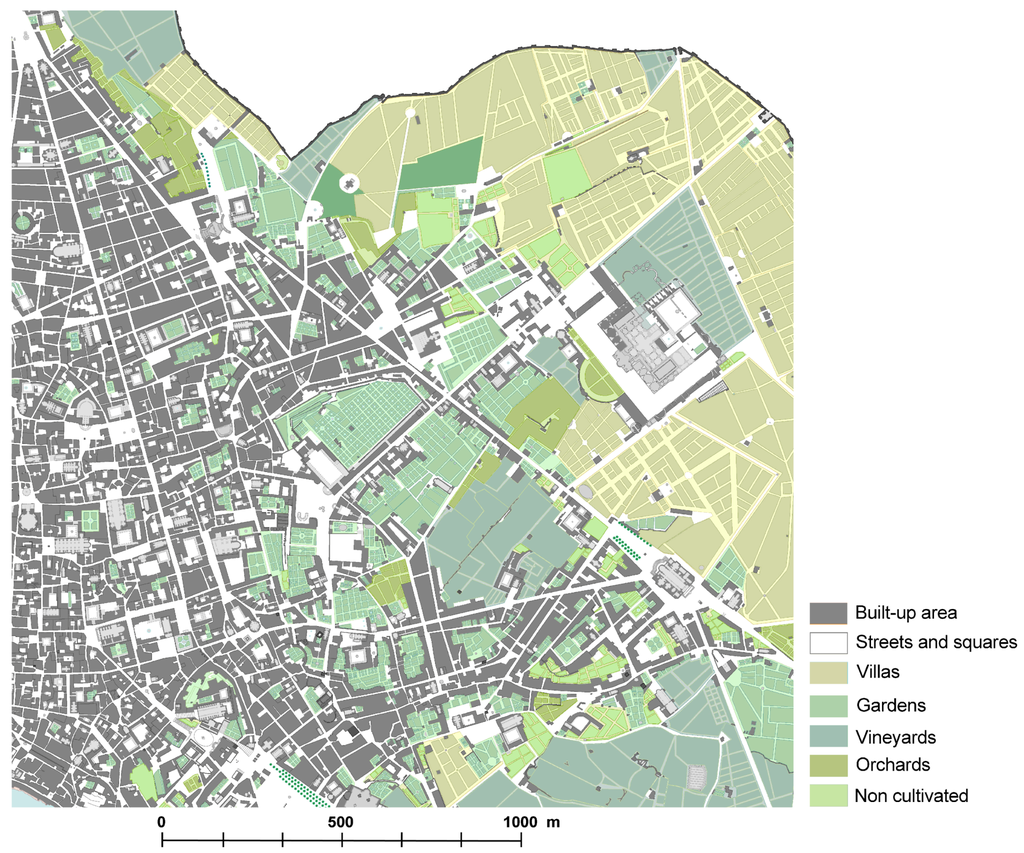
Figure 7.
Urban land use map in 1748, fragment.
Another level of information is added by integrating into the system the original map index. This contains the names of 1320 noteworthy places organized into categories (palaces, public buildings, streets, squares, and so on). We added to this list 542 additional records describing non-built-up areas (vineyards, orchards, villas, gardens, and so on), whose descriptions were written inside the map, obtaining an integrated index (Figure 8). Although being the most complete descriptive information on modern Rome, Nolli’s index does not homogeneously cover all of the categories: while the churches and the other ecclesiastic institutions are listed without omissions, the same does not occur with the palaces, whose selection criteria appear uncertain. The tendency to omit information is more evident in the case of the streets and squares, which are only partially listed, excluding several main streets. Since the integrated index respects the contents of the original source, the complete street network is an integrating part of our HGIS. This layer is obtained by completing the missing information with street toponyms obtained from additional descriptive and cartographic sources.
The descriptive detail of the newly-created integrated index database is incremented by the adjunction, as a separate field, of the information contained in the coeval “Description of the Rioni” Published in 1744 by Bernardino Bernardini. This list of noteworthy places is very similar to Nolli’s index, but it contains detailed information on the owners of the buildings and on the description of public offices. An additional database of coeval iconographic material is also created, covering most of the indexed buildings. The database contains and describes 18th century prints and drawings of the most important squares and buildings in Rome, drawn by Giovanni Battista Falda, Giovanni Battista Piranesi, Giuseppe Vasi, Antonio Pinelli, and so on. This aspect is considered of particular interest for divulgation purposes. The user-friendly Web-GIS interface allows for an interactive overlay and for the contextual querying of maps, databases and iconographic information.
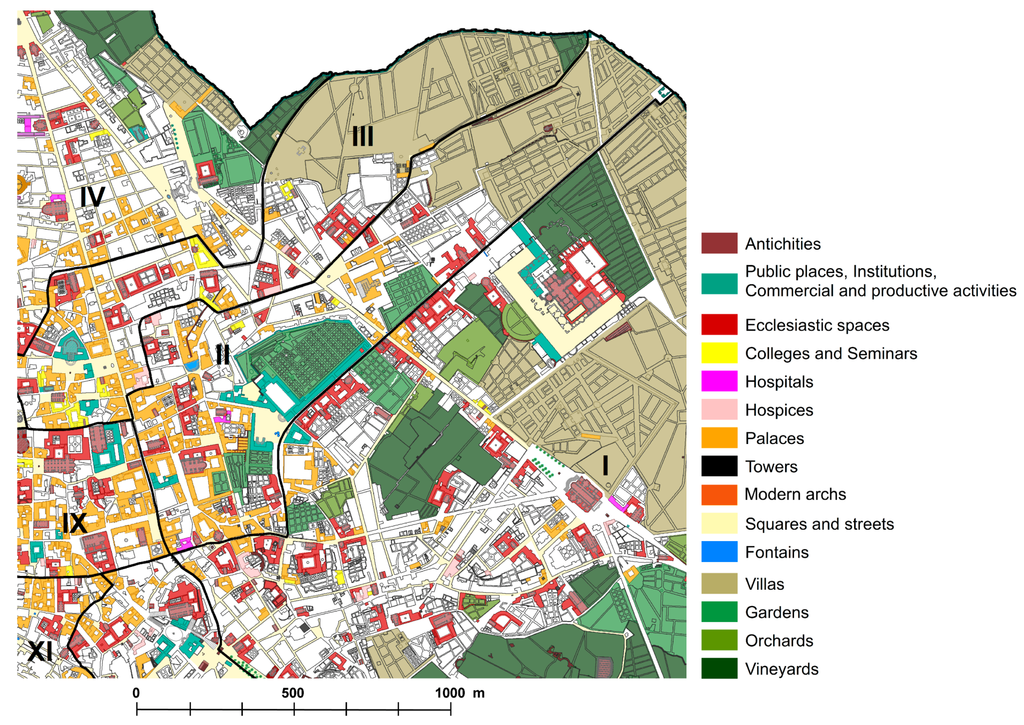
Figure 8.
Urban functions in 1748, retrieved by the integrated index of the Nuova pianta’s, fragment.
Within the HGIS, the analytical functions that can be developed by using the georeferenced and vectorized version of the Nuova pianta di Roma are as follows:
- spatial querying of the database contents;
- generation of new spatial thematic and statistical information and dynamic visualization of the results in the form of maps or reports;
- synchronic analysis, i.e., joint analysis of different themes, referring to the same geographical area and time period;
- diachronic analysis, i.e., analysis of the same themes, referring to the same geographical area at different times;
- production of thematic maps.
5. GIS Analysis of the Urban Landscape
The image of the city depicted by the map of Nolli of 1748 is that of a densely urbanized area that accounts for 409 hectares and 156,000 inhabitants, concentrated on the meander of the Tiber. A large green belt of villas and urban orchards surrounds the city. The Aurelian walls encompass a territory of almost 1450 hectares of which, considering the areas occupied by squares and streets beyond the built up region, only approximately 40% is urbanized.
The reconstruction of the historical city in all its components enables for complex and multiple descriptions of the urban landscape. The physical structure of Rome in the 18th century is configured within the GIS system as a three-dimensional representation. This choice is made to further enhance the topographic and spatial characteristics of the city. Building heights are approximated according to the land use information and the distribution of the functions, retrieved from the GIS database. The shape of the most important landmarks, such as domes, towers and archaeological vestiges, is modeled ad hoc. The 3D representation of the urban structure is then superimposed onto a digital elevation model (DEM) produced by elaborating historical altimetry sources (Figure 9). As far as concerns this last question, it must be noted that the oldest cartographical sources offering precise and reliable altimetry information on Rome and its surroundings are from the end of the 19th century and the beginning of the 20th century. The chosen sources are: the topographic map of Italy (Rome) by Istituto Geografico Militare (IGM), in 1:25,000 scale, dating to 1890 and the topographic map of Rome and its surroundings by Istituto Geografico Militare (IGM), in 1:5000 scale, dating to 1908, both used for retrieving the contour lines; and The Forma Urbis Romae by Rudolfo Lanciani, in 1:1000 scale, dating to 1901, used for completing the altimetry of the city center, by retrieving quotes of the crossroads. The large time span of more than 150 years between the cartographic representations used for reconstructing the historical landscape can be justified by the fact that the extension of the built up area by the beginning of the 20th century had not yet reached and exceeded the perimeter of the Aurelian walls. For this reason, the DEM, whose scope was by no means quantitative, but purely illustrative, may be considered a sufficiently good approximation of the morphology, in absence of earlier historical sources.
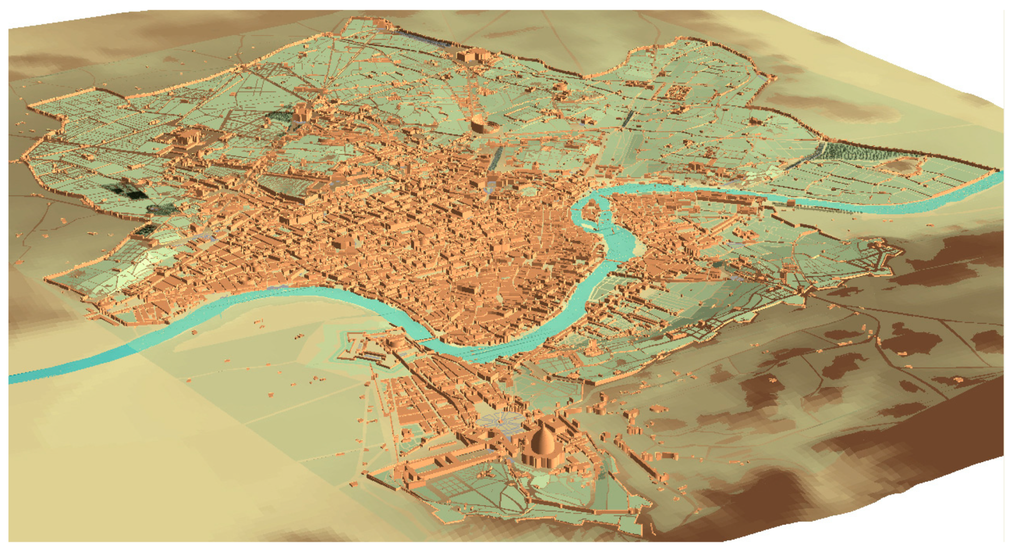
Figure 9.
Physical structure of Rome in the 18th century.
This representation of the urban space is an example of how historical data sources of different origin and typology and bibliographic research results can be integrated within a GIS system to enable in-depth analysis and study of the historical urban environment. Future work will focus on the progressive rendering of the most significant buildings, squares and streets prospects.
Further on, we illustrate some in-depth thematic readings obtained by means of integrating additional information with the spatial historical database described in the previous section. These are fully developed features within the HGIS.
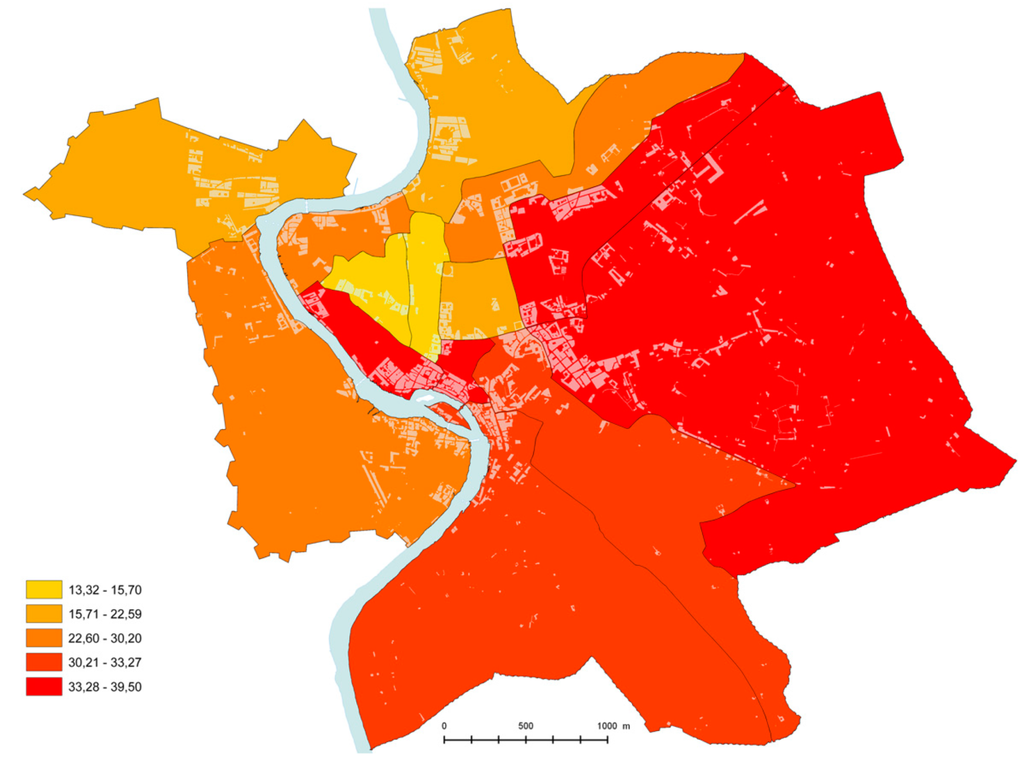
Figure 10.
Lost urban heritage (%) in the Rioni (quarters) of Rome. Demolished building blocks are evidenced in light grey.
5.1. Lost Urban Heritage
The Nuova pianta di Roma by Giovanni Battista Nolli depicts the urban structure as it was before the great transformations that took place after the unification of Italy and the proclamation of Rome as the capital of the nation. These transformations may be grouped into the following categories:
- demolition of historical urban fabric to leave room for the new road network;
- demolition of historical urban fabric for the purpose of isolating archaeological sites or buildings;
- new urban expansions.
The urban heritage demolished between 1870 and 1940, including noble palaces and villas, churches and monasteries, and so on, extends over the entire area delimited by the Aurelian walls. The spatial overlay between the Nuova pianta and actual cartography, as well as an accurate bibliographical research, which is part of a project coordinated by CROMA, makes a precise identification of the lost urban heritage possible: building blocks totally or partially demolished were mapped, while simple GIS operations returned a quantification of the lost urban heritage in every Rione (Figure 10). More than 300 objects, already described in the integrated index, are identified as lost buildings. A detailed database is compiled for each indexed lost building, which includes information on the period of construction, the architects, the period and the reasons for the demolition. Iconographic illustration is provided, as well. This includes the digitalization and indexing of some well-known collections of engravings of Rome between the 17th and 19th centuries (see Table 1, Column 5). Each form is interactively linked to the digital historical cartography and compared to the actual situation. This product, integrated within the Web-GIS, constitutes a useful tool for researchers, teachers, local administrators and citizens, for the knowledge of lost urban heritage.
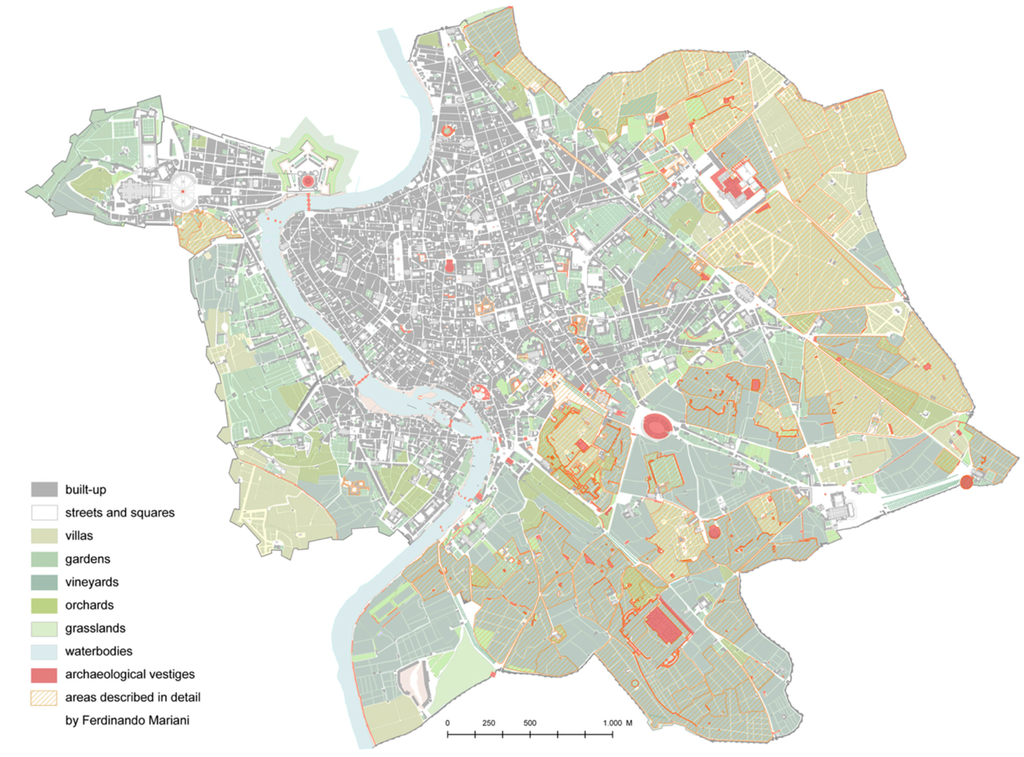
Figure 11.
Land use map of Rome in the 18th century with evidenced archaeological vestiges.
5.2. Modern Rome and Archaeology
Our efforts to perform a detailed study of the archaeological landscape of Rome in the 18th century rely on the accurate work of Giovanni Battista Nolli and his collaborators and are directly related to the original requirements of the map’s promoters, mostly interested in antiquities [40]. In that period, increasing interest towards the immense archaeological patrimony produced the first examples of conservation practices and study initiatives. In 1734, Pope Clemente XII Corsini founded the Capitoline Museum, the first public museum of antiquities in the world, aiming to preserve the archaeological heritage from systematic depredation. Detailed written descriptions exist of large part of the ancient vestiges of Rome in the 18th century. These notes were taken by Ferdinando Mariani between 1736 and 1738, during the survey operations of the Nuova pianta and correspond to archaeological objects drawn in the map’s preparatory drawing. The manuscripts, conserved in incomplete form in the Secret Vatican Library, were published in 1883 and 1884. The ruins described in these publications have no immediate correspondence with the printed version of the Nuova pianta, since in the latter, only a reduced number of archaeological objects is indexed. A database is compiled extending the number of recorded objects from 104, contained the integrated index, to 362. The contents of the database include: the category of archaeological object, the reviewed description of the vestige, considering that the actual knowledge may differ from that of the 18th century, the transcription of the original description operated by Mariani and bibliographic references. Each form is interactively linked to the digital historical cartography and compared to the actual situation. This inedited work, being also part of the Web-GIS, offers a clear picture of the archaeological heritage as it was in the 18th century, before the transformations that occurred after the unification of Italy, resulting in the partial loss of this unique patrimony (Figure 11).
5.3. Population
The last application illustrated here concerns the demography of Rome in the 18th century. The reconstruction of the parish limits is made by transferring traditional descriptive information into cartography. The rich information on historical toponyms contained in our historical GIS database (comprising the names of the streets, alleys, squares, as well as of the principal monuments, public spaces and functions, noble palaces and religious buildings) has made possible the precise and reliable delimitation of the parish limits on the Nuova pianta. This delimitation brings about the possibility to enrich the historical GIS with new information on population, contained in the registers of the Stati delle anime (“Survey of Souls”) from which the descriptive information on the delimitation of the parishes was retrieved. These registers were systematically compiled every year, at least since 1630, and contain detailed demographic information on the residents: name, profession, age, social status, and so on [55]. It is very difficult to precisely locate people inside a building block, since descriptions are in-homogeneously detailed, but data can be easily referred to the spatial units of parishes. Parish maps were drawn from the 17th to the 19th century. Thus, the database on the population encompasses a time span of three centuries. The opportunity to keep track of the demographic movements and to perform demographic spatial statistics adds further value to our historical GIS project.
Figure 12a illustrates the population density within the Rioni (districts) in 1748, the year of the publication of Nolli’s map. We can observe that population is concentrated in the densely built-up area of the Tiber bend, along the medieval “path of the pilgrims” that still today leads to St. Peter. If we observe the rate of edification, depicted in Figure 12b, given by the percentage of the built-up area compared to the total Rione area, we learn that the densest built-up areas do not necessarily correspond to the densest inhabited areas. This gives an indirect indication of the volumetric distribution of the built fabric, a feature that is absent in the Nolli map.
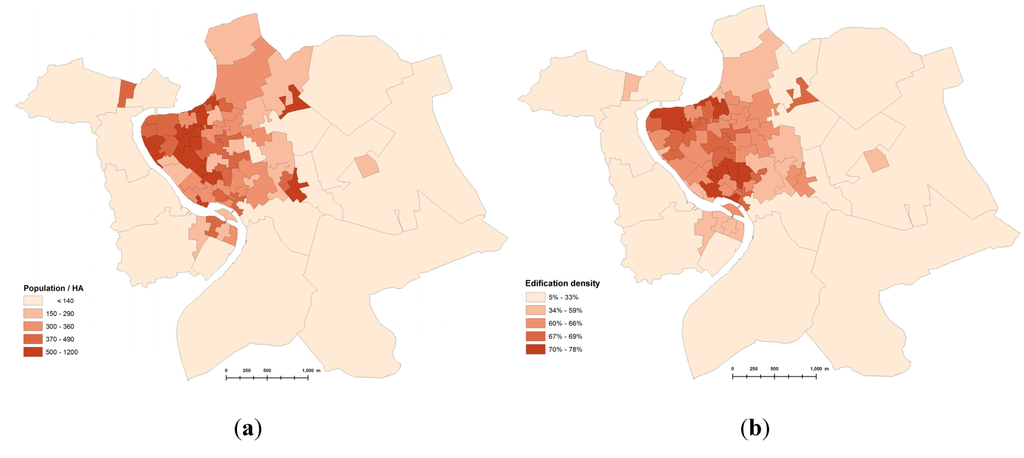
Figure 12.
(a) Population density and (b) rate of soil edification in the Rioni (districts) of Rome in the 18th century.
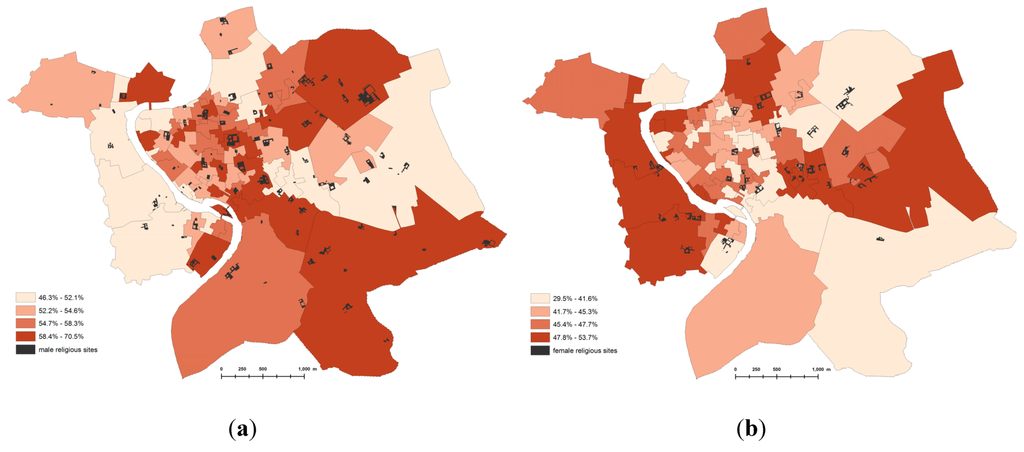
Figure 13.
Incidence of males (a) and females (b) on the total population in the Rioni (districts) of Rome in the 18th century.
Integration of multiple historical sources within a GIS system enables thematic interpretations based on the spatial distribution of phenomena, that otherwise might be difficult to delineate, offering valuable indications for further research. Figure 13 illustrates an example. The two maps show the incidence of male (a) and female (b) population on the total population of each Rione. Rome’s population in 1748 was 147,496 inhabitants, of which males compose 55.2%. The explanation for the higher number of males is given by the fact that 8.8% of this population is composed of religious people, while for the females, this feature stands at 2.7%. If we take a closer look at the distribution geographies within the territorial units, we find out that localization of religious sites, such as monasteries, convents, religious houses, which were able to host an elevated number of religious people, may offer an explanation for the observed unbalances.
The above-described examples illustrate some first attempts at integration between historical sources, which have returned extremely positive feedback to researchers that were given the opportunity to use the historical GIS tool in experimental form. The results obtained until now encourage the integration of other detailed and useful 18th century documentary sources describing economic activities and small-scale urban transformations.
6. Conclusions
This paper outlines the principles and the methods employed for building an HGIS of Rome in the 18th century. Technologies that incorporate the spatial component allow the development of a deeper and more sophisticated understanding of the data. This type of analysis, traditionally scarcely used by historians, is now experiencing a growing number of applications, as GIS technologies are no longer niche products and are becoming more accessible in terms of costs and the supply of interfaces that are suitable for less experienced users [56]. This latter aspect raises an important question: what would be the theoretical and methodological impact of the recurrent use of information technology on the work of the historian of the city and the territory? The use of spatial databases and map application environments does not release historians from the duty of understanding the circumstances and purposes of the creation of the studied documents or the application of historical critiques. Interdisciplinary cooperation, especially including digital technologies, places new requirements on researchers. Each of the relevant research sectors has already developed a specialized vocabulary and methods. Topics, such as a town or a certain territory and its appearance and development in the past, attract scholars to go beyond the boundaries of their branch and seek a common language. However, this requires knowledge of quickly developing technologies, openness to new impulses and the desire to understand the thought and work processes of colleagues from other branches of science.
Discussions on the impact of all of this “digitization” and on its effective usefulness have gone hand in hand with the proliferation of projects resulting in digital outputs, such as websites, interactive exhibits, museums or any form of mediated digital historical content [57,58]. As a matter of fact, digital technologies were not born to be primarily of value to urban history; instead, they developed as a support to other disciplines, such as archaeology, geography, urban planning, and so on, having practical nonacademic applications. Therefore, we should ask ourselves which would be the margins of the adaptation of these technologies in order to meet the specific needs of historical analysis in urban and territorial contexts.
There is convergence on the fact that the use of GIS in urban history offers great opportunities for analysis and communication of historical research. Moreover, GIS provides effective solutions for overcoming some problems and limitations related to the incomplete and fragmentary nature of historical sources. In our project, integration within the HGIS based on the Nolli map of information deriving from the urban cadaster gave the possibility to increase the existing spatial detail of the cartographic source by adding precise information on the buildings’ shape. The descriptive source by Bernardini, enabled a useful integration of the original map index database with valuable and detailed information on the use and functions of urban space. In general terms, the opportunity to jointly manage and visualize multiple spatial databases may help the historian to develop new insights into the studied phenomenon.
The opportunity to communicate the results of geospatial historical research through the web represents a significant evolution and an important challenge for HGIS studies. Web-GIS has transformed the way geospatial information is transmitted, shared and visualized. High quality Web-HGIS applications are not yet common, but there is increasing awareness about the fact that the web may offer great perspectives for research developments in historical studies, in general, and in the urban field, in particular. As Web-GIS is able to perform all GIS functions, including capture, storage, editing, manipulation, management, analysis, sharing and visualization, it represents a powerful tool for historians, architects, planners and archaeologists to produce and exchange spatial research. The example of the historical atlas of the modern Rome brings evidence to the fact that a multidisciplinary approach to urban historical studies is boosted by the use of the web mapping applications. We are currently updating our historical and archaeological database through a Web-GIS back office application, remotely accessed by different researchers. We are also testing the Web HGIS functions within a network of specialists from different fields, receiving real-time feedback and working on suggested modifications. This democratic process of sharing skills and experience for the purpose of improving the quality of research and communication is enabled by this continuously evolving sector. Historians should take full advantage of it.
Conflicts of Interest
The author declare no conflict of interest.
References
- Bodenhamer, D.J.; Corrigan, J.; Harris, T.M. (Eds.) The Spatial Humanities: GIS and the Future of Humanities Scholarship; Indiana University Press: Bloomington, IN, USA, 2010.
- Knowles, A.K. Historical GIS: The spatial turn in social history-introduction. Soc. Sci. Hist. 2000, 24, 451–470. [Google Scholar] [CrossRef]
- Doorn, P. A Spatial Turn in History. Available online: http://www.gim-international.com/issues/articles/id453-A_Spatial_Turn_in_History.html (accessed on 29 November 2014).
- The Historical GIS Research Network. Available online: http://www.hgis.org.uk/resources.htm#online_hgis (accessed on 8 October 2014).
- Rodaway, P. Sensuous Geographies: Body, Sense and Place; Routledge: London, UK, 1994. [Google Scholar]
- Witcher, R.E. GIS and landscapes of perception. In Geographical Information Systems and Landscape Archaeology; Oxbow Books: Oxford, UK, 1999; pp. 13–22. [Google Scholar]
- Vitali, S. Passato Digitale. Le Fonti Dello Storico Nell’era del Computer; Bruno Mondadori: Milano, Italy, 2004. [Google Scholar]
- Borillo, M. Informatiques Pour les Sciences de L’homme; Mardaga: Bruxelles, Belgium, 1984. [Google Scholar]
- Castleford, J. Archaeology, GIS, and the time dimension: An overview. In Computer Applications and Quantitative Methods in Archaeology; Lock, G., Moffett, J., Eds.; British Archaeological Report: Oxford, UK, 1992; pp. 95–106. [Google Scholar]
- Langran, G. Time in Geographic Information Systems; Taylor and Francis: London, UK, 1992. [Google Scholar]
- Openshaw, S.; Alvanides, S. Applying geocomputation to the analysis of spatial distributions. In Geographic Information Systems: Principles and Technical Issues 1, 2nd ed.; Longley, P.A., Goodchild, M.F., Maguire, D.J., Rhind, D.W., Eds.; John Wiley and Sons: New York, NY, USA, 1999; pp. 267–282. [Google Scholar]
- Zhang, J.; Goodchild, M.F. Uncertainty in Geographical Information; Taylor and Francis: London, UK, 2002. [Google Scholar]
- Knowles, A.K. Placing History: How GIS is Changing Historical Scholarship; Hillier, A., Ed.; ESRI Press: Redlands, CA, USA, 2008. [Google Scholar]
- Miller, P. How to look good and influence people: Thoughts on the design and interpretation of an archaeological GIS. In Archaeology and Geographical Information Systems: A European Perspective; Lock, G., Stančič, Z., Eds.; Taylor and Francis: London, UK, 1995; pp. 319–334. [Google Scholar]
- Unwin, D.J. Geographical information systems and the problem of error and uncertainty. Prog. Hum. Geogr. 1995, 19, 549–558. [Google Scholar] [CrossRef]
- Gregory, I.N. A Place in History: A Guide to Using GIS in Historical Research; Oxbow: Oxford, UK, 2003. [Google Scholar]
- Gregory, I.N.; Ell, P.S. Historical GIS: Techniques, Methodologies and Scholarship; Cambridge University Press: Cambridge, UK, 2007. [Google Scholar]
- Lelo, K.; Travaglini, C.M. Il GIS dell’atlante storico di Roma: Metodologie per l’informatizzazione, l’integrazione e l’analisi congiunta delle fonti catastali ottocentesche. In Fonti, Metafonti e GIS per L’indagine della Struttura Storica del Territorio; Panzeri, M., Farruggia, A., Eds.; Politecnico di Torino, Celid: Torino, Italy, 2009; pp. 51–60. [Google Scholar]
- Gregory, I.N.; Kemp, K.; Mostern, R. Geographical Information and historical research: Current progress and future directions. Hist. Comput. 2001, 13, 7–21. [Google Scholar] [CrossRef]
- Gregory, I.; Southall, H. Putting the past in its place: The Great Britain historical GIS. In Innovations in GIS 5; Carver, S., Ed.; Taylor and Francis: London, UK, 1998; pp. 210–221. [Google Scholar]
- Gregory, I.N. The Great Britain historical GIS. Hist. Geogr. 2005, 33, 132–134. [Google Scholar]
- De Moor, M.; Wiedemann, T. Reconstructing Belgian territorial units and hierarchies: An example from Belgium. Hist. Comput. 2001, 13, 71–97. [Google Scholar] [CrossRef]
- Fitch, C.A.; Ruggles, S. Building the National Historical Geographic Information System. Hist. Methods 2003, 36, 41–51. [Google Scholar] [CrossRef]
- McMaster, R.B.; Noble, P. The USA National Historical Geographical Information System. Hist. Geogr. 2005, 33, 134–136. [Google Scholar]
- Merzlyakova, I.A. Historical GIS initiative in Russia. Hist. Geogr. 2005, 33, 147–149. [Google Scholar]
- Bol, P.; Ge, J. China historical GIS. Hist. Geogr. 2005, 33, 150–152. [Google Scholar]
- Kim, J.-H. HGIS project of South Korea. Hist. Geogr. 2005, 33, 152–154. [Google Scholar]
- Kunz, A. Fusing time and space: The Historical Information System HGIS Germany. Int. J. Humanit. Arts Comput. 2007, 1, 111–122. [Google Scholar] [CrossRef]
- Gregory, I.N.; Healey, R.G. Historical GIS: Structuring, mapping and analysing geographies of the past. Prog. Hum. Geogr. 2007, 31, 638–653. [Google Scholar] [CrossRef]
- Spence, C. London in the 1690s: A Social Atlas; Centre for Metropolitan History, Institute of Historical Research: London, UK, 2000. [Google Scholar]
- Orforda, S.; Dorlingb, D.; Mitchellc, R.; Shawd, M.; Smith, G.D. Life and death of the people of London: A historical GIS of Charles Booth’s inquiry. Health Place 2002, 8, 25–35. [Google Scholar] [CrossRef] [PubMed]
- Siebert, L. Using GIS to Document, Visualize, and Interpret Tokyo’s Spatial History. Soc. Sci. Hist. 2000, 24, 537–574. [Google Scholar] [CrossRef]
- Wilson, A. Sydney timemap: Integrating historical resources using GIS. Hist. Comput. 2001, 13, 45–68. [Google Scholar] [CrossRef]
- Yano, K.; Nakaya, T.; Isoda, Y. (Eds.) Virtual Kyoto: Exploring the Past, Present and Future of Kyoto; Nakanishiya Shuppan: Kyoto, Japan, 2007.
- Pinol, J.-L.; Garden, M. Atlas des Parisiens: De la Révolution à nos Jours; Parigramme: Paris, France, 2009. [Google Scholar]
- Novak, M.J.; Gilliland, J.A. Trading places: A historical geography of retailing in London, Canada. Soc. Sci. Hist. 2011, 35, 543–570. [Google Scholar] [CrossRef]
- Travaglini, C.M.; Lelo, K. (Eds.) Roma nel Settecento, Immagini e Realtà di una Capitale Attraverso la Pianta di G.B. Nolli, 2 voll; Roma Tre University: Rome, Italy, 2013.
- Docci, M.; Maestri, D. Storia del Rilevamento Architettonico e Urbano; Roma-Bari: Laterza, Italy, 1993. [Google Scholar]
- Bevilacqua, M. Roma nel secolo dei lumi. In Architettura Erudizione Scienza Nella Pianta; Electa Napoli Srl: Napoli, Italy, 1998. [Google Scholar]
- Faccioli, C. Gio. Battista Nolli (1701–1756) e la sua gran «Pianta di Roma» del 1748. Studi Romani 1966, XIV, 415–442. [Google Scholar]
- Insolera, I. Roma. Immagini e Realtà dal X al XX Secolo; Roma-Bari: Laterza, Italy, 1980. [Google Scholar]
- Spagnesi, G. L’immagine di Roma barocca da Sisto V a Clemente XII: La pianta di G.B. Nolli del 1748. In Immagini del Barocco. Bernini e la Cultura Europea del Seicento; Fagiolo, M., Spagnesi, G., Eds.; Istituto dell’Enciclopedia Italiana: Roma, Italy, 1982; pp. 145–156. [Google Scholar]
- Ceen, A. Piranesi and Nolli: Imago Urbis Romae. In Piranesi. Rome Recorded; Exhibition Catalogue: New York, NY, USA, 1990; pp. 17–22. [Google Scholar]
- Irish Historic Town Atlas. Available online: http://www.ria.ie/research/ihta/european-project.aspx (accessed on 8 October 2014).
- Opll, F.; Simms, A. Historic Town Atlases. Urban History through Maps; The International Commission for the History of Towns and Crédit Communal de Belgique: Brussels, Belgium, 1995. [Google Scholar]
- Slater, T.R. The European historic towns Atlas. J. Urban Hist. 1996, 22, 739–749. [Google Scholar] [CrossRef]
- Clarke, H.B. Joining the club: A Spanish historic towns Atlas. Imago Temporis. Medium Aevum 2008, 2, 27–43. [Google Scholar]
- Conzen, M.P. Retrieving the pre-industrial built environments of Europe: The Historic Towns Atlas programme and comparative morphological study. Urban Morphol. 2008, 12, 143–156. [Google Scholar]
- Prunty, J.; Clarke, H.B. Reading the Maps: A guide to the Irish Historic Towns Atlas; Royal Irish Academy: Dublin, Ireland, 2011. [Google Scholar]
- Opll, F. The European Atlas of historic towns. Project, vision, achievements. Ler Hist. 2011, 60, 169–182. [Google Scholar]
- Ruggeri, A.; Londei, L. Il catasto urbano di Roma (1818–1824). In Eventi e Documenti Diacronici delle Principali Attività Geotopografiche in Roma—L’Universo, 6; Cantile, A., Ed.; Istituto Geografico Militare: Firenze, Italy, 2000; pp. 102–137. [Google Scholar]
- Baiocchi, V.; Lelo, K. Confronto di cartografie storiche con cartografie attuali per l’area del centro storico di Roma. In Proceedings of the 2002 Conferenza nazionale ASITA, Perugia, Italy, 5–8 November 2002.
- Baiocchi, V.; Lelo, K. Georeferencing the historical maps of Rome between the seventeenth and eighteenth centuries. In International Cooperation to Save the World’s Cultural Heritage, Proceedings of the 2005 International CIPA Symposium, Torino, Italy, 26 September–1 October 2005.
- Baiocci, V.; Lelo, K. Assessing the accuracy of historical maps of cities: Methods and problems. Città Stor. 2014, 9, 61–89. [Google Scholar]
- Sonnino, E. Popolazione e territori parrocchiali a Roma dalla fine del’500 all’unificazione. In Popolazione e Società a Roma dal Medioevo all’età Contemporanea; Sonnino, E., Ed.; Il Calamo: Roma, Italy, 1998; pp. 93–139. [Google Scholar]
- Lelo, K.; Travaglini, C.M. Historical cartography and the study of urban cultural heritage: The case of Rome in the 18th century. e-Perimetron 2013, 8, 177–186. [Google Scholar]
- Gordon, C. Lost in space, or confessions of an accidental geographer. Int. J. Hum. Arts Comput. 2011, 5, 1–2. [Google Scholar] [CrossRef]
- Silveria, L.E. Geographic Information Systems and historical research: An appraisal. Int. J. Hum. Arts Comput. 2014, 8, 28–45. [Google Scholar] [CrossRef]
© 2014 by the authors; licensee MDPI, Basel, Switzerland. This article is an open access article distributed under the terms and conditions of the Creative Commons Attribution license (http://creativecommons.org/licenses/by/4.0/).