Canadian Forest Fires and the Effects of Long-Range Transboundary Air Pollution on Hospitalizations among the Elderly

Abstract
:1. Introduction
2. Methods
2.1. Study Area
2.2. Data Sources
2.3. Statistical Analysis

| Reason for Hospital Admission | ICD-9 Codes |
|---|---|
| Respiratory Outcomes | (460–519) |
| Chronic Obstructive Pulmonary Disease (COPD) | (490–492, 496) |
| Asthma | (493) |
| Respiratory Tract Infections | (464–466, 480–487) |
| Cardiovascular Outcomes | (390–492, 496) |
| Cerebrovascular Disease | (430–438) |
| Heart Failure | (440–448) |
| Stroke | (410) |
| Peripheral Vascular Disease | (410–414) |
| Myocardial Infarction | (426–427) |
| Ischemic Heart Disease | (426–428) |
| Heart Rhythm Disturbances | (46–427) |
| Heart Disease | (426–428) |
| Other Heart Disease | (420–425, 428) |
| Hypertension | (401–405) |
| Injury | (800–849) |
 and
and  be the observed and expected daily number of cause-specific hospitalizations,
  be the number of people at risk on day t in county c,
  be the daily average PM2.5 for county c,
  and
and  the daily average temperature and dew point temperature for county c. We fit the following log-linear regression model:

 an indicator variable representing haze versus non-haze period and
  representing the regression offset. The parameter β1 denotes the log relative risk of cause-specific hospitalization associated with one unit (µg/m3) increase in daily average PM2.5 (block kriged county estimates) adjusted for temperature and dew-point temperature. The parameter β2 denotes the increase in log relative rate of hospitalizations during the haze period compared to that during the non-haze period.
  in the county-specific model (1) for
  , where l = 0, 1, 2 days and
  is the PM2.5 concentration for county c on day t at a lag of l days [63]. A lag of 0 days corresponds to the association between PM2.5 concentrations on a given day and the risk of hospitalization on the same day. We also applied distributed lag models [64,65] to estimate the relative risk of hospitalization associated with cumulative exposure over the current day and the previous two days. The distributed lag models are obtained by substituting
  in the county-specific model (Equation (1)) for . Models with a PM2.5 by haze period interaction
  were also considered allowing for the relative risk of hospitalizations associated with PM2.5 exposure to change during the haze period compared to the non-haze period.
3. Results
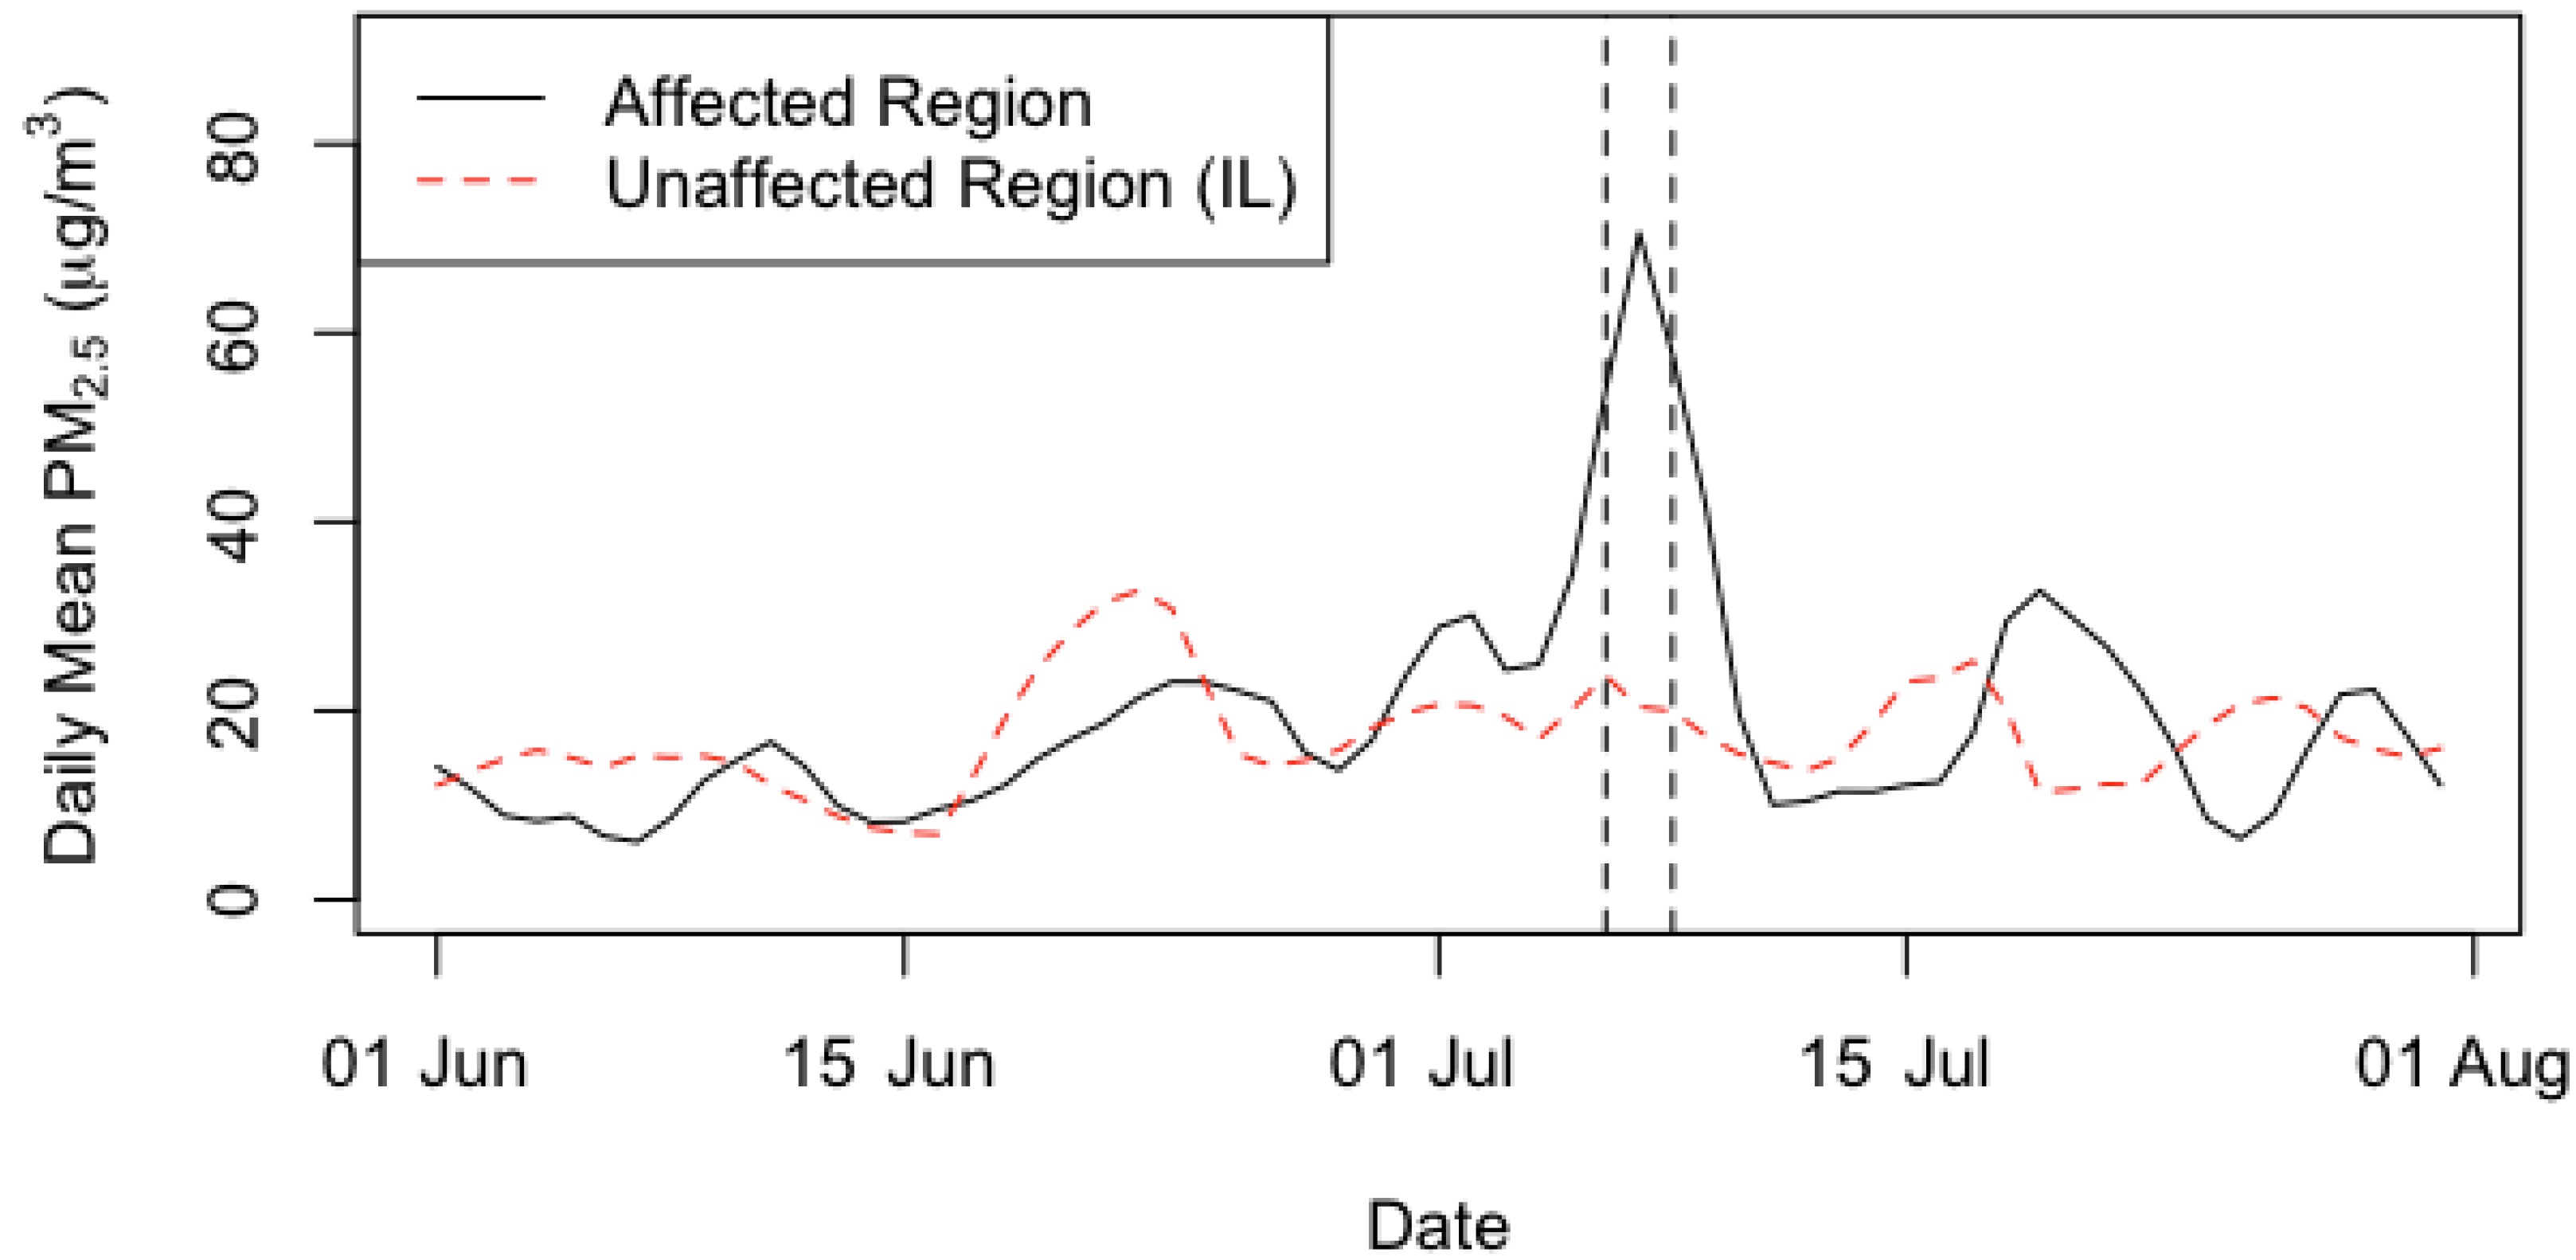
| Summary Statistics | Affected Region | Unaffected Region (IL) | ||
|---|---|---|---|---|
| Haze | Non-Haze | Haze | Non-Haze | |
| Min | 17.6 | 7.0 | 12.2 | 15.2 |
| 25th %tile | 35.6 | 13.7 | 16.0 | 19.0 |
| Median | 43.1 | 22.6 | 20.7 | 20.7 |
| Mean | 53.0 | 21.5 | 22.4 | 20.8 |
| 75th %tile | 69.1 | 25.3 | 29.7 | 22.1 |
| Max | 127.7 | 43.7 | 33.0 | 28.4 |
| SD | 25.0 | 10.3 | 7.2 | 5.0 |
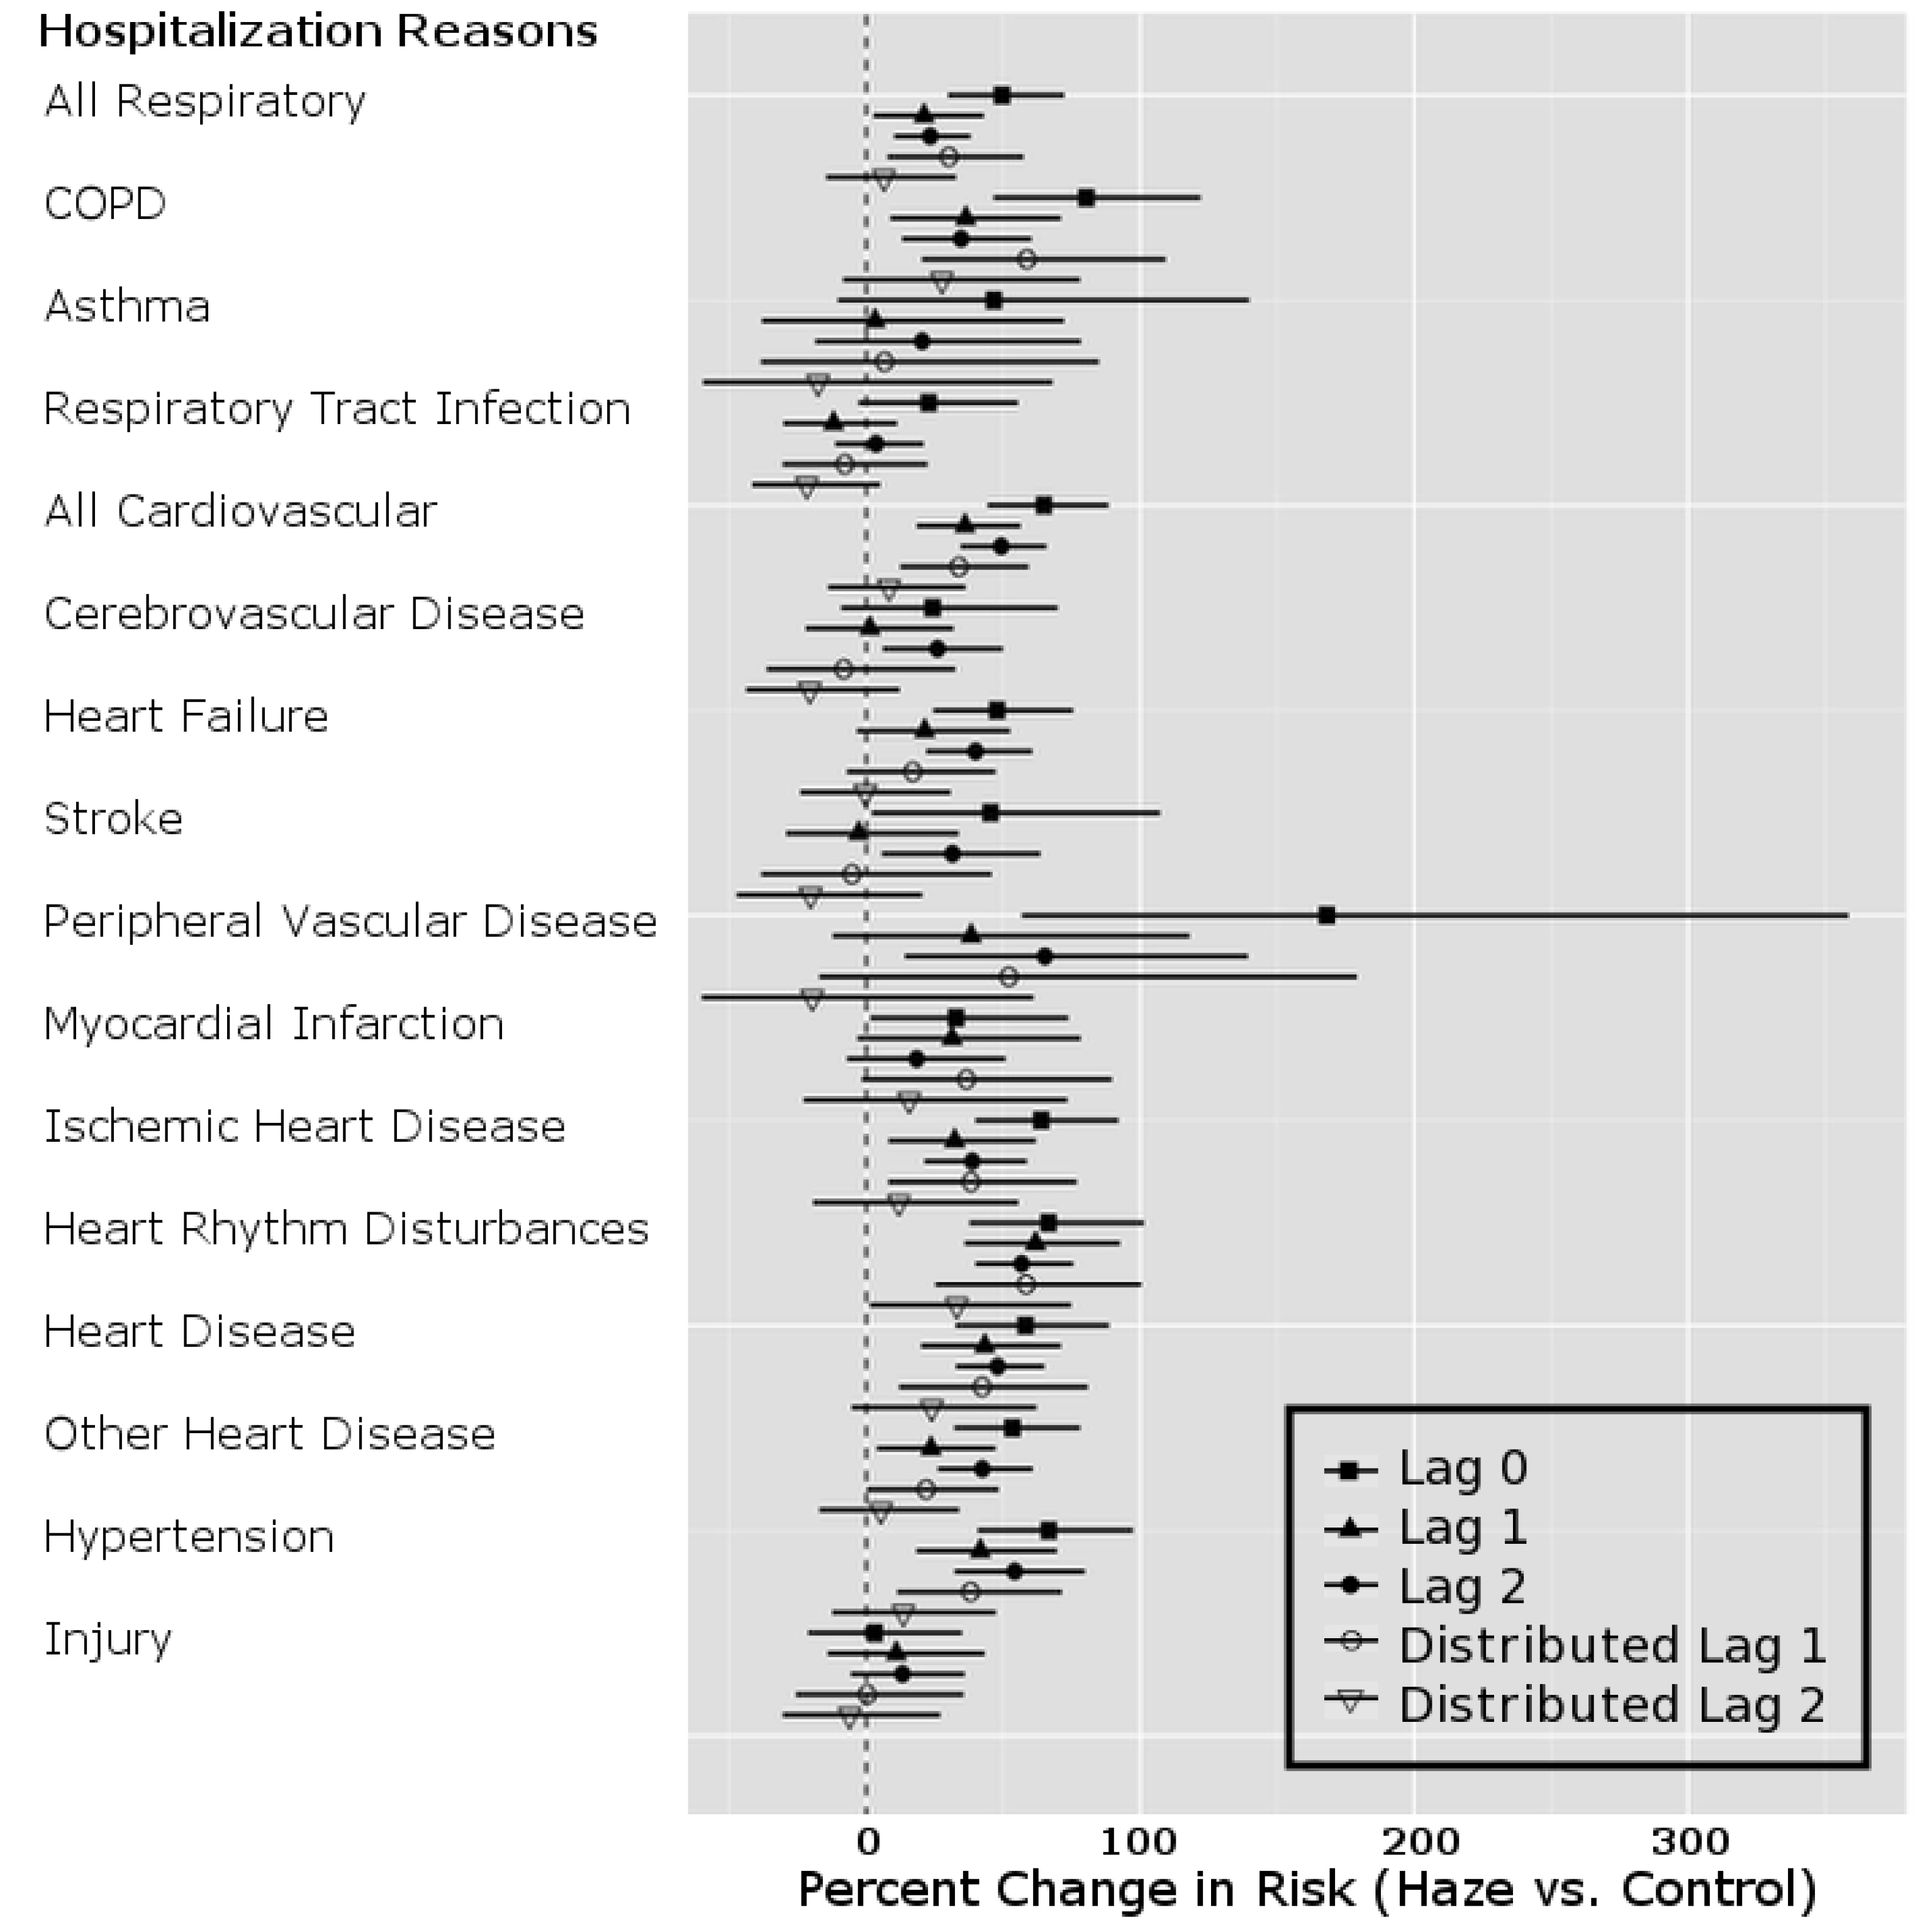
| Hospitalization Codes | PM2.5 Model Lag | Percent Change | 95% Confidence Interval |
|---|---|---|---|
| All Respiratory | Lag 0 | 49.55 | (29.82, 72.29) |
| Lag 1 | 21.14 | (2.69, 42.90) | |
| Lag 2 | 23.36 | (10.20, 38.10) | |
| Dlag1 | 30.20 | (7.66, 57.46) | |
| Dlag2 | 6.48 | (−14.63, 32.81) | |
| All Cardiovascular | Lag 0 | 64.93 | (44.30, 88.51) |
| Lag 1 | 36.06 | (18.43, 56.32) | |
| Lag 2 | 49.28 | (34.39, 65.81) | |
| Dlag1 | 33.85 | (12.45, 59.33) | |
| Dlag2 | 8.31 | (−13.89, 36.24) | |
| Injury | Lag 0 | 3.04 | (−21.31, 34.92) |
| Lag 1 | 10.97 | (−14.04, 43.27) | |
| Lag 2 | 13.23 | (−5.64, 35.89) | |
| Dlag1 | 0.37 | (−25.69, 35.55) | |
| Dlag2 | −6.04 | (−30.50, 27.02) |

4. Discussion
5. Conclusions
Acknowledgments
Author Contributions
Conflicts of Interest
References
- Ward, D. Health Guidelines for Vegetation Fire Events, Background Papers. In Smoke from Wildland Fires; WHO: Geneva, Switzerland, 1999; pp. 70–85. [Google Scholar]
- Miller, D.J. Assessing boreal forest fire smoke aerosol impacts on U.S. air quality: A case study using multiple data sets. J. Geophys. Res. 2011, 116, 1–19. [Google Scholar]
- Mathur, R. Estimating the impact of the 2004 Alaskan forest fires on episodic particulate matter pollution over the eastern Unites States through assimilation of satellite derived aerosol optical depths in a regional air quality model. J. Geophys. Res. 2008, 113, 1–14. [Google Scholar]
- Jalava, P.; Salonen, R.; Halinen, A.; Penttinen, P.; Pennanen, A.; Sillanpaa, M.; Sandell, E.; Hillamo, R.; Hirvonen, M.R. In vitro inflammatory and cytotoxic effects of size-segregated particulate samples collected during long-range transport of wildfire smoke to Helsinki. Toxicol. Appl. Pharmacol. 2006, 215, 341–353. [Google Scholar] [CrossRef]
- Sapkota, A.; Symons, J.; Kleissl, J.; Wang, L.; Parlange, M.; Ondov, J.; Breysse, P.N.; Diette, G.B.; Eggleston, P.A.; Buckley, T.J. Impact of the 2002 Canadian forest fires on particulate matter air quality in Baltimore city. Environ. Sci. Technol. 2005, 39, 24–32. [Google Scholar] [CrossRef]
- Morris, G.A.; Hershey, S.; Thompson, A.M.; Stohl, A.; Colarco, P.R.; McMillan, W.W.; Warner, J.; Johnson, B.J.; Witte, J.C.; Kucsera, T.L.; et al. Alaskan and Canadian forest fires exacerbate ozone pollution in Houston, Texas, on 19 and 20 July. J. Geophys. Res. 2004, 111, 1–10. [Google Scholar]
- Ovadnevaite, J.; Kvietkus, K.; Marsalka, A. 2002 summer fires in Lithuania: Impact on the Vilnius city air quality and the inhabitants health. Sci. Total Environ. 2006, 356, 11–21. [Google Scholar] [CrossRef]
- Mott, J.; Mannino, D.M.; Alverson, C.; Kiyu, A.; Hashim, J.; Lee, T.; Falter, K.; Redd, S.C. Cardiorespiratory hospitalizations associated with smoke exposure during the 1997, southeast Asian forest fires. Int. J. Hyg. Environ. Health 2005, 208, 75–85. [Google Scholar] [CrossRef]
- Heil, A.; Goldammer, J. Smoke-haze pollution: A review of the 1997 episode in southeast Asia. Reg. Environ. Chang. 2001, 2, 24–37. [Google Scholar] [CrossRef]
- Wotawa, G.; Trainer, M. The influence of Canadian forest fires on pollutant concentrations in the United States. Science 2000, 288, 324–328. [Google Scholar] [CrossRef]
- Health Guidelines for Vegetation Fire Events. In Technical Report; World Health Organization: Geneva, Switzerland, 1999.
- Andreae, M. Biomass burning in the tropics: Impact on environmental quality and global climate. Popul. Dev. Rev. 1990, 16, 268–291. [Google Scholar] [CrossRef]
- Duclos, P.; Sanderson, L.M.; Lipsett, M. The 1987 forest fire disaster in California: Assessment of emergency room visits. Arch. Environ. Health 1990, 45, 53–58. [Google Scholar] [CrossRef]
- Emmanuel, S.C. Impact to lung health of haze from forest fires: The Singapore experience. Respirology 2000, 5, 175–182. [Google Scholar] [CrossRef]
- Johnston, F.H.; Webby, R.J.; Pilotto, L.S.; Bailie, R.S.; Parry, D.L.; Halpin, S.J. Vegetation fires, particulate air pollution and asthma: A panel study in the Australian monsoon tropics. Int. J. Environ. Health Res. 2006, 16, 391–404. [Google Scholar] [CrossRef]
- Rappold, A.G.; Stone, S.L.; Cascio, W.E.; Neas, L.M.; Kilaru, V.J.; Carraway, M.S.; Szykman, J.J.; Ising, A.; Cleve, W.E.; Meredith, J.T.; et al. Peat bog wildfire smoke exposure in rural north Carolina is associated with cardiopulmonary emergency department visits assessed through syndromic surveillance. Environ. Health Perspect. 2011, 119, 1415–1420. [Google Scholar] [CrossRef]
- Sastry, N. Forest fires, air pollution and mortality in southeast Asia. Demography 2002, 39, 1–23. [Google Scholar] [CrossRef]
- Larson, T.V.; Koenig, J.Q. Wood smoke: Emissions and noncancer respiratory effects. Annu. Rev. Public Health 1994, 15, 133–156. [Google Scholar] [CrossRef]
- Delfino, R.J.; Brummel, S.; Wu, J.; Stern, H.; Ostro, B.; Lipsett, M.; Winer, A.; Street, D.H.; Zhang, L.; Tjoa, T.; et al. The relationship of respiratory and cardiovascular hospital admissions to the southern California wildfires of 2003. Occup. Environ. Med. 2009, 66, 189–197. [Google Scholar] [CrossRef]
- Henderson, S.B.; Brauer, M.; MacNab, Y.C.; Kennedy, S.M. Three measures of forest fire smoke exposure and their associations with respiratory and cardiovascular health outcomes in a population-based cohort. Environ. Health Perspect. 2011, 119, 1266–1271. [Google Scholar] [CrossRef]
- Johnston, F.H.; Bailie, R.S.; Pilotto, L.S.; Hanigan, I.C. Ambient biomass smoke and cardio-respiratory hospital admissions in Darwin, Australia. BMC Public Health 2007, 7. [Google Scholar] [CrossRef]
- Kunii, O.; Kanagawa, S.; Yajima, I.; Hisamatsu, Y.; Yamamura, S.; Amagai, T.; Ismail, I.T. The 1997 haze disaster in Indonesia: Its air quality and health effects. Arch. Environ. Health 2002, 174, 16–22. [Google Scholar]
- Ostro, B.; Broadwin, R.; Green, S.; Feng, W.; Lipsett, M. Fine particulate air pollution and mortality in nine California counties: Results from Calfine. Environ. Health Perspect. 2006, 114, 29–33. [Google Scholar]
- Pope, C.A., III; Dockery, D.W. Health effects of particulate air pollution: Lines that connect. J. Air Waste Manag. Assoc. 2006, 56, 709–742. [Google Scholar] [CrossRef]
- Rückerl, R.; Schneider, A.; Breitner, S.; Cyrys, J.; Peters, A. Health effects of particulate air pollution: A review of epidemiological evidence. Inhal. Toxicol. 2011, 23, 555–592. [Google Scholar] [CrossRef]
- Samet, J.M.; Domnici, F.; Curriero, F.; Coursac, I.; Zeger, S. Fine particulate air pollution and mortality in 20 U.S. cities: 1987–1994. N. Engl. J. Med. 2000, 342, 1742–1757. [Google Scholar] [CrossRef]
- Schwartz, J.; Dockery, D.W.; Neas, L. Is daily mortality associated specifically with fine particles? J. Air Waste Manag. Assoc. 1996, 46, 927–939. [Google Scholar] [CrossRef]
- Zanobetti, A.; Schwartz, J. Air pollution and emergency admissions in Boston, MA, USA. J. Epidemiol. Community Health 2006, 60, 890–896. [Google Scholar] [CrossRef]
- Aditama, T. Impact of haze from forest fire to respiratory health: Indonesian experience. Respirology 2000, 5, 169–174. [Google Scholar] [CrossRef]
- Künzli, N.; Avol, E.; Wu, J.; Gauderman, W.J.; Rappaport, E.; Millstein, J.; Bennion, J.; McConnell, R.; Gilliland, F.D.; Berhane, K.; et al. Health effects of the 2003 Southern California wildfire on children. Amer. J. Respir. Crit. Care Med. 2006, 174, 1221–1228. [Google Scholar] [CrossRef]
- Moore, D.; Copes, R.; Fisk, R.; Joy, R.; Chan, K.; Brauer, M. Population health effects of air quality changes due to forest fires in British Columbia in 2003: Estimates from physician-visit billing data. Can. J. Public Health 2006, 97, 105–108. [Google Scholar]
- Naeher, L.P.; Brauer, M.; Lipsett, M.; Zelikoff, J.T.; Simpson, C.D.; Koenig, J.Q.; Smith, K.R. Woodsmoke health effects: A review. Inhal. Toxicol. 2007, 19, 67–106. [Google Scholar]
- Vedal, S. Ambient particles and health: Lines that divide. J. Air Waste Manag. Assoc. 1997, 37, 551–581. [Google Scholar] [CrossRef]
- Mott, J.; Meyer, P.; Mannino, D.M.; Redd, S.; Smith, E.; Gotway-Crawford, C.; Chase, E. Wildland forest fire smoke: Health effects and intervention evaluation, Hoopa, California, 1999. West. J. Med. 2002, 176, 157–162. [Google Scholar] [CrossRef]
- Schreuder, A.; Larson, T.; Sheppard, L.; Claiborn, C. Ambient woodsmoke and associated respiratory emergency department visits in Spokane, Washington. Int. J. Occup. Environ. Health 2006, 12, 147–153. [Google Scholar] [CrossRef]
- Shusterman, D.; Kaplan, J.; Canabarro, C. Immediate health effects of an urban wildfire. West. J. Med. 1993, 158, 133–138. [Google Scholar]
- Sutherland, E.; Make, B.; Vedal, S.; Zhang, L.; Dutton, S.; Murphy, J.; Silkoff, P.E. Wildfire smoke and respiratory symptoms in patients with chronic obstructive pulmonary disease. J. Allergy Clin. Immunol. 2005, 115, 420–422. [Google Scholar] [CrossRef]
- Viswanathan, S.; Eria, L.; Diunugala, N.; Johnson, J.; McClean, C. An analysis of effects of San Diego wildfire on ambient air quality. J. Air Waste Manag. Assoc. 2006, 56, 56–67. [Google Scholar] [CrossRef]
- Report of the Biregional Workshop on the Health Impacts of Haze Related Air Pollution. In Technical Report RS/98/GE/17(MAA); Regional Office for the Western Pacific, World Health Organization: Manila, Philippines, 1998.
- American Lung Association. State of the Air: 2004. In Technical Report; American Lung Association: New York, NY, USA, 2004. [Google Scholar]
- Anderson, H.; Atkinson, R.; Peacock, J.; Marston, L.; Konstantinou, K. Meta-Analysis of Time-Series Studies and Panel Studies of Particulate Matter (PM) and Ozone (O3). In Technical Report; World Health Organization (WHO): Geneva, Switzerland, 2004. [Google Scholar]
- Annesi-Maesano, I.; Agabiti, N.; Pistelli, R.; Couilliot, M.; Forastiere, F. Subpopulations at increased risk of adverse health outcomes from air pollution. Eur. Respir. J.Suppl. 2003, 40, S57–S63. [Google Scholar]
- Barnett, A.; Williams, G.; Schwartz, J.; Best, T.; Neller, A.; Petroeschevsky, A.; Simpson, R. The effects of air pollution on hospitalizations for cardiovascular disease in elderly people in Australian and New Zealand cities. Environ. Health Perspect. 2006, 114, 1018–1023. [Google Scholar] [CrossRef]
- Boezen, H.; Vonk, J.; van der Zee, S.; Gerritsen, J.; Hoek, G.; Brunekreef, B.; Schouten, J.P.; Postma, D.S. Susceptibility to air pollution in elderly males and females. Eur. Respir. J. 2005, 25, 1018–1024. [Google Scholar] [CrossRef]
- Brook, R.; Franklin, B.; Cascio, W.; Hong, Y.; Howard, G.; Lipsett, M.; Luepker, R.; Mittleman, M.; Samet, J.; Smith, S.C., Jr.; et al. Air pollution and cardiovascular disease: A statement for healthcare professionals from the Expert Panel on Population and Prevention Science of the American Heart Association. Circulation 2004, 109, 2655–2671. [Google Scholar] [CrossRef]
- Chen, Y.; Yang, Q.; Krewski, D.; Burnett, R.; Shi, Y.; McGrail, K. The effect of coarse ambient particulate matter on first, second, and overall hospital admissions for respiratory disease among the elderly. Inhal. Toxicol. 2005, 17, 649–655. [Google Scholar] [CrossRef]
- Goldberg, M.S.; Burnett, R.; Bailar, J., III; Brook, J.; Bonvalot, Y.; Tamblyn, R.; Singh, R.; Valois, M. Identifying Subgroups of 19 the General Population that may be Susceptible to Short-Term Increases in Particulate Air Pollution: A Time-Series Study in Montreal, Quebec. In Research Report 097; Health Effects Institute: Cambridge, MA, USA, 2000. [Google Scholar]
- Pope, C.A., III. Epidemiology of fine particulate air pollution and human health: Biologic mechanisms and who’s at risk? Environ. Health Perspect. 2000, 108, 713–723. [Google Scholar] [CrossRef]
- Pope, C.A., III; Burnett, R.; Thun, M.; Calle, E.; Krewski, D.; Ito, K.; Thurston, G.D. Lung cancer, cardiopulmonary mortality and long-term exposure to particulate air pollution. JAMA 2002, 287, 1132–1141. [Google Scholar] [CrossRef]
- Villeneuve, P.; Chen, L.; Stieb, D.; Rowe, B. Associations between outdoor air pollution and emergency department visits for stroke in Edmonton, Canada. Eur. J. Epidemiol. 2006, 21, 689–700. [Google Scholar] [CrossRef]
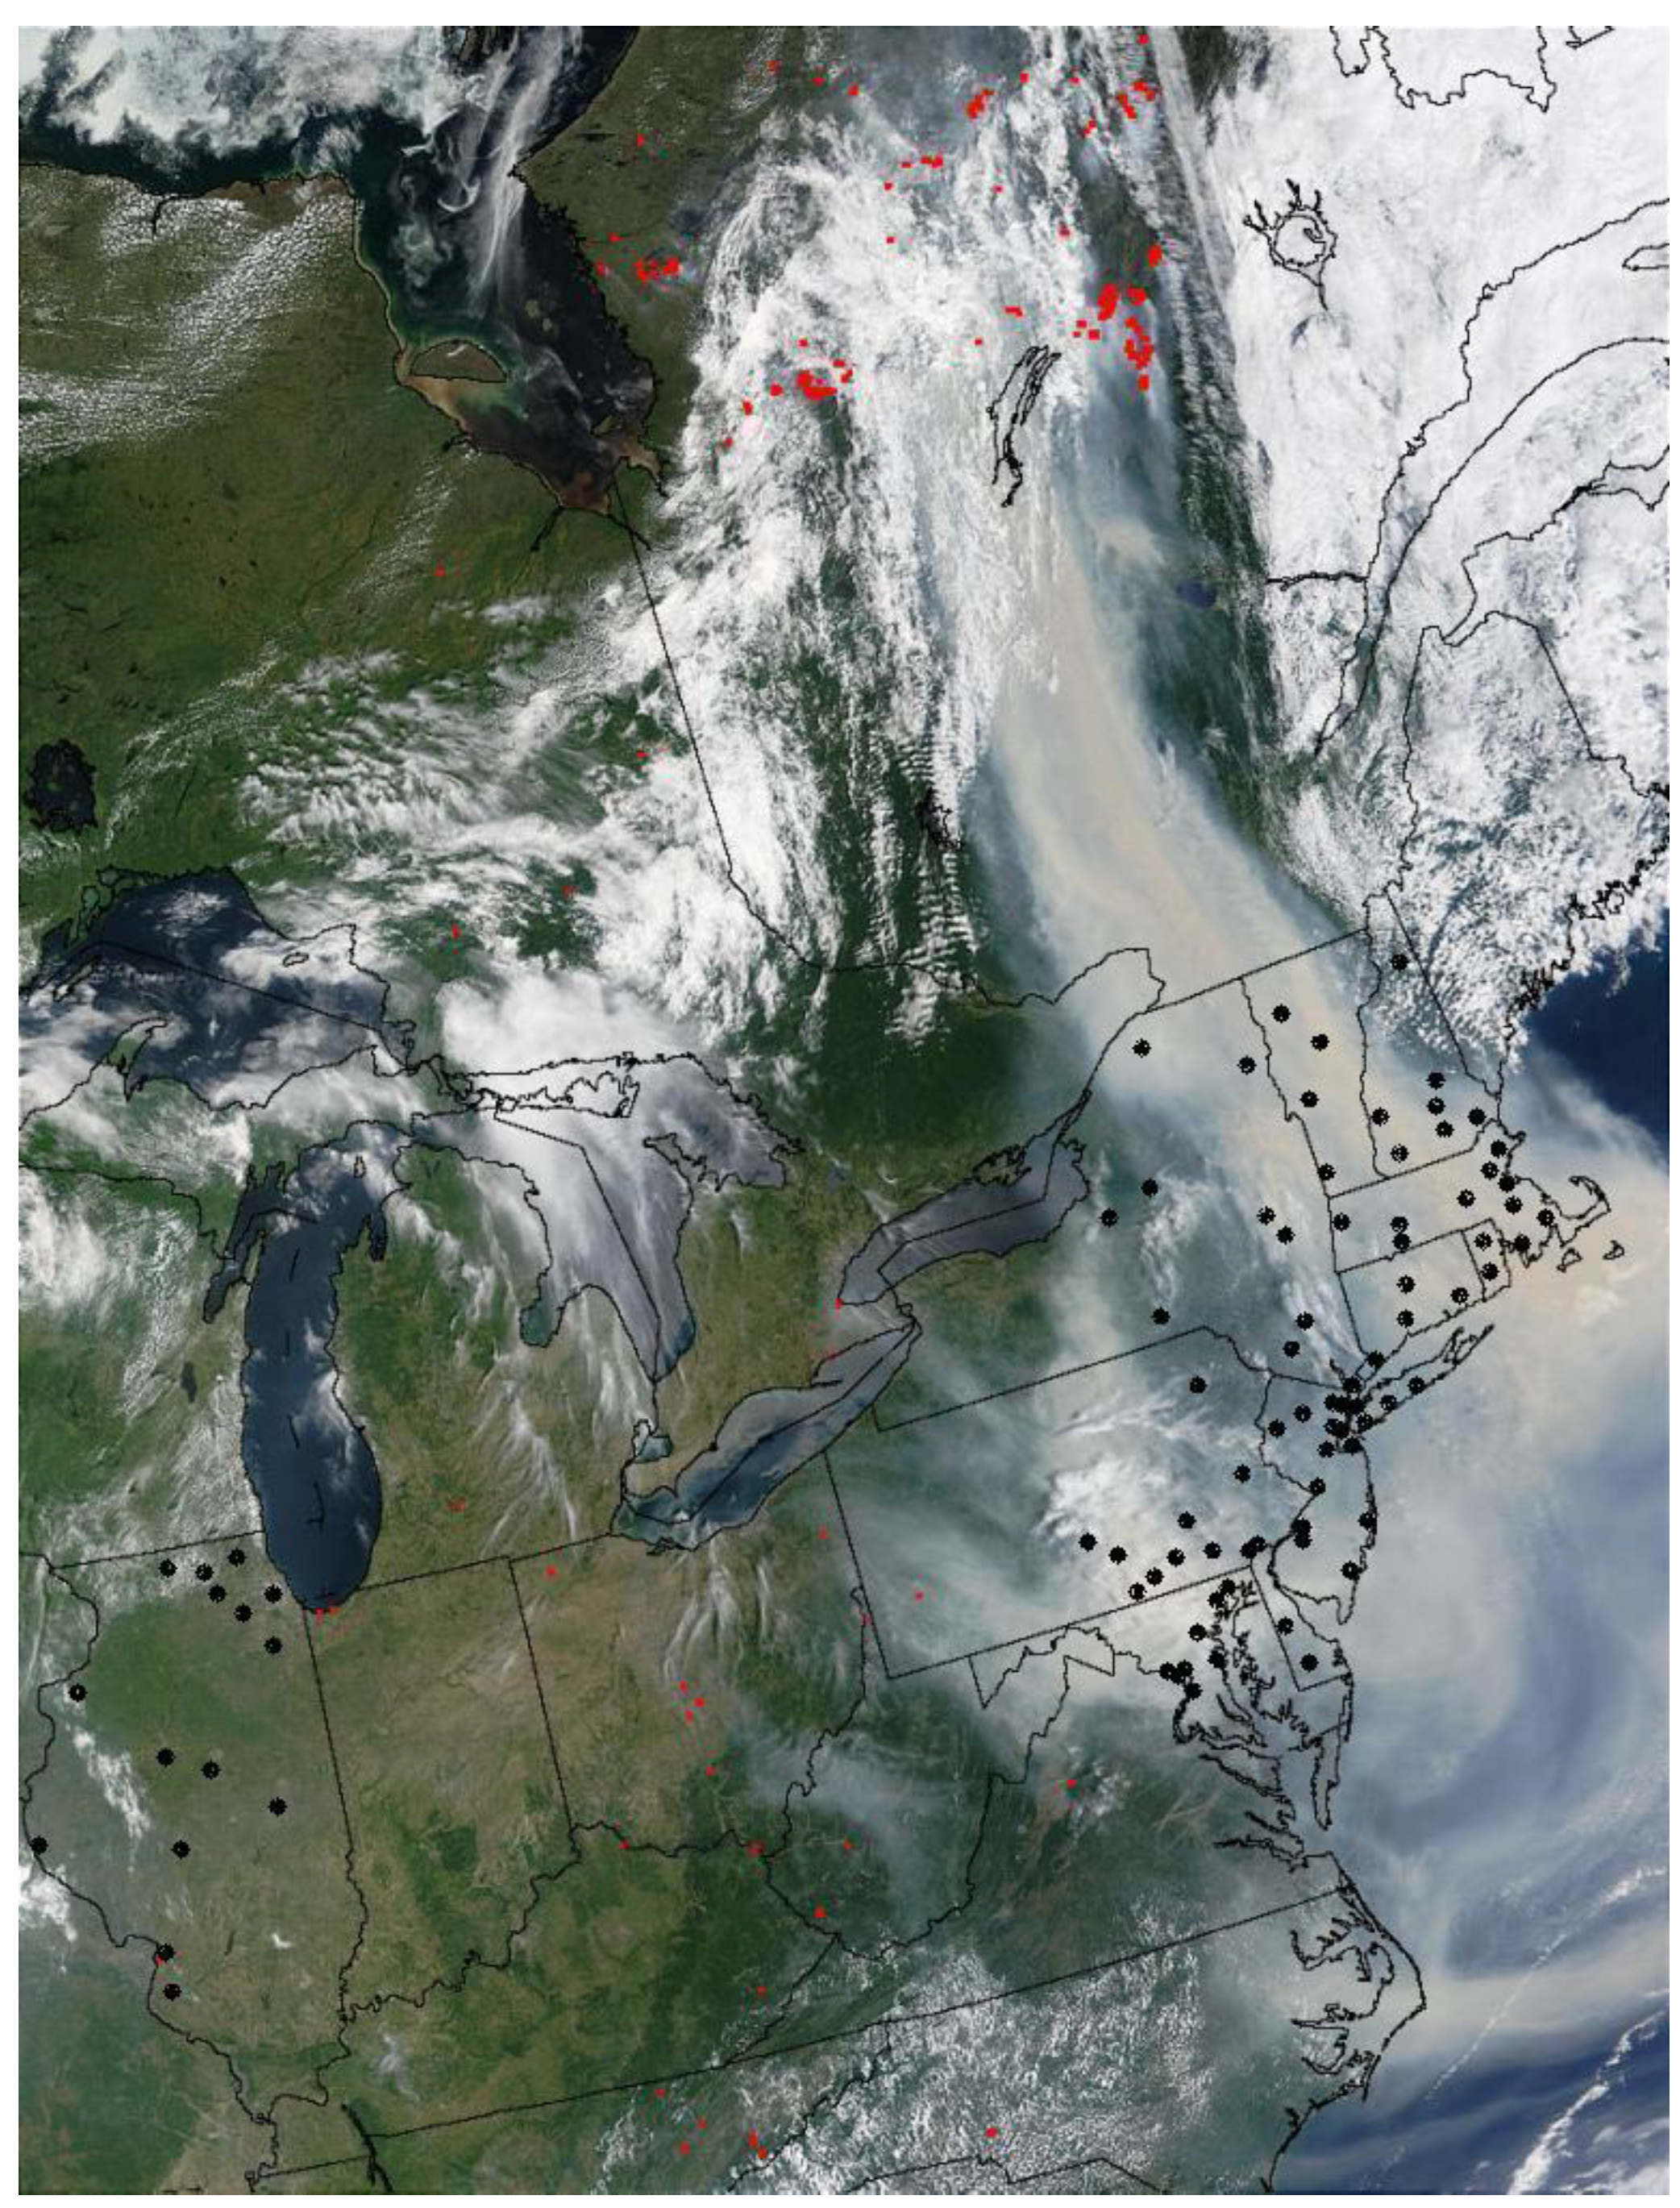
- DeBell, L.J.; Talbot, R.; Dibb, J. A major regional air pollution event in the northeastern United States caused by extensive forest fires in Quebec, Canada. J. Geophys. Res. 2004, 109, D19305. [Google Scholar] [CrossRef]
- NASA: Visible Earth. Wildfires in Quebec and Smoke over United States East Coast. Available online: http://visibleearth.nasa.gov/view.php?id=60610 (accessed on 1 February 2011).
- GFMC (Global Fire Monitoring Center)/Fire Ecology Research Group. 2007 UN International Strategy for Disaster Reduction (ISDR). Available online: http://www.fire.uni-freiburg.de/ (accessed on 3 December 2010).
- International Classification of Diseases, Ninth Revision (ICD-9); World Health Organization: Geneva, Switzerland, 1977.
- U.S. Environmental Protection Agency. Air Quality System Data Mart (Internet Database). Available online: http://www.epa.gov/ttn/airs/aqsdatamart (accessed on 1 February 2011).
- National Climatic Data Center. NCDC Surface Airways, CD Database; EarthInfo Inc.: Boulder, CO, USA, 2011. [Google Scholar]
- Cressie, N.A.; Cassie, N.A. Statistics for Spatial Data; Wiley: New York, NY, USA, 1993. [Google Scholar]
- Young, L.J.; Gotway, C.A.; Yang, J.; Kearney, G.; DuClos, C. Linking health and environmental data in geographical analysis: It’s so much more than centroids. Spat. Spatiotemporal Epidemiol. 2009, 1, 73–84. [Google Scholar] [CrossRef]
- R Core Team. R: A Language and Environment for Statistical Computing, 2014. Available online: Available online: www.r-project.org (accessed on 1 February 2014).
- Dominici, F.; Peng, R.; Bell, M.; Pham, L.; McDermott, A.; Zeger, S.; Samet, J.M. Fine particulate air pollution and hospital admission for cardiovascular and respiratory diseases. JAMA 2006, 295, 1127–1134. [Google Scholar] [CrossRef]
- Eftim, S.E.; Janes, H.; McDermott, A.; Samet, J.; Dominici, F. A comparative analysis of the chronic effects of fine particulate matter. Epidemiology 2008, 19, 209–216. [Google Scholar] [CrossRef]
- Liang, K.-Y.; Zeger, S. Longitudinal data analysis using generalized linear models. Biometrika 1986, 73, 13–22. [Google Scholar] [CrossRef]
- Peng, D.; Dominici, F. Statistical Methods for Environmental Epidemiology with R; Springer Science, Business Media, LLC: New York, NY, USA, 2008. [Google Scholar]
- Schwartz, J. The distributed lag between air pollution and daily deaths. Epidemiology 2000, 1, 320–326. [Google Scholar] [CrossRef]
- Welty, L.; Zeger, S. Are the acute effects of particulate matter on mortality in the national morbidity, mortality, and air pollution study the result of inadequate control for weather and season? A sensitivity analysis using flexible distributed lag models. Amer. J. Epidemiol. 2005, 162, 80–88. [Google Scholar] [CrossRef]
- Morgan, G.; Sheppard, V.; Khalaj, B.; Ayyar, A.; Lincoln, D.; Jalaludin, B.; Beard, J.; Corbett, S.; Lumley, T. Effects of brushfire smoke on daily mortality and hospital admissions in Sidney, Australia. Epidemiology 2010, 21, 47–55. [Google Scholar] [CrossRef]
- Vedal, S.; Steven, J.D. Wildfire air pollution and daily mortality in a large urban area. Environ. Res. 2006, 102, 29–35. [Google Scholar] [CrossRef]
- Dennekamp, M.; Abramson, M.J. The effects of bushfire smoke on respiratory health. Respirology 2011, 16, 198–209. [Google Scholar] [CrossRef]
- Dockery, D.; Ware, J.; Ferris, B.J.; Speizer, F.; Cook, N.; Herman, S. Change in pulmonary function in children associated with air pollution episodes. J. Air Pollut. Control Assoc. 1982, 32, 937–942. [Google Scholar] [CrossRef]
- Roemer, W.; Hoek, G.; Brunekreef, B. Effect of ambient winter air pollution on respiratory health of children with chronic respiratory symptoms. Amer. Rev. Resp. Dis. 1993, 147, 118–124. [Google Scholar] [CrossRef]
- Hoek, G.; Brunekreef, B. Effect of photochemical air pollution on acute respiratory symptoms in children. Amer. J. Resp. Crit. Care Med. 1995, 151, 27–32. [Google Scholar] [CrossRef]
- Hoek, G.; Dockery, D.; Pope, C.A.; Neas, L.; Roemer, W.; Brunekreef, B. Association between PM10 and decrements in peak expiratory flow rates in children: Reanalysis of data from five panel studies. Eur. Resp. J. 1998, 11, 1307–1311. [Google Scholar] [CrossRef]
- Brook, R.D.; Rajagopalan, S.; Pope, C.A.; Brook, J.R.; Bhatnagar, A.; Diez-Roux, A.V.; Holguin, F.; Hong, Y.; Luepker, R.V.; Mittleman, M.A.; et al. Particulate matter air pollution and cardiovascular disease: An update to the scientific statement from the American Heart Association. Circulation 2010, 121, 2331–2378. [Google Scholar] [CrossRef]
- Sin, D.; Man, S. Chronic obstructive pulmonary disease as a risk factor for cardiovascular morbidity and mortality. Proc. Amer. Thorac. Soc. 2005, 2, 8–11. [Google Scholar] [CrossRef]
- Sin, D.; Wu, L.; Man, S. The relationship between reduced lung function and cardiovascular mortality: A population-based study and a systematic review of the literature. Chest 2005, 127, 1952–1959. [Google Scholar] [CrossRef]
- Van Eeden, S.; Yeung, A.; Quinlam, K.; Hogg, J. Systemic response to ambient particulate matter: Relevance to chronic obstructive pulmonary disease. Proc. Amer. Thorac. Soc. 2005, 2, 61–67. [Google Scholar] [CrossRef]
- Swiston, J.R.; Davidson, W.; Attridge, S.; Li, G.T.; Brauer, M.; van Eeden, S.F. Wood smoke exposure induces a pulmonary and systemic inflammatory response in fire fighters. Eur. Resp. J. 2008, 32, 129–138. [Google Scholar] [CrossRef]
- Peters, A.; Döring, A.; Wichmann, H.E.; Koenig, W. Increased plasma viscosity during an air pollution episode: A link to mortality? Lancet 1997, 349, 1582–1587. [Google Scholar] [CrossRef]
- Dominici, F.; Sheppard, L.; Clyde, M. Statistical review of air pollution. Int. Statist. Rev. 2003, 71, 243–276. [Google Scholar] [CrossRef]
- Baicker, K.; Chandra, A.; Skinner, J.S.; Wennberg, J.E. Who you are and where you live: How race and geography affect the treatment of Medicare beneficiaries. Health Affair. 2004, 23. [Google Scholar] [CrossRef]
- Fisher, E.; Whaley, F.; Krushat, W.; Malenka, D.; Fleming, C.; Baron, J.A.; Hsia, D.C. The accuracy of Medicare’s hospital claims data: Progress has been made, but problems remain. Amer. J. Public Health 1992, 82, 243–248. [Google Scholar] [CrossRef]
- Havranek, E.; Wolfe, P.; Masoudi, F.; Rathore, S.; Krumholz, H.; Ordin, D. Provider and hospital characteristics associated with geographic variation in the evaluation and management of elderly patients with heart failure. Arch. Intern. Med. 2004, 164, 1186–1191. [Google Scholar]
- Kiyota, Y.; Schneeweiss, S.; Glynn, R.; Cannuscio, C.; Avorn, J.; Solomon, D. Accuracy of Medicare claims-based diagnosis of acute myocardial infarction: Estimating positive predictive value on the basis of review of hospital records. Amer. Heart J. 2004, 148, 99–104. [Google Scholar] [CrossRef]
- Janssen, N.A.H.; Schwartz, J.; Zanobetti, A.; Suh, H.H. Air conditioning and source-specific particles as modifiers of the effect of PM10 on hospital admissions for heart and lung disease. Environ. Health 2002, 110, 43–49. [Google Scholar]
- Analitis, A.; Georgiadis, I.; Katsouyanni, K. Forest fires are associated with elevated mortality in a dense urban setting. Occup. Environ. Med. 2012, 69, 158–162. [Google Scholar]
- Hanigan, I.C.; Johnston, F.H.; Morgan, G.G. Vegetation fire smoke, indigenous status and cardio-respiratory hospital admissions in Darwin, Australia, 1996–2005: A time-series study. Environ. Health 2008, 7. [Google Scholar] [CrossRef]
- See, S.; Balasubramanian, R.; Rianawati, E.; Karthikevyan, S.; Streets, D. Characterization and source apportionment of particulate matter ≤2.5 μm in Sumatra, Indonesia, during a recent peat fire episode. Environ. Sci. Technol. 2007, 41, 3488–3494. [Google Scholar] [CrossRef]
- IPCC 2007: Climate Change: Synthesis Report. Contribution of Working Groups I, II and III to the Fourth Assessment Report of the Intergovernmental Panel on Climate Change; Core Writing Team; Pachauri, R.K.; Reisinger, A. (Eds.) IPCC: Geneva, Switzerland, 2007; p. 104.
- Westerling, A.L.; Hidalgo, H.G.; Cayan, D.R.; Swetnam, T.W. Warming and earlier spring increases western U.S. forest wildfire activity. Science 2006, 313, 940–943. [Google Scholar] [CrossRef]
- Pechony, O.; Shindell, D.T. Driving forces of global wildfires over the past millennium and the forthcoming century. Proc. Nat. Acad. Sci. USA 2010, 107, 19167–19170. [Google Scholar] [CrossRef]
© 2014 by the authors; licensee MDPI, Basel, Switzerland. This article is an open access article distributed under the terms and conditions of the Creative Commons Attribution license (http://creativecommons.org/licenses/by/3.0/).
Share and Cite
Le, G.E.; Breysse, P.N.; McDermott, A.; Eftim, S.E.; Geyh, A.; Berman, J.D.; Curriero, F.C. Canadian Forest Fires and the Effects of Long-Range Transboundary Air Pollution on Hospitalizations among the Elderly. ISPRS Int. J. Geo-Inf. 2014, 3, 713-731. https://doi.org/10.3390/ijgi3020713
Le GE, Breysse PN, McDermott A, Eftim SE, Geyh A, Berman JD, Curriero FC. Canadian Forest Fires and the Effects of Long-Range Transboundary Air Pollution on Hospitalizations among the Elderly. ISPRS International Journal of Geo-Information. 2014; 3(2):713-731. https://doi.org/10.3390/ijgi3020713
Chicago/Turabian StyleLe, George E., Patrick N. Breysse, Aidan McDermott, Sorina E. Eftim, Alison Geyh, Jesse D. Berman, and Frank C. Curriero. 2014. "Canadian Forest Fires and the Effects of Long-Range Transboundary Air Pollution on Hospitalizations among the Elderly" ISPRS International Journal of Geo-Information 3, no. 2: 713-731. https://doi.org/10.3390/ijgi3020713
APA StyleLe, G. E., Breysse, P. N., McDermott, A., Eftim, S. E., Geyh, A., Berman, J. D., & Curriero, F. C. (2014). Canadian Forest Fires and the Effects of Long-Range Transboundary Air Pollution on Hospitalizations among the Elderly. ISPRS International Journal of Geo-Information, 3(2), 713-731. https://doi.org/10.3390/ijgi3020713