Review

A Comparative Review of North American Tundra Delineations

1
College of the Environment and Life Sciences, 106 Coastal Institute-MESM, University of Rhode Island, Kingston, RI 02881, USA
2
Sigma Space Corporation, Biospheric Sciences Laboratory, Code 618, NASA Goddard Space Flight Center, Greenbelt, MD 20771, USA
*
Author to whom correspondence should be addressed.
ISPRS Int. J. Geo-Inf. 2013, 2(2), 324-348; https://doi.org/10.3390/ijgi2020324
Submission received: 29 January 2013 / Accepted: 25 March 2013 / Published: 8 April 2013

Abstract

:
Recent profound changes have been observed in the Arctic environment, including record low sea ice extents and high latitude greening. Studying the Arctic and how it is changing is an important element of climate change science. The Tundra, an ecoregion of the Arctic, is directly related to climate change due to its effects on the snow ice feedback mechanism and greenhouse gas cycling. Like all ecoregions, the Tundra border is shifting, yet studies and policies require clear delineation of boundaries. There are many options for ecoregion classification systems, as well as resources for creating custom maps. To help decision makers identify the best classification system possible, we present a review of North American Tundra ecoregion delineations and further explore the methodologies, purposes, limitations, and physical properties of five common ecoregion classification systems. We quantitatively compare the corresponding maps by area using a geographic information system.

1. Introduction

The Arctic has been a topic of published research since the 19th century. As early as 1,865 scientists recognized that the Arctic region played a significant role in regional and global climates [1]. More recent research has shown profound changes in the Arctic environment. In September 2012, Arctic sea ice appeared to reach its lowest seasonal minimum extent in the satellite record since these data became available in 1979 due to thinning ice and warmer Arctic temperatures [2]. The sea ice extent of under 3.5 million square kilometers recorded in September 2012 surpassed the previous minimum (4.13 million square kilometers) record set in 2007 [2]. Air temperature has increased and permafrost has generally been warming [3]. Warming temperatures have also been linked to earlier plant flowering and altered regional species composition in Arctic regions [4,5,6,7,8]. Similarly, research indicates that climate change related greening is occurring in high-latitude areas, which may in turn amplify warming in the growing season [9]. Concerns are growing about permanent ice loss and the idea of a tipping point in the Tundra, where feedback loops create conditions that accelerate warming [5,9]. An essential aspect of these studies concerns the pattern and extent of Arctic ecosystems. Understanding how boundaries of ecological regions within the Arctic are delineated will help ensure the progress of Arctic science.
The Arctic is the region around the North Pole, defined as being north of 60°N in North America [10]. It is comprised of multiple ecological regions, or “ecoregions.” There are many definitions of ecoregion, but it is generally an area with similar environmental, ecological, and geographical characteristics and interactions [11]. We use the term ecoregion extensively in this paper as a means to classify the Tundra, which is a region of the Arctic. Besides being a type of ecosystem, the term “Tundra” can also simply refer to the type of vegetation (see below for details) found in the sub-Arctic. Early, generalized definitions of the Tundra described it as the flat region that includes the Arctic coast and an area inland as far as 800 miles (1,287 km) south [12].
Perhaps the earliest instance of large-scale mapping of ecological boundaries is Merriam’s 1898 Life and Crop Zones of the United States [13]. Based largely on flora, fauna, and soil, Merriam sought to identify which areas of the United States are best suited for certain crops. In 1939, Clements and Shelford authored a book on the topic of bioecology that discusses organisms that are typical for particular habitats and their relationships with each other and their habitats [14]. A 1966 phytoecological study was performed by Maini [15] in the area surrounding Small Tree Lake in the Northwestern Territories, Canada, where he determined the structure and composition of various vegetation types and their relationships with the landscape. Maini used a boundary delineation characterized as sylvotundra, which is described by Tikhomirov [16] as being a transition zone between the Tundra and Taiga. More recently, federal agencies, such as the US Environmental Protection Agency (EPA) and US Geological Survey (USGS), and international organizations, such as the Commission for Environmental Cooperation (CEC) and the Nature Conservancy (TNC) have continued to create and refine ecoregion maps.
Delineating an area into ecoregions that have clearly defined boundaries enables the development of empirical relationships between features in different geographic locations. Delineations can differ, however, due to deviations in underlying assumptions, goals, and individual choices of the creators employing the “art” of devising the boundaries [17]. Ecoregion classification methods differ greatly depending on the input variables chosen and the weights placed on those variables. Criteria that are frequently used include vegetation, soil, climate, wildlife, and human activity. As a result of the large number of possible choices for input variables, there are many ways to delineate ecoregion boundaries. In addition, temporal shifts inherent in natural processes cause each ecoregion dataset to represent boundaries at only one instant in time.
The Tundra is a region that has been delineated in many ecoregion maps and is sometimes further split into sub-regions. It has landscapes ranging from vast plains to ice covered lakes, average temperature ranging from −17 °C to −7 °C, and subsoil that is permanently frozen. The associated vegetation types include tall shrub (2–5 m), dwarf shrub heath (5–20 cm), and graminoid-moss [18]. The region is generally characterized by a wide variety of mammals and birds and has undergone very little development by humans [19]. Besides the Tundra’s biological significance, it also contains about 14% of the global stored carbon [20] and warming of the Tundra could generate a large source of methane emissions to the atmosphere [21].
Like all ecoregions, the Tundra border is shifting [22], yet studies require clear delineation of ecoregion boundaries. The National Aeronautic and Space Administration’s (NASA) Arctic-Boreal Vulnerability Experiment (ABoVE) seeks to more fully understand the evolving Arctic-Boreal environment to improve the ability to develop societal responses to climate change. Specifically, NASA researchers would like to know more about processes controlling soil carbon and the potential release of carbon dioxide and methane from the decomposition of thawed permafrost. This type of large-scale project requires common geospatial datasets from which to work. The challenge is choosing an appropriate, commonly accepted dataset that can satisfy the needs of multiple investigators.
The objective of our study is to help researchers identify a viable Tundra dataset for their own current and future work. We will present a review of classification systems for delineating the boundary of the Tundra when considered as an ecological region. Besides aggregating the literature and summarizing five prominent approaches, this paper serves to assist researchers to more easily and efficiently utilize geographic information system(s) (GIS). To help accomplish this, we present classification systems and maps that are available digitally and can therefore be more easily optimized through GIS, as well as maps that are only available in analog format. We will explore available Tundra datasets and compare and contrast the intents and uses of exemplars by:
  • explaining the specific classification systems including methodologies, purposes, and properties like scale and area (Section 2)
  • quantitatively comparing the Tundra geospatial mapping products by area (Section 3)
  • presenting two case studies that illustrate ways to actually combine classification systems to achieve specific goals (Section 4)
  • describing approaches that can be used to choose a classification system (Section 5)

2. Methodologies of Ecoregions Classification Systems

We have identified datasets that incorporate different techniques and resulting boundary delineations (Table 1). The five datasets we examine in detail (Section 2.2) were chosen to represent the best combination of comprehensiveness, documentation, and availability while simultaneously being the most commonly used and updated. Each classification system analyzed has one or more corresponding map available digitally that is comprised of North American Tundra and may also include information beyond the Arctic. Explicit accuracy assessments were unavailable for most of the datasets that were reviewed; hence we produce a qualitative analysis of them and provide a consolidated set of information to allow a user to make an informed choice when selecting a dataset.
Table 1. Summary of maps and classification systems that represent ecoregions encompassing Tundra area in North America. If an author or source has more than one version of a map due to updates, the most recent version is listed below. If the associated GIS data are available online, a citation is included. Format of the table was adapted from Brandt [23].
Author, Year Published or Last Updated ScaleName or Terminology UsedOptions for Spatial Extent of ProductsFormat (Vector, Raster, Hardcopy)Types of Tundra at Highest Level of Detail (if Available)Main Criteria Used
BCMFR, 2012
1:600,000–20,000
Data [24]
Biogeoclimatic ecosystemsBritish ColumbiaVectorNone directly labeled tundraClimate, vegetation, and site characteristics
Saucier et al., 2011
1:1,250,000
Data [25]
vegetation zones, bioclimatic domainsQuebecHardcopy3Vegetation, forest inventory plots, elevation
Brandt, 2009 [23]
recommended usage
1:8–5 million
Digital data [26]
Boreal ZonesNorth America Boreal ZoneVectorNone directly labeled tundraPhytogeography and previous maps
Kottek et al., 2006 [27]
0.5 degree lat/long
Data [28]
Köppen-Geiger Climate ClassificationWorldVector/Raster1Climate, vegetation, and fauna
Alberta Tourism, Parks, and Recreation, 2006
1:250,000
Data [29]
Methods: Natural
Regions Committee [30]
Natural regions and subregionsAlbertaVectorNone directly labeled tundraClimate, soil, vegetation, land distribution, elevation, and remote sensing data
Omernik’s Ecological Regions, 2006
1:50–5 million
Data [31]
EcoregionsNorth America except Greenland, Conterminous United States, and individual statesVector20location, climate, geology, physiography, vegetation, hydrology, terrain, wildlife, and human activity
Circumpolar Arctic Vegetation Map, 2005 [32]
1:7.5 million
Data [33]
Vegetation mapCircumpolar regionVector8remote sensing data, elevation, hydrology, vegetation, surficial and bedrock geology, soils, percentage water cover, bioclimate subzones, and floristic provinces
Global Land Cover, 2002 [34]
1 km at equator
Data [35]
Global Land CoverWorld, options for specific continents and some countries. Max latitude is 75°N.Raster3SPOT Vegetation
Olson et al.’s Terrestrial Ecoregions, 2001
Digital data [36]
Methods [37]
EcoregionsGlobal Terrestrial, Freshwater, and Marine Ecoregions. “Global 200”Vector18Biodiversity and fauna/vegetation distribution
Unified Ecoregions of Alaska, 2001
1:2.5 million
Data [38]
United Ecoregions of AlaskaAlaskaVector6Vegetation, soils, hydrography, and glaciation
Bliss, 2000 [18]
1:80 million
Arctic and Polar Desert BiomeNorth AmericaHardcopy2Vegetation, climate, soil, permafrost
Elliott-Fisk, 2000 [39]
1:33.3 million
EcotonesNorth AmericaHardcopy2Vegetation, climate, soil
Ecological Stratification Working Group, 1999
1:7.5–1.1 million
Data [40]
Methods [41]
Eco-district,
-region,
-province,
-zone
CanadaVectorNone directly labeled tundraClimate, vegetation, landform, soil, wildlife, geology, water, and human activity. Based on Wiken (1986)
Bailey’s Ecoregions, 1997 [42]
1:15 million
Data [43]
Methods [44]
EcoregionsUSA, North America, All Continents, Marine and Freshwater EcoregionsVector7landform, climate, vegetation, soils, and fauna
Nowacki and Brock, 1995
1:5 million
Data [45]
EcoMap, Ecoregions, and subregionsAlaskaVector7Adapted from Bailey (1997) above
Schultz, 1995 [46]
Only a classification system
EcozonesWorldNo map3Climate, relief and drainage, soils, vegetation, fauna, and human activity
Timoney, 1988
[47] 1:5,847,000
Geobotanical studyNorthwest Territories and northern ManitobaHardcopy6Aerial photography of vegetation
Tuhkanen, 1984 [48]
1:47,619,000
Circumboreal climatic-phytogeographi-cal zonesArctic, hemiarctic, boreal, and temperate zonesHardcopyNone directly labeled tundraBiotempera-ture, potential evapotranspiration, effective temperature sum, and length of growing season
Payette, 1983 [49]
1:8,696,000
Vegetation zonesNorthern Quebec and LabradorHardcopy2Distribution of tree species using aerial photography and ground surveys
Atkinson, 1981 [50]
Only a classification system
EcotonesCanadian subarcticNo map3Vegetation, treeline, previous works
Brown et al., 1979 [51]
1:1,000,000–62,500
Biotic CommunitiesNorth AmericaHardcopy12Vegetation, fauna, soils, temperature
Nature Conservancy, 2006
1:1 million
Data [52]
Biotic CommunitiesSouthwest USAVector1Adapted from Brown and Lowe (1979) above
Franklin, 1977 [53]
Scale not given
BiospheresContinental USA and AlaskaHardcopy2Adapted from Udvardy, also took into account size and legal issues
Oswald and Senyk, 1977 [54]
1:2.5 million
EcoregionsYukon TerritoryHardcopyNone directly labeled tundraTree species distribution, permafrost, and topography using: Landsat imagery, aerial photography, aerial and ground surveys, physiographic, climatic, and geological maps
Walter and Box, 1976 [55]
only a classification system
Global classification of natural terrestrial ecosystemsWorldNo map1Climate, fauna, vegetation, soil
Udvardy, 1975 [56]
1:10 million
Data [57] Metadata [58]
Biogeographical provincesWorldVector3Vegetation, ecological climax, fauna, climate, physiography, and soil
Hare and Ritchie, 1972 [59]
1:2.5 million
Boreal BioclimatesCanada and AlaskaHardcopy5Plant cover, especially tree species
Crowley, 1967 [60]
1 inch = 500 miles
BiogeographyCanadaHardcopy3Vegetation, climate, and soil
Lobeck, 1948 [61]
1:12 million
Physiographic provincesNorth AmericaHardcopyNone directly labeled tundraPhysiography
Dice, 1943 [62]
1 inch = 500 miles
Biotic ProvincesNorth AmericaHardcopyNone directly labeled tundraSame as Udvardy (1975) above
Thornthwaite, 1931 [12]
1:20 million
ClimatesNorth AmericaHardcopy1Climate, soil, plant distribution
The methods of ecoregion classification can be described as qualitative or quantitative. Qualitative ecoregionalization relies more heavily on expert knowledge, while quantitative is often faster and more replicable. Both may be considered multivariate analyses, but with a qualitative approach the creator uses expert opinion to weight the input factors. Some argue that quantitative classification is preferable because it is more objective [63,64], while others believe that qualitative should be used because it allows human expertise to identify unique ecological landscape characteristics [65,66,67], such as a floodplain [68]. Combined approaches have been suggested on the assumption that that the two methods can complement each other. For example, one could use quantitative methods to delineate boundaries, using equally weighted variables to provide an initial basis that an expert can subsequently modify [69]. The debate of quantitative versus qualitative is ongoing in the field of ecoregion delineation.

2.1. Quantitative Ecoregion Classification Examples

Quantitative ecoregion delineation methods often rely on computer models and large amounts of data. They can also provide information that qualitative maps cannot, such as sharpness of borders [63].
Hargrove and Hoffman [63] delineated ecoregion borders quantitatively using multivariate clustering. Their technique, like most quantitative approaches, allows for the use of massive amounts of data. One important aspect of their procedure is that it finds and visualizes ecoregion borders with the ability to portray the sharpness, or representativeness, of the borders at any point along the line [63]. Being able to visualize the sharpness of borders, in this case using contours, is useful because there always exists at least some gradation between ecoregion boundaries, as opposed to a distinct line. The process involves an algorithm that utilizes Euclidian Distance, principal-component analysis (PCA), and what the authors call Multivariate Geographic Clustering (MGC) to analyze the environmental characteristics the user wishes to apply. In one case, the authors use nine environmental conditions, organized with three PCAs, to map the United States. The first PCA grouped soil density, mineral soil depth, and bedrock depth. A second PCA grouped mean annual temperature and precipitation, and inverse elevation and slope. The third PCA grouped annual solar insolation and inverse soil water holding capacity [63]. This segregated the US into 50 distinct ecoregions, but they have also divided the US into as many as 7,000 distinct ecoregions using 1 km2 resolution.
Zhou et al. [64] developed a technique that is fast and replicable using remotely sensed information and other environmental and natural resources spatial data. The authors’ Spatial Pattern Analysis Model uses an algorithm that merges the most similar neighbors based on designated criteria. They used GIS to create an automated procedure for ecosystem mapping based on soil rooting depth, organic matter content, available water capacity, growing degree days, and multi-temporal satellite-derived greenness [64]. It is an agglomerative hierarchical clustering procedure that, in the case of Nebraska, combined 2,024 polygons to form hierarchical regions [69].
Hargrove and Hoffman [69] reviewed several quantitative ecoregion classification methods, such as different algorithms and regression modeling. For example, Generalized Additive Modeling (GAM) determines evidence-based connections between response variable and predictor variables. GAM can handle nonlinear relationships, but the probability distribution must be specified [69]. There are also multiple types of GAM for regionalization and geographic range prediction, such as Classification and Regression Trees (CART) and Regression Tree Analysis (RTA) [69]. A regression tree works by having test criteria of a predictor variable defined at each step of a binary decision tree [69]. The nodes can later be removed or shrunk to attain generalization.

2.2. Detailed Summaries of Five Datasets

In this section, we explain the methodologies and properties of common ecoregion datasets currently in use. Except for Global Land Cover 2000 [34], the datasets are all qualitative and the boundaries still vary due to input choices made by their creators. Here we explore in detail five datasets: Omernik’s Ecological Regions [31]; Bailey’s Ecological Regions [42]; Olson et al.’s Terrestrial Ecoregions [37]; the Circumpolar Arctic Vegetation Map [32]; and the Global Land Cover-2000 North America product [34]. These five systems were chosen for analysis because they are robust, recently updated, available online, and show how different goals and choices result in different delineations of the North American Tundra.

2.2.1. Omernik Ecological Regions (OER)

The overall OER mapping effort relies on identifying areas in which the aggregate of biotic, abiotic, terrestrial, and aquatic characteristics are similar, and uses expert human judgment of patterns found in maps [68]. The main purpose is to assist natural resource managers in understanding realistically attainable resource quality [70], water quality assessment, and general ecosystem management [11]. Similar to the other sources, the OER delineations build upon the work of others. OER is a multiagency, multinational, and multidisciplinary collaboration. The agencies involved include the EPA, USGS, nationalatlas.gov, Canada, and CEC. OER builds on a framework that Omernik originally began in 1987 (see Section 5.1) using the weight of evidence approach [66]. This approach accounts for the differences in relative importance of the various characteristics for different regions and scales [67]. OER’s approach is integrated, meaning it uses the interrelatedness of the variables to reinforce the distinctiveness of particular areas. For example, land use is a strong integrative tool in that it describes the characteristics of soils, physiography, and climate because they affect the capacity of the land [71].
There are currently four separate levels of detail in OER, with Level I being the coarsest. Each level of detail uses satellite imagery and natural resource maps to different extents. The Level I product is useful for intercontinental scale work. Level II is more useful for national and subcontinental overviews of physiography, wildlife, and land use [19]. Level III has been created using remote sensing techniques and natural resource maps of scales as fine as 1:2 million. This allows locally defining characteristics to be identified and specific management strategies to be formulated. Ecoregions have been digitally drawn at 1:250,000. Use for smaller areas, such as projects requiring a 1:24,000 scale map boundary, is not recommended by the EPA [72].
At its most general, OER classifies our area of interest as “Tundra.” Level II breaks this down into four sections, which are Northern Arctic, Alaska Tundra, Brooks Range Tundra, and Southern Arctic. Level III Tundra includes between one and nine subsections under Level II. There are excellent descriptions of the criteria for all Level III units available online by Wiken et al. (see [73]). These descriptions, which show the slight differences between the Level III areas, include location, climate, vegetation, hydrology, terrain, wildlife, and land use/human activity. Regional experts are employed from a variety of disciplines to help compile the map and perform field verification for Levels III and IV detail areas [67]. Completion of Level IV detail is done on a state-by-state basis depending on funding availability. The map was last updated in its entirety in 2006, although sections of Levels III and IV Ecoregions of the Conterminous United States were more recently revised in December 2011 and published May 2012 [72]. It should be noted that Greenland is not included in the North America product because the project is a partnership only between Canada, USA, and Mexico.
Examples of applications of OER include the Indiana Biological Survey Aquatic Research Center [74], Regionalization of the Index of Biotic Integrity for Texas Streams [75], and the Arizona Forest Resource Strategy [76]. Gallant et al. [70] also adapted OER to document trends in land-cover and land-use dynamics in the conterminous USA from 1973–2000. They needed a framework that recognized the relative influences of different environmental characteristics and found that OER corresponded well with spatiotemporal patterns of land cover and surface water quality [70].

2.2.2. Bailey Ecological Regions (BER)

The BER interpretation draws upon three decades of expertise in the study of interactions between the environment and its effects on the distribution of flora and fauna, or ecogeography [65]. It is a collaboration between the US Forest Service (USFS), TNC, and USGS [77]. BER uses a hierarchical classification that first divides land areas into four large ecosystem “Domains” using climatic factors, such as temperature and precipitation. Then the Domains are further split into ecosystem “Divisions,” such as Tundra Division or Temperate Steppe Division. Divisions are based on climate, vegetation, soil, and geomorphic processes. Lastly, Divisions are broken up into ecosystem “Provinces,” such as Arctic Tundra Province or Great Plains Steppe Province. Provinces are classified using land-surface form, climate, vegetation, soils, and fauna. The Tundra areas, for example, can be found within the Polar Domain. Descriptions of the various levels of detail of ecoregions of the United States and a complete description of the classification approach by Bailey are available online (see [44]).
The overall focus in mapping the BER is in deciphering the environmental variables that steer ecosystem processes at multiple scales and using those variables to partition the landscape [68]. The main purpose of this is to assist the USFS with augmenting public land-management organization and involvement in regional long-term planning [70]. BER has a scale of 1:15 million that makes regional planning possible, but limits its applications for local planning.
Organizations such as TNC [78,79]; the National Wildlife Federation [80]; and the USDA UV-B Monitoring and Research Program [81] have found BER useful for their land management and regional planning purposes.

2.2.3. Olson et al. Terrestrial Ecoregions (OTE)

The OTE map, a production of the World Wildlife Federation (WWF), was developed to aid in biodiversity conservation planning and places a greater emphasis on floral/faunal differences between regions. It is a map of terrestrial biodiversity that gives enough detail to be useful in global and regional conservation priority setting and planning efforts. It is meant for identifying vulnerable areas, thresholds/tradeoffs for biodiversity, etc. The OTE is hierarchical. The broadest level is realm, which contains 14 terrestrial biomes and 825 terrestrial ecoregions within the biomes. The average size of an ecoregion is 150,000 square kilometers [37]. The “Global 200” map [82], generated by using the OTE map, represents what Olson et al. found to be the 200 most biologically distinct terrestrial, freshwater, and marine areas of the planet.
OTE was created using a variety of biogeographic maps that were previously published for specific regions. OTE actually adopts and modifies its Nearctic and continental US regions from OER [83]. Olson et al. [37] modify OER’s complexly defined ecoregions to reflect assemblages of species and ecological communities of conservation interest [17]. It is possible and indeed likely that the OTE delineations match observed changes in climate, but first and foremost, the map is meant to reflect the distributions of animals and plants around the world [37]. Decision makers can use this information as a tool for conservation planning, perhaps in a more direct manner than possible when using OER. For example, one can map the richness of the world’s terrestrial mammal species by ecoregion. Olson et al. [37] showed that the mammal species richness of the Tundra varies from 0–66. Another illustration of the potential uses of OTE is how Olson et al. [37] mapped terrestrial mammal species endemism. The authors’ analysis yielded 0–3 mammal species endemism for the Arctic area, including the Tundra.

2.2.4. Circumpolar Arctic Vegetation Map (CAVM)

The CAVM is another highly collaborative project that involves public and private organizations from around the world, although the final map was ultimately published by the US Fish and Wildlife Service (USFWS) and the Circumpolar Arctic Flora and Fauna (CAFF) project. Based on maps with scales ranging from 1:2.5 million to 1:4 million, factors incorporated into the final map include remote sensing imagery, topography, hydrology, vegetation, surficial geology, bedrock geology, soils, percentage water cover, bioclimate subzones, and floristic provinces [32]. At first glance, it may make sense to simply use the bioclimate subzones that were incorporated into creating the end map. The final product may be better used for Tundra boundaries than the bioclimate subzones, however, because the final vegetation map has the specific Tundra regions and types already labeled. In addition, the bioclimate subzones are based on very sparse climate data [32] and do not integrate the aforementioned factors. Therefore, the final CAVM is a better choice in regards to ecoregion boundary accuracy. In their paper, Walker et al. [32] also summarize other arctic bioclimate zonation approaches. The CAVM, however, is the most updated, robust, and only readily available and digitized option. The GIS data of the final product and all the inputs can be found online (see [33]).
The CAVM was created with the purpose of creating a map of the composition and distribution of vegetation units in the Arctic and is specifically restricted to the arctic region [32]. Because of this, it has less areal extent than the other classification systems we analyze in Section 3.

2.2.5. Global Land Cover-2000 (GLC)

Implemented by the European Commission Joint Research Centre and developed by Latifovic et al. [34], GLC is an option for projects that require raster data. This product represents the various vegetation classes in North America. It was derived using satellite Système Pour l’Observation de la Terre (SPOT) vegetation data. It was generated jointly by Natural Resources Canada and the USGS. GLC may be used for Tundra boundaries when there are specific requirements for, or particular emphasis on, vegetation. As a demonstration, we find the raster has similar dimensions to the vector products (Table 2) by extracting raster values 15–17. These values correspond with layers called Temperate or Subpolar Grassland with a Sparse Shrub, Polar Grassland with a Sparse Shrub, and Polar Grassland with a Dwarf-Sparse Shrub, respectively. In this way, we create and classify our own Tundra range because Tundra was not explicitly labeled or defined beforehand.
Table 2. Tundra ecoregion areas (km2) estimated by five different delineation approaches, broken down by regions. Mean, standard deviation, and coefficient of variation of the estimates are provided. Data source of boundaries used to define regions: ESRI [84].
SourceAlaska 1Canada 1Greenland 1Total Tundra in North America
OER508,0882,356,59702,864,684.48
BER626,6732,805,751355,5613,787,984.15
OTE894,0992,857,347448,7874,200,233.45
CAVM277,8841,575,77167,0421,920,697.05
GLC426,7462,339,16102,765,907.18
Mean546,6982,386,925290,4633,107,901.26
Standard Deviation231,961514,267199,024805,142
Coefficient of Variation0.4240.2150.6850.259
1 Areas for Table 2, Table 3, Table 4, Table 5 are approximate due to differences between ESRI World Countries and USA States shapefiles and the boundaries used by the data sources. Error is greatest at 3.5% for BER and least at 0.5% for GLC. Error was determined by comparing the areal extent of the reference sources (ESRI and USA States shapefiles) and the original sources.
The GLC was created to represent the world’s land cover in the year 2000. It was completed in 2003 after compiling data acquired from SPOT from January to December 2000. It is important to note that both the North America and Greenland files do not extend to the pole. This is because the data remotely sensed by the SPOT satellite has a maximum latitude of 75°N during the summer because of poor illumination due to sun elevation (Etienne Bartholomé, personal communication, 16 August 2012). Similar to OER, the GLC North America product does not include Greenland. A separate file that includes Greenland and Iceland can be downloaded. Consequently, the mean, standard deviation, and coefficient of variation results for Greenland in Table 2 were calculated without OER and GLC. The Greenland data is classified into different types of Tundra, as opposed to the North America dataset, which has values for pixels that correspond to vegetation classes, such as “Temperate or Subpolar Grassland”. The spatial resolution at the equator is 1 km.

2.3. Note on Other Maps

There are other classification systems in the literature that are not described in detail in this paper. This is due to lack of relevance and the fact that many systems, similar to the GLC raster, do not classify areas into Tundra regions. Another reason is that the data are outdated and therefore not as useful as recently updated maps. For instance, the greening of higher latitudes as temperatures warm [9] causes boundaries to change slightly from year to year and these changes are more extensive on the temporal scale of decades. Although the older maps may not be practical (except in historical analyses) they still contributed to the science of ecoregion mapping and played a role in shaping modern classification systems. We touch on the lineage of ecoregion maps in Section 5.1.

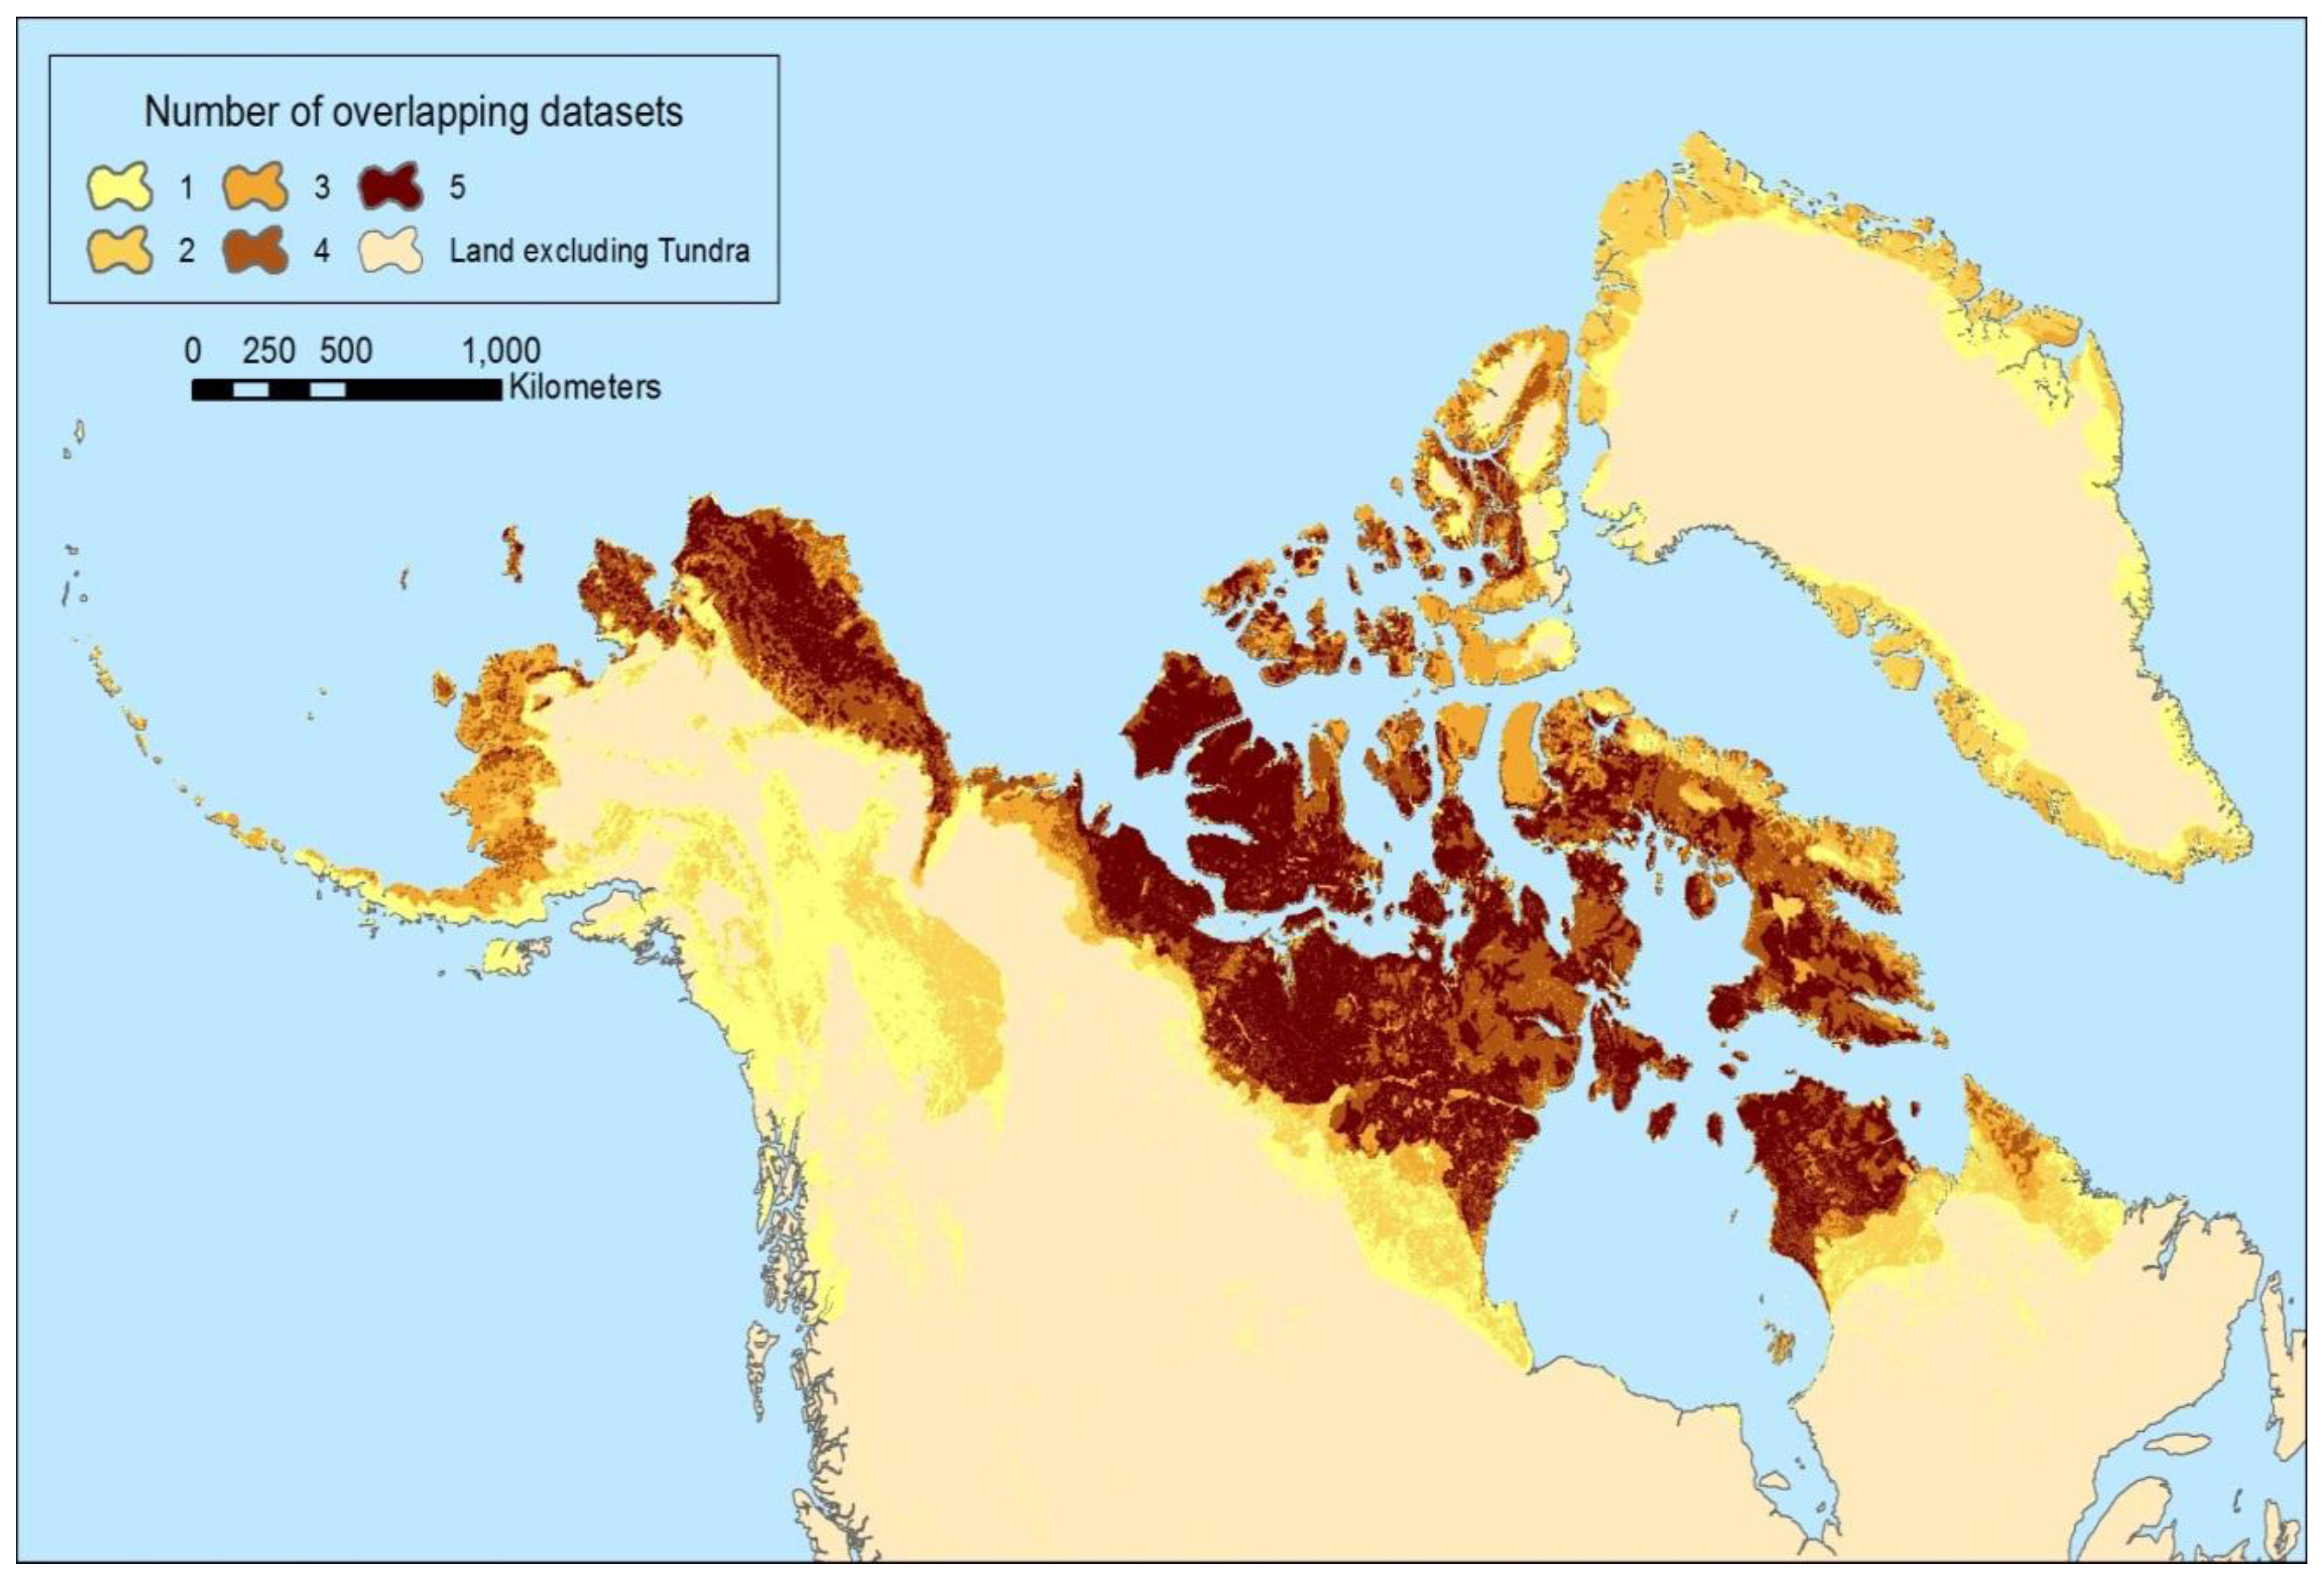
3. Results of the Quantitative Comparison

A quantitative analysis of the classification systems by area was performed to show how the products relate to each other (Table 2, Table 3, Table 4, Table 5). We analyze the overall amount of overlap, as well as the overlap by region as a percentage of the area of each classification method. After reprojecting each dataset into Lambert Azimuthal Equal Area, the analyses were performed with a series of intersections inside a geodatabase. Microsoft Excel was the primary statistical software employed once the data were acquired. It should also be noted that GLC was converted from raster to vector format to execute the overlap calculations.
Table 3. Extent of overlap in Tundra ecoregion area between the various methods: Canada.
% of Total Area of Source in Left Column (km2)OERBEROTECAVMGLCAverage% (excluding Overlap with Self)
OER100% (2,356,597)95.4% (2,248,373)99.3% (2,339,355)62.5% (1,472,530)71.4% (1,682,467)82.1%
BER80.1% (2,248,373)100% (2,805,751)84.1% (2,358,433)53.8% (1,508,654)68.7% (1,927,745)71.7%
OTE81.9% (2,339,355)82.5% (2,358,433)100% (2,857,347)52.7% (1,506,831)66.3% (1,893,734)70.9%
CAVM93.4% (1,472,530)95.7% (1,508,654)95.6% (1,506,831)100% (1,575,771)79.6% (1,253,669)91.1%
GLC71.9% (1,682,469782.4% (1,927,745)81.0% (1,893,734)53.6% (1,253,669)100% (2,339,161)72.2%
Overall mean77.6%
Table 4. Extent of overlap in Tundra ecoregion area between the various methods: Alaska.
% of Total Area of Source in Left Column (km2)OERBEROTECAVMGLCAverage % (excluding Overlap with Self)
OER100% (508,088)98.3% (499,646)99.3% (504,363)43.9% (223,178)62.2% (316,106)75.9%
BER79.7% (499,646)100% (626,673)88.0% (551,611)41.9% (262,397)53.6% (335,850)65.8%
OTE56.4% (504,363)61.7% (551,611)100% (894,099)29.4% (262,669)44.6% (398,726)48.0%
CAVM80.3% (223,178)94.4% (262,397)94.5% (262,669)100% (277,884)65.1% (180,844)83.6%
GLC74.1% (316,106)78.7% (335,850)93.4% (398,726)42.4% (180,844)100% (426,746)72.1%
Overall mean69.1%
Table 5. Extent of overlap in Tundra ecoregion area between the various methods: Greenland.
% of Total Area of Source in Left Column (km2)BEROTECAVMAverage % (excluding Overlap with Self)
BER100% (355,561)78.2% (277,909)13.9% (49,560)46.0%
OTE61.9% (277,909)100% (448,787)13.0% (58,358)37.5%
CAVM73.9% (49,560)87.0% (58,358)100% (67,042)80.5%
Overall mean54.7%
There is a fair amount variation of total Tundra area between the classification methods. This may be partially attributed to the fact that OER and GLC do not include Greenland. The greatest amount of agreement occurs for Canada, while the greatest differences occur within Greenland. Greenland still has the highest variation even when OER and GLC are not included in the standard deviation and coefficient of variation calculations. Although OTE adapts parts of OER, its estimates of total Tundra area are more similar to BER. This is likely due to its addition of Greenland and priorities on wildlife and biodiversity.
The fact that OTE is based on OER can be seen in Table 3, Table 4, which show OTE overlapping OER for greater than 99% of OER’s area in both Canada and Alaska. It is also interesting to see that BER overlaps over 95% of OER. Both of these datasets were produced with expert knowledge, but had different purposes and inputs, as explained in Section 2.2.1 and Section 2.2.2. In addition, BER has about 449,000 km2 more area than OER in Canada, which causes OER to overlap only 80% of BER for that region. Consequently, it is not surprising that BER overlaps a higher percentage of OER instead of vice versa because BER simply due to BER’s larger extent.
Table 3, Table 4, Table 5 show that CAVM has the most percent agreement with the other systems, with averages overlap ranging from about 80% to 91%. This may be attributed to its accurate methodology, but also how CAVM simply consists of less area. OER has the next highest amount of overlap, within Canada and Alaska, after CAVM. Greenland, however, has much less agreement, even after OER and GLC are removed.
Having said that, compared to the other methods for delineating ecoregion borders, CAVM generates the smallest area of Tundra. This is perhaps due to its concentration on the circumpolar region, which does not extend as far south as the other datasets. When CAVM is removed from Table 2, the standard deviation for the Tundra ecoregion area in Canada based on the other four approaches is approximately 280,235 km2, about 11% of the mean of the four estimates. This suggests that the various classifications agree most in regards to Tundra area within Canada. The low coefficient of variation of 0.215 provides further evidence towards this postulation. This can also be seen in Table 3, where the overall average percent of agreement is highest, compared to Table 4 , Table 5, at 77.6%.
When OER and GLC are included, the average percent overlap data may be misleading because OER and GLC do not include Greenland and therefore contain 0 km2 of area there. Even the classification methods that do include it designate much less Tundra than the other regions. Much of Greenland is covered by ice, causing the Tundra to be largely restricted to the more moderate climate of the coasts. This, along with the overlap, is visualized below in Figure 1 using a Lambert Azimuthal Equal Area projection with the Central Meridian set to −100.0 and the Latitude of Origin set to 50.0. The figure was created by converting each of the datasets to raster format. Pixels were given a value of 1 and the resulting rasters were summed using the Raster Calculator tool.
Figure 1. Extent of overlap between the five datasets. North America boundary data: ESRI [84].
Ijgi 02 00324 g001
Figure 1 shows that besides Canada, there is also high agreement of area in northern Alaska. Greenland exemplifies how the various classification systems yield different levels of detail. BER and OTE’s more coarse and broad delineations are visible. BER and OTE agree on large swaths of area, with CAVM occasionally overlapping as well. The figure helps highlight that when choosing a dataset (Section 5.2), the area of greatest agreement between the 5 datasets that were compared is in the high Arctic of continental North America and most of the disagreement comes in delineating the southern and northern borders. Differences in the northern border are likely due to the extent of the input data used by the analyst(s). The differences in the southern border are more likely to be due to differences in definition of Tundra and/or the purpose for which the dataset was created. This should be a strong consideration when selecting a dataset to use.

4. Case Studies

In some situations, it may be advantageous to generate boundaries that are tailored to a specific question or purpose, as opposed to using data already drawn up by state, federal, or international organizations. These circumstances could arise if different criteria are required; the area of interest is smaller and demands a finer scale; or there are unacceptable limitations in the existing data, such as how GLC has a maximum latitude of 75°N. The case studies we describe below are examples using data and knowledge from previously drawn Tundra boundaries to create an improved dataset for the researchers’ particular needs. We provide resources for creating custom ecoregions in Section 5.3.

4.1. Unified Ecoregions of Alaska: 2001 (UEA)

One example of using multiple Tundra ecoregion classification systems is the Unified Ecoregions of Alaska: 2001 (UEA) project. This project was a joint effort by the USGS, US National Park Service (NPS), TNC, and personnel from many other agencies and private organizations [38]. The creators of the map combined field experience from experts in a variety of disciplines and datasets, such as vegetation, soils, hydrography, and glaciation. The authors used the approaches of both Bailey (hierarchical) and Omernik (integrated) to map 32 ecoregion units. These 32 units are grouped into two higher levels based on climate, vegetation response, and disturbance processes [38]. The purpose was to map Alaska’s lands and resources to provide a stronger foundation for studying, managing, and understanding the ecosystems of Alaska. At 1:2.5 million, the final product has a more detailed scale than both OER and BER. This highlights the advantage of creating one’s own map if it is for a smaller area. The UEA map, region descriptions, and metadata can be found online (see [85]).

4.2. Brandt (2009) North America Boreal Zone

Brandt [23] reviews the literature on the boreal zone in North America and constructs a new delineation that affects the border of the Tundra. The author’s new delineation is created by using GIS to analyze consistencies and discrepancies between prior maps, notably extent of boundaries. Brandt also applies up-to-date data on vegetation to complete his final product. The paper has an extensive list of maps that concentrate on vegetation, especially tree distribution. The main difference between the five different approaches examined in this study and Brandt [23] is that Brandt concentrates solely on phytogeography, which is the geographic distribution of plants, as the criterion for boundaries. Consequently, the paper and its corresponding map are particularly useful for researchers wishing to focus on vegetation in Canada and Alaska. Brandt performs highly detailed comparisons concerning the boundary choices between sources within areas he delineates as forest-tundra, boreal-hemiboreal, and hemiboreal-temperate ecotones. The author splits these ecotones further into unique regions, such as Greenland, Northern Labrador and Quebec, Yukon Territory and Mackenzie Mountains, Western cordillera, northeast USA and Great Lakes, and others. The recommended scale with which to use the map is as coarse as 1:8 million and as fine as 1:5 million. Multiple scales are possible because the data is composed of digital GIS shapefiles that are available online (see [26]).

5. Discussion

We have expounded upon the background of ecoregions and summarized and compared various maps. Now we clarify how to choose a classification system. To accomplish this, we explore:
  • The origins of two example ecoregion maps we already described in detail (Section 5.1)
  • Important considerations for choosing a classification system (Section 5.2)
  • Resources for those who wish to create custom ecoregions maps (Section 5.3).

5.1. Lineage of Ecoregion Maps

One aspect of choosing a classification system involves knowing how the data were derived. The modern maps we described in detail are basically refinements and expansions of work started by others. The EPA’s 2010 version [86] of OER is an update of a map completed in 2006 [31], which is an update of the cooperative CEC 1997 project [19], which is based on a publication of the first hierarchical level of the EPA framework [71] and a map for Canada [87,88]. OER’s Level IV ecological regions are revisions and subdivisions of earlier Levels I, II, and III ecological regions [19,31,66,71,86,87,88].
Bailey’s first Ecoregion map was actually of the United States in 1976 [89]. Furthermore, he based the ecosystem Domain delineations on the Köppen system [90] because it was considered by some to be the international standard for geographical purposes [77]. BER is based on a map Bailey and Cushwa [91] created for the USFWS, which spawned from concepts advanced by Crowley [60,77].
Besides adapting parts of Omernik [83], OTE based their work on other biogeographic maps. One example is Udvardy’s Biogeographical Provinces of the World [56]. Udvardy made an early version of Ecoregions of the entire earth with the purpose of defining useful geographical units for conservation. This map and classification system was produced for the International Union for Conservation of Nature and Natural Resources [58]. Udvardy uses phylogenetic subdivisions, vegetation formations, flora/fauna, and climate as input factors [56]. This option is quite old, but can be found online (see [57]).
Having a grasp on the approaches of past classification methods may aid decision makers choosing a system by illuminating the choices and purposes originally used. For instance, OTE adopted some choices made by OER, but also based general biogeographic realms on Udvardy [56] that were subsequently modified after consulting many other global and regional maps [37]. In addition, approaches that continue to refine and expand upon earlier maps may tend to have better documentation and detail.

5.2. Choosing a Classification System

Selecting an ecoregion classification system depends on the goals of the individual users and how well the methodology of the classification aligns with those goals [67,68]. For example, OTE would be valuable to researchers interested in biodiversity and conservation because it was designed to help identify biologically vulnerable areas. Scientists who wish to use the OER interpretation must be aware that Greenland was not included in the analysis. CAVM and GLC are well suited for situations that place emphasis on vegetation or for needs in locations that extend beyond North American. Besides knowing the methodology, one must also understand the limitations of the data. The tables and Figure 1 show that the classification systems have highly variable areas and detail. Of those that we explore in detail, OER is the most recently updated, but it does not include Greenland. GLC does not include upper reaches of Canada and if desired, one must download a separate file for Greenland, which is missing its northern half. This does not mean that the datasets are poor, but that the user must know spatial limitations of particular datasets. In addition, as we explained in Section 4, it may be preferable in some cases to combine different classification schemes, particularly if the extent of area of interest/study is smaller, as exemplified by UEA [38] and Brandt [23].
The information provided here can be used as a starting point to develop a weighting function to create a new dataset based on all or several of the datasets analyzed here. The function can incorporate factors, such as date of production, degree of overlap with other sources, overall spatial extent, and methodology to arrive at a determination of Ecoregion type. There are also approaches for comparing maps other than those used in this paper. For example, the Kappa statistic expresses agreement between two categorical datasets and has been used to assess accuracy of land use change models [92], compare global vegetation maps [93], and compare accuracy of classification differences between thematic maps [94]. In addition, software has been developed for the specific purpose of comparing maps. One example is the publicly available Map Comparison Kit [95], which employs techniques based on fuzzy-set calculation rules that the creators remark is similar to human judgment.

5.3. Resources for Creating Custom Ecoregions

There are resources available to assist a researcher if a custom ecoregion dataset is required. The two examples we examine are Anderson et al. [96] and McMahon et al. [68]. We will summarize the main points of these works and assess some aspects of the approaches our case studies followed. We cannot offer a comprehensive analysis, however, because the level of detail is beyond the scope of this paper.

5.3.1. Anderson et al. (1999): Guidelines for Representing Ecological Communities

In Anderson et al. [96], the authors provide a step-by-step process for delineating ecoregions. Their work shows how ecological communities are defined, how to identify on-the-ground examples, criteria for example communities, and how to apply this information to meet conservation goals. Anderson et al. [96] is largely concerned with conservation planning and setting protection goals for target communities.
One of the key considerations put forth by Anderson et al. [96] that Brandt [23] clearly addresses is the question of what factors the system is based on. Brandt purposely relies on phytogeography in determining boundaries. Anderson et al. [96] places emphasis on evaluating the geographic range within which the classification system is consistent. Both Brandt [23] and UEA [38] do a good job of identifying this because they are projects based on specific areas; Brandt’s map consists of the boreal zone and hemiboreal subzone in North America and UEA is an analysis of Alaska specifically.
The authors of Anderson et al. [96] believe that expert knowledge is extremely helpful is identifying examples of ecological communities. Once again, both case studies follow this approach; Brandt [23] performed extensive literature reviews and comparisons on his topic. Brandt also considered his map a refinement of the past publications Rowe [97] and Viereck and Little [98]. Nowacki et al. [38] expressly point out that UEA was created by combining the methods of BER and OER, which are two systems created by well-known experts. In addition, UEA was a collaboration of scientists who are authorities in the disciplines necessary for the completion of the project.

5.3.2. McMahon et al. (2004): Toward a Scientifically Rigorous Basis for Developing Ecoregions

McMahon et al. [68] poses a series of questions and propositions one should consider while creating ecoregions. These include research questions, as well as key issues of determining boundaries. The paper also provides insight on a variety of topics that are extremely important when mapping ecoregions. These topics include quantitative and qualitative methods for defining ecological regions, data replicability, and perspectives on classification and mapping. Brandt [23] and Nowacki et al. [38] do not directly answer McMahon et al.’s research questions, but they do address them, sometimes indirectly, which helps provide more evidence for the strength of their methods.
McMahon et al. [68] asks several questions related to the boundaries and stability of ecosystems, patterns and scale in defining ecological regions, and hierarchical spatial associations of ecosystems. One example of Brandt [23] attending to these issues is how the author defines the forest-tundra ecotone. Brandt uses the northern tree limit and certain tree species to delimit the northern boundary between the boreal zone and arctic Tundra. Brandt additionally examines the concepts of human and invasive species disturbance and multiple maps with multiple scales. In doing so, the author answers a few of McMahon et al.’s [68] questions concerning scale, boundary distinction, and dynamic exchanges of matter and energy.
The ecoregions defined within UEA have descriptions of the climate, parent materials, flora, fauna, landforms, and climate specific to the units. These descriptions indirectly address questions and propositions posed by McMahon et al. [68] about internal ecosystem processes, landscape characteristics, and relationships between spatial patterns and ecological processes. McMahon et al. [68] also questions the degree of variability at different levels of hierarchy. UEA confronts this topic by taking an interesting and comprehensive approach to mapping; by mapping using both the BER (hierarchical) and OER (integrated) methods, the ultimate product uses a “tri-archy”. 32 ecoregions fit into eight groups at Level 2 and three regimes at Level 1, those being Boreal, Maritime, and Polar [38].

6. Future Work

The Arctic landscape is transforming ever more rapidly due to climate change and the processes, such as feedback loops, that climate change propagates. The Tundra plays a chief role in governing the types and rates of many of these alterations. We have compiled a list of the available datasets (Table 1) and highlighted five of them that may be used for work concerning Tundra in North America. This paper represents a step towards advancing our understanding of the limitations and effectiveness of certain ecoregion classification methods. Future work must involve continued collaboration between experts on an international scale to develop a common set of definitions or classification scheme that will enable researchers to refine and update ecoregion maps even as the landscape itself changes. Decision makers in different countries must have a common reference map to work from for the purpose of ecosystem management and consideration of potential responses to climate change. The Commission for Environmental Cooperation [19], for example, helped create OER and included the United States, Canada, and Mexico. These three countries collaborated for the very purpose of having a common framework to use for international policy. Further comparisons between ecoregion classification methods should be made for different ecoregions in other parts of the world and how well these methods address specific and general management needs [67]. Continued research and evaluation will help improve our understanding of ecoregions and the processes that govern them. New tools and remotely sensed datasets are becoming available that can enable improvements and synchronization of these base maps from which decisions must be based.

Acknowledgments

We would like to thank MESM graduate Elissa Monahan for her excellent insight. In addition, the wisdom of Arthur Gold, a MESM advisor, has been paramount to this paper and otherwise. We would also like to thank Molly Brown and the NASA internship program SOLAR for providing the opportunity to complete this work.

References

  1. Markham, C.R. On the origin and migrations of the greenland esquimaux. J. Roy Geogr. Soc. London 1865, 35, 87–99. [Google Scholar] [CrossRef]
  2. National Snow & Ice Data Center (NSIDC). Arctic Sea Ice Extent Settles at Record Seasonal Minimum. Available online: http://nsidc.org/arcticseaicenews/2012/09/arctic-sea-ice-extent-settles-at-record-seasonal-minimum/ (accessed on 30 September 2012).
  3. White, D.; Hinzman, L.; Alessa, L.; Cassano, J.; Chambers, M.; Falkner, K.; Francis, J.; Gutowski, W.J.; Holland, M.; Holmes, R.M.; et al. The arctic freshwater system: Changes and impacts. J. Geophys. Res. 2007. [Google Scholar] [CrossRef]
  4. Arft, A.M.; Walker, M.D.; Gurevitch, J.; Alatalo, J.M.; Bret-Harte, M.S.; Dale, M.; Diemer, M.; Gugerli, F.; Henry, G.H.R.; Jones, M.H.; et al. Responses of tundra plants to experimental warming: Meta-analysis of the international tundra experiment. Ecol. Monogr. 1999, 69, 491–511. [Google Scholar]
  5. Foley, J.A. Tipping points in the tundra. Science 2005, 310, 627–628. [Google Scholar] [CrossRef]
  6. Henry, G.H.; Molau, U. Tundra plants and climate change: The international tundra experiment (itex). Glob. Change Biol. 1997, 3, 1–9. [Google Scholar] [CrossRef]
  7. Liston, G.E.; Mcfadden, J.P.; Sturm, M.; Pielke, R.A. Modelled changes in arctic tundra snow, energy and moisture fluxes due to increased shrubs. Glob. Change Biol. 2002, 8, 17–32. [Google Scholar] [CrossRef]
  8. Walker, M.D.; Wahren, C.H.; Hollister, R.D.; Henry, G.H.; Ahlquist, L.E.; Alatalo, J.M.; Bret-Harte, M.S.; Calef, M.P.; Callaghan, T.V.; Carroll, A.B.; et al. Plant community responses to experimental warming across the tundra biome. Proc. Natl. Acad. Sci. USA 2006, 103, 1342–1346. [Google Scholar] [CrossRef]
  9. Jeong, J.H.; Kug, J.S.; Kim, B.M.; Min, S.K.; Linderholm, H.W.; Ho, C.H.; Rayner, D.; Chen, D.; Jun, S.Y. Greening in the circumpolar high-latitude may amplify warming in the growing season. Clim. Dynam. 2012, 38, 1421–1431. [Google Scholar] [CrossRef]
  10. Arctic Monitoring and Assessment Programme (AMAP), Geographical Coverage. Available online: http://www.amap.no (accessed on 28 March 2013).
  11. Loveland, T.R.; Merchant, J.M. Ecoregions and ecoregionalization: Geographical and ecological perspectives. Environ. Manage. 2004, 34, S1–S13. [Google Scholar] [CrossRef]
  12. Thornthwaite, C.W. The climates of north america: According to a new classification. Geogr. Rev. 1931, 21, 633–655. [Google Scholar] [CrossRef]
  13. Merriam, C.H. Life Zones and Crop Zones of the United States; US Department of Agriculture, Division of Biological Survey: Washington, DC, USA, 1898.
  14. Clements, F.E.; Shelford, V.E. Bioecology; John Wiley & Sons: New York, NY, USA, 1939; p. 425. [Google Scholar]
  15. Maini, J.S. Phytoecological study of sylvotundra at small tree lake, NWT. Arctic 1966, 19, 220–243. [Google Scholar]
  16. Tikhomirov, B.A. Plantgeographical investigations of the tundra vegetation in the soviet union. Can. J. Bot. 1960, 38, 815–832. [Google Scholar] [CrossRef]
  17. Thompson, R.S.; Shafer, S.L.; Anderson, K.H.; Strickland, L.E.; Pelltier, R.T.; Bartlein, P.J.; Kerwin, M.W. Topographic, bioclimatic, and vegetation characteristics of three ecoregion classification systems in north america: Comparisons along continent-wide transects. Environ. Manage. 2004, 34, S125–S148. [Google Scholar] [CrossRef]
  18. Bliss, L.C. Arctic Tundra and Polar Desert Biome. In North American Terrestrial Vegetation, 2nd; Barbour, M.G., Billings, W.D., Eds.; Cambridge University Press: Cambridge, UK, 2000; pp. 1–40. [Google Scholar]
  19. Commission for Environmental Cooperation, Ecological Regions of North America: Toward a Common Perspective; Commission for Environmental Cooperation: Montréal, QC, Canada, 1997.
  20. Post, W.M.; Emanuel, W.R.; Zinke, P.J.; Stangenberger, A.G. Soil carbon pools and world life zones. Nature 1982, 298, 156–159. [Google Scholar]
  21. Christensen, T.R. Methane emission from arctic tundra. Biogeochemistry 1993, 21, 117–139. [Google Scholar] [CrossRef]
  22. Scholze, M.; Knorr, W.; Arnell, N.W.; Prentice, I.C. A climate-change risk analysis for world ecosystems. Proc. Natl. Acad. Sci. USA 2006, 103, 13116–13120. [Google Scholar]
  23. Brandt, J.P. The extent of the north american boreal zone. Environ. Rev. 2009, 17, 101–161. [Google Scholar] [CrossRef]
  24. British Columbia Ministry of Forests and Range (BCMFR), Biogeoclimatic Maps. Available online: http://www.for.gov.bc.ca/hre/becweb/resources/maps/GISdataDownload.html (accessed on 23 January 2013).
  25. Saucier, J.P.; Robitaille, A.; Grondin, P.; Bergeron, J.F.; Gosselin, J. Les Régions Écologiques du Québec Méridional (Version 4). Scale: 1:1,250,000. Available online: http://www.mrnf.gouv.qc.ca/publications/forets/connaissances/carte-regions-ecologiques.pdf (accessed on 23 January 2013).
  26. Canadian Forest Service, North American Boreal Zone Map Shapefiles. Available online: http://cfs.nrcan.gc.ca/pages/357 (accessed on 23 January 2013).
  27. Kottek, M.; Grieser, J.; Beck, C.; Rudolf, B.; Rubel, F. World map of the koppen-geiger climate classification updated. Meteorol. Z. 2006, 15, 259–263. [Google Scholar] [CrossRef]
  28. Kottek, M.; Grieser, J.; Beck, C.; Rudolf, B.; Rubel, F. World Map of the Köppen-Geiger Climate Classification Updated. Available online: http://koeppen-geiger.vu-wien.ac.at/present.htm (accessed on 23 January 2013).
  29. Alberta Tourism, Parks, and Recreation. 2005 Natural Regions and Subregions of Alberta. Available online: http://tpr.alberta.ca/parks/heritageinfocentre/naturalregions/default.aspx (accessed on 23 January 2013).
  30. Natural Regions Committee. Natural Regions and Subregions of Alberta. Available online: http://www.tpr.alberta.ca/parks/heritageinfocentre/docs/NRSRcomplete%20May_06.pdf (accessed on 23 January 2013).
  31. US Environmental Protection Agency, Ecoregions of North America. Scale: Various Scales. Available online: http://www.epa.gov/wed/pages/ecoregions/na_eco.htm (accessed on 23 January 2013).
  32. Walker, D.A.; Raynolds, M.K.; Daniëls, F.J.A.; Einarsson, E.; Elvebakk, A.; Gould, W.A.; Katenin, A.E.; Kholod, S.S.; Markon, C.J.; Melnikov, E.S.; et al. The circumpolar arctic vegetation map. J. Veg. Sci. 2005, 16, 267–282. [Google Scholar] [CrossRef]
  33. University of Alaska Fairbanks. Map Catalog. Available online: http://www.arcticatlas.org/maps/catalog/index (accessed on 23 January 2013).
  34. Latifovic, R.; Zhu, Z.L.; Cihlar, J.; Giri, C.; Olthof, I. Land cover mapping of north and central america—Global land cover 2000. Remote. Sens. Environ. 2004, 89, 116–127. [Google Scholar] [CrossRef]
  35. Joint Research Centre, Land Resource Management Unit, European Comission, Global Land Cover-2000 Products; 2003. Available online: http://bioval.jrc.ec.europa.eu/products/glc2000/products.php (accessed on 28 January 2013).
  36. World Wildlife Federation, Terrestrial Ecoregions of the World. Available online: http://worldwildlife.org/publications/terrestrial-ecoregions-of-the-world (accessed on 23 January 2013).
  37. Olson, D.M.; Dinerstein, E.; Wikramanayake, E.D.; Burgess, N.D.; Powell, G.V.N.; Underwood, E.C.; D’amico, J.A.; Itoua, I.; Strand, H.E.; Morrison, J.C.; et al. Terrestrial ecoregions of the world: A new map of life on earth. BioScience 2001, 51, 933–938. [Google Scholar] [CrossRef]
  38. Nowacki, G.; Spencer, P.; Fleming, M.; Brock, T.; Jorgenson, T. Unified Ecoregions of Alaska: 2001. Usgs Open File Report 02–297. 2001. Available online: http://agdcftp1.wr.usgs.gov/pub/projects/fhm/akecoregions.htm (accessed on 23 January 2013).
  39. Elliott-Fisk, D.L. The Taiga and Boreal Forest. In North American Terrestrial Vegetation, 2nd; Barbour, M.G., Billings, W.D., Eds.; Cambridge University Press: Cambridge, UK, 2000; pp. 41–74. [Google Scholar]
  40. Marshall, I.B.; Shut, P.H.; Ballard, M. National Ecological Framework for Canada. Available online: http://sis.agr.gc.ca/cansis/nsdb/ecostrat/index.html (accessed on 23 January 2013).
  41. Ecological Stratification Working Group (ESWG), A National Ecological Framework for Canada; Agriculture and Agri-Food Canada, Research Branch, Centre for Land and Biological Resources Research and Environment Canada, State of the Environment Directorate, Ecozone Analysis Branch: Ottawa, ON, Canada, 1999.
  42. Bailey, R.G. Ecoregions of North America. Scale: 1:15,000,000; USDA Forest Service: Washington, DC, USA, 1997.
  43. Bailey, R.G.; US Department of Agriculture, Forest Service. Ecoregions of North America. Available online: http://www.fs.fed.us/rm/ecoregions/products/map-ecoregions-north-america/ (accessed on 28 January 2013).
  44. Bailey, R.G. Description of the Ecoregions of the United States, 2nd edUS Department of Agriculture, Forest Service: Washington, DC, USA, 1995.
  45. Nowacki, G.T.; Brock, T. Ecoregions and Subregions of Alaska, Ecomap Version 2.0. Scale: 1:5,000,000. Available online: http://agdc.usgs.gov/data/usgs/erosafo/ecoreg (accessed on 23 January 2013).
  46. Schultz, J. The Ecozones of the World: The Ecological Divisions of the Geosphere; Springer-Verlag: Stuttgart, Germany, 1995. [Google Scholar]
  47. Timoney, K.P. A Geobotanical Investigation of the Subarctic Forest-Tundra of the Northwest Territories. Ph.D. Thesis, University of Alberta, Edmonton, AB, Canada, 1988. [Google Scholar]
  48. Tuhkanen, S. A circumpolar system and indices in plant geography. Acta. Bot. Fenn. 1984, 127, 1–50. [Google Scholar]
  49. Payette, S. The forest tundra and present tree-lines of the northern québec-labrador peninsula. Nordicana 1983, 47, 3–23. [Google Scholar]
  50. Atkinson, K. Vegetation zonation in the canadian subarctic. Area 1981, 13, 13–17. [Google Scholar]
  51. Brown, D.E.; Lowe, C.H.; Pase, C.P. A digitized classification system for the biotic communities of North America, with community (series) and association samples from the southwest. J. Ariz-Nev. Acad. Sci. 1979, 14, 1–16. [Google Scholar]
  52. The Nature Conservancy. Biotic Communities of the Southwest GIS Layer. Available online: http://azconservation.org/downloads/biotic_communities_of_the_southwest_gis_data (accessed on 23 January 2013).
  53. Franklin, J.F. The biosphere reserve program in the united states. Science 1977, 195, 262–267. [Google Scholar]
  54. Oswald, E.T.; Senyk, J. Ecoregions of Yukon Territory; Canadian Forestry Service: Victoria, BC, USA, 1977. [Google Scholar]
  55. Walter, H.; Box, E. Global classification of natural terrestrial ecosystems. Plant Ecol. 1976, 32, 75–81. [Google Scholar] [CrossRef]
  56. Udvardy, M.D.F. A Classification of the Biogeographical Provinces of the World; International Union for Conservation of Nature and Natural Resources: Morges, Switzerland, 1975; p. 48. [Google Scholar]
  57. FAO GeoNetwork. Udvardy’s Ecoregions. Available online: http://www.fao.org/geonetwork/srv/en/metadata.show?id=1008 (accessed on 23 January 2013).
  58. International Union of Conservation of Nature. UNEP-WCMC Metadata-Udvardy’s Biogeographical Provinces. Available online: http://www.unep-wcmc.org/medialibrary/2011/10/03/7d9d7a51/Udvardy_metadata.pdf (accessed on 23 January 2013).
  59. Hare, K.F.; Ritchie, J.C. The boreal bioclimates. Geogr. Rev. 1972, 66, 333–365. [Google Scholar] [CrossRef]
  60. Crowley, J.M. Biogeography. Can. Geogr. 1967, 11, 312–326. [Google Scholar] [CrossRef]
  61. Lobeck, A.K. Physiographic Provinces of North America (Scale: 1:12,000,000); Hammond: Maplewood, NJ, USA, 1948. [Google Scholar]
  62. Dice, L.R. The Biotic Provinces of North America; University of Michigan Press: Ann Arbor, MI, USA, 1943; p. 78. [Google Scholar]
  63. Hargrove, W.W.; Hoffman, F.M. Using multvariate clustering to characterize ecoregion borders. Comput. Sci. Eng. 1999, 1, 18–25. [Google Scholar] [CrossRef]
  64. Zhou, Y.; Narumalani, S.; Waltman, W.J.; Waltman, S.W.; Palecki, M.A. A GIS-based spatial pattern analysis model for eco-region mapping and characterization. Int. J. Geogr. Inf. Sci. 2003, 17, 445–462. [Google Scholar] [CrossRef]
  65. Bailey, R.G. Identifying ecoregion boundaries. Environ. Manage. 2004, 34, S14–S26. [Google Scholar] [CrossRef]
  66. McMahon, G.; Gregonis, S.M.; Waltman, S.W.; Omernik, J.M.; Thorson, T.D.; Freeouf, J.A.; Rorick, A.H.; Keys, J.E. Developing a spatial framework of common ecological regions for the conterminous united states. Environ. Manage. 2001, 28, 293–316. [Google Scholar] [CrossRef]
  67. Omernik, J.M. Perspectives on the nature and definition of ecological regions. Environ. Manage. 2004, 34, S27–S38. [Google Scholar] [CrossRef]
  68. McMahon, G.; Wiken, E.B.; Gauthier, D.A. Toward a scientifically rigorous basis for developing mapped ecological regions. Environ. Manage. 2004, 34, S111–S124. [Google Scholar] [CrossRef]
  69. Hargrove, W.W.; Hoffman, F.M. Potential of multivariate quantitative methods for delineation and visualization of ecoregions. Environ. Manage. 2004, 34, S39–S60. [Google Scholar] [CrossRef]
  70. Gallant, A.L.; Loveland, T.R.; Sohl, T.L.; Napton, D.E. Using an ecoregion framework to analyze land-cover and land-use dynamics. Environ. Manage. 2004, 34, S89–S110. [Google Scholar] [CrossRef]
  71. Omernik, J.M. Ecoregions of the conterminous united states. Ann. Assoc. Amer. Geogr. 1987, 77, 118–125. [Google Scholar] [CrossRef]
  72. US Environmental Protection Agency, Level IV Ecoregions of the Conterminous United States. Available online: ftp://ftp.epa.gov/wed/ecoregions/us/Eco_Level_IV_US.htm (accessed on 23 January 2013).
  73. Wiken, E.B.; Nava, F.J.; Griffith, G.E. North American Terrestrial Ecoregions—Level III. Available online: ftp://ftp.epa.gov/wed/ecoregions/pubs/NA_TerrestrialEcoregionsLevel3_Final-2june11_CEC.pdf (accessed on 23 January 2013).
  74. Indiana Biological Survey Aquatic Research Center. Ecoregions. Available online: http://www.indiana.edu/~inbsarc/ecoregions.html (accessed on 23 January 2013).
  75. Linam, G.W.; Kleinsasser, L.J.; Mayes, K.B. Regionalization of the Index of Biotic Integrity for Texas Streams. Available online: http://www.tpwd.state.tx.us/publications/pwdpubs/media/pwd_rp_t3200_1086.pdf (accessed on 23 January 2013).
  76. Buettner, G.; Hendricks, A.; Boness, K.; Ballard, L.; Bright, K.; Brill, K.; Cassady, S.; Castillo, K.; Dahlberg, H.; Dawe, C. Arizona Forest Resource Strategy. Available online: ftp://ftp.epa.gov/ wed/ecoregions/pubs/Arizona_Forest_Resource_Strategy_2010.pdf (accessed on 23 January 2013).
  77. Bailey, R.G. Ecoregions Map of North America : Explanatory Note; US Department of Agriculture, Forest Service: Washington, DC, USA, 1998.
  78. Hoekstra, J.M.; Molnar, J.L.; Jennings, M.; Revenga, C.; Spalding, M.D.; Boucher, T.M.; Robertson, J.C.; Heibel, T.J.; Ellison, K. The Atlas of Global Conservation: Changes, Challenges and Opportunities to Make a Difference; University of California Press: Berkeley, CA, USA, 2010. [Google Scholar]
  79. Sotomayor, L. Terrestrial and Marine Ecoregions of the United States. Available online: http://gis.tnc.org/data/MapbookWebsite/map_page.php?map_id=103 (accessed on 23 January 2013).
  80. National Wildlife Federation, Ecoregions. Available online: http://www.nwf.org/Wildlife/Wildlife-Conservation/Ecoregions.aspx (accessed on 23 January 2013).
  81. US Department of Agriculture, Colorado State University, UV-B Monitoring Climatological and Research Network. Available online: http://uvb.nrel.colostate.edu/UVB/uvb_network.jsf (accessed on 23 January 2013).
  82. Olson, D.M.; Dinerstein, E. The global 200: A representation approach to conserving the earth’s most biologically valuable ecoregions. Conserv. Biol. 1998, 12, 502–515. [Google Scholar]
  83. Omernik, J.M. Ecoregions: A Spatial Framework for Environmental Management. In Biological Asessment and Criteria: Tools for Water Resource Planning and Decision Making; Davis, W., Simon, T., Eds.; Lewis Publishing: Boca Raton, FL, USA, 1995; pp. 49–62. [Google Scholar]
  84. Environmental Systems Resource Institute (ESRI), SDC Feature Database, World Continents; ESRI: Redlands, CA, USA, 2012.
  85. US Geological Survey, Alaska Ecoregions Mapping. Available online: http://agdc.usgs.gov/data/usgs/erosafo/ecoreg (accessed on 23 January 2013).
  86. US Environmental Protection Agency, Level III Ecoregions of the Continental United States. Available online: http://www.epa.gov/wed/pages/ecoregions/level_iii_iv.htm (accessed on 23 January 2013).
  87. Wiken, E.B. Terrestrial Ecozones of Canada; Ecological Land Classification Series; Environment Canada: Ottawa, ON, Canada, 1986. [Google Scholar]
  88. Wiken, E.B.; Gauthier, D.A.; Marshall, I.B.; Lawton, K.; Hirvonen, H. A Perspective on Canada’s Ecosystems: An Overview of the Terrestrial and Marine Ecozones; Occasional Paper; Canadian Council on Ecological Areas: Ottawa, ON, Canada, 1996. [Google Scholar]
  89. Bailey, R.G. Ecoregions of the United States (Scale: 1:7,500,000); USDA Forest Service: Ogden, UT, USA, 1976.
  90. Köppen, W. Grundriss der Klimakunde; Walter de Gruyter: Berlin, Germany, 1931. [Google Scholar]
  91. Bailey, R.G.; Cushwa, C.T. Ecoregions of North America (Scale: 1:12,000,000); US Fish and Wildlife Service: Washington, DC, USA, 1981.
  92. Van Vliet, J.; Bregt, A.K.; Hagen-Zanker, A. Revisiting Kappa to account for change in the accuracy assessment of land-use change models. Ecol. Model. 2011, 222, 1367–1375. [Google Scholar] [CrossRef]
  93. Monserud, R.A.; Leemans, R. Comparing global vegetation maps with the Kappa statistic. Ecol. Model. 1992, 62, 275–293. [Google Scholar] [CrossRef]
  94. Foody, G.M. Thematic map comparison: Evaluating the statistical significance of differences in classification accuracy. Photogramm. Eng. Remote Sensing 2004, 70, 627–633. [Google Scholar]
  95. Visser, H.; de Nijs, T. The map comparison kit. Environ. Modell. Softw. 2006, 21, 346–358. [Google Scholar] [CrossRef]
  96. Anderson, M.; Comer, P.; Grossman, D.; Groves, C.; Poiani, K.; Reid, M.; Schneider, R.; Vickery, B.; Weakley, A. Guidelines for Representing Ecological Communities in Ecoregional Conservation Plans. Available online: http://conserveonline.org/workspaces/cbdgateway/era/standards/supportmaterials/std7sm/EcoregionConservation%20PlansGuide.pdf (accessed on 28 March 2013).
  97. Rowe, J.S. Forest Regions of Canada; Information Canada: Ottawa, ON, Canada, 1972. [Google Scholar]
  98. Viereck, L.A.; Little, E.L. Alaska Trees and Shrubs; Agriculture Handbook; US Department of Agriculture: Washington, DC, USA, 1972.

