Abstract
As a crucial component of the Belt and Road Initiative (BRI), China Railway Express (CR Express) plays a pivotal role in enhancing regional connectivity and economic integration. However, the systematic evaluation of CR Express node cities remains understudied, hindering the optimization of logistics networks and sustainable development goals. This study pioneers a data-driven approach by integrating multi-source geospatial data and advanced machine learning algorithms to develop a comprehensive evaluation framework spanning five critical dimensions: economic vitality, ecological sustainability, logistics capacity, network connectivity, and policy support. By comparing the evaluation performance of six machine learning models, an optimal decision-making model is identified, and the evaluation indicators are rigorously screened to provide robust decision-support for the establishment of CR Express assembly centers. The Random Forest model outperformed comparative algorithms with 99.5% prediction accuracy (8.33% higher than conventional classification models), particularly in handling multi-dimensional interactions between urban development factors. Feature importance analysis identified 11 decisive indicators from node city evaluation empirical indicators, where CR Express trade volume (weight = 0.1269), logistics hub classification (weight = 0.1091), and operational frequency (weight = 0.0980) emerged as the top three predictors. Spatial predictions highlight five strategic cities (Changsha, Wuhan, Shenyang, Jinan, Hefei) as prime candidates for CR Express assembly centers, providing actionable insights for national logistics planning under the BRI framework.
1. Introduction
Driven by the BRI and international transportation demand, CR Express guarantees the efficient and smooth flow of international logistics because of its “land and sea linkage, two-way interoperability” transportation system. However, there are still issues such as resource dispersion, line duplication, and high return empty load rates. The high-quality sustainable development of CR Express needs to be studied urgently [1,2]. Wang et al. integrated the Hub Location theory (HLP), focusing on researching hub node construction and guaranteeing the smooth transportation of CR Express [3]. In 2020, the National Development and Reform Commission (NDRC) launched the construction of the first batch of CR Express assembly centers, which promoted the upgrade of CR Express to the “hub and distribution” mode. The research shows that the construction of CR Express assembly centers is a key measure to implement the strategic plan of the Third Plenary Session of the 20th Central Committee of the Communist Party of China for the construction of an international logistics hub, improve the level of opening-up, and support the new development pattern of “dual circulation” [4,5,6,7]. The determination of the assembly center should take into account multiple aspects of the city and be combined with an assessment of the current operation status of CR Express. Therefore, there is an urgent need to conduct evaluation research on the node cities of CR Express to scientifically determine the assembly centers. This will not only provide theoretical support for optimizing the layout of the CR Express network, but also offer technical support to address the practical problems of CR Express.
The evaluation of CR Express node cities is a process of comprehensively and quantitatively evaluating the core elements of cities based on a multi-dimensional indicator system. The research mainly focuses on selecting evaluation indicators based on the dimensions of economic level, logistics capacity, location conditions, infrastructure conditions, etc., and adopts the TOPSIS method, the Delphi expert survey method, cluster analysis, and other methods for calculation [8,9,10,11,12]. For example, Cheng et al. considered the operation costs and greenhouse gas emissions, and used the two-layer mixed-integer programming model and the augmented ε-constraint method to select Qingdao, Harbin, Changchun, Taiyuan, Urumqi, and Tianjin as CR Express assembly centers. Liu et al. built an index system around the dimensions of economic vitality, logistics scale, and green innovation, and calculated the logistics competitiveness level of CR Express node cities based on the gray correlation model. Li et al. used the improved entropy TOPSIS method to comprehensively evaluate node cities, and took cities such as Guangzhou, Tianjin, and Chongqing as distribution centers [13,14,15,16,17,18,19].
The application of machine learning technology in the field of transportation continues to deepen, providing a new route for the objective evaluation of the node cities of CR Express [20,21,22,23,24,25,26,27,28]. Relevant studies have predominantly focused on the application of unsupervised clustering methods in small sample scenarios. For instance, Wei et al. employed multi-source data and CatBoost to enhance the predictive accuracy of urban flood risk assessment. Rahman et al. utilized a hybrid method of K-Means and P-Median for the classification of logistics hubs. Luo et al. demonstrated good classification performance using KNN and LSTM for spatiotemporal traffic flow predictions [29,30,31,32,33,34].
In summary, the evaluation research of existing node cities is extensive, but there are still some shortcomings. First, most studies emphasize the expression of social and eco-nomic dimensions, lacking the use of indicators such as emerging elements in evaluating node cities. Second, because it is limited by data acquisition and the application of machine learning technology, research on using machine learning to evaluate node cities is still relatively scarce, especially in the context of CR Express node cities. Furthermore, the existing evaluation studies using machine learning are mostly limited to the application of a single method, lacking the comparison of multiple learning methods, making it difficult to ensure the model’s adaptability. Fourth, the research on CR Express mainly focuses on regions, such as the central and western corridors and the Yangtze River Delta, and few studies have been conducted for the whole country.
Based on the aforementioned findings, there is an urgent need to construct a machine learning method that combines multi-source data to evaluate the node cities of CR Ex-press. Thirty-three cities, as defined in the China Railway Express Construction and Development Plan (2016–2020), are selected as the research objects, and six machine learning models are compared and analyzed: Logistic Regression (LR), Support Vector Machine (SVM), K-Nearest Neighbor (KNN), Decision Tree (DT), Random Forest (RF), and Extreme Gradient Boosting Tree (XGB). The optimal evaluation model is screened out, and it explains the quantitative impacts of multiple key evaluation indicators on CR Ex-press node cities. Finally, the prime candidates for CR Express assembly centers are macroscopically predicted based on the optimal model.
2. Research Process and Methodology
2.1. Study Area
The research area of this study is mainland China. As the initiator and main promoter of the BRI, China plays a core role in the Eurasian logistics network by leveraging the rapid development of CR Express, and continuously promotes economic development, reshapes the industrial structure, enhances regional status, and fosters the international cooperation of cities along the route. Under the trend of upgrading the hub and distribution model and in response to the requirements of high-quality development, effectively assessing the practical needs of CR Express node cities is important for addressing the current challenges and promoting the high-quality and sustainable development of CR Express.
Based on the planning framework outlined in the China Railway Express Construction and Development Plan (2016–2020), four major categories of transportation nodes, specifically main inland cargo sources, major railway hubs, important coastal ports, and land border ports, are comprehensively selected. Consequently, 33 nodal cities of CR Express are identified as the research objects. The distribution of specific categories is shown in Table 1.

Table 1.
Category of China Railway Express node cities.
2.2. Data Sources
The data sources used in this study are as follows: (1) The data on urban economic vitality are obtained from the latest National Economic and Social Development Statistical Bulletin and Statistical Yearbook issued by the statistical bureaus of various cities, including total GDP, total imports and exports, and total retail sales of consumer goods, etc. (2) The data on natural resources, urban greening, and environmental governance are obtained from the bulletin on the state of the environment issued by the Bureau of Ecology and Environment of each city “https://sthjj.cq.gov.cn/ (accessed on 15 January 2025)”. (3) The data on urban development potential and new quality productivity are obtained from the National Bureau of Statistics “https://www.stats.gov.cn/ (accessed on 15 January 2025)”, including the size of the city’s resident population, the growth rate of fixed-asset investment, and the degree of industrial agglomeration, etc. (4) The data on logistics infrastructure are obtained from the local transportation bureaus of various cities “https://www.ceicdata.com.cn/ (accessed on 15 January 2025)”, including the density of the highway network and the density of the railway network, etc. (5) The trade and logistics data of the node cities of CR Express are sourced from the official website of the “Belt and Road” “https://www.yidaiyilu.gov.cn/ (accessed on 15 January 2025)”, including the number of CR Express trips dispatched, the freight volume, the proportion of return trips, etc. (6) The customs clearance data of CR Express at each port are obtained through the Customs Data Online Inquiry Platform “http://stats.customs.gov.cn/ (accessed on 15 January 2025)”, including CR Express trade volume, the number of trading partners, etc. (7) The platform companies in each city publish the operation data of CR Express node cities through the official websites of the enterprises, press conferences, or industry forums, including the starting time, the subsidies for the railway express, etc.
2.3. Model Framework
In this study, a model combining multi-source geospatial data with advanced machine learning algorithms is constructed to evaluate node cities, and the specific process is illustrated in Figure 1.
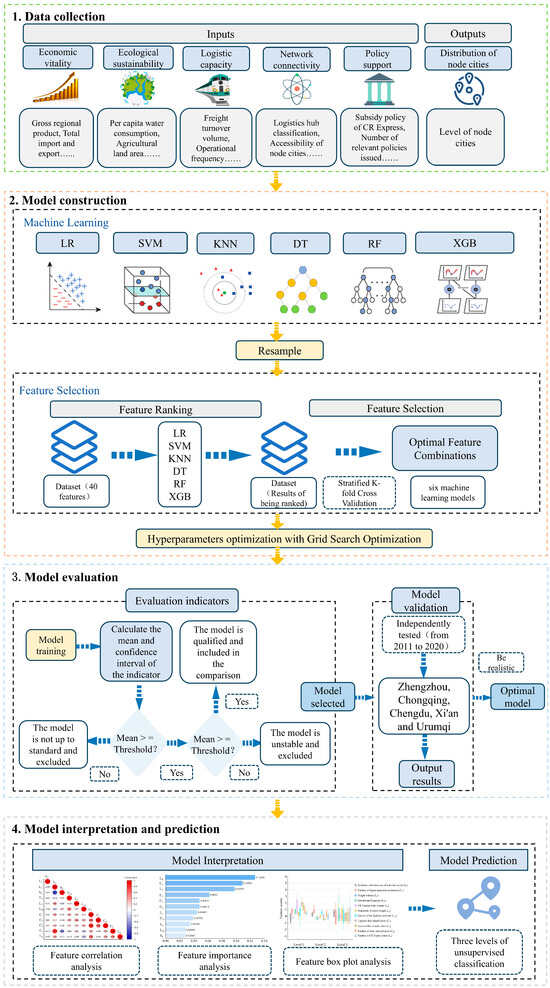
Figure 1.
Technology roadmap. (The blue arrows indicate the logical relationships within subsystems, while the yellow arrows indicate the procedural sequence of methodological steps).
Stage 1: Data collection. The multi-source geospatial data collected as input for modeling encompass economic, ecological, and social factors, which can be categorized into five critical dimensions: economic conditions, economic vitality, ecological sustainability, logistics capacity, network connectivity, and policy support. Based on this, the collected index values are standardized using the Z-score method, and the dataset is then split into an 8:2 ratio for training and testing sets to prepare for the subsequent model construction.
Stage 2: Model construction. Six commonly used advanced machine learning models are introduced, including Logistic Regression (LR), Support Vector Machine (SVM), K-Nearest Neighbor (KNN), Decision Tree (DT), Random Forest (RF), and Extreme Gradient Boosting tree (XGB). In the construction of the machine learning models, the SMOTE and the Stratified K-fold Cross Validation (KFCV) are employed for resampling and key feature selection on the six machine learning models, respectively. Grid Search Optimization (GSO) is applied to determine the hyperparameter configurations for each machine learning model.
Stage 3: Model evaluation to identify the optimal model. After the model training and testing, the prediction performance of the machine learning models is evaluated using macro precision, macro recall, macro F1-score, the Receiver Operating Characteristic (ROC) curve, and the Area Under the Curve (AUC) of the ROC curve. Additionally, the Stratified K-fold Cross Validation (KFCV) is employed to assess the fitting issues of these models. These indicators and their respective scores provide a comprehensive validation of the candidate machine learning models. Subsequently, model validation is conducted to finalize the machine learning model with the best overall performance, which will be used as a follow-up analysis.
Stage 4: Model interpretation and prediction. During the screening of machine learning models, we identify key features that quantitatively influence the model’s output and quantify these features effectively. Furthermore, we elucidate the relevance and importance of these key features. The model provides the final predictions for the classification results of CR Express node cities and identifies prime candidates for CR Express assembly centers.
2.4. Data Collection
2.4.1. Construction of Node City Evaluation Index System
Synthesizing the existing research and the current development situation of CR Ex-press node cities, this study uses multi-source geospatial data to construct a four-level hierarchical evaluation index system by selecting 40 indicators from five critical dimensions: economic vitality, ecological sustainability, logistics capacity, network connectivity, and policy support (as shown in Table 2) [35,36,37,38,39,40].
Table 2.
Characteristics presented in the dataset.
- Economic vitality
Economic vitality is an important dimension to assess node cities, and they can be evaluated from economic status and sustainable development capacity. The level of economic development is assessed using indicators such as gross regional product, total imports and exports, and total retail sales of consumer goods to reflect the regional economic aggregate and growth momentum [19].
The sustainable development capability covers the urban development potential and the level of new-quality productive forces. The urban development potential reflects the market expansion capability. It is demonstrated through population dynamics, including the size and growth rate of the resident population; investment intensity, measured by the growth rate of fixed-asset investment; and industrial momentum, indicated by the growth rate of the value added of industry above a designated size. The new-quality productive forces depend on the degree of industrial agglomeration and the level of digitization, as reflected in the entropy of secondary industry location, the number of mobile users, the number of fixed Internet broadband access users, the number of higher education institutions, and the number of patents granted, which jointly contribute to promoting the sustainable development of the city [38].
- Ecological sustainability
Ecological sustainability is a core dimension for assessing the realization of high-quality development in a city, focusing on three major criteria: natural resource endowments, ecological construction effectiveness, and environmental governance efficiency. The natural resources reflect the basic carrying capacity measured by per capita water consumption and agricultural land area. Ecological construction quantifies the level of ecological space provision through the green coverage rate of built-up areas and the park green space area per capita. Environmental governance uses the sewage treatment rate and the synthetic utilization rate of industrial waste to assess the implementation effectiveness [36].
- Logistic capacity
Sound logistics capacity serves as a critical dimension underpinning the efficient operation of the railway express, and the overall effectiveness of urban logistics is the result of the joint action of three major criteria: transport capacity, transport security, and infrastructure [39]. Transportation capacity focuses on the core characteristics of international container transportation, which is systematically evaluated by indicators such as freight volume, freight turnover volume, operational frequency, CR Express trade volume, the proportion of return freight, and the average travel speed, etc. Transportation security reflects the ability of risk prevention and control and the level of cargo value protection, and is measured by the number of operational safety accidents of CR Express, the number of incidents involving cargo loss and theft, and the volume of international insurance business. Logistics infrastructure assesses the logistics service capacity and the efficiency of transportation organization of logistics hubs through indicators such as the density of the highway network, the density of the railway network, fixed-asset investment in the transportation industry, and the number of cargo vehicles in operation, etc.
- Network connectivity
Network connectivity serve as the key guarantee dimension for the success of transnational economic cooperation initiatives like the BRI, which includes two major criteria: location conditions and customs clearance facilitation level [10]. Location conditions have both administrative and geographic attributes. Their strategic position is measured by logistics hub classification, while geographic advantages are quantified by the accessibility of node cities and the distance between node cities and exit ports. The level of customs clearance facilitation is reflected by the number of entry and exit ports and the number of CR Express lines. Regarding the score of the logistics hub level, it is determined based on documents such as the list of the first batch of national logistics hubs constructed in 2019, the major cities of the Silk Road Economic Belt, the Medium- and Long-Term Railway Network Plan, and the National Circulation Node City Layout Plan (2015–2020). Cities that are national-level logistics hubs, cities along the Silk Road Eco-nomic Belt, cities where railway container central stations are located, and “national-level circulation node cities” are scored 2 points, and regional-level circulation node cities are scored 1 point.
- Policy support
The policy support is a key dimension for facilitating the operation of CR Express. The support is analyzed based on government support, resource input, and openness and co-operation [40]. Government support is measured by the number of relevant policies issued, the depth of government resource input is reflected in the subsidy policy of CR Express, and the degree of openness is reflected by the number of foreign cities covered by CR Express and the number of cities that have established friendly relations.
2.4.2. Data Processing
The 33 node cities, as identified in the China Railway Express Construction and Development Plan (2016–2020), are selected as the research objects. These cities include major inland cargo sources, major railroad hubs, important coastal ports, and land border ports. As listed in Table 2, this study collected data on 40 indicators for 33 CR Express node cities from 2011 to 2023, yielding a total of 17,160 raw data points. Through the annual mean aggregation to reflect long-term trends, a dataset containing 1320 feature samples was constructed. Next, the collected indicator values were subjected to both Z-score standardization and dimensionless transformation using the StandardScaler function from the Scikit-learn library to form a new dataset containing standardized feature columns. The node cities of CR Express were classified into two levels (Level 1 and Level 2), with the classification results serving as sample labels to ultimately construct a new dataset. Then, the train_test_split function from Scikit-learn library was used to divide the newly constructed dataset into training and testing sets with an 8:2 ratio. This division lays the data foundation for the subsequent model construction [41]. The basic formula for Z-score standardization is as follows:
Here, x is the original data value; µ is the mean value of the column; σ is the standard deviation of the column; and is the value after standardization processing.
With reference to the construction of the demonstration project of China Railway Express assembly centers issued by the National Development and Reform Commission in 2020, CR Express node cities are classified into different levels. The classification results are shown in Table 3.
Table 3.
Classification of China Railway Express node cities.
2.5. Model Construction
2.5.1. Machine Learning Models
The study compares and analyzes the application of six commonly advanced machine learning models (LR, SVM, KNN, DT, RF, and XGB) in node city evaluation to identify the optimal evaluation model. The basic principles of each model are briefly described as follows.
- Logistic Regression (LR)
Logistic Regression (LR) is a probabilistic linear classifier that typically solves binary classification problems, and its conditional probability distribution can be expressed as follows:
where Y takes the value 0 or 1; x denotes the input feature; and ω denotes the weight associated with that feature.
- Support Vector Machines (SVM)
Support Vector Machines (SVM) are machine learning algorithms for classification and regression, mapped to higher dimensional spaces using kernel tricks to handle nonlinearly separable data. The nonlinear Support Vector Machines model can be represented as follows:
where i indexes the sample; xi is the feature vector; yi is the positive example point; K(x, z) is a positive definite kernel function; N is the number of linear Support Vector Machines; ai∗ and b∗ are the vectors of optimal solutions.
- K-Nearest Neighbors (KNN)
K-Nearest Neighbors (KNN) is a nonparametric model based on feature space similarity measures, which utilizes the categories of the K samples in the training dataset that are most similar to the sample to be classified to determine the sample to be classified. The decision rule is as follows:
where ŷ is the model prediction; Nk(x) is the set of K-nearest neighbors of x; mode denotes the number of pluralities taken.
- Decision Tree (DT)
Decision Tree (DT) is a machine learning method for classification and prediction based on tree structure, which recursively divides the feature space by Information Gain (ID3) or Gini coefficient (CART). The information entropy is calculated as follows:
where C is the number of categories; Pj represents the proportion of category j in the sample set S.
- Random Forest (RF)
Random Forest (RF) is a learning method that integrates multiple decision trees. In the process of constructing each decision tree, nodes are split based on criteria such as the Gini index, and the feature with the smallest Gini value is taken as the optimal feature. The Gini coefficient is calculated as follows:
- Extreme Gradient Boosting Tree (XGB).
Extreme Gradient Boosting Tree (XGB) is a boosting algorithm based on regression trees, which is essentially an improvement and optimization of the gradient decision tree algorithm. The objective function of the model is as follows:
where N is the number of samples; yi is the actual value; ŷi represents the predicted value; l is the loss function of the model; t is the number of iterations; Ω(ft) is the canonical term of the t-th iteration; ω denotes the leaf node weight; γ is the penalty coefficient for the number of leaf nodes; λ is the regularization coefficient; T denotes the number of leaf nodes.
2.5.2. Resampling
Resampling techniques can significantly improve the prediction performance of classification models on imbalanced datasets [42]. In this study, there is a problem of class imbalance in the dataset of node cities classified into different levels, and the resampling technique should be used to rebalance the levels in the dataset. The SMOTE oversampling method has shown good performance in existing studies, and this study applies the SMOTE technique to perform resampling to balance the dataset, and the performance of the resampling method is comprehensively evaluated by using the Imbalance Ratio (IR), Oversampling Ratio (OR), Undersampling Ratio (UR), and model performance indicators. The formulas for IR, OR, and UR are as follows:
where max (si/sj, sj/si) is the imbalance ratio between classes i and j; si and sj are the sample sizes of classes i and j, respectively; “Oversamplingsize” is the sample increase in the oversampling class; “Undersamplingsize” is the sample decrease in the undersampling classes; “Originalsamplingsize” is the sample size of the dataset before resampling.
2.5.3. Feature Selection
Feature selection can effectively identify key features that have a significant impact on the research objective from a large number of candidate features, as a core step in machine learning, which could improve the learning effect and accuracy. Supervised feature selection methods are mainly categorized into three types: filtering method, wrapping method, and embedding method. The embedding method combines the advantages of the filtering method and the wrapping method, which can complete the feature selection during the model training process, and exhibits better performance in terms of stability and prediction effectiveness [20]. In addition, Stratified K-fold Cross Validation (KFCV) plays an important role in key feature selection to ensure that the selected features have good stability and generalization ability on different data subsets [23]. Therefore, in this study, based on the ranking of features, the embedding method is used to screen the key features, and the model based on feature subsets is iteratively trained and validated using KFCV. And the optimal feature combination is selected according to the cross-validation accuracy. The performance evaluation formula of KFCV is as follows:
where is the accuracy on the k-th fold validation set.
2.5.4. Hyperparameter Tuning
Hyperparameter tuning, as a core aspect of model training, can improve the accuracy and generalization ability of the model by optimizing its parameter settings. Commonly used tuning methods include Random Search (RS), Grid Search Optimization (GSO), and Bayesian Optimization (BO). Among them, GSO seeks the optimal model configuration by traversing combinations of predefined parameter values, which is particularly suitable for situations where the parameter space is small or where each parameter setting needs to be fully explored [16]. Therefore, in this study, we employ GSO in conjunction with KFCV scores to conduct a global optimization of the hyperparameter space for the multiclassification algorithms, and ultimately to determine the hyperparameter configurations associated with each model. The optimization objective formula of GSO is as follows:
where Pij is the model’s prediction of the probability that sample i belongs to category j; yij is the true value of sample i; H is the Cartesian product of the hyperparameter space.
For each hyperparameter combination θ, the average performance of the K validations is calculated as follows:
where Scorek(θ) is the evaluation result of the k-th fold validation set.
2.6. Performance Evaluation
After training and testing each model, the performance of multiple machine learning models is typically evaluated using indicators such as Precision, Recall, F1-Score, ROC curves, and AUC values. KFCV is widely employed to determine whether the model is suffering from overfitting or underfitting [41]. This study calculates Precision, Recall, and F1-Score using the macro-average method, and collectively employs these indicators, along with AUC values from ROC curves and Stratified K-fold Cross-Validation scores, as indicators for model performance evaluation [43]. Meanwhile, the effectiveness and stability of the models are assessed by setting minimum thresholds for each evaluation indicator and calculating the confidence interval (CI). The specific process is shown in Figure 2 [44,45].
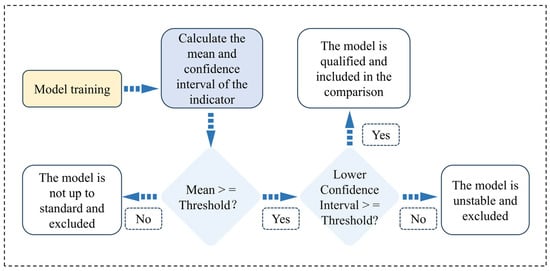
Figure 2.
The evaluation process for the models.
The confidence interval (CI) is calculated as follows:
where is the sample mean; S is the standard deviation of the sample; N is the sample size; Zα/2 is the critical value of the standard normal distribution corresponding to the confidence level of 1-α.
Table 4 lists the definitions, calculation formulas, and minimum threshold standards of each indicator. Specifically, for the formulas in this table, TP denotes the number of samples correctly predicted as positive classes, TN denotes the number of samples correctly predicted as negative classes, FP denotes the number of samples incorrectly predicted as positive classes, and FN denotes the number of samples incorrectly predicted as negative classes. In general, based on the above indicators, the performance of each model can be comprehensively quantified, and the machine learning model with the best comprehensive performance can be screened.
Table 4.
Definition, calculation formula, and minimum threshold of model performance evaluation indicators.
2.7. Model Interpretation and Prediction
After completing the model training and testing, the screened machine learning model is further analyzed to reveal the correlation performance of key features, which can be used to better interpret the model output. By demonstrating the strength of feature correlation, identifying feature redundancy and collinearity problems, and effectively quantifying the contribution of each feature in the model to the prediction results, an optimal decision-making model is identified, and its core features are screened. Meanwhile, the stability of features under different data subsets is assessed by showing the distribution of feature scores for different classes. Conducting in-depth analysis of the model features from the above different perspectives helps to comprehensively understand the relationship between the features and the model performance.
Based on the model interpretation, prime candidates for CR Express assembly centers are predicted based on the screened model, and the results can provide a basis for relevant decision-making departments in formulating regional development strategies, optimizing resource allocation, and other aspects.
3. Results and Discussions
3.1. Analysis of Resampling Results
The dataset that has undergone class division suffers from severe category imbalance. Using SMOTE resampling can effectively balance the dataset. The IR before resampling reaches 7.67. After applying SMOTE resampling, the IR, OR, and UR are 1.00, 1.77, and 1.00, respectively, indicating that the dataset after resampling has reached a balanced state.
A comparative analysis was conducted to compare and analyze the performance differences between the models before and after resampling in the classification task, using six typical machine learning models such as LR and SVM as benchmarks (as shown in Table 5). The performance of the models trained on the dataset resampled by SMOTE is generally superior to that of the models trained on the pre-resampled dataset. Specifically, the macro precision, macro recall, and macro F1-score of the post-resampling models are improved by 14.5%, 11.1%, and 10.0% on average, and have a significant effect on the performance improvement of the tree models. This result validates the superiority of adopting the SMOTE resampling method.
Table 5.
Performance comparison before and after resampling.
3.2. Analysis of Feature Selection Results
To further enhance the performance and accuracy of machine learning, this study trained six models on embedded feature selection methods based on the CR Express node city dataset, and identified the best feature combinations of each model according to the scores of Stratified K-fold Cross-Validation (K = 3). As shown in Figure 3, the performance of different feature combinations in the same model varies, and all models are able to identify the feature combinations with the highest validation accuracy. Taking RF as an example, RF reaches its peak cross-validation accuracy when the number of feature combinations is adjusted to 11. At this optimal configuration, the feature combinations contain 11 indicators such as CR Express trade volume (L4), logistics hub classification (C1), operational frequency (L3), and accessibility of node cities (C2).
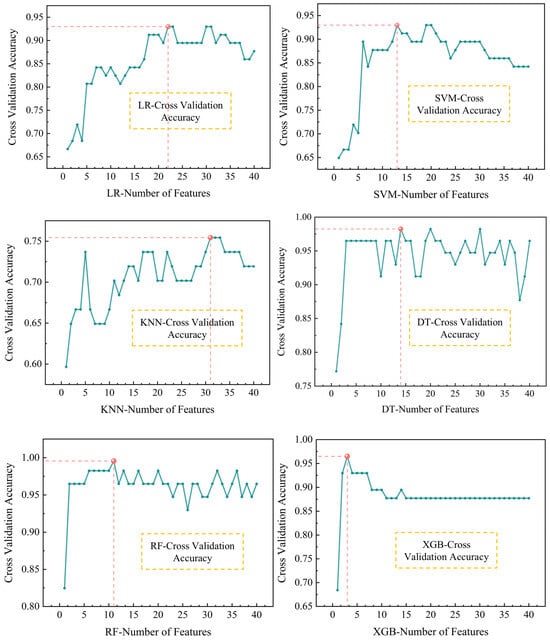
Figure 3.
Model cross-validation accuracy with different number of features (The red lines indicate minimum features for maximum score, while the green lines indicate the accuracy curve.).
To assess the effectiveness of the embedded feature selection method, we compare the performance differences of six machine learning models, such as LR and SVM, etc., before and after feature selection (as shown in Table 6). The results show that the macroP, macroR, and macroF1-score values of the models increased by an average of 8.9%, 3.7%, and 6.4%, respectively, after feature selection, indicating that feature selection can further optimize the model performance.
Table 6.
Performance comparison before and after feature selection.
3.3. Analysis of Hyperparameter Tuning Results
For the six machine learning models of LR, SVM, KNN, DT, RF, and XGB, their hyperparameters are tuned and optimized using KFCV and GSO. The hyperparameter tuning process involves utilizing GSO to construct a multi-dimensional parameter matrix for comprehensive parameters, and combined with KFCV (K = 3), which randomly divides the training set into K mutually exclusive subsets, cyclically performs K training-validation iterations, and ultimately determines the optimal hyperparameter configurations of the models based on the average performances of the model’s performance indicators in the validation set. The hyperparameter tuning results of the six models are shown in Table 7.
Table 7.
Hyperparameter configuration of the models.
3.4. Model Performance Evaluation Results
For the six machine learning models trained on the same dataset, the six indicators listed in Table 4 are used to evaluate their performance for predicting CR Express node cities. Table 8 presents the mean scores for the five indicators, AUC, macroP, macroR, macroF1, and K-fold score. The ROC curve assesses the classification performance of the model by plotting the true positive rate (TPR) and false positive rate (FPR) across different thresholds, with the area under the curve defined as the AUC score (as shown in Figure 4). Results show that the AUC, macroP, and macroR scores of all the models exceed the predefined thresholds. However, the AUC of DT and the mean macroF1-scores of KNN fail to meet the threshold, and these underperforming DT and KNN models should be excluded.
Table 8.
The mean scores of evaluation indicators based on machine learning models.
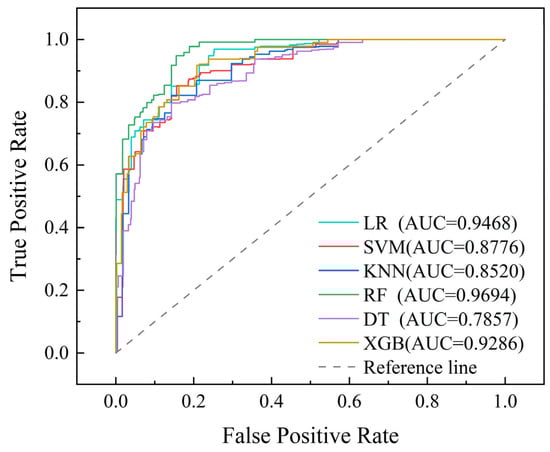
Figure 4.
Comparison of ROC curves for six machine learning models.
To further evaluate the stability of the models, stratified cross-validation (K = 3) repeated 10 times is employed to calculate the 95% confidence interval (CI) for AUC, macroP, macroR, and macroF1 of LR, SVM, RF, and XGB (Table 9). The lower bounds of the CI for all model indicators exceeded the predefined thresholds, indicating that all three models meet the stability requirements. For AUC, macroP, and macroR, RF exhibited a narrower CI and higher lower bounds, demonstrating its superior classification performance and better stability. Although XGB showed slightly higher macroF1 values than RF, its CI is wider, reflecting inferior stability. Therefore, RF is identified as the optimal model through comprehensive evaluation.
Table 9.
Confidence intervals of evaluation indicators based on machine learning models.
To verify the practical value of the model, the actual data on the five existing CR Express assembly centers, Zhengzhou, Chongqing, Chengdu, Xi’an, and Urumqi, during the period from 2011 to 2020, are additionally used to construct an independent testing set and trained by RF. The output results of the model are found to be consistent with the actual situation. Therefore, RF is selected to evaluate the CR Express node cities and further analyze their key features.
3.5. Model Interpretation and Prediction Results
3.5.1. Feature Correlation Analysis
The evaluation of CR Express node cities is carried out using RF, by combining it with a feature-ranking mechanism and employing an embedding method within the model to demonstrate the correlation of the selected features. The feature combination selected based on the model encompasses 11 features, including freight volume (L1), operational frequency (L3), synthetic utilization rate of industrial waste (S6), number of higher education institutions (V11), proportion of return freight (L5), density of the highway network (L10), logistics hub classification (C1), accessibility of node cities (C2), number of entry and exit ports (C4), number of CR Express lines (C5), and CR Express trade volume (L4). The Spearman correlation coefficients among the features are generally lower than 0.30, indicating a weak correlation among these features. This shows that the information overlap rate among the features is low, and the issue of multicollinearity is not severe (as shown in Figure 5).
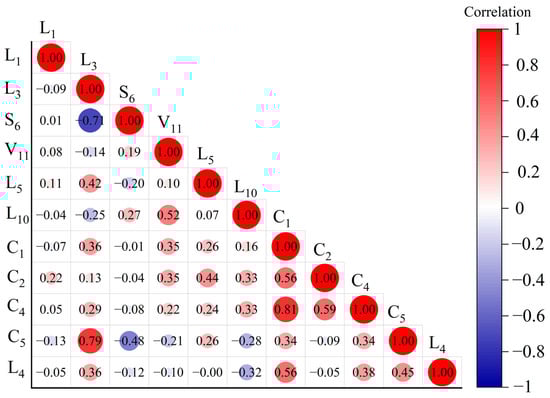
Figure 5.
Heat map of feature correlation coefficients.
3.5.2. Feature Importance Analysis
Based on the key feature importance analysis of RF (Figure 6), CR Express trade volume (L4), logistics hub classification (C1), operational frequency (L3), and accessibility of node cities (C2) emerged as the top evaluation indicators of CR Express node cities. CR Express trade volume (L4) reflects a node city’s cargo distribution capacity in CR Express, where cities with higher trade volumes possess stronger resource integration capabilities, thereby influencing the agglomeration of more logistics resources. The logistics hub classification (C1) signifies their status in the national logistics network, and high-level hubs can directly impact train operation efficiency and network connectivity by reducing cargo handling costs. The operational frequency (L3) directly reflects operational efficiency. An increase in departures can lower unit costs, attract cargo aggregation, and thereby enhance the competitiveness of node cities. The accessibility of node cities (C2), which quantifies network connectivity based on complex network theory, can reduce transportation time and lower cargo damage rates by improving accessibility, thus influencing cargo owner preference.
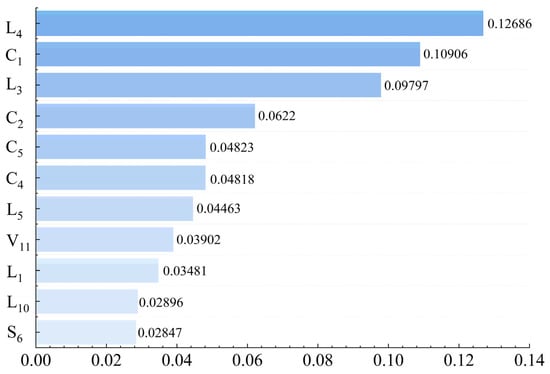
Figure 6.
Feature importance of CR Express node cities based on RF.
The secondary indicators in the evaluation process include the number of CR Express lines (C5), the number of entry and exit ports (C4), and the proportion of return freight (L5). The number of CR Express lines (C5) aligns with the supply chain resilience theory, as multi-route layouts can disperse geopolitical risks and further enhance the disturbance resistance of node cities. The number of entry and exit ports (C4) reflects customs clearance efficiency node cities with more ports that can achieve multi-port diverging customs clearance, directly influencing transportation timeliness. The proportion of return freight (L5) embodies a node city’s capability to organize freight transportation, where a high return trip proportion is crucial for achieving two-way logistics balance.
In contrast, indicators such as the number of higher education institutions (V11), freight volume (L1), the density of the highway network (L10), and the synthetic utilization rate of industrial waste (S6) exhibit lower feature importance and contribute less to the evaluation. The number of higher education institutions (V11) indirectly influences a node city by driving long-term logistics innovation through talent reserve. Freight volume (L1), encompassing both road and rail freight, indirectly reflects a node city’s transportation capacity in CR Express. The density of the highway network (L10) demonstrates the supporting role of infrastructure, as a high-density highway network ensures “last-mile” collection and distribution efficiency. The synthetic utilization rate of industrial waste (S6) measures achievements in green development, aligning with the green transition trend of CR Express and playing a prospective role.
3.5.3. Model Prediction
Based on the binary supervised classification in the training phase (Table 3), this study conducted a refined identification of 33 CR Express node cities using the trained RF model, achieving a three-level unsupervised classification through the model’s output comprehensive scores (as shown in Table 10). Zhengzhou, Chongqing, Chengdu, Xi’an, and Urumqi have the highest overall city scores and are classified into the first level. Cities such as Changsha, Wuhan, Shenyang, Jinan, and Hefei are ranked closely after them and are classified into the second level, while the remaining node cities are classified into the third level. The results showed that the classification of the first batch of assembly centers was completely consistent with the binary classification results of the training model, while Changsha, Wuhan, Shenyang, Jinan, and Hefei emerged as the most promising future CR Express assembly centers. The identification of second-level cities provides a direction for subsequent hub construction.
Table 10.
The three-level classification of China Railway Express node cities based on the RF model.
The prediction results demonstrate that the potential CR Express assembly centers are Changsha, Wuhan, Shenyang, Jinan, and Hefei. These assembly centers form spatial complementarity with the five existing CR Express assembly centers including Zhengzhou, Chongqing, Chengdu, Xi’an, and Urumqi, jointly covering the nationwide CR Express transportation network. CR Express node cities show differential development trends, and Figure 7 illustrates the feature scores of cities at different levels. The five first-level cities, as the five existing assembly center cities, have significant advantages in the development of core features, leveraging the synergistic benefits of location, transportation capacity, and infrastructure to form a differentiated competitive landscape. The second-level cities demonstrate distinct development advantages, primarily in the aggregation of innovative elements and sustainable development ability. Compared to the assembly centers, there are still gaps in their basic evaluation indicators, and these gaps require further improvement. The third-level cities exhibit unbalanced development characteristics. While they possess development potential in green development, transport efficiency improvement, and channel construction, there are significant gaps in infrastructure construction and notable shortcomings in core features, which need to be strengthened by construction and development in the relevant fields.
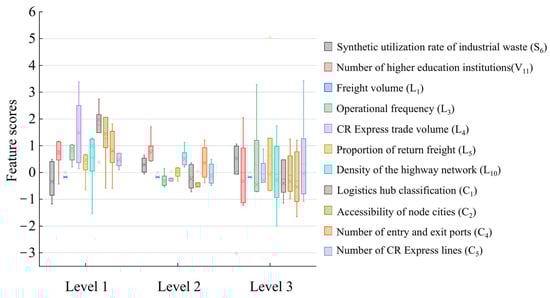
Figure 7.
Box plots of the feature scores of CR Express node cities.
Based on multi-source data, this study innovatively employs supervised classification combined with embedded feature selection to achieve node evaluation and prediction. Compared with traditional statistical methods and mainstream international unsupervised algorithms, supervised classification introduces the grade labels of CR Express node cities, which avoids the subjectivity of predefining clusters in unsupervised clustering. It can more accurately capture the mapping between features and node classification, and is better adapted to the context of CR Express. Embedded feature selection further identifies key indicators with high contribution to classification, addressing the ambiguity in feature weighting inherent in traditional methods. Meanwhile, the evaluation framework is enhanced by integrating new indicators such as new-quality productivity, ecological construction, and policy support, which supplement traditional evaluation systems. Within the general framework of domestic and international node classification, this study adapts to the policy attributes and operational characteristics of CR Express, demonstrating the applicability of the framework in node classification research while showcasing the significant advantages of the improved method in evaluating CR Express node cities. Notably, all model performance indicators exceed 70%, with the highest reaching 99.6%. This provides a methodological reference for more precise logistics node evaluation in countries along the Belt and Road Initiative (BRI).
4. Conclusions
This study evaluates CR Express node cities by constructing an evaluation model that integrates multi-source geospatial data and advanced machine learning algorithms. The method comprises steps such as data collection, resampling, feature selection, hyperparameter optimization, and evaluation prediction. And by comparing the performance of six machine learning algorithms, the optimal algorithm Random Forest (RF) is selected for evaluation, and we can draw the following main conclusions.
Random Forest (RF), as a machine learning algorithm integrating multi-source geospatial data, demonstrated the relatively best performance in the evaluation study of CR Express node cities, with a maximum of 99.6%. Six machine learning models, including Logistic Regression (LR), Support Vector Machine (SVM), K-Nearest Neighbor (KNN), Decision Tree (DT), Random Forest (RF), and Extreme Gradient Boosting Tree (XGB), were comprehensively evaluated using evaluation indexes such as AUC, macroP, macroR, macroF1, and K-fold scores. All the learning models achieved prediction reliability of over 70%, which verifies the advantages of integrating multi-source geospatial data and advanced machine learning in the evaluation study of node cities.
The first 11 features were selected as decisive indicators in the training of the Random Forest (RF) model. Among these features, CR Express trade volume, logistics hub classification, operational frequency, and the accessibility of node cities were the top indicators affecting the evaluation of node cities. Meanwhile, the number of CR Express lines, the number of entry and exit ports, and the proportion of returns also showed significant influences during the evaluation process. And the number of higher education institutions, freight volume, the density of the highway network, and the synthetic utilization rate of industrial waste had relatively low contributions to the evaluation. The node cities exhibited differential development. First-level cities had significant development advantages based on location conditions, transportation capacity, and infrastructure. Second-level cities showed distinctive development advantages in terms of the concentration of innovation factors and sustainable development capacity. Third-level cities had a certain gap with the other cities, with overall unbalanced development.
The prediction results of the Random Forest (RF) model indicate that Zhengzhou, Chongqing, Chengdu, Xi’an, and Urumqi perform excellently in the evaluation and prediction. Meanwhile, Changsha, Wuhan, Shenyang, Jinan, and Hefei follow as potential cities for CR Express assembly centers. They will further enhance the service coverage capacity of the CR Express transportation network in conjunction with the existing five major assembly centers and jointly establish a nationwide collection and distribution system with nationwide coverage. This can provide an important basis for relevant decision-making departments to formulate development strategies, optimize resource allocation, and other relevant aspects.
Author Contributions
Conceptualization, Chenglin Ma and Mengwei Zhou; evolutionary gaming methodology, Chenglin Ma and Mengwei Zhou; software, Mengwei Zhou; validation, Mengwei Zhou and Haolong Wang; formal analysis, Mengwei Zhou; collaboration investigation, Wenchao Kang and Jiajia Feng; resources, Mengwei Zhou; data curation, Mengwei Zhou; writing—original draft preparation, Chenglin Ma and Mengwei Zhou; writing—review and editing, Haolong Wang and Mengwei Zhou; visualization, Mengwei Zhou; supervision, Haolong Wang; project administration, Chenglin Ma; funding acquisition, Chenglin Ma. All authors have read and agreed to the published version of the manuscript.
Funding
This study was funded by the Heilongjiang Provincial Natural Science Fund (LH2023G002). We are grateful to the Natural Science Foundation of Heilongjiang Province.
Data Availability Statement
The datasets used and analyzed during the current study are available from the corresponding author upon reasonable request.
Conflicts of Interest
The authors declare no conflicts of interest.
References
- Guo, S.; Wei, Z.; Sun, Z.; Li, Y.; Li, G. Evaluation of Market Share of New International Land-Sea Trade Corridor in Different Periods of COVID-19. JST 2023, 23, 305–313. [Google Scholar] [CrossRef]
- Choi, K.S. The current status and challenges of China Railway Express (CRE) as a key sustainability policy component of the Belt and Road Initiative. Sustainability 2021, 13, 5017. [Google Scholar] [CrossRef]
- Wang, Y. Status, Problems and Suggestions on Development of Sino-Europe Block Trains. Compr. Transp. 2015, 37, 70–75+89. [Google Scholar]
- Liu, Y.; Dong, G. Optimization of Site Selection for China Railway Express Assembly Center. Railw. Transp. Econ. 2023, 45, 10–18. [Google Scholar] [CrossRef]
- Feng, F.; Cai, M.; Jia, J. Key Node Identification of China Railway Express Transportation Network Based on Multi-layer Complex Network. JST 2023, 22, 191–200. [Google Scholar] [CrossRef]
- Zhang, D.; Zhang, F.; Chen, W.; Wang, Z. Optimization of international transportation network of China Railway Express under demand uncertainty. J. Railw. Sci. Eng. 2021, 18, 2841–2848. [Google Scholar] [CrossRef]
- Zhou, X.; Sun, J.; Fu, H.; Ge, F.; Wu, J.; Lev, B. Resilience analysis of the integrated China-Europe freight transportation network under heterogeneous demands. Transp. Res. Part A Policy Pract. 2024, 186, 104130. [Google Scholar] [CrossRef]
- Zhang, X.; Zhang, W.; Lee, P.T.W. Importance rankings of nodes in the China Railway Express network under the Belt and Road Initiative. Transp. Res. Part A Policy Pract. 2020, 139, 134–147. [Google Scholar] [CrossRef]
- Cheng, Z.; Zhao, L.; Wang, G.; Li, H.; Hu, Q. Selection of consolidation center locations for China railway express to reduce greenhouse gas emission. J. Clean. Prod. 2021, 305, 126872. [Google Scholar] [CrossRef]
- Qi, Y.; Harrod, S.; Psaraftis, H.N.; Lang, M. Transport service selection and routing with carbon emissions and inventory costs consideration in the context of the Belt and Road Initiative. Transp. Res. Part E Logist. Transp. Rev. 2022, 159, 102630. [Google Scholar] [CrossRef]
- Li, D.; Zhao, L.; Wang, C.; Sun, W.; Xue, J. Selection of China’s imported grain distribution centers in the context of the Belt and Road initiative. Transp. Res. Part E Logist. Transp. Rev. 2018, 120, 16–34. [Google Scholar] [CrossRef]
- Zhang, W.; Qin, S.; Peng, Q.; Qin, H. A Reflection on the Establishment of the Quality Evaluation Index System of China Railway Express. Railw. Transp. Econ. 2019, 41, 85–89. [Google Scholar] [CrossRef]
- Sun, W.; Zhao, L.; Wang, C.; Li, D.; Xue, J. Selection of consolidation centers for China railway express. Int. J. Logist. Res. Appl. 2020, 23, 417–442. [Google Scholar] [CrossRef]
- Jiang, Y.; Sheu, J.B.; Peng, Z.; Yu, B. Hinterland patterns of China Railway (CR) express in China under the Belt and Road Initiative: A preliminary analysis. Transp. Res. Part E Logist. Transp. Rev. 2018, 119, 189–201. [Google Scholar] [CrossRef]
- Fan, X. A Tentative Study on the Countermeasures for Developing China Railway Express Piggyback Transportation Under the Belt and Road Initiative. Railw. Transp. Econ. 2019, 41, 40–43. [Google Scholar] [CrossRef]
- Shi, X.; Wong, Y.D.; Li, M.Z.F.; Palanisamy, C.; Chai, C. A feature learning approach based on XGBoost for driving assessment and risk prediction. Accid. Anal. Prev. 2019, 129, 170–179. [Google Scholar] [CrossRef]
- Liu, S.; Du, H.; Li, G.; Gao, G.; Yang, N. Construction of Logistics Competitiveness System and Level Measurement of Node Cities of China Railway Express Based on Text Mining. Curr. Sci. 2025, 5, 1079–1090. [Google Scholar] [CrossRef]
- Zhao, L.; Zhao, Y.; Hu, Q.; Li, H.; Stoeter, J. Evaluation of consolidation center cargo capacity and locations for China railway express. Transp. Res. Part E Logist. Transp. Rev. 2018, 117, 58–81. [Google Scholar] [CrossRef]
- Wei, Y.; Huang, C.; Li, J.; Xie, L. An evaluation model for urban carrying capacity: A case study of China’s mega-cities. Habitat. Int. 2016, 53, 87–96. [Google Scholar] [CrossRef]
- Chen, T.; Shi, X.; Wong, Y.D.; Yu, X. Predicting lane-changing risk level based on vehicles’ space-series features: A pre-emptive learning approach. Transp. Res. Part C Emerg. Technol. 2020, 116, 102646. [Google Scholar] [CrossRef]
- Nair, R.; Hoang, T.L.; Laumanns, M.; Chen, B.; Cogill, R.; Szabó, J.; Walter, T. An ensemble prediction model for train delays. Transp. Res. Part C Emerg. Technol. 2019, 104, 196–209. [Google Scholar] [CrossRef]
- Lv, Y.; Duan, Y.; Kang, W.; Li, Z.; Wang, F.Y. Traffic flow prediction with big data: A deep learning approach. IEEE Trans. Intell. Transp. Syst. 2014, 16, 865–873. [Google Scholar] [CrossRef]
- Pineda-Jaramillo, J.; Viti, F. Identifying the rail operating features associated to intermodal freight rail operation delays. Transp. Res. Part C Emerg. Technol. 2023, 147, 103993. [Google Scholar] [CrossRef]
- Bao, J.; Liu, P.; Ukkusuri, S.V. A spatiotemporal deep learning approach for citywide short-term crash risk prediction with multi-source data. Accid. Anal. Prev. 2019, 122, 239–254. [Google Scholar] [CrossRef]
- Cheng, B.; Jia, G. Improved AHP and BP Neural Network Model for Construction Companies’ Circular Economy Evaluation. Manag. Rev. 2015, 27, 36–47. [Google Scholar] [CrossRef]
- Maxwell, A.E.; Warner, T.A.; Fang, F. Implementation of machine-learning classification in remote sensing: An applied review. Int. J. Remote Sens. 2018, 39, 2784–2817. [Google Scholar] [CrossRef]
- Zhang, M.; Wang, X.; Jin, L.; Song, M.; Li, Z. A new approach for evaluating node importance in complex networks via deep learning methods. Neurocomputing 2022, 497, 13–27. [Google Scholar] [CrossRef]
- Zhang, S.; Khattak, A.; Matara, C.M.; Hussain, A.; Farooq, A. Hybrid feature selection-based machine learning Classification system for the prediction of injury severity in single and multiple-vehicle accidents. PLoS ONE 2022, 17, e0262941. [Google Scholar] [CrossRef]
- Wei, Q.; Zhang, H.; Chen, Y.; Xie, Y.; Yin, H.; Xu, Z. City scale urban flooding risk assessment using multi-source data and machine learning approach. J. Hydrol. 2025, 651, 132626. [Google Scholar] [CrossRef]
- Zhang, P.; Guo, H.; Ribeiro, F.L.; Kirillov, P.L.; Makhrova, A.G.; Gao, Z.; Gao, L. Quantifying contributions of geographical features to urban GDP outputs via interpretable machine learning. Sustain. Cities Soc. 2025, 121, 106185. [Google Scholar] [CrossRef]
- Falah, N.; Falah, N.; Solis-Guzman, J.; Marrero, M. An Indicator-Based Framework of Circular Cities Focused on Sustainability Dimensions and Sustainable Development Goal 11 Obtained Using Machine Learning and Text Analytics. Sustain. Cities Soc. 2025, 121, 106219. [Google Scholar] [CrossRef]
- Ji, T.; Li, K.; Sun, Q.; Duan, Z. Urban transport emission prediction analysis through machine learning and deep learning techniques. Transp. Res. Part D Transp. Environ. 2024, 135, 104389. [Google Scholar] [CrossRef]
- Rahman, M.A.; Basheer, M.A.; Khalid, Z.; Tahir, M.; Uppal, M. Logistics hub location optimization: A k-means and p-median model hybrid approach using road network distances. Transp. Res. Procedia 2025, 84, 219–226. [Google Scholar] [CrossRef]
- Luo, X.; Li, D.; Yang, Y.; Zhang, S. Spatiotemporal traffic flow prediction with KNN and LSTM. J. Adv. Transp. 2019, 2019, 4145353. [Google Scholar] [CrossRef]
- Li, Y.; Wang, B.; Pan, X.; Liu, Z. Competitive Evolution Characteristics and Competitiveness Enhancement Countermeasures of Five Assembly Centers for China Railway Express. Railw. Transp. Econ. 2021, 43, 38–44. [Google Scholar] [CrossRef]
- Li, F.; Liu, X.; Hu, D.; Wang, R.; Yang, W.; Li, D.; Zhao, D. Measurement indicators and an evaluation approach for assessing urban sustainable development: A case study for China’s Jining City. Landsc. Urban Plan. 2009, 90, 134–142. [Google Scholar] [CrossRef]
- Li, Y.; Guo, C.; Liu, M.; Zhu, H.; Zhang, Y. Operation Quality Evaluation of China Railway Express from the Perspective of “Dual Circulation”. Railw. Transp. Econ. 2023, 45, 10–16+23. [Google Scholar] [CrossRef]
- Liu, Y.; He, Z. Synergistic industrial agglomeration, new quality productive forces and high-quality development of the manufacturing industry. Int. Rev. Econ. Financ. 2024, 94, 103373. [Google Scholar] [CrossRef]
- Taniguchi, E.; Van Der Heijden, R.E. An evaluation methodology for city logistics. Transp. Rev. 2000, 20, 65–90. [Google Scholar] [CrossRef]
- Kundu, T.; Sheu, J.B. Analyzing the effect of government subsidy on shippers’ mode switching behavior in the Belt and Road strategic context. Transp. Res. Part E Logist. Transp. Rev. 2019, 129, 175–202. [Google Scholar] [CrossRef]
- Pineda-Jaramillo, J. Travel time, trip frequency and motorised-vehicle ownership: A case study of travel behaviour of people with reduced mobility in Medellín. J. Transp. Health 2021, 22, 101110. [Google Scholar] [CrossRef]
- Shi, X.; Wong, Y.D.; Chai, C.; Li, M.Z.F. An automated machine learning (AutoML) method of risk prediction for decision-making of autonomous vehicles. IEEE Trans. Intell. Transp. Syst. 2020, 22, 7145–7154. [Google Scholar] [CrossRef]
- Wahab, L.; Jiang, H. A comparative study on machine learning based algorithms for prediction of motorcycle crash severity. PLoS ONE 2019, 14, e0214966. [Google Scholar] [CrossRef] [PubMed]
- Bradley, A.P. The use of the area under the ROC curve in the evaluation of machine learning algorithms. Pattern Recognit. 1997, 30, 1145–1159. [Google Scholar] [CrossRef]
- Shakir, K.; Reemiah Muneer, A. A novel thresholding for prediction analytics with machine learning techniques. Int. J. Comput. Sci. Netw. Secur. 2023, 23, 33–40. [Google Scholar] [CrossRef]
Disclaimer/Publisher’s Note: The statements, opinions and data contained in all publications are solely those of the individual author(s) and contributor(s) and not of MDPI and/or the editor(s). MDPI and/or the editor(s) disclaim responsibility for any injury to people or property resulting from any ideas, methods, instructions or products referred to in the content. |
© 2025 by the authors. Published by MDPI on behalf of the International Society for Photogrammetry and Remote Sensing. Licensee MDPI, Basel, Switzerland. This article is an open access article distributed under the terms and conditions of the Creative Commons Attribution (CC BY) license (https://creativecommons.org/licenses/by/4.0/).