1. Introduction
Climate change contributes to an increased frequency of droughts and high-temperature periods [
1], which directly influences the rise in vegetation fires, particularly in woodlands. Tyukavina et al. [
2] demonstrate a growing trend in the areas affected by fires during the period from 2001 to 2019. Numerous studies suggest that the extent and duration of fires may continue to rise [
3,
4,
5,
6].
To mitigate the impacts of wildfires, it is essential to have robust systems in place for assessing fire risk and prioritizing response efforts. The initial component associated with fires and preceding evacuation route planning tools are various types of fire risk assessment systems for a given area. These systems allow for the rapid preparation of actions by rescue units in the most endangered areas. Before we can effectively plan evacuation routes and foot access to the target in areas prone to wildfires, we need to first understand the inherent fire risks of that specific region. Fire risk assessment systems play a pivotal role in this initial stage. The predominant systems and algorithms for managing activities during fires are based on determining the fire risk index in a given area [
7,
8]. In the United States, the US National Fire Danger Rating System (NFDRS) designates the most at-risk areas, aiding in estimating evacuation priorities [
9]. Other systems, such as the Wildland Fire Assessment System, focus on forecasting fire danger based on weather conditions, covering the United States [
10].
While existing systems forecast how fires may expand, during firefighting operations, rescuers, firefighting teams, or individuals at risk must navigate a given area and plan the fastest and safest evacuation routes from the endangered area. In this research, the author focused on route planning in areas lacking road networks. Route planning in such conditions is a complex task that requires specialized knowledge and tools. The analyses conducted must take into account numerous factors, such as terrain topography, vegetation, and substrate type. Current wildland routing systems, based on GIS technologies, use raster data with the above information assigned to image pixels. Algorithms determine paths through pixel centroids, connecting them based on conditions related to the smallest or largest sum of pixel values [
11]. This facilitates finding the shortest or fastest route in the field without a defined road network. A key challenge in wildland route planning is to optimize analysis time for real-time capabilities.
Route planning is the domain of database systems capable of determining routes in under a second, with high precision (the route is optimal, accurate, and considers many factors) and with a high degree of flexibility in analysis. These analyses often occur in real time [
12]. A clear advantage of databases over raw file data is the ability to seamlessly update data continuously and to enable SQL queries to be executed from outside the primary server where the database system operates [
13]. This capability is crucial for applications that require up-to-date information, such as traffic management systems or emergency response coordination. Database systems are now the primary tools for determining routes in road networks in urban areas [
14]. Extending their use to areas without a clearly defined road network will enhance the speed and simplicity of network analysis.
After a thorough review of the available scientific literature, the author concluded that there is a significant gap in research concerning the application of vector routing systems during evacuations and foot access to the wild areas target, such as forests. This deficiency motivated the author to investigate adapting a vector data-based system to determine routes in inaccessible areas. A key need in wildland firefighting is the ability to quickly determine effective routes. This requires adapting and validating a vector system for such terrain. Often, when combating small fires or using manual suppression techniques (such as backpack pumps, beaters, and shovels), firefighters must reach locations inaccessible by vehicles. The presented tool addresses this need by providing route planning functionality and, crucially, enabling rapid evacuation route calculation in response to increased danger or fire expansion.
An additional advantage of using vector data would be the possibility of performing multimodal analyses. Multimodal evacuation route planning considers a variety of transportation modes that can be utilized during crisis events such as fires. Unlike traditional plans, which often rely on a single, primary evacuation route, the multimodal approach offers more flexible and effective solutions.
The primary objective of this article is to develop, optimize, and test a method for adopting a database routing system (SpatiaLite) to swiftly determine routes from fire-risk areas to specific evacuation points or determine the fastest route to the designated point. The main innovative elements include the method of building networks in areas without a defined road network, the potential for multimodal analysis using the network within the area (evacuation on foot) and the road network (evacuation by vehicle), and determining the optimal meeting point during an evacuation by various means of transport. A key objective is to optimize the database to ensure acceptable analysis times adaptable to commercial evacuation management systems.
The author’s primary novel contribution to the research on route planning in off-road environments lies in the method of network creation and the algorithm for simplifying the vector network used in the analysis (heuristic spatial network aggregation). Furthermore, due to the use of databases, the analysis can be conducted to identify the optimal location for a mode of transport change, necessitated by the inability to continue the journey through terrain inaccessible to vehicles—multimodal analysis. The author achieved research objectives using a SpatiaLite geodatabase and the Python programming language to develop an algorithm for aggregating a vector network. The input data for creating the test database (for optimization) consisted of LiDAR data covering an area of 3.74 km2 and 40 km2 for testing multimodal path designation.
The author’s method has several advantages in route determination over widely used raster-based methods. Databases allow for storing and managing vast amounts of data regarding the network, obstacles, speed limits, and even user preferences. This enables the consideration of multiple factors influencing the optimal route. Analyses based on raster data often struggle with data updates and dynamic changes are difficult to implement, unlike in databases. The second factor surpassing current solutions is the ability to create highly detailed network models in the wildland area, which translates into greater accuracy of the determined routes. The use of databases allowed the author to easily implement routes using various means of transport (combining vehicle access with hiking).
This article is structured into Sections.
Section 2 comprises a thematic review of the literature on methods for determining routes in wildland areas.
Section 3 details the research area, describes the methodology of database construction, and introduces the concept of a comprehensive system for multimodal analyses over large areas.
Section 4 presents the obtained results and discusses potential methods for optimizing the database to determine evacuation routes from threatened areas. The final section,
Section 5, provides a summary and outlines potential avenues for further research on the topic.
3. Materials and Methods
The proposed method creates a multimodal route planning system for wildland areas, focusing on determining the fastest destination and evacuation route. First, LiDAR data are processed to generate a high-resolution digital terrain model (DTM) and vegetation density maps. Movement costs (time to traverse) are calculated based on terrain slope and vegetation density, with higher density and steeper slopes resulting in higher costs. A regular vector network is then created, connecting pixel centroids and assigning travel times to each segment based on the calculated costs. To improve efficiency, a novel heuristic algorithm (HAN) aggregates points with similar movement costs into larger squares, simplifying the network while preserving accuracy. Finally, this optimized network is integrated with existing road networks to create a multimodal system, enabling route planning that combines vehicle travel on roads with pedestrian movement in the wildland, allowing for faster and more flexible evacuation strategies.
3.1. Geographic Location
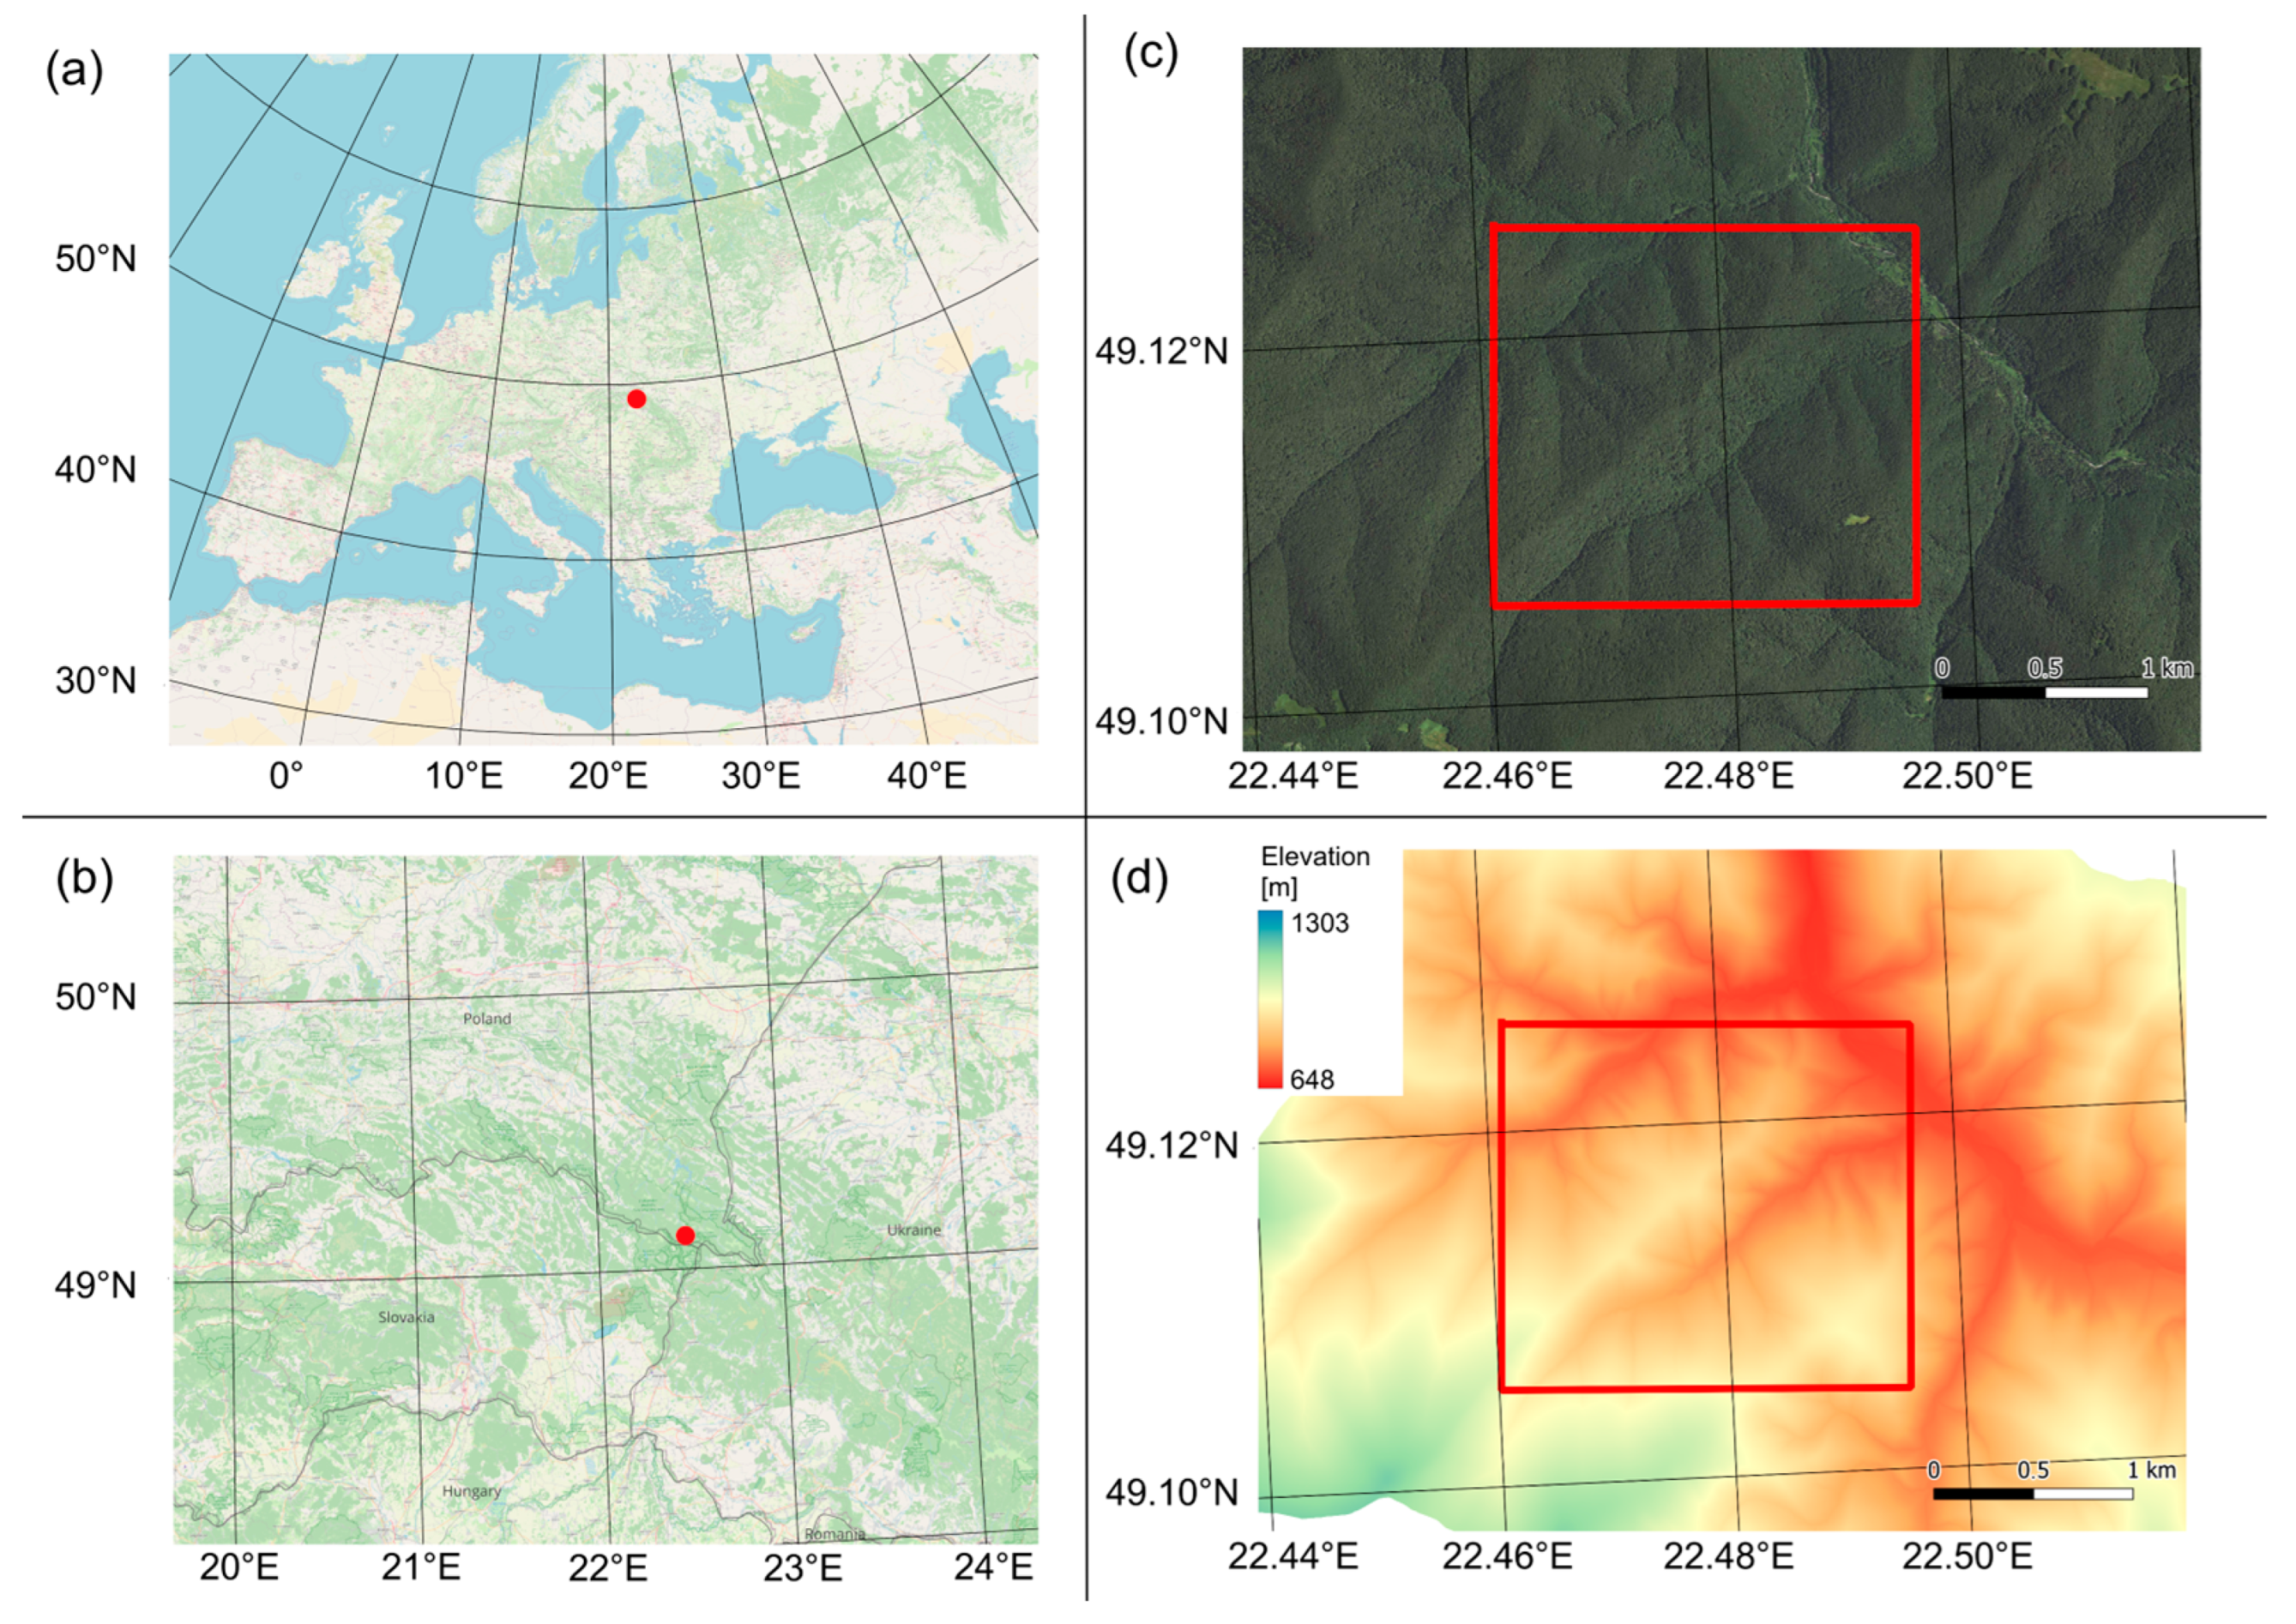
The research area selected for testing the solution is situated in Poland, covering a fragment of the Bieszczady region near the village of Moczarne, within the border strip between Poland and Slovakia (
Figure 1). Given that the evacuation route analysis is conducted with a focus on the evacuation of firefighting teams or tourists, the area under consideration, located within a national park, is unpopulated. The analyzed area spans 3.74 km
2, predominantly covered with old beech trees with an admixture of fir and sycamore. Minor watercourses traverse the area, characterized by a mountainous surface with elevations ranging from 690 m above sea level to 1028 m above sea level.
3.2. Cost Calculation for Navigating Through the Wildland Area
The primary data source for calculating the cost of movement in the terrain was a LiDAR airborne laser scanning point cloud with a density of 4 points per m2. For density determination, only the last echoes were considered. The extracted data points from the LiDAR classes included the following:
2-ground, used to create a digital terrain model (DTM) with a pixel size of 1 × 1 m;
3-low (height range 0 to 0.4 m), 4-medium (height range 0.4 to 2 m), and 5-high vegetation (height above 2 m relative to the ground class), used to create a raster with information about point density in a given location and a pixel size of 5 × 5 m;
9-water, used to create a raster with information about point density in each location and a pixel size of 5 × 5 m.
In the considered network, the cost of movement was determined as the time needed to traverse specific sections between successive nodes. This study leveraged existing knowledge about pedestrian movement speeds in wooded areas. Areas with dense vegetation (0.4 to 2 m in height, making it difficult for people to move quickly) were assumed to have one LiDAR point per m
2. Vegetation below 0.4 m was excluded because it was largely homogeneous across the study area (consisting mainly of short grass). Based on the findings of Jakubowski et al. [
51], a sampling density of one point per square meter was determined to be optimal for unequivocal vegetation type classification. With the adopted pixel resolution of 5 m, this resulted in a minimum of 25 points in each pixel of processed data. A pixel value of 0 indicated an area without vegetation hindering movement. To accommodate variations in vegetation density, the author defined six ranges representing movement speed. Movement speed was also influenced by terrain slope, with three ranges: up to 10 degrees, 10 to 30 degrees, and 30 to 45 degrees. The terrain slope was calculated from the DTM, and areas with slopes exceeding 45 degrees were considered inaccessible by foot and were excluded from the analysis. Movement speeds were derived from available data on the website [
52], assuming different conditions for vegetation density and terrain slopes; the remaining values were linearly interpolated by the author. The data are presented in
Table 1. A speed of 0.0045 m/s was assumed for movement through areas with detected water (wetlands, streams, or reservoirs—detected from LiDAR data in class 9). The author introduces a novel approach to address the challenge of non-uniform vegetation density: by dividing the speed of data acquisition (represented by the speed of movement) by the density of measurement points (represented by the number of LiDAR points). The assumed travel speeds based on land cover types were used during the network connection building stage to calculate the travel time for specific road sections.
3.3. Regular Vector Model of a Network in a Wildland Area
The foundation for constructing the connection network is based on determining the centroids of raster pixels with the terrain slope. These points were utilized to extract information from other rasters, such as the density of points with detected water and the intensity of vegetation. To obtain values of individual rasters at locations defined by vector points, the built-in functionality of QGIS was utilized. This tool automatically samples raster values at the intersections of the rasters with the point geometries. As a result, for each point, a set of values corresponding to the individual raster pixels directly beneath that point was obtained. These data, treated as separate attributes, facilitated the assignment of movement speed according to
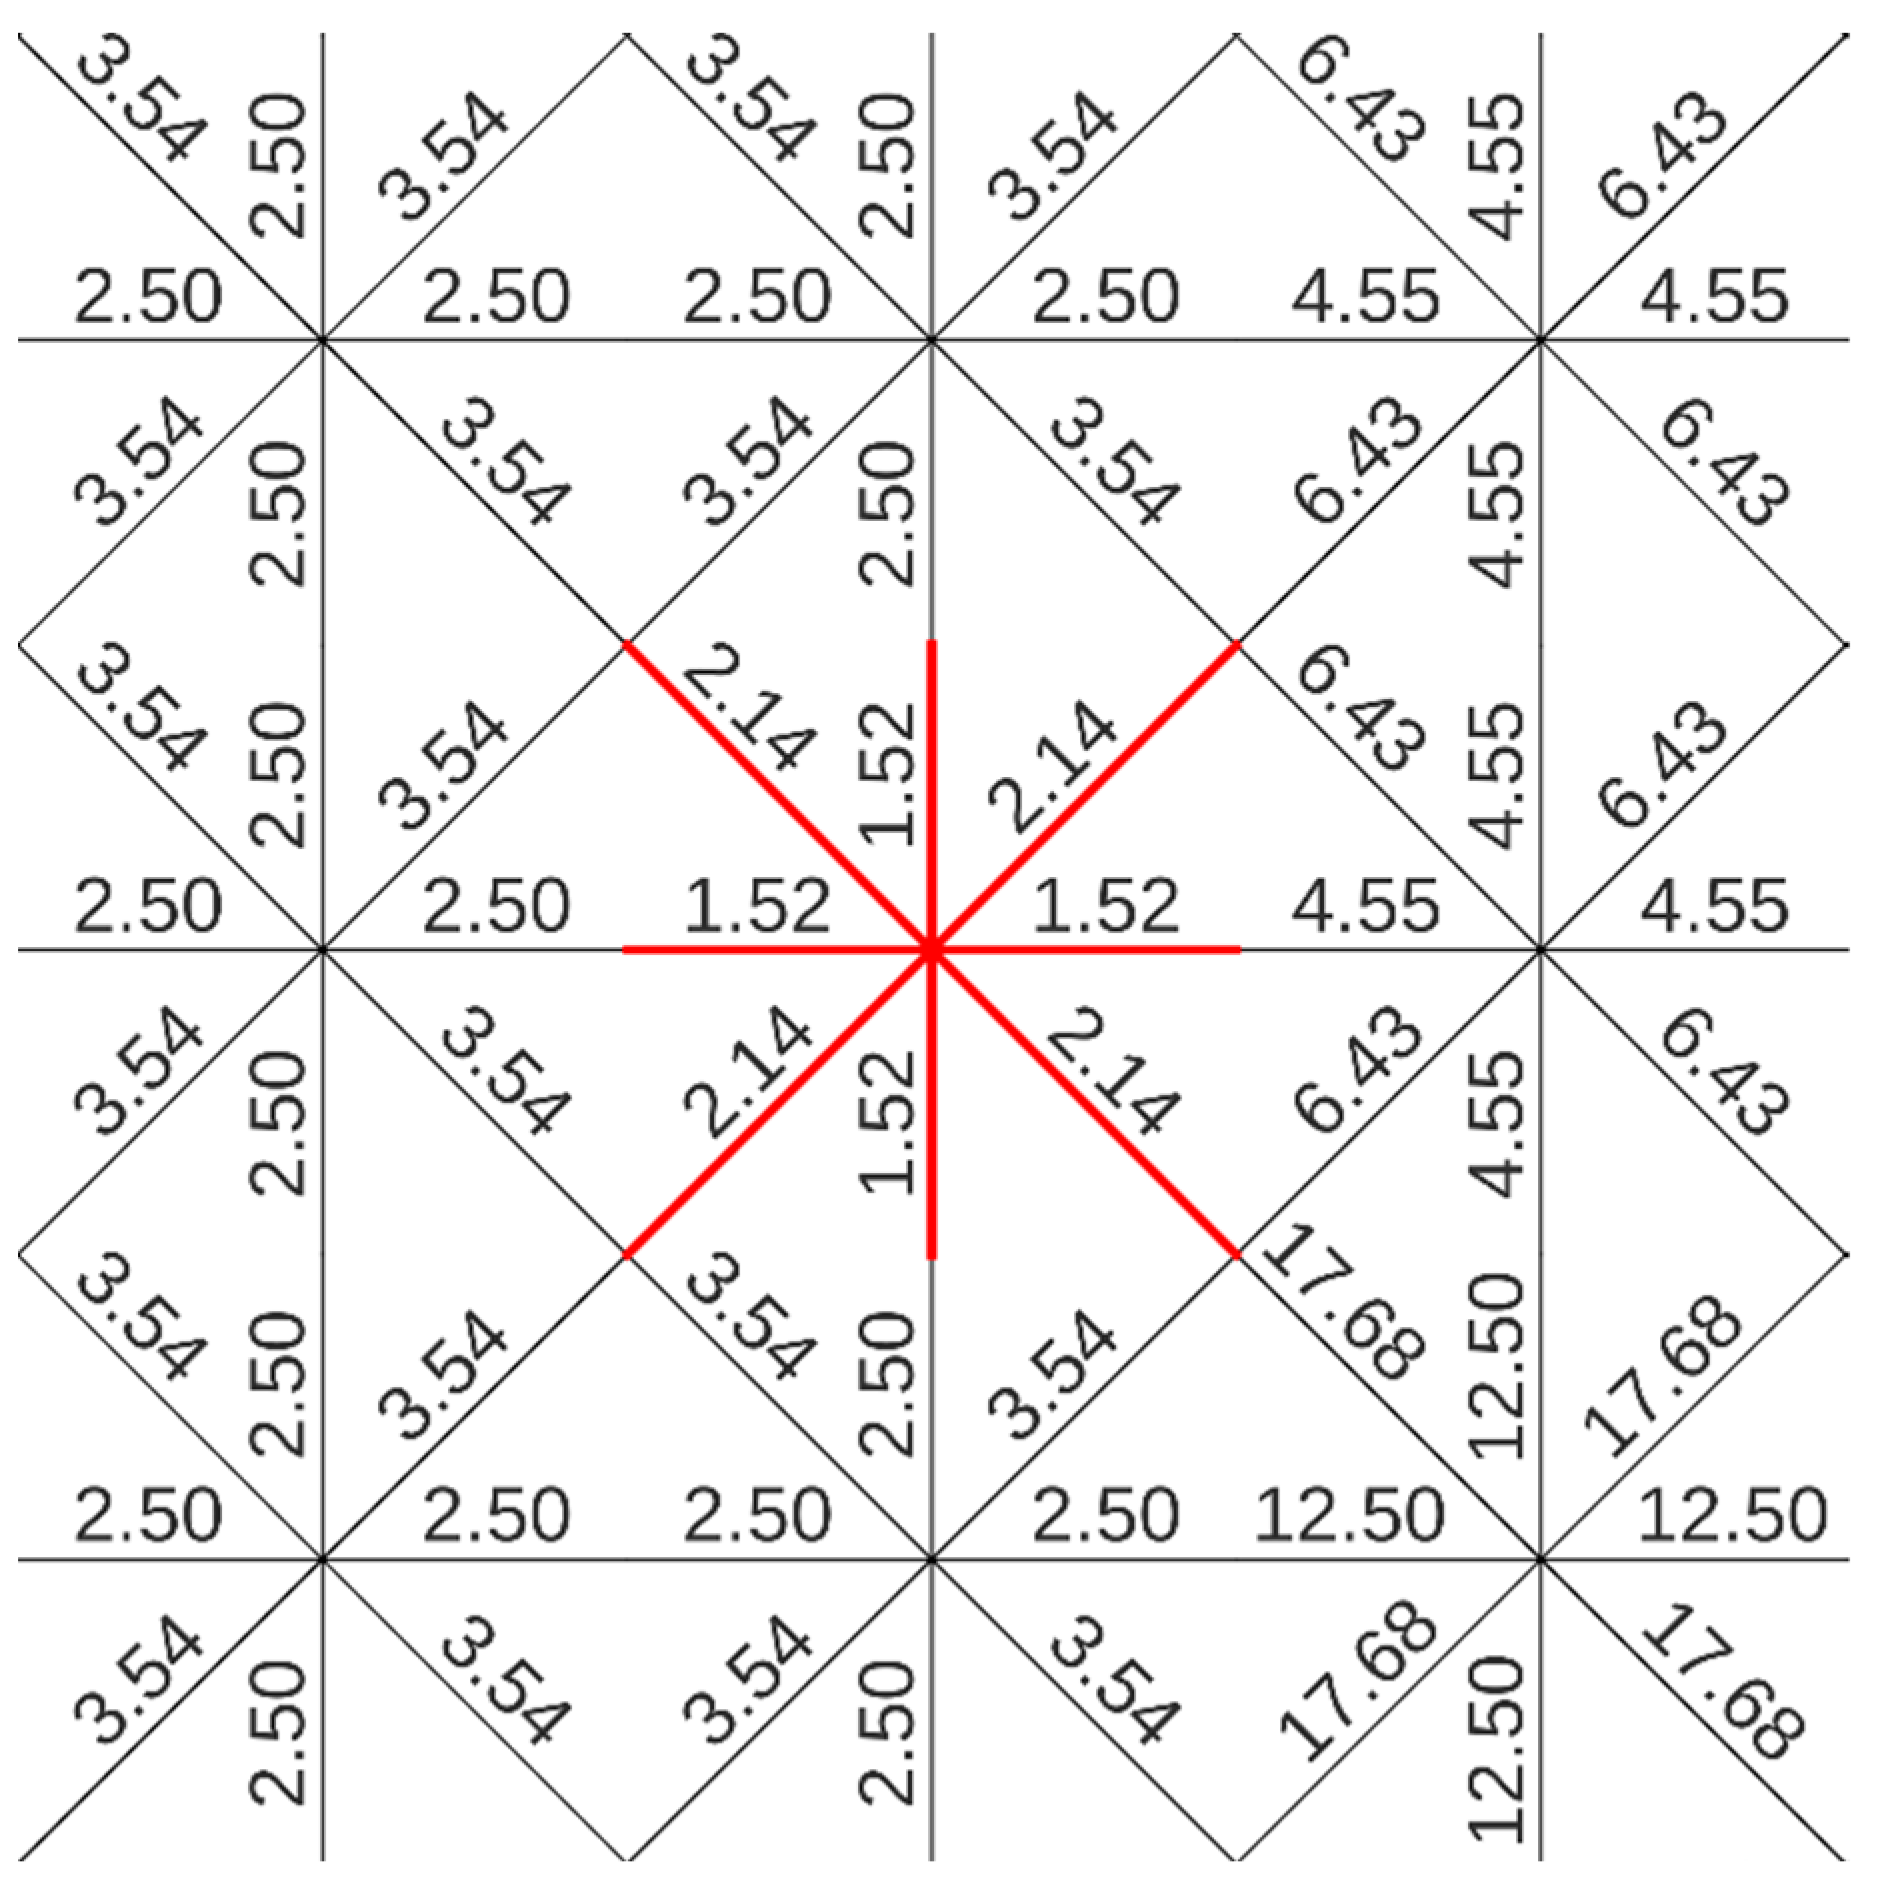
Table 1. If an area with water was identified at a specific point (minimum density of 25 points or more), the region was considered challenging to traverse, and the lowest movement speed of 0.0045 m/s was assigned. Each point with information about the movement speed within it (corresponding to a raster pixel) was transformed into a network of eight single lines connecting all neighboring points (queen contiguity) using an SQL query. This approach enables movement in any direction within the network. The transit time was computed for each individual line, considering the potential speed of movement within the pixel where the network is created. The algorithm for network creation is presented in
Figure 2, while a segment of the completed network, displaying movement speed data, is presented in
Figure 3. While path-finding algorithms on vector and raster networks share fundamental principles, vector networks offer distinct advantages for real-time applications. Their structure, composed of lines, allows for more precise representation of geographic features and enables dynamic updates. This flexibility makes vector networks ideal for optimizing routes based on changing conditions such as fire-dependent restrictions. By contrast, raster data, which represent geographic space as a grid of cells, can be less efficient for complex spatial analyses and real-time updates.
The small test network covered a rectangular area of 3.74 km
2 and comprised 29,969,808 single-line sections with assigned crossing times. For lines where the movement speed is 0 (indicating no feasible crossing, e.g., due to a steep slope exceeding 45 degrees), an arbitrary crossing time value of 1,000,000 s was introduced. It is also possible to exclude such sections from the network by deletion. When establishing the network in the SpatiaLite database software, it was assumed that Dijkstra’s algorithm would be employed to find the optimal paths, allowing the direction of passage through the network to be freely determined. The SQL code for creating a regular network from point data is presented in the
Supplementary Materials.
3.4. Heuristic Spatial Network Aggregation—Irregular Network Resolution
Two methods of vector network optimization can be used to improve the speed of the route calculation algorithm:
In the case of data resampling, the network construction method does not differ from the one presented earlier. The only difference is the raster resolution, which decreases as a result of processing.
The use of heuristics in route finding is applied in various cases. Lai et al. [
53] presented a method of using a heuristic algorithm to find the optimal path in a multigraph. Aggregation using a heuristic algorithm is also a solution in the case of a complex road network and many destinations [
54].
This article introduces a novel, author-developed heuristic algorithm for network creation and optimization, designed to address the challenges of rapid route planning in complex environments. This innovative approach, termed HAN, offers significant benefits in terms of computational efficiency and adaptability, as demonstrated in the Results section. The open-source algorithm, implemented in Python, has a core functionality that lies in its ability to efficiently aggregate data into neighboring squares and subsequently utilize their centroids to construct a representative network. The aggregation process is initiated by data preparation, which involves compiling a set of points representing pixel centroid coordinates and their associated movement costs. In the present case study, this cost is defined by the traversal speed across the terrain, serving as the primary attribute governing the aggregation. This strategic aggregation of data allows the algorithm to create a simplified yet accurate representation of the terrain, enabling rapid calculation of the optimal routes. The benefits of this approach, detailed in the Results section, include significantly reduced processing time and improved accuracy compared to resampling methods.
In the presented case study, the cost is the speed of movement on the area, and this is the attribute according to which the aggregation will take place. When exporting centroids from a raster, the points (
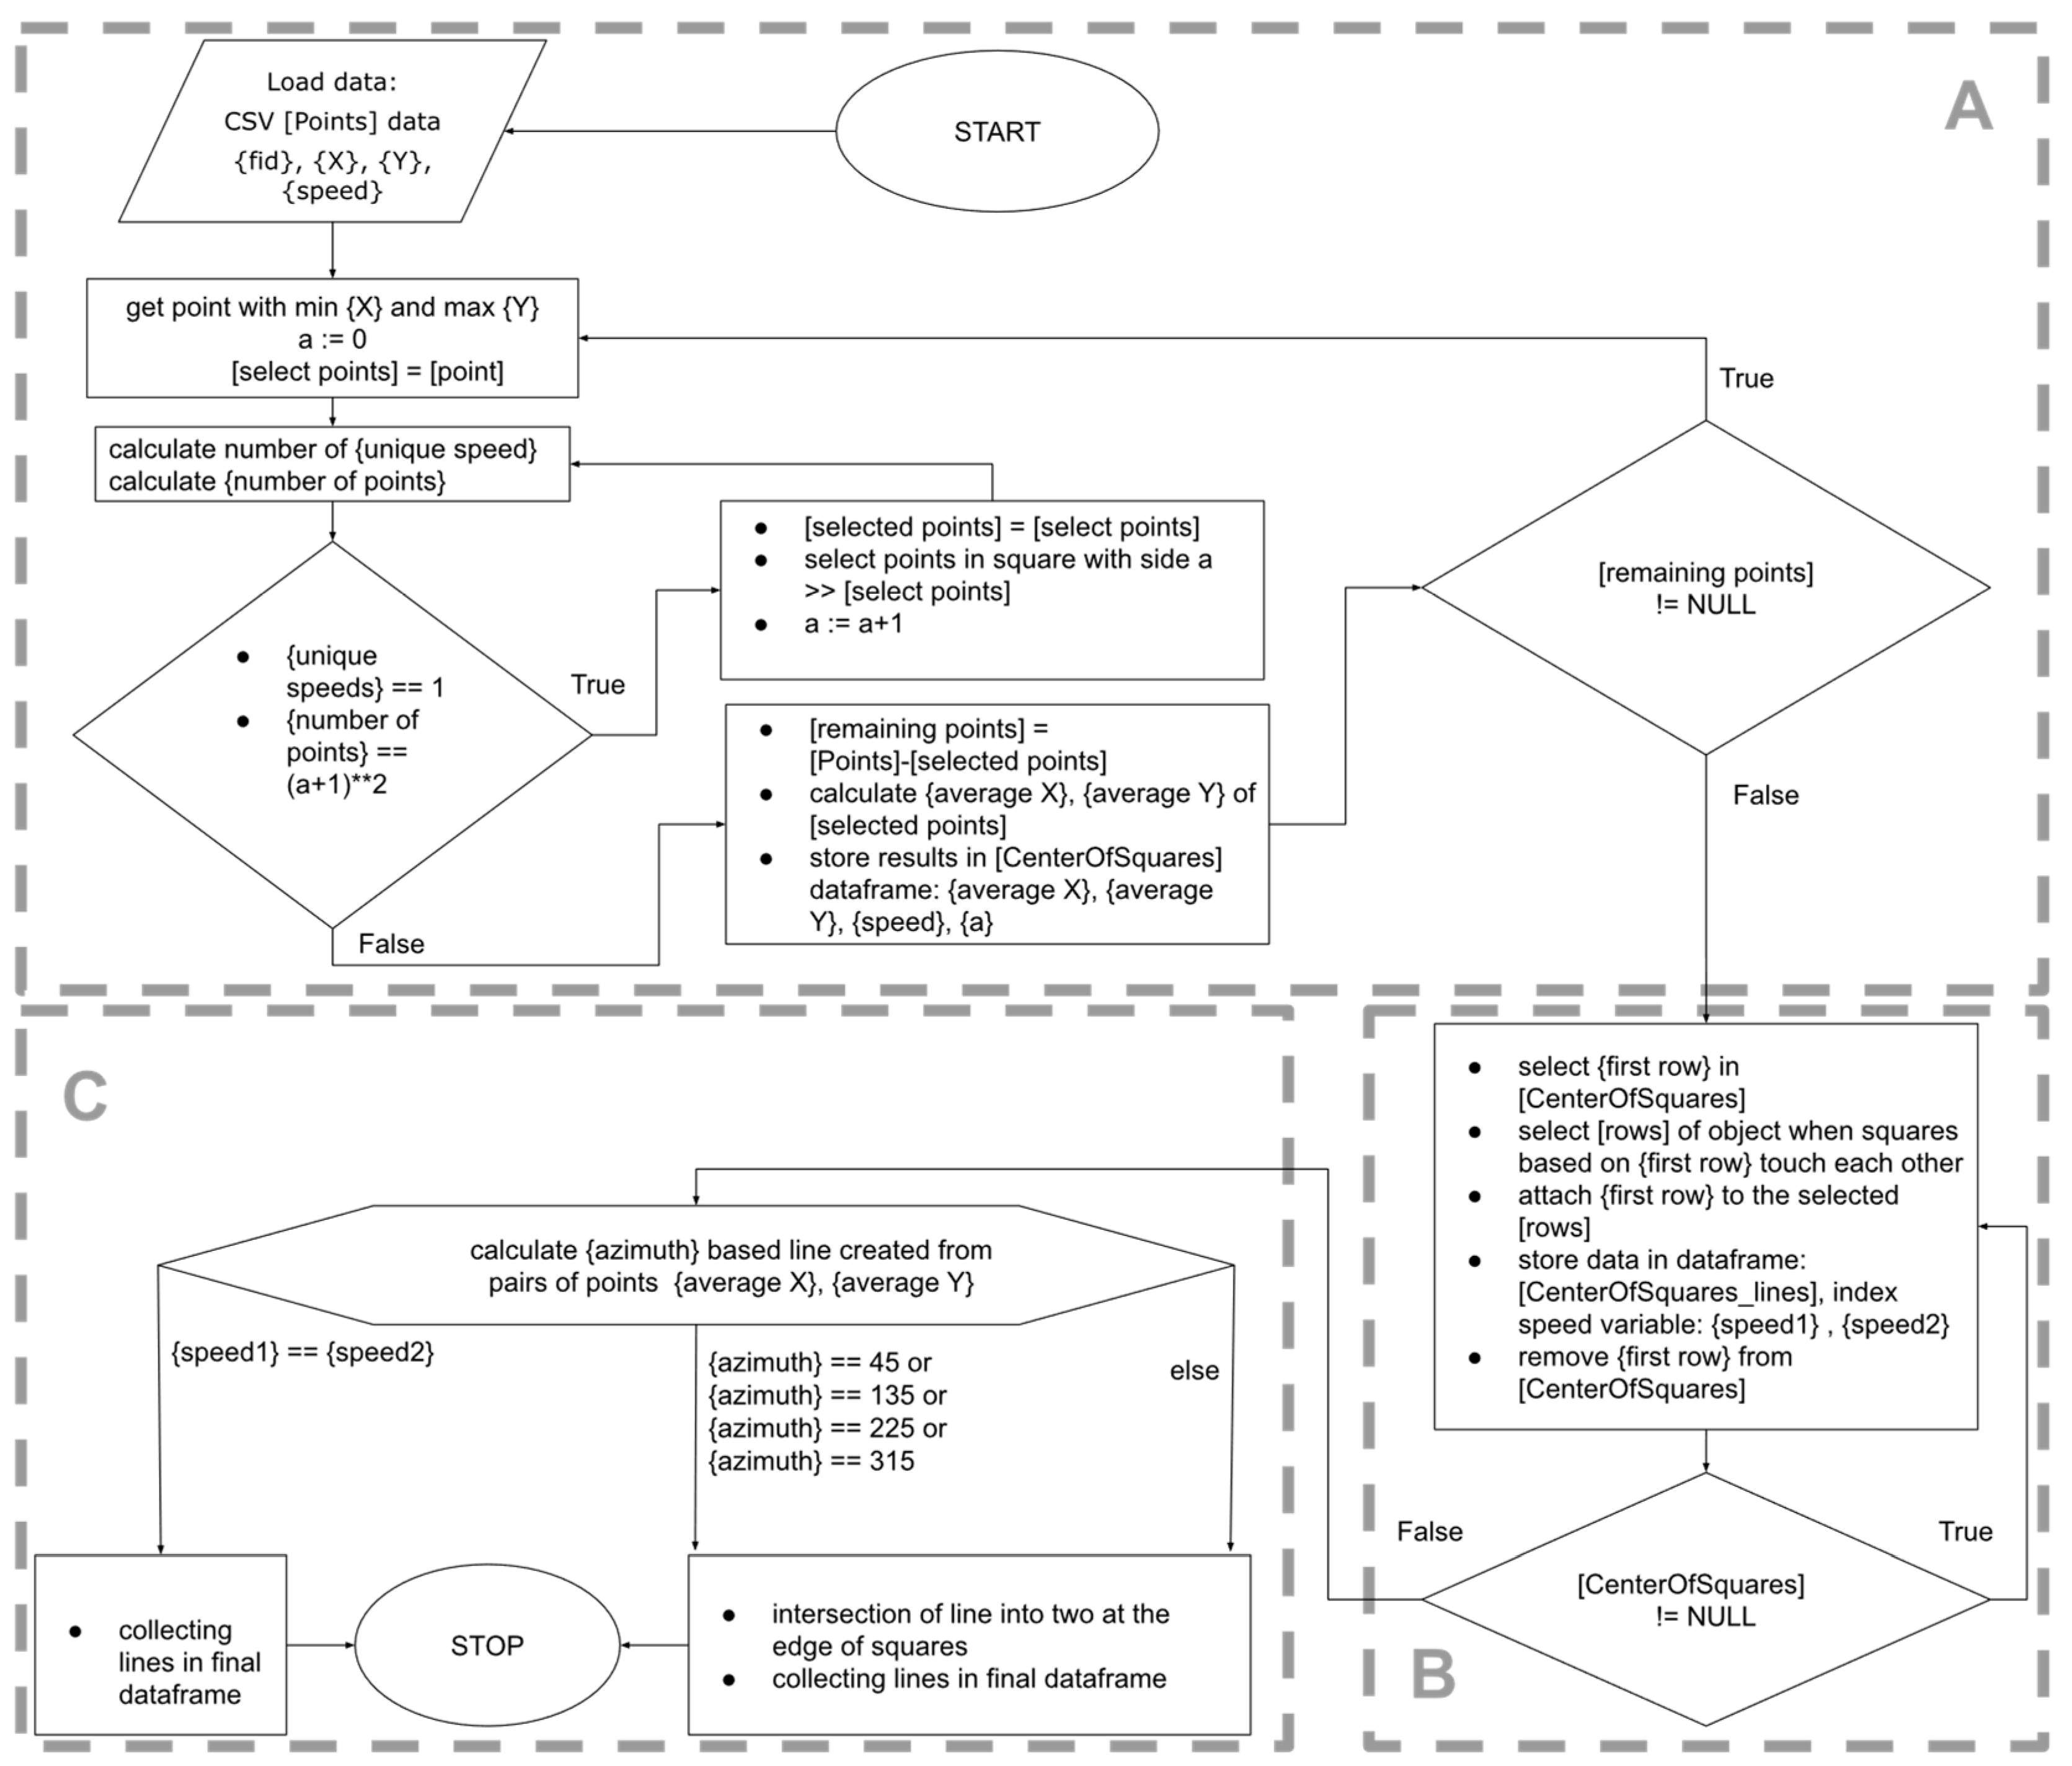
P) are sorted in rows from the top of the raster to the bottom and in a row from left to right. This is important when choosing the first point
P1 starting the aggregation, which should lie in the highest row of pixels (
max Y) and in the left-most column (
min X), thus satisfying Equation (1):
Next, the neighboring points (to the right and below) are checked to see if they have the same aggregation attribute, i.e., speed. The process continues until a point with a different aggregation value (speed) is encountered. The process is also presented in a block diagram in
Figure 4A. The selected square, built from points with the same speed value, is replaced with a single point (centroid) and saved to a new data table. The points that formed the square are removed from the entire data set. The process is repeated until all points have been exhausted.
The next step of the algorithm is to build connections between the centroids of neighboring squares. This process connects pairs of centroids that satisfy the condition that the squares built on their basis touch each other (
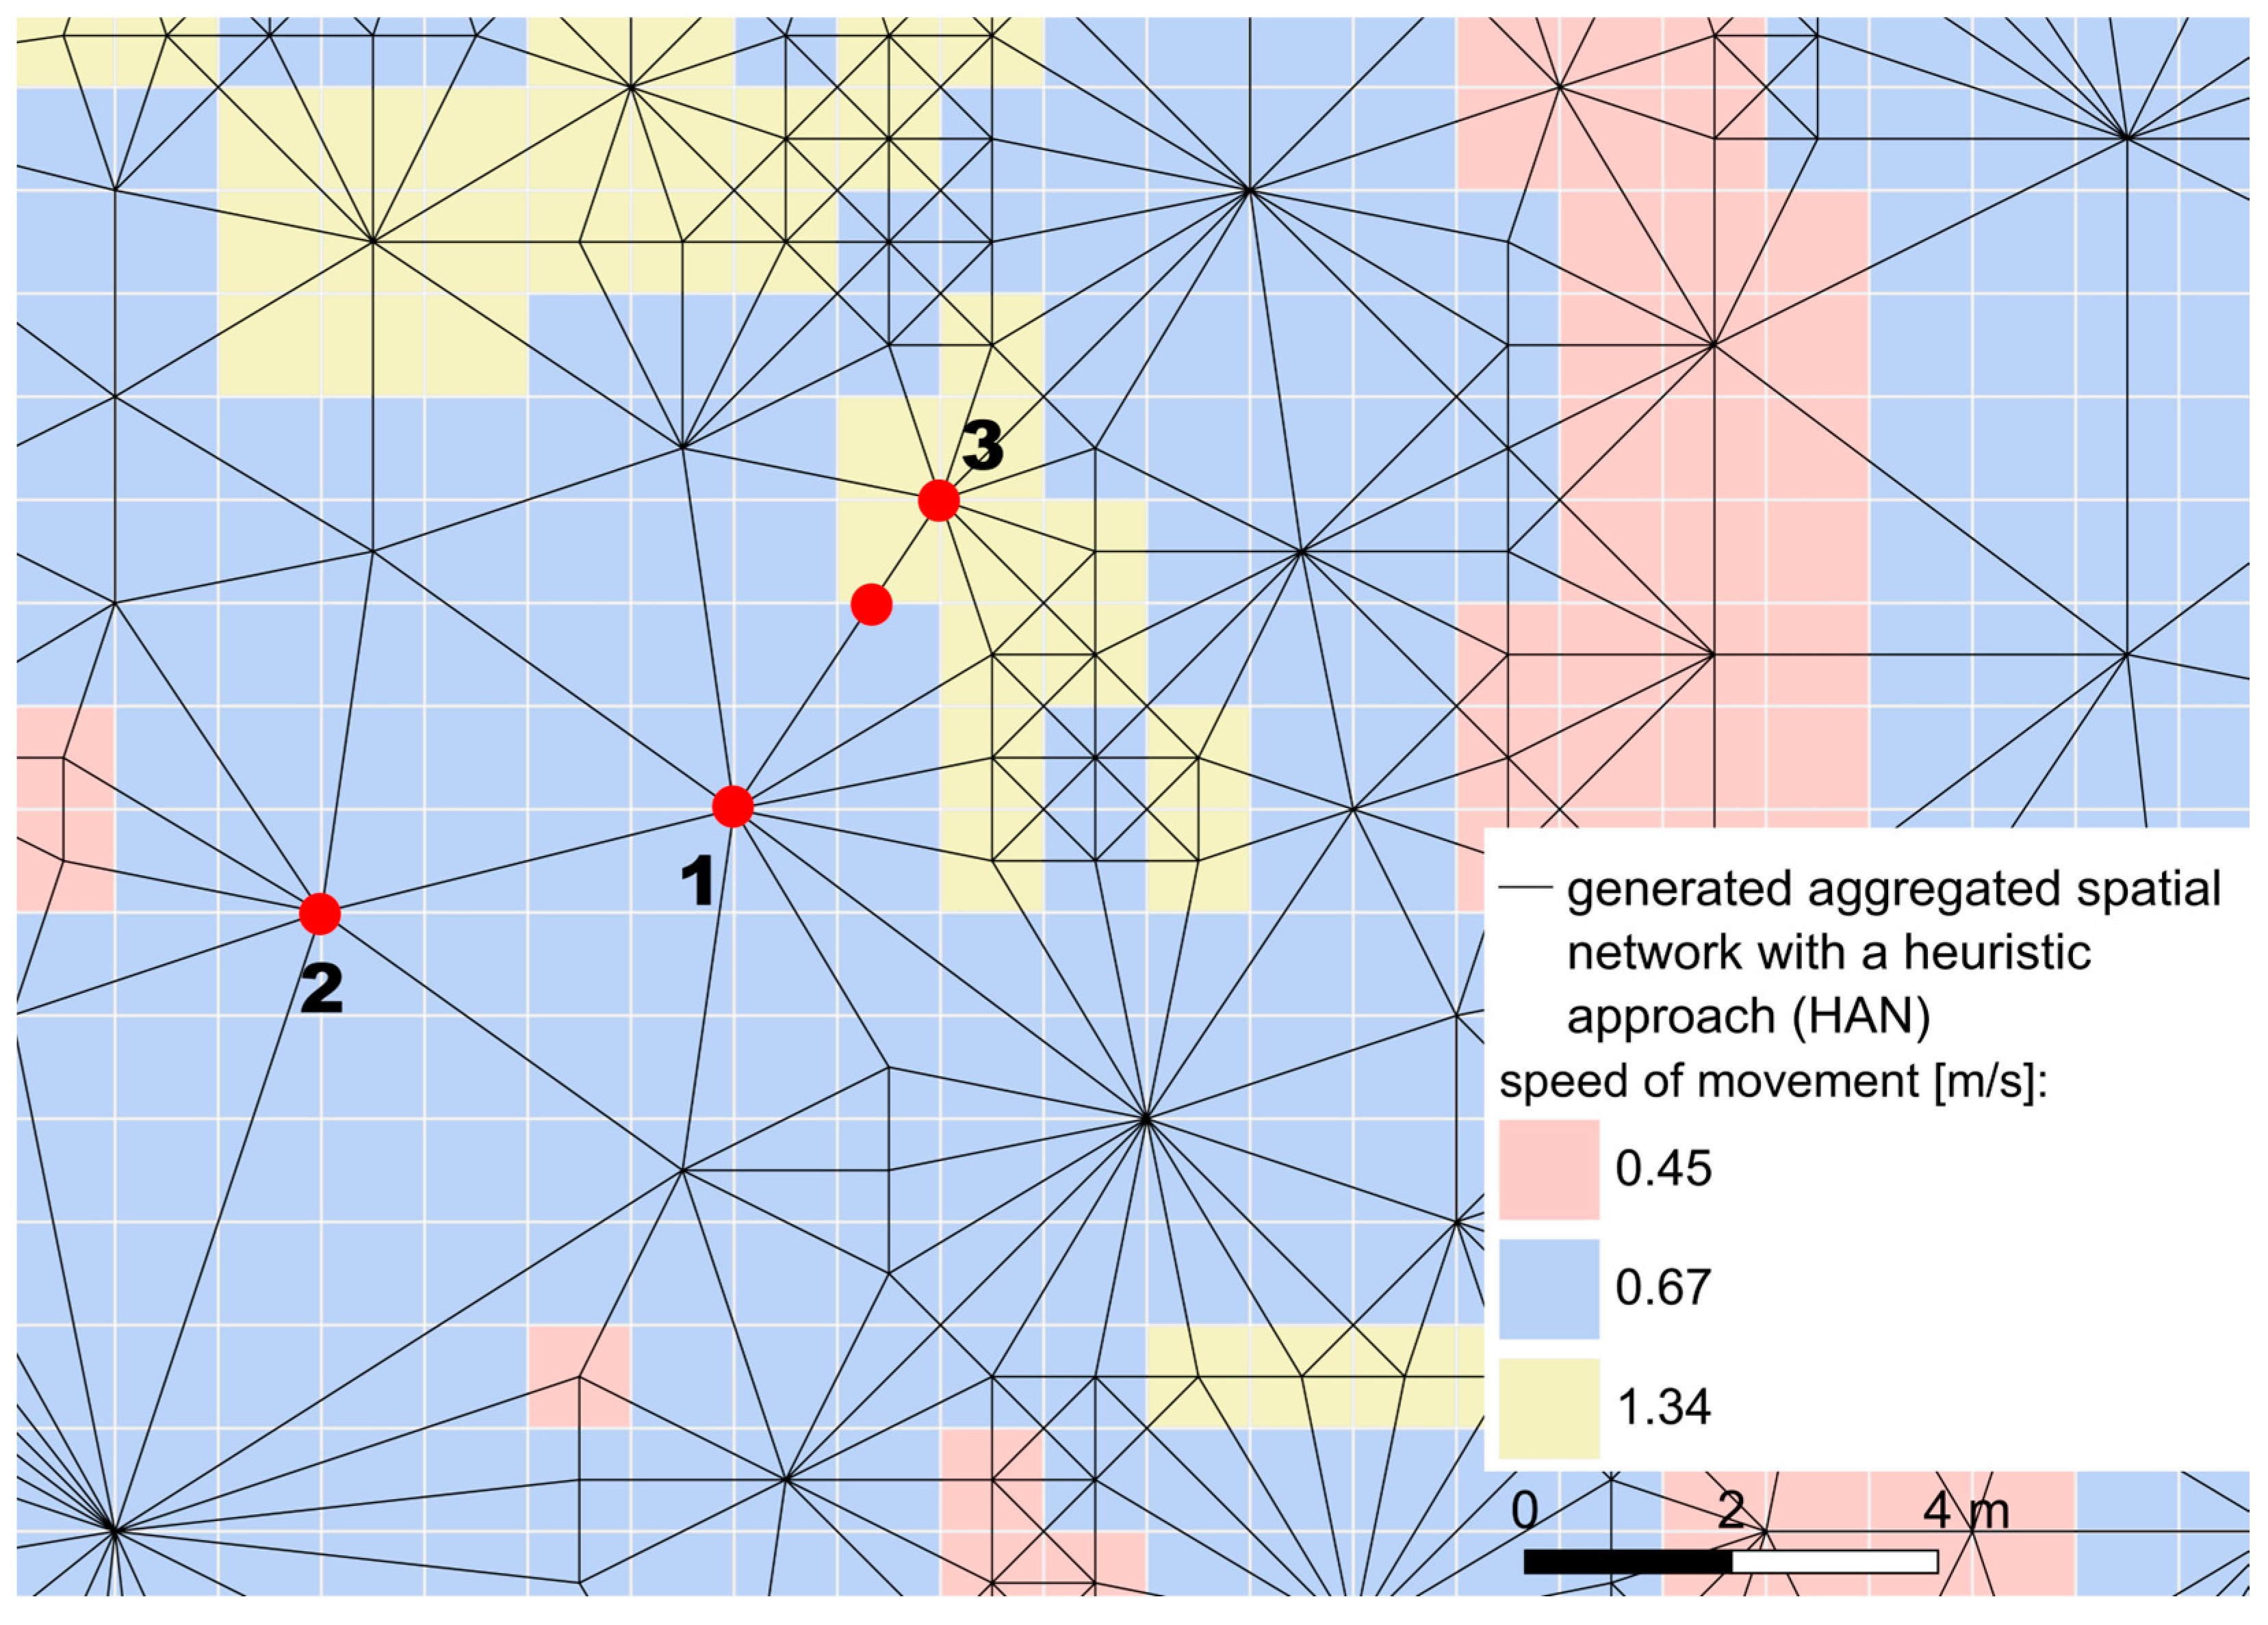
Figure 4B). As a result of this operation, a network could already be created, but the lines connecting the centroids must also be additionally intersected at the side of the squares, only if the speeds of movement within the squares are different or if the squares touch at a corner (intersection to allow a change in the direction of movement in the network). The example is presented in
Figure 5, where red dots represent the sample endpoints of selected lines. Between points 1 and 2, the line is not divided because the area it passes through has the same speed attribute. A division exists between points 1 and 3 due to a change in the speed of movement. The azimuth of the line and the size of the given square were used to determine the location of the line intersection. Lines are not intersected if the network resistance value (speed) is the same (
Figure 4C).
In the final stage of the algorithm, the network line geometry is saved in WKT format, which allows for automatic loading into the database. An example of a processed network fragment is presented in
Figure 5, where squares represent areas with different speeds of movement in the wildland.
The algorithm is implemented in Python 3 using the Pandas library and the DataFrame data structure.
3.5. Multimodal Route Planning System
Enhancing evacuation management in a given area can be achieved by employing a straightforward tool to designate evacuation routes or reach the injured. Such a tool can take the form of a vector network created in the SpatiaLite database.
The proposed network might be too extensive to cover an entire park, reserve, or forest. Therefore, the author suggests dividing the area served by the system into selected sectors, automatically chosen based on the requirements for determining routes to or from specific locations. The principle of sector division may involve limiting the number of linear objects in a single part of the network or natural divisions of areas separated by features such as fire lanes, road lanes, larger watercourses, or other natural barriers. When querying the database for a route, the system can determine which network to utilize.
To enrich a single network in areas without designated routes, the existing road network can be incorporated. This inclusion allows the rescue team to travel more efficiently using mechanical means of transport. The conceptual outline is shown in
Figure 6, illustrating two ways to reach a destination: utilizing the road network for faster transport and walking on foot in areas inaccessible to vehicles. The system, during analysis, can determine which rescue unit is closer to the destination, optimizing the evacuation route for speed.
4. Results and Discussion
The entire analysis was performed on a notebook equipped with a quad-core Intel Core i7-8550U processor with 16 GB of RAM running Windows 11 64-bit. The analysis utilized SpatiaLite database version 5.0.1 and ArcGIS ArcMap version 10.8.
4.1. Comparison of Results from the SpatiaLite Database with Analyses Currently Used on Raster Data
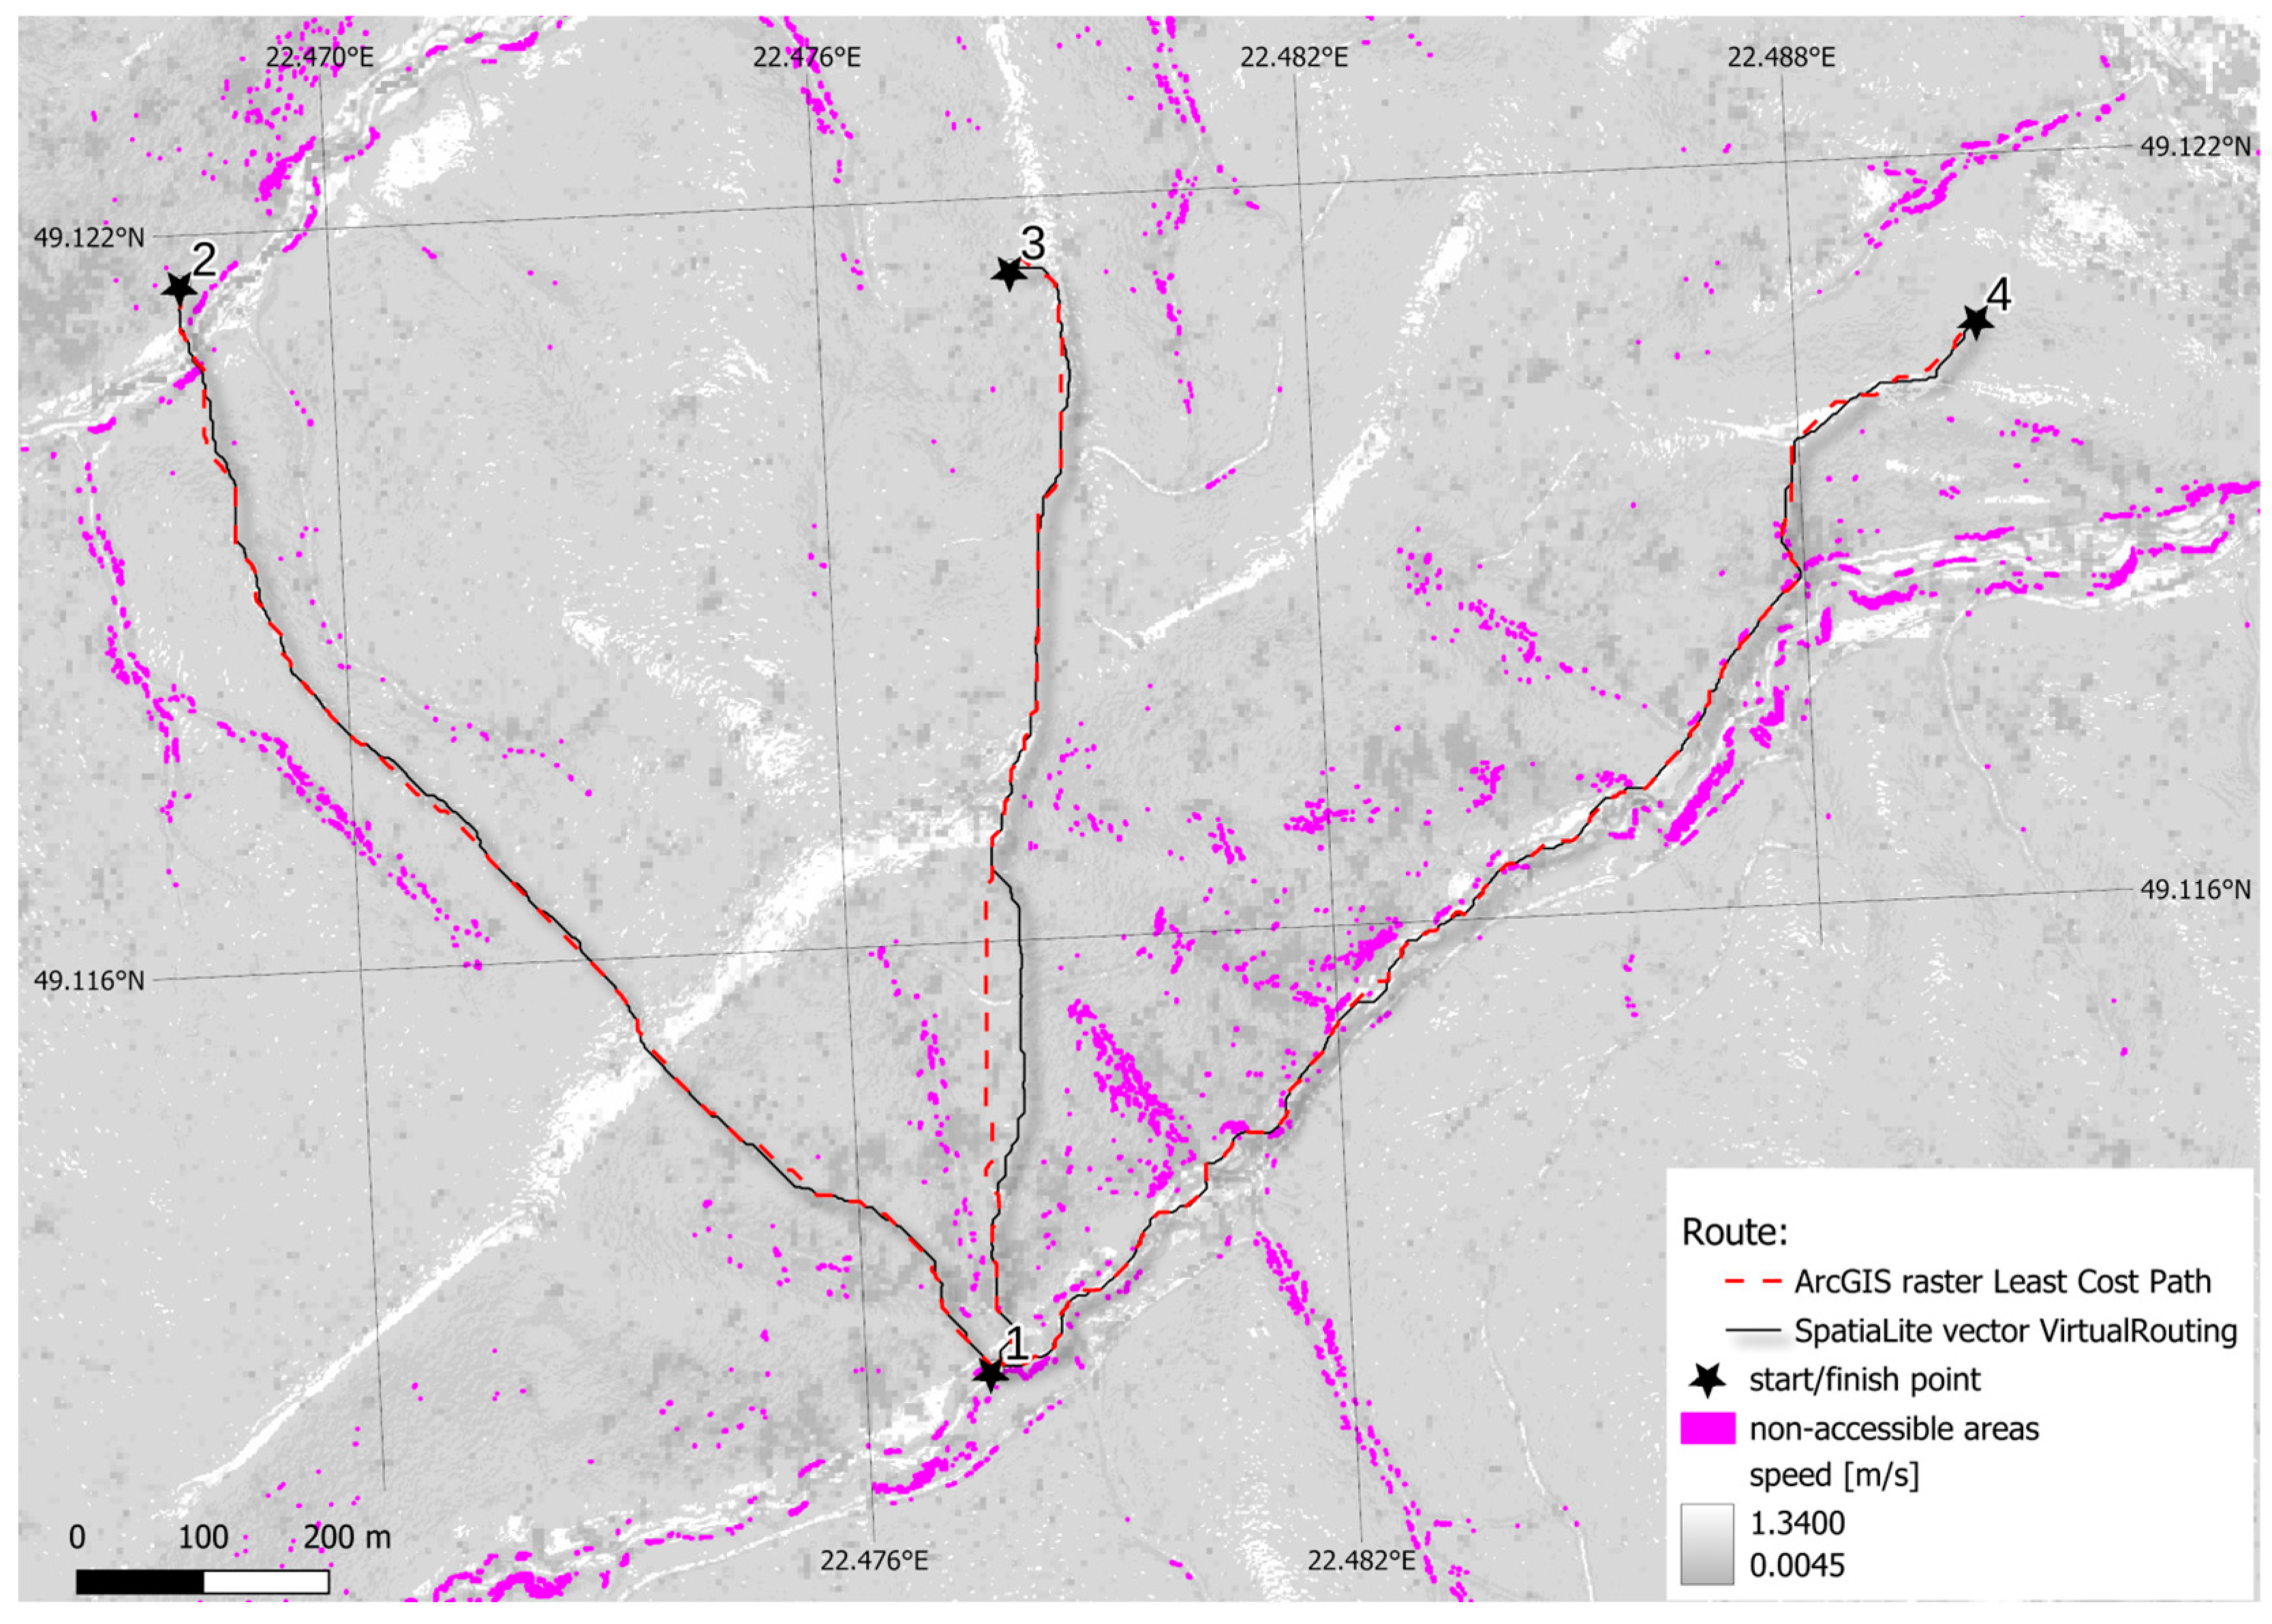
The initial analysis aimed to determine the evacuation route from a specific location to three selected points using the SpatiaLite database, comparing it with the traditional least-cost path raster analysis performed in the ArcGIS ArcMap application. The resolution of both the path cost raster and the network vector data was 1 m. Results are presented in
Figure 7 and
Table 2. The designated routes from point number 1 to points 2 and 4 show minimal differences, whereas a more noticeable difference in the route is observed between points 1 and 3 (the route shifts by approximately 30 m). With a higher computational load due to numerous individual connections, the database exhibited slower performance than the raster-based analyses. The designated route can be considered equally fast, with differences of a few seconds, possibly resulting from the adoption of a different nearest network nodal point.
The durations for solving the fastest route differ by a few seconds (
Table 2). It is noteworthy that in the case of ArcGIS, the use of simpler networks (e.g., a smaller or less resolved raster with the cost of moving around the network) does not significantly improve processing time due to the multi-stage computational process. An additional advantage of SpatiaLite is its minimal use of memory resources. SpatiaLite’s minimal memory footprint translates into improved performance, increased scalability, broader compatibility, and enhanced stability. In the ArcGIS software, increasing the analysis area often leads to an out-of-memory error [
55], limiting the possibility of using raster analyses in multimodal mode when the fire or rescue brigade headquarters are located dozens of kilometers away from the inaccessible area. Therefore, the raster used for such an analysis would be unsupported by known algorithms. The selected database system also offers the capability to run in parallel on multiple computer processors [
56].
4.2. Results of the Various Optimizations
As mentioned in the preceding chapter, reducing the raster resolution does not significantly impact the acceleration of analyses in traditional systems. However, decreasing the number of connections in the database should considerably shorten the SQL query processing time. To enhance analysis efficiency, the author suggests utilizing data at a lower resolution achieved through resampling. The application of the nearest resampling method [
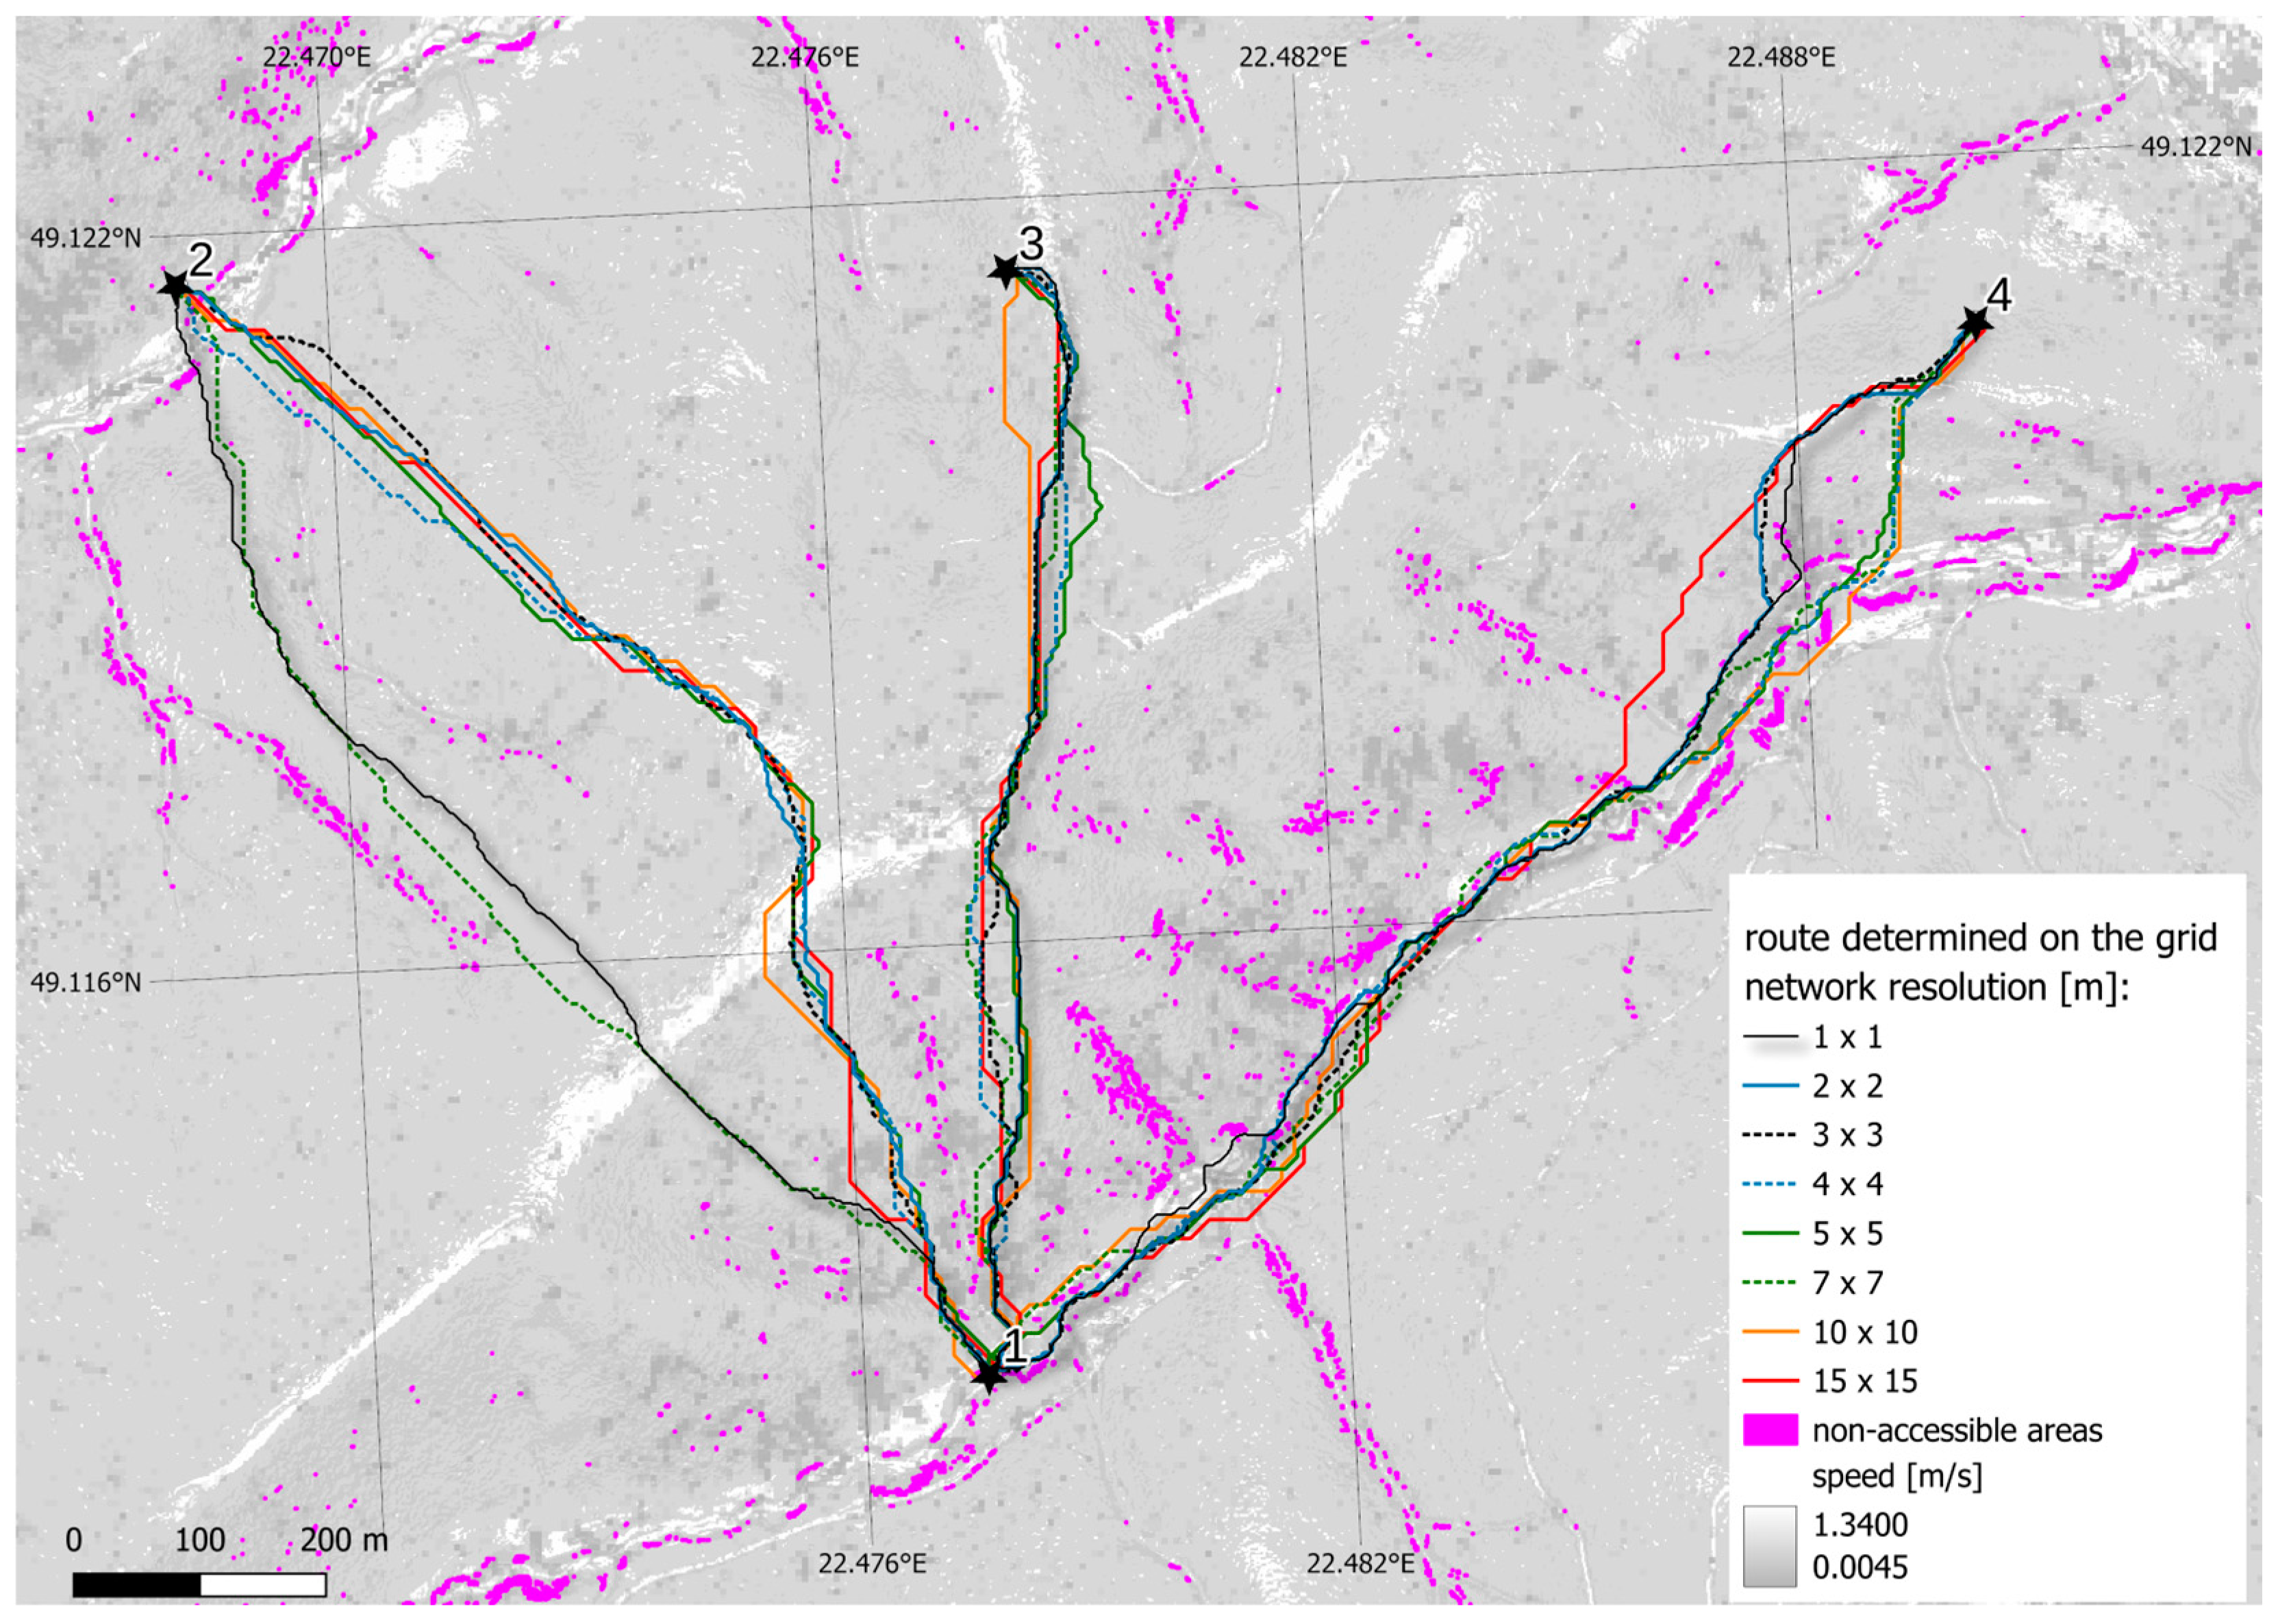
57] allows for retaining crucial small details, such as inaccessible areas, through which movement should be avoided in the wildland area. The experiment involved data with a processed resolution of 2, 3, 4, 5, 7, 10, and 15 m for the resulting pixel from which the network was created in SpatiaLite and heuristic aggregated network (HAN). The results of determining the fastest route are presented in
Figure 8 and
Table 3.
The results vary depending on the resolution of the vector network used for analysis. The most noticeable difference is observed between points 1 and 2, where the designated routes for resolutions of 1 and 7 m differ from the remaining resolutions (a different variant designated). This discrepancy may be attributed to a different location of the nearest node determining the beginning and end of the route. In analyzing the passage of the routes, none of them traverses inaccessible areas, suggesting that the data resampling method was appropriately chosen.
The time to determine the fastest path decreases rapidly as the network resolution decreases. Already, with a resolution of 3 m (3 × 3 m pixels) and HAN, it is possible to determine the route in less than 1 s, suggesting that the model can be used for real-time analyses of changing terrain conditions, such as deviating from the designated route and recalculating it. The most significant gain in analysis time occurs at the beginning of reducing the analysis resolution, owing to the geometric decrease in the number of individual lines in the network relative to the resolution (
Figure 9).
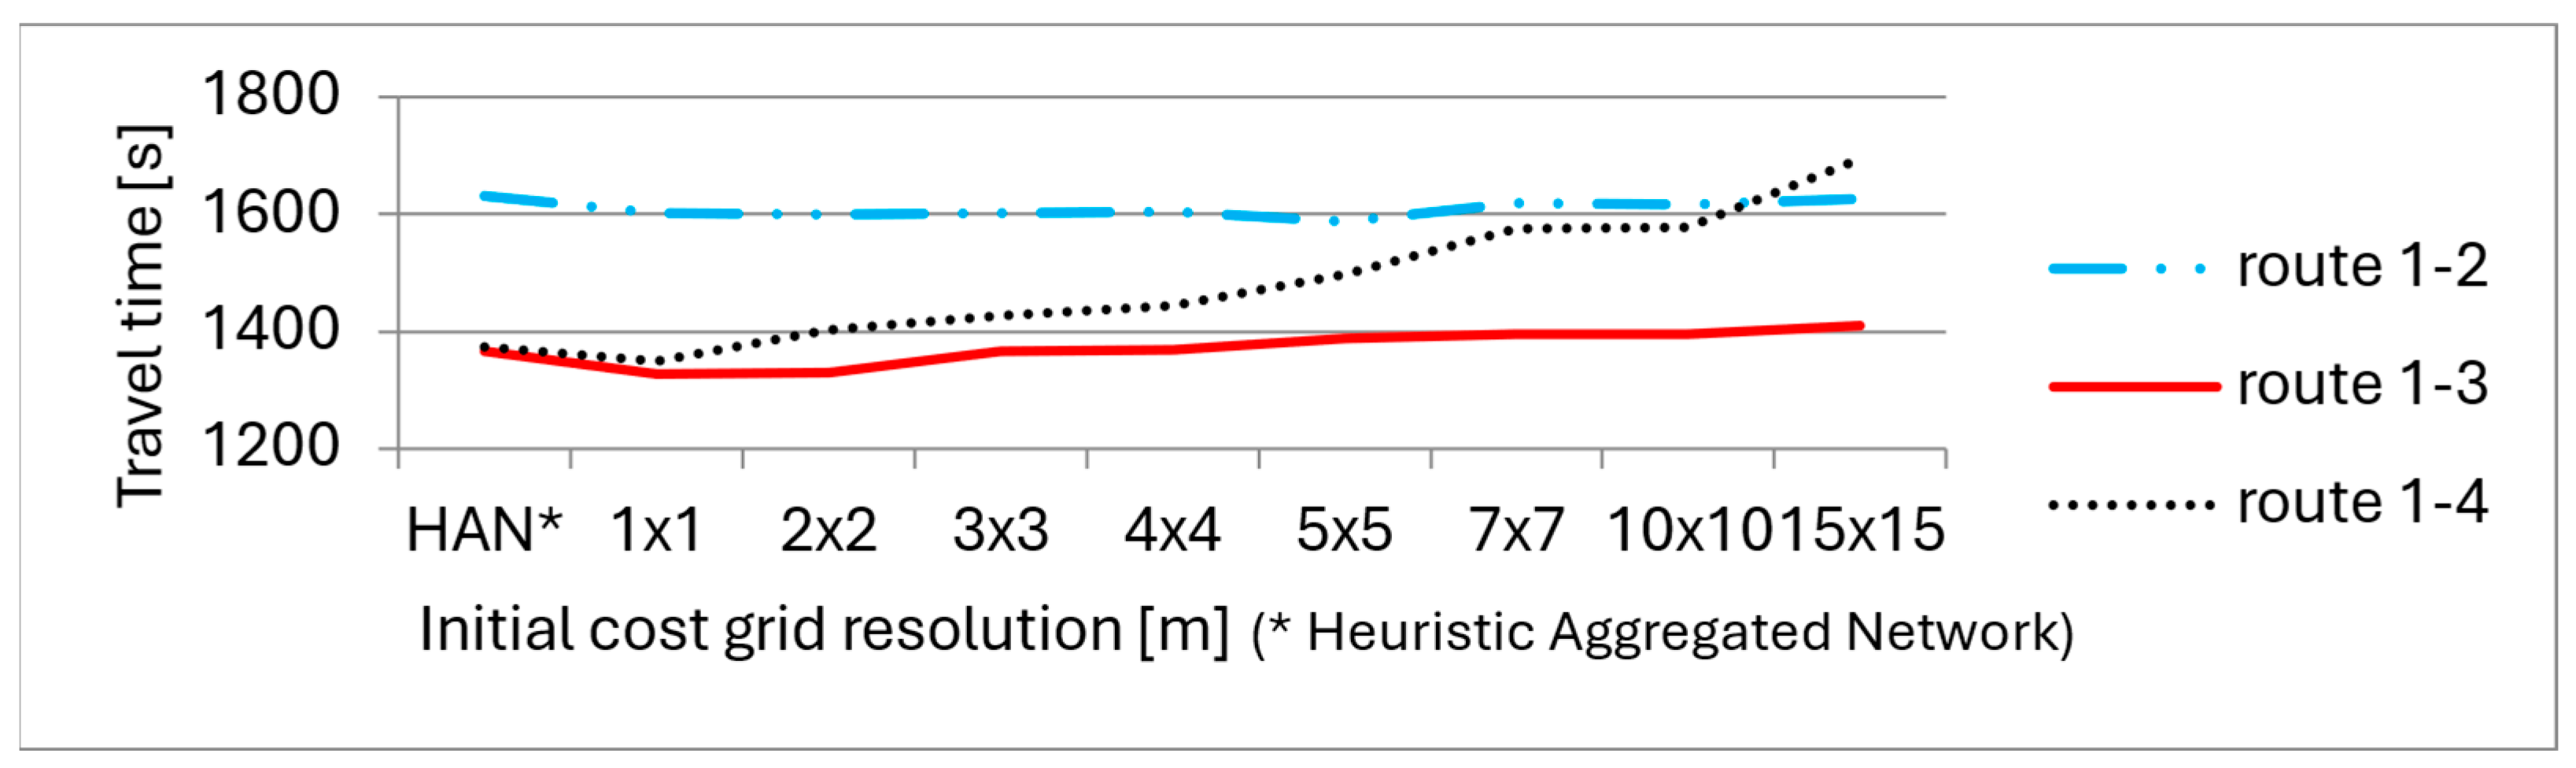
It should be noted that introducing optimization by reducing the resolution of the analysis network also leads to a deterioration of results. The output resolution of the cost raster of 15 × 15 m causes a decrease in the accuracy of route calculation, especially in areas with different values, such as inaccessible areas. In the example under consideration, this is particularly evident in the route from points 1 to 4, where reducing the resolution results in determining a route with a much higher cost (
Figure 10,
Table 3). The algorithm must avoid inaccessible areas, which become larger and more challenging to avoid due to the selected resampling method.
It should be noted that the optimal resolution would align with that offered by popular global navigation satellite systems locators. In popular devices, it currently ranges from 4 to 9 m, depending on the conditions in the wooded area [
58]. Considering the highest achievable positioning accuracy and the quality and efficiency of the analysis, the optimal network resolution could be 4 m. With such a resolution of the bin raster, it would be necessary to build a network of connections in the database. However, on powerful computers, when areas are divided into small parts, the resolution may be higher.
In areas with high diversity (such as the area between points 1 and 4 (
Figure 8)), the network optimization proposed by the author allows for a balance between analysis time and result quality. The calculated route has a road cost closest to the most accurate data (
Table 3) and differs by only 23 s. This allows us to conclude that this method of simplifying the vector network is the most optimal in areas with a high diversity of the cost of movement on the network.
The high-resolution analysis proposed by the author enables precise route determination. In the work by [
48], the authors determine an evacuation route using a very low raster resolution of 159 × 98, which is a relatively low resolution. In areas with terrain obstacles that prevent passage, the determined route may be incorrect or may cause a significant extension of the actual travel time.
A similar scenario is observed in the work of [
49], where the authors employed a low resolution for input data (the most accurate data pixel being 16 m). Within an analysis area of approximately 4 km
2 (inferred from the figures provided), they achieved a route determination time exceeding 9 s. While their work benefits from incorporating fire spread risk, the author’s approach can achieve the same outcome by excluding high fire risk areas from the analysis, as presented in
Section 4.4.
Other similar works in this area [
46,
47,
59] present models that would be difficult to apply in real-world commercial solutions due to limitations in performance and speed of analysis. The application of the author’s proposed algorithm for heuristic network optimization (HAN), along with the transfer of data proposed by authors of works in this field, would significantly accelerate the speed of analysis.
4.3. Multimodal Analysis
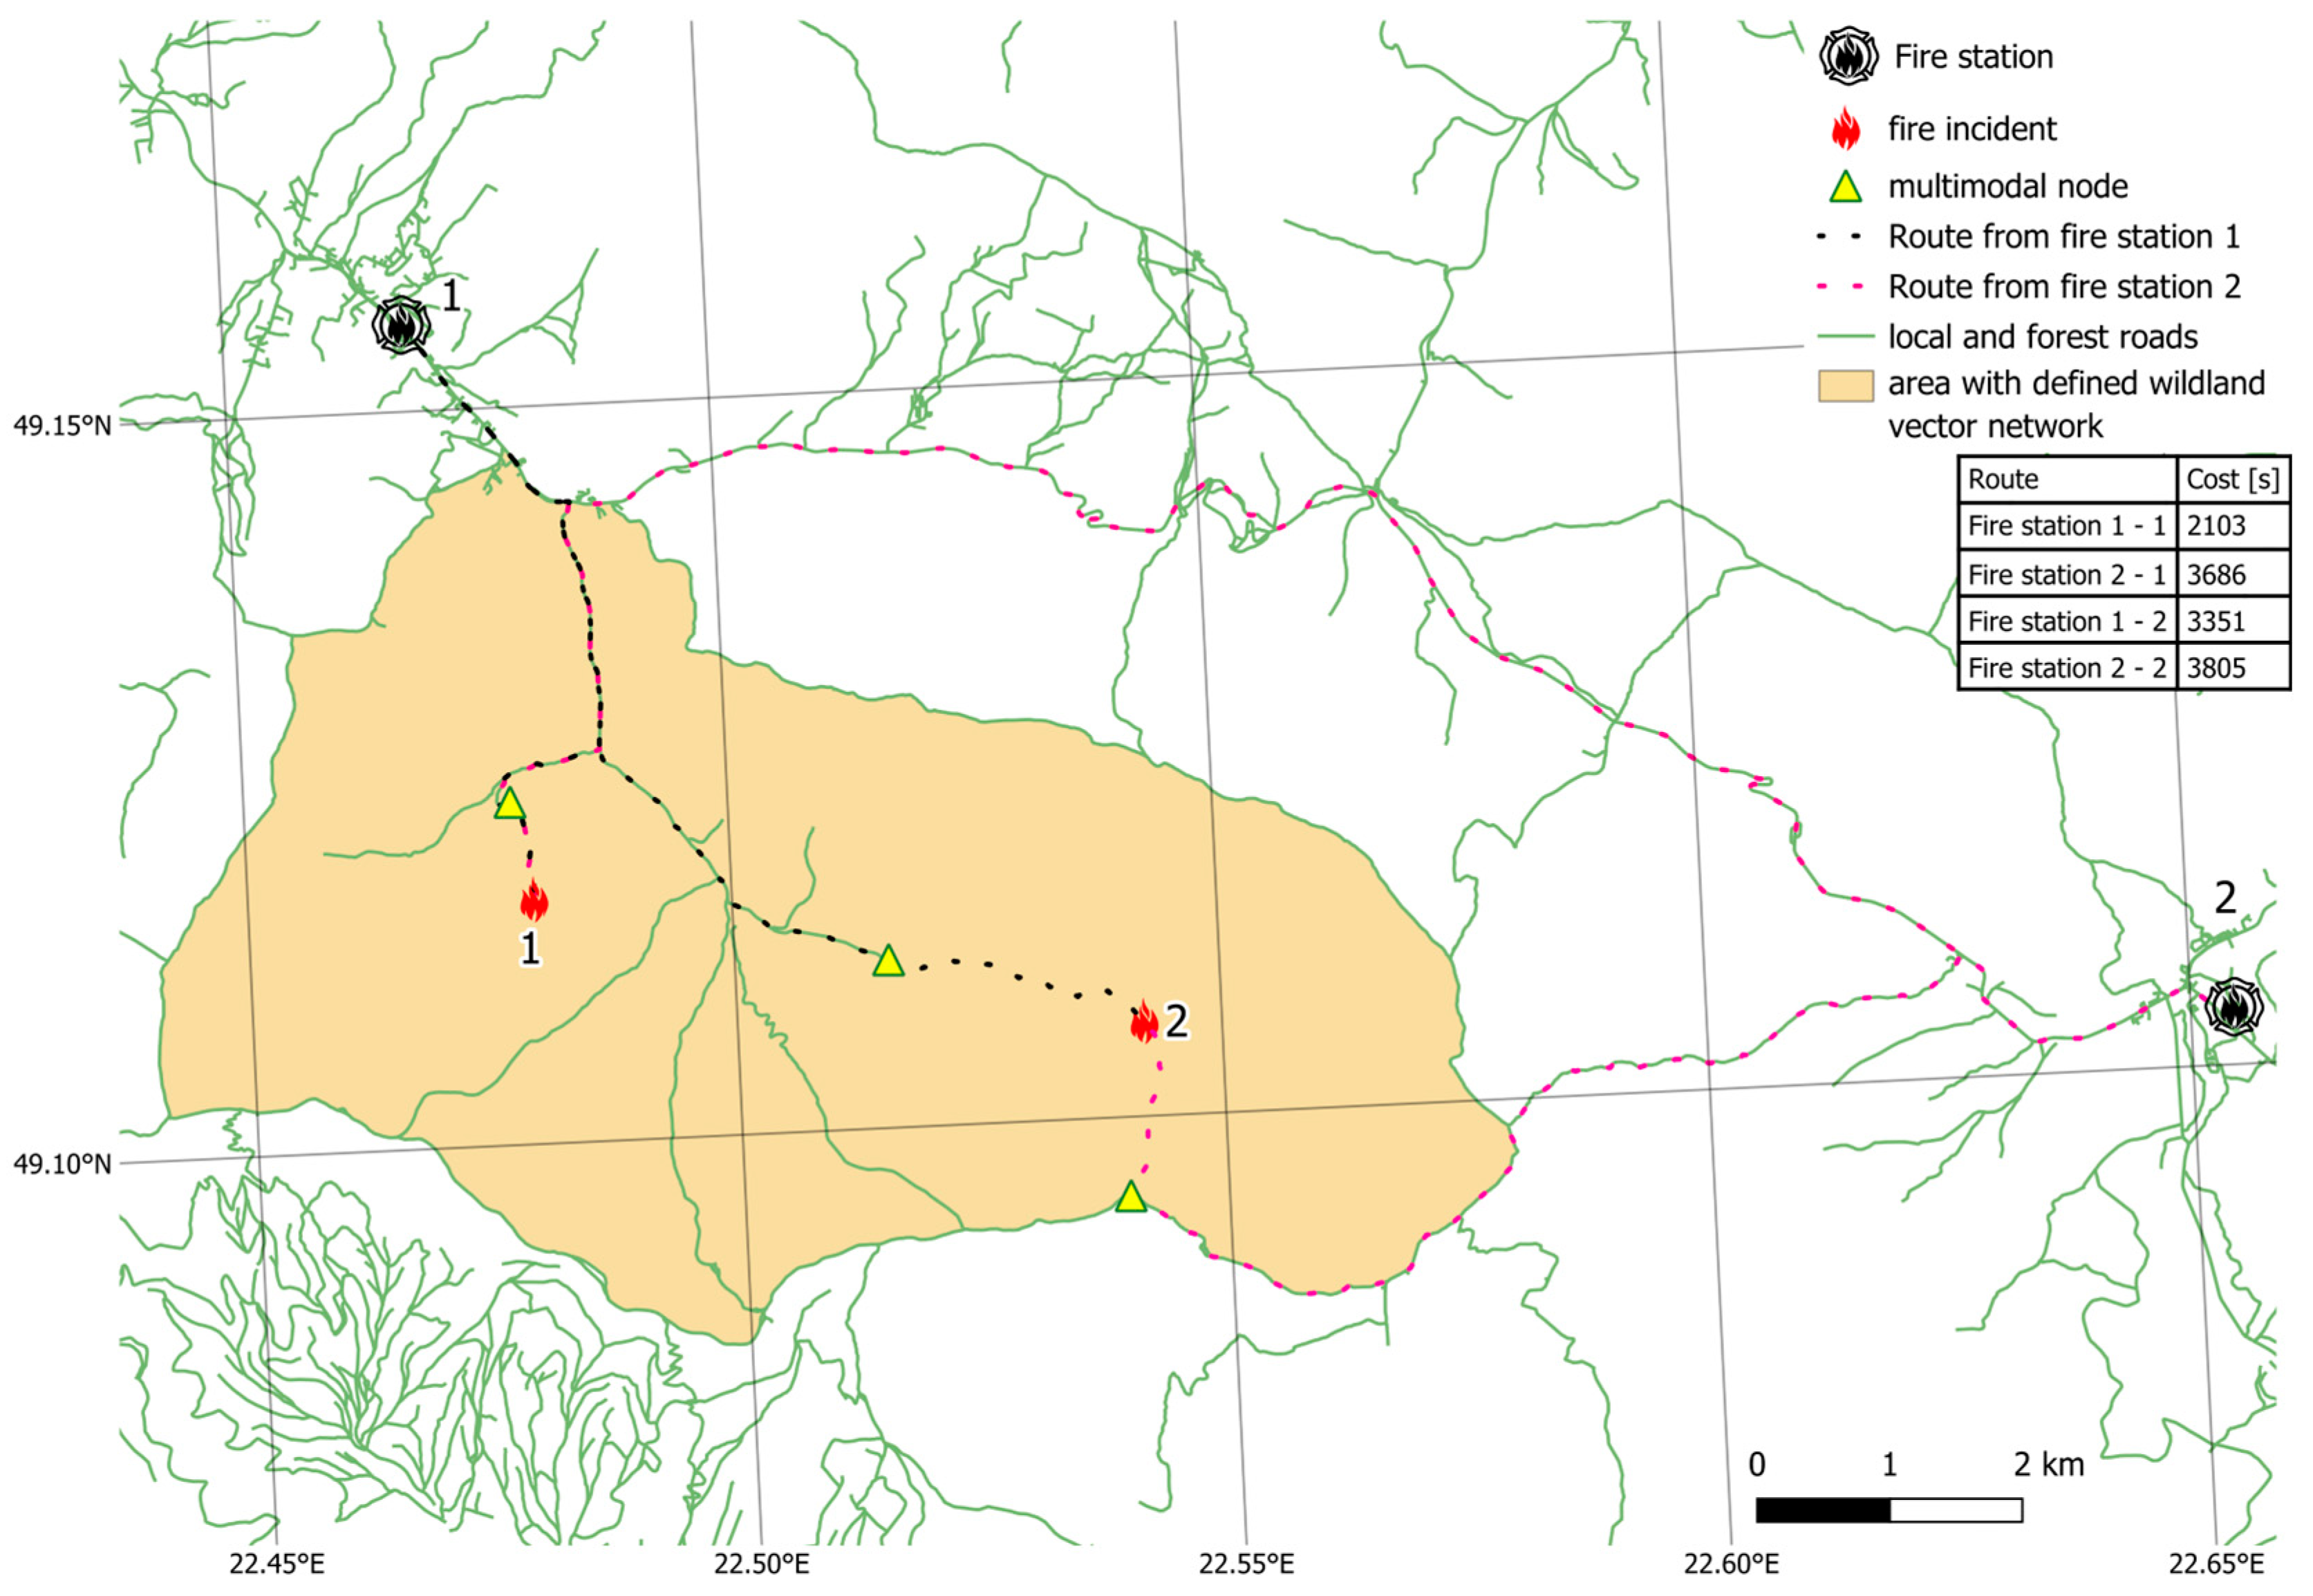
The author conducted a test to assess the performance of the database enriched with a road network to conduct multimodal analysis, involving both road travel by high-speed transport and on-foot movement in the field. The database allows for the rapid determination of a multimodal route with a point of transition between transport methods (
Figure 11). Adding data to the database in the form of a road network is straightforward and does not increase the analysis time. It only requires determining the cost for this network, represented by travel time, calculated based on the significantly higher speed of movement along the road. The additional road network is not limited by a specific length value, enabling the designation of a route to a destination or starting point located even tens of kilometers away from the area in question, with access to the road network. Such an analysis could not be performed solely on raster data using the least-cost path method.
The primary method for determining the meeting point between pedestrians and motorized transport involves a holistic approach to the network (roads with speeds for each mode of transport and virtual paths created in wildland areas). Once the route is calculated, the meeting point (transfer point) will be the location where the speed of travel changes along the calculated route. By taking a holistic approach to network modeling, which includes both physical road networks and virtual paths in off-road areas, and by assigning appropriate costs to different segments based on travel time and mode of transport, the system can determine the optimal multimodal route. The transfer point is identified as the location where the traveler switches between modes, as indicated by a change in the assigned cost.
The system built in SpatiaLite, enriched with a road network, can be utilized to manage various events, including determining the fastest route for firefighters to reach the location of a fire, aiding rescue services in reaching people requiring assistance, and establishing the quickest evacuation path from an area threatened by various external factors. It can also support decisions on the optimal location to dispatch rescue teams for the quickest response [
60]. Another application of the proposed solution is in mountain rescue, combining access to injured persons along designated trails using special means of transport and then reaching the location of the injured persons on foot.
A similar approach to the topic, using different methods, was described by Duff and Derek [
50], who employed cellular automata models. However, their model is comparatively inefficient and has the same limitation regarding the scope of analysis (points cannot be too far apart). The processor used in the cited study is three times slower, and a similarly sized area was divided into a 30 m resolution grid. The authors achieved a routing time of 1 min and 40 s, which, for such a low resolution, is a result requiring performance improvement.
The proposed solution could complement more comprehensive evacuation solutions for people from areas at risk of fire [
61], particularly in determining the evacuation route to a specific shelter or assembly point.
4.4. Incorporating Constraints into the Analysis
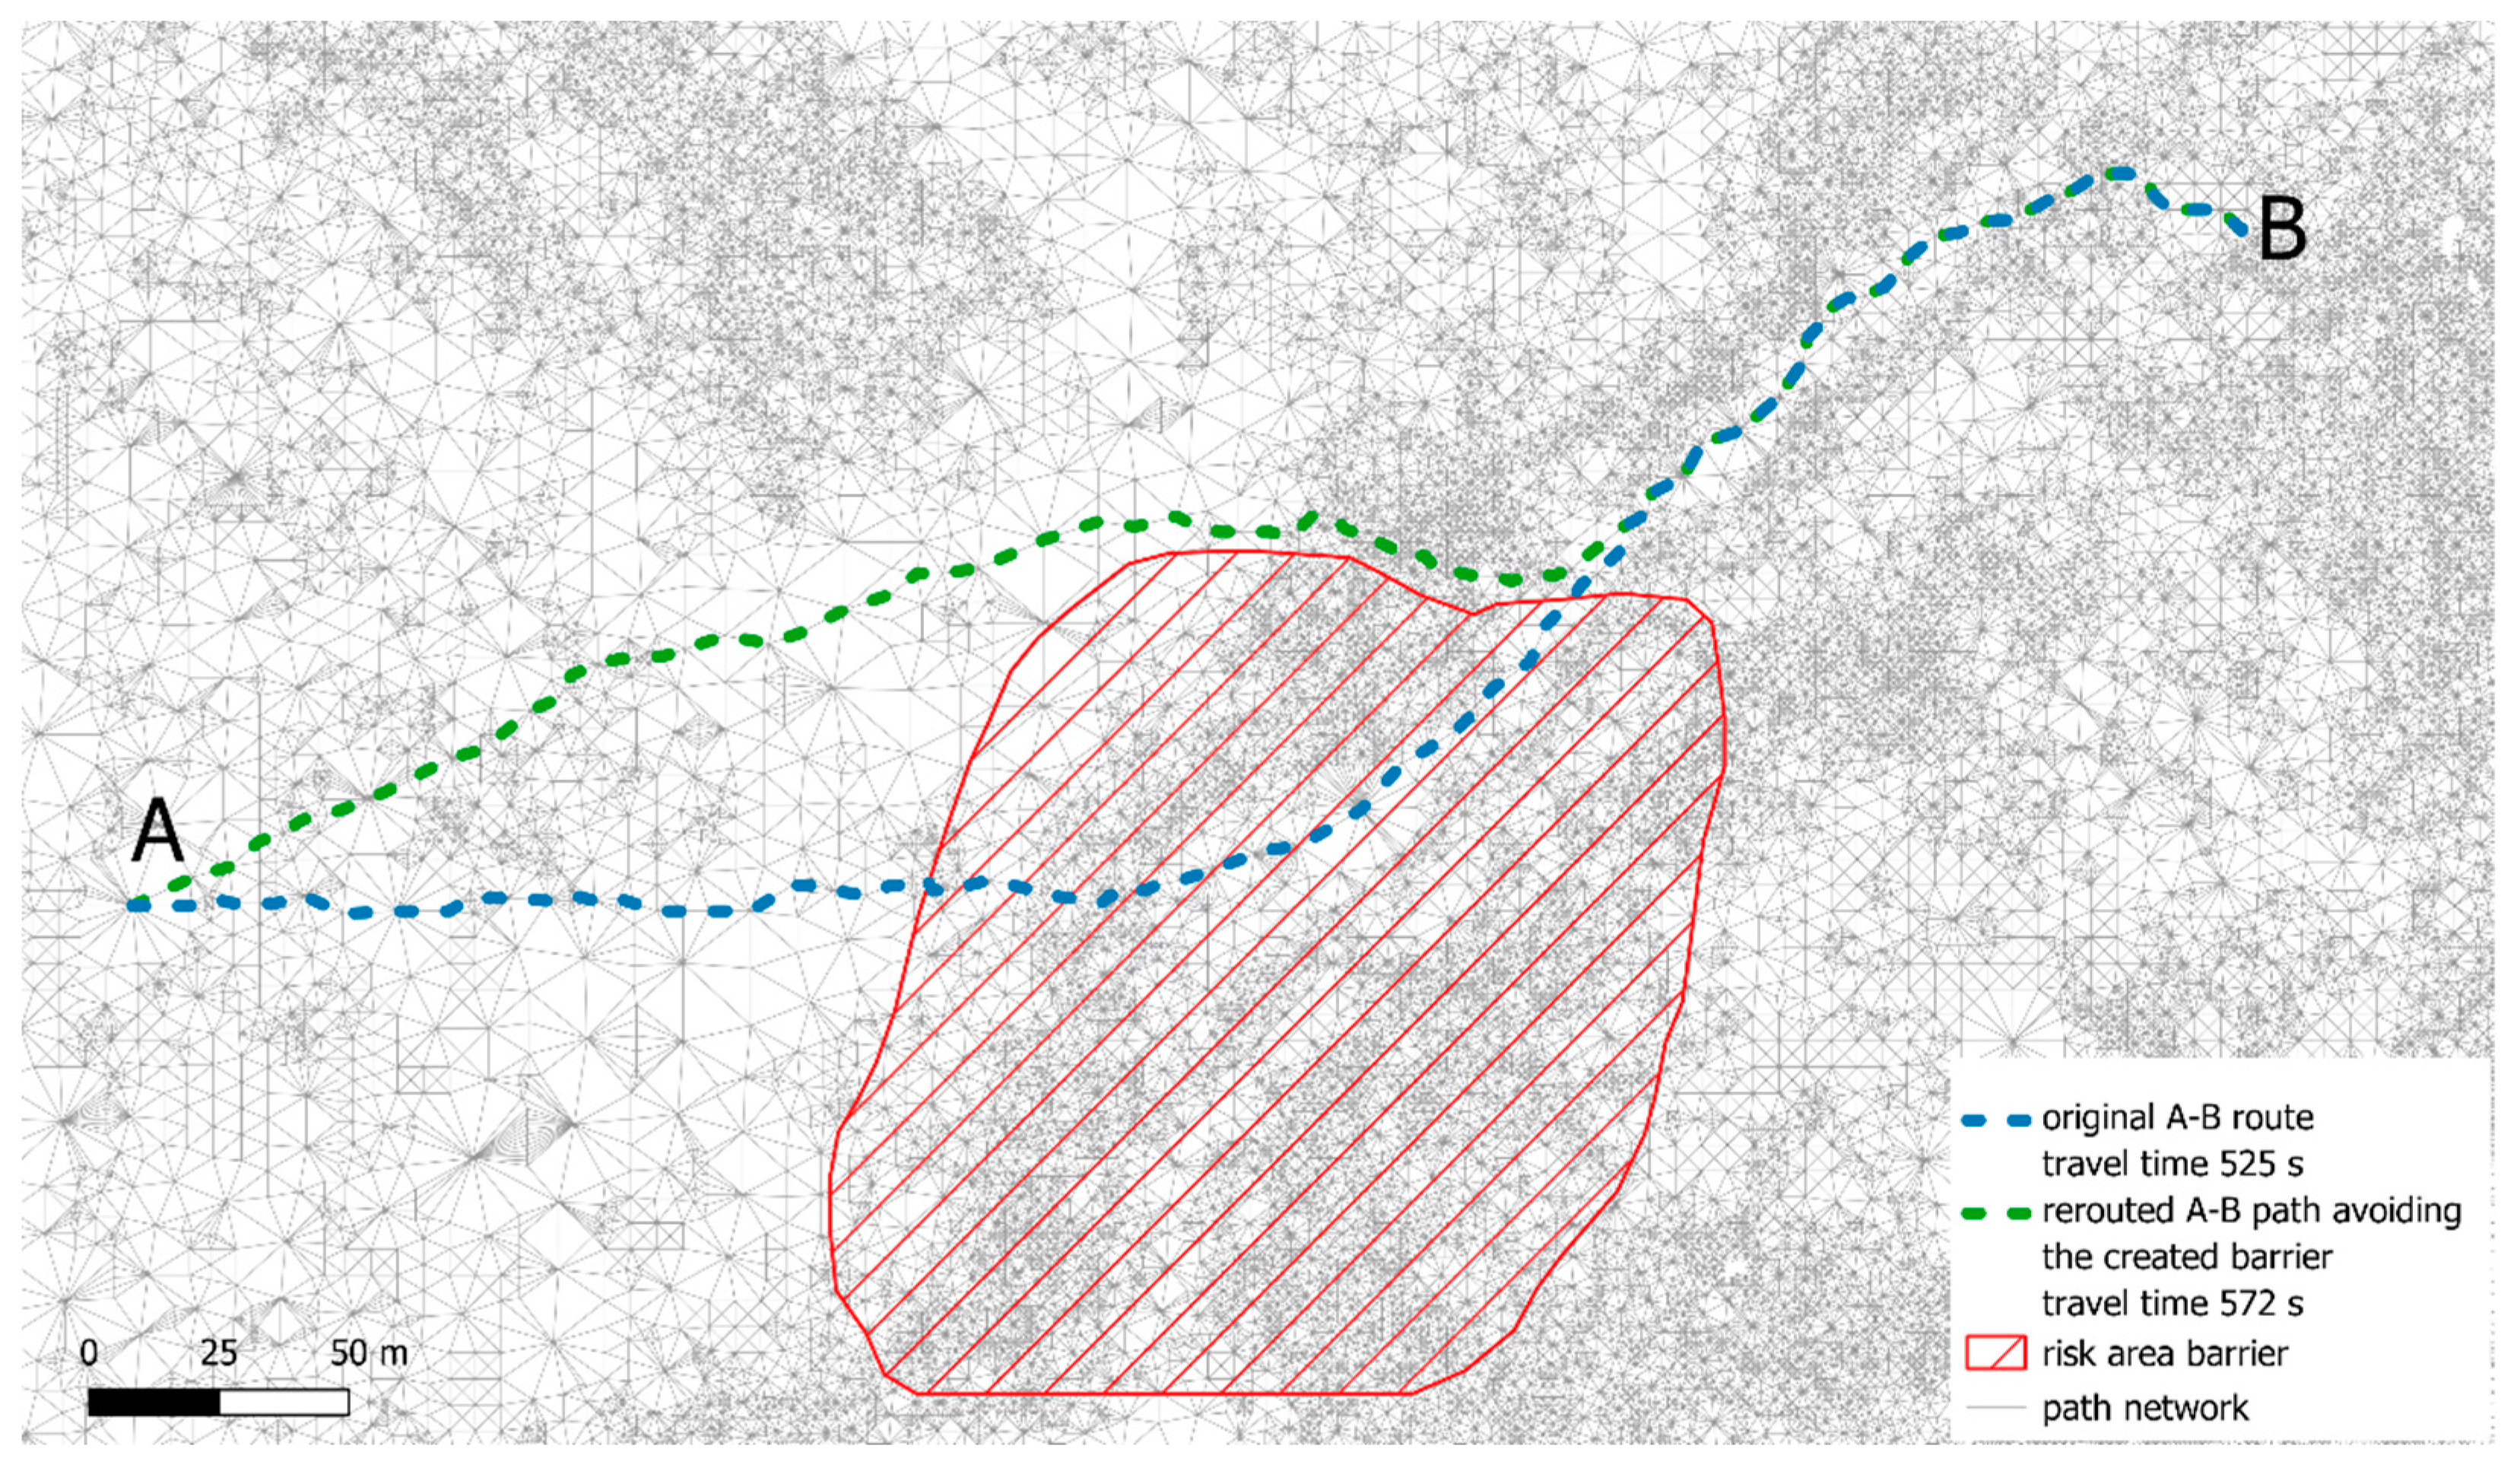
Wildfires are dynamic events that can rapidly change in size and intensity. In such situations, quick response and adaptation to the changing circumstances are crucial. One of the most important elements of crisis management in the case of wildfires is updating evacuation routes. The rapid spread of fire can cause previously safe routes to become hazardous. Therefore, as the fire progresses, emergency services must continuously assess the situation and make changes to the data on the availability of the evacuation network.
In the presented article, the SpatiaLite database system enables the update of a network to include inaccessible elements. The update can be performed in two ways: by removing from a database copy those network elements that are inaccessible (affected by or threatened by fire) or by changing the speed of movement along inaccessible network elements to a value of 0. This change occurs at the final stage, i.e., after heuristic spatial network aggregation. The update operation time is low, taking only a few seconds.
The selection of inaccessible areas can be based on real-time polygonal spatial data from fire detection [
62] or as a result of separate algorithms and applications that determine polygonal fire hazard areas [
63,
64,
65]. The removal of network segments or the update of movement speeds is performed using standard GIS analysis, specifically the intersection of the network layer with the hazard area. As a result of this intersection, the selected network segments can be removed or overwritten with a speed parameter. An example of applying this limitation is presented in
Figure 12. Route A-B has been calculated twice: once without considering barriers and once with a network that includes a sample barrier.
4.5. Hypothetical Use of the Proposed System in Assumed Scenarios
To investigate how the proposed system might operate and what its capabilities (route determination time, operability) are, the author decided to generate a network for a much larger area covering 40 km
2 of wildland in which the route analysis would take place. The area is bounded by forest roads (
Figure 11). The first stage of the system’s work is the preparation of the network (based on LIDAR data), which is time-consuming, but after its completion, the network is operational and ready to determine routes.
4.5.1. Practical Application of the System for a Small Fire That Can Be Handled Manually
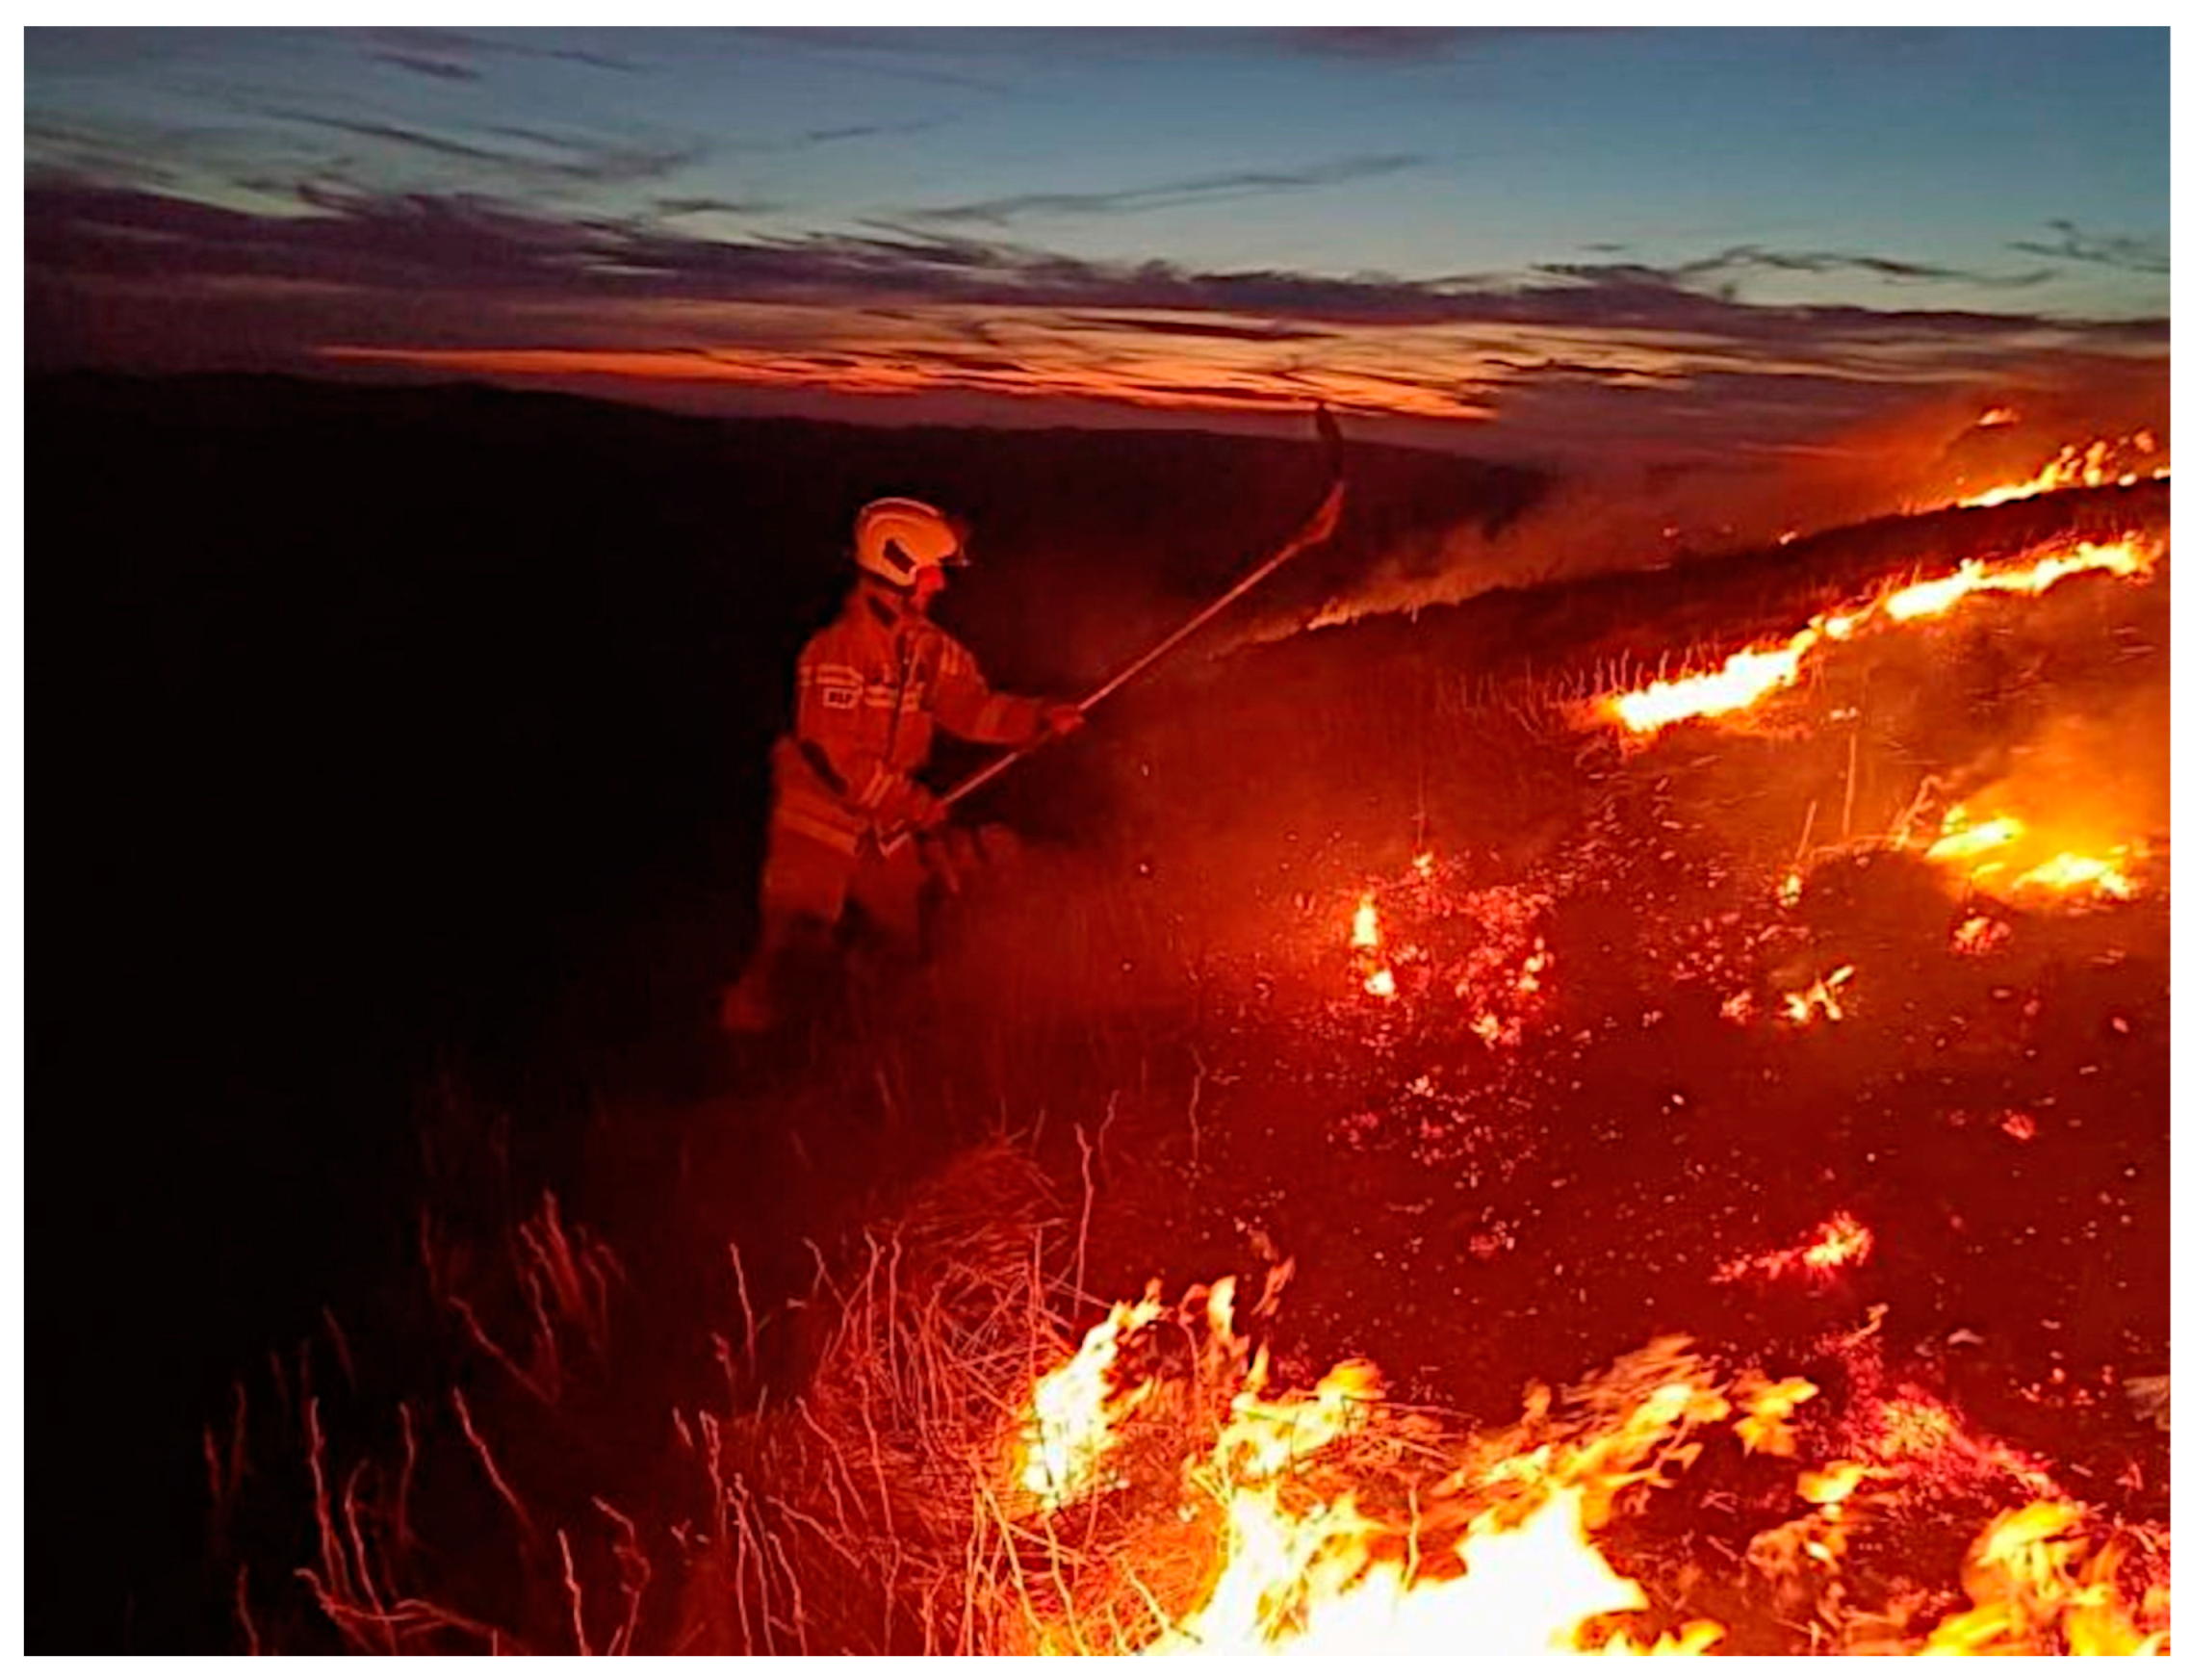
The occurrence of the scenario is very likely in the selected area, as it materialized in April 2024 in Połonina Caryńska, located 2 km from the exemplary considered area. During the fire, after traveling by fire trucks on a route passable by heavy vehicles, the firefighters were transported by small off-road quads or traveled on foot to the sources of the fire to manually extinguish it at the tops of the hills using hand beaters (
Figure 13). The rapid reaction and arrival of the extinguishing teams stopped the expansion of the fire into forest areas.
In such a scenario, the system can determine the best optimal routes that can be reached by a fire truck and then traveled on foot.
Figure 11 shows the result of such an analysis from two existing fire departments. By marking two hypothetical fire locations (obtained, for example, from satellite imagery), the fastest routes to points 1 and 2 were obtained. If the events occurred in parallel, it is possible, thanks to rapid analyses, to decide where to send a given fire unit. The analysis time of one route in this case is about 10 s (the network consists of over 40 million sections). The analysis could be performed by the rescue operation coordinator or commissioned by him, and the determined routes themselves can be sent directly from the database to navigation devices in the form of a GPX track.
4.5.2. Evacuation from the Wildland Area
A system based on a vector object database can be used for evacuation in the event of a threat (e.g., a fire during manual extinguishing begins to develop rapidly or engulfs the forest. In this case, the author’s method has several limitations. Other types of programs should be included in the analysis that allow determining polygonal fire hazard zones, e.g., [
63,
65]. The polygonal area can exclude the threatened part of the network from the analysis (by overlaying spatial layers in the database and overwriting the prepared network). The result of such an operation is shown in
Figure 12, and the operation time for a network covering a 40 km
2 area is about 3 s (not including the running time of the program determining the hazard zones). As a result of overwriting the network, the route will be determined by passing the threatened zone.
Another solution is to use real-time fire data, which are generated from continuous satellite observations, e.g., through the NASA-FIRMS project [
62]. The system determines hot-spot areas based on Landsat satellite data (30 m resolution) and S-NPP, NOAA-20, and NOAA-21 VIIRS (approx. 375 m resolution). The limitation of the system is that while real-time data are presented for the United States and Canada, other regions obtain new data only every 30 min or so. You can also use already tested tools and proprietary systems that allow you to obtain such data for any area of the Earth from geostationary satellites [
66]. The advantage of such systems over modeling is the actual image of the fire spread; in modeling, the forecast can change depending on the wind direction, which can be very unpredictable. It would be ideal to combine modeling with satellite data to verify the fire spread process with the calculated model.
The advantage of the author’s system over many other solutions is the speed of route analysis and the speed of data updating. The route can be recalculated periodically during evacuation (e.g., every minute) if the fire hazard zone changes or, for example, the fire brigade evacuating from the hazard zone deviates from the designated route due to unforeseen terrain conditions (fresh landslides, debris). In such a case (as mentioned earlier), the recalculation time of a new route for a large area is a few seconds.
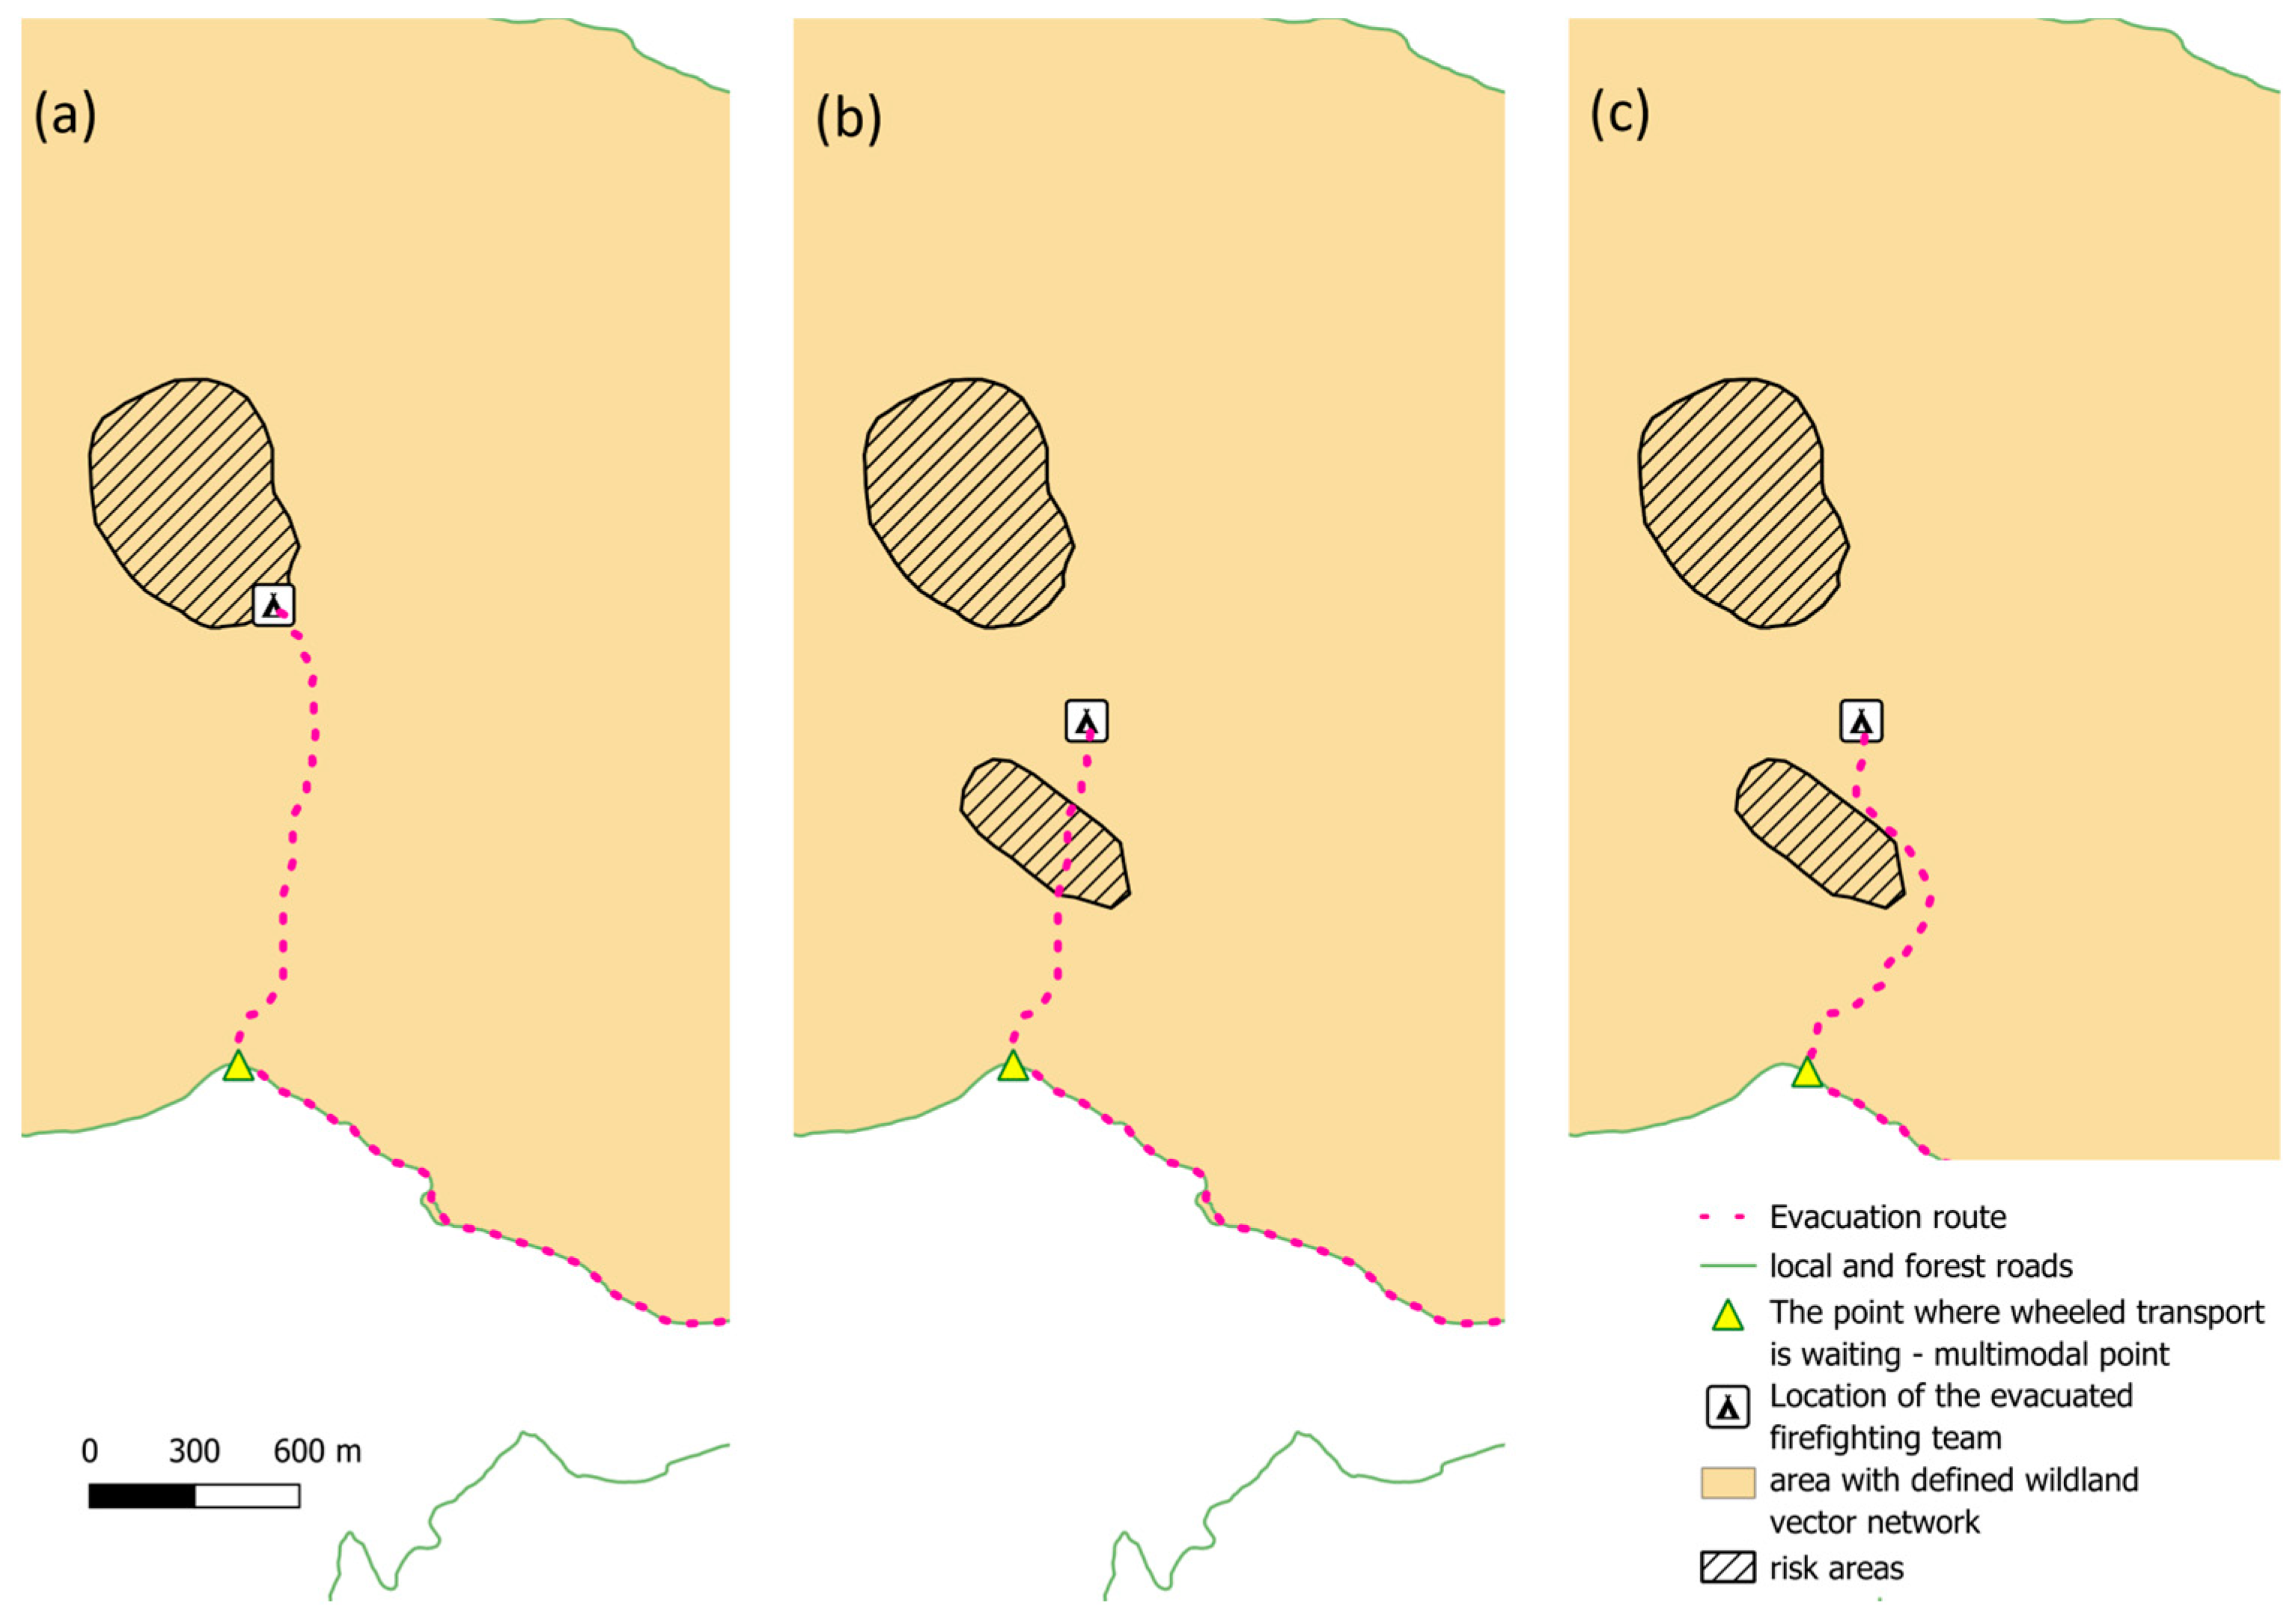
The evacuation process procedure is presented in
Figure 14. In it, part a shows the original evacuation route along with the place where heavy equipment or a fast means of transport can reach. During evacuation, using GNSS transmitters, the system operator constantly tracks the movement of evacuees and, in the event of deviation from the route, sends a new GPX file with the route to the devices. During the evacuation, a new fire breaks out (
Figure 14b), which prevents the evacuation of firefighters along the old, designated route. In such a case, the operator receives a new route within a few seconds (
Figure 14c), which he can also send at any time in the form of a GPX file to the devices of the evacuees.
The proposed route determination system in emergency situations during wildland fires, based on the SpatiaLite database, integrates with existing systems and can be extended with a road network, enabling more efficient use of mechanical transport by rescue teams. This system can determine which rescue unit is closer to the target, optimizing the route of access or evacuation in terms of speed. Integration with existing crisis management systems may include the use of fire hazard data from other systems and applications, real-time data updates, including the use of data on the fire and its development, integration with dispatch systems, and support for multimodal analysis. The challenges associated with system integration include, among others, training of personnel operating the system, probably difficult compatibility with existing systems, trust in the system, costs of system implementation and maintenance, and cooperation between agencies. Despite these challenges, system integration can significantly improve the effectiveness of rescue operations during fires occurring in wildland areas.
5. Conclusions and Future Directions
The objective of this article was to adapt the spatial objects database for network analysis in wildland areas, a task previously executed on raster data due to the absence of a defined road network. The focus was on presenting results in the context of evacuating individuals from a specific point or reaching a destination during a rescue operation. The developed method of converting raster data into an extensive network, even covering the considered area, enables analyses to be performed in the database at an optimal time, allowing for real-time crisis management. The main advantage of this solution, compared to existing raster routing systems, is the capability to expand the network with existing roads, facilitating multimodal analysis that combines on-foot travel in wild areas with motor vehicle transportation. The ability to designate an optimal meeting point during an evacuation significantly enhances crisis management in each situation.
In areas with low diversity of movement cost, interpolation of output data to lower resolutions shows good results. In contrast, in diversified areas, the best solution was the algorithm aggregating the output regular network to a network of irregular squares called HAN (heuristic aggregated network), which aggregates areas with the same cost of movement.
The analyses were conducted in the widely used open SQLite database SpatiaLite. However, the assumptions and methodology presented in this article can be successfully implemented in any database system that allows for route calculation. The proposed use of databases for route planning is significant due to the easy and cost-effective commercial implementation of the solution, making it applicable to fire and rescue services, tourists, foresters, and various other individuals and institutions.
This study has several limitations. Firstly, it assumes a static version of the terrain coverage obtained from LiDAR data. In the future, terrain coverage could be developed based on advanced satellite imagery, which is more up-to-date and less costly. Another limitation relates to determining the speed of movement through the virtual network in wildland areas. The only data used by the author to modify the speed of movement were the terrain slope, vegetation density, and the presence of wetlands and flooded areas. Future studies should also consider the type of substrate. As part of future research, it is recommended to explore an ideal approach to optimize the network to cover much larger areas without division into regions. For foot routing solutions, introducing a parameter to distinguish whether the route traverses uphill or downhill terrain could improve the estimation of walking speeds over longer distances. Further research may also focus on optimizing the HAN algorithm for better and faster network optimization. In the future, an algorithm could be further developed to automatically divide the area into sectors based on natural terrain barriers (e.g., rivers, roads) or the density of the vector network. The system could also be tested and used in other emergency situations, such as floods, landslides, and earthquakes, as well as for planning tourist and recreational routes in forest areas, taking into account user preferences and terrain conditions.


