Abstract
Google Earth Engine (GEE) has become one of the most widely used platforms for Land Use and Land Cover (LULC) research, offering cloud-based access to petabyte-scale datasets and scalable analytical tools. While earlier reviews provided valuable overviews of data and applications, this study synthesizes 72 selected articles published between 2016 and February 2025 to examine the evolution of GEE–LULC research. Results show exponential growth in publications, with Landsat and Sentinel imagery dominating datasets and Random Forest (RF) and Support Vector Machine (SVM) remaining the most common classifiers. Geographically, output is concentrated in China and India, reflecting regional leadership in GEE adoption. Despite its strengths, GEE faces persistent challenges, including memory limits, restricted support for advanced Deep Learning (DL), and reliance on labeled data. Promising directions include integrating few-shot semantic segmentation and hybrid workflows combining GEE scalability with local Graphics Processing Unit (GPU) computing. By bridging platform-focused and application-focused studies, this review provides a comprehensive synthesis of GEE–LULC research and outlines actionable pathways for advancing scalable and Artificial Intelligence (AI)-enabled geospatial analysis.
1. Introduction
In recent years, several cloud computing platforms have been implemented, offering on-demand technical infrastructure, storage services, software packages, and computing power to handle large volumes of data processing and calculations [1,2,3,4]. Google Earth Engine (GEE), introduced by Google in 2010, is one of the most widely recognized platforms in remote sensing-related research. It is designed for storing, accessing, and analyzing a vast collection of remotely sensed data and geospatial datasets [5,6,7]. GEE provides a wide range of datasets, including both pre-processed and raw data, as well as freely accessible satellite products at global, national, and regional scales [8,9,10]. It archives a massive amount of remote sensing satellite data gathered over the past 40 years from major land monitoring sensors, including Landsat, Moderate Resolution Imaging Spectroradiometer (MODIS), National Oceanic and Atmospheric Administration (NOAA), Sentinel, and Advanced Land Observing Satellite (ALOS), among other datasets [11] such as atmospheric, environmental, natural resources, and terrain datasets that serve as fundamental data for multidisciplinary research and applications [10].
In addition to GEE, other widely used cloud computing platforms for geospatial research include Amazon Web Services (AWS) and Microsoft Azure [12,13,14]. These platforms provide access to remote sensing datasets such as Landsat, Sentinel, and MODIS, combined with machine learning and cloud storage tools [12,13,14]. They are presented in our study for comparative purposes with GEE, as they constitute the most frequently used platforms within remote sensing research. While AWS and Azure offer flexible infrastructures, their domain-specific integration is less extensive than GEE, which uniquely combines a comprehensive data catalog with ready-to-use geospatial analysis tools at a global scale.
AWS involves Landsat-8, Sentinel-1, Sentinel-2, China–Brazil Earth Resources Satellite program, National Oceanic and Atmospheric Administration (NOAA) image datasets, open data supplied by DigitalGlobe, and Global Model outputs [7,12,15]. On the other hand, Azure has been providing Landsat and Sentinel-2 products for North America since 2013, along with Moderate Resolution Imaging Spectroradiometer (MODIS) data since 2000 [12,13,15,16,17]. Compared to them, GEE provides significantly larger volumes of remotely sensed datasets. GEE offers a broader range of geospatial datasets, including Sentinel, recent and historical archive (since 1972) of Landsat datasets, among many other remote sensing satellites’ missions data, and provides services free of charge to all researchers [14,18,19,20]. Table 1 presents a detailed comparison between the three mentioned platforms in the context of remote sensing, highlighting GEE’s unique features and advantages over its competitors.

Table 1.
Comparison of Cloud-Based Platforms: Google Earth Engine, AWS, and Microsoft Azure.
While AWS and Azure are both robust platforms, their limited capabilities may not enable them to fully replace GEE, given its broad and openly accessible geospatial data and tools. This was reflected by the continued high usage of GEE by researchers, as noted in the review studies [12,13,14]. GEE is widely utilized in urbanization, sustainability, and environmental research studies due to its cloud-based geospatial processing abilities, online user access, and accessibility to extensive geospatial datasets [21,22,23,24,25]. Furthermore, it is also the most widely used online geospatial platform in land monitoring science [7,14]. GEE consists of several key components that make it an impressive tool for geospatial analysis [26,27,28]. These key components include: (1) Its Data Catalog, which offers access to a wide range of remotely sensed datasets, among other massive amounts of data [29]. (2) Its Code Editor is a web-based interactive environment that allows users to implement and execute JavaScript and Python programming in order to process and visualize data [30,31]. (3) Its cloud-based processing, which leverages Google’s high-performance computing infrastructure and parallel processing capabilities to enable efficient large-scale analysis without requiring local storage [12,32]. (4) allowing Application Programming Interfaces (APIs) in JavaScript and Python, which support workflow automation, integrate with other platforms, and enable the development of customized applications [33,34]. (5) GEE’s built-in export and sharing tools allow users to share results through Google Drive, Cloud Storage, or Earth Engine assets, facilitating collaboration and reproducibility [12,14]. (6) supports user-defined processing methods, enabling users to develop algorithms and deploy interactive applications using its accessible resources [13,20]; (7) Its platform-free accessibility allows users to process datasets free of charge without downloading data or installing additional software [7,12,14].
Moreover, GEE offers a comprehensive cloud-based solution for processing remotely sensed data, integrating both data access and analytical tools, making traditional desktop-based image analysis obsolete [34,35]. GEE is providing the researchers with a high-capability platform to analyze massive amounts of remotely sensed data through parallel processing techniques. This infrastructure facilitates efficient large-scale geospatial data analysis and ensures the timely delivery of results, even when working with highly complex datasets [12,32]. These features make GEE an effective tool for environmental monitoring, disaster response, and geospatial research.
Additionally, this platform includes a range of built-in algorithms, such as classification algorithms like Random Forest (RF), Support Vector Machine (SVM), Classification and Regression Tree (CART), and other supervised classification methods [36,37,38,39,40,41,42,43]. Moreover, it also involves various clustering algorithms such as K-Means, Cobweb, and Simple Non-Iterative Clustering (SNIC) [10,11,44].
Research indicates that GEE has been utilized across various research fields, including urban planning, water management, health, forestry, and agricultural research [14,45,46,47,48]. The majority of studies using GEE have concentrated on the evaluation and monitoring of land use and land cover (LULC) changes, including trend historical evaluation, the role of land surface temperature (LST) in global warming, and water resources studies [49,50,51,52,53,54,55,56,57].
In LULC research, analyzing and monitoring changes is vital for understanding urban growth, agricultural shifts, deforestation, and climate change. Accurate LULC data offers essential evidence for conserving biodiversity, minimizing disaster risks, and planning sustainable cities. By combining the capabilities of GEE with LULC analysis, researchers can tackle urgent global issues related to human–environment interactions.
Unlike earlier reviews that focused either on GEE as a platform or on LULC analysis in isolation, this paper is the first to systematically integrate both fields. By connecting platform-level reviews and application-specific studies, it highlights methodological advances and emerging challenges, providing new insights that go beyond previous work.
2. Significance and Objective
Due to the continuous increase in urbanization, monitoring LULC change has become crucial for evaluating urban planning, understanding urban-related hazards arising from rapid expansion, and mitigating the consequences of human–environment interactions [57,58]. Assessing LULC dynamics is also essential for evaluating impacts on ecosystems, including deforestation and biodiversity loss [16]. More broadly, LULC analysis plays a key role in monitoring changes on Earth’s surface, encompassing climatic, environmental, and human transformations. However, LULC data support evidence-based policy-making and economic planning [18,56].
Given these critical roles, this review focuses on the role of GEE in analyzing and monitoring LULC change. To the best of our knowledge, although several review papers address either GEE or LULC independently, no review has specifically examined LULC studies conducted using GEE. Therefore, this study aims to fill that gap by providing a comprehensive and up-to-date review of how GEE is applied to LULC change detection, identifying current trends, methodological preferences, and practical challenges. The study provides a foundation for researchers selecting methodologies and datasets for LULC analysis using GEE. The following section presents a comprehensive evaluation and analysis of recent review papers, with a focus on the role of GEE in remote sensing research.
3. Summary of Recent Review Articles
According to [12], five literature review studies on GEE were conducted up to 2020, including articles [11,14,25,47], and [12] itself. Based on our investigation, six additional review articles have been published since 2020, including [7,10,13,15,20,59]. The studies reflect a remarkable increase in the utilization of GEE and its applications across various scientific disciplines. For instance, ref. [11] illustrated a comprehensive review of the GEE platform, discussing its data catalog, system architecture, and efficiency, and offering insights into its broad range of applications. In other studies [25,47] explored the usage patterns of GEE, revealing that most GEE-related research comes from developed nations, with Landsat being the dominant dataset. These studies also identified a gap in research from less developed countries, particularly in regions such as Africa. In terms of applications, the studies revealed that GEE has been widely used in several scientific fields, including monitoring and tracking land use and land cover (LULC) changes, land cover classification, disaster management, and agricultural research studies. These studies highlighted the strength of GEE as an emerging open-source tool across various applications. They also indicated that the demand for GEE is expected to grow significantly in the future due to its high capabilities in providing diverse data and its efficiency in analyzing and managing geospatial data in a manner suitable for users worldwide.
More recent review studies have confirmed what earlier reviews, before 2020, already indicated, showing an apparent increase in the use of GEE. For example, refs. [12,13,14] demonstrated the rapid expansion of employing GEE in a wide range of research and applications. These studies prove that Landsat datasets remain the most popularly utilized data, and machine learning techniques such as Random Forest (RF) and Support Vector Machine (SVM) are frequently employed for classification tasks. Additionally, GEE’s role in investigating and analyzing global issues, such as water resource management, deforestation, desertification, air pollution, and global warming, was clearly highlighted in these reviews. In the context of GEE, ML, and AI integration, refs. [15,59] identified the role of GEE in geospatial research, with a focus on ML and AI tools. The studies investigated technical aspects and the most utilized techniques and methodologies. The authors noted key challenges and future research priorities, while refs. [7,20] underscored the platform’s capabilities across several disciplines, reporting that countries such as China and the United States of America (USA) are major contributors to its widespread adoption. A summary of the main scope and findings of these review papers is described in Table A1. In general terms, most review studies before 2020 highlighted the robust capabilities and components of GEE, as well as its applications in various research fields, predicting high demand for this technology due to its free access and ability to support remote sensing studies, with a note on the low contribution from less-developed countries. At the same time, more recent reviews (2020 onward) have focused on improving GEE effectiveness through integration with ML, DL, and AI approaches, which enhance performance and provide more reliable and accurate results. However, GEE continues to prove itself as an effective tool for processing massive amounts of geospatial data and tackling global challenges, despite some obstacles and regional disparities in its adoption.
Synthesizing the findings across the studies in Table A1, Landsat and Sentinel data emerged as the dominant datasets. Meanwhile, RF and SVM consistently ranked as preferred classifiers due to their robustness and simplicity within the GEE framework. Common strengths included rapid processing of extensive image archives and reproducibility across regions. However, notable differences also emerged: some studies emphasized national or global-scale monitoring, while others applied GEE to localized problems, such as crop classification or watershed management. Divergent findings often reflected differences in training data availability, choice of ancillary variables, and study objectives. These variations illustrate both the versatility of GEE and the challenges of balancing generalization with context-specific accuracy in remote sensing research.
4. Materials and Methods
The first step of this research was to identify the range of selected articles, focusing on publications that utilized the Google Earth Engine (GEE) platform to analyze and monitor Land Use and Land Cover (LULC) changes. The selection criteria focused on utilizing multiple global scientific libraries and databases to ensure the inclusion of the most relevant studies aligned within the scope of our research and to minimize selection bias. The review and analysis were conducted through “Google Scholar, Scopus, and Web of Science” libraries and databases to identify the most relevant articles. The selection criteria included: the exclusive presence of the terms “Google Earth Engine” and “Land Use and Land Cover” in the title or abstract, or keywords; publication in English; publication in peer-reviewed and high-impact journals; and a focus on the most recent year.
Consequently, more than 110 articles were reviewed. Then, some articles that were less relevant or had similar content, authors, or were published in a non-English language or low-impact journals were excluded for further analysis. Low relevance was defined as studies in which GEE was only mentioned peripherally (e.g., used solely for visualization without substantive analysis), duplicate or overlapping case studies from the same research groups, or works outside the scope of LULC change (e.g., studies focused exclusively on climate modeling or atmospheric monitoring). For cases where multiple studies by the same first author were found, the most recent and comprehensive paper was retained as representative. Finally, 72 articles were selected, including 11 review articles on GEE and 61 articles on the use of GEE in LULC-related topics for in-depth analysis. These selected articles represent a comprehensive and significant body of work in the field of GEE-based LULC research.
Although the final sample size may seem modest, this targeted approach ensures a focus on high-quality, peer-reviewed studies. Additionally, our analysis explicitly compares these 72 papers with the findings of earlier reviews, thereby enhancing the reliability of our research.
All selected articles in the database were thoroughly reviewed, and various pieces of information were collected. The articles database includes details such as the paper’s title, authors’ names, keywords, publication year, journal, study areas, study sizes, satellite data, LULC classification method, data resolution, study period, accuracy, and reported challenges of using GEE. The PRISMA workflow has been used to ensure a transparent and systematic process for selecting studies. Figure 1 illustrates the process of choosing and screening studies included in this review.
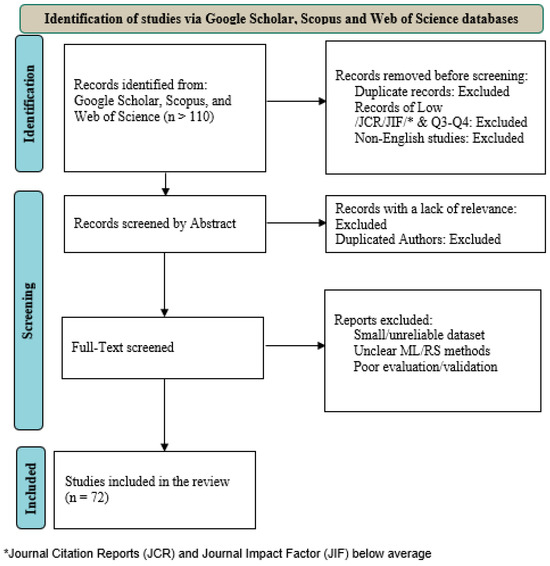
Figure 1.
PRISMA flowchart of the study selection process, showing the selection criteria and mechanism for excluding articles that do not match the scope of our study.
In summary, while many methods are available for LULC analysis, this review focuses on those that are most effectively integrated within the GEE environment. Techniques such as RF, SVM, and CART remain popular because they are compatible with GEE’s cloud architecture, while emerging approaches, including deep learning and time-series analysis, are gradually being adopted on the platform. Comparing these methods across our search criteria was considered in terms of both their shared strengths (scalability and reproducibility) and differences (accuracy and computational demand), guiding future researchers.
5. Results
5.1. Time Trend Analysis of Search Engine Results on GEE and LULC-Related Publications
The analysis of the observed results, conducted through “Google Scholar, Scopus, and Web of Science” search engines using the term “Google Earth Engine (GEE)” from 2011 to 2025, reveals that GEE experienced exponential growth from 2011 to 2021, followed by a period of stabilization between 2021 and 2023. This confirms the findings of the recent literature review article by [13], which reported that GEE-related publications have grown significantly, with nearly 85% of them published in the past three years. Overall, based on our findings, the number of research articles referencing GEE in identifying publication years in the “Google Scholar, Scopus, and Web of Science” search engines has increased significantly over the years. A rapid growth was observed between 2015 and 2021. Between 2015 and 2017, the number of results reached about 23,100, indicating moderate growth. This increased to 26,000 results from 2017 to 2019, showing wider adoption of GEE. There was a significant jump to 36,000 results from 2019 to 2021, reflecting high demand for the use of GEE for research purposes during this period. From 2021 to 2023, approximately 35,900 results were recorded, indicating sustained research interest. Finally, in recent years, from 2023 to the present (up to February 2025), a notable increase in publications has been observed. This surge is attributed to the fact that the number of articles collected up to February 2025 indicates an estimated 42,343 results by the end of 2025.
Regarding the number of articles that utilized GEE in LULC-related research, there were fluctuations over the years. Growth was observed in earlier years (2013–2017), which can be attributed to the increasing popularity and accessibility of GEE. This was followed by a slight slowdown in the later years (2017–2023), possibly due to the field’s maturation, the need for more complex and time-consuming research, and the recession that accompanied the global pandemic COVID-19. However, a significant increase in publications integrating GEE and LULC was noted in recent years (2023–2025), marking a notable rise. This surge could be due to recent developments in the GEE, new research applications, an increased focus on urban expansion-related topics, and LULC monitoring using remote sensing data. Figure 2 illustrates the timeline of research trends observed through scientific search databases “Google Scholar, Scopus, Web of Science” that focused on GEE alone compared to studies that combined GEE and LULC-related studies between 2011 and 2025. Two-year intervals were chosen to simplify the visualization and highlight broad temporal patterns in GEE–LULC publications, rather than focusing on short-term year-to-year fluctuations.
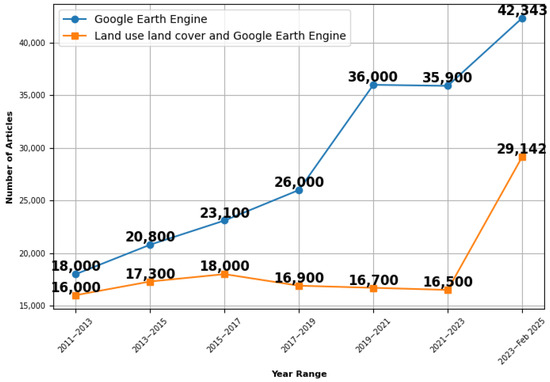
Figure 2.
Number of GEE–LULC publications across two-year intervals from 2011 to 2025. The values for 2023–Feb 2025 are based on publications available up to February 2025 and should therefore be considered an estimate. Two-year intervals are used to provide a simplified overview of long-term publication trends, enabling the tracking of changes over time. The timeline shows an overall growth of GEE and LULC-related studies over the years.
In our study, as shown in Figure 3, all selected and reviewed articles (72 papers) were published from 2016 onward. About 80% of the articles were published after 2020, indicating a significant increase in research activity focused on GEE and LULC integration in recent years. Notably, 7.9% of the articles are from 2025, despite the data only covering the first two months of the year (up to February). This surge in publications in recent years reflects the growing interest and research activity in the field of GEE-based LULC research, keeping the audience updated with the latest trends.
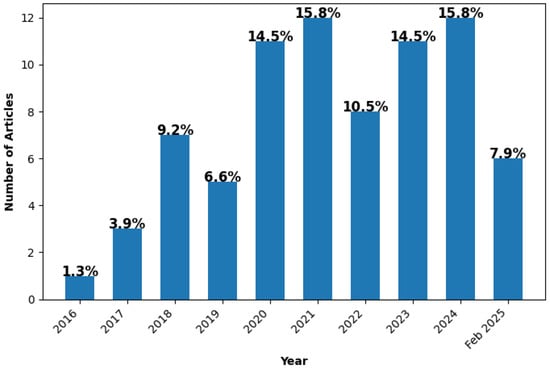
Figure 3.
Number of selected studies by year, showing that most of the GEE and LULC-related studies were conducted from 2020 onward. The bar for Feb 2025 represents selected papers that were published in January–February 2025 and are therefore not directly comparable to prior full-year counts.
5.2. Journals Analysis
During this study, the scientific journals that have published the selected papers were analyzed, showing a clear concentration of publications in specific journals. The journal “Remote Sensing” was utilized as a publisher for 25% of total publications, indicating its significant contribution in the field of remote sensing and environmental sciences. It is one of the most prominent and widely used journals in the discipline, likely to publish an extensive portion of the research related to satellite imagery, geospatial data, and remote sensing techniques. In addition, this confirms the results of previous review articles on GEE topics by [10,12,13,47], which revealed that the “Remote Sensing” journal has the highest number of publications in related fields. As a result, “Remote Sensing” has emerged as the leading journal for GEE-related publications to date. Several journals, such as “ISPRS Journal of Photogrammetry and Remote Sensing”, “ISPRS International Journal of Geo-Information”, and “Remote Sensing of Environment” appear multiple times, which may indicate a strong presence in their respective fields as shown in Table 2.
Table 2.
Journals’ publications in LULC/GEE-related articles (based on the selected papers in our study).
Other journals in the list cover a variety of specializations within remote sensing, environmental monitoring, and geospatial sciences. For example, journals like “Land”, “Rangeland Ecology & Management”, “Water”, and “Sustainability” highlight the intersection of remote sensing with environmental science, land management, and sustainable development. The list includes not only journals focused on remote sensing but also interdisciplinary journals such as “Computers, Environment and Urban Systems”, “Journal of Earth System Science”, and “GIScience & Remote Sensing”, which cover broader geographical, environmental, and earth monitoring topics.
5.3. Geographical Distribution of Studies
One of the primary outcomes of this study is to highlight the geographical distribution of the reviewed papers. As shown in Figure 4, the studies encompass a diverse range of regions worldwide, including China, India, Ethiopia, Turkey, the US, and Vietnam, among other countries. China appears most frequently in the studies in about 27%, with studies covering various provinces, river basins, urban areas, and more (e.g., “Yangtze River Basin, Yellow River Basin, Shenzhen, Shandong, Hebei, and Liaoning”). after China, India often appears in several studies, accounting for 13%, focusing on districts, sub-basins, and specific regions. (e.g., “Jagatsinghpur district, Kolleru Lake and Munneru Sub-Basin”).
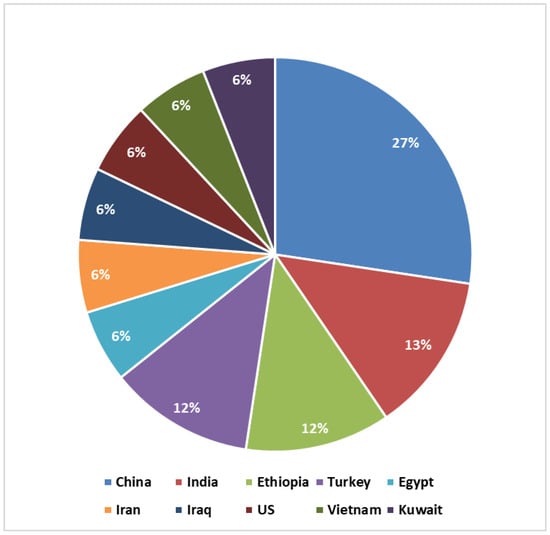
Figure 4.
Geographical distribution of case studies by country. Researchers from China contribute the highest percentage of publications, representing 27% of total reviewed articles, followed by India 13%.
The period from 2020 to 2024 witnessed a rise in global-level studies such as [4,8,30,34,60], as well as several regional-level studies such as [16,19,24,28,61,62,63]. This reflects a high-growing interest globally and regionally in using remote sensing virtual platforms, particularly GEE, for analyzing and monitoring large-scale data in urbanization and environmental studies. In early 2025, several studies such as [5,51,54,57,58] highlighted a significant focus on utilizing GEE for analyzing and investigating urban sprawl and wetlands, indicating a future research direction towards addressing the impacts of urbanization and environmental change.
By analyzing studies covering extensive regions such as China’s Yellow River Basin (967,000 km2) in the study [64] and Vietnam’s Mekong River Delta (7306.6 km2) in the paper by [16], it is evident that researchers rely on GEE as a primary tool and data source for widespread study areas. These regions are of particular interest due to their ecological and socio-economic significance, making the use of GEE in these studies particularly noteworthy. Based on this extensive reliance on GEE in these studies, GEE has proven to be a reliable and effective platform for managing and analyzing large-scale remotely sensed data. There are other studies focused on smaller but significant areas, such as Indonesia’s Banda Aceh (small urban areas), authored by [42], Italy’s Calabria by [27], and Ethiopia’s Upper Tekeze River Basin’s studies by [33,65], demonstrating that GEE provides a diverse range of datasets for researchers to conduct their studies smoothly and achieve the desired results.
According to the reviewed papers, the analysis and assessment of LULC change were consistently dominant in all geographical scales, as illustrated in Figure 5, reflecting the powerful capabilities of the GEE platform on different scales.
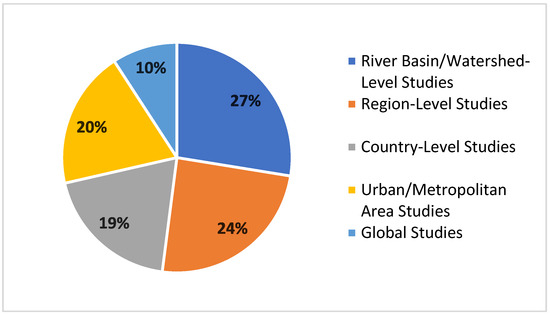
Figure 5.
Percentage of articles’ study scale on LULC topics related to GEE, representing the variety of case studies from a large-scale level (globally) to a small-scale level (e.g., river basins and watersheds).
This also emphasizes the importance of GEE in land management, urbanization, and agriculture monitoring-related studies. In particular, the studies have focused notably on urban expansion and LULC analysis in recent years (2023–2025) across various spatial scales. This concentration was clear in several articles, such as [1,5,21,28,40,48,58]. This trend highlights an increasing need for effective open-source platforms, such as GEE. As the demand for advanced analytics and global engagement in LULC studies continues to grow, it is anticipated that the adoption of platforms like GEE will become more urgent, ensuring that researchers can keep pace with the evolving landscape of geospatial analysis.
5.4. LULC-Related Methods, Algorithms, and Applications
Various methods have been applied for LULC data classification in the selected studies. As shown in Figure 6, the Random Forest (RF) algorithm was the most commonly used classification method, appearing in the majority of studies and representing approximately 36% of all reviewed studies. It was followed by Support Vector Machines (SVM) and Classification and Regression Trees (CART), which accounted for approximately 19% and 17%, respectively. Several DL approaches, such as Artificial Neural Networks (ANN), Fully Convolutional Neural Networks (FCNN), and TWIn Neural Networks for Sentinel data (TWINNS), were utilized in about 6.67% of cases, indicating that deep learning is emerging as a strong tool, particularly for Sentinel and Landsat imagery. Some less commonly used methods, such as Naive Bayes, Integrated Valuation of Ecosystem Services and Tradeoffs (InVEST), Simple Non-Iterative Clustering (SNIC), and Random Under-sampling Ensemble of Support Vector Machines (RUESVMs), were each applied only once in the reviewed studies.
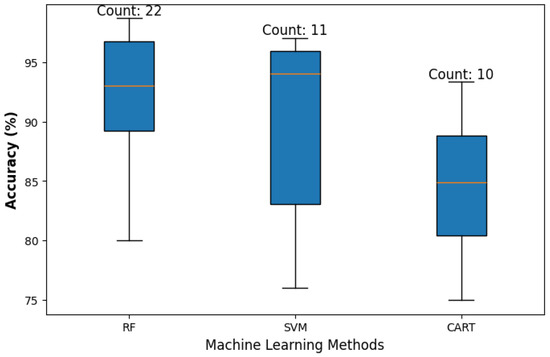
Figure 6.
RF, SVM, and CART classifiers’ frequency and accuracy, demonstrating the prevalence of utilizing RF algorithms for data classification tasks over the reviewed studies, as evidenced by providing the highest accuracy range.
Most studies (almost 90%) validate classification results using overall accuracy, user’s accuracy, producer’s accuracy, and Kappa coefficient. The overall accuracy of different classification methods ranges from 80% to 98.68%, with most methods achieving above 90%. This high level of accuracy reassures researchers about the reliability of the results. At the same time, Kappa values are generally high and above (>0.75), indicating strong agreement between classified results and reference data. The highest reported accuracy (98.68%) was achieved using a combination of RF, CART, and SVM. However, the RF classifier alone provides accuracy above 95% in most cases. The most frequently used algorithms for data analysis were RF, SVM, CART, and Maximum Likelihood (MLH), with RF being the most widely adopted method. SVM is commonly combined with RF, typically achieving accuracy above 90%. In contrast, CART, although widely used, generally provides lower accuracy, ranging between 80% and 90%, as demonstrated in Figure 6.
The Maximum Likelihood Algorithm (MLH) was utilized in some studies, but it is less prevalent than machine learning methods. Moreover, deep learning and neural network models, including FCNN, TWINNS, and Multilayer Perceptron Neural Network (MLPNN), are gaining attention in LULC-related research due to their high accuracy.
For instance, RF is a highly adaptable algorithm and widely used across various domains, including LULC classification, urban growth modeling, regression analysis, time-series analysis, and change detection. It is often combined with other machine learning algorithms such as SVM, CART, ANN, and Multiple Linear Regression (MLR) to enhance its performance and accuracy. SVM algorithms were frequently used in combination with RF and CART to improve results, particularly in tasks such as Synthetic Aperture Radar (SAR) intensity classification, urban expansion prediction, and change detection. It is widely applied in supervised classification tasks and is often combined with other algorithms to develop advanced change detection methods. The Maximum Likelihood Algorithm (MLH) serves as a baseline for comparison with more complex algorithms such as RF and SVM, particularly in supervised classification. It is also used in index-based methods, such as the Normalized Urban Areas Composite Index (NUACI), which combines multiple indices, including the Normalized Difference Water Index (NDWI), the Normalized Difference Vegetation Index (NDVI), and the Normalized Difference Built-up Index (NDBI), for comprehensive land use and land cover analysis. CART was also commonly used in urban growth modeling, change detection, Land Surface Temperature (LST) analysis, and LULC classification. However, SVM and CART algorithms are often combined with other models to improve classification accuracy. Other algorithms, such as ANN, are leveraged for predicting future LULC projections and urban expansion. Moreover, Geographically Weighted Regression (GWR) and Linear Spectral Mixture Analysis (LSMA) are also employed alongside RF and SVM to enhance the accuracy of the regression model, providing better results in complex geographical and urban studies.
While GEE provides an accessible platform for integrating deep learning models, its capabilities are limited compared to local computing environments. In GEE, deep learning support is currently constrained, with only basic TensorFlow integration available. However, GEE’s built-in machine learning APIs cannot flexibly allocate GPU resources, customize advanced architectures, or employ diverse deep learning frameworks directly such as PyTorch 2.9 or TensorFlow 2.20.0, which are commonly used in local settings. By contrast, local computing environments allow extensive model training, hyperparameter tuning, and experimentation with emerging architectures, making them more suitable for highly specialized applications. GEE’s advantage lies in scalability and immediate access to vast geospatial datasets, whereas local systems excel in flexibility, computational control, and support for cutting-edge deep learning methods. Together, these approaches can be seen as complementary rather than interchangeable.
5.5. Satellite Imagery Usage
This study has examined various data sources used for LULC classification and analysis in the selected papers. The results demonstrate consistency across the most common datasets, based on multiple approaches aligned with each study’s primary objectives. This is especially noteworthy, given that some studies have used different types of remotely sensed data sources to achieve impactful results. Overall, as demonstrated in Table 3 and Figure 7, Landsat satellite data, including all versions, were utilized in 65% of LULC-related studies, confirming their dominance in long-term change detection and land use land cover (LULC) analysis. Landsat-8 is the most often used satellite sensor, appearing in 31% of total studies, underscoring its importance in remote sensing applications [14]. Landsat-5 and Landsat-7 were utilized in 20% and 14%, respectively, reflecting the continued reliance on historical Landsat data for long-term LULC change and environmental monitoring [15]. This widespread use of Landsat data underscores its reliability and the trust researchers place in it for their studies. On the other hand, Sentinel satellite datasets, including Sentinel-1 and Sentinel-2, were employed in 23% of the reviewed LULC-related articles, highlighting their essential role in remote sensing but still trailing behind Landsat in overall usage [14,66]. Precisely, Sentinel-2 has been used in 15% of papers, making it more widely adopted than Sentinel-1, which appears in 8% of the total studies. This indicates a stronger preference for researchers to use optical data over SAR-based observations [10,12]. MODIS data have been utilized in various LULC studies, representing 4.5% of the total studies. The low percentage of MODIS dataset utilization in LULC monitoring studies is likely due to its lower spatial resolution (250 m, 500 m, 1000 m) [47] compared to Landsat and Sentinel data. However, its effectiveness was remarkable in studies that required Near Real-Time (NRT) data due to its appropriate temporal resolution for monitoring and investigating environmental issues such as drought, vegetation health, natural disasters, and atmospheric studies [10,11,12].
Table 3.
The frequency of remote sensing satellite data used.
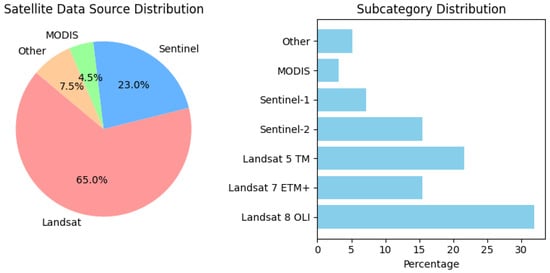
Figure 7.
The most common satellite data used in the reviewed articles represent a remarkable prevalence of utilizing Landsat data, followed by Sentinel datasets.
These trends highlight the significant role of Landsat data in environmental and urban studies, complemented by the integration of Sentinel data for a wide range of research applications. The use of Landsat and Sentinel satellite data with spatial resolutions ranging from 10m to 30m is crucial for monitoring land use changes, urban sprawl, deforestation, and environmental degradation [62,66]. Based on our findings, the most common spatial resolution used in studies focusing on urban expansion monitoring and LULC change tracking was 10 to 30 meters, which provides an excellent balance between spatial detail and coverage. This balance ensures the effectiveness of the chosen approach in capturing both detailed and broad changes in the landscape.
5.6. Studies Periods
By reviewing the selected papers that used GEE for LULC change monitoring, we have identified an apparent variation in the time intervals of the studies, ranging from long-term analyses (approximately 30 years) to short-term periods (1 to 5 years), depending on the primary objectives of each study. Most studies have mainly focused on decadal trends in years such as 2000, 2010, and 2020, which are the most frequently analyzed years. Many studies follow fixed decadal intervals (e.g., every 5 or 10 years) such as [23,44,67]. In contrast, others such as [5,52,64] used variable intervals or annual data (e.g., 1987–2020) for time-series analysis. Short-term studies (e.g., 2016 to 2019, 2015 to 2020, 2019) examined recent changes, as seen in studies conducted by [29,60,68], whereas long-term studies (e.g., 20–30 years) explored historical trends such as [16,51]. Landsat satellite datasets, particularly Landsat 5, 7, and 8, have been extensively used over long periods, such as 20–30 years, for research investigating environmental monitoring and LULC change detection [14,15]. MODIS data, on the other hand, has been employed in broader temporal ecological studies, particularly focusing on vegetation, water bodies, large-scale atmospheric analysis, and studies that require Near Real-Time (NRT) data [11,12]. Sentinel-1 (SAR) and Sentinel-2 (optical) data are commonly used in various recent studies, such as [8,44,58], which concentrate on monitoring and investigating long-term and short-term urban dynamics and expansion. This reflected the effectiveness of their temporal and spatial resolution, which is ideal for detecting rapid changes, such as land subsidence and urban sprawl. The increased use of Sentinel data in recent years has highlighted a shift towards more detailed monitoring of land and infrastructure changes, especially in land use and urban planning. The combination of utilizing various satellite data, such as Landsat and Sentinel, provides complementary insights, allowing for comprehensive analysis of large-scale and localized environmental issues and LULC change monitoring [15].
5.7. Keyword Analysis
Throughout this study, the replication of common keywords used in the reviewed articles was examined. The analysis of the frequency and percentage distribution of common keywords reveals that “Change Detection” is the most frequently used term, occurring 20 times, which constitutes approximately 28% of the total studies. This indicates a strong focus on the usage of change detection in the context of scientific remote sensing applications and studies. Other key terms include “Urban Expansion” (18 occurrences), “Machine Learning” (15 occurrences), and “Climate Change” (13 occurrences), highlighting the diverse role of remote sensing technologies and GEE platforms in selecting the research’s keywords. The frequent use of these terms suggests a clear trend toward geospatial data-driven approaches and cloud-based processing in recent LULC research. Figure 8 presents the most used keywords, and Figure 9 illustrates a word cloud of the most frequently used keywords in the reviewed studies.
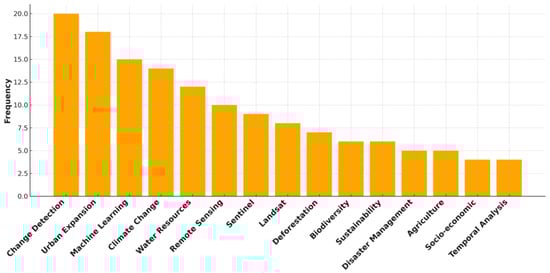
Figure 8.
The most frequently used keywords in the reviewed articles highlight dominant research themes related to GEE and LULC.
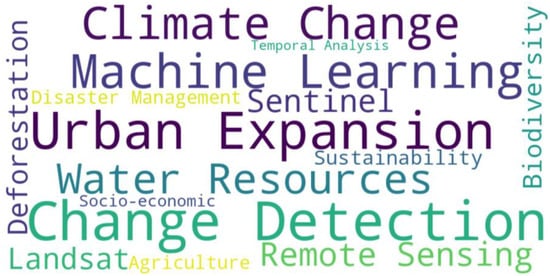
Figure 9.
Word cloud visualization of keywords extracted from the reviewed articles, illustrating the prominence of emerging research themes. The most frequently used terms highlight current priorities, such as change detection, urban expansion, machine learning, climate change, and water resources, reflecting the evolving focus of GEE-based LULC studies.
Overall, the main keywords chosen by researchers have revolved around geospatial technologies, machine learning applications, and satellite-based monitoring. This highlights the growing role of GEE not just as a data platform, but as a vital tool and theme for modern geospatial analysis.
6. Discussion
This discussion articulates key insights from this study’s findings and recent review papers on GEE, situating them within the broader context of the platform’s expanding applications, evolving methodologies, global usage trends, and challenges. By comparing earlier reviews [12,25,47] with more recent reviews, such as [10,13,20], our study highlights critical shifts in GEE’s role within remote sensing research from its early stages to its current status as a globally utilized platform.
6.1. Expansion of Data Usage and Methodological Shifts
Early reviews, such as [12], revealed the dominance of Landsat and Sentinel data in GEE applications, with RF algorithms being widely implemented. Subsequent studies, including [14,20] confirmed these trends while noting an increasing reliance on Sentinel-2 due to its improved spatial and temporal resolution. Our review further demonstrates a methodological evolution, with a growing emphasis on deep learning, cloud-native workflows, and AI-driven automation [15]. This shift reflects GEE’s transition from being primarily a data access tool to a comprehensive platform supporting advanced large-scale analytics [25,47].
6.2. Geographic and Thematic Diversification
Initial assessments by [25,47] highlighted GEE’s limited adoption in developing regions, despite its potential to make geospatial analysis more accessible. However, later studies, including [14,20], observed a significant increase in contributions from Asia, Africa, and Latin America, with countries such as China, India, Ethiopia, and Brazil emerging as key contributors. Our findings support this trend, showing broader engagement from previously underrepresented regions, particularly in applications such as urban expansion, wetland monitoring, and agricultural assessments. This expansion aligns with [11], the original vision of GEE, which is to be an inclusive and globally accessible platform.
6.3. Increasing Specialization and Interdisciplinary Applications
While early review by [12] emphasized GEE’s general utility in LULC mapping and environmental monitoring, more recent analyses reveal a trend toward specialization. Studies such as [59] focused on refining classification techniques using machine learning, while refs. [10,13] highlighted GEE’s growing role in climate change, disaster response, and public health. The integration of AI and cloud computing [15] has further enabled complex, large-scale analyses, reinforcing GEE’s position as a cornerstone of modern geospatial research. Our study aligns with these findings and confirms that the GEE platform has become a powerful integrated tool for obtaining data, conducting comprehensive analysis, and visualizing the desired results. Furthermore, the platform is developed to be integrated with advanced ML and AI tools, serving researchers worldwide across various fields of research.
6.4. Comparative Insights on GEE’s Future Directions
Compared to foundational work such as [11] which positioned GEE as a revolutionary and promising tool, recent reviews demonstrate its evolution into a standardized platform for remote sensing and geospatial research. The rising number of publications, diversification of applications, and global user base underscore its established role not only in addressing environmental and societal challenges but also in contributing its extensive capabilities to a wide range of studies worldwide.
The capabilities of GEE support the diversity of LULC research perspectives by enabling: (i) multi-sensor integration across optical (Landsat, Sentinel-2) and radar (Sentinel-1) datasets; (ii) scalable time-series analysis to monitor long-term changes from local to global scales; (iii) harmonized data access, where preprocessing, cloud masking, atmospheric correction, and mosaicking are standardized. These features allow researchers to address both broad monitoring tasks and specialized case studies within a unified platform.
6.5. Reported Limitations of GEE in LULC
GEE is a powerful tool for processing geospatial data, but it has some limitations that obstruct its full potential for various applications [7,11,12,14]. Noting that these limitations could be considered as expected challenges in the technology fields. These challenges could be addressed in the future without compromising the high effectiveness and performance of the GEE platform. One of the major challenges is the difficulty in handling large datasets due to memory constraints, which can result in slow processing times, especially when dealing with high-resolution or large-scale time-series data [14,15]. Moreover, GEE’s fixed computing infrastructure limits users’ ability to adjust computational resources, while the flexibility is often needed for more detailed computations and simulations [15,58]. Additionally, GEE’s users highlighted some challenges with cloud cover and data gaps in satellite imagery, which can significantly reduce its usefulness in areas with frequent cloud cover, such as tropical regions [12,14,15,64]. Users also face challenges when trying to integrate multi-source data and conduct spatial and temporal analyses together [58,69]. The platform’s lack of control over data chunking and limitations in multi-user collaboration further complicate large-scale and multi-user projects [14,61]. The platform is also not compatible with certain types of data, such as complex Synthetic Aperture Radar (SAR) data (unless Sentinel-1 data), and high-resolution data (unless National Agriculture Imagery Program (NAIP) and Planet Skysat) data [7,14]. In addition, GEE’s data privacy has been mentioned in the literature as a marked concern, due to the storage of data on private company servers, which presents a barrier for users, governmental agencies, and private companies that require strict data confidentiality [7,12]. Users also reported some difficulties with specific preprocessing methods, such as atmospheric corrections and the platform’s inability to handle complex segmentation algorithms [7,12].
Another critical limitation in LULC research is the scarcity of labeled data, particularly in regions with limited annotation resources. This challenge often restricts the accuracy and transferability of classification models. Recent advances in few-shot semantic segmentation provide promising solutions by enabling models to learn effectively from limited samples and generalize to novel land cover classes [70,71]. Integrating such approaches with GEE-based workflows could significantly enhance the scalability and applicability of LULC analysis. Emerging techniques, such as hierarchical relation learning [71] and learnable prototype-based methods [70], highlight pathways to overcome annotation scarcity and extend the utility of GEE for global environmental monitoring.
There are also significant reported issues with the restricted implementation of deep learning models within GEE compared to local environments [7,12,14,15]. While GEE facilitates large-scale data handling and basic TensorFlow workflows, it lacks the flexibility of local computing for GPU allocation, model customization, and the use of advanced frameworks such as PyTorch. This restricts researchers who require fine-grained control over deep learning architectures. Therefore, although GEE offers scalability and ease of access to global datasets, local systems remain indispensable for training complex models, underscoring the need for hybrid approaches that combine GEE’s scalability with the computational flexibility of local environments.
To summarize, the most significant limitations are memory constraints and cloud cover interference, which hinder large-scale and tropical applications, respectively. Furthermore, other technical limitations, such as limited support for advanced machine learning (ML) models and fixed computing infrastructure, could be improved by integrating GEE with more advanced Application Programming Interfaces (APIs) in JavaScript and Python, which enable deep workflow automation and modeling. These limitations together highlight the challenges noted by users when using GEE for large-scale geospatial analysis. Table A2 summarizes the main reported limitations and challenges of the GEE platform.
6.6. Limitations of the Study
Although this review provides a comprehensive overview of Google Earth Engine (GEE)-based Land Use and Land Cover (LULC) research, it is important to acknowledge several limitations for transparency, clarity, and accuracy. First, the scope of the literature search was intentionally limited to studies that explicitly mentioned “Google Earth Engine” and “Land Use and Land Cover” in their titles, abstracts, or keywords. This careful focus ensured thematic consistency but might have excluded relevant works that used broader or alternative keywords, such as “land use” or “land cover” individually, or those that discussed LULC analysis indirectly. Second, the inclusion criteria were limited to Q1 and Q2 peer-reviewed journals indexed in Google Scholar, Scopus, and the Web of Science databases. This approach emphasized methodological rigor and reproducibility but may have overlooked valuable insights from Q3 and Q4 journals, conference proceedings, and gray literature. Third, although the initial database search yielded over 110 papers, only 72 were retained after applying relevance and quality filters. This sample size constraint reflects a trade-off between analytical depth and comprehensive coverage, which may cause us to overlook region-specific or exploratory studies, as well as valuable research not included in our search criteria. Fourth, bibliometric and reporting inconsistencies among journals, especially differences in author-provided keywords, metadata accuracy, and citation indexing, may have affected the accuracy of the trend analysis and keyword mapping. Finally, the review reflects the state of research up to February 2025, meaning that subsequent publications and evolving analytical frameworks are not captured. Future meta-analyses should therefore consider expanding the search window and keyword set to include newly emerging GEE-LULC applications and methodological innovations.
Recognizing these limitations enhances the credibility and reliability of this review by providing a balanced view of its analytical scope. It also highlights opportunities for future researchers to expand on this work through wider search strategies, inclusion of multidisciplinary sources, and updated bibliometric analyses. Despite these limitations, the insights presented in this review establish a solid foundation for understanding current progress in GEE-based LULC research and serve as a springboard for future methodological and thematic developments discussed in the concluding section.
7. Conclusions
This review has provided a comprehensive synthesis of Google Earth Engine (GEE)-based Land Use and Land Cover (LULC) research published between 2016 and February 2025, bridging the gap between earlier platform-focused reviews and recent application-specific studies. By systematically analyzing 72 selected articles, we highlight the evolution of GEE as a cornerstone of geospatial research, confirming its widespread role in environmental monitoring, urbanization studies, and land management. Our findings demonstrate that Landsat and Sentinel remain the dominant data sources, while Random Forest (RF) and Support Vector Machines (SVM) continue to be the most widely adopted classification methods. At the same time, the increasing use of advanced approaches such as Classification and Regression Trees (CART), deep learning, and hybrid machine learning reflects a methodological diversification that aligns with GEE’s growing analytical capabilities.
Geographically, contributions are highly concentrated in China and India, underscoring both regional leadership and a broader trend toward global adoption. The surge in publications after 2020 reflects a maturing research landscape, with an increasing focus on urban expansion, wetland monitoring, and climate-related applications. Despite these advances, significant challenges remain. Memory constraints, cloud cover in optical data, and the platform’s restricted implementation of deep learning models compared to local GPU environments limit the scalability and accuracy of some analyses. Moreover, the scarcity of labeled data, particularly in regions with limited annotation resources, continues to restrict the generalization of classification models.
In response to these limitations, this review emphasizes several promising directions. Batch and tiling strategies within GEE can address memory challenges, while radar data such as Sentinel-1 can complement optical imagery in cloud-prone regions. Hybrid workflows that combine GEE’s scalable data access with local GPU training environments offer pathways for integrating advanced machine learning models. Notably, recent advances in few-shot semantic segmentation provide a vital opportunity to address data scarcity by enabling models to learn from limited samples and generalize to new classes, further enhancing the global applicability of GEE for LULC research.
By consolidating recent trends, methodological advances, and persistent challenges, this review provides a dedicated synthesis of GEE–LULC research from 2016 to 2025. It offers researchers and practitioners a transparent, critical, and forward-looking reference to guide future studies, ensuring that the transformative potential of GEE is realized in addressing LULC research and urgent environmental and societal challenges worldwide.
Author Contributions
Conceptualization, Bader Alshehri and Zhenyu Zhang; methodology, Bader Alshehri and Zhenyu Zhang; data collection and analysis, Bader Alshehri and Xiaoye Liu; writing—original draft preparation, Bader Alshehri; review and refinement, Zhenyu Zhang and Xiaoye Liu; editing, Bader Alshehri; supervision, Zhenyu Zhang and Xiaoye Liu. All authors have read and agreed to the published version of the manuscript.
Funding
This research received no external funding.
Data Availability Statement
The data supporting the findings of this study are available from the first author upon reasonable request.
Conflicts of Interest
The authors declare no conflicts of interest.
Abbreviations
The following abbreviations are used in this manuscript:
| AI | Artificial Intelligence |
| ALOS | Advanced Land Observing Satellite |
| ANN | Artificial Neural Networks |
| APIs | Application Programming Interfaces |
| AWS | Amazon Web Services |
| CART | Classification and Regression Tree |
| DL | Deep Learning |
| FCNN | Fully Convolutional Neural Networks |
| GEE | Google Earth Engine |
| GPU | Graphics Processing Unit |
| GWR | Geographically Weighted Regression |
| InVEST | Integrated Valuation of Ecosystem Services and Tradeoffs |
| LSMA | Linear Spectral Mixture Analysis |
| LST | Land Surface Temperature |
| LULC | Land Use and Land Cover |
| ML | Machine Learning |
| MLH | Maximum Likelihood Algorithm |
| MLPNN | Multilayer Perceptron Neural Network |
| MLR | Multiple Linear Regression |
| MODIS | Moderate Resolution Imaging Spectroradiometer |
| NAIP | National Agriculture Imagery Program |
| NDBI | Normalized Difference Built-up Index |
| NDVI | Normalized Difference Vegetation Index |
| NDWI | Normalized Difference Water Index |
| NOAA | National Oceanic and Atmospheric Administration |
| NRT | Near Real-Time |
| NUACI | Normalized Urban Areas Composite Index |
| RF | Random Forest |
| RUESVMs | Random Under-sampling Ensemble of Support Vector Machines |
| SAR | Synthetic Aperture Radar |
| SNIC | Simple Non-Iterative Clustering |
| SVM | Support Vector Machine |
| TWINNS | TWIn Neural Networks for Sentinel data |
Appendix A
Table A1.
Scope and main findings of previous review articles on the GEE topic.
Table A1.
Scope and main findings of previous review articles on the GEE topic.
| Study | Scope | Main Findings |
| (Gorelick et al., 2017) [11] | A comprehensive analysis was conducted on multiple factors of GEE, involving its data catalog, system structure, functionalities, data dissemination mechanisms, efficiency, applications, and reported challenges. | Provided a summary of frequently used datasets in Google Earth Engine’s data catalog. Discussed a simplified system architecture diagram. The paper illustrates a summary of Google Earth Engine functions. Examined GEE System modeling, structure, and performance assessment. Evaluate the data dissemination procedure and approaches. The paper discussed future directions and challenges in utilizing GEE as a valuable tool for analyzing global issues. |
| (Kumar & Mutanga, 2018) [47] | Conducted an intensive analysis of usage patterns on the GEE platform, focusing on determining its adoption by researchers in developing countries. | The highest number of articles was published in the journals “Remote Sensing”, followed by “Remote Sensing of Environment”. A wide range of applications was conducted, involving different areas of research such as forestry and vegetation, as well as investigating various medical diseases such as Malaria. The most widely utilized data in the research were Landsat imagery datasets. GEE usage was primarily associated with institutions located in developed countries, and most study sites were also situated in these regions. A limited number of publications were conducted by institutions located in less developed nations. |
| (Mutanga & Kumar, 2019) [25] | This special issue, authored by experts in the field, illustrates 22 papers that examine key applications of Google Earth Engine (GEE). The topics covered included vegetation applications and mapping, land-cover changes, agricultural and disaster management, as well as various areas within related disciplines. | The practical implementation of GEE across a range of applications. GEE is capable of processing large datasets at different scales and developing automated models suitable for operational use. There was a higher level of GEE usage in developed countries compared to developing regions such as Africa. Landsat was recognized as the most extensively utilized dataset. |
| (Tamiminia et al., 2020) [14] | A review was conducted on 349 scientific papers that utilized GEE as a leading platform, evaluating various factors including the datasets and satellite sensors used, areas of interest, data resolutions, applications, methodologies, and analytical strategies. | Demonstrated and discussed a wide range of GEE-related papers in different disciplines, such as urbanization studies and environmental challenges at both national and worldwide levels. Remotely sensed data were employed in 90% of the reviewed articles, while the remaining 10% relied on pre-processed or pre-existing datasets for their research. Landsat imagery datasets with moderate spatial resolution were intensively utilized. The most commonly applied techniques for processing utilized datasets were Random Forest and Linear Regression Algorithms. The normalized difference vegetation index (NDVI) was used in 27% of the reviewed articles for vegetation, crop, and land-cover analysis, as well as for research on drought and desertification. The results of this study demonstrate that GEE has achieved remarkable advancements in tackling global challenges related to geospatial data processing. |
| (Amani et al., 2020) [12] | Examined 450 scientific papers focusing on various applications of the GEE platform, including its capabilities, datasets, functionalities, benefits, challenges, and diverse aspects of applications. | Landsat and Sentinel datasets have been extensively utilized by users of Google Earth Engine (GEE). Data classification frequently employs supervised machine learning algorithms, with Random Forest (RF) being a commonly used example. The intensive use of GEE covers a broad range of applications, including land use and land cover (LULC) analysis, hydrological studies, urbanization modeling, disaster monitoring, global warming assessment, and various data processing tasks. Recent years have witnessed a notable rise in GEE-related publications. In the future, it is expected that an even broader range of users from diverse disciplines will adopt GEE to undertake their challenges in big data processing. |
| (Q. Zhao et al., 2021) [7] | A comprehensive review analysis was conducted on the applications and evolving trends of Google Earth (GE) and Google Earth Engine (GEE), focusing on scientific papers published up to January 2021. | Over the 14 years from 2006 to 2020, the number of publications that employed GE and GEE increased from 2 to 530, marking a significant growth in the research interest in GE and GEE. Compared to GEE, GE research spanned various disciplines of study, including biology, education, health, and economics, and was published in a broader range of scientific journals. Keywords such as “land cover”, “water”, “model”, “vegetation”, and “forest” were commonly used in both studies related to GE and GEE. Publications from the United States, China, and the United Kingdom were among the top countries that utilized GE and GEE as a significant tool in the research field, driving a considerable portion of research and applications. GEE serves as a crucial tool for analysis, while GE has primarily been used as a supporting tool for visualization. |
| (Yang et al., 2022) [15] | A systematic review on integrating AI methods with Google Earth Engine (GEE). This paper analyzed 200 articles that combined GEE with AI, focusing on its applications and the techniques utilized in remote sensing and geospatial analysis. | The number of studies integrating GEE and AI has significantly increased since 2019, illustrating the potential of this combination for various aspects of geospatial analysis. GEE and AI were integrated in various fields of research, including yield mapping, land use land cover (LULC) analysis, vegetation and wetland mapping, water body classification, and forest monitoring. Machine learning (ML) was the dominant approach, with Random Forest (RF) and Support Vector Machines (SVM) being the most used algorithms. This paper highlights the capability of integrating GEE and AI for analyzing vast amounts of geospatial datasets. It identifies future research directions to enhance the reliability and effectiveness of this integration. |
| (Pham-Duc et al., 2023) [13] | This study examined the trends and key applications of Google Earth Engine (GEE) in remote sensing and Earth science research through a bibliometric review analysis of 1995 scientific papers up to December 2022. | GEE-related research has increased in recent years, with about 85% of papers being published in the last three years. GEE’s studies are primarily focused on various fields of research, such as land studies, environmental management, biological research, global warming, hydrological studies, and agricultural mapping. Researchers from China and the United States have contributed the highest number of publications related to GEE studies. While the “Remote Sensing” journal published the most articles, “Remote Sensing of Environment” gained the most citations, indicating their significant impact in geospatial research. Landsat data was recognized as the most significantly used dataset. The most frequently employed ML algorithms were Random Forest (RF), Support Vector Machines (SVM), and decision trees. |
| (Jangid et al., 2023) [59] | Examined the most popular techniques used by researchers to conduct land use land cover (LULC) classification with the integration of Google Earth Engine (GEE) and Machine Learning (ML) algorithms, and presented challenges and guidelines for future research. | The paper discussed the effectiveness of machine learning algorithms such as Random Forest (RF), Support Vector Machine (SVM), and CART in LULC classification. The article highlighted several challenges in LULC classification, including data quality, selecting the appropriate algorithms, and the necessity of using an accurate training sample for Machine Learning (ML) models. This paper demonstrates the potential of integrating GEE and ML algorithms for conducting accurate LULC classification and analysis. |
| (Velastegui-Montoya et al., 2023) [20] | A comprehensive review analysis was conducted on GEE-related publications. The process consisted of four phases: selecting search criteria, collecting data from 2011 to 2022, reviewing the published articles using bibliometric tools, and analyzing the results. | The leading research contributors on utilizing, visualizing, and processing geospatial data on GEE were researchers from China and the United States. GEE-related research has experienced a significant rise, with 2800 papers published between 2011 and 2022, and researchers from 125 countries worldwide have contributed to the field. GEE is applied in various fields of research, including land studies, environmental monitoring, disaster management, agriculture, biology, and engineering. The co-citation analysis highlighted the relationships among researchers who have utilized GEE in their studies. GEE is recognized as a valuable tool with a wide range of applications across multiple disciplines. |
| (Pérez-Cutillas et al., 2023) [10] | The study conducted a systematic review and meta-analysis on 343 scientific papers published between 2020 and 2022 to understand the evolution of GEE research, identifying its applications, trends, potential, datasets used, and analytical methodologies applied. | The most popular satellite dataset used in GEE-related publications was Landsat 8 data, with 25% of the studies. The Random Forest (RF) algorithm was the most applied approach to conduct data classifications in 31% of the reviewed studies. Water sources evaluation and forecasting were the most frequent methodological applications. Despite the recent global significance of the COVID-19 pandemic, few articles have addressed the pandemic. Researchers from China, the United States, and India conducted the highest percentage of publications. In terms of citation impact, “Remote Sensing” and “Remote Sensing of Environment” journals were the top publishers. Random Forest (RF) algorithm and agriculture research were the most cited. |
Table A2.
The main reported limitations of GEE.
Table A2.
The main reported limitations of GEE.
| Limitation | Description |
| Data & Processing Challenges | Cloud cover and Data Gaps: Cloud cover is a challenge for datasets such as Landsat, creating gaps in data that can limit its usefulness in regions with frequent cloud cover [15,64,69]. Resolution Limitations: The resolution of imagery used in GEE can cause difficulties in detecting small-scale features, especially in built-up areas near dense vegetation [68,72]. Fixed Computing Constraints: Unlike local models, where users have complete control over computing resources, GEE enforces fixed platform-based constraints, which limit flexibility, especially for simulations at finer scales [58]. Lack of User Control over Data Chunking: GEE does not allow users to define chunk sizes for efficient data storage and computation, which can impact performance, especially with large datasets [69]. |
| Computational & Performance Constraints | Memory Constraints: GEE has memory limitations when handling large datasets [15,63,64]. GEE API Limitations: The existing image analysis tools are restricted within the GEE’s API. Standard preprocessing methods like atmospheric correction are not yet implemented [12]. Users require in-depth knowledge of GEE’s algorithms and cloud-based computing performance for custom tool development [7,14]. Computation Effort Increases with Dataset Size: The processing time in GEE increases significantly with larger datasets, particularly when dealing with high-resolution or large-scale time-series data, taking a long time to process [7,14,69]. |
| Analytical & Methodological Challenges | Noise in Classification: RF classification, as the most frequent and widely used method within GEE, may produce random noise due to its pixel-oriented nature, which can lead to inaccurate boundaries and finer classification results [67]. GEE lacks efficient segmentation algorithms for object-based image analysis, and this may be considered a technical limitation in the platform [12,47]. Training Samples: Users are restricted by the number of training samples and input features that can be used for classification purposes [7,12]. Supporting Spatio-Temporal Analysis: GEE has a challenge with handling spatial and temporal analyses together in a seamless manner, which limits its usability for some studies [69]. Data Mining Models: GEE’s data mining tools are limited, with a few classification algorithms like CART, RF, and SVM [7,12]. Deep Learning Integration: GEE was linked to only TensorFlow Deep Learning algorithm in 2019, and it can be accessed for analysis and classification purposes in the GEE platform, while other Deep Learning models cannot be directly implemented in GEE [7,14,15]. This can be considered a limitation in the GEE platform and could be enhanced by connecting more Machine Learning models and making them available for users. |
| Integration & Collaboration Issues | Multi-User Collaboration Challenges: GEE has limitations in supporting multi-user collaboration, making it difficult for multiple users to work on shared projects effectively [61]. Multi-Source Data Integration: GEE faces challenges when improving spatial resolution (e.g., from 1 km to 30 m), mainly due to issues with data availability, multi-source data interoperability, and computational requirements [58]. |
| Security & Privacy concerns | Data is stored on private company servers, which raises privacy concerns for many governmental agencies and private companies [7,12]. |
References
- Bathe, K.D.; Patil, N.S. Assessment of Land Use-Land Cover Dynamics and Its Future Projection through Google Earth Engine, Machine Learning and QGIS-MOLUSCE: A Case Study in Jagatsinghpur District, Odisha, India. J. Earth Syst. Sci. 2024, 133, 111. [Google Scholar] [CrossRef]
- Chi, M.; Plaza, A.; Benediktsson, J.A.; Sun, Z.; Shen, J.; Zhu, Y. Big Data for Remote Sensing: Challenges and Opportunities. Proc. IEEE 2016, 104, 2207–2219. [Google Scholar] [CrossRef]
- Sulova, A.; Jokar Arsanjani, J. Exploratory Analysis of Driving Force of Wildfires in Australia: An Application of Machine Learning within Google Earth Engine. Remote Sens. 2020, 13, 10. [Google Scholar] [CrossRef]
- Venter, Z.S.; Barton, D.N.; Chakraborty, T.; Simensen, T.; Singh, G. Global 10 m Land Use Land Cover Datasets: A Comparison of Dynamic World, World Cover and Esri Land Cover. Remote Sens. 2022, 14, 4101. [Google Scholar] [CrossRef]
- Atesoglu, A.; Ozel, H.B.; Varol, T.; Cetin, M.; Baysal, B.U.; Bulut, F.S. Monitoring Land Cover/Use Conversions in Türkiye Wetlands Using Collect Earth. J. Indian Soc. Remote Sens. 2025, 53, 1979–1994. [Google Scholar] [CrossRef]
- Lin, L.; Hao, Z.; Post, C.J.; Mikhailova, E.A.; Yu, K.; Yang, L.; Liu, J. Monitoring Land Cover Change on a Rapidly Urbanizing Island Using Google Earth Engine. Appl. Sci. 2020, 10, 7336. [Google Scholar] [CrossRef]
- Zhao, Q.; Yu, L.; Li, X.; Peng, D.; Zhang, Y.; Gong, P. Progress and Trends in the Application of Google Earth and Google Earth Engine. Remote Sens. 2021, 13, 3778. [Google Scholar] [CrossRef]
- Brown, C.F.; Brumby, S.P.; Guzder-Williams, B.; Birch, T.; Hyde, S.B.; Mazzariello, J.; Czerwinski, W.; Pasquarella, V.J.; Haertel, R.; Ilyushchenko, S.; et al. Dynamic World, Near Real-Time Global 10 m Land Use Land Cover Mapping. Sci. Data 2022, 9, 251. [Google Scholar] [CrossRef]
- Liu, X.; Hu, G.; Chen, Y.; Li, X.; Xu, X.; Li, S.; Pei, F.; Wang, S. High-Resolution Multi-Temporal Mapping of Global Urban Land Using Landsat Images Based on the Google Earth Engine Platform. Remote Sens. Environ. 2018, 209, 227–239. [Google Scholar] [CrossRef]
- Pérez-Cutillas, P.; Pérez-Navarro, A.; Conesa-García, C.; Zema, D.A.; Amado-Álvarez, J.P. What Is Going on within Google Earth Engine? A Systematic Review and Meta-Analysis. Remote Sens. Appl. Soc. Environ. 2023, 29, 100907. [Google Scholar] [CrossRef]
- Gorelick, N.; Hancher, M.; Dixon, M.; Ilyushchenko, S.; Thau, D.; Moore, R. Google Earth Engine: Planetary-Scale Geospatial Analysis for Everyone. Remote Sens. Environ. 2017, 202, 18–27. [Google Scholar] [CrossRef]
- Amani, M.; Ghorbanian, A.; Ahmadi, S.A.; Kakooei, M.; Moghimi, A.; Mirmazloumi, S.M.; Moghaddam, S.H.A.; Mahdavi, S.; Ghahremanloo, M.; Parsian, S.; et al. Google Earth Engine Cloud Computing Platform for Remote Sensing Big Data Applications: A Comprehensive Review. IEEE J. Sel. Top. Appl. Earth Obs. Remote Sens. 2020, 13, 5326–5350. [Google Scholar] [CrossRef]
- Pham-Duc, B.; Nguyen, H.; Phan, H.; Tran-Anh, Q. Trends and Applications of Google Earth Engine in Remote Sensing and Earth Science Research: A Bibliometric Analysis Using Scopus Database. Earth Sci. Inform. 2023, 16, 2355–2371. [Google Scholar] [CrossRef]
- Tamiminia, H.; Salehi, B.; Mahdianpari, M.; Quackenbush, L.; Adeli, S.; Brisco, B. Google Earth Engine for Geo-Big Data Applications: A Meta-Analysis and Systematic Review. ISPRS J. Photogramm. Remote Sens. 2020, 164, 152–170. [Google Scholar] [CrossRef]
- Yang, L.; Driscol, J.; Sarigai, S.; Wu, Q.; Chen, H.; Lippitt, C.D. Google Earth Engine and Artificial Intelligence (AI): A Comprehensive Review. Remote Sens. 2022, 14, 3253. [Google Scholar] [CrossRef]
- Binh, N.A.; Nhut, H.S.; An, N.N.; Phuong, T.A.; Hanh, N.C.; Thao, G.T.P.; Pham, T.T.; Hong, P.V.; Ha, L.T.T.; Bui, D.T.; et al. Thirty-Year Dynamics of LULC at the Dong Thap Muoi Area, Southern Vietnam, Using Google Earth Engine. ISPRS Int. J. Geo-Inf. 2021, 10, 226. [Google Scholar] [CrossRef]
- Hird, J.; DeLancey, E.; McDermid, G.; Kariyeva, J. Google Earth Engine, Open-Access Satellite Data, and Machine Learning in Support of Large-Area Probabilistic Wetland Mapping. Remote Sens. 2017, 9, 1315. [Google Scholar] [CrossRef]
- Amaefuna, R.O.; Chukwudi, D.O. Analysis Of Land Use And Land Cover Changes In Port Harcourt Metropolis Using Geospatial Techniques. IOSR J. Environ. Sci. Toxicol. Food Technol. 2024, 18, 38–44. [Google Scholar] [CrossRef]
- Felix Justiniano, E.; Rodrigues Dos Santos Junior, E.; Malheiros De Melo, B.; Victor Nascimento Siqueira, J.; Gomes Morato, R.; Fantin, M.; Cesar Pedrassoli, J.; Roberto Martines, M.; Shinji Kawakubo, F. Proposal for an Index of Roads and Structures for the Mapping of Non-Vegetated Urban Surfaces Using OSM and Sentinel-2 Data. Int. J. Appl. Earth Obs. Geoinf. 2022, 109, 102791. [Google Scholar] [CrossRef]
- Velastegui-Montoya, A.; Montalván-Burbano, N.; Carrión-Mero, P.; Rivera-Torres, H.; Sadeck, L.; Adami, M. Google Earth Engine: A Global Analysis and Future Trends. Remote Sens. 2023, 15, 3675. [Google Scholar] [CrossRef]
- Al-Dousari, A.E.; Mishra, A.; Singh, S. Land Use Land Cover Change Detection and Urban Sprawl Prediction for Kuwait Metropolitan Region, Using Multi-Layer Perceptron Neural Networks (MLPNN). Egypt. J. Remote Sens. Space Sci. 2023, 26, 381–392. [Google Scholar] [CrossRef]
- Goldblatt, R.; You, W.; Hanson, G.; Khandelwal, A. Detecting the Boundaries of Urban Areas in India: A Dataset for Pixel-Based Image Classification in Google Earth Engine. Remote Sens. 2016, 8, 634. [Google Scholar] [CrossRef]
- Gurbuz, M.; Cilek, A. Analysis of urban land use change using remote sensing and different change detection techniques: The case of Ankara province. Int. Arch. Photogramm. Remote Sens. Spat. Inf. Sci. 2023, XLVIII-M-1–2023, 515–520. [Google Scholar] [CrossRef]
- Liang, J.; Chen, C.; Song, Y.; Sun, W.; Yang, G. Long-Term Mapping of Land Use and Cover Changes Using Landsat Images on the Google Earth Engine Cloud Platform in Bay Area—A Case Study of Hangzhou Bay, China. Sustain. Horiz. 2023, 7, 100061. [Google Scholar] [CrossRef]
- Mutanga, O.; Kumar, L. Google Earth Engine Applications. Remote Sens. 2019, 11, 591. [Google Scholar] [CrossRef]
- Cao, X.; Gao, X.; Shen, Z.; Li, R. Expansion of Urban Impervious Surfaces in Xining City Based on GEE and Landsat Time Series Data. IEEE Access 2020, 8, 147097–147111. [Google Scholar] [CrossRef]
- Khachoo, Y.H.; Cutugno, M.; Robustelli, U.; Pugliano, G. Impact of Land Use and Land Cover (LULC) Changes on Carbon Stocks and Economic Implications in Calabria Using Google Earth Engine (GEE). Sensors 2024, 24, 5836. [Google Scholar] [CrossRef]
- Liu, Z.; Han, Y.; Zhu, R.; Qu, C.; Zhang, P.; Xu, Y.; Zhang, J.; Zhuang, L.; Wang, F.; Huang, F. Spatio-Temporal Land-Use/Cover Change Dynamics Using Spatiotemporal Data Fusion Model and Google Earth Engine in Jilin Province, China. Land 2024, 13, 924. [Google Scholar] [CrossRef]
- Çolak, E.; Chandra, M.; Sunar, F. The use of multi-temporal sentinel Satellitesin the analysis of land cover/land use Changescaused by the nuclear power plant construction. Int. Arch. Photogramm. Remote Sens. Spat. Inf. Sci. 2019, XLII-3/W8, 491–495. [Google Scholar] [CrossRef]
- Capolupo, A. Improving the Accuracy of Global DEM of Differences (DoD) in Google Earth Engine for 3-D Change Detection Analysis. IEEE J. Sel. Top. Appl. Earth Obs. Remote Sens. 2021, 14, 12332–12347. [Google Scholar] [CrossRef]
- Cloud-Based Remote Sensing with Google Earth Engine: Fundamentals and Applications; Cardille, J.A., Crowley, M.A., Saah, D., Clinton, N.E., Eds.; Springer International Publishing: Cham, Switzerland, 2024; ISBN 978-3-031-26587-7. [Google Scholar]
- Chen, D.; Wang, Y.; Shen, Z.; Liao, J.; Chen, J.; Sun, S. Long Time-Series Mapping and Change Detection of Coastal Zone Land Use Based on Google Earth Engine and Multi-Source Data Fusion. Remote Sens. 2021, 14, 1. [Google Scholar] [CrossRef]
- Fentaw, A.E.; Abegaz, A. Analyzing Land Use/Land Cover Changes Using Google Earth Engine and Random Forest Algorithm and Their Implications to the Management of Land Degradation in the Upper Tekeze Basin, Ethiopia. Sci. World J. 2024, 2024, 3937558. [Google Scholar] [CrossRef] [PubMed]
- Li, X.; Gong, P.; Zhou, Y.; Wang, J.; Bai, Y.; Chen, B.; Hu, T.; Xiao, Y.; Xu, B.; Yang, J.; et al. Mapping Global Urban Boundaries from the Global Artificial Impervious Area (GAIA) Data. Environ. Res. Lett. 2020, 15, 094044. [Google Scholar] [CrossRef]
- Naboureh, A.; Ebrahimy, H.; Azadbakht, M.; Bian, J.; Amani, M. RUESVMs: An Ensemble Method to Handle the Class Imbalance Problem in Land Cover Mapping Using Google Earth Engine. Remote Sens. 2020, 12, 3484. [Google Scholar] [CrossRef]
- Atef, I.; Ahmed, W.; Abdel-Maguid, R.H. Modelling of Land Use Land Cover Changes Using Machine Learning and GIS Techniques: A Case Study in El-Fayoum Governorate, Egypt. Environ. Monit. Assess. 2023, 195, 637. [Google Scholar] [CrossRef]
- Awad, M. Google Earth Engine (GEE) Cloud Computing Based Crop Classification Using Radar, Optical Images and Support Vector Machine Algorithm (SVM). In Proceedings of the 2021 IEEE 3rd International Multidisciplinary Conference on Engineering Technology (IMCET), Beirut, Lebanon, 8–10 December 2021; pp. 71–76. [Google Scholar]
- Hasan, S.H.; AL-Hameedawi, A.N.M.; Ismael, H.S. Supervised Classification Model Using Google Earth Engine Development Environment for Wasit Governorate. IOP Conf. Ser. Earth Environ. Sci. 2022, 961, 012051. [Google Scholar] [CrossRef]
- Johnson, B.A.; Iizuka, K.; Bragais, M.A.; Endo, I.; Magcale-Macandog, D.B. Employing Crowdsourced Geographic Data and Multi-Temporal/Multi-Sensor Satellite Imagery to Monitor Land Cover Change: A Case Study in an Urbanizing Region of the Philippines. Comput. Environ. Urban Syst. 2017, 64, 184–193. [Google Scholar] [CrossRef]
- Kaya, Z.; Dervisoglu, A. Determination of Urban Areas Using Google Earth Engine and Spectral Indices; Esenyurt Case Study. Int. J. Environ. Geoinformatics 2023, 10, 1–8. [Google Scholar] [CrossRef]
- Magidi, J.; Ahmed, F. Assessing Urban Sprawl Using Remote Sensing and Landscape Metrics: A Case Study of City of Tshwane, South Africa (1984–2015). Egypt. J. Remote Sens. Space Sci. 2019, 22, 335–346. [Google Scholar] [CrossRef]
- Amiren, M.; Nazhifah, S.A.; Rusdi, M.; Misbullah, A. Comparison of Support Vector Machine and Random Forest Methods on Sentinel-2A Imagery for Land Cover Identification in Banda Aceh City Using Google Earth Engine. Indones. J. Comput. Sci. 2024, 13, 9121–9133. [Google Scholar] [CrossRef]
- Tesfaye, W.; Elias, E.; Warkineh, B.; Tekalign, M.; Abebe, G. Modeling of Land Use and Land Cover Changes Using Google Earth Engine and Machine Learning Approach: Implications for Landscape Management. Environ. Syst. Res. 2024, 13, 31. [Google Scholar] [CrossRef]
- Yan, X.; Wang, J. Dynamic Monitoring of Urban Built-up Object Expansion Trajectories in Karachi, Pakistan with Time Series Images and the LandTrendr Algorithm. Sci. Rep. 2021, 11, 23118. [Google Scholar] [CrossRef] [PubMed]
- Kazemi Garajeh, M.; Haji, F.; Tohidfar, M.; Sadeqi, A.; Ahmadi, R.; Kariminejad, N. Spatiotemporal Monitoring of Climate Change Impacts on Water Resources Using an Integrated Approach of Remote Sensing and Google Earth Engine. Sci. Rep. 2024, 14, 5469. [Google Scholar] [CrossRef]
- Kolli, M.K.; Opp, C.; Karthe, D.; Groll, M. Mapping of Major Land-Use Changes in the Kolleru Lake Freshwater Ecosystem by Using Landsat Satellite Images in Google Earth Engine. Water 2020, 12, 2493. [Google Scholar] [CrossRef]
- Kumar, L.; Mutanga, O. Google Earth Engine Applications Since Inception: Usage, Trends, and Potential. Remote Sens. 2018, 10, 1509. [Google Scholar] [CrossRef]
- Mohiuddin, G.; Mund, J.-P.; Rahaman, K.J. Detection of Urban Expansion Using the Indices-Based Built-Up Index Derived from Landsat Imagery in Google Earth Engine. GI_Forum 2023, 1, 18–31. [Google Scholar] [CrossRef]
- Amini, S.; Saber, M.; Rabiei-Dastjerdi, H.; Homayouni, S. Urban Land Use and Land Cover Change Analysis Using Random Forest Classification of Landsat Time Series. Remote Sens. 2022, 14, 2654. [Google Scholar] [CrossRef]
- Chang, Y.; Hou, K.; Li, X.; Zhang, Y.; Chen, P. Review of Land Use and Land Cover Change Research Progress. IOP Conf. Ser. Earth Environ. Sci. 2018, 113, 012087. [Google Scholar] [CrossRef]
- Demessie, S.F.; Dile, Y.T.; Bedadi, B.; Tarkegn, T.G.; Bayabil, H.K.; Sintayehu, D.W. Assessing and Projecting Land Use Land Cover Changes Using Machine Learning Models in the Guder Watershed, Ethiopia. Environ. Chall. 2025, 18, 101074. [Google Scholar] [CrossRef]
- Gautam, L.; Rai, R. Land Use and Land Cover Change Analysis Using Google Earth Engine in Manamati Watershed of Kathmandu District, Nepal. Third Pole J. Geogr. Educ. 2022, 22, 49–60. [Google Scholar] [CrossRef]
- Loukika, K.N.; Keesara, V.R.; Sridhar, V. Analysis of Land Use and Land Cover Using Machine Learning Algorithms on Google Earth Engine for Munneru River Basin, India. Sustainability 2021, 13, 13758. [Google Scholar] [CrossRef]
- Parida, B.R.; Tiwari, S.; Dwivedi, C.S.; Pandey, A.C.; Singh, B.; Behera, M.D.; Kumar, N. Comparative Assessment of Satellite-Based Models through Planetscope and Landsat-8 for Determining Physico-Chemical Water Quality Parameters in Varuna River (India). Appl. Water Sci. 2025, 15, 55. [Google Scholar] [CrossRef]
- Ravanelli, R.; Nascetti, A.; Cirigliano, R.V.; Di Rico, C.; Leuzzi, G.; Monti, P.; Crespi, M. Monitoring the Impact of Land Cover Change on Surface Urban Heat Island through Google Earth Engine: Proposal of a Global Methodology, First Applications and Problems. Remote Sens. 2018, 10, 1488. [Google Scholar] [CrossRef]
- Selka, I.; Mokhtari, A.; Tabet Aoul, K.; Bengusmia, D.; Kacemi, M.; Djebbar, K. Assessing the Impact of Land Use and Land Cover Changes on Surface Temperature Dynamics Using Google Earth Engine: A Case Study of Tlemcen Municipality, Northwestern Algeria (1989–2019). ISPRS Int. J. Geo-Inf. 2024, 13, 237. [Google Scholar] [CrossRef]
- Stamou, A.; Dosiou, A.; Bakousi, A.; Karachaliou, E.; Tavantzis, I.; Stylianidis, E. Assessing Spatial Correlations Between Land Cover Types and Land Surface Temperature Trends Using Vegetation Index Techniques in Google Earth Engine: A Case Study of Thessaloniki, Greece. Remote Sens. 2025, 17, 403. [Google Scholar] [CrossRef]
- Meng, X.; Hu, G.; Li, M.; Yao, Y.; Li, X. An Online Tool with Google Earth Engine and Cellular Automata for Seamlessly Simulating Global Urban Expansion at High Resolutions. Int. J. Geogr. Inf. Sci. 2025, 39, 231–253. [Google Scholar] [CrossRef]
- Jangid, A.; Gupta, M.K.; Shrivastava, V. Techniques and Challenges of the Machine Learning Method for Land Use/Land Cover (LU/LC) Classification in Remote Sensing Using the Google Earth Engine. Int. J. Recent Innov. Trends Comput. Commun. 2023, 11, 85–92. [Google Scholar] [CrossRef]
- Kuang, W.; Hou, Y.; Dou, Y.; Lu, D.; Yang, S. Mapping Global Urban Impervious Surface and Green Space Fractions Using Google Earth Engine. Remote Sens. 2021, 13, 4187. [Google Scholar] [CrossRef]
- Arévalo, P.; Bullock, E.L.; Woodcock, C.E.; Olofsson, P. A Suite of Tools for Continuous Land Change Monitoring in Google Earth Engine. Front. Clim. 2020, 2, 576740. [Google Scholar] [CrossRef]
- Phan, T.N.; Kuch, V.; Lehnert, L.W. Land Cover Classification Using Google Earth Engine and Random Forest Classifier—The Role of Image Composition. Remote Sens. 2020, 12, 2411. [Google Scholar] [CrossRef]
- Zhao, Z.; Islam, F.; Waseem, L.A.; Tariq, A.; Nawaz, M.; Islam, I.U.; Bibi, T.; Rehman, N.U.; Ahmad, W.; Aslam, R.W.; et al. Comparison of Three Machine Learning Algorithms Using Google Earth Engine for Land Use Land Cover Classification. Rangel. Ecol. Manag. 2024, 92, 129–137. [Google Scholar] [CrossRef]
- Ji, Q.; Liang, W.; Fu, B.; Zhang, W.; Yan, J.; Lü, Y.; Yue, C.; Jin, Z.; Lan, Z.; Li, S.; et al. Mapping Land Use/Cover Dynamics of the Yellow River Basin from 1986 to 2018 Supported by Google Earth Engine. Remote Sens. 2021, 13, 1299. [Google Scholar] [CrossRef]
- Ewunetu, A.; Abebe, G. Integrating Google Earth Engine and Random Forest for Land Use and Land Cover Change Detection and Analysis in the Upper Tekeze Basin. Earth Sci. Inform. 2025, 18, 227. [Google Scholar] [CrossRef]
- Ienco, D.; Interdonato, R.; Gaetano, R.; Ho Tong Minh, D. Combining Sentinel-1 and Sentinel-2 Satellite Image Time Series for Land Cover Mapping via a Multi-Source Deep Learning Architecture. ISPRS J. Photogramm. Remote Sens. 2019, 158, 11–22. [Google Scholar] [CrossRef]
- Cui, J.; Zhu, M.; Liang, Y.; Qin, G.; Li, J.; Liu, Y. Land Use/Land Cover Change and Their Driving Factors in the Yellow River Basin of Shandong Province Based on Google Earth Engine from 2000 to 2020. ISPRS Int. J. Geo-Inf. 2022, 11, 163. [Google Scholar] [CrossRef]
- Shafizadeh-Moghadam, H.; Khazaei, M.; Alavipanah, S.K.; Weng, Q. Google Earth Engine for Large-Scale Land Use and Land Cover Mapping: An Object-Based Classification Approach Using Spectral, Textural and Topographical Factors. GIScience Remote Sens. 2021, 58, 914–928. [Google Scholar] [CrossRef]
- Sidhu, N.; Pebesma, E.; Câmara, G. Using Google Earth Engine to Detect Land Cover Change: Singapore as a Use Case. Eur. J. Remote Sens. 2018, 51, 486–500. [Google Scholar] [CrossRef]
- Wang, J.; Liu, Y.; Zhou, Q.; Wang, Z.; Wang, F. Few-Shot Semantic Segmentation on Remote Sensing Images With Learnable Prototype. IEEE Trans. Geosci. Remote Sens. 2025, 63, 5104411. [Google Scholar] [CrossRef]
- He, X.; Liu, Y.; Zhou, Y.; Ding, H.; Zhao, J.; Liu, B.; Jiang, X. Hierarchical Relation Learning for Few-Shot Semantic Segmentation in Remote Sensing Images. IEEE Trans. Geosci. Remote Sens. 2025, 63, 1–15. [Google Scholar] [CrossRef]
- Biswas, J.; Jobaer, M.A.; Haque, S.F.; Islam Shozib, M.S.; Limon, Z.A. Mapping and Monitoring Land Use Land Cover Dynamics Employing Google Earth Engine and Machine Learning Algorithms on Chattogram, Bangladesh. Heliyon 2023, 9, e21245. [Google Scholar] [CrossRef]
Disclaimer/Publisher’s Note: The statements, opinions and data contained in all publications are solely those of the individual author(s) and contributor(s) and not of MDPI and/or the editor(s). MDPI and/or the editor(s) disclaim responsibility for any injury to people or property resulting from any ideas, methods, instructions or products referred to in the content. |
© 2025 by the authors. Published by MDPI on behalf of the International Society for Photogrammetry and Remote Sensing. Licensee MDPI, Basel, Switzerland. This article is an open access article distributed under the terms and conditions of the Creative Commons Attribution (CC BY) license (https://creativecommons.org/licenses/by/4.0/).