Abstract
The Blue Schools initiative integrates the ocean into classroom learning through project-based approaches, cultivating environmental awareness and a deeper sense of responsibility toward marine ecosystems and human–ocean interactions. Although the European Blue School initiative has grown steadily since its launch in 2020, its uneven uptake raises important questions about the territorial factors that influence certification. This study examines the spatial determinants of Blue School certification in Mallorca, Spain, where a bottom-up pilot initiative successfully certified 100 schools. Using Maximum Entropy (MaxEnt) modeling, we estimated the spatial probability of certification based on 16 geospatial variables, including proximity to Blue Economy actors, hydrological networks, transport accessibility, and socio-economic indicators. The model achieved strong predictive performance (AUC = 0.84) and revealed that features such as freshwater ecosystems, traditional economic structures, and sustainable public transport play a greater role in school engagement than coastal proximity alone. The resulting suitability map identifies over 30 high-potential, non-certified schools, offering actionable insights for targeted outreach and educational policy. This research highlights the potential of presence-only modeling to guide the strategic expansion of Blue Schools networks.
1. Introduction
Blue Schools are educational institutions committed to advancing ocean literacy (OL) and promoting sustainable practices related to both marine and freshwater environments. They play a key role in teaching students about the importance of aquatic ecosystems while encouraging active participation in conservation and sustainability initiatives. According to the European Commission and UNESCO, a Blue School “brings the ocean into the classroom” through project-based learning, fostering environmental awareness and a sense of responsibility toward marine life and human–ocean interactions [1,2]. This means that everyday subjects, from science and geography to art and history, can incorporate ocean-related topics, helping students understand our deep connection with ocean and water systems.
The Blue Schools concept builds upon earlier efforts to embed ocean themes in education. A notable foundation was the EU-funded Sea Change project (2015–2018), which positioned OL as a strategic educational objective in Europe. Through public engagement campaigns and school-based pilots, Sea Change demonstrated the potential of marine-themed learning in formal education and laid the groundwork for what would later become national and international Blue School initiatives [3].
A pivotal development in the Blue Schools movement occurred in 2017, when Portugal launched “Escola Azul”, a national Blue School program coordinated by the Directorate-General for Maritime Policy (DGPM) under the Ministry of the Sea. This initiative showcased how OL could be embedded across school curricula at scale. Built on partnerships with universities, municipalities, NGOs, and the private sector, Escola Azul created a network of stakeholders supporting teachers and students in ocean-themed projects [4]. It also proactively addressed systemic challenges that often hinder innovation in schools, such as rigid curricula and limited teacher training on new topics. Through an interdisciplinary and intercultural model, Escola Azul has contributed to improvements in OL, sustainability education, and scientific and civic engagement among students [5].
Inspired in part by the Portuguese experience, several other Blue School networks and programs have emerged in recent years globally, such as the All-Atlantic Blue Schools Network [6], and more recently the UNESCO Global Blue Schools Network [7].
1.1. The European Blue Schools Initiative
In Europe, the Blue Schools initiative was officially launched on 8 June 2020, during World Oceans Day, as part of the EU4Ocean Coalition [8]. Supported by the European Commission, this coalition brings together educators, organizations, youth groups, policymakers, and individuals to deepen the understanding of the ocean’s critical role in sustaining life on Earth. Schools participating in this network engage students in hands-on projects that connect them to the ocean, fostering sustainability and marine awareness. Schools that successfully integrate OL into their school activities receive the European Blue School Certification, recognizing their commitment to marine education.
To obtain EU Blue School Certification, schools must meet five key requirements (see Figure 1) [9]: 1. Schools must develop a well-defined, tangible outcome related to OL, such as an educational campaign, research project, awareness initiative, or exhibition showcasing students’ learning experiences. 2. They are required to implement structured projects that interconnect various marine and maritime topics, ensuring that students engage with the ocean in a comprehensive manner. 3. EU Blue School projects must also be inclusive, involving all students across different levels and subject areas to make OL accessible to the entire school community. 4. Additionally, collaboration with external organizations, including marine research institutions, environmental NGOs, or maritime businesses, is essential to providing students with real-world insights. 5. Finally, schools must effectively communicate project results, sharing their findings with the local community and beyond to foster broader engagement and awareness in OL efforts.
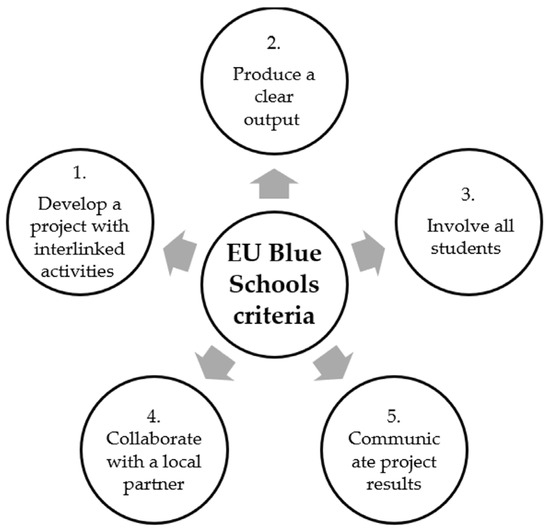
Figure 1.
Core criteria for EU Blue Schools certification as defined by the Network of EU Blue Schools. The diagram provides the policy and operational context for the projects analysed in this study.
1.2. The Case of Mallorca
While the European Blue Schools framework presents a promising approach, its adoption remained limited, with only 40 schools [10] applying for certification by the end of 2021 under a top-down strategy. This prompted the authors to explore whether bottom-up approaches might be more effective for educational institutions, given their daily operational commitments. To test this hypothesis, a grassroots strategy was implemented in a localized setting, with the island of Mallorca chosen as the pilot case. With support from the Erasmus+ program, the authors, along with two additional partners [11], initiated a pilot project aiming to certify 100 schools, equivalent to one in three schools on the island. This strategy was structured into key phases (Figure 2): conducting background research on schools through websites and social media, engaging in one-on-one outreach, facilitating school visits, developing five model Blue School projects as multipliers, supporting teachers throughout the certification process, and organizing certification events to recognize achievements.

Figure 2.
Blue Schools Project implementation approach.
The project achieved notable success, receiving formal recognition from the European Commission’s Maritime Forum [12] and being awarded “Best Project” by the WestMED Initiative [13] for its innovative and inclusive approach to fostering OL at the local level. As a result, Mallorca now accounts for approximately one in five certified European Blue Schools (see Figure 3). However, despite the success and a consistent and equal outreach strategy applied across the island, a substantial number of schools chose not to pursue certification. This uneven uptake highlights an important research question: “What territorial and institutional factors influence a school’s decision to engage with the Blue Schools program?”.
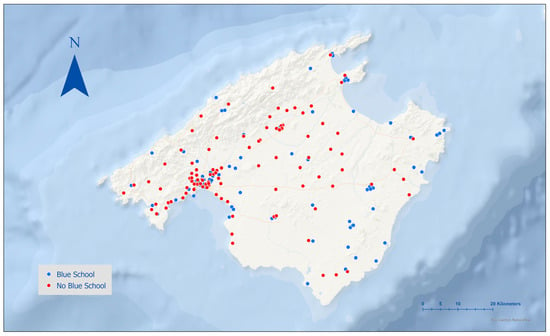
Figure 3.
Distribution of schools in Mallorca included in the study. Certified EU Blue Schools are shown in blue, while non-certified schools are shown in red. This baseline map highlights the geographic spread of schools across both coastal and inland municipalities.
1.3. Exploring Factors for Blue School Certification: Towards a Place-Based Understanding
1.3.1. Limited Research on Territorial Factors
Despite the growing visibility of the Blue Schools movement, the territorial factors influencing certification remain insufficiently studied. While the initiative promotes inclusive OL across diverse contexts, from coastal to inland schools [9], existing research has largely focused on school-level dynamics, such as teacher motivation [14,15], students’ [16] and teachers’ OL knowledge level, barriers to teach OL in schools [17], or curricular integration [18,19].
A case study from the Azores highlights Blue School participation but primarily focuses on teachers’ awareness and the limited classroom integration of ocean literacy [20]. Another study examining ocean literacy levels among students in three Mediterranean countries notes the presence of Blue School projects, yet the emphasis remains on student knowledge gaps rather than spatial determinants of school participation [21].
The ProBleu methodology supports school engagement through citizen science and peer-based mentoring strategies, promoting inclusivity and capacity-building within the network [22]. Yet these internal factors do not operate in isolation. The territorial context in which a school is embedded, its proximity to the sea, access to marine institutions, infrastructural connectivity, or rural isolation, can shape both the feasibility and form of marine education projects.
1.3.2. A Hypothesis Supported by Programmatic Insights
Although the academic literature on territorial drivers of Blue School certification is still emerging, preliminary evidence from national networks suggests that territorial context does, in fact, play a significant role. For instance, in the Portuguese Blue School Network [5], schools operate across a variety of settings, including rural areas, fishing villages, urban centers, and islands, each with distinct conditions that shape project implementation. While island schools benefit from direct access to marine environments and urban schools often enjoy better infrastructure and partnerships with science centers, rural schools face logistical challenges despite strong community cohesion. These variations underscore the importance of context-sensitive approaches in advancing OL. In the broader Mediterranean region, frameworks like the Mediterranean Sea Literacy (MSL) initiative [23] also emphasize aligning educational content with local ecological and cultural realities.
Beyond the scope of Blue Schools specifically, previous research has highlighted the influence of human geography variables on OL more broadly. Research has shown that younger students tend to be more receptive to OL initiatives, while female learners consistently demonstrate higher levels of environmental concern and a greater willingness to engage in marine conservation efforts; however, males show higher levels of knowledge [24]. Among adults, factors such as level of education, income, and residential proximity to the coast have been positively associated with both ocean knowledge and concern for marine issues [25]. Furthermore, evidence from the UK–Ireland context shows that coastal residents are significantly more likely than inland residents to engage in ocean-related safety behaviors such as tide-checking, illustrating how spatial proximity to the sea influences practical OL [26].
Recent research in educational geography and conservation policy highlights how spatial context, institutional networks, and place-based learning influence the adoption of environmental [27,28] and educational programs [29]. By integrating these perspectives, our study situates Blue Schools within a broader interdisciplinary framework that combines environmental modeling with educational policy analysis. This framing underscores the potential of MaxEnt not only as a predictive tool but also as a bridge between ecological insights and social applications.
1.4. Modeling Spatial Potential for Blue School Certification: A MaxEnt Approach
Understanding how educational innovations like Blue School certification expand across space calls for modeling approaches that can work with the kind of data we often have in the real world, cases where we only know where the program exists. Maximum Entropy (MaxEnt) modeling offers a useful solution in this context. It is a presence-only method that estimates the most likely distribution of a phenomenon based on the conditions observed at known presence locations, without requiring data on absences [30].
While MaxEnt was originally developed for ecological applications, particularly species distribution modeling [30], it has become widely used across disciplines thanks to some practical advantages. It performs well even with small datasets, can handle correlations among predictor variables, and models nonlinear relationships effectively [31]. These strengths make it appealing for use in education and social research, where clean, large, and balanced datasets are often unavailable.
Over the past decade, MaxEnt has been applied to an increasingly broad range of human and environmental challenges. In environmental sciences, for example, it has been used to map flood-prone areas [32], forecast fire risk [33,34,35], and identify hotspots of human–wildlife conflict [36]. In each case, presence data, whether flood events, fire occurrences, or conflict incidents, are modeled against a set of environmental and social predictors to estimate future risk or likelihood.
More recently, researchers have extended the application of MaxEnt to model subjective or behavior-driven phenomena. In the context of land-use planning, MaxEnt has been used to visualize the spatial distribution of cultural ecosystem services by integrating participatory mapping with biophysical and landscape variables [37]. Similarly, other studies have employed MaxEnt to predict tourist concentrations by coupling the model with infrastructure, land use data, and geotagged social media check-ins [38].
Building on this interdisciplinary potential, we apply MaxEnt to model the spatial distribution of Blue School certification in Mallorca. Using the locations of certified schools as presence data, and drawing on a range of socio-economic, environmental, and infrastructural variables, we estimate the probability of certification across the island. This helps us not only understand the factors that influence certification but also identify areas with potential for future expansion, contributing both to methodological development and more informed educational policy.
This paper uses MaxEnt to model the spatial determinants of Blue School certification in Mallorca, advancing the field by extending presence-only modeling from ecological to social–educational contexts. To our knowledge, this is the first application of MaxEnt to an educational policy program, filling a critical gap in the literature on spatial determinants of program adoption and offering a data-driven approach to guide the expansion of Blue School networks.
1.5. Research Aims and Hypotheses
Based on the conceptual framework of the Blue Schools and the spatial dynamics of educational participation, this study explores the territorial conditions that enable or constrain Blue School certification. The research focuses on three interrelated dimensions:
- (1)
- The spatial distribution of certified schools in relation to environmental, socio-economic, and infrastructural predictors;
- (2)
- The explanatory power of Maxent modeling in identifying high-suitability areas for certification using presence-only data;
- (3)
- The potential for using spatial prediction to guide strategic expansion of the Blue Schools programs.
From these objectives, the following hypotheses are proposed:
H1.
The spatial distribution of Blue School certifications in Mallorca is not explained solely by coastal proximity, but by a wider set of territorial variables, including transport accessibility, presence of marine institutions, and economic structure.
H2.
Maxent modeling can reliably predict the suitability of school locations for Blue School certification using presence-only data, achieving high classification accuracy through cross-validation of geospatial predictors.
H3.
Spatial modeling will reveal non-certified schools located in areas with high territorial suitability, particularly in inland or underserved municipalities, demonstrating the model’s potential for guiding targeted outreach and expanding the Blue Schools network.
2. Materials and Methods
The methods applied in this study follow a structured workflow that integrates geospatial data collection, variable preparation, and MaxEnt modeling to assess the territorial determinants of Blue School certification. An overview of this workflow is provided in Figure 4, which combines a conceptual schematic (Figure 4a) with a detailed technical roadmap (Figure 4b). Together, these panels illustrate the data sources, spatial processing steps, and modeling procedures described in the following subsections.
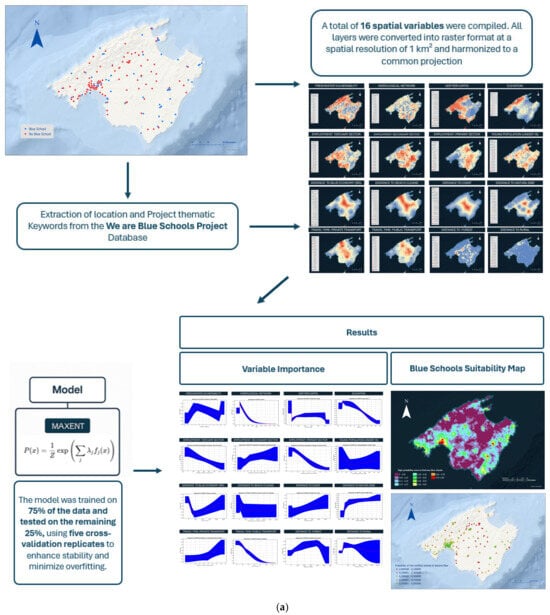
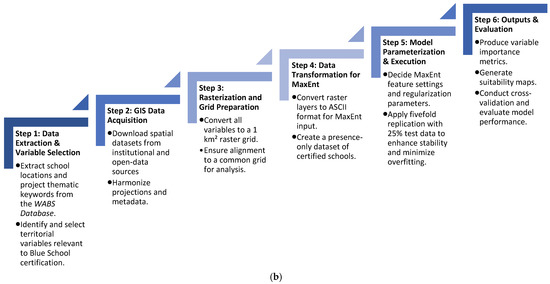
Figure 4.
(a) Conceptual overview of the study workflow from data extraction to modeling outputs. (b). Conceptual overview of the study workflow from data extraction to modeling outputs.
2.1. Study Area
Mallorca, the largest island in Spain’s Balearic archipelago, features a diverse geography: the Serra de Tramuntana mountains in the northwest, the fertile Es Pla plain in the centre, and a heavily urbanized southern coastline anchored by Palma. As of the first quarter of 2025, continuous census data indicate Mallorca’s population stood at approximately 967,322 inhabitants, marking a 0.7% growth compared to the previous year [39,40]. The island encompasses 53 municipalities, with 27 coastal municipalities, providing varied environments for marine education and experiences (see Figure 5).
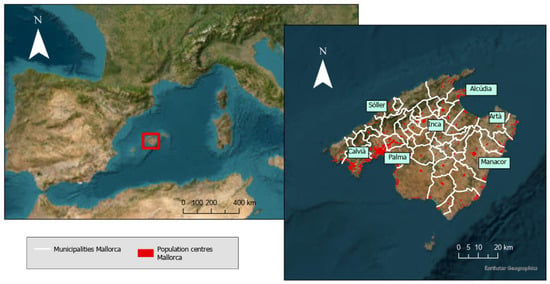
Figure 5.
Study area of the research: the island of Mallorca, Spain. The map shows the boundaries of its 53 municipalities, distinguishing coastal from inland areas, and highlights key physical features including the Serra de Tramuntana mountains, Es Pla plain, and major urban centers.
Although tourism remains the dominant economic sector [41], its influence is equally evident in the island’s training and education systems [42], which continue to prioritize the needs of the tourism industry [43,44]. However, regional policy documents for 2023–2030 outline a strategic shift toward Blue Economy development, emphasizing marine conservation, sustainable fisheries, renewable ocean energy, and maritime research [45]. This shift is reinforced by Mallorca’s expanding maritime infrastructure, which includes over 40 ports and marinas [46,47], alongside a growing ecosystem of marine-focused NGOs, maritime museums, research organisations, and educational institutions. Together, these developments create favorable conditions for advancing OL initiatives across the island.
2.2. Data and Variables
In order to identify which geographical factors influence Blue School certification and should therefore be included in the MaxEnt modeling framework, all certified projects from the We Are Blue Schools database were reviewed. The analysis focused on extracting keywords that reflect spatially relevant themes (Table 1). These were then compared with factors previously highlighted in academic literature, such as distance to the coast or income [19] and the urban–rural divide [5] to ensure both empirical grounding and theoretical alignment.

Table 1.
Keywords extracted from the 100 projects of the We are Blue Schools project database.
From this keyword analysis, several territorial themes emerged recurrently, including beach cleanup areas (43 mentions), Posidonia oceanica meadows (22 mentions), marine biodiversity and coastal ecosystems (12), natural parks and marine protected areas (8), freshwater systems and waterways (7), and contrasts between virgin and tourist zones (5). These project-level insights supported the design of a spatial modeling framework grounded in real educational content.
A total of 16 spatial variables were compiled and grouped into environmental, socio-economic, and infrastructural categories (Table 2). All layers were converted into raster format at a spatial resolution of 1 km2 and harmonized to a common projection (EPSG:25831) for compatibility with Maxent modeling. Because each 1 km2 pixel represents a single suitability value, schools located near cell edges may share the same predicted value if they fall within the same grid cell. The selected variables were as follows:

Table 2.
Variables selected and data sources.
The spatial and socio-economic variables used in the Maxent model were derived from a combination of publicly available datasets and original geospatial analyses (Figure 6). Proximity to Blue Economy organizations was calculated through custom mapping using data provided by Ports de les Illes Balears [44] and the Balearic Association of Marine Enterprises [48]. Travel time to the coast via public and private transport was modeled using data from Transport Illes Balears [49], while straight-line distance to the coast was calculated through original GIS processing.
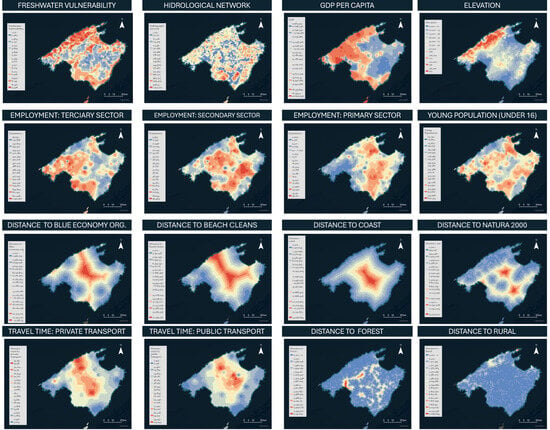
Figure 6.
Preparation of spatial data layers on a 1 km2 grid for MaxEnt modeling. Each thematic map (environmental, socio-economic, infrastructural) was harmonized to a common projection and rasterized at 1 km2 resolution. This standardized grid enabled direct comparison among variables and produced the input layers used to train and test the MaxEnt model.
Cleanup site locations were compiled from the Let’s Clean Up Europe initiative [50] and the MARNOBA citizen science platform [51]. Demographic and economic indicators, including employment by sector, youth population (under 19 years), and GDP per capita, were obtained from the Spanish National Statistics Institute [52].
Land classification data for identifying rural and urban areas, as well as forest coverage, were sourced from the CORINE Land Cover inventory [53]. Natura 2000 protected areas, the hydrological network, and freshwater vulnerability indicators were acquired from the Balearic Spatial Data Infrastructure [54]. Elevation data were derived from the Copernicus Digital Elevation Model [55].
2.3. The Method: Maxent Modeling
We employed Maxent version 3.4.4 [56] to model the spatial distribution of Blue School certifications using presence-only data. While a range of spatial modeling techniques could be applied to presence–absence or continuous datasets, including logistic regression, kernel density estimation, and machine-learning approaches such as random forests [57], these methods typically require either absence data or large training samples. By contrast, MaxEnt is specifically designed for presence-only data and performs well under small-sample conditions, while still allowing for robust evaluation through cross-validation. For these reasons, MaxEnt represents an appropriate and reliable choice for modeling the spatial determinants of Blue School certification in Mallorca.
The model was trained on a 75% random sample of the data and tested on the remaining 25%, with five cross-validation replicates to ensure stability and reduce overfitting. The logistic output format was used to produce continuous suitability values ranging from 0 to 1, representing the estimated relative probability of Blue School certification under the constraints imposed by the input variables.
Maxent operates by estimating the probability distribution of maximum entropy (i.e., closest to uniform), constrained by the empirical average of each environmental variable across presence locations. Given a set of features fj(x), the algorithm seeks the probability distribution P(x) that maximizes entropy:
where
- P(x) is the estimated suitability at location x;
- fj(x) are the environmental or socio-economic features;
- λj are the weights assigned to each feature j, learned during model training;
- Z is a normalizing constant ensuring that the total probability sums to one.
This formulation ensures that the expected value of each feature under the estimated distribution matches its empirical average over the observed presences, while otherwise assuming as little as possible about unknown data.
Model performance was evaluated using the Area Under the Curve (AUC) of the Receiver Operating Characteristic (ROC), alongside omission rate plots to assess calibration. To determine the relative contribution of each variable, we analyzed percent contribution (based on model training), permutation importance (based on reduction in model performance when variables are randomized), and jackknife tests (measuring gain from each variable alone or excluded). This multi-metric approach provides a robust assessment of which spatial factors most influence the likelihood of Blue School certification.
2.4. School-Level Suitability Extraction
Following the generation of the median prediction surface, we extracted the predicted suitability value at each known school location in Mallorca. This allowed us to assign a spatial probability score, ranging from 0 to 1, to both certified and non-certified schools across the island. By juxtaposing the full population of schools with the prediction map, we were able to identify high-suitability schools that have not yet been certified. This spatial overlay serves as a practical tool for prioritizing outreach and capacity-building efforts, particularly in inland or underserved areas that exhibit strong alignment with the territorial drivers of certification identified by the model.
3. Results
3.1. Model Performance
The MaxEnt model exhibited strong predictive performance, achieving an average test AUC (Area Under the Curve) of 0.840 across five cross-validated replicates, with a standard deviation of ±0.044 (Figure 7). This high AUC value indicates excellent discriminatory power in differentiating between locations with and without Blue School certification. In practical terms, it reflects a well-calibrated balance between sensitivity (true positive rate) and specificity (true negative rate), confirming the model’s robustness in identifying areas of high suitability based on the selected geospatial predictors.
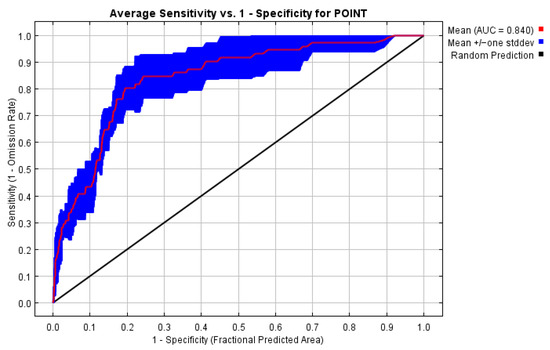
Figure 7.
Receiver Operating Characteristic (ROC) curve showing model sensitivity vs. 1-specificity for the MaxEnt predictions. The area under the curve (AUC) quantifies the model’s discriminatory power, with higher AUC values indicating better ability to distinguish between certified Blue Schools (presence) and background locations. This metric provides an overall assessment of model accuracy and robustness.
Additional evidence of strong model calibration is provided by the omission vs. predicted area curve (Figure 8). The observed omission rate (cyan line) closely tracks the predicted omission rate (black line) across cumulative thresholds, remaining largely within the orange confidence envelope (± one standard deviation). This alignment suggests that the predicted probabilities correspond well with the actual spatial distribution of certified schools, reinforcing the model’s internal consistency.
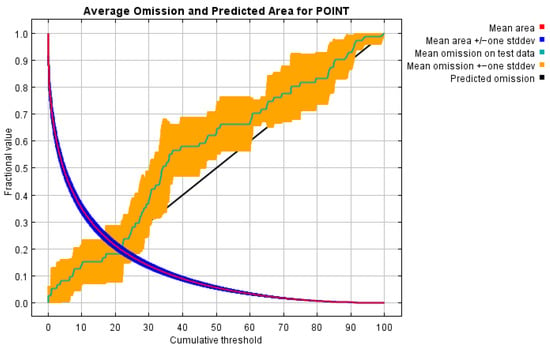
Figure 8.
Average omission rate and predicted area across fivefold cross-validation of the MaxEnt model. The graph displays how omission error varies with cumulative threshold values, indicating the model’s ability to discriminate between observed and background points. Lower omission rates and stable predicted area curves reflect higher model accuracy and reliability.
3.2. Variable Importance and Spatial Drivers
Among the predictor variables (Table 3), distance to Blue Economy organisations emerged as the most influential according to percent contribution (30.2%), and it yielded the highest training gain when evaluated independently in the jackknife analysis. This underscores the pivotal role of proximity to maritime enterprises, research institutions, and NGOs in facilitating school engagement with OL. However, its low permutation importance (4.4%) suggests that its predictive influence may be shared with correlated variables, reducing its unique contribution when others are present.

Table 3.
Importance and contribution of the variables to the model.
In contrast, the hydrological network surfaced as the most informative and non-redundant variable. Its omission resulted in the greatest drop in model performance, with a permutation importance of 23.5%, indicating that freshwater systems, such as torrents (dry rivers), reservoirs, and wetlands, are critical territorial enablers of aquatic environmental education.
Other high-ranking variables include the percentage of the population employed in the primary sector (21.2%) and travel time to the coast by public transport (25.6%), both of which point to contextual factors that facilitate marine engagement. The former reflects the relevance of traditional economies, such as agriculture and fisheries, in cultivating environmental awareness and stewardship. The latter highlights the enabling role of sustainable accessibility; schools with efficient public transport connections to coastal zones (e.g., train and direct public lines) are better positioned to carry out field-based marine learning activities.
Moderate contributions were also observed for proximity to Natura 2000 areas (10%) and distance to forested zones (6.9%), suggesting that natural protected areas and transitional ecosystems support place-based learning and curricular innovation. These landscapes likely serve as focal points for school projects that align with biodiversity and conservation goals.
By contrast, socio-economic indicators such as GDP per capita (3%), employment in the tertiary sector (2.3%), and youth population share (0.7%) played marginal roles in the model. This suggests that structural and geographic accessibility to marine or freshwater environments is more decisive than general economic wealth or demographic composition in driving school participation.
Together, these results (Figure 9) indicate that the spatial distribution of Blue School certification is not solely determined by proximity to the coast, but rather by a complex interplay of access to marine-related institutions, engagement with water systems, and community-based drivers rooted in economic activity and environmental values.
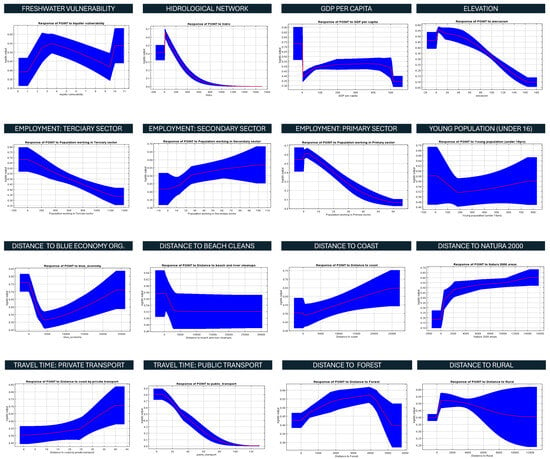
Figure 9.
MaxEnt response curves illustrating how each environmental, socio-economic, and infrastructural variable influences the predicted probability of Blue School certification. Each curve depicts the model’s logistic output as a single variable varies while all others are held at their average values, enabling interpretation of variable-specific effects and non-linear relationships.
3.3. Suitability Mapping and School-Level Predictions
The median prediction surface generated by the MaxEnt model reveals distinct spatial patterns in the likelihood of Blue School certification across the island of Mallorca (Figure 10). Zones of high suitability are clearly concentrated along the southeastern and eastern coastal corridors, as well as within the Palma metropolitan area. These areas exhibit a strong convergence of favorable territorial conditions, most notably, close proximity to Blue Economy organizations, efficient public transport access to the coast, and dense hydrological networks, which were among the highest-ranking variables in the model. Their spatial overlap highlights the synergistic effect of infrastructure, ecosystem connectivity, and institutional presence in fostering OL engagement.
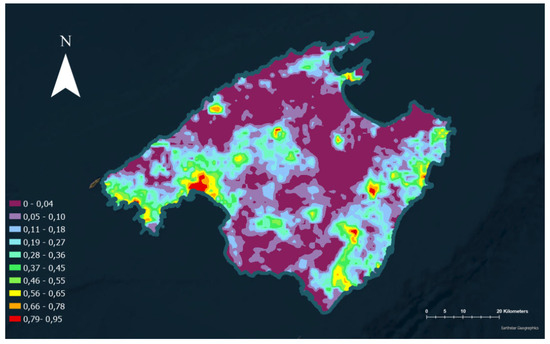
Figure 10.
Predicted suitability map for identifying potential new Blue Schools in Mallorca generated by the MaxEnt model. Warmer colours indicate higher predicted probability of certification, while cooler colours indicate lower probability. This spatial output highlights inland and urban schools with high suitability scores, supporting targeted outreach and policy planning for network expansion.
In particular, the Palma region stands out not only due to urban density but also because of its clustering of marine research institutions, NGOs, port authorities, and educational hubs, which together create an ecosystem of support for schools seeking certification. Several schools within Palma’s urban fabric scored above 0.94 in predicted suitability, despite not yet being certified. This suggests a significant latent potential in urban environments where functional and institutional access compensates for distance to the physical coastline.
Similarly, the eastern and southeastern coastal belts align with productive landscapes and Natura 2000 protected areas, where environmental awareness may be higher and partnerships with conservation actors more feasible. The predictive contribution of the primary sector employment variable (notably high in rural coastal areas) may explain the engagement of schools located in small fishing villages and agricultural zones, where communities are more attuned to marine and aquatic resource sustainability.
In contrast, areas of low suitability are predominantly concentrated in the central interior (Pla de Mallorca) and the northwestern mountainous zones (Serra de Tramuntana). These regions are typically more rural, dispersed, and infrastructurally isolated, with fewer marine institutions, weaker transport connectivity, and lower exposure to both marine and freshwater ecosystems. While some of these areas host schools with strong environmental traditions, the absence of structural enablers, such as public transport links to the coast or nearby marine stakeholders, limits their baseline potential for certification under current conditions. This highlights how territorial disadvantage may stem not from distance per se, but from multi-dimensional access barriers.
Moreover, the model’s surface reveals nuanced cases where inland schools score relatively high in suitability, particularly where freshwater systems intersect with educational centers, access to public transport, and Natura 2000 areas. These “outliers” reinforce the importance of freshwater engagement and protected area proximity as alternative pathways for schools not located near the sea to participate in the Blue School program.
As a next step, the prediction surface was overlaid with the complete set of school locations in Mallorca, enabling the extraction of site-specific suitability scores for both certified and non-certified institutions. This spatial overlay revealed that more than 30 non-certified schools exhibit predicted suitability values exceeding 0.85, indicating a high latent potential for engagement with the Blue School programme. Notably, several urban schools in Palma emerged as particularly promising candidates, with predicted scores above 0.94. These include IES Joan Alcover, IES Ramon Llull, IES Politècnic, and CEIP Aina Moll i Marquès (Table 4).

Table 4.
Schools with higher probability of becoming Blue.
Their elevated suitability values, despite their current uncertified status, highlight clear opportunities for targeted outreach and capacity-building, especially in metropolitan areas where key enabling factors such as institutional proximity, infrastructure, and access to Blue Economy actors are already in place (Figure 11). These findings provide actionable insight into how the Blue School program can expand strategically. Rather than focusing solely on coastal proximity, the suitability map underscores the importance of multi-dimensional territorial factors, ranging from ecological networks to transport infrastructure and economic structure, in enabling educational engagement with the marine environment. In practical terms, the results support a data-driven approach to scaling the Blue Schools program by identifying and prioritizing schools already situated within favorable territorial conditions, yet not yet part of the certification network.
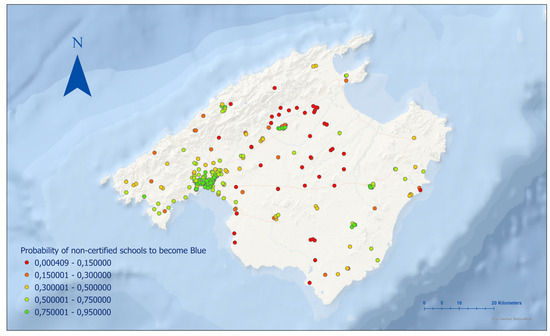
Figure 11.
Probability of non-certified schools becoming Blue Schools in Mallorca, as predicted by the MaxEnt model. Each point represents an existing non-certified school, colour-coded by predicted suitability score (0–1) from red (lowest probability) to green (highest probability). This spatial representation highlights priority areas for outreach and capacity-building, especially in inland municipalities with high suitability values.
The MaxEnt results also reveal patterns with direct ecological and conservation relevance. The projected high-suitability areas in inland municipalities coincide with freshwater systems and public transport hubs, suggesting these features can offset distance from the coast and enhance access to marine education. Such patterns provide evidence for targeted conservation planning and biodiversity management, identifying locations where expansion of Blue School initiatives can complement marine and sustainability stewardship. This deeper understanding of spatial drivers helps align educational outreach with conservation priorities across the island.
4. Discussion
4.1. Spatial Context and Blue School Engagement
This study’s findings underscore that territorial context is pivotal in shaping Blue School certification outcomes. The MaxEnt model revealed that factors like spatial accessibility to Blue Economy institutions, the extent of hydrological networks, and availability of sustainable transport infrastructure are among the most influential predictors of school participation. These results challenge any assumption that coastal proximity or economic prosperity alone drives OL engagement. Instead, it is the combination of functional access, ecosystem connectivity, and community relevance that enables schools to develop meaningful marine education projects. This aligns with the Blue Schools philosophy that successful OL initiatives must connect learning to local communities and real-world issues [2,4,5].
In fact, OL frameworks are increasingly being adapted to fit regional and local contexts, for example, the Mediterranean Sea Literacy principles were developed to tailor OL to the specific ecological and cultural setting of the Mediterranean region [23]. Such efforts reinforce that place-based context and relevance are key to engaging students, whether their schools are on the coast or farther inland.
4.2. Theoretical and Methodological Implications
This study contributes to the emerging interface between educational geography and environmental modeling by demonstrating how territorial variables can predict participation in OL programs. Recent research in educational geography and policy diffusion underscores how spatial context, institutional networks, and place-based learning shape the adoption of environmental and educational initiatives [27,28,29]. By adapting MaxEnt, a tool traditionally used in species distribution modeling, to a social and educational context, our analysis illustrates the feasibility of applying spatially explicit, presence-only models to educational research. Future work could extend this approach by experimenting with parameter optimization, incorporating dynamic or qualitative variables (e.g., teacher training capacity, institutional readiness), and testing the model’s external validity across multiple regions.
4.3. Inland Schools and Hydrological Connectivity
An intriguing insight is the high importance of inland hydrological networks (rivers, wetlands, etc.) in the model. This reinforces that OL is not confined to strictly coastal settings. Schools situated away from the coast but embedded in rich freshwater ecosystems or longstanding place-based environmental education traditions may be equally well-positioned to join the Blue Schools network. Indeed, the Blue Schools initiative itself emphasizes inclusivity across diverse geographies, aiming to reach “children everywhere” as ocean stewards [9].
By analogy, high potential for Blue School certification can emerge in areas where multiple enabling conditions, such as a strong environmental context, community partnerships, and access to resources, converge, even if those areas are not located directly along the coast. Inland schools with robust water-related environmental programs and active community engagement can thus become vibrant nodes of OL, extending the Blue Schools movement beyond the shoreline. For example, the NOAA-supported Ocean Acidification Education Partnership has demonstrated that landlocked schools can effectively engage in OL through watershed-based approaches and inter-school collaborations with coastal institutions [58]. Similarly, ocean education initiatives in Canada emphasize the pressing need to improve marine education for the millions of citizens living inland, showing that physical proximity to the ocean is not a prerequisite for meaningful engagement [59]. Inland schools with robust water-related environmental programs or community engagement can thus become vibrant nodes of OL, extending the Blue Schools movement beyond the shoreline.
4.4. Identifying Opportunity Zones for Expansion
One of the most impactful outcomes of this spatial analysis is the identification of 33 non-certified schools with very high predicted suitability scores (>0.85) for the Blue School program. Notably, many of these schools are clustered in and around the city of Palma, the densely populated capital of Mallorca. This confirms that urban density and institutional proximity can provide fertile ground for Blue School initiatives.
Urban centers like Palma host numerous educational institutions and nearby marine or science organizations (museums, aquariums, universities, NGOs), creating a concentration of resources and potential partners to support Blue School projects. These results offer a clear roadmap for strategically expanding the program through targeted outreach. Schools that show this kind of territorial readiness, where the geographic, social, and infrastructural conditions are ripe, can be prioritized for certification support.
From a policy standpoint, this approach enables more strategic resource allocation by identifying “opportunity zones” with the highest potential for successful Blue School certification. The predictive map can serve as a practical tool for guiding mentorship, capacity-building, and funding efforts toward schools where OL initiatives are most likely to flourish, thereby enhancing overall impact.
This territorial analysis adds a valuable layer to existing engagement models like ProBleu [22], which promote inclusivity and peer learning among schools. Incorporating geographic suitability into such initiatives could help tailor outreach and support efforts to those schools where the conditions for ocean literacy projects are already favorable.
4.5. Extending MaxEnt to Educational Context
Beyond the substantive findings on Blue Schools identification, this research showcases an innovative application of the MaxEnt modeling technique outside its traditional ecological realm. MaxEnt was originally developed for species distribution modeling [30], but here we adapted it to presence-only data on educational program participation, opening new possibilities for predicting where educational or social innovations are most likely to succeed based on spatial context.
According to the Balearic Government’s school enrollment guidelines, most students in Mallorca attend schools within their own municipality, but certain specialized or bilingual schools draw enrolment island-wide [60]. These differing catchment areas may influence the territorial exposure of students and should be considered when interpreting the spatial results. This study contributes to the expanding use of MaxEnt in modeling complex social phenomena by demonstrating its relevance in the education sector. Specifically, it shows how MaxEnt can effectively identify spatial opportunities to strengthen OL in schools, highlighting the method’s potential for social and educational planning, particularly in contexts where conventional data, such as indicators of non-engagement, are limited or unavailable.
4.6. Transferability and Policy Implications
While our case study focused on the island of Mallorca, the approach we developed is highly transferable to other regions. The predictive modeling framework can be readily replicated by education authorities or OL networks in other parts of Spain, through the Spanish Network of Blue Schools [61], and Europe. By adjusting the input layers to local data, such as each region’s Blue Economy infrastructure, hydrological features, and community indices, stakeholders can identify under-engaged but spatially promising schools in their own territories. In this sense, the MaxEnt model can serve as both an analytical and strategic tool for scaling Blue Schools equitably across diverse geographies.
Our findings build on this momentum by offering a data-driven method to guide where the next waves of Blue Schools could emerge. Policymakers and program coordinators can use these insights to proactively target outreach, funding, and partnerships in areas with high latent potential for OL education. Ultimately, aligning expansion efforts with the geography of opportunity will help ensure that the growth of the Blue School network is both efficient and inclusive, bringing the benefits of OL to coastal and inland communities alike, and empowering the next generation of ocean-literate citizens across Europe.
Although the predictive framework was developed and validated within a single regional case study, its robustness was supported by fivefold cross-validation of model performance. We recognize, however, that model generalization may be constrained by the spatial specificity of the Mallorcan context. With Mallorca currently accounting for approximately one in five certified Blue Schools in Europe, the island provides a uniquely dense sample for model calibration. As the Network of European Blue Schools expands and other regions reach similar participation levels, future work will test and calibrate the model across multiple geographic settings to assess external validity and support cross-regional policy recommendations.
5. Conclusions
This study demonstrates the value of spatial modeling in guiding the equitable expansion of the Blue Schools network. By applying MaxEnt to presence-only data, we identified key territorial factors that shape school engagement with OL.
Importantly, the model revealed high potential in several non-certified urban and inland schools, challenging the assumption that proximity to the coast is a prerequisite for participation. These insights offer a practical foundation for strategic outreach and policy planning, ensuring that OL can reach diverse educational contexts.
This modeling framework also equips policymakers and conservation practitioners with a practical evidence base for targeting Blue School outreach and investment. By pinpointing inland municipalities where freshwater systems and public transport hubs enhance suitability, it challenges coast-dependent assumptions and identifies opportunities to integrate blue education with biodiversity stewardship. This represents the first application of MaxEnt to an educational policy context, extending its traditional ecological use to a novel social and educational domain and offering a transferable tool for data-driven planning across Europe.
Taken together, these results provide empirical support for the three hypotheses articulated at the outset of the study. H1 was confirmed by demonstrating that territorial variables beyond coastal proximity, such as distance to blue economy organisations or transport accessibility, play a decisive role in Blue School certification. H2 was supported through the strong predictive performance of the MaxEnt model, which achieved stable accuracy across cross-validation replicates. H3 was validated by identifying several non-certified schools in inland and underserved municipalities with high predicted suitability, indicating clear opportunities for targeted outreach. This alignment between hypotheses and findings reinforces the robustness of the modeling framework.
Future research could refine and extend this approach by integrating dynamic or qualitative variables, such as institutional readiness, teacher training capacity, or levels of student environmental interest, or by applying the model longitudinally to evaluate impact over time. Replicating this analysis in other European regions would also help validate the model’s generalizability and support transnational coordination across the Network of European Blue Schools. In addition, future studies could integrate proximity to other Blue Schools as a predictor variable to test potential network effects. Although this factor showed little additional explanatory power in the current model due to the high density of Blue Schools in Mallorca, it may yield important insights in larger or more heterogeneous regions.
Limitations of the Study
This study provides new insight into the territorial factors shaping Blue School certification, but several limitations should be noted. These limitations do not undermine the findings but help to set realistic expectations about their scope and highlight clear priorities for future research, including cross-regional validation, finer-scale data and the integration of qualitative indicators:
- Focus on a Single Region: Our analysis is based solely on Mallorca, where Blue Schools are unusually concentrated. This density made it possible to develop a robust model but also means the findings may not automatically apply to regions with fewer schools or very different geographic and policy contexts.
- Presence-Only Data: We modeled only certified schools. Schools actively working on ocean literacy but not yet certified were not included, which may underrepresent some areas of potential engagement.
- Missing Qualitative Dimensions: Despite assembling a broad set of environmental, socio-economic and infrastructural variables, we could not include qualitative aspects such as institutional readiness, teacher training or student interest because comparable data do not yet exist at the island scale.
- Grid Size and Spatial Detail: All data were standardized to a 1 km2 grid. This is appropriate for island-scale modeling but inevitably smooths out local differences. Schools at the edge of grid cells may receive similar predicted values even if their immediate surroundings differ.
- Need for External Validation: We evaluated the model internally through cross-validation, but it has not yet been tested on other regions. Applying and validating the approach elsewhere will be essential to confirm its generalizability.
Author Contributions
Conceptualization, Christian Esteva-Burgos and Maurici Ruiz-Pérez; methodology, Christian Esteva-Burgos and Maurici Ruiz-Pérez; software, Christian Esteva-Burgos and Maurici Ruiz-Pérez; validation, Christian Esteva-Burgos and Maurici Ruiz-Pérez; formal analysis, Christian Esteva-Burgos and Maurici Ruiz-Pérez; investigation, Christian Esteva-Burgos and Maurici Ruiz-Pérez; resources, Christian Esteva-Burgos and Maurici Ruiz-Pérez; data curation, Christian Esteva-Burgos and Maurici Ruiz-Pérez; writing—original draft preparation, Christian Esteva-Burgos; writing—review and editing, Christian Esteva-Burgos and Maurici Ruiz-Pérez; visualization, Christian Esteva-Burgos and Maurici Ruiz-Pérez; supervision, Maurici Ruiz-Pérez; project administration, Christian Esteva-Burgos and Maurici Ruiz-Pérez; funding acquisition, none. All authors have read and agreed to the published version of the manuscript.
Funding
This research received no external funding.
Data Availability Statement
No new data were created or analyzed in this study. Data sharing is not applicable to this article.
Acknowledgments
We would like to express our sincere gratitude to Evy Copejans and Silja Teege for their invaluable support in implementing the We are Blue Schools project, which inspired this research, and for their dedication in helping build the database of school information.
Conflicts of Interest
The authors declare no conflict of interest.
Correction Statement
This article has been republished with a minor correction to the Data Availability Statement. This change does not affect the scientific content of the article.
Abbreviations
The following abbreviations are used in this manuscript:
| AUC | Area Under the Curve |
| DEMs | Digital Elevation Models |
| GIS | Geographic Information Systems |
| MaxEnt | Maximum Entropy |
| NEBS | Network of European Blue Schools |
| OL | Ocean Literacy |
References
- European Commission. Become a European Blue School. EU4Ocean Coalition. Available online: https://maritime-forum.ec.europa.eu/theme/ocean-literacy-and-blue-skills/ocean-literacy/network-european-blue-schools/become-european-blue-school_en (accessed on 1 October 2024).
- UNESCO. Blue Schools Global Network. Available online: https://oceanliteracy.unesco.org/projects/blue-school-global-network (accessed on 1 July 2025).
- Sea Change Consortium. Sea Change: Key Achievements Booklet; European Union: Brussels, Belgium, 2018; Available online: https://www.ecsite.eu/sites/default/files/sea_change_key_achievements_booklet.pdf (accessed on 1 October 2024).
- Costa, R.L.; Mata, B.; Silva, F.; Conceição, P.; Guimarães, L. Fostering Ocean-Literate Generations: The Portuguese Blue School. In Ocean Literacy: Understanding the Ocean. Key Challenges in Geography; Koutsopoulos, K.C., Stel, J.H., Eds.; Springer: Cham, Switzerland, 2021. [Google Scholar] [CrossRef]
- Costa, R.L.; Faria, C. The Blue School Program: A Model for Holistic Ocean Literacy Education. Sustainability 2025, 17, 661. [Google Scholar] [CrossRef]
- All-Atlantic Ocean Research & Innovation Alliance. All-Atlantic Blue Schools Network: Promoting Ocean Literacy Through International School Engagement Across Atlantic Countries. 2023. Available online: https://allatlanticocean.org/all-atlantic-joint-actions/all-atlantic-blue-schools-network/ (accessed on 2 February 2025).
- UNESCO-IOC. Blueprint for a Global Blue School Programme: A Toolkit for Educators; UNESCO: Paris, France, 2023; Available online: https://unesdoc.unesco.org/ark:/48223/pf0000394326 (accessed on 2 February 2025).
- European Commission. Launch of the EU4Ocean Coalition on Ocean Literacy—Virtual Ocean Literacy Summit, 8 June 2020 (World Oceans Day). Maritime Forum. 2020. Available online: https://maritime-forum.ec.europa.eu/events/launch-eu4ocean-coalition-2020-06-08_en (accessed on 2 February 2025).
- European Commission. Handbook for the Network of European Blue Schools; EU4Ocean Coalition: Brussels, Belgium, 2021; Available online: https://maritime-forum.ec.europa.eu/system/files/2021-02/handbook_eueopean_blue_schools_220221.pdf (accessed on 2 February 2025).
- European Commission. Members of the Network of European Blue Schools. Maritime Forum. Available online: https://maritime-forum.ec.europa.eu/theme/ocean-literacy-and-blue-skills/ocean-literacy/network-european-blue-schools/members_en (accessed on 2 February 2025).
- We Are Blue Schools. Erasmus + Project. Available online: https://weareblueschools.eu/ (accessed on 2 February 2025).
- European Commission Maritime Forum. Som Escoles Blaves: A Beacon for Ocean Literacy in the Balearic Islands. 2024. Available online: https://maritime-forum.ec.europa.eu/som-escoles-blaves-beacon-ocean-literacy-balearic-islands_en (accessed on 2 February 2025).
- WestMED Initiative. Success Story on Ocean Literacy and Blue Skills: “We Are Blue Schools”—Making Waves from the Classrooms Up. 2024. Available online: https://westmed-initiative.ec.europa.eu/westmed-success-story-on-ocean-literacy-and-blue-skills-we-are-blue-schools-making-waves-from-the-classrooms-up/ (accessed on 13 July 2025).
- Freitas, C.; Venzo, P.; Bellgrove, A.; Francis, P. Diving into a sea of knowledge: Empowering teachers to enhance ocean literacy in primary schools through an ocean education training program. Environ. Educ. Res. 2024, 30, 2357342. [Google Scholar] [CrossRef]
- McDonnell, J.D. Best Practices in Marine and Coastal Science Education: Lessons Learned from a National Estuarine Research Reserve. Mar. Coast. Sci. Educ. 2000, 173–182. [Google Scholar]
- Fauville, G.; Strang, C.; Cannady, M.A.; Chen, Y.-F. Development of the International Ocean Literacy Survey: Measuring knowledge across the world. Environ. Educ. Res. 2019, 252, 238–263. [Google Scholar] [CrossRef]
- Fauville, G.; McHugh, P.; Domegan, C.; Mäkitalo, Å.; Møller, L.F.; Papathanassiou, M.; Alvarez Chicote, C.; Lincoln, S.; Batista, V.; Copejans, E.; et al. Using collective intelligence to identify barriers to teaching 12–19 year olds about the ocean in Europe. Mar. Policy 2018, 91, 85–96. [Google Scholar] [CrossRef]
- Roy, N. Fostering Ocean Literacy Through Formal Education in Quebec, Canada: A Case Study of Saving a Coastal School. Master’s Thesis, Dalhousie University, Halifax, NS, Canada, 2020. Available online: https://dalspaceb.library.dal.ca/server/api/core/bitstreams/20de55c9-8c58-451d-b131-5f0b28a1ae58/content (accessed on 3 June 2025).
- Fletcher, S.; Castle, Z.; McKinley, E. Coastal and Marine Education in Schools: Constraints and Opportunities Created by the Curriculum, Schools, and Teachers in England. Ocean. Yearb. Online 2010, 24, 425–444. [Google Scholar] [CrossRef]
- Costa, A.C.; Amorim, A.V.; Neto, A.I.; Alves, F.M. Where is Ocean Literacy in Oceanic Islands’ Schools? The Azores Case. Mar. Policy 2024, 163, 106062. [Google Scholar] [CrossRef]
- Mogias, A.; Louvrou, I.; Maliappis, M.; Paraskevopoulou, A.; Mavrikaki, E. Evaluating Ocean Literacy of Elementary School Students: A Cross-Cultural Study in the Mediterranean Region. Front. Mar. Sci. 2019, 6, 396. [Google Scholar] [CrossRef]
- Ceccaroni, L.; Mancini, M.; Arimany, N.; Piera, J. The Role of Citizen Science in Promoting Ocean and Water Literacy in School Communities: The ProBleu Methodology. Sustainability 2023, 15, 11410. [Google Scholar] [CrossRef]
- Mokos, M.; Realdon, G.; Čižmek, H. Mediterranean Sea Literacy: When Ocean Literacy Becomes Region-Specific. Mediterr. Mar. Sci. 2020, 21, 592–598. [Google Scholar] [CrossRef]
- Guest, H.; Lotze, H.K.; Wallace, D. Youth and the Sea: Ocean literacy in Nova Scotia, Canada. Mar. Policy 2015, 58, 98–107. [Google Scholar] [CrossRef]
- Steel, B.S.; Smith, C.L.; Opsommer, L.; Curiel, S.; Warner-Steel, R. Public ocean literacy in the United States. Ocean Coast. Manag. 2005, 48, 97–114. [Google Scholar] [CrossRef]
- Morris-Webb, E.S.; Austin, M.; Cousens, C.; Kent, N.; Gosney, K.; Tenbrink, T. Cut Off by the Tide: How Ocean Literacy Can Help Save Lives. Ocean. Soc. 2025, 2, 9793. [Google Scholar] [CrossRef]
- Hernandez González, F. Exploring the Affordances of Place-Based Education for Advancing Sustainability Education: The Role of Cognitive, Socio-Emotional and Behavioural Learning. Educ. Sci. 2023, 13, 676. [Google Scholar] [CrossRef]
- Soucy, A.R.; Rahimzadeh-Bajgiran, P.; De Urioste-Stone, S.; Eitel, K.; Jansujwicz, J.; Brownlee, M. Impact of a place-based educational approach on student and community members’ experiences and learning within a post-secondary GIS course. J. Geosci. Educ. 2024, 1–16. [Google Scholar] [CrossRef]
- Yemini, M.; Engel, L.; Ben Simon, A. Place-based education—A systematic review of literature. Educ. Rev. 2025, 77, 640–660. [Google Scholar] [CrossRef]
- Phillips, S.J.; Anderson, R.P.; Schapire, R.E. Maximum entropy modeling of species geographic distributions. Ecol. Model. 2006, 190, 231–259. [Google Scholar] [CrossRef]
- Merow, C.; Smith, M.J.; Silander, J.A. A Practical Guide to MaxEnt for Modeling Species’ Distributions: What It Does, and Why Inputs and Settings Matter. Ecography 2013, 36, 1058–1069. [Google Scholar] [CrossRef]
- Huang, F.; Zhu, D.; Zhang, Y.; Zhang, J.; Wang, N.; Dong, Z. Urban Flooding Disaster Risk Assessment Utilizing the MaxEnt Model and Game Theory: A Case Study of Changchun, China. Sustainability 2024, 16, 8696. [Google Scholar] [CrossRef]
- Fonseca, M.G.; Ramos, F.M.; Alvalá, R.C.S.; Escada, M.I.S.; Câmara, G.; Ferreira, K.R. Modelling fire probability in the Brazilian Amazon using the maximum entropy method. Int. J. Wildland Fire 2016, 25, 955–969. [Google Scholar] [CrossRef]
- Syphard, A.D.; Rustigian-Romsos, H.; Mann, M.; Conlisk, E.; Moritz, M.A. The Relative Influence of Climate and Housing Development on Current and Projected Future Fire Patterns and Structure Loss across Three California Landscapes. Glob. Environ. Change 2019, 56, 41–55. [Google Scholar] [CrossRef]
- Castillo, M.; Plaza, Á.; Garfias, R. A Recent Review of Fire Behavior and Fire Effects on Native Vegetation in Central Chile. Glob. Ecol. Conserv. 2020, 24, e01210. [Google Scholar] [CrossRef]
- Broekhuis, F.; Cushman, S.A.; Elliot, N.B. Identifying human–carnivore conflict hotspots to prioritize mitigation efforts: A spatial analysis using MaxEnt. Ecol. Evol. 2017, 7, 10630–10639. [Google Scholar] [CrossRef] [PubMed]
- Shi, Q.; Chen, H.; Liang, X.; Liu, D.; Geng, T.; Zhang, H. Combination of participatory mapping and MaxEnt model to visualize the cultural ecosystem services at county scale. Ecosyst. Serv. 2025, 72, 101710. [Google Scholar] [CrossRef]
- Yan, Y.; Kuo, C.-L.; Feng, C.-C.; Huang, W.; Fan, H.; Zipf, A. Coupling Maximum Entropy Modeling with Geotagged Social Media Data to Determine the Geographic Distribution of Tourists. Int. J. Geogr. Inf. Sci. 2018, 32, 1698–1720. [Google Scholar] [CrossRef]
- Instituto Nacional de Estadística (INE). Estadística Continua de Población—1 April 2025; INE: Madrid, Spain, 2025; Available online: https://www.ine.es/dyngs/Prensa/ECP1T25.htm (accessed on 1 April 2025).
- Instituto Balear de Estadística (IBESTAT). Índice de Presión Humana en Mallorca—October 2024; IBESTAT: Palma, Spain, 2025. [Google Scholar]
- OECD. Rethinking Regional Attractiveness in the Balearic Islands Region of Spain; OECD Publishing: Paris, France, 2023; Available online: https://www.oecd.org/en/publications/rethinking-regional-attractiveness-in-the-balearic-islands-region-of-spain_47bf5ec1-en.html (accessed on 1 April 2025).
- Amer, J. Educación y Sociedad Turística en Baleares: Las Políticas Públicas Educativas ante el Impacto de la Economía de Servicios Turísticos en el Abandono Escolar; Departament de Pedagogia i Didàctiques Específiques, Universitat de les Illes Balears: Palma, Spain, 2025. [Google Scholar]
- Govern de les Illes Balears. Formación Profesional. Available online: https://www.caib.es/sites/fp/ca/inici/?campa=yes (accessed on 1 April 2025).
- Universitat de les Illes Balears (UIB). Grados Universitarios. Available online: https://estudis.uib.es/es/estudis-de-grau/grau/ (accessed on 1 April 2025).
- Govern de les Illes Balears. Plan de Desarrollo Económico Mediterráneo: Economía Azul 2023–2030; CAIB: Palma, Spain, 2023. [Google Scholar]
- Autoridad Portuaria de Baleares (Ports de les Illes Balears). Memoria Anual 2022; Puertos del Estado: Madrid, Spain, 2023. [Google Scholar]
- Ports IB. Ports de les Illes Balears. Available online: https://www.portsib.es/ca/paginas/inici (accessed on 13 July 2025).
- Asociación Provincial de Empresarios de Actividades Marítimas de Baleares (APEAM). Available online: https://www.apeam.com (accessed on 1 April 2025).
- Transport de les Illes Balears (TIB). Servei de Transport Públic Regular de Viatgers per Carretera. Available online: https://www.tib.org (accessed on 1 April 2025).
- Let’s Clean Up Europe. European Week for Waste Reduction. Available online: https://ewwr.eu/actions/lets-clean-up-europe (accessed on 1 April 2025).
- Asociación Vertidos Cero. Plataforma MARNOBA: Seguimiento de Basuras Marinas en Costas Españolas. Available online: https://www.marnoba.org (accessed on 1 April 2025).
- Instituto Nacional de Estadística (INE). Base de Datos INE. Available online: https://www.ine.es (accessed on 1 April 2025).
- European Environment Agency (EEA). CORINE Land Cover (CLC) 2018, Version 2020_20u1. Available online: https://land.copernicus.eu/pan-european/corine-land-cover (accessed on 1 April 2025).
- European Environment Agency (EEA). EU-DEM v1.1 Digital Elevation Model. Available online: https://land.copernicus.eu/imagery-in-situ/eu-dem (accessed on 1 April 2025).
- Infraestructura de Dades Espacials de les Illes Balears (IDEIB). Geoportal IDEIB. Available online: https://ideib.caib.es (accessed on 1 April 2025).
- Phillips, S.J.; Dudík, M.; Fink, D.; Schapire, R.E. MaxEnt Software for Modeling Species Niches and Distributions (Version 3.4.4). 2023. Available online: https://biodiversityinformatics.amnh.org/open_source/maxent (accessed on 2 March 2025).
- Rothacher, Y.; Strobl, C. Identifying Informative Predictor Variables with Random Forests. J. Educ. Behav. Stat. 2024, 49, 595–629. [Google Scholar] [CrossRef]
- Ocean Acidification Program. Educational Partnership with Coastal and Non-Coastal Schools to Increase Ocean Acidification Literacy. NOAA Ocean Acidification Program. Available online: https://oceanacidification.noaa.gov/funded-projects/educational-partnership-with-coastal-and-non-coastal-schools-to-increase-ocean-acidification-literacy/ (accessed on 4 July 2025).
- Ocean Literacy Canada. Making Waves Inland: The Challenges for Ocean Literacy in Land-Locked Locations. Available online: https://oceanliteracy.ca/making-waves-inland-the-challenges-for-ocean-literacy-in-land-locked-locations/ (accessed on 4 July 2025).
- Govern de les Illes Balears. Relació de Criteris de Barem. Servei d’escolarització. 2025. Available online: https://www.caib.es/sites/escolaritzaciocurs/ca/relacia_de_criteris_de_barem (accessed on 5 July 2025).
- Ministerio para la Transición Ecológica y el Reto Demográfico (MITECO). Las Blue Schools como Herramientas para Fomentar la Alfabetización Oceánica. Seminario Red Educativa Marina (REEDUCAMAR). 2024. Available online: https://www.miteco.gob.es/content/dam/miteco/es/ceneam/grupos-de-trabajo-y-seminarios/reeducamar/2024/blueschools.pdf (accessed on 4 July 2025).
Disclaimer/Publisher’s Note: The statements, opinions and data contained in all publications are solely those of the individual author(s) and contributor(s) and not of MDPI and/or the editor(s). MDPI and/or the editor(s) disclaim responsibility for any injury to people or property resulting from any ideas, methods, instructions or products referred to in the content. |
© 2025 by the authors. Published by MDPI on behalf of the International Society for Photogrammetry and Remote Sensing. Licensee MDPI, Basel, Switzerland. This article is an open access article distributed under the terms and conditions of the Creative Commons Attribution (CC BY) license (https://creativecommons.org/licenses/by/4.0/).