Article

Spatio-Temporal Mapping of Violence Against Women: An Urban Geographic Analysis Based on 911 Emergency Reports in Monterrey

by
Onel Pérez-Fernández
1,2,
Octavio Quintero Ávila
3,4,*,
Carolina Barros
5 and
Gregorio Rosario Michel
6,7
1
Escuela de Geografía, Departamento de Cartografía, Universidad de Panamá, Panamá City 0824, Panama
2
Grupo de Investigación en Ciencia de Datos Geoespaciales (GICDGE), Centro Regional Universitario de Veraguas, Universidad de Panamá, Santiago de Veraguas 8007, Panama
3
Facultad de Derecho y Criminologia, Universidad Autónoma de Nuevo León, San Nicolas de los Garsa 66451, Mexico
4
Centro de Investigaciones de Cibercriminalidad, Derecho Digital y Ciberseguridad, Laboratorio Inteligencia Criminal y Estratégica, Universidad Autónoma de Nuevo León, San Nicolas de los Garsa 66451, Mexico
5
Departamento de Geografía, Universidad Complutense de Madrid, 28040 Madrid, Spain
6
Escuela de Agrimensura, Universidad Nacional Pedro Henríquez Ureña (UNPHU), Santo Domingo 10602, Dominican Republic
7
Escuela de Agrimensura, Facultad de Ingeniería y Arquitectura, Universidad Autónoma de Santo Domingo (UASD), Ciudad Universitaria, Santo Domingo 10103, Dominican Republic
*
Author to whom correspondence should be addressed.
ISPRS Int. J. Geo-Inf. 2025, 14(10), 367; https://doi.org/10.3390/ijgi14100367
Submission received: 28 July 2025 / Revised: 8 September 2025 / Accepted: 17 September 2025 / Published: 23 September 2025

Abstract

In Latin American cities, violence against women (VAW) remains critical for public health, well-being, and safety. This phenomenon is influenced by social, political, and environmental drivers. VAW is not randomly distributed; built environments—geography, ambient population, and street networks—influence criminal through spatial dependence across multiple scales. Despite growing interest in the spatial distribution of crime, few studies have explicitly explored the spatiotemporal dimensions of VAW in Monterrey. This study explores spatio-temporal patterns of VAW in Monterrey, Mexico, based on the analysis of 27,036 georeferenced and verified emergency reports from the 911 system (2019–2022). The study applies kernel density estimation (KDE), the Getis–Ord Gi* statistics, the Local Moran I index, and space–time cube analysis to identify spatial and temporal clusters of VAW. The results show concentrations of incidents during nighttime and weekends, particularly in northern and eastern sectors in Monterrey. The analysis reveals clusters in areas of high socioeconomic vulnerability. VAW in Monterrey follows predictable and cyclical patterns. These insights contribute to the design of tailored public policies and actions to improve women’s health, well-being, and safety in critical zones and timeframes. The findings also enhance international understanding of gender-based spatial violence patterns in the rapidly urbanizing contexts of the Global South.

1. Introduction

Violence against women (VAW) is a significant challenge in public health and human rights today [1]. VAW encompasses physical, sexual, emotional, psychological, and economic abuse, most often perpetrated by intimate partners [2,3]. The roots of VAW lie in persistent gender inequality and social norms that reinforce male dominance and female subjugation [4,5]. Globally, this problem affects women across all age groups and backgrounds [6]. For instance, about one in three women has faced physical or sexual violence in their lifetime, either from a partner or another individual [7,8,9]. These VAW experiences have significant consequences beyond physical harm, affecting women’s mental health, reproductive health, and overall well-being [10].
Recent studies emphasize the need for ethical, transdisciplinary, and methodologically sound approaches to study violence against women, particularly to address underreporting and promote integrated, evidence-based responses [11]. In this regard, the present paper addresses two main research questions to guide our work: Where and when are incidents of violence against women most likely to occur in Monterrey? and what spatial or temporal patterns can inform more effective, locally grounded public safety strategies?
This study aims to identify the spatial and temporal patterns of violence against women in Monterrey, Mexico, using emergency call data from the 911 emergency service. We apply advanced geographic information system (GIS) tools—specifically Getis–Ord Gi* and Local Moran’s I—to detect significant spatiotemporal clusters of reported incidents of VAW. By integrating environmental criminology, spatial statistics, and georeferenced emergency data, the study contributes localized, policy-relevant insights into VAW in urban Latin America.
Within this framework, spatial crime analysis becomes a valuable approach to understanding the territorial dynamics of VAW, supporting local authorities and policy-makers with targeted, place-based insights. Recent studies using GIS and emergency call data have identified VAW clusters in Monterrey, particularly in neighborhoods like Topo Chico, Fomerrey 25, and Colinas de San Bernabé. One study analyzing 35,085 reports of 911 emergency service from 2018 to 2022 found that over 77% were related to domestic violence and concentrated in areas with high levels of marginalization [12]. Using GIS tools, other researchers generated heat maps and temporal distributions to identify high-risk times and locations [13,14].
However, despite growing interest in the spatial distribution of crime, few studies have explicitly explored the spatiotemporal dimensions of VAW in Monterrey. While some recent GIS-based studies have mapped high-risk neighborhoods, most analyses have remained descriptive and lacked fine-grained spatial or temporal disaggregation [12,13,14]. This knowledge gap hinders the ability to design interventions grounded in localized evidence. Moreover, although 911 emergency calls provide valuable real-time data, they are subject to well-known limitations including underreporting, misclassification, and variability in reporting behavior. These factors must be considered when interpreting spatial patterns.
By applying spatial analysis techniques, environmental criminology and spatiotemporal statistics, our study offers a novel perspective to examine violence against women in Monterrey, as an example of typical Latin American urban context. This study contributes to the field by identifying specific spatial and temporal hot spots of VAW, using advanced GIS tools to generate actionable knowledge for public policy. The findings are intended to serve as a spatially grounded roadmap to guide local authorities to prioritize resources, design targeted interventions, and reduce the risk of VAW in vulnerable communities in Monterrey, and other similar Latin America cities. Therefore, this study contributes new insights from a Latin American perspective to enhance international understanding of gender-based spatial violence patterns in rapidly urbanizing contexts of the Global South.
The paper is structured as follows: the remainder of Section 1 briefly presents the context of VAW and the spatial analysis techniques used. Section 2 explains the research methodology approach undertaken in this research. Section 3 presents our results on the spatio-temporal analysis of VAW in Monterrey, Mexico. In Section 4, we discuss our findings. Finally, Section 5 closes the paper by presenting our main conclusions and implications.

1.1. Violence Against Women in Context

In Mexico, the 2021 National Survey on the Dynamics of Household Relationships revealed that 70.1% of women have experienced some form of violence, while the 2024 “Así Vamos” survey found that 38.2% of respondents perceive domestic violence against women as frequent or constant—rising to nearly 40% in the Monterrey Metropolitan Area [15,16]. Official statistics confirm that 68.1% of women aged 15 and over in Nuevo León have experienced violence, with a state target to reduce this to 63% by 2027. Among those affected nationally, psychological violence is most prevalent (51.6%), followed by sexual (49.7%) and physical violence (34.7%) [17]. These trends are particularly alarming in domestic and community settings, where emotional, sexual, and economic abuse are pervasive.
Systematic reviews from Latin America highlight the severe mental health outcomes of intimate partner violence, including depression and post-traumatic stress disorder, pointing to a significant gap in prevention and intervention strategies [18]. Nuevo León, where Monterrey is located, consistently rank among the Mexican states with the highest rates of Gender-Based Violence (GBV). As the state capital and an industrial center, Monterrey faces complex social dynamics—including high population density, socioeconomic inequality, and internal migration—all of which are known to heighten the risk of violence [19,20]. National surveys often overlook localized phenomena, yet urban pressures—especially in informal settlements and socially excluded areas—may intensify GBV [21].
The INEGI survey serves as the primary tool for assessing the magnitude, type, and context of violence experienced by Mexican women aged 15 and older. Beyond lifetime prevalence, this survey indicates that 42.8% of women have experienced violence in the past twelve months [17]. The data reveal a predominance of psychological violence (51.6%), followed by sexual (49.7%) and physical violence (34.7%). These patterns are particularly concerning in intimate partner community contexts, where women frequently report emotional, sexual, economic, or physical abuse.
Several studies in Monterrey utilizing 911 emergency call data and GIS-based spatial analysis have identified concentrated clusters in areas such as Topo Chico, Fomerrey 25, and Colinas de San Bernabé. Other authors studied 35,085 reports from 2018 to 2022 and found that over 77% of GBV incidents were related to domestic violence in socioeconomically marginalized areas [11]. The researchers used GIS tools to create heat maps and analyze incidents by the hour, identifying areas and times when violence was most likely to occur.
Furthermore, domestic and VAW are among the top three public safety concerns for Monterrey residents, making up 3.5% of direct mentions. These findings match official data from the State Institute for Women, which shows that 68.1% of women aged 15 and older in Nuevo León have experienced some form of violence in their lifetime. The Mexican state government aims to reduce this figure to 63% by 2027 through coordinated institutional responses and public policy [16].

1.2. Spatial Analysis Techniques Applied to Crime

Before examining violence against women in Monterrey, it is important to assess how spatial analysis techniques have been widely applied to the crime studies. Standard geospatial techniques applied for the crime analysis, include tools such as kernel density estimation (KDE), the Getis–Ord Gi* statistic, and Local Moran’s I. These tools help identify significant crime clusters in cities [22,23]. They also allow researchers to spot persistent, emerging, or sporadic spatial patterns [24,25,26]. For instance, Quintero et al. [12] analyzed 911 Emergency System reports, between January 2018 to December 2022, to locate incidences of gender-based crime in Monterrey, Mexico. Recent studies, such as Pérez-Fernández et al. [27], have demonstrated the utility of combining analysis of geospatial and statistical patterns to uncover localized, statistically significant space–time clusters in urban settings to improve decision-making and formulate public policies to reduce spatial disparities in the Caribbean and Latin American countries. The DBSCAN algorithm helps identify spatial clusters, as it does not require predefined shapes. This algorithm is helpful when analyzing long-time series [28]. Advanced tools, such as Space–Time Pattern Mining and Emerging Hotspot Analysis (EHSA) in ArcGIS Pro, aid in identifying rapidly or gradually changing crime patterns. These methods are particularly advantageous in urban studies that require high temporal and spatial resolution [22,24,26].
Choosing the right spatial aggregation unit is crucial. Past studies have employed police quadrants, regular grids, buffer zones, and census tracts, each of which has affected our understanding of crime. For instance, Nepomuceno et al. [29] caution that using incorrect spatial units can lead to ecological fallacies, thereby obscuring the accurate distribution of crime. In contrast, multiscale approaches better capture hidden patterns across different spatial scales. This is especially important for complex issues like gender-based violence [23,30]. In this context, ArcGIS Pro is a powerful tool that enables users to combine multiple analytical layers and work with various spatial units [23,29].
Crime patterns have also been studied at specific times, like nighttime. Researchers have looked at links between artificial lighting, socioeconomic factors, and crime using Geographically Weighted Regression. This has been performed in cities such as Vienna [31]. Wang and Li [32] studied London during COVID-19 lockdowns. They used Bayesian spatio-temporal models and Geographically Weighted Logistic Regression (GWLR). Their work showed how crime patterns changed in detail. Beyond general crime patterns, these spatial analysis techniques have been applied to other manifestations of violence. For instance, Carrillo-Brenes and Vilches-Blázquez [25] used time series and spatial autocorrelation methods, like Global and Local Moran’s I. They studied child sexual abuse patterns in Mexico City before, during, and after the COVID-19 pandemic. Their work highlighted how factors like poverty and education interact with these patterns. A recent literature review shows a shift from simple models to advanced machine learning and deep learning methods. These new techniques can capture the changing patterns of crime over time and space at different scales [33].

1.3. Literature Review: Spatial Analysis Applied to VAW

The literature on violence against women has advanced using geospatial methods. Recent studies have revealed the complexity of violence patterns, not only in their geospatial manifestation but also in their reporting and underlying factors. Roy et al. [23] used KDE and Getis–Ord Gi* in India to identify hot spots of sexual harassment and domestic violence. Their findings linked these issues to structural factors in urban areas.
The violence against women (VAW) has been the subject of detailed spatial analysis. For example, in Valencia, Spain, Gracia et al. [34] conducted an eight-year spatio-temporal longitudinal study on intimate partner violence against women, demonstrating that disadvantaged neighborhoods experience a chronic and persistent risk of violence. More recent investigations have delved into the spatio-temporal heterogeneity of sexual violence. In the U.S. context, Bunch et al. [35] demonstrated how neighborhood traits, such as population density and poverty, influence the distribution of domestic violence. In Mumbai, India, Wei et al. [36] investigated the effects of macro- and micro-level built environment on sexual violence against women, revealing that places like maternity homes, casinos, cybercafes, and public toilets can be hot spots, and that these impacts vary significantly between day and night, and from urban centers to suburbs using GWR and GTWR models. It is also revealed that it is crucial to address the dark figures of crime in spatial analysis, especially in violent contexts.
In Latin America context, Ibarra-Cabrera et al. [37] found that rates of violence against women (VAW) in Peru relate directly to socio-environmental factors. These factors include low population density, rural areas, poverty, illiteracy, and the number of women of childbearing age and young mothers. This study highlights the need for careful public services planning in high-risk areas. Similarly, Melo et al. [38] examined the spatial dark figures of rapes in Campinas, Brazil, comparing incident patterns from police and hospital sources. Their findings indicated that only half of the spatial patterns of reported and unreported rapes overlapped, which highlights the need to use multiple data sources to gain a complete picture of crime distribution and to improve place-based prevention measures.
This body of work reinforces that spatial analysis can go beyond mapping incidents to increase the understanding of the systemic conditions that foster VAW. However, significant gaps remain in the literature. Predictive models combining spatiotemporal analysis with social factors or machine learning are still uncommon in crime analysis [39]. Additionally, the lack of standardization in analysis units and methods complicates cross-context comparisons. Violations against women frequently receive insufficient representation in spatial analyses conducted within Latin America. Furthermore, when these issues are examined, the consideration of temporal factors is often neglected. These limitations highlight the importance of studying VAW in cities like Monterrey, where spatial inequalities intersect with social risk factors. This study uses ArcGIS Pro to conduct space–time pattern analyses (EHSA, Space–Time Pattern Mining) based on high-resolution georeferenced data from a Latin American urban area marked by significant social inequalities.

2. Materials and Methods

2.1. Study Area

The researchers focused the study on the municipality of Monterrey, in the state of Nuevo León (see Figure 1). This municipality is part of the Monterrey Metropolitan Area (MMA), one of the most populated regions in Mexico, with 5,434,171 inhabitants [40]. This urban area features a blend of socioeconomic backgrounds, varying urbanization levels, and distinct spatial divides. These disparities make Monterrey a relevant case for analyzing complex social problems, such as VAW, from both criminological and geographic perspectives.
We used georeferencing techniques to classify neighborhoods (colonias) into five urban zones. These zones are the North Zone, South Zone, West Zone, Huajuco Zone, and Central Zone. We based this classification on their geographic positions and official maps. Neighborhoods were assigned to zones using geographic centroids and shapefiles provided by the municipal government. This segmentation allowed us to view the phenomenon by territory. It also helped create thematic maps showing the density and geographic spread of incident reports. This spatial division aligns with administrative and planning criteria used locally, enabling more effective interpretation of the results for policy-making purposes.

2.2. Methods

This study analyzed reports of VAW made to Mexico’s 911 emergency system in Monterrey from January 2019 to December 2022. The dataset comprises high-resolution, georeferenced incidents records, each containing precise location and timestamp information. A spatio-temporal analytical framework was adopted, integrating descriptive statistics, spatial clustering techniques, and time-series analysis. IBM SPSS Statistics (v26) was used for the temporal and statistical exploration, while ArcGIS Pro 3.4.3 supported the spatial analysis. We applied kernel density estimation (KDE), Getis–Ord Gi*, Local Moran’s I, and Space–Time Cube Analysis to generate a multidimensional understanding of violence patterns and evolution.

2.2.1. Data Processing

The initial database was sourced from 911 emergency service reports, downloaded from Monterrey’s open data portal (https://mide.monterrey.gob.mx/catalogue/#/dataset/92, accessed on 7 June 2025). It comprises 151,644 unique criminal incidents reported from 2019 to 2022. Each entry provides information such as the street name, type of crime, geographic coordinates, and timestamp.
We implemented the following inclusion and exclusion criteria:
Inclusion: reports classified as “confirmed events” from 2019 to 2022 include the following categories: domestic violence, intimate partner violence, violence against women, sexual abuse, sexual harassment, rape, and related offenses.
Exclusion: records labeled as “canceled”, “false alarm”, or those without a precise criminal classification.
Elimination: duplicates, records with invalid coordinates, time/date discrepancies, or cases that cannot be georeferenced.
We carried out the following preprocessing steps to prepare the data for spatial and temporal analysis:
Temporal standardization: we grouped the date variable into months. This helps us analyze trends throughout the year.
Hourly rounding: we rounded the incident time to the nearest hour. For example, 19:44 became 19:00. This helps us create hourly bands.
Spatial cleaning: we standardized neighborhood names (colonias). If coordinates were missing, we used OpenStreetMap-based services for geocoding.
Zonal classification: each neighborhood belongs to one of five zones: North, South, Center, West, or Huajuco. This was performed using verified coordinates (latitude and longitude).
These procedures resulted in a curated spatiotemporal dataset suitable for both exploratory visualization and inferential analysis.

2.2.2. Temporal Analysis

Temporal analysis was performed using descriptive statistics in IBM SPSS Statistics version 26. Monthly time series for 2019–2022 were visualized using line graphs to identify seasonal fluctuations and recurring patterns. Additional time-related variables such as the month of report, the day of the week, and the rounded hour of reception enabled the generation of hourly heat maps.

2.2.3. Spatial Pattern Analysis

To conduct spatial analysis, the cleaned CSV was converted into a point feature layer and spatially joined to 491 Basic Geo-statistical Areas (AGEBs), Monterrey’s official territorial units. To detect annual spatial crime patterns, the date of each incident was used as the temporal reference. This study used the following spatial clustering techniques:
Hot Spot Analysis (Getis–Ord Gi*).
This method identifies clusters of high or low incident values by comparing the local mean against the global mean. Significant z-scores indicate hot (positive) or cold (negative) spots, with p-values signaling statistical significance. Getis–Ord Gi* statistic was used to compare crime incidence across years and identify AGEBs with significant clustering. In hot spot analysis, an AGEB is defined as a hot spot if its local mean significantly exceeds the global mean. The magnitude and nature of significance are evaluated using the z-score and p-value. AGEBs with significantly positive z-scores indicate spatial clustering of high values (hot spots), while significantly negative z-scores represent clustering of low values (cold spotss). The p-value indicates the level of statistical significance [41]. These techniques enabled us to detect stable and shifting spatial concentrations of violence. They also helped isolate critical zones that show statistically significant deviations from the citywide average.
The formula for Getis–Ord Gi* is as follows [23]:
G i = j = 1 n w i j x j X ¯ j n w i j S n j = 1 n w i j 2 j = 1 n w i j 2 n 1
where
x j = attribute value at location j
w i j = spatial weight between locations i and j
n = number of observations
X ¯ = mean of x
S = standard deviation of x
Cluster and Outlier Analysis (Local Moran’s I).
Another commonly used clustering technique is Anselin’s Local Moran’s I, also known as Local Indicators of Spatial Association (LISA). This method is similar to hot spot analysis but adds the capacity to detect local outliers, or features that differ significantly from their neighbors. Spatial analysis relies on spatial autocorrelation. This means that nearby locations often show similar values. A significant disparity between a unit and its neighbors suggests the presence of processes requiring deeper investigation. Unlike Getis–Ord Gi*, Local Moran’s I does not rely on predefined neighborhoods, allowing a differentiated comparative approach. This analysis addresses two key questions: Is there a significant difference between the neighborhood mean and the global mean? Does the feature value significantly differ from its neighbors [41]?
It is calculated as follows [42]:
I = i = 1 n j = 1 n w i j x i x ¯   x j x ¯ S 2   i = 1 n j = 1 n w i j
where
I = Local Moran’s I value
x i , x j = attribute values at location i and j
X ¯ = global mean
w i j = spatial weight matrix
S 2 = variance of x
Both techniques helped find important patterns of VAW in Monterrey from 2019 to 2022. In particular, Local Moran’s I facilitated the detection of spatial clusters and outliers that diverge from surrounding patterns.
Emerging Hot Spot Analysis (EHSA).
Emerging Hot Spot Analysis (EHSA) is known as a powerful spatio-temporal statistical technique for the identification of clustering patterns of geographic phenomena and how these patterns change over time [43]. It is part of Exploratory Spatial Data Analysis (ESDA) tools and is particularly useful for big geospatial data analysis, where visual inspection of complex patterns at multiple spatial and temporal scales is infeasible [43,44]. The EHSA methodology is based on combining two key statistics [43,44,45]: (1) Getis–Ord Gi* statistic: This measures the intensity of clustering of high or low values (i.e., event counts such as VAW reports) in a location (bin) relative to its neighboring locations in the data cube. It generates Z-scores (standard deviations) and p-values (statistical probabilities) for each bin, indicating whether the clustering is statistically significant. A high Z-score and low p-value suggest a significant “hot spot,” while a low Z-score and low p-value indicate a “coldspot” [43]; and, (2) Mann–Kendall trend test: This is a non-parametric statistical test that assesses whether a significant temporal trend (increasing or decreasing) exists in the time series of the Z-scores from the Getis–Ord Gi* statistic for each bin [43,45].
This research employed EHSA to detect temporal trends and spatial clustering. Based on the Getis–Ord Gi* statistic [24], it categorizes evolving patterns over time. EHSA categorizes areas based on their clustering characteristics, such as hot- or coldspots. It uses traits such as intensifying, persistent, diminishing, sporadic, oscillating, or historical patterns. These traits depend on their consistency over time [46]. EHSA provides a dynamic perspective into how the spatial risk of VAW reports evolves. EHSA has seen widespread adoption across a variety of fields, including environmental studies, public health, crime analysis, and urban planning, providing nuanced insights into dynamic spatial phenomena [43,45].

2.2.4. Spatial Parameter Selection

A fixed-distance spatial weights matrix was employed for both Getis–Ord Gi* and Local Moran’s I analyses. This helped compare different AGEBs by size and density. This method showed how the surrounding environment changes [22,47,48]. The chosen distance came from three methods: Ripley’s K-function at 3500 m, Incremental Spatial Autocorrelation at 4000 m, and Optimized Hotspot Analysis at 2400 m. A weighted average of these results produced a final band distance of 3300 m. The alignment of these methods provided a robust and coherent spatial framework, thereby enhancing the reliability of the spatial analysis.

2.2.5. Hourly Band Spatio-Temporal Analysis

Incidents were grouped into hourly intervals, to introduce a temporal dimension into the spatial analysis. This allowed detection of shifts in incident distribution throughout the day. VAW is a complex social issue [6,49]. It influenced by daily routines, patterns of surveillance, and the presence or absence of potential aggressors or witnesses [50]. To capture intra-day temporal variation, the 24 h period was segmented into four time intervals:—Early Morning: 00:00–06:00—Morning: 07:00–12:00—Afternoon: 13:00–18:00—Evening: 19:00–23:00, to examine potential temporal variations in the spatial distribution of violence. These time intervals were informed by previous studies on VAW and urban crime cycles in comparable cities [51,52,53]. These periods reflect differences in social activity, mobility, and exposure to public vs. private spaces [54]. Each time segment was analyzed independently using Getis–Ord Gi* and Local Moran’s I with a fixed-distance spatial weights matrix (see Section 2.2.4). This approach enabled us to determine whether spatial clusters of incidents remained stable or changed throughout the day. It looked at their location, intensity, and shape. This helped identify risk conditions and guided time-specific public policy.

2.2.6. Density Analysis

Kernel density estimation (KDE) was used to generate spatial interpolation, yielding continuous surface maps of incident density. It utilizes a kernel function to estimate event intensity over a specific area. This creates continuous surface maps that show how crime events vary in density [55]. KDE is one of the most widely used cartographic techniques for visualizing crime hot spots, due to its availability in GIS platforms, effectiveness in highlighting concentrations, and high visual clarity [56,57,58]. This method created density maps for different types of VAW. It helped visualize areas with high concentrations in the urban landscape. In this study, we applied KDE using a fixed bandwidth of 3300 m, which corresponds to the same spatial scale used in the fixed-distance band for Getis–Ord Gi* and Local Moran’s I analyses. This distance was empirically derived from a weighted average of three spatial autocorrelation diagnostics: Ripley’s K-function, Incremental Spatial Autocorrelation, and Optimized Hotspot Analysis, each of which identified clustering thresholds between 2400 and 4000 m. By selecting a consistent distance across spatial techniques, we ensured analytical coherence and grounded the smoothing parameter in the actual scale of spatial dependence observed in the data. This bandwidth also aligns with the approximate spatial extent of neighborhood-level phenomena in Monterrey, enhancing the interpretability of the resulting density surfaces.
The KDE equation is:
f x , y = 1 n h 2 i = 1 n k d i h
where
f x , y = density value at location x , y
n = number of events
h = bandwidth
d i = distance between crime event i and location x , y
k = kernel function
Each x , y represents the coordinates of an incident of violence against women [56]. Spatial analysis revealed the persistence of hot spots over time and distinct spatial variations across urban zones, suggesting a potential link to structural, socioeconomic, and housing vulnerability factors.

3. Results

This section is divided into three components: descriptive statistics, temporal patterns, and spatial patterns. It examines a total of 27,036 validated reports of violence against women sourced from the 911 Emergency System in Monterrey, spanning the years 2019 to 2022. The ensuing analysis offers a comprehensive spatial and criminological perspective grounded in structural, social learning, and opportunity theories.

3.1. Descriptive Statistics

Table 1 presents daily descriptive statistics of violence against woman (VAW) cases. The annual distribution of 911 emergency reports from 2019 to 2022 shows an upward trend during the first three years, followed by a slight decline in 2022. On average, the number of reports per analysis unit was 17.8 in 2019, rising to 19.7 in 2020, and 20.4 in 2021, marking the peak of the period. In 2022, there was a modest drop, with an average of 19.9 reports. It also had the highest standard deviation (SD = 9.29), indicating increased dispersion in the data.
The maximum number of reports increased over the years—from 51 cases in 2019 to 55 in 2022—while minimum values fluctuated between 1 and 5. These variations may reflect patterns of underreporting or shifts in local reporting behavior.
The highest annual volume was recorded in 2021 (7449 cases), followed by 2020 (7221). This trend may relate to the COVID-19 pandemic, which brought more psychosocial stress and structural issues due to lockdowns, isolation, and economic crises. This behavior illustrates the need for a multi-year planning perspective. It helps with resource allocation and designing prevention strategies. We must also consider factors such as public health crises, economic downturns, and shifts in how institutions respond. From a structural criminology point of view, this shows ongoing social and cultural issues. These issues keep gender inequality alive and make violence seem like a way to solve problems.
Table 2 presents a cumulative frequency analysis by crime type. An analysis of crime incidents from 2019 to 2022 shows apparent differences in size and variation. Domestic violence is the most common crime. It shows an average of 15.2 reports each period, with a standard deviation of 7.0. The highest number of cases reached 48, totaling 21,128 incidents. This prevalence highlights enduring structural issues within domestic settings and underscores the urgent need for policy intervention focused on prevention and effective response strategies. Intimate partner violence follows, characterized by a mean of 3.4 reports (SD = 1.9) and a maximum of 14 incidents, totaling 4437 cases. The observed variability indicates that incidents occur frequently, but not uniformly over time.
In contrast, incidents of sexual crimes reflect markedly lower means: sexual abuse has a mean of 1.2 (SD = 0.4), sexual harassment averages 1.1 (SD = 0.4), and rape also has a mean of 1.1 (SD = 0.4). These low numbers suggest two things. First, there may be a real decrease in incidents. Second, there may be significant underreporting, particularly in cases of revictimization or fear of reporting. The category’ Other acts against sexual freedom and safety’ shows a steady mean of 1.0 (SD = 0.0). There is no yearly change. This might suggest a consistent way of classifying or a set limit for recording these offenses. Meanwhile, the general category violence against women (Mean = 1.3, SD = 0.6) shows mild dispersion and totals 654 cases. This highlights the need to differentiate this general category from other, more specific VAW types to improve data precision and avoid redundancy. These results show patterns in crime frequency, stability, and variability by type. This information is key for planning targeted interventions, allocating resources, and assessing public safety and violence prevention policies.
Table 3 displays descriptive statistics for emergency reports by day of the week across four consecutive years (2019–2022). The analysis reveals a consistent weekly trend, with Sunday reporting the highest average across all years—23.0 in 2019, rising to 28.0 in 2021, then slightly declining to 25.3 in 2022. This persistent increase suggests a systematic concentration of violent incidents during weekends, potentially linked to sociocultural and situational factors such as increased family interaction, alcohol consumption, and reduced institutional surveillance.
Saturdays also showed an upward trend, rising from 18.9 (2019) to 23.2 (2022), reinforcing the so-called weekend effect. Tuesdays and Wednesdays had the lowest averages, ranging from 15.3 to 18.8. This shows less reporting during the middle of the week. Standard deviations were moderate to high, especially on weekends. For example, the Sunday SD was 10.0 in 2022.
This shows week-to-week variability. It may be due to specific events, such as holidays, sports, or paydays. These patterns demonstrate the importance of carefully planning police and social services on high-risk days, particularly on weekends. They also support the addition of time factors to predictive policing models and community violence prevention efforts.

3.2. Temporal Pattern Analysis

3.2.1. Pre-Pandemic Behavior (2019)

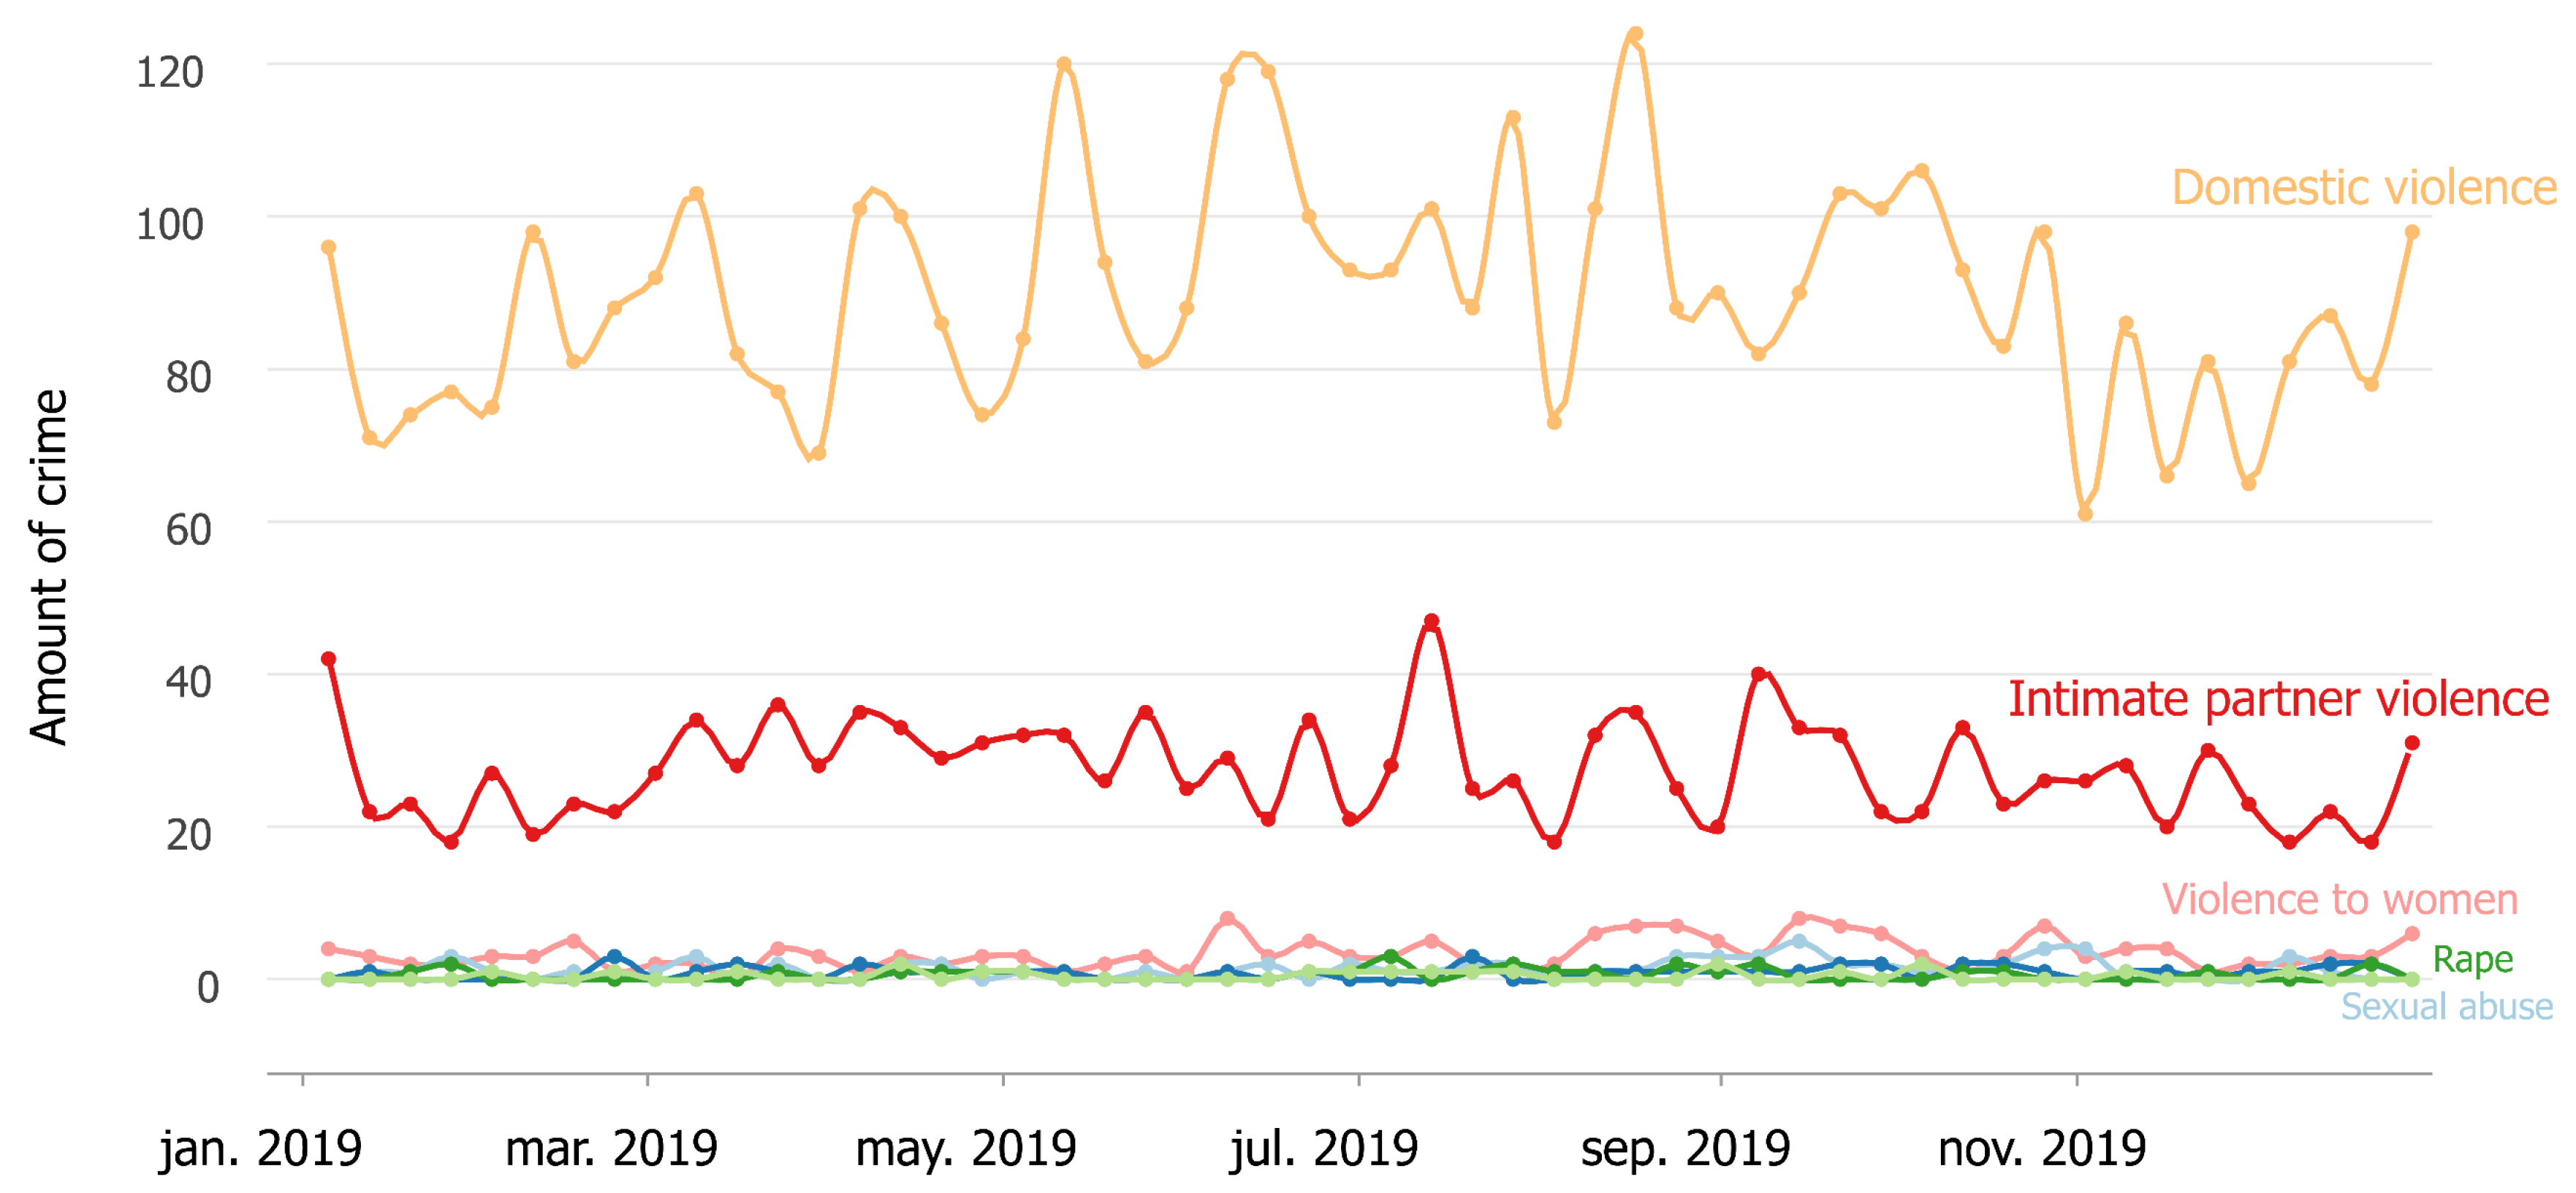
Figure 2 shows the weekly distribution of VAW reports recorded by the 911 Emergency System in Monterrey during 2019. The data reveal a strong pattern of domestic violence. It averaged 80 to 120 incidents each week. In contrast, intimate partner violence was lower, with 20 to 40 cases. More serious crimes like violence against women, sexual abuse, sexual harassment, and rape remained low, with fewer than 10 incidents each week. However, their impact on society is significant. This pattern reveals that even in non-pandemic conditions, aggressive dynamics within the domestic sphere constitute the core of the issue. These findings support social learning theory [59]. This theory suggests that violent behaviors spread and become normal in families. They do this through observation, imitation, and reinforcement. The graph shows steady weekly trends. This means risks come from a stable social structure, not just short-term events. The steady levels indicate that violence remains a persistent threat. This suggests that there are deep-rooted issues, not just temporary changes.

3.2.2. Pandemic Impact (2020)

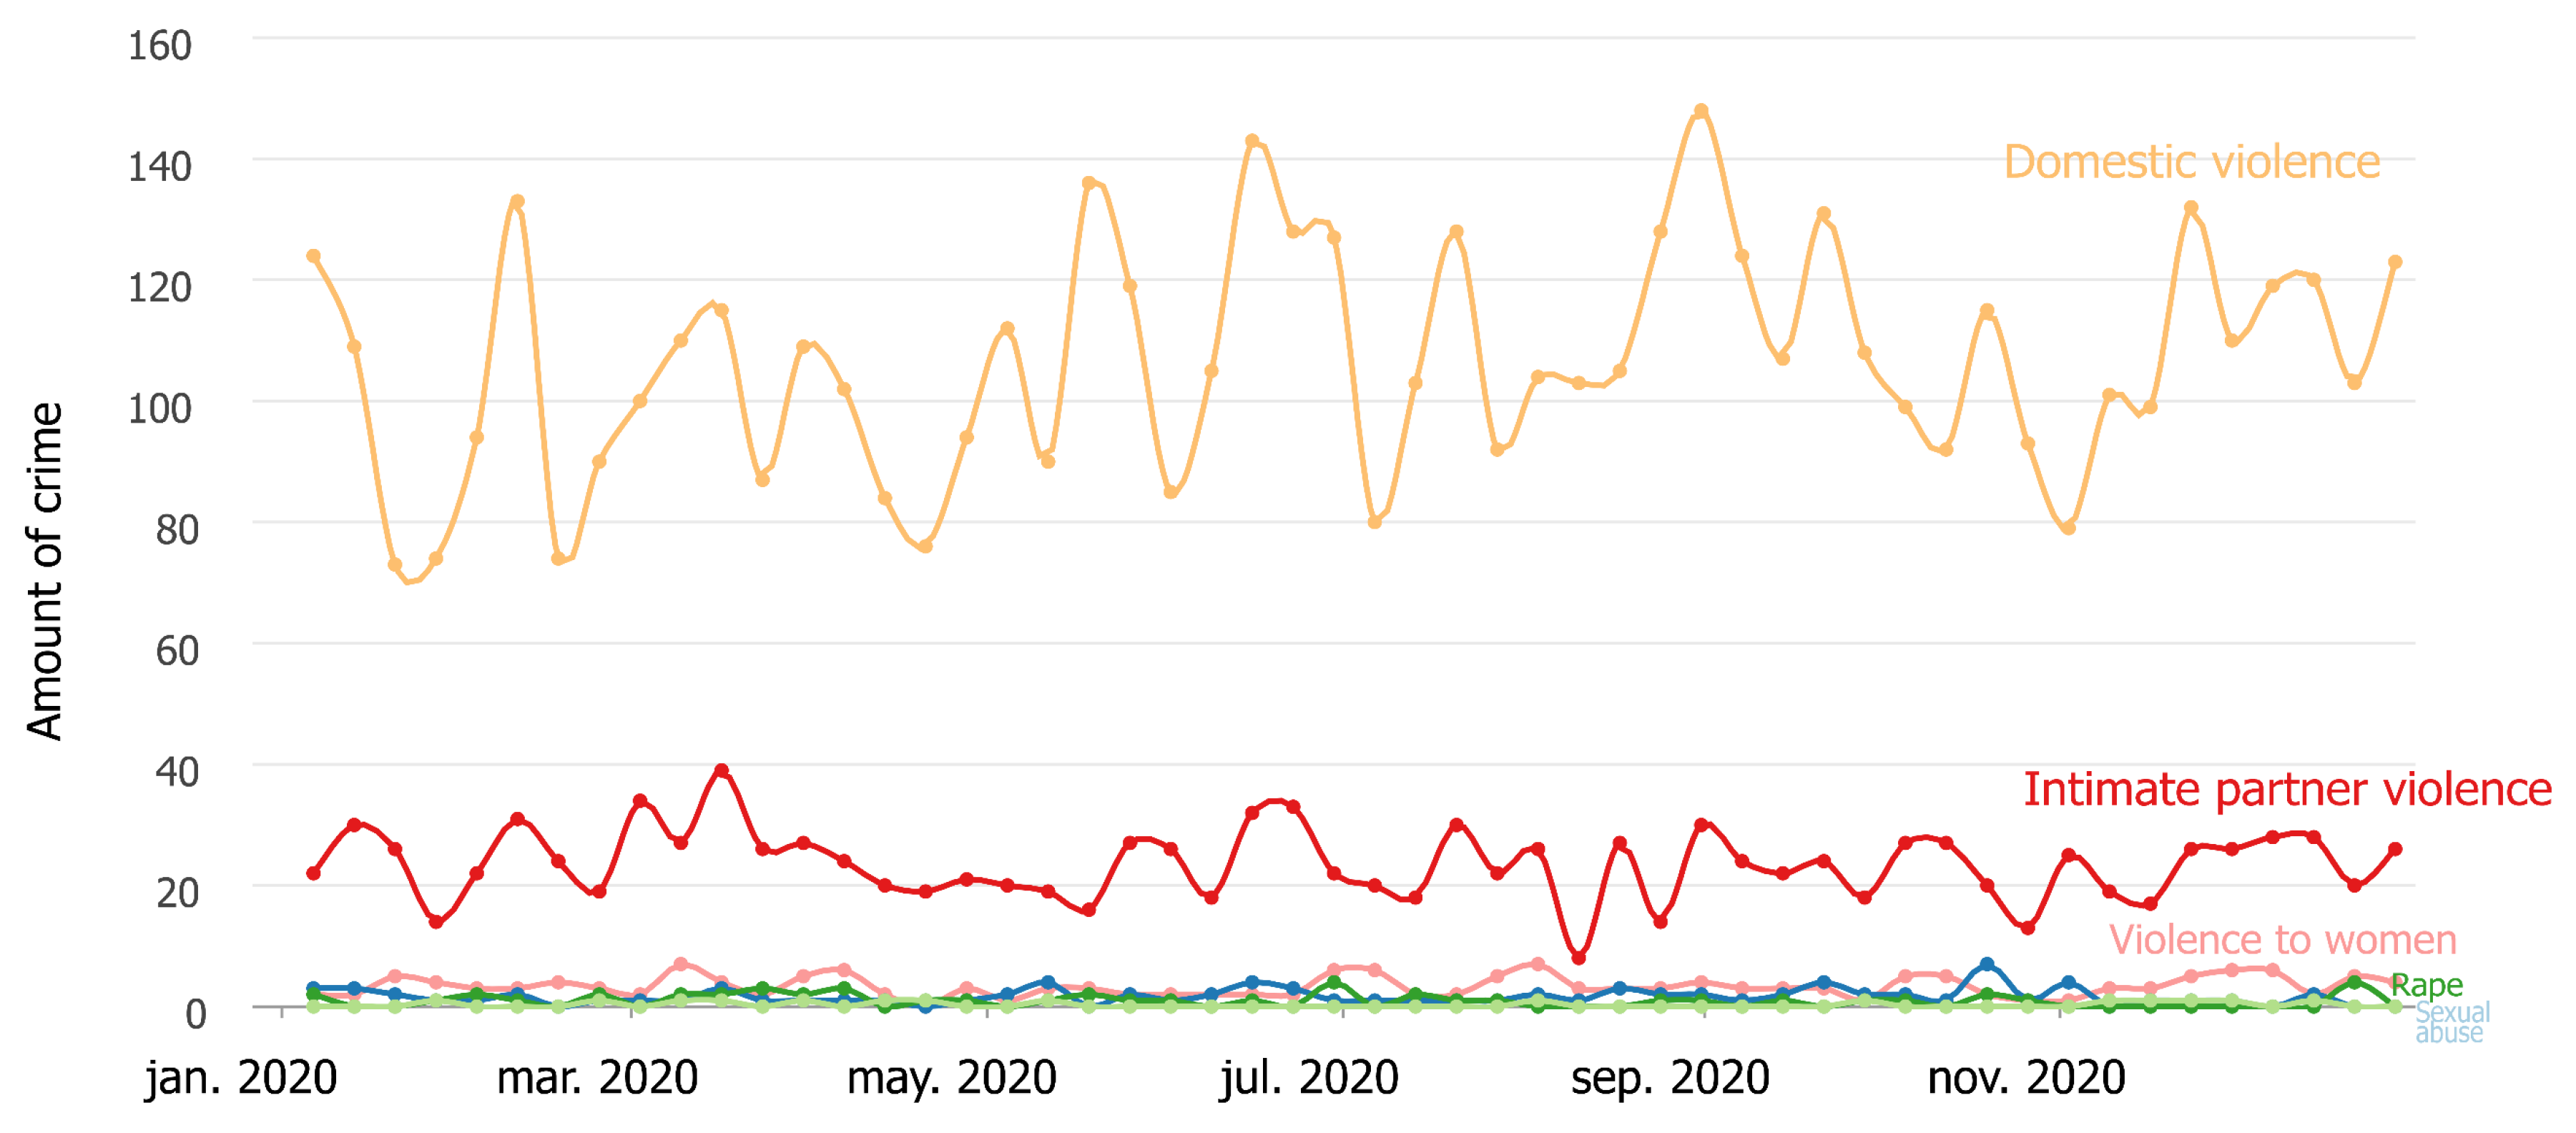
Figure 3 shows the 2020 data. This year, the COVID-19 pandemic and subsequent lockdowns have significantly altered social dynamics. The graph shows a notable increase in domestic violence, reaching 120 to 140 weekly incidents, representing an 11.5% increase compared to the previous year.
Sexual crimes and intimate partner violence stayed at 2019 levels. Nevertheless, there was a rise. According to [60], VAW increased by 20–30% globally during lockdowns. This surge is not just a temporary change. It is a rise in long-standing tensions. Prolonged confinement, social isolation, and increased household stress have made things worse. The findings highlight how structural vulnerabilities can be exacerbated in crisis contexts, underscoring the need for adaptive, crisis-sensitive public safety and social policy frameworks.

3.2.3. Peak of Violence Against Women (2021)

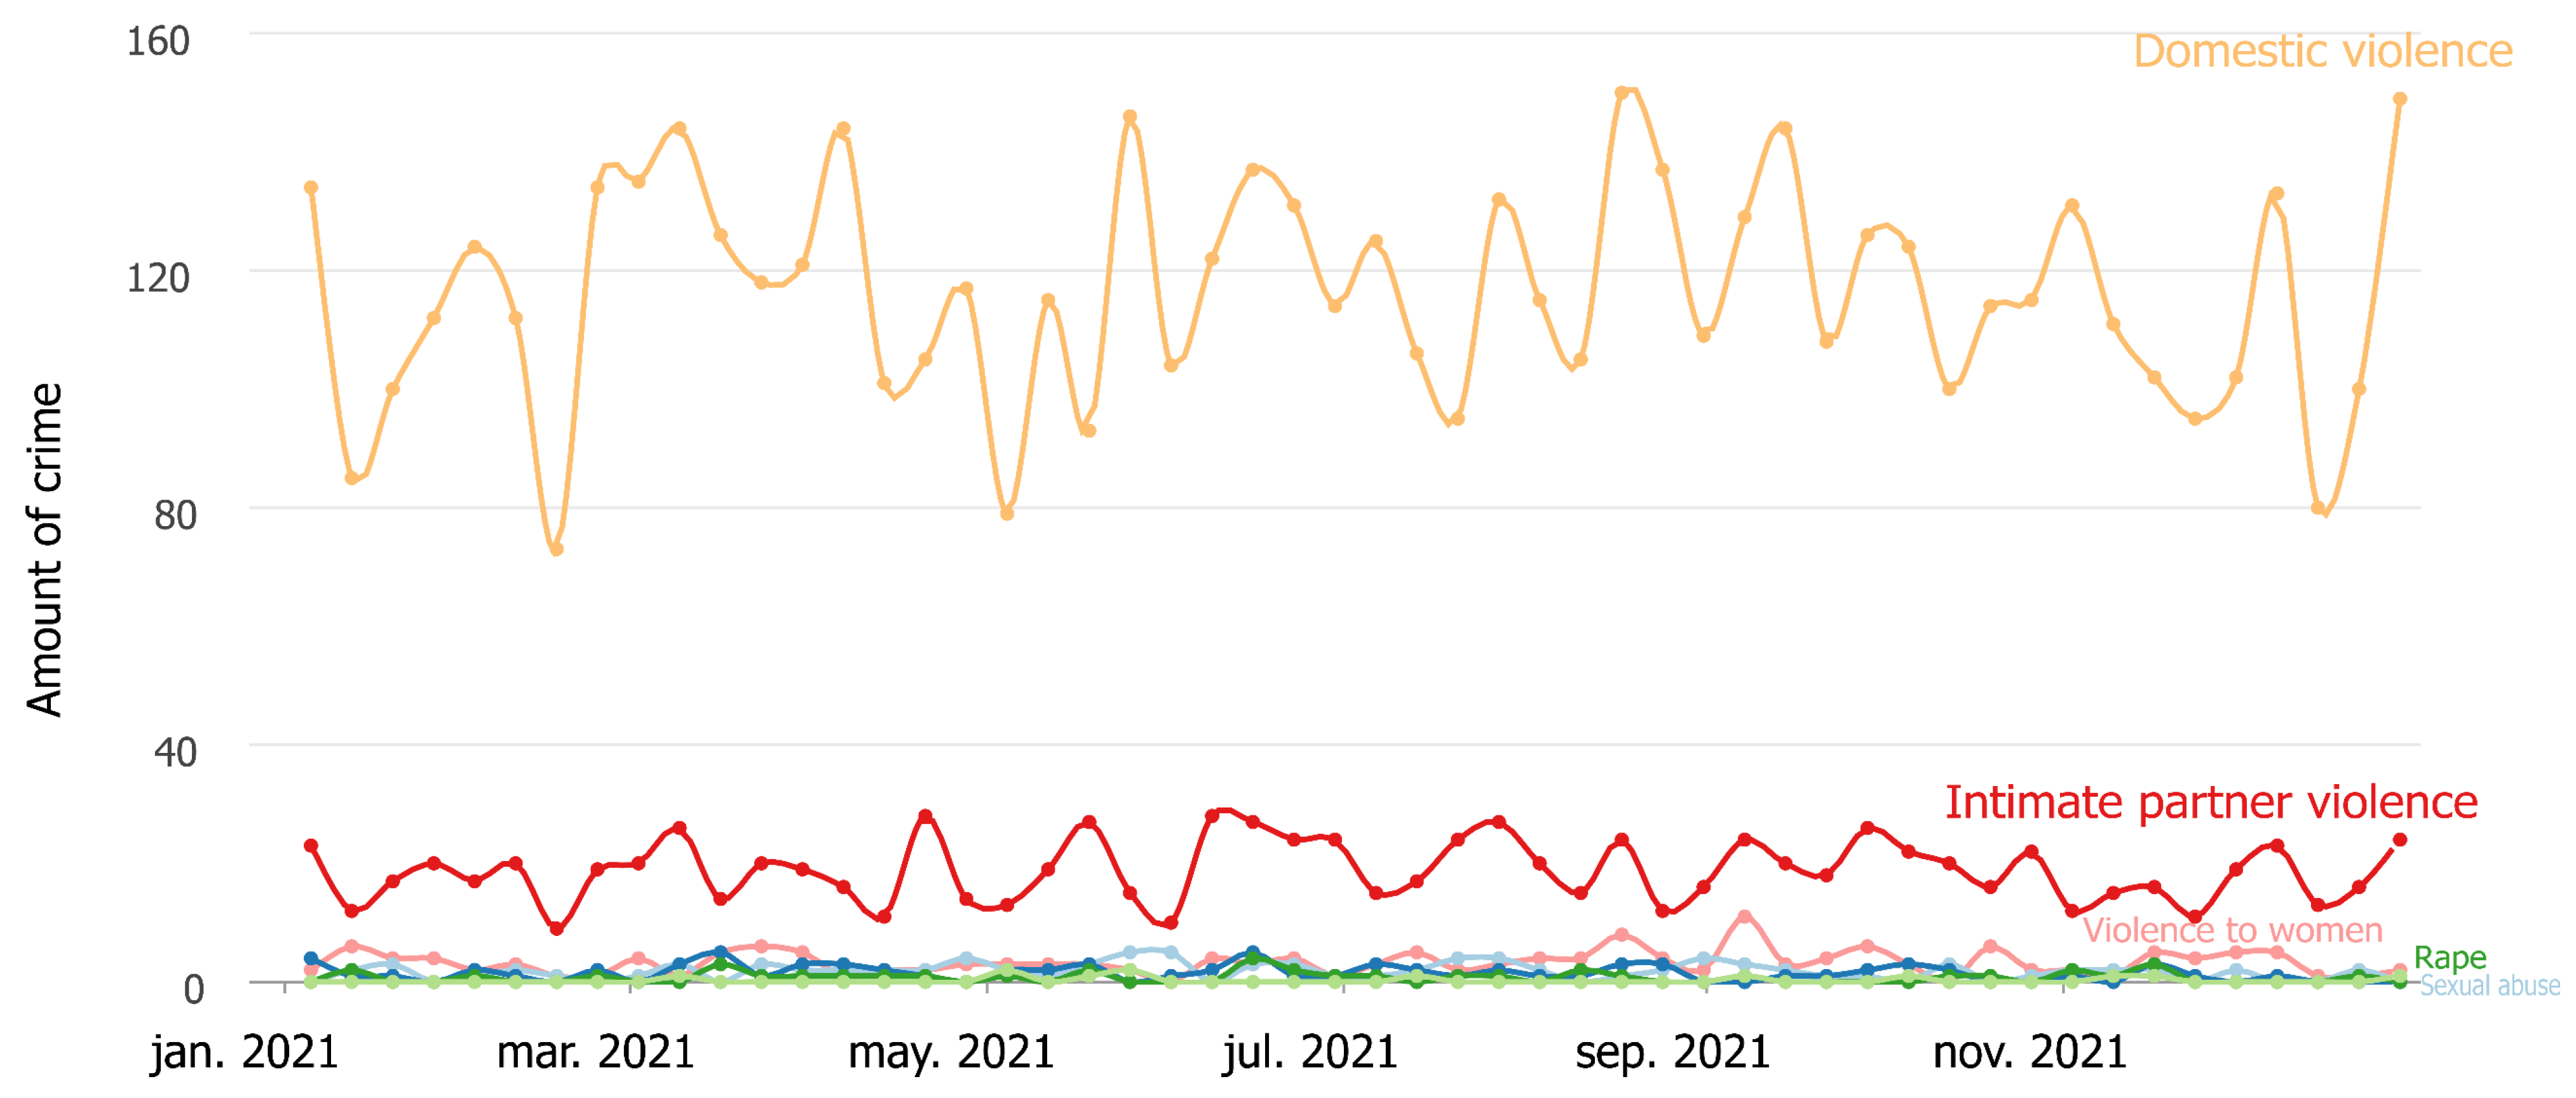
Figure 4 presents data for the year 2021, identified as the peak year in the analysis, with a reported 150 weekly domestic violence incidents. Even with some pandemic restrictions lifted, violence did not drop. This shows that underlying issues—like patriarchal norms, domination patterns, and economic control—still drive VAW. Peaks appeared in March, June, and October. These months likely coincide with the school year, holidays, and festive seasons. During these periods, family dynamics often become more complex. This behavioral pattern reinforces the notion that VAW is a structural issue, not merely a consequence of exceptional circumstances or temporary stressors.

3.2.4. Post-Pandemic Stabilization (2022)

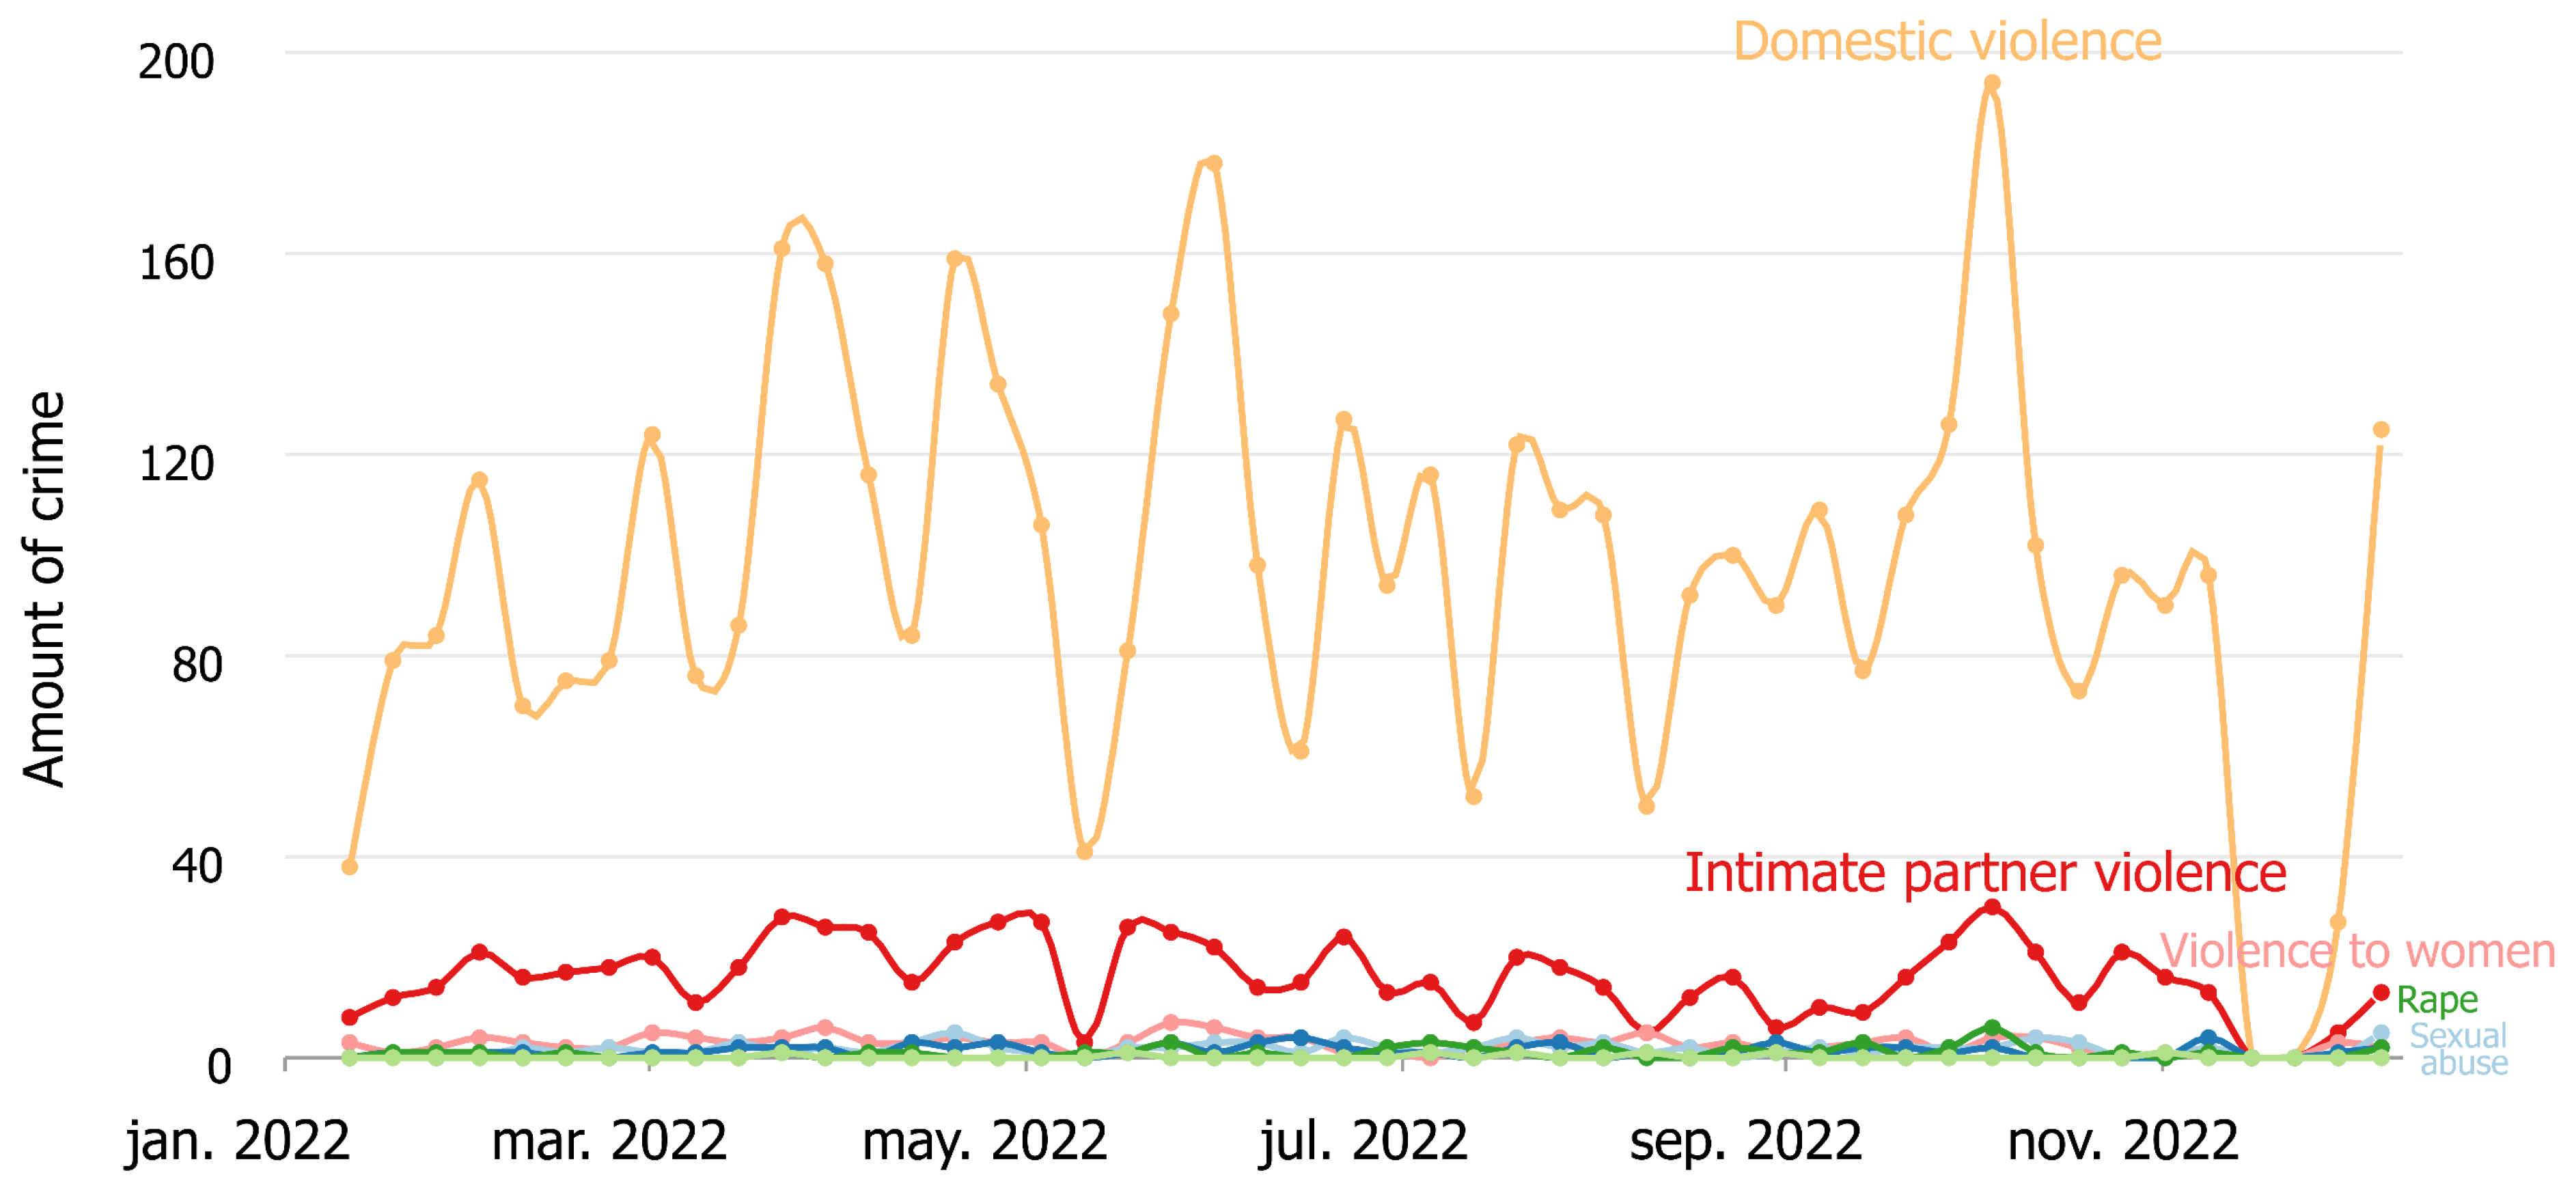
Figure 5 shows the 2022 data. The total number of reports fell to 6874 incidents. This is an 8.2% decrease from 2021. However, sharp peaks in May and November indicate that risk factors remain present and unresolved. This decline might seem like progress. However, the data show stabilization after an extraordinary time, such as the pandemic, rather than proof of a lasting solution. From an environmental criminology perspective, these results highlight the need to enhance institutional presence. This includes more surveillance, community support, and local interventions. It is essential in high-risk areas and times. Hourly patterns suggest that home environments are not always safe. Under certain conditions, such as economic strain, isolation, or power dynamics, homes can become a breeding ground for crime.

3.2.5. Hourly Patterns Pre-Pandemic and During Lockdown

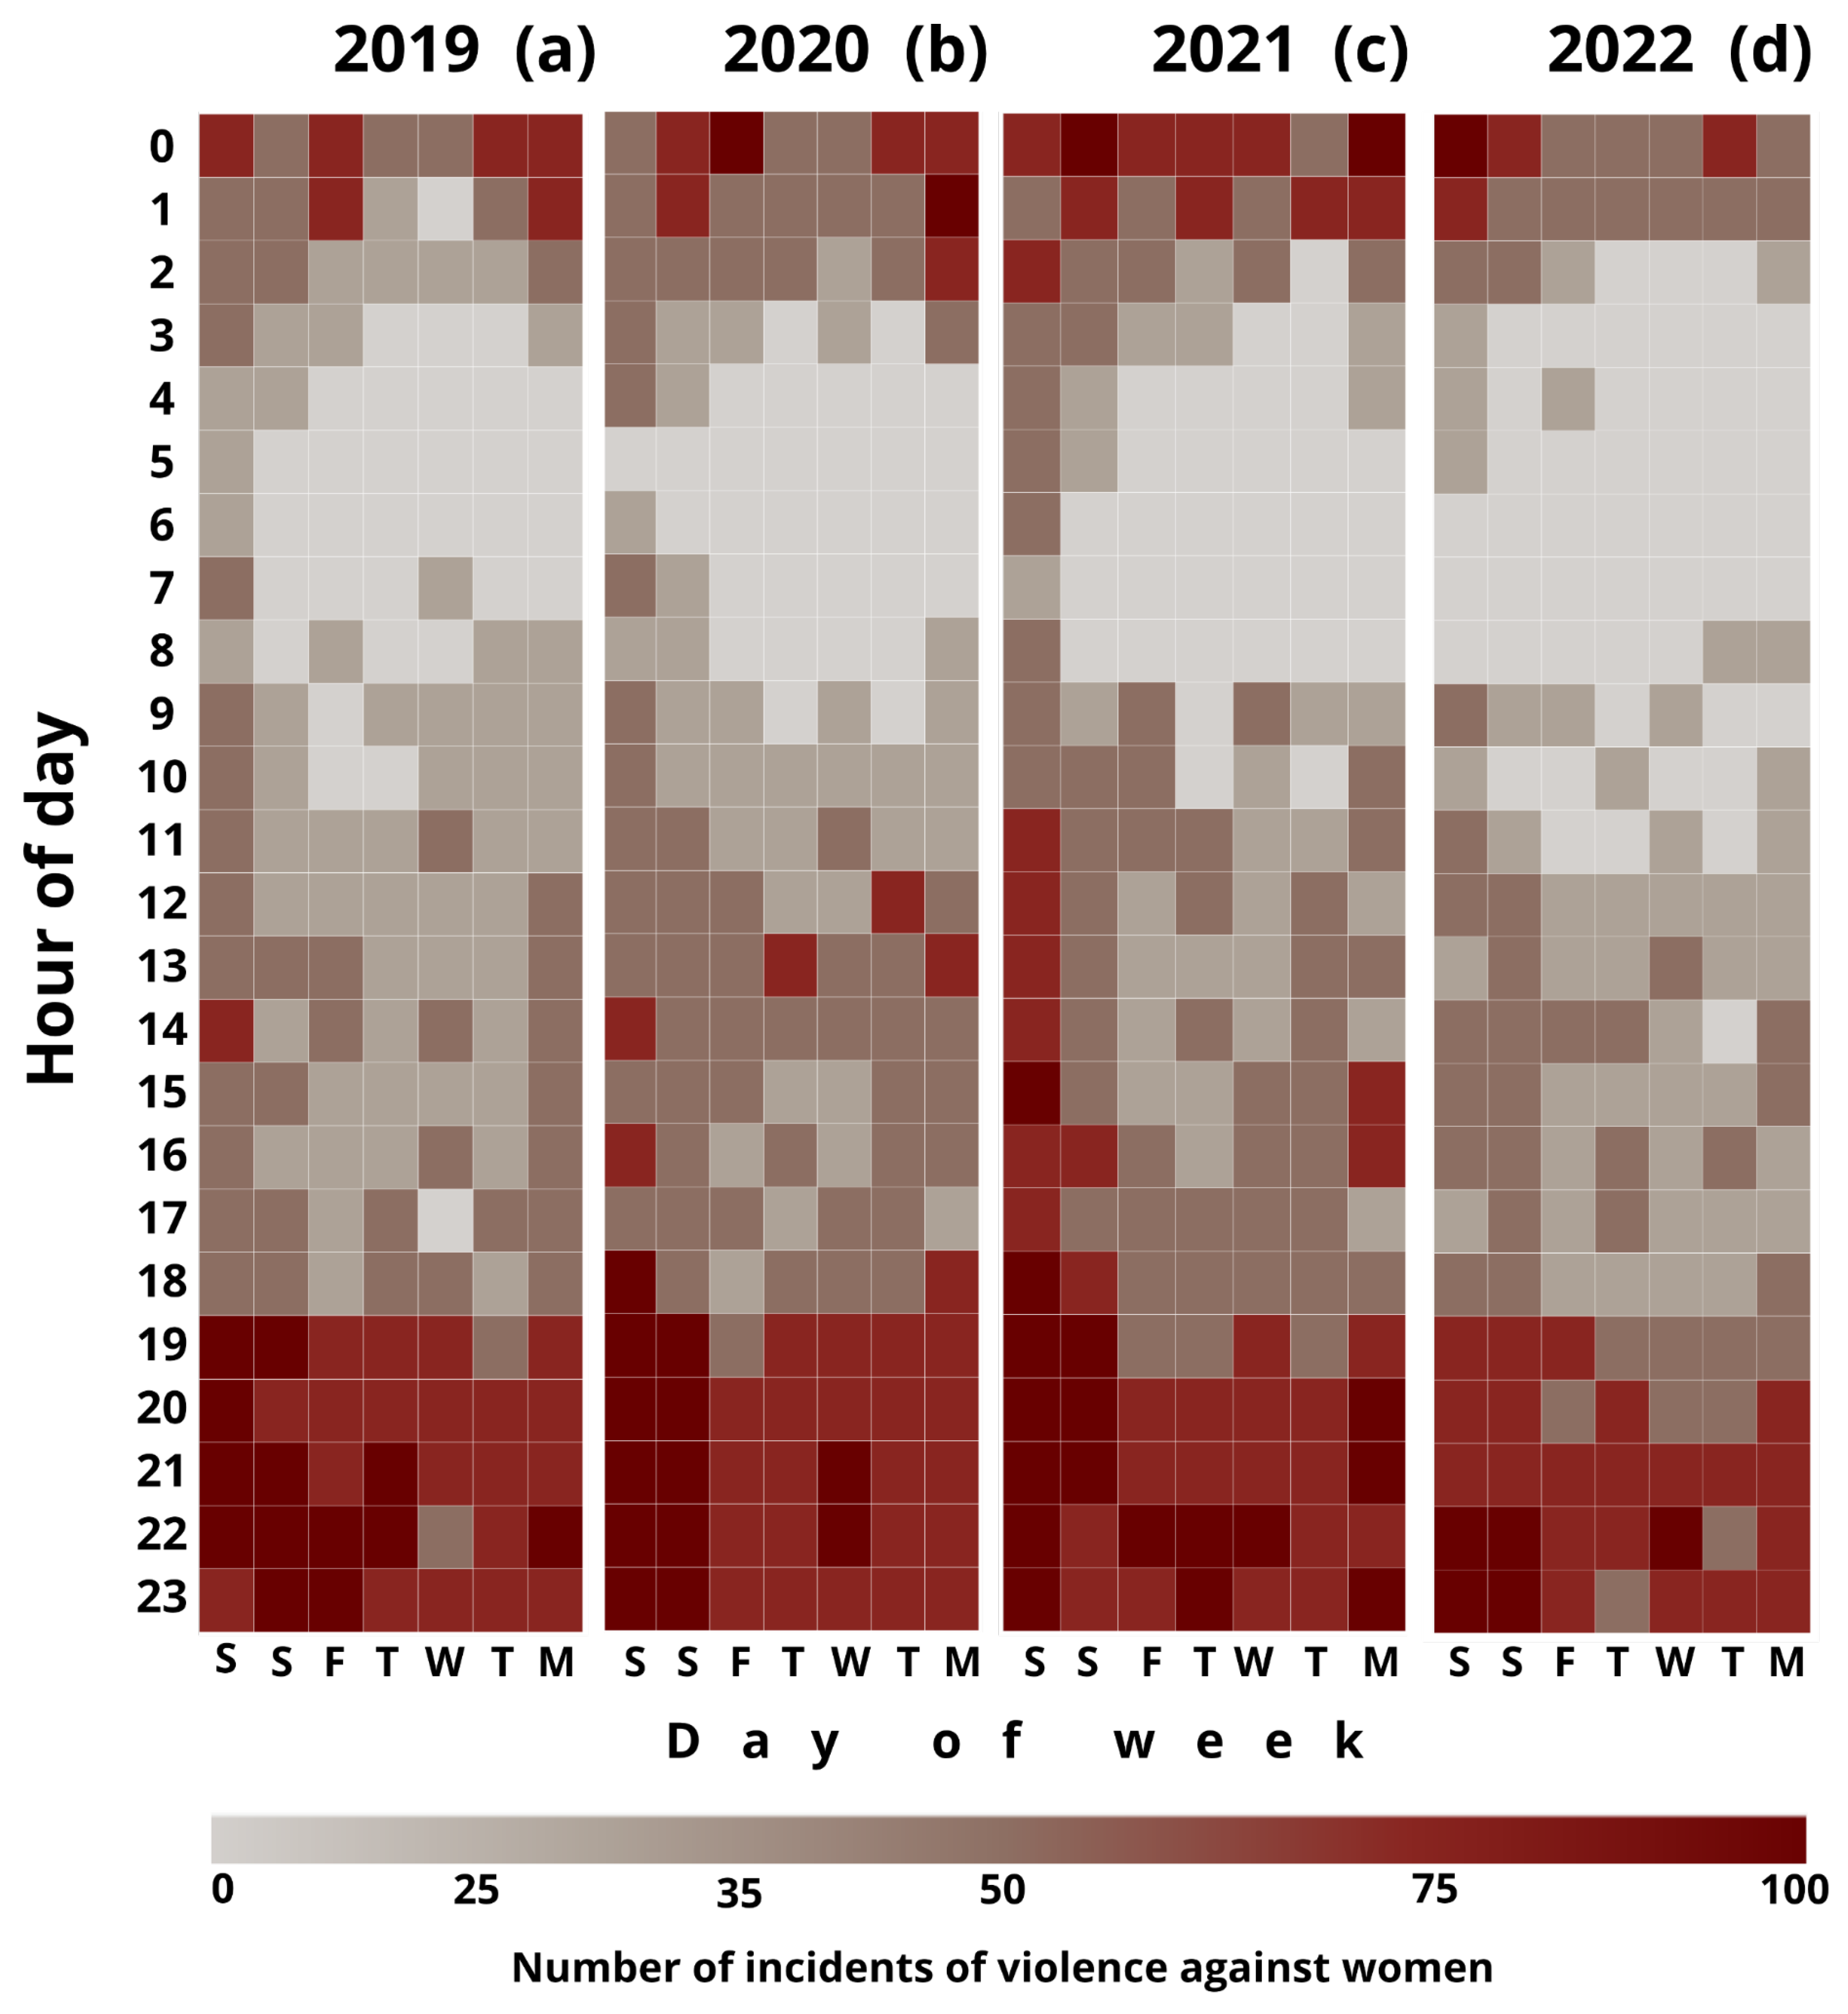
Figure 6a shows a data clock. It visualizes the hourly and weekly reports of VAW in 2019. The analysis reveals that incidents are heavily concentrated between 18:00 and 23:00 h, with weekends representing the highest-risk periods, accounting for approximately 38% of the total annual cases. This timing matches the Routine Activity Theory [61]. It suggests that violent events happen more often when offenders and victims meet in time and place, especially without capable guardians like police or community support. Evenings and weekends are times of increased risk. During these hours, home routines, social tensions, and reduced supervision converge, making situations more hazardous. In 2020, Figure 6b shows that during the COVID-19 lockdown, violence increased. It spread over more hours, especially in the evening and early morning. This time change shows that social isolation did not lessen the chances of violence. It increased them. It also extended the timeframe during which these incidents could occur. Home confinement forced victims to stay around their abusers for long periods. They often lacked support from friends, family, or institutions. These findings suggest that being close to others and having little protection can increase the risk of victimization in homes. This supports the idea that opportunity structures, not just deterrence, influence the timing and location of VAW. Figure 6c presents a data clock visualization for the year 2021, showing an even higher density of nighttime reports. The critical time window stretched from 18:00 into the early morning. This shows the strong and ongoing nature of VAW, even with pandemic restrictions lifted. This finding is important. It shows that the effects of confinement lasted beyond the lockdown. This suggests larger shifts in social routines and the operation of informal social control. The disruption of everyday structures, combined with weakened community vigilance, may have contributed to the normalization of high-risk domestic dynamics. In 2022, Figure 6d reveals a slight decrease in overall intensity, yet critical patterns remained concentrated on weekend nights. This indicates that crises, such as the pandemic, have a lasting impact on violence over time. However, structural factors remain the primary causes. These include gender inequality, household stress, and a lack of safe spaces.

3.3. Spatial Distribution and Clustering

3.3.1. Spatial Distribution of Violence Types

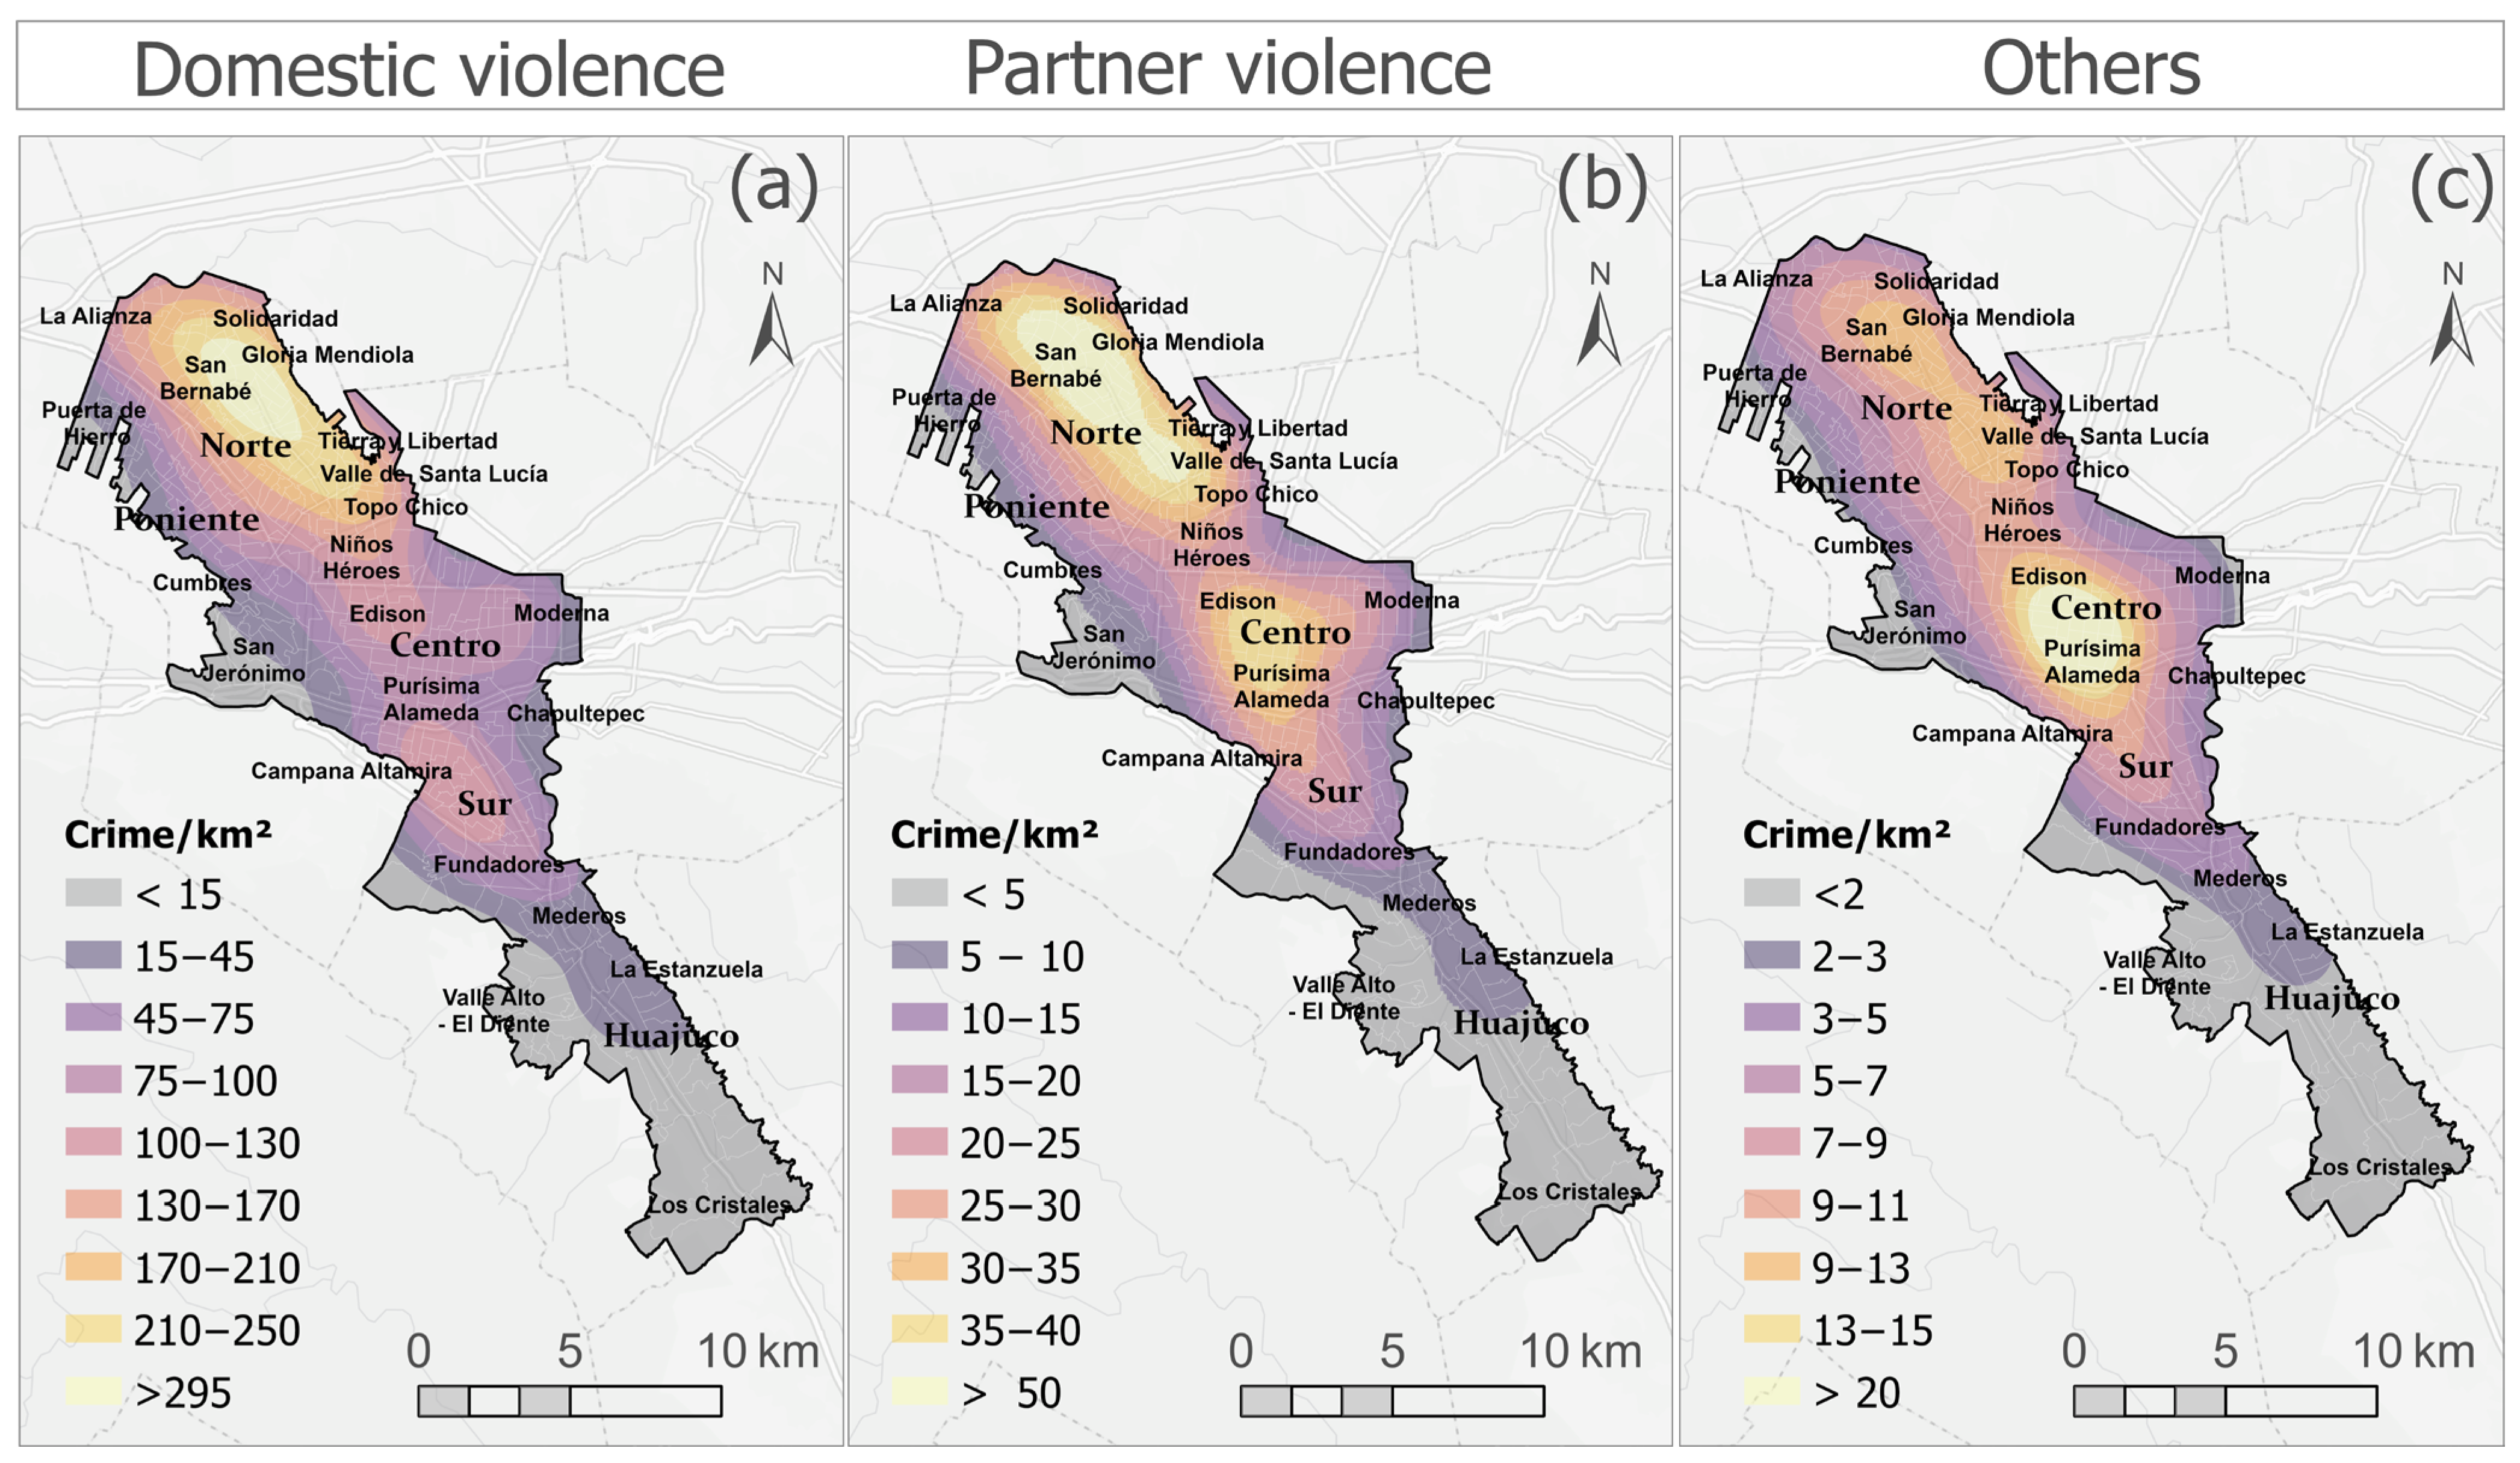
Figure 7 displays the spatial distribution of VAW reports by type of incident, using a kernel density estimation (KDE) analysis. The heat map shows high-density areas, or hot zones, in Monterrey. These clusters are primarily located in the Central Zone, which encompasses the neighborhoods of San Bernabé, Tierra y Libertad, and La Alianza. These critical areas often sit in densely populated regions with poor economic conditions. This points to a connection between demographics, socioeconomic status, and violence against women. In the case of domestic violence, some areas reach values of over 295 incidents per square kilometer. These findings indicate that some urban regions can create criminogenic environments. Violence occurs here due to issues such as marginalization, poor lighting, low surveillance, and weak infrastructure [62]. Prioritize high-density zones for targeted interventions. Use the Crime Prevention Through Environmental Design (CPTED) model [63,64]. This model focuses on modifying the environment to reduce crime chances and enhance perceived safety.

3.3.2. Spatial Clustering of Violence Against Women

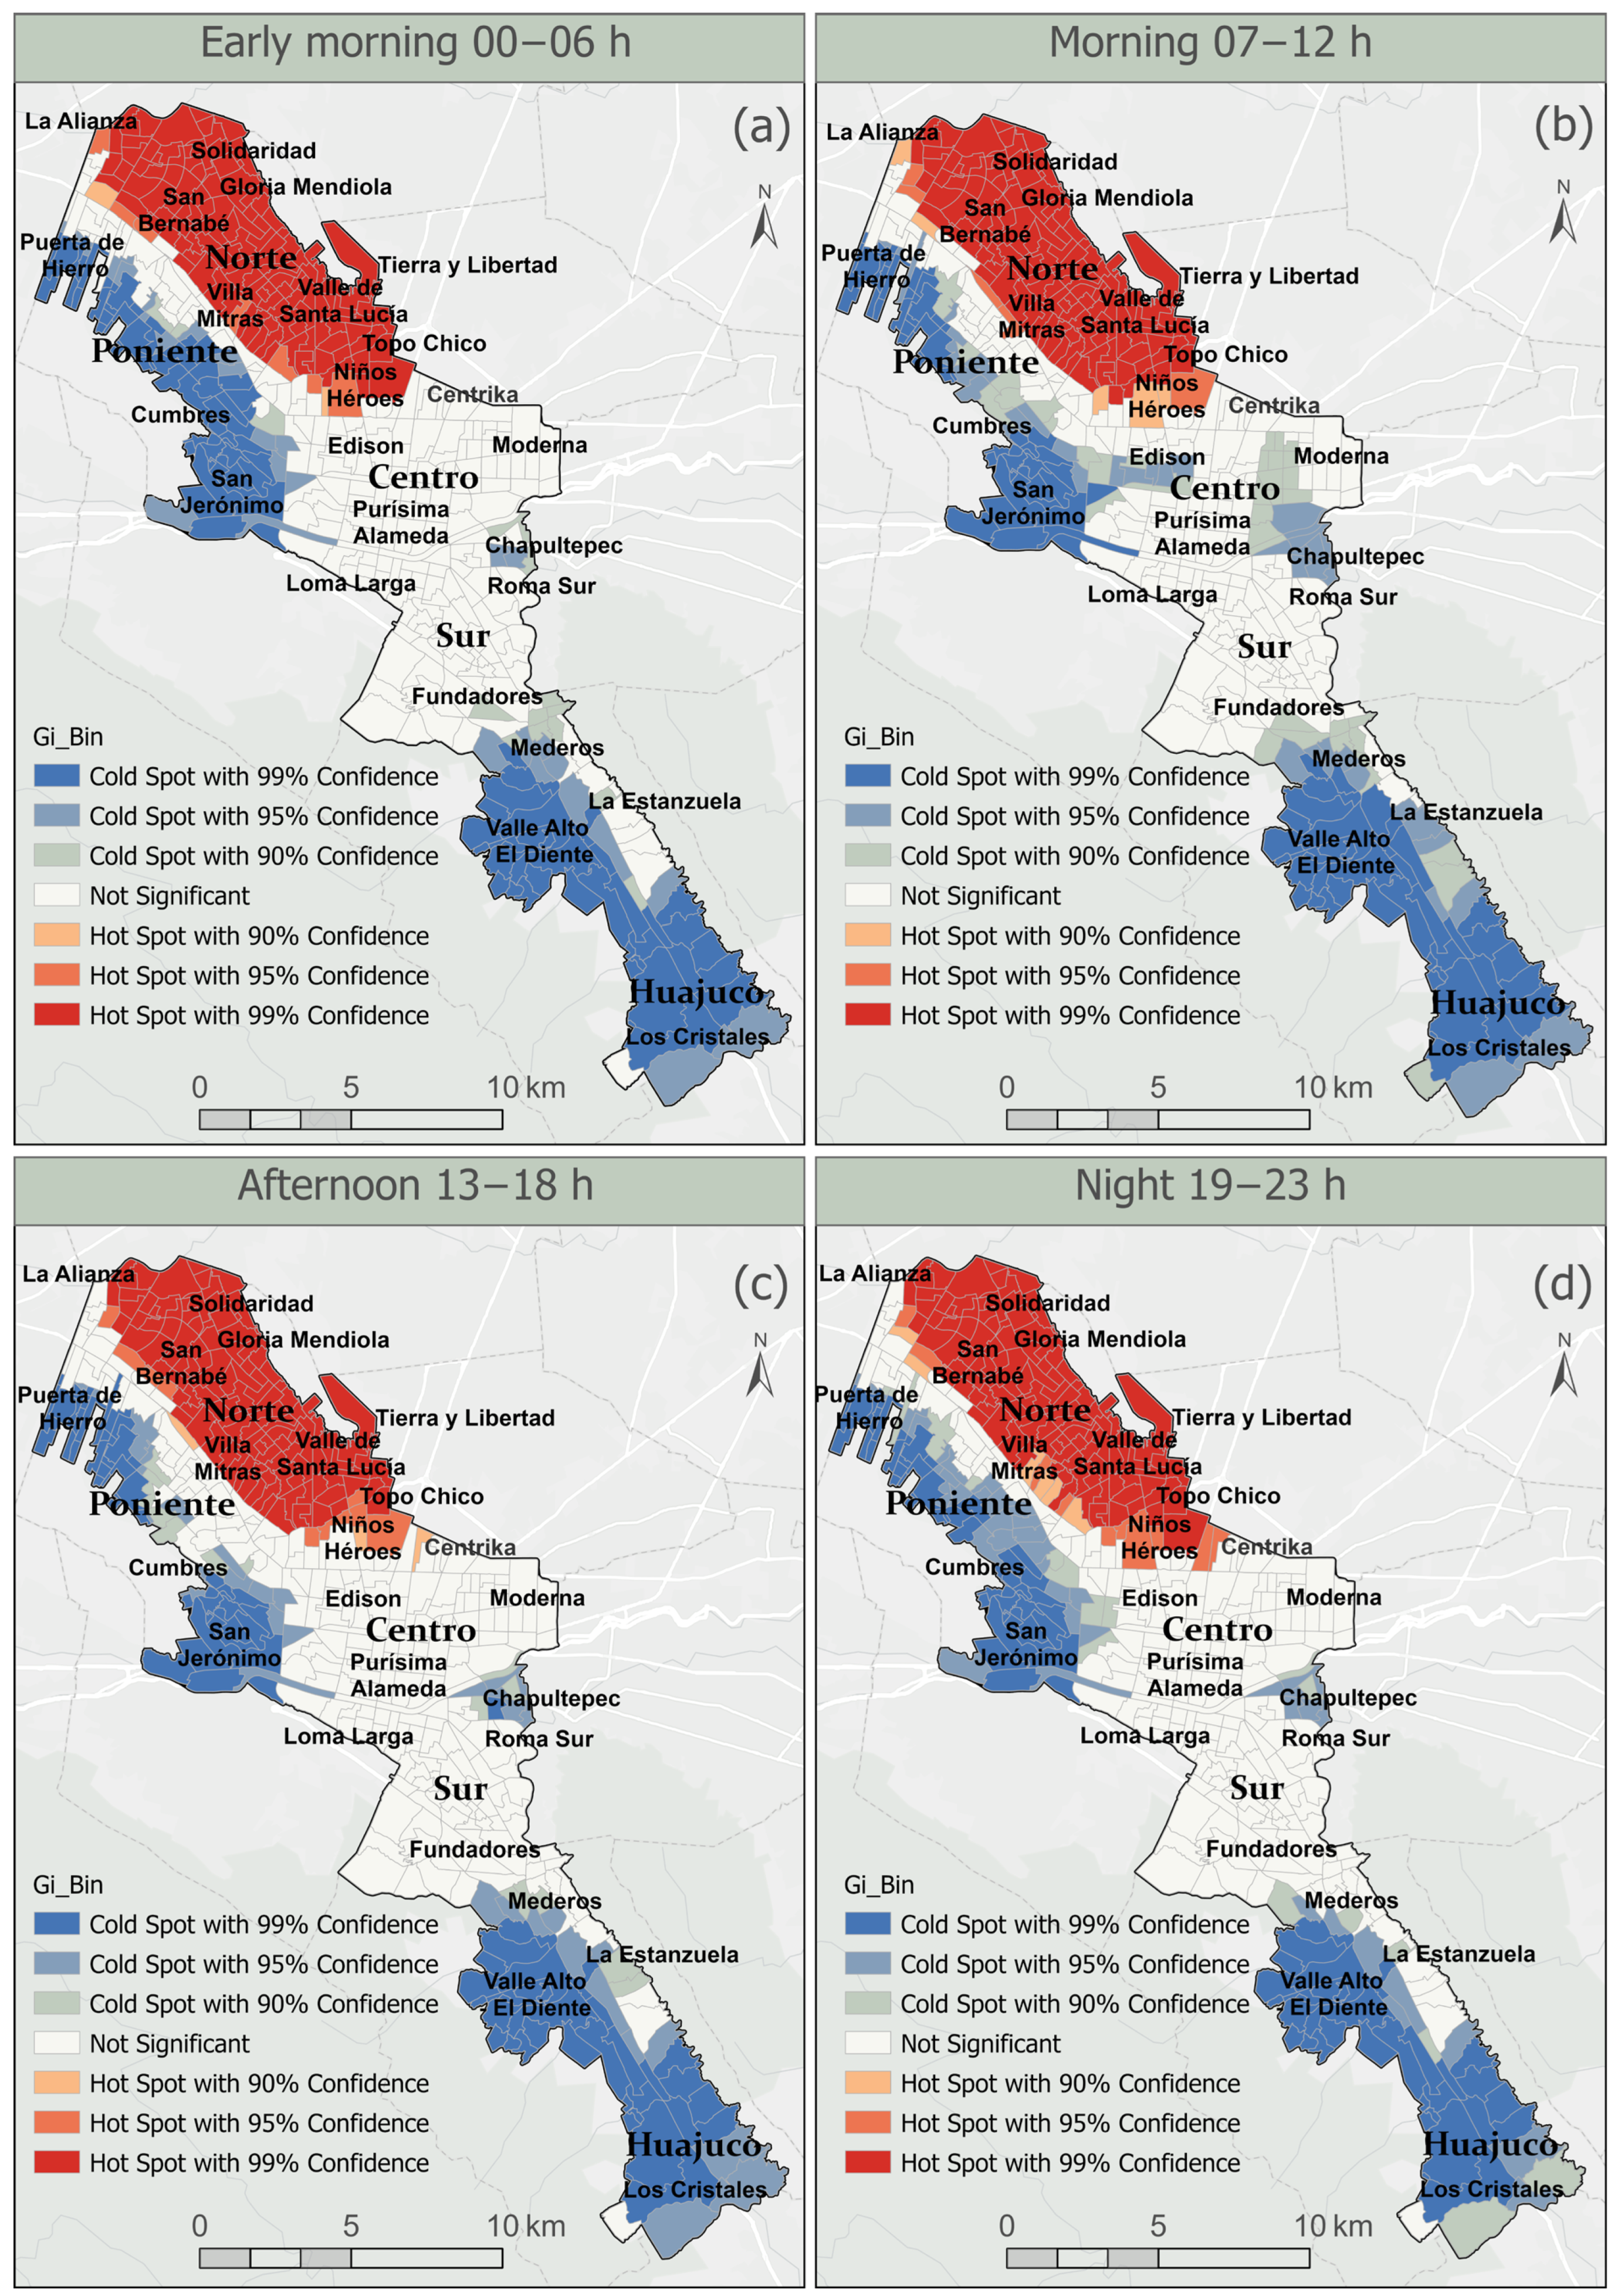
Figure 8 illustrates the temporal behavior of VAW reports according to hourly time bands. The analysis shows that AGEBs (Basic Geo-statistical Areas) in the northern part of the municipality are always hot spots. Areas such as San Bernabé, Solidaridad, Niños Héroes, and Topo Chico consistently stand out in every study. This spatial-temporal clustering fits with the Routine Activity Theory [61]. This theory posits that crimes occur when three elements converge: a motivated offender, a suitable target, and a lack of capable guardianship. Nighttime peaks link to risk factors like alcohol use, changed work routines, and less formal supervision. Weekends can mean more time with potential aggressors, especially at home. Victims often feel more isolated, and control can increase during this time.
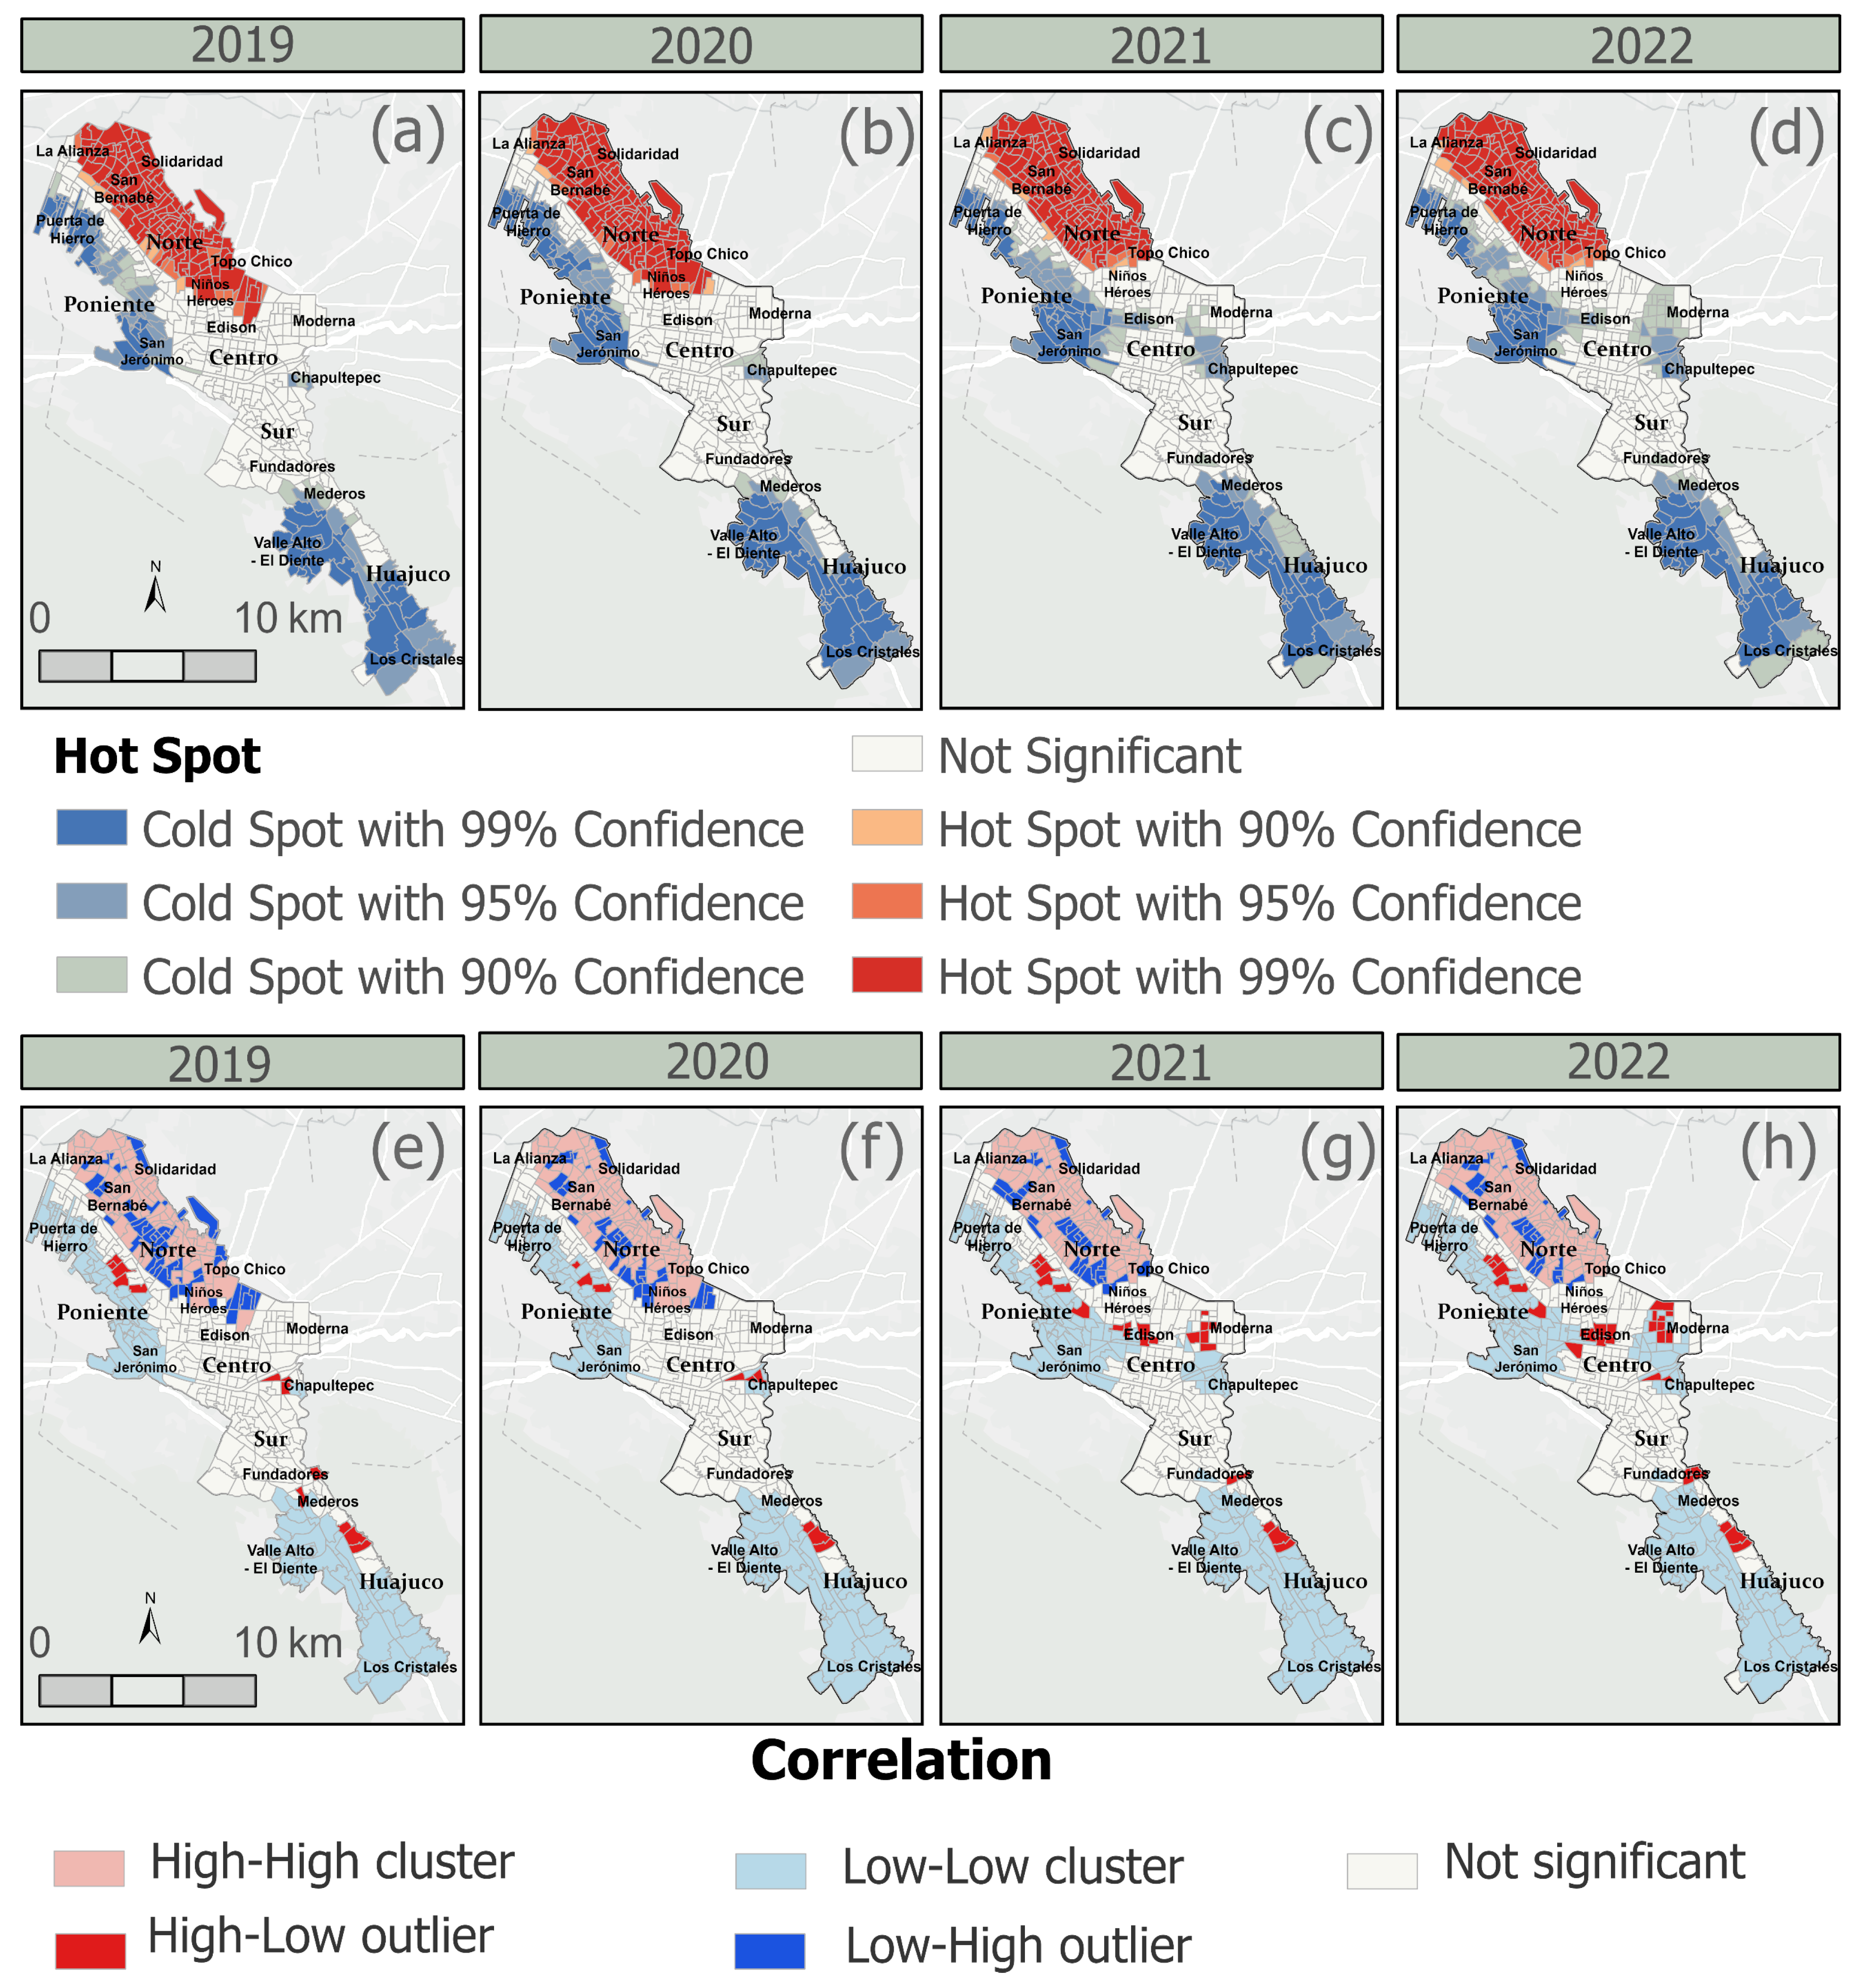
Figure 9 displays the results of applying the Getis–Ord Gi* spatial autocorrelation statistic alongside the Local Moran’s I index. The Getis–Ord Gi* algorithm found significant clusters of violence against women. These include high-concentration areas, marked in red, and low-concentration areas, marked in blue. Unlike KDE, this method allows for statistical validation of both hot spots and cold spots.
The analysis reveals persistent hot spots in the northern zone of Monterrey, particularly in the neighborhoods of Solidaridad, San Bernabé, and Niños Héroes. These areas are primarily residential in land use. According to the crime concentration theory [65], a small area typically experiences the highest level of criminal activity. This highlights the importance of targeted interventions and prevention strategies that focus on specific locations. In contrast, the analysis also identified statistically significant coldspots (blue zones) located in the Southern and Western delegations. These represent areas with lower-than-expected concentrations of VAW. These areas deserve more study. We need to find protective factors or resilient traits in communities. This information could help high-risk zones.

3.3.3. Spatio-Temporal Evolution of Violence Patterns

Figure 10 presents the results of a space–time cube analysis conducted to detect the distribution patterns of VAW during the 2019–2022 period. This method looks at both space and time in VAW. It shows how this violence is concentrated, spread out, and changes over time [24].
The analysis identified Intensifying Hotspots—zones with a growing concentration of incidents. The results show a spatio-temporal cluster. This means there is a hot spot that is significant in 90% of the periods studied. It is found in the northern part of the city, especially in La Alianza, Solidaridad, San Bernabé, and Villa Mitras. This cluster exhibits a progressive upward trend in incident density, indicating that criminogenic conditions in these areas not only persist but have also intensified over time. The proximity of these neighborhoods suggests the presence of common socioeconomic conditions (e.g., poverty, housing precarity, and institutional neglect). These conditions facilitate the concentration and reproduction of violence patterns. Recent literature also identified similar patterns of hot spots overlap areas, characterized by high population density, housing precarity, and limited guardianship in public space [34,38]. Other authors claimed that the long-term exposure to concentrated disadvantage is directly related to higher rates of domestic violence and assaults [32,37].
In contrast, the analysis also identified Persistent Coldspots—areas with consistently low incidence of reported violence. These zones are located in the Southern, Western, and Guajuco delegations. During the study period, these zones showed consistently low levels of violence. This suggests that protective social and spatial conditions may help prevent VAW. The coldspots stretch across entire districts. This shows that the structural conditions are stable in the area. Therefore, it is essential to examine environmental and social factors that may benefit higher-risk sectors.

4. Discussion

This study shows that VAW in Monterrey is not random. It is a structured and ongoing issue. It is also tied to specific places and times, with clear patterns. From 2019 to 2022, the reports show a clear focus on some urban regions. This is especially true for the northern and eastern parts of the municipality. This aligns with previous research in environmental criminology. It shows that violence is related to spatial segregation and socioeconomic exclusion [58,62].
Spatial analysis tools, such as kernel density estimation (KDE) and the Getis–Ord Gi* statistics reveal clear evidence of hot spots in marginalized areas. These results align with recent studies in Monterrey, which identified persistent clusters in neighborhoods such as Topo Chico and Fomerrey 25 [14]. The overlap of these clusters and vulnerable areas shows that VAW is both social and geographic. This matches findings in recent Latin American studies on urbanism and gender [18]. The results show that most incidents occur at night and on weekends. This pattern fits with Routine Activity Theory [61]. This theory posits that crimes occur when a motivated offender, a suitable target, and the absence of a capable guardian converge in space and time. Weekend reports might rise due to more exposure to aggressors at home, drinking alcohol, and weaker protection from institutions. Historical time series shows that violence increased during the COVID-19 lockdown (2020–2021). UN Women [60] reports a 20–30% rise in domestic violence worldwide during this time. In this study, an 11.5% increase in weekly reports was recorded in 2020, confirming that social isolation, economic stress, and forced coexistence exacerbate pre-existing violent dynamics.
Previous research in Latin America has shown that areas near bus stops, bars, and dense residential zones are particularly associated with increased risks of gender-based crimes, where available targets and motivated offenders converge under low surveillance [61,66]. Similarly, researchers reported similar patterns in urban areas in Brazil with socio-spatial segregation, confirming that the concentration of violence has both local and global components [18]. In this sense, the evidence presented for Monterrey contributes to understanding how gender-based violence is territorially anchored in vulnerable urban spaces in Latin American cities.
This study’s main contribution lies in its combination of descriptive and explanatory methods, utilizing GIS tools. These tools help measure the phenomenon and also indicate where it occurs in a spatial context. This ability to “see” crime in space is a significant innovation. It helps design public policies that target specific areas of concern. This aligns with micro-zoning strategies aimed at reducing risk [65].
However, certain methodological limitations must be acknowledged in this research. First, the analysis relies on secondary data from 911 emergency reports, which may be subject to underreporting, reporting biases, and variability in georeferencing accuracy. For instance, previous research on spatial dark figures of rapes in Latin American cities has shown that underreporting is not uniform, but tends to be higher in marginalized neighborhoods and among vulnerable populations, thereby shaping the spatial distribution of observed cases [38]. This implies that the mapped patterns of violence against women in Monterrey may partly reflect these uneven reporting practices, in addition to actual incidence. In line with our results, Perez-Vincent et al. [67] also stated that during the first months of the COVID-19 lockdown, reports for gender-based violence increased significantly in Mexico, but this may mask the persistence of underreporting in marginalized areas. Second, the analysis lacks citizen perceptions or direct victim testimonies, which are crucial for a comprehensive understanding of the current problem. Third, the research is restricted to the urban area of Monterrey, excluding peri-urban and rural territories where women’s vulnerabilities are also common. These constraints could shape the interpretation of the results, thereby emphasizing the need for complementary approaches. In terms of implications, the results highlight the need for differentiated interventions based on geographic zone, time of day, and type of violence, with a particular focus on areas with persistent clusters. It is also recommended to strengthen predictive patrol strategies, community-based prevention networks, and specialized victim support services with a territorial focus.
Future research should consider the inclusion of qualitative factors related to VAW. These factors may comprise citizen perceptions and victim testimonies (e.g., feelings of insecurity and personal experiences of victims). The analysis of the institutional response and coordination between public actors could also be studied. The assessment of the effectiveness of past policies, or the potential institutional resistance to their implementation may also be considered. Expanding the territorial scope toward peri-urban and rural settings would allow comparative insights across different urban-rural dynamics of VAW. This study lays a robust foundation for advancing an evidence-based geographic criminology of gender, committed to transforming urban spaces into safe environments for women.

5. Conclusions

Our overall results reveal that most incidents of VAW in Monterrey happen at night and on weekends. They are spatially clustered in neighborhoods with high levels of marginalization and limited institutional presence. Most of these neighborhoods are located in the northern and eastern marginalized areas of the city, namely Solidaridad, San Bernabé, and Niños Héroes. These spatial patterns appear to be closely linked to social and spatial factors associated with urban vulnerability (e.g., poverty, housing precarity, and institutional neglect). Furthermore, our findings show a systematic concentration of violent incidents on Sunday reporting the highest number of VAW reports, followed by Saturday. Finally, our results reveal that VAW incidents are more likely to occur at certain night hours, specifically between 18:00 and 23:00.
The findings also show that the home is not always a safe place. In fact, under certain conditions of structural inequality, it can become a site for crime. This underscores the urgent need to develop public policies focused on micro-zoning of risk, optimizing predictive patrol strategies, and implementing differentiated psychosocial interventions in the most vulnerable territories. Overall, our findings show that VAW is a complex structural issue. It is influenced by multiple factors and is rooted in specific geographical locations. This calls for focused, preventive, and evidence-based actions.
This paper advances the knowledge in the field of evidence-based geographic criminology of gender by contributing to the transformation of urban spaces into safe environments for women. While previous research on gender-based violence in Monterrey has primarily focused on identifying high-risk areas of family violence and femicides within specific locations such as households, our study offers a novel approach by integrating spatio-temporal analysis, environmental criminology, and opportunity theories with GIS-based methods to generate a multidimensional understanding of spatio-temporal patterns and evolution of violence against women in Monterrey, Mexico. This allows us not only to map where incidents occur but also to uncover when and how these patterns evolve over time, highlighting structural drivers such as marginalization, poverty, and institutional neglect. Our research moves beyond descriptive mapping toward a comprehensive spatio-temporal understanding, capable of revealing how certain areas maintain recurrent patterns of violence against women and how these evolve over time. The results of this research are particularly relevant for policymakers, law enforcement organizations, local government authorities, NGOs and government agencies, as they contribute to the design and implementation of action programs and public policies that target specific areas of concern to reduce VAW in the territories. Finally, this methodology is relevant not only for Monterrey, Mexico, but for other Latin American cities as well as other cities in developing countries around the world.

Author Contributions

The authors’ individual contributions are specified as followed: conceptualization, Onel Pérez-Fernández and Octavio Quintero Ávila; methodology, Onel Pérez-Fernández, Octavio Quintero Ávila, Carolina Barros and Gregorio Rosario Michel; software, Onel Pérez-Fernández, Octavio Quintero Ávila and Carolina Barros; validation, Onel Pérez-Fernández, Octavio Quintero Ávila, Carolina Barros and Gregorio Rosario Michel; formal analysis, Onel Pérez-Fernández, Octavio Quintero Ávila, Carolina Barros and Gregorio Rosario Michel; data curation, Onel Pérez-Fernández and Octavio Quintero Ávila; writing—original draft preparation, Onel Pérez-Fernández, Octavio Quintero Ávila and Carolina Barros; writing—review and editing, Onel Pérez-Fernández, Octavio Quintero Ávila, Carolina Barros and Gregorio Rosario Michel; visualization, Onel Pérez-Fernández, Octavio Quintero Ávila, Carolina Barros and Gregorio Rosario Michel. All authors have read and agreed to the published version of the manuscript.

Funding

This research was funded by the National Research System (SNI) and the National Secretariat for Science, Technology, and Innovation (SENACYT-SNI-NM2024-002) of the Republic of Panama, Universidad Nacional Pedro Henríquez Ureña (UNPHU), Dominican Republic, and Ministerio de Educación Superior, Ciencia y Tecnología: FONDOCYT-2023-1-3C5-0509.

Data Availability Statement

Data is contained within the article.

Acknowledgments

We thank the National Research System (SNI) and the National Secretariat for Science, Technology, and Innovation (SENACYT) of the Republic of Panama, and Universidad Nacional Pedro Henríquez Ureña (UNPHU), Dominican Republic, for providing the resources that funded this study. We thank the support of the technical and administrative personnel at the Grupo de Investigación en Ciencia de Datos Geoespaciales (GICDGE), Centro Regional Universitario de Veraguas, Universidad de Panamá, Universidad Autónoma de Nuevo León, and Universidad Nacional Pedro Henríquez Ureña (UNPHU), Dominican Republic. We are very grateful for their encouragement and valuable insights in the development of this research.

Conflicts of Interest

The authors declare no conflicts of interest.

References

  1. Pinargote-Zamora, M.J. Derechos Humanos y Violencia de Género En Ecuador. Rev. Científica Arbitr. Psicol. NUNA YACHAY 2022, 5, 2–16. [Google Scholar] [CrossRef]
  2. Fernandez-Sanchez, M.; Lopez-Zafra, E. Intimate Partner Violence Against Women (IPVAW): Resilience and Emotional Intelligence as Health Protectors; Gender Violence: Prevalence, Implications and Global Perspectives; Nova Science Publishers: Hauppauge, NY, USA, 2018; pp. 67–92. ISBN 9781536136111. [Google Scholar]
  3. Meneses-La-Riva, M.E.; Ocupa-Cabrera, H.G.; Ocupa-Meneses, G.D.D.; Paredes-Díaz, S.E.; Ocupa-Meneses, B.D.D.; Vera-Calmet, V.G. A Narrative Review of Scientific Evidences Regarding Characteristics of Gender-Based Violence in Intimate Partners. Acad. J. Interdiscip. Stud. 2023, 12, 248–256. [Google Scholar] [CrossRef]
  4. Mormontoy-Morales, A.E. Analysis of the Novel “No Se Lo Digas a Nadie” as an Instrument to Understand Masculinity and Gender Violence. Rev. Neuropsiquiatr. 2020, 83, 45–50. [Google Scholar] [CrossRef]
  5. Patró-Hernández, R.M. Chapter 7—Intimate Partner Violence Against Women: Prevention and Intervention Strategies in Spain. In The Psychology of Gender and Health; Sánchez-López, M.P., Limiñana-Gras, R.M., Eds.; Academic Press: San Diego, CA, USA, 2017; pp. 199–229. ISBN 978-0-12-803864-2. [Google Scholar]
  6. Herrera Giraldo, M.; González Espitia, C.; Ochoa Díaz, H. The Spatial and Economic Relationship between Labour Informality and Homicides in Cali, Colombia. Dev. Policy Rev. 2023, 41, e12709. [Google Scholar] [CrossRef]
  7. Tiravanti-Delgado, D. Bajo Prevalence and Factors Associated with Different Types of Intimate Partner Violence in Peruvian Women; Revista Cubana de Medicina Militar: La Habana, Cuba, 2021; Volume 50. [Google Scholar]
  8. Bott, S.; Guedes, A.; Ruiz-Celis, A.P.; Mendoza, J.A. Intimate Partner Violence in the Americas: A Systematic Review and Reanalysis of National Prevalence Estimates. Rev. Panam. Salud Publica/Pan Am. J. Public Health 2021, 45, e26. [Google Scholar] [CrossRef]
  9. Organización Mundial de la Salud [OMS]. Violencia Contra Las Mujeres: Estimaciones Mundiales e Impacto. Available online: https://www.who.int/es/news-room/fact-sheets/detail/violence-against-women (accessed on 2 June 2025).
  10. Thobejane, T. Effects of Gender-Based Violence Towards Young Females: The Case of Vhufuli Village in Thohoyandou, Limpopo Province-South Africa. J. Rev. Glob. Econ. 2019, 8, 53–62. [Google Scholar] [CrossRef]
  11. Falb, K.; Peterman, A.; Nordås, R.; Field, A.; Porat, R.; Stark, L. Violence against Women and Girls Research: Leveraging Gains across Disciplines. Proc. Natl. Acad. Sci. USA 2025, 122, e2404557122. [Google Scholar] [CrossRef]
  12. Quintero-Avila, O. Análisis espacial del delito: Violencia de género en Monterrey, Nuevo León. In Perspectivas Criminológicas. En la Inteligencia Criminal Estratégica; Catillo, M.A.G., Avila, O.Q., Delgadillo, J.A.C., Eds.; Tirant Humanidades: Mexico City, Mexico, 2025; Volume 1, pp. 63–104. ISBN 978-84-1081-034-1. [Google Scholar]
  13. Quintero-Avila, O. El Análisis y mapeo delictivo para el desarrollo de políticas públicas de seguridad en México. Constr. Criminológicos 2024, 4, 159–170. [Google Scholar] [CrossRef]
  14. Quintero-Avila, O.; Caballero-Delgadillo, J.A. Percepción de Inseguridad Urbana: Enfoque Geoespacial para el análisis criminológico. Dilemas Contemp. Educ. Política Valores 2025, 12, 1–25. [Google Scholar] [CrossRef]
  15. Instituto Nacional de Estadística y Geografía (ENDIREH). Encuesta Nacional Sobre la Dinámica de las Relaciones en los Hogares (ENDIREH). Available online: https://www.inegi.org.mx/programas/endireh/ (accessed on 2 June 2025).
  16. García, S. Tercer Informe de Gobierno: Indicadores Sectoriales; Gobierno del Estado de Nuevo León: Nuevo León, Mexico, 2022. [Google Scholar]
  17. INEGI ENDIREH 2021: Resultados Nuevo León. Available online: https://www.inegi.org.mx/programas/endireh/2021/ (accessed on 7 June 2025).
  18. Russo Rafael, R.d.M.; Jalil, E.; Velasque, L.; Friedman, R.; Ramos, M.; Monteiro, L. Intimate Partner Violence among Brazilian Trans and Cisgender Women Living with Hiv or at Hiv Risk. Transgend Health 2025, 10, 63–72. [Google Scholar] [CrossRef]
  19. Jiménez, I.T.B.; Ávila, N.R. Factors associated with domestic violence in women: Systematic Ecological Review. Rev. Cuid. 2025, 16, e3857. [Google Scholar]
  20. Gabriela, E.; Huerta, R. La Ciudad Desde Las Mujeres: Análisis de Los Obstáculos de Movilidad Para Las Mujeres En La Zona Metropolitana de Monterrey. Rev. Estud. 2021, 43, 2021. [Google Scholar] [CrossRef]
  21. Garcia-Cervantes, N. Urban Violence as the Politics of Space in Monterrey, Mexico. Int. Dev. Plan. Rev. 2025, 47, 199–221. [Google Scholar] [CrossRef]
  22. Mondal, S.; Singh, D.; Kumar, R. Crime Hotspot Detection Using Statistical and Geospatial Methods: A Case Study of Pune City, Maharashtra, India. GeoJournal 2022, 87, 5287–5303. [Google Scholar] [CrossRef]
  23. Roy, S.; Chowdhury, I.R. Geography of Crime against Women in West Bengal, India: Identifying Spatio-Temporal Dynamics and Hotspots. GeoJournal 2023, 88, 5863–5895. [Google Scholar] [CrossRef]
  24. Hashim, H.; Wan Mohd, W.M.N.; Sadek, E.S.S.M.; Dimyati, K.M. Modeling Urban Crime Patterns Using Spatitial Space Time and Regression. In Proceedings of the International Archives of the Photogrammetry, Remote Sensing and Spatial Information Sciences—ISPRS; International Society for Photogrammetry and Remote Sensing: Kuala Lumpur, Malaysia, 2019; Volume 62, pp. 247–254. [Google Scholar]
  25. Carrillo-Brenes, F.; Vilches-Blázquez, L.M. Characterizing Spatio-Temporal Patterns of Child Sexual Abuse in Mexico City Before, During, and After the COVID-19 Pandemic. ISPRS Int. J. Geoinf. 2024, 13, 223. [Google Scholar] [CrossRef]
  26. Sadler, R.C.; Melde, C.; Zeoli, A.; Wolfe, S.; O’Brien, M. Characterizing Spatio-Temporal Differences in Homicides and Non-Fatal Shootings in Milwaukee, Wisconsin, 2006–2015. Appl. Spat. Anal. Policy 2022, 15, 117–142. [Google Scholar] [CrossRef]
  27. Pérez-Fernández, O.; Michel, G.R. Spatial Accessibility to Healthcare Facilities: GIS-Based Public–Private Comparative Analysis Using Floating Catchment Methods. ISPRS Int. J. Geoinf. 2025, 14, 253. [Google Scholar] [CrossRef]
  28. Mohammed, A.F.; Baiee, W.R. The GIS Based Criminal Hotspot Analysis Using DBSCAN Technique. In Proceedings of the IOP Conference Series: Materials Science and Engineering, Thi-Qar, Iraq, 15–16 July 2020; IOP Publishing Ltd.: Bristol, UK, 2020; Volume 928. [Google Scholar]
  29. Nepomuceno, T.C.C.; Costa, A.P.C.S. Spatial Visualization on Patterns of Disaggregate Robberies. Oper. Res. 2019, 19, 857–886. [Google Scholar] [CrossRef]
  30. Luo, J. Multi-Spatiotemporal Patterns of Residential Burglary Crimes in Chicago: 2006–2016. In Proceedings of the 2nd International Symposium on Spatiotemporal Computing, Cambridge, MA, USA, 7–9 August 2017; ISPRS Annals of the Photogrammetry, Remote Sensing and Spatial Information Sciences: Cambridge, MA, USA, 2017; Volume 4, pp. 193–198. [Google Scholar]
  31. Lee, J.; Leitner, M.; Paulus, G. Spatiotemporal Analysis of Nighttime Crimes in Vienna, Austria. ISPRS Int. J. Geoinf. 2024, 13, 247. [Google Scholar] [CrossRef]
  32. Wang, R.; Li, Y. Bayesian Structural Time Series and Geographically Weighted Logistic Regression Modelling Impacts of COVID-19 Lockdowns on the Spatiotemporal Patterns of London’s Crimes. ISPRS Int. J. Geoinf. 2024, 13, 18. [Google Scholar] [CrossRef]
  33. Du, Y.; Ding, N. A Systematic Review of Multi-Scale Spatio-Temporal Crime Prediction Methods. ISPRS Int. J. Geoinf. 2023, 12, 209. [Google Scholar] [CrossRef]
  34. Gracia, E.; Marco, M.; López-Quílez, A.; Lila, M. Chronic High Risk of Intimate Partner Violence against Women in Disadvantaged Neighborhoods: An Eight-Year Space-Time Analysis. Prev. Med. 2021, 148, 106550. [Google Scholar] [CrossRef]
  35. Bunch, R.L.; Murray, C.; Gao, X.; Hunt, E.D. Geographic Analysis of Domestic Violence Incident Locations and Neighborhood Level Influences. Int. J. Appl. Geospat. Res. 2018, 9, 14–32. [Google Scholar] [CrossRef]
  36. Wei, B.; Cui, Z.; Wu, Q.; Guo, S.; Li, W.; Wang, X.; Qiu, W. Investigating the Spatiotemporally Heterogeneous Effects of Macro and Micro Built Environment on Sexual Violence against Women: A Case Study of Mumbai. Humanit. Soc. Sci. Commun. 2025, 12, 502. [Google Scholar] [CrossRef]
  37. Ibarra-Cabrera, M.J.; Ibarra-Cabrera, E.M.; García Vázquez, Y.; Ferrás, C. Analysis of the Location and Spatial Distribution of Violence Against Women in Peru. Soc. Sci. 2025, 14, 76. [Google Scholar] [CrossRef]
  38. Melo, S.N.; Boivin, R.; Morselli, C. Spatial Dark Figures of Rapes: (In) Consistencies across Police and Hospital Data. J. Environ. Psychol. 2020, 68, 101393. [Google Scholar] [CrossRef]
  39. Butt, U.M.; Letchmunan, S.; Hassan, F.H.; Ali, M.; Baqir, A.; Sherazi, H.H.R. Spatio-Temporal Crime Hotspot Detection and Prediction: A Systematic Literature Review. IEEE Access 2020, 8, 166553–166574. [Google Scholar] [CrossRef]
  40. INEGI Censo de Población y Vivienda. Available online: https://www.inegi.org.mx/programas/ccpv/2020/ (accessed on 5 June 2025).
  41. Bennett, L.; Vale, F. Spatial Statistics Illustrated, 1st ed.; Esri Press: Redlands, CA, USA, 2023. [Google Scholar]
  42. Anselin, L. Local Indicators of Spatial Association—LISA. Geogr. Anal. 1995, 27, 93–115. [Google Scholar] [CrossRef]
  43. Harris, N.L.; Goldman, E.; Gabris, C.; Nordling, J.; Minnemeyer, S.; Ansari, S.; Lippmann, M.; Bennett, L.; Raad, M.; Hansen, M.; et al. Using Spatial Statistics to Identify Emerging Hot Spots of Forest Loss. Environ. Res. Lett. 2017, 12, 024012. [Google Scholar] [CrossRef]
  44. Cuba, N.; Sauls, L.A.; Bebbington, A.J.; Bebbington, D.H.; Chicchon, A.; Marimón, P.D.; Diaz, O.; Hecht, S.; Kandel, S.; Osborne, T.; et al. Emerging Hot Spot Analysis to Indicate Forest Conservation Priorities and Efficacy on Regional to Continental Scales: A Study of Forest Change in Selva Maya 2000–2020. Environ. Res. Commun. 2022, 4, 071004. [Google Scholar] [CrossRef]
  45. Ghanghermeh, A.; Roshan, G.; Asadi, K.; Attia, S. Spatiotemporal Analysis of Urban Heat Islands and Vegetation Cover Using Emerging Hotspot Analysis in a Humid Subtropical Climate. Atmosphere 2024, 15, 161. [Google Scholar] [CrossRef]
  46. Bunting, R.J.; Chang, O.Y.; Cowen, C.; Hankins, R.; Langston, S.; Warner, A.; Yang, X.; Louderback, E.R.; Roy, S. Sen Spatial Patterns of Larceny and Aggravated Assault in Miami–Dade County, 2007–2015. Prof. Geogr. 2018, 70, 34–46. [Google Scholar] [CrossRef]
  47. Siabato, W.; Guzmán-Manrique, J. La Autocorrelación Espacial y El Desarrollo de La Geografía Cuantitativa. Cuad. Geogr. Rev. Colomb. Geogr. 2019, 28, 1–22. [Google Scholar] [CrossRef]
  48. Tavares, J.P.; Costa, A.C. Spatial Modeling and Analysis of the Determinants of Property Crime in Portugal. ISPRS Int. J. Geoinf. 2021, 10, 731. [Google Scholar] [CrossRef]
  49. López-Hernández, E.; Rubio-Amores, D. Reflexiones Sobre La Violencia Intrafamiliar y Violencia de Género Durante Emergencia Por COVID-19. CienciAmérica 2020, 9, 312–321. [Google Scholar] [CrossRef]
  50. Kabiraj, P. Crime against Women in India: A Spatio-Temporal Analysis. Pap. Appl. Geogr. 2023, 9, 261–278. [Google Scholar] [CrossRef]
  51. Cueva, D.; Cabrera-Barona, P. Spatial, Temporal, and Explanatory Analyses of Urban Crime. Soc. Indic. Res. 2024, 174, 611–629. [Google Scholar] [CrossRef]
  52. Irandegani, Z.; Mohammadi, R.; Taleai, M. Investigating Temporal and Spatial Effects of Urban Planning Variables on Crime Rate: A Gwr and Ols Based Approach. In Proceedings of the GeoSpatial Conference 2019—Joint Conferences of SMPR and GI Research, Karaj, Iran, 12–14 October 2019; International Society for Photogrammetry and Remote Sensing: Baton Rouge, LA, USA, 2019; Volume 42, pp. 559–564. [Google Scholar]
  53. Towers, S.; Chen, S.; Malik, A.; Ebert, D. Factors Influencing Temporal Patterns in Crime in a Large American City: A Predictive Analytics Perspective. PLoS ONE 2018, 13, e0205151. [Google Scholar] [CrossRef]
  54. Wang, D.; Fei, L.; Chai, Y. Activity Spaces and Sociospatial Segregation in Beijing. Urban Geogr. 2012, 33, 256–277. [Google Scholar] [CrossRef]
  55. Hu, Y.; Wang, F.; Guin, C.; Zhu, H. A Spatio-Temporal Kernel Density Estimation Framework for Predictive Crime Hotspot Mapping and Evaluation. Appl. Geogr. 2018, 99, 89–97. [Google Scholar] [CrossRef]
  56. Spencer Chainey Understanding Crime. Analyzing the Geography of Crime; Esri Press: Redlands, CA, USA, 2021; ISBN 9781589485846. [Google Scholar]
  57. Chainey, S.; Tompson, L.; Uhlig, S. The Utility of Hotspot Mapping for Predicting Spatial Patterns of Crime. Secur. J. 2008, 21, 4–28. [Google Scholar] [CrossRef] [PubMed]
  58. Eck, J.E.; Weisburd, D.; Eck, J. Crime Places in Crime Theory. Crime Place Crime Prev. Stud. 2015, 4, 1–33. [Google Scholar]
  59. Bandura, A.; Walters, R.H. Social Learning Theory; Prentice Hall: Englewood Cliffs, NJ, USA, 1977; Volume 1, pp. 141–154. [Google Scholar]
  60. UN Women la Pandemia en la Sombra: Violencia Contra las Mujeres Durante el Confinamiento. Available online: https://www.unwomen.org/es/news/in-focus/in-focus-gender-equality-in-covid-19-response/violence-against-women-during-covid-19 (accessed on 2 June 2025).
  61. Cohen, L.E.; Felson, M. Social Change and Crime Rate Trends: A Routine Activity Approach. Am. Sociol. Rev. 1979, 44, 588. [Google Scholar] [CrossRef]
  62. Brantingham, P.L.; Brantingham, P.J. 21 Nodes, Paths and Edges: Considerations on the Complexity of Crime and the Physical Environment. In Social, Ecological and Environmental Theories of Crime; Routledge: Oxfordshire, UK, 2017; pp. 363–388. [Google Scholar]
  63. Crow, T. Crime Prevention through Environmental Design; National Crime Prevention Institute: China Spring, TX, USA, 2000. [Google Scholar]
  64. Crowe, T.D. Crime Prevention through Environmental Design: Applications of Architectural Design and Space Management Concepts; Butterworth-Heinemann: Oxford, UK, 2000. [Google Scholar]
  65. Weisburd, D. The Law of Crime Concentration and the Criminology of Place. Criminology 2015, 53, 133–157. [Google Scholar] [CrossRef]
  66. Felson, M.; de Melo, S.N.; Boivin, R. Risk of Outdoor Rape and Proximity to Bus Stops, Bars, and Residences. Violence Vict. 2021, 36, 723–738. [Google Scholar] [CrossRef]
  67. Perez-Vincent, S.M.; Carreras, E. Domestic Violence Reporting during the COVID-19 Pandemic: Evidence from Latin America. Rev. Econ. Househ. 2022, 20, 799–830. [Google Scholar] [CrossRef]
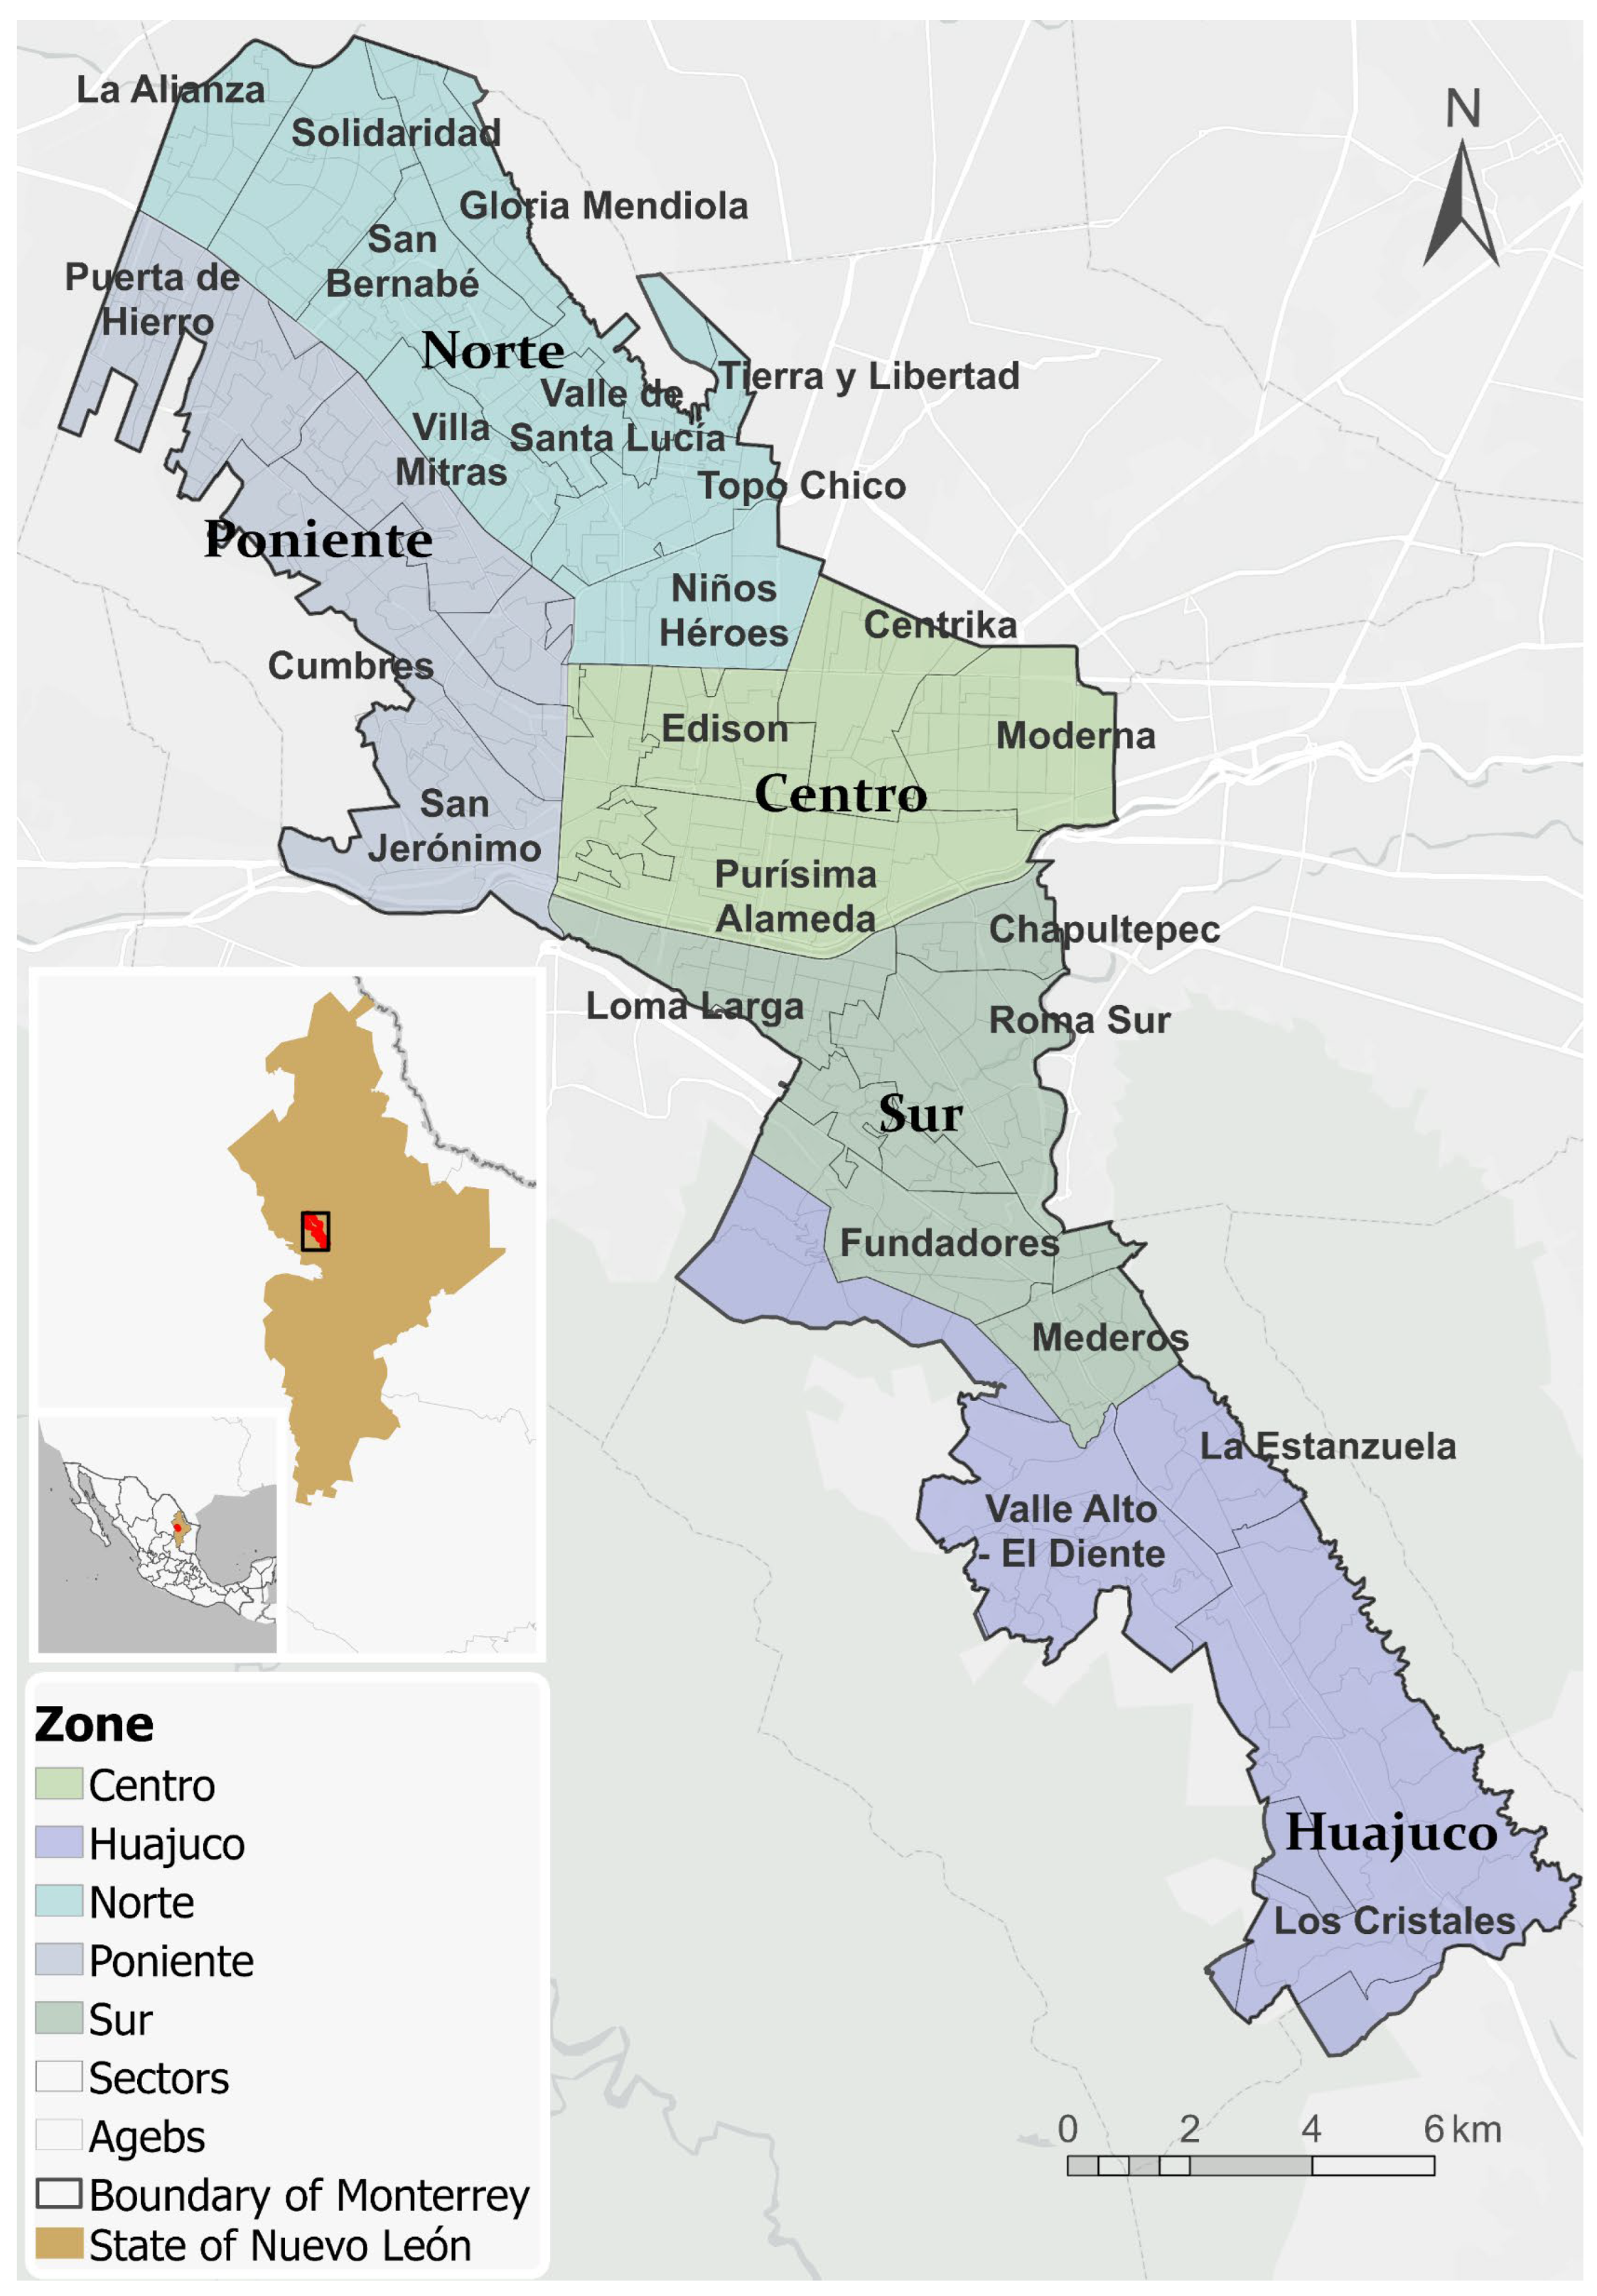
Figure 1. Study area.
Ijgi 14 00367 g001
Figure 2. Behavior of VAW in Monterrey in 2019 (Pre-pandemic of COVID-19).
Ijgi 14 00367 g002
Figure 3. Behavior of VAW in Monterrey in 2020 (Impact of COVID-19).
Ijgi 14 00367 g003
Figure 4. Behavior of VAW in Monterrey in 2021 (Peak period).
Ijgi 14 00367 g004
Figure 5. Behavior of VAW in Monterrey in 2022 (Post-pandemic of COVID-19).
Ijgi 14 00367 g005
Figure 6. Distribution of activity by day of the week and time of day. (a) 2019; (b) 2020; (c) 2021; (d) 2022.
Ijgi 14 00367 g006
Figure 7. Heat map of the spatial density of violence against women incidents by type in Monterrey. (a) Domestic violence; (b) Partner violence; (c) Others.
Ijgi 14 00367 g007
Figure 8. Temporal analysis of incidents of violence against women categorized by time intervals: (a) early morning; (b) morning; (c) afternoon; and (d) night.
Ijgi 14 00367 g008
Figure 9. Annual identification of hot- and coldspots using the Getis–Ord Gi* and Local Moran’s I statistics. (a) Getis–Ord Gi* 2019; (b) Getis–Ord Gi* 2020; (c) Getis–Ord Gi* 2021; (d) Getis–Ord Gi* 2022; (e) Local Moran I 2019; (f) Local Moran I 2020; (g) Local Moran I 2021; (h) Local Moran I 2022.
Ijgi 14 00367 g009
Figure 10. Spatio-temporal distribution of violence against women in Monterrey, 2019–2022.
Ijgi 14 00367 g010
Table 1. Daily Descriptive Statistics.
YearMeanSDMinMaxSum
201917.87.12516482
202019.77.55487221
202120.48.34547449
202219.99.21555884
Table 2. Descriptive Statistics by Crime Type (2019–2022).
Crime TypeMeanSDMinMaxSum
Sexual abuse1.20.413335
Sexual harassment or assault1.10.413266
Other acts against sexual freedom/safety1.00.01154
Rape1.10.413162
Violence against women (general category)1.30.614654
Intimate partner violence3.41.91144437
Domestic violence15.27.014821,128
Table 3. Descriptive Statistics by Day of the Week and Year.
Day20192020
MeanSDMinMaxSumMeanSDMinMaxSum
Monday18.57.124096120.05.510311038
Tuesday15.36.464281018.67.4545966
Wednesday15.76.443181517.55.8831925
Thursday16.05.353283217.26.9636911
Friday17.07.143388418.77.5748970
Saturday18.95.663498421.86.69411135
Sunday23.08.6851119624.59.99471276
Day20212022
MeanSDMinMaxSumMeanSDMinMaxSum
Monday20.67.4440106919.16.4136802
Tuesday17.46.073790517.27.9543723
Wednesday18.89.295398018.28.5334782
Thursday17.95.763293317.67.1433739
Friday18.37.543996819.111.0551803
Saturday21.97.21154114023.211.0455973
Sunday28.09.5753145425.310.07521062
Disclaimer/Publisher’s Note: The statements, opinions and data contained in all publications are solely those of the individual author(s) and contributor(s) and not of MDPI and/or the editor(s). MDPI and/or the editor(s) disclaim responsibility for any injury to people or property resulting from any ideas, methods, instructions or products referred to in the content.