Article

Geographic Information System-Based Framework for Sustainable Small and Medium-Sized Enterprise Logistics Operations

by
Jonathan Agoo
,
Renz Joshua Lanuza
,
Jonathan Lee
,
Paul Anthony Rivera
,
Neil Oliver Velasco
,
Marielet Guillermo
* and
Arvin Fernando
Gokongwei College of Engineering, De La Salle University, Manila 1004, Philippines
*
Author to whom correspondence should be addressed.
ISPRS Int. J. Geo-Inf. 2025, 14(1), 1; https://doi.org/10.3390/ijgi14010001
Submission received: 23 August 2024 / Revised: 3 November 2024 / Accepted: 15 November 2024 / Published: 24 December 2024

Abstract

:
Dispatching goods is becoming more difficult to manage in the field of logistics due to the high demand for order shipments. This is related to the increasing popularity of the use of e-commerce platforms by consumers, where products are required to be delivered rather than being bought in physical stores. Dispatch management is one of the critical components in a supply chain since it covers the coordination of tasks among stakeholders from the warehouse to the consumer’s doorstep. In this study, the authors propose a framework leveraging geographic information to sustain logistics operations, specifically in terms of managing last-mile delivery and return trip orders. This includes scheduling, communications, and the inventorying of the shipment status of goods. A mobile application built on this framework was integrated with a waypoint order optimization algorithm considering an entire route that traverses all the required pick-up and delivery points. It was pilot tested with an actual dispatch operation of a logistics company, yielding decreases of 92% and 43% in the average turnaround time and carbon footprint per completed service request, respectively, a decrease of 57% in operations cost, and an increase of 72% in profit. With the adoption of this framework, this study aims to contribute to the overall efficiency and sustainability of logistics operations in a wider geographic range.

1. Introduction

Consumers of the present generation have grown more dependent on the use of e-commerce, given the convenience it offers in terms of the purchase and delivery of goods [1,2]. Consequently, the demand for logistics has exponentially increased since e-commerce businesses heavily rely on this industry [3]. The companies running e-commerce services have opted to make use of third-party logistics services instead of buying their own delivery vehicles and managing their own order shipments. Third-party logistics or 3PL is a type of logistics service that specializes in moving goods from source to destination points [4]. Its services commonly include freight forwarding, cargo delivery services, and point-to-point delivery [5]. Outsourcing this service has enabled e-commerce businesses to focus more on improving their core operations.
The process of bringing the product to the customer, technically known as last-mile delivery, has garnered a lot of attention recently because of its pivotal role in customer satisfaction, environmental impact, and cost-effective operations [6,7]. It is composed of several steps, as follows: (1) the storing of order information in the digitized central system, (2) the physical arrival of orders at the logistics company, (3) the assignment of orders to delivery personnel, (4) the updating of order statuses, and (5) the closing of orders for successful end-to-end transactions [8]. A return trip is added as an additional step when the product delivered is wrong or defective. Return trips are the transfer of products or assets from the vehicle’s destinations back to their origins or to another specified point [9,10]. Although it appears to be a simple step in the logistics process, return trips can bring about challenges and opportunities that may have a significant impact both on the business’ cost savings and on the environment. Coordination among stakeholders throughout the process is seen as crucial, and among the difficult tasks of a dispatcher are scheduling and fleet tracking [11,12]. Inefficiency in handling these tasks has contributed to operational overhead costs and to greater environmental carbon footprints [13].
According to one study, 25% of the total CO2 emissions of an urban city are generated from the logistics network. This is because of the urban deliveries made using smaller trucks catering to individual households, as compared to traditional bulk and long-distance deliveries [14,15]. The more frequent the stops and idle times of the vehicles, the higher the fuel consumption and the higher the greenhouse gas contribution. This scenario has been evident in last-mile deliveries or the final leg of shipments [16,17,18]. Other contributing factors to the increased carbon footprint are the vehicle type, traffic characteristics, fuel type, and the fleet behavior [19]. There has long been a need to structure fleet dispatch and space usage at a single time of delivery to lower the contribution of logistics operations to pollution [20,21]. With the use of the IoT, the coordination between customers and drivers was made more real-time in one study [22]. Another study focused on managing received requests to make dispatch assignments more economical at the pick-up vehicle end [23,24]. In terms of routing optimizations, several search heuristics [25,26,27] have been proposed, not only in the transportation sector but also in supply distribution [28,29] and in fields that require the redirection of entities in general [30,31,32]. Dijkstra’s method is one of the most classic yet stable search algorithms that serve as the primary backbone of route-finding algorithms for Google Maps. It aims to find the shortest path from one point to another by visiting all the adjacent vertices and calculating the path cost at the same time [33]. The path cost may vary depending on the required metric. Most commonly, either distance or time cost metrics are used [34]. A review of related studies and lacking approaches is summarized in Table 1.
The strengths and weaknesses of the existing studies relevant to the authors’ proposed solution are presented in this chapter. After thorough research, we gained an understanding of ways of dealing with the issues in dispatch management and gained insights into how various algorithms and methods can be integrated into solutions mitigating the problems encountered in logistics operations in general.
This study aimed to address the pressing economic and environmental needs and challenges within the logistics industry, primarily for small and medium-sized third-party logistics businesses, through a geographic-information-system-based framework [56]. A software application was developed and integrated with a waypoint optimization algorithm to manage the workload in last-mile delivery and return trips [57,58] more efficiently, leveraging actual geospatial data such as the location and traffic-based travel time, which can be obtained from this framework. Concurrently, we promote green logistics with a reduction in carbon emissions from courier activities on the road while maximizing the logistics resources at hand [59]. The achievement of these objectives is evident with the resulting metrics presented in Section 3 of this paper.

2. Materials and Methods

A logistics company was interviewed to validate the pain points identified in the previous chapter in the context of dispatch management and to gain insights into the proposed framework, which will be discussed further in Section 2.2. A dispatch management software application was developed using Android Studio (Hedgehog v2023.1.1) as an Integrated Development Environment (IDE), Flutter (v3.19.0) as the UI Software Development Kit (SDK), and Dart (v3.3) as the primary programming language, and this was powered by Google APIs (application programming interfaces) such as Maps, Places, Directions, and Firebase Cloud Messaging. The final prototype was tested, and its performance results were compared with the traditional approach of the identified logistics company in dispatch management.

2.1. Current Method Used by the Partner and Other Third-Party Logistics Companies

The traditional return trip and last-mile delivery transactions of most logistics companies like 5RJS Lanuza Logistics Corp. have been made through calls, Short Message Service (SMS), and emails from customers. The 3PL is directly contacted by the customer via phone, when they make a call to schedule the delivery of their goods. The dispatcher from the 3PL then arranges a vehicle and driver to send the products in a batch to the respective end customer’s location. The car usually returns to its origin point with empty or unused space after all assigned orders are successfully delivered. In the case of return trips, the dispatcher is contacted again by the customer, requesting a new schedule to transport goods from the destination back to the vehicle’s origin. The current method has presented limitations and challenges in establishing effective communication, coordination, and scheduling, resulting in inefficiencies and missed opportunities, especially in terms of optimizing delivery routes and use of carrier space. Additionally, transactions made via phone calls, SMS, and emails are difficult to track, and further issues in managing logistics processes are posed.
Similar conventional methods are being used in other small to medium-sized 3PL business operations in the country, such as F2, Majestic Group Global, Ernest, and SuperHawk Logistics. There were attempts to use software solutions for cargo-booking and delivery-tracking visibility for the end user. However, the dispatch management internal to the operations remains conventional. On the driver’s side, the ordering of deliveries is decided based on the expert judgment of the dispatcher, which is not reliable at all times, given the sporadic changes encountered on the road daily. Other 3PL software solutions, such as Lalamove (v112.3.0) and Grab Express (v5.332.0) services, utilize GIS to optimize delivery routes, although trip requests are received by drivers on an on-demand basis, meaning that the current transaction needs to be completed first before receiving another job, since dispatch management per se is not included in the software solution functions.
The old framework shown in Figure 1 has yielded a high turnaround time and low concurrent order processing. Using phone calls has limited single customer transactions as these calls take time, usually ranging from a few minutes to an hour in duration, depending on the concerns of the customer. The following describes the setup of the corporation:
The customer can only make inquiries about delivery orders through phone calls or SMS to the company. High call waiting times have become a common problem when there are simultaneous requests from multiple customers. When an inbound call comes through, a customer service representative (CSR) is assigned to interact with the customer and maintain good relationships. They answer customer concerns, relay messages to and from the management, provide service information, and monitor the capacity of trucks to handle a given number of deliveries. All these are crucial in maintaining a good business image for customers. Next, dispatchers interact with drivers while assigning delivery requests to available drivers, monitor the progress of deliveries, and relay the routes/paths that the drivers should take. Fleet tracking is performed using a whiteboard only. This is inconsistent and difficult to sustain, especially when the business is expanding. On the driver’s side, a call is made by the dispatcher when an accepted delivery order is placed, whether it is for last-mile or return trip delivery.

2.2. Proposed GIS-Based Framework

Four roles (see Table 2) have been identified at the software level: administrator, dispatcher, customer, and driver. The customer is the one who requests the trips and monitors the progress of the delivery requests. The dispatcher will either accept or decline the delivery requests, depending on the availability of vehicles and drivers. The dispatcher will also be responsible for receiving and assigning requests to the available drivers, which they will then monitor. The driver will accept or decline the delivery requests depending on their condition and update their progress while delivering the goods. Lastly, the administrator has the same responsibilities as the dispatcher but has additional ones, specifically retrieving, updating, and deleting user accounts in the application software.
The proposed improvement to the framework of the 5RJSL Lanuza Logistics Corp. is shown in Figure 2. This utilizes mobile applications and GIS-driven algorithms at the backend to improve the business response times and increase the number of concurrent customers the business can handle. With the new framework, customer can send orders through the application software, and acceptance notifications are received without repeated dialing. The option to use SMS, calls, or emails for inquiries about concerns and special deliveries is still available. The customer service representative may answer special concerns through SMS, calls, and emails. The dispatcher can handle multiple orders at the same time as long as delivery trucks are available. The dispatcher is also responsible for assigning driver trips, including return trips through the application software, managing the truck fleet using the dashboard, and monitoring the trucks and customer orders. Lastly, the truck driver can update the dispatcher regarding delivery and availability much more quickly instead of calling the dispatcher back. They can also accept/reject customer orders, which is useful in case the driver needs to go home early or has health problems that arise.
To optimize the trip of a driver, the application software suggests a route plan based on various input parameters such as vehicle type, shipment locations, defined constraints, and vehicle cost parameters. The constraints include driver working hours, vehicle capacity, and window hours. This optimization is achieved through the waypoint order optimization algorithm, wherein a vehicle is assigned cost per hour, per kilometer, and per traveled hour parameters. The pseudocode representation of the algorithm is as follows:
  • request.truck [0].startLocation -> transitions [0] -> visits [0] ->
  • transitions [1] -> visits [1] -> transitions [2] -> … -> visits [n] ->
  • transitions [n] -> request.truck [0].endLocation.
The startLocation and endLocation represent a truck’s origin and return point, respectively, after all orders have been shipped to the corresponding end customer location. Based on the GPS locations of pick-up/delivery points, the waypoint order is arranged to achieve the minimum travel hour and distance costs. These costs are extracted using Google’s Distance Matrix and Directions API. A transition is tagged between the truck’s current location and the following location to visit. Upon completion of a pick-up or delivery, it is tagged as a visit. This represents the assigned work that a truck must complete at the requested place and time. Google’s interactive polyline encoder utility was used to aid the driver in visualizing the path per visit.
Utilizing the GIS-based framework can sustain logistics operations with its combined workload management tool and shipment route optimization to increase time efficiency, cost savings, customer/driver satisfaction, and environmental friendliness through reduced carbon emissions despite being in the transportation sector.

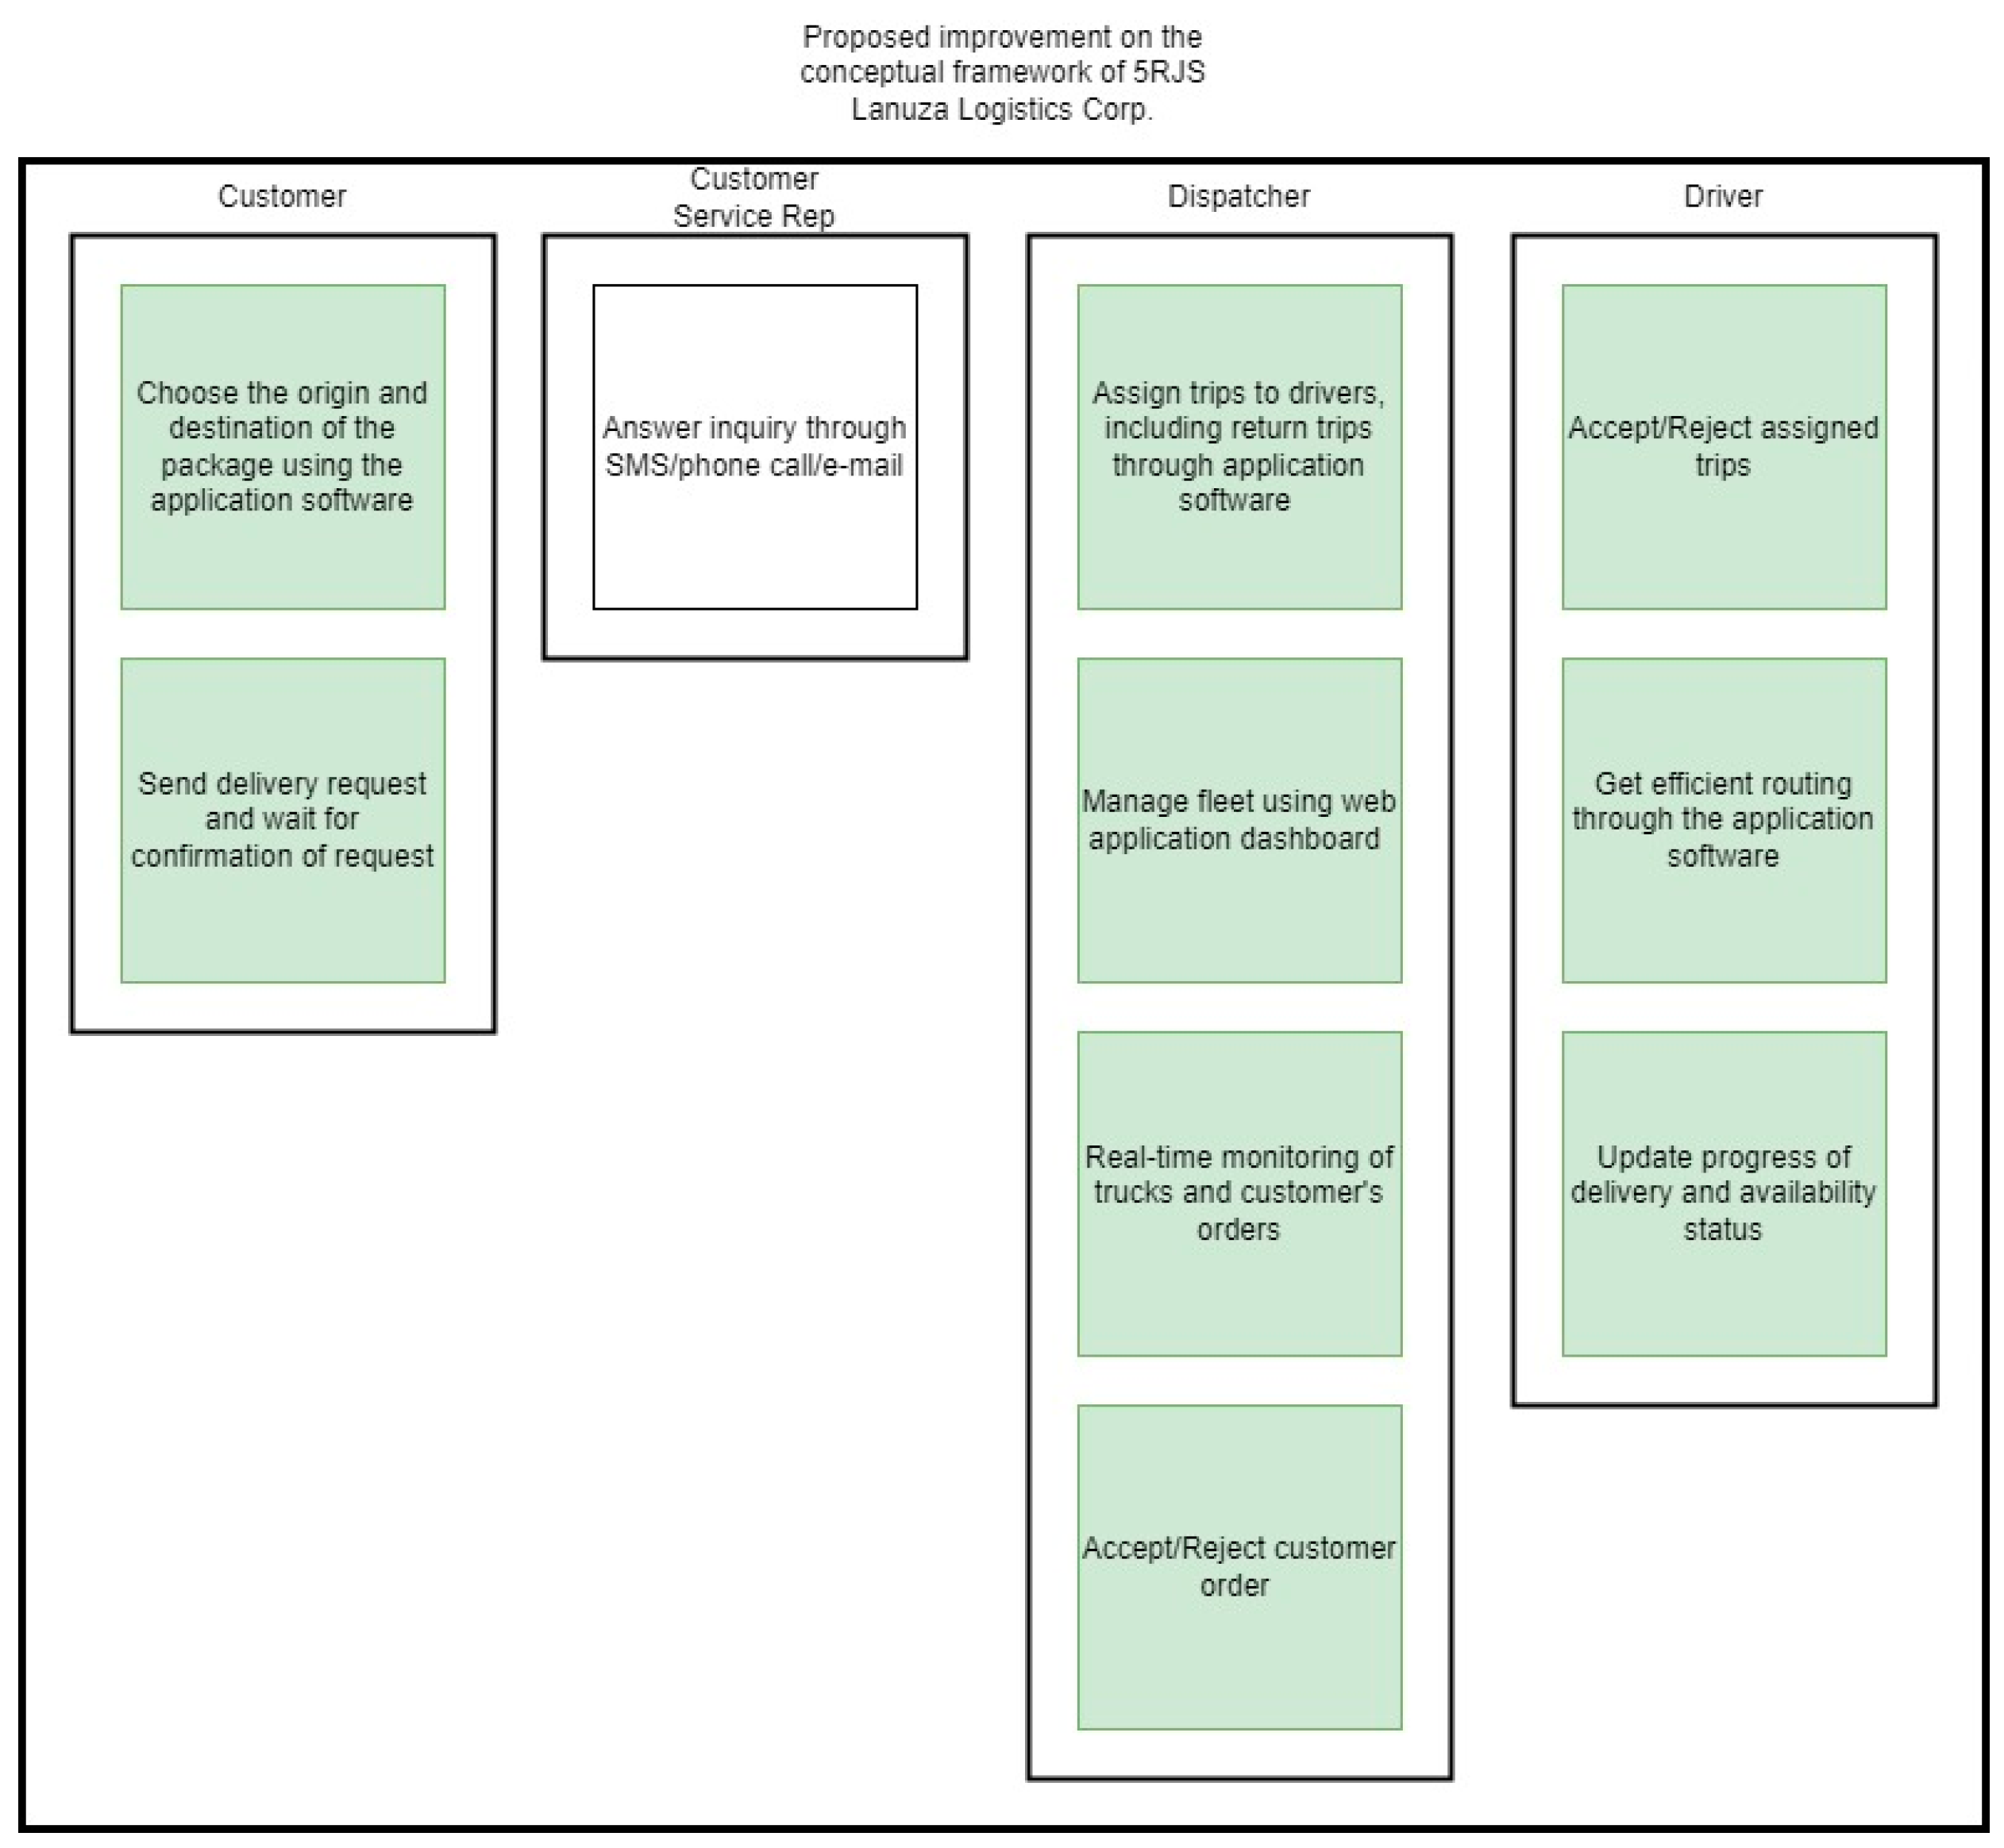
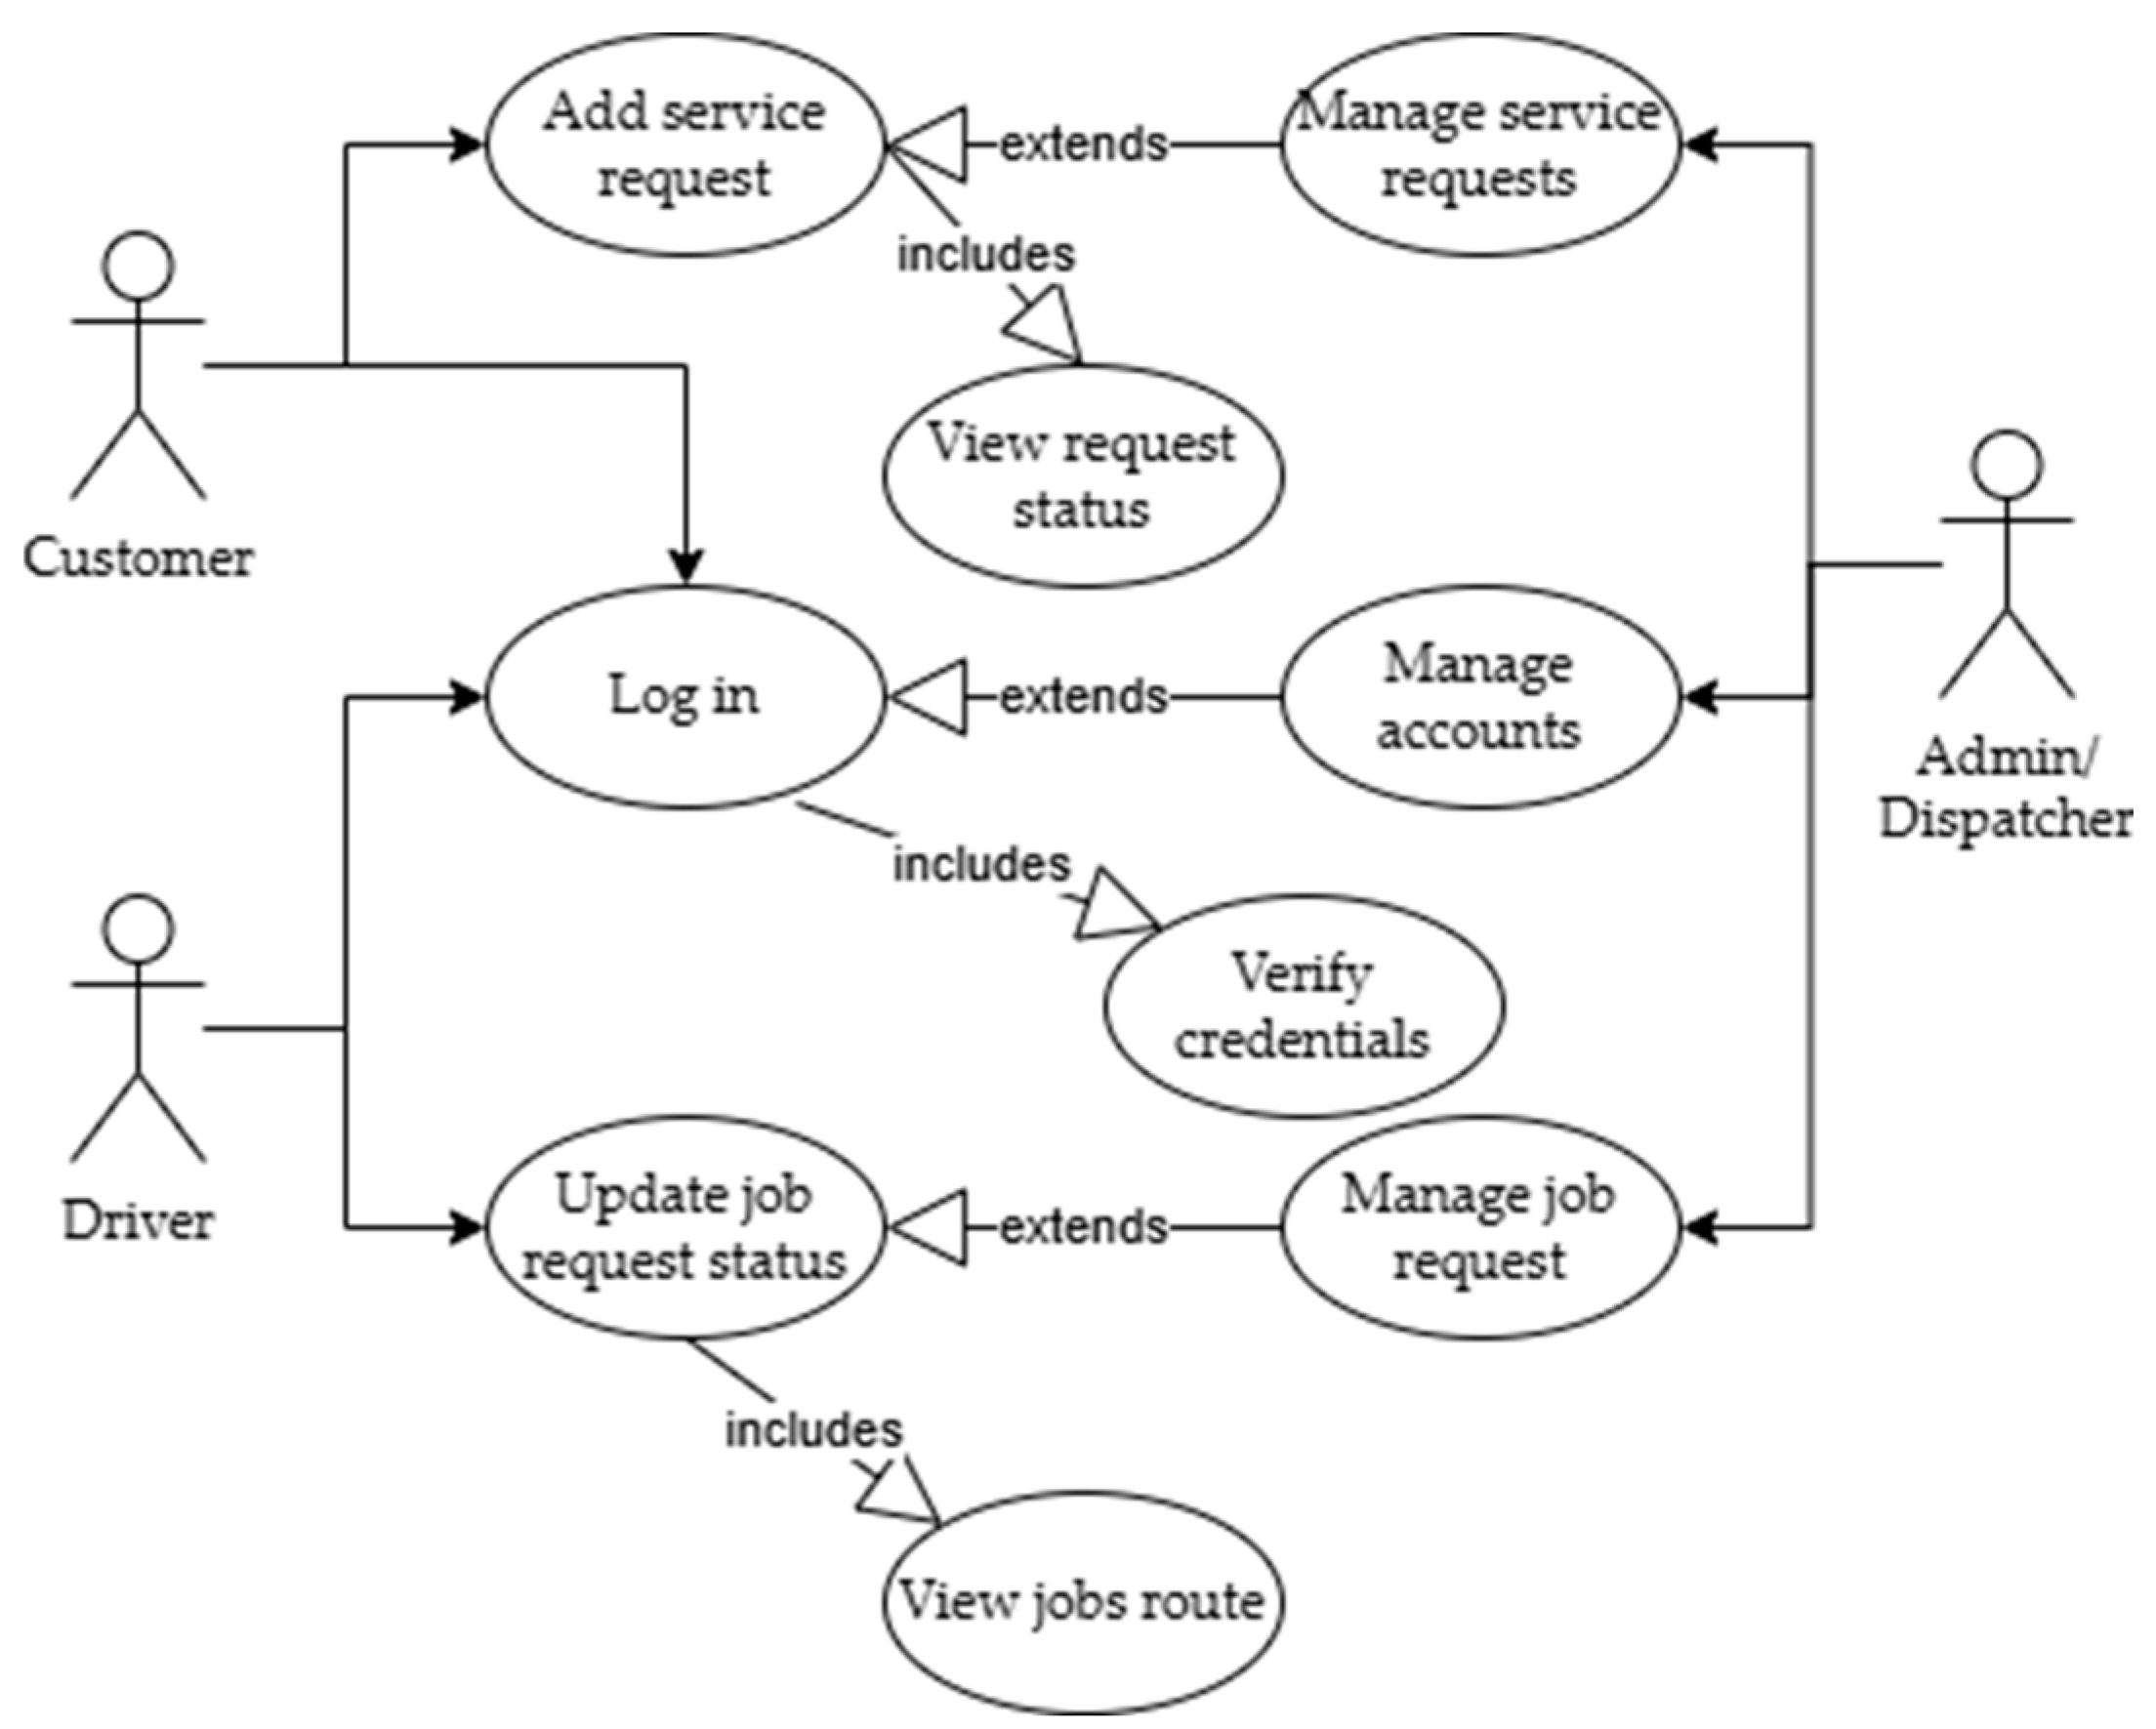
2.3. Roles and User Access in the Application Software

The roles and capabilities of the application software are described in Table 2 and illustrated in Figure 3. The admin has the ability of a dispatcher plus the ability to view, update, block/unblock, and delete the details of the users in the database.

2.4. Dataflow in the GIS Framework

Figure 4 shows the data flow diagram of the application software. This figure illustrates the interaction between the database, APIs, different variables, and user data. The data start with the creation of users and drivers in the application. At first, the user will input their details such as email address, username, phone number, and password, and the driver will input the details mentioned earlier in addition to car details such as plate number, model, and their picture so that the admin and dispatcher can further validate their legitimacy and identify them more easily in the system once recorded in the database. The Mapping and Database module houses the algorithms and core GIS, which are the key contribution and difference made by the proposed study as compared to existing 3PL solutions of SMEs, whether conventional or with the aid of software applications.

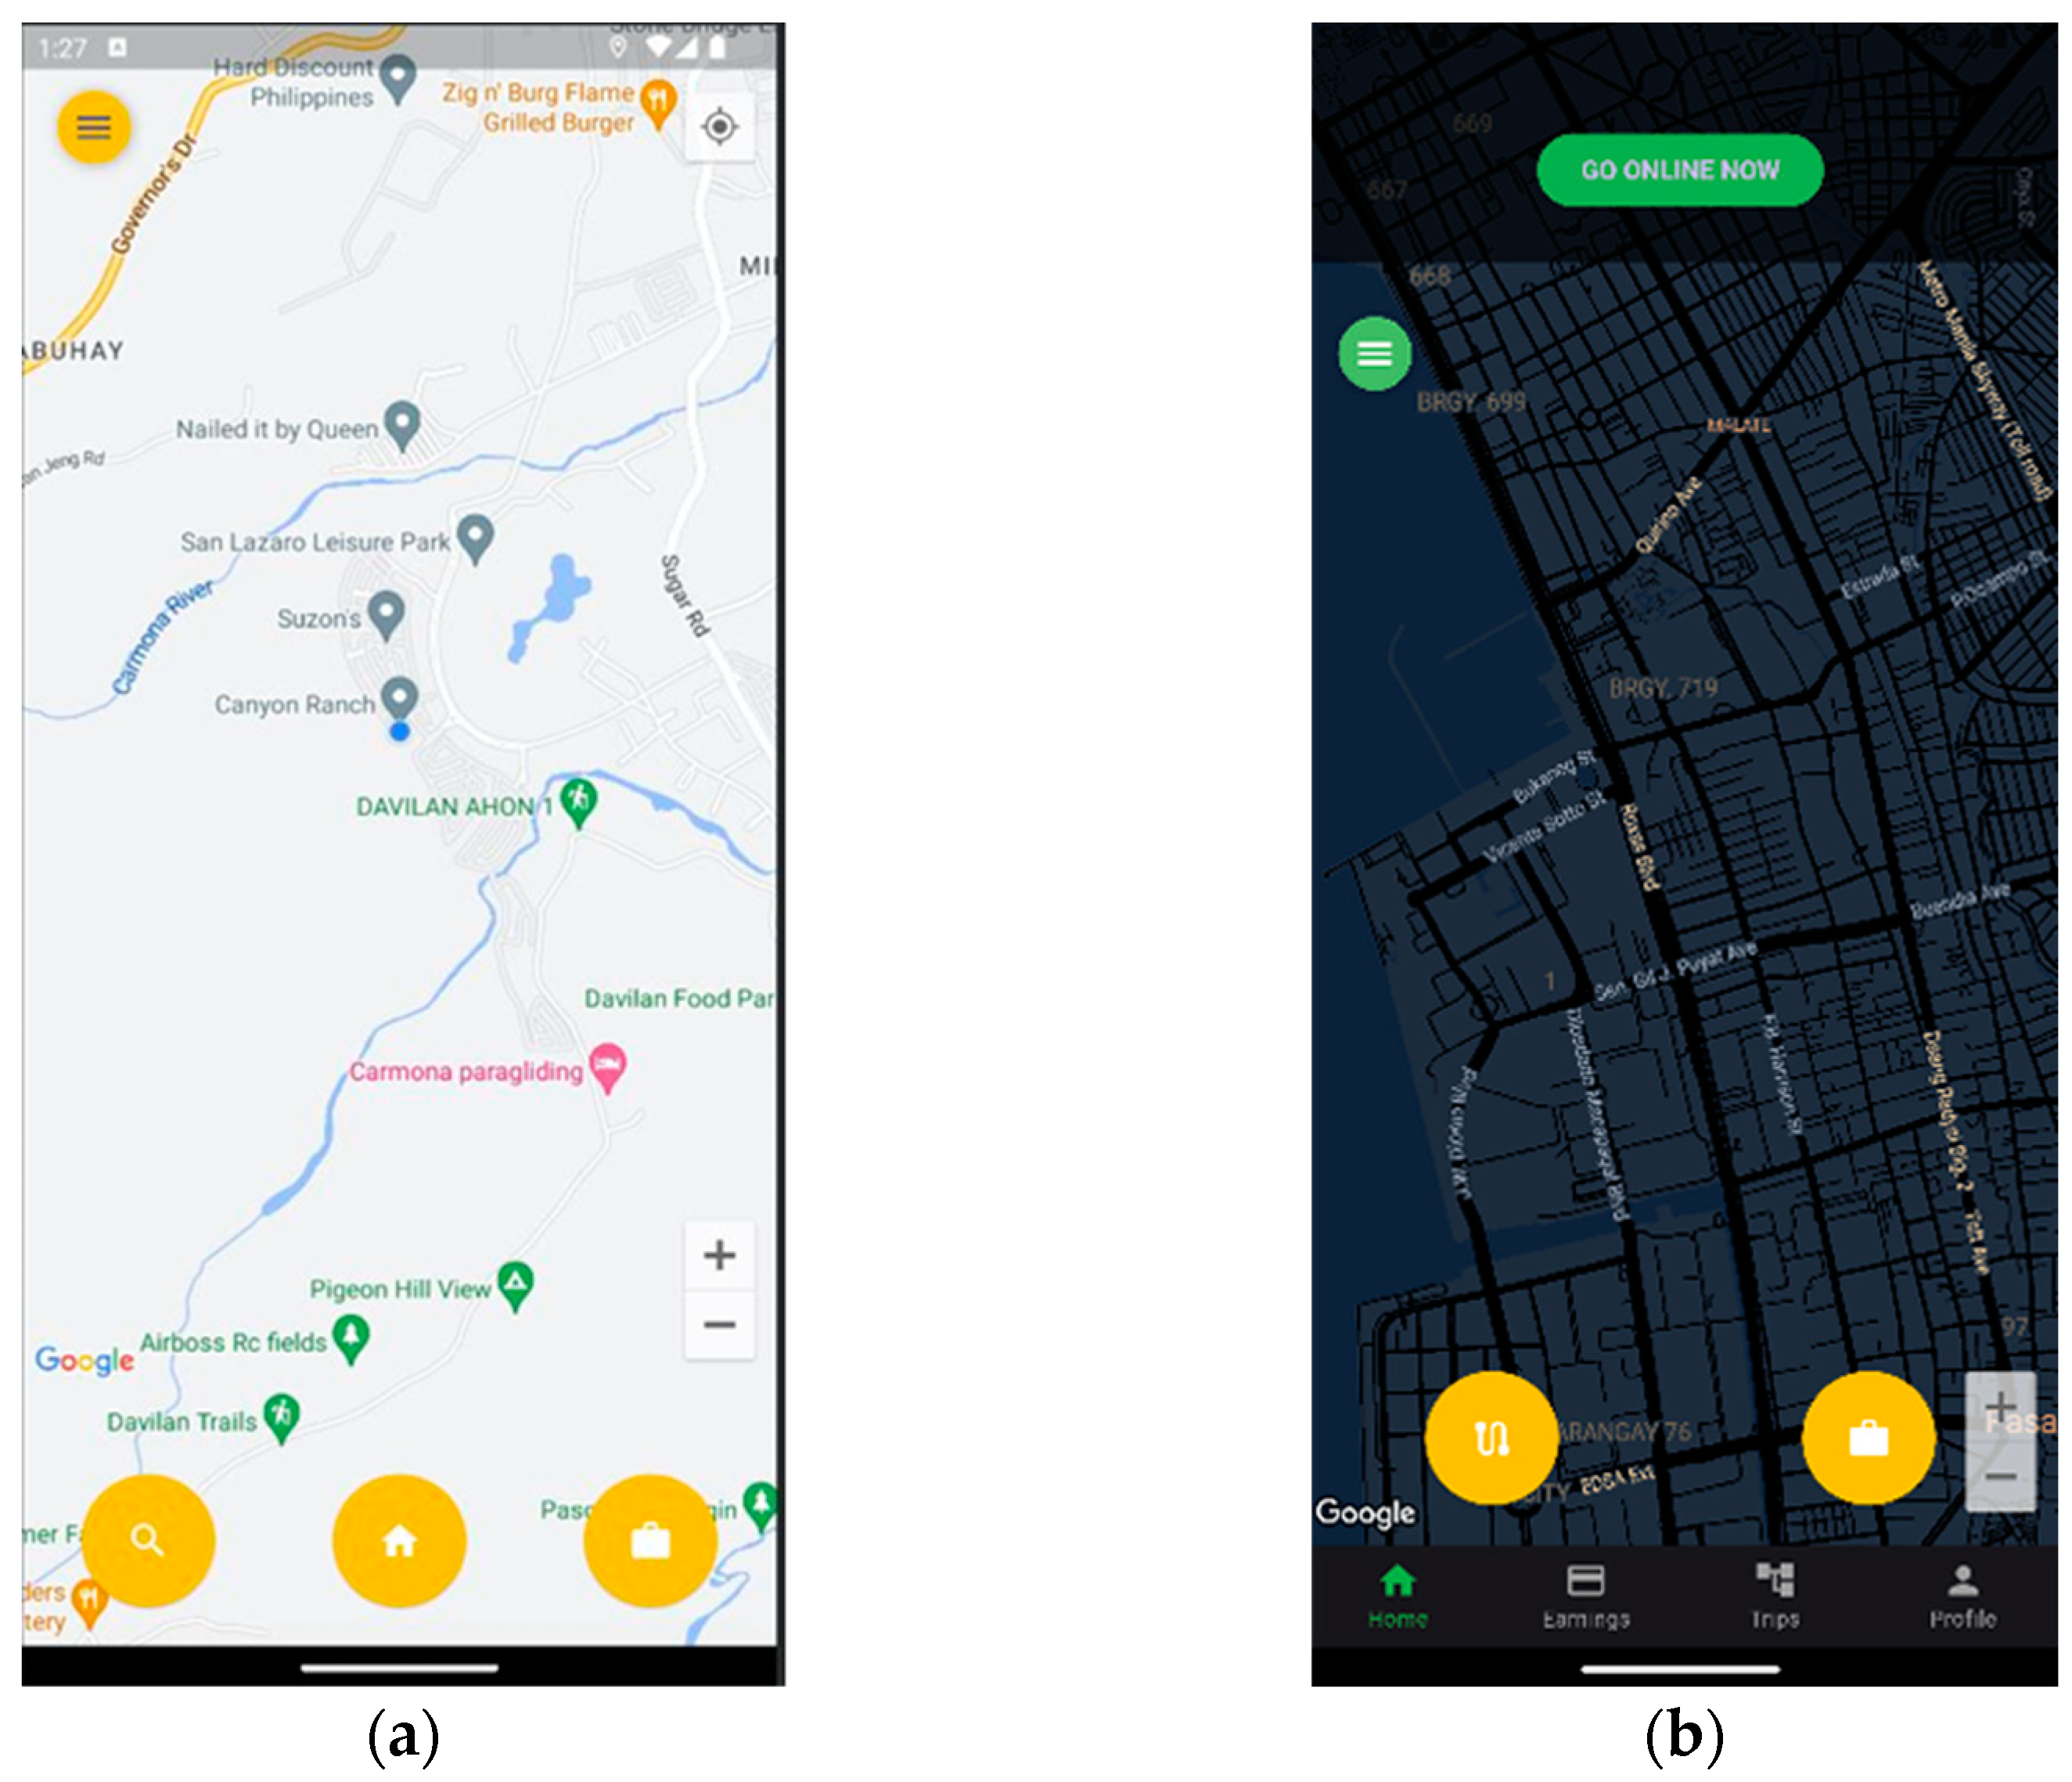
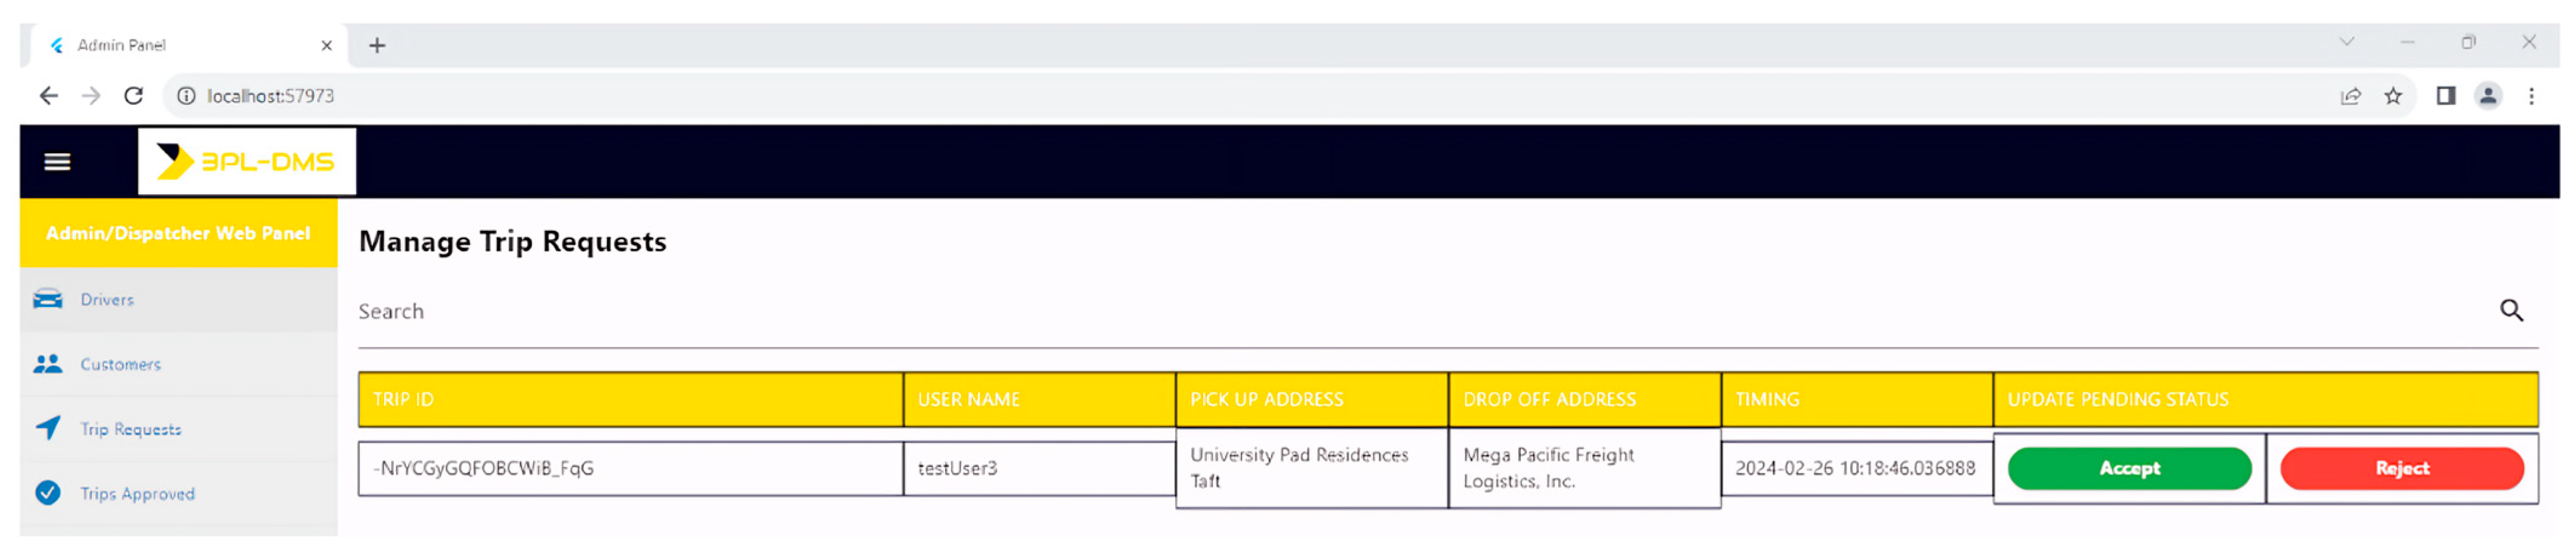
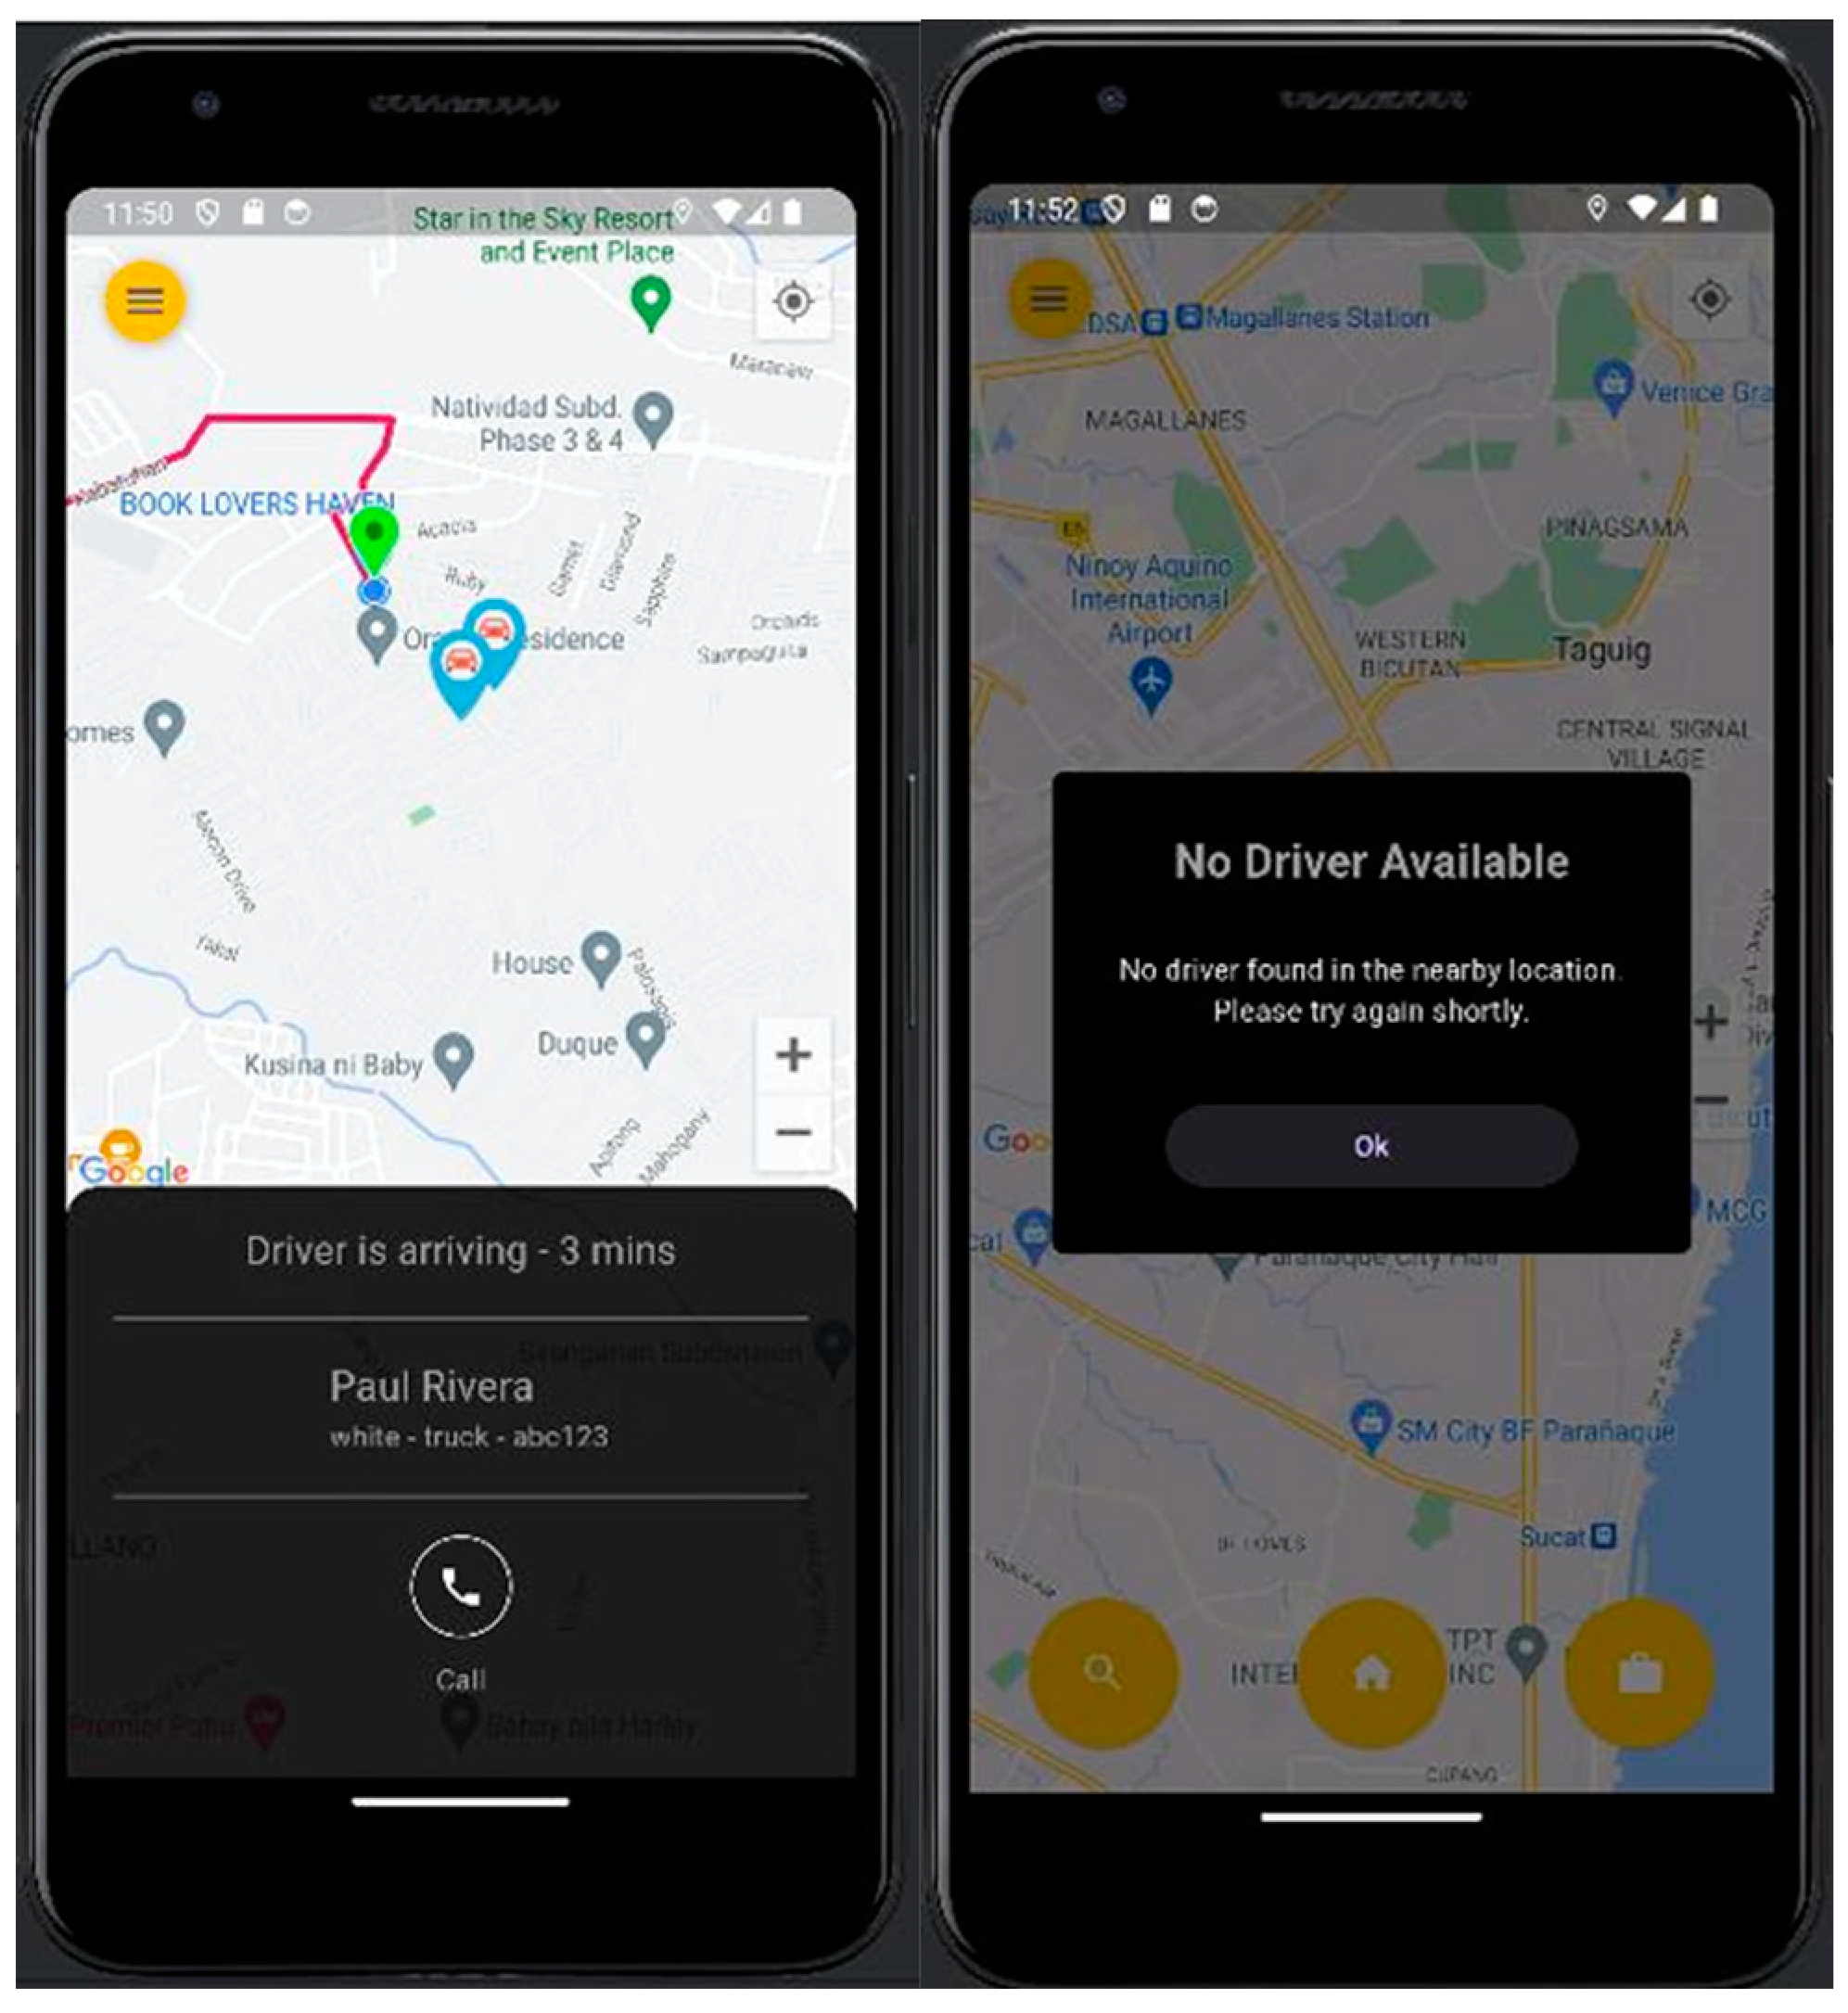
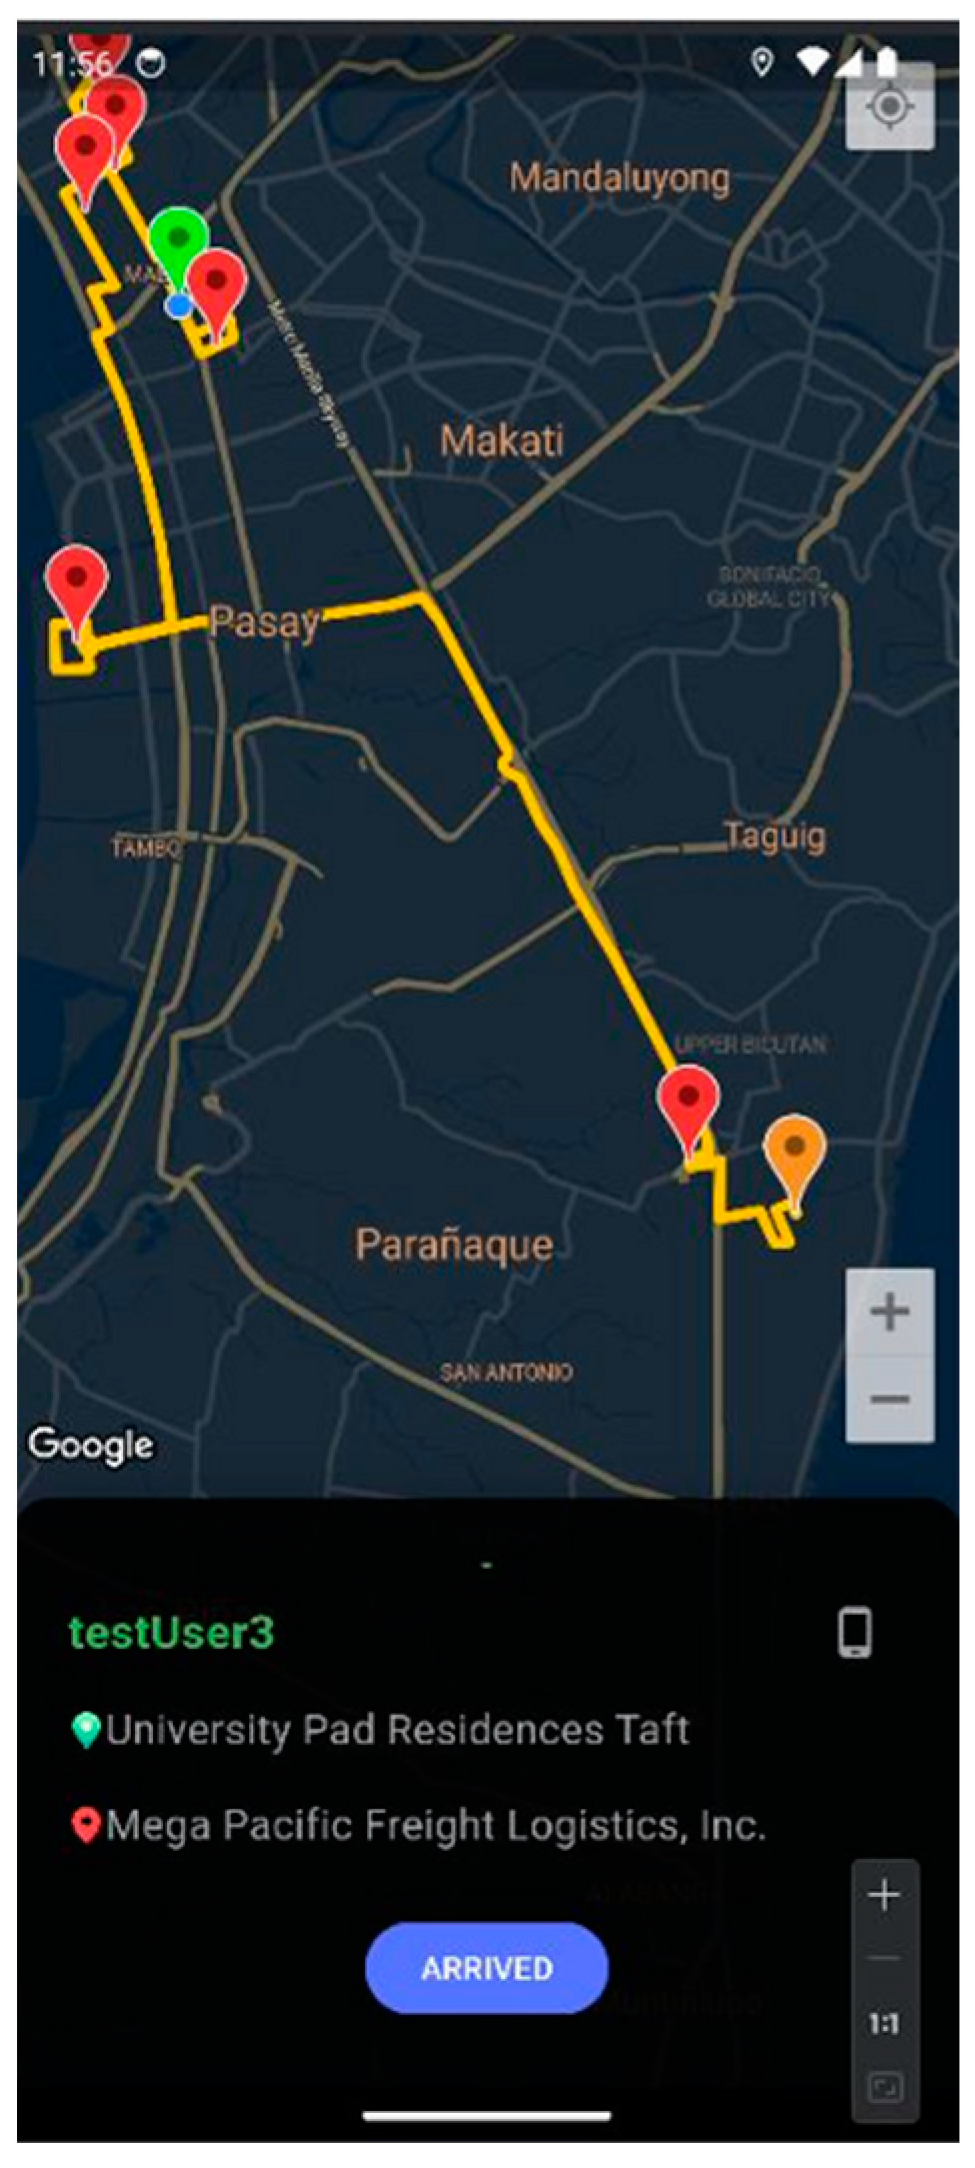
2.5. Developed Application Interface

The log-in pages of the mobile application for the user and driver have been developed with a similar design but with separate backend forms for credentials’ validation. Once successfully logged in, the user and driver are redirected to a map, as illustrated in Figure 5. On the users’ side, they can see the available drivers within their area, indicated by a car icon. On the other hand, there is a “Go Online Now” button for the drivers. The driver can click it to indicate their availability to pick up goods from customers. The search destination page in Figure 6 is where a user can enter their preferred pick-up and destination points. The search algorithm predicts the location based on the characters being entered and dynamically lists places that match for easier and more accurate entry of locations, as shown in the pseudocode below.
FUNCTION searchLocation (locationName)
        IF the length of locationName is greater than 1 THEN
            CONSTRUCT the API URL for Google Places Autocomplete
                using the locationName and the Google Maps API key;
            SEND a request to the Places API using the constructed URL;
            AWAIT the response from the Places API
            END IF
            IF an error occurs during the API request THEN
                RETURN to the function
            END IF
            IF the response status from the Places API is “OK” THEN
                EXTRACT the predictions from the response;
                MAP each prediction to a PredictionModel object;
                CONVERT the mapped predictions to a list;
                UPDATE the dropOffPredictionsPlacesList state variable
                    with the list of predictions
            END IF
END FUNCTION
A web application has been developed to manage trip requests on the admin or dispatcher’s side. The panel dashboard is shown in Figure 7. Here, the trip details such as trip ID, username, pick-up and drop-off addresses, and request status can be seen and managed by the admin to facilitate delivery service. Once a trip request is approved, the pseudocode below is initiated to find and notify the nearest online driver from the place of pick-up. A time-out is incorporated to limit the waiting time and immediately pass on the service request to the next-closest available driver. The notification dialog that pops up when a trip has been assigned to a driver is shown in Figure 8. When the driver accepts the request, the trip details container showing information on the driver’s estimated time of arrival, name, and car is populated on the user app, as shown in Figure 9. It also has a call button to enable communication between the user and the driver. When the user clicks the button, they are redirected to the phone’s dialing app, and the mobile app automatically pulls up the driver’s number. When the dispatcher rejects the trip or none of the drivers accept the request within the set time limit, a notification dialog will pop up stating that no driver is available. Figure 10 shows the navigation map of the driver when multiple requests were accepted within the given period. The routes highlighted are based on the resulting order of pick-up and delivery points using the waypoint order optimization algorithm, as discussed in Section 2.2 of this paper.
FUNCTION initializeGeoFireListener ()
        INITIALIZE GeoFire with the database reference “onlineDrivers”;
        QUERY nearby drivers using the current latitude and longitude of the
user with a radius of 22 units;
LISTEN for changes in the nearby drivers query results

IF the driver event is not null THEN
    RETRIEVE the child event type from the driver event;
    SWITCH CASE on the child event type
        IF the event is Geofire.onKeyEntere THEN
            CREATE a new OnlineNearbyDrivers object;
            POPULATE the object with the driver’s uid,
                latitude, and longitude;
            ADD the driver to the nearbyOnlineDriversList;
            IF nearbyOnlineDriversKeysLoaded is true THEN
                UPDATE the drivers on the Google Map
        END IF

        IF the event is Geofire.onKeyExited THEN
            REMOVE the driver from the nearbyOnlineDriversList;
            UPDATE the available online drivers on the map
        END IF

        IF the event is Geofire.onKeyMoved THEN
            CREATE a new OnlineNearbyDrivers object;
            UPDATE the object with the driver’s UID,
                latitude and longitude;
            UPDATE the location of the driver in the
nearbyOnlineDriversList;
                    UPDATE the available online drivers on the map
                END IF

                IF the event is Geofire.onGeoQueryReady THEN
                    SET nearbyOnlineDriversKeysLoaded to true
                    UPDATE the available online drivers on the map
                END IF
            END SWITCH CASE
        END IF

END FUNCTION
A proof-of-delivery function was also added to allow drivers to capture images and send them accordingly, along with the drop-off time and location. This is crucial when assessing disputes about lost packages or return requests for wrong/damaged packages.

2.6. Data Collection Methods

We replicated an average trip of a 4-wheeler vehicle of the partner logistics company. The scenario is that there are seven accepted service requests in a single day identified with a reference number, three of which have exact pick-up locations but with different delivery areas and lead times, and one is a return request, as shown in Table 3. All packages that cannot be delivered within the day, including those for return, will be dropped off at Mega Pacific Freight Logistics, Inc. (Manila, Philippines). Based on the requests received, the dispatcher has arranged the pick-up and delivery points in the form of a job request for the next-day schedule of an assigned driver. This will be further discussed in Section 3.1.
Data gathering is divided into three parts. In the first part, the researchers followed the order of job requests based on the expert judgment or familiarity of the dispatcher with the service locations without using the developed software or any navigation apps. In the traditional approach, the driver should be following this, but there are instances when the points are reordered depending on several factors such as the driver’s spatial awareness, traffic conditions, and inability to contact the recipient on their number. In the second part, the researchers used the software application, which receives the service request, allows the dispatcher to accept requests, assigns the requests to a driver, and organizes the route for the driver. The elapsed time, distance traveled, and fuel expenses were recorded, and the corresponding carbon footprint, service turnaround time, job requests completed, elapsed time savings, and projected profits were measured. It should be noted that due to time constraints, the researchers started outside the Br. Andrew Gonzales Hall in the actual testing for both the traditional and the proposed GIS-based frameworks, instead of Mega Pacific Logistics, Inc. The deviation in time and distance projected by Google Maps were added to the final results. In the last part of the data gathering, the researchers demonstrated the software application to several employees of the partner logistics company. They distributed a survey about user acceptance to them.

2.7. Freight Rate Matrix Provided by the Partner Logistics Company

The freight rate matrix provided by the partner logistics company is summarized in Table 4. The researchers used this to generate the projected profits for testing using the current dispatch method. Another factor measured was the fuel cost per trip. To compute the fuel cost incurred in the traditional method, the researchers followed the fuel efficiency values and fuel price set by the partner logistics company. According to R.J. Lanuza in a personal interview on 19 February 2024, the company currently has the fuel efficiency set to 8 km/L and the fuel price set to PHP 65.00/L in computing the fuel expenses, assuming no applicable toll fees. The third column in Table 3 is the fuel expense less the reclaimable amount equal to the consumption tax of around 11% for businesses. The labor cost is calculated as the sum of the driver’s and helper’s fees of PHP 550.00 and PHP 405.00, respectively. These are the current fixed amounts being paid by the partner logistics company in exchange for the services of the assigned driver and helper, regardless of the total distance traveled. The freight rate that is being charged to customers is computed as the sum of total expenses and the marked-up amount. The mark-up pricing of the partner logistics company is set to 35% of the total costs. The freight rate is also subjected to 12% VAT when the customer uses the service. The final freight rate charged to the customers per trip is simply the freight rate, including VAT, rounded up to the nearest hundred. In the final column, the percentage profit per transaction is computed as the final freight rate less the 12% VAT and divided by the total expenses. It can be seen that the profit per transaction ranges from 33 to 41% in the conventional method.

2.8. Freight Rate Matrix Provided by the Researchers

Table 5 shows the freight rate matrix with the use of the developed software application for dispatch management. This was also used to generate the projected profits, to test the dispatch performance using the proposed GIS-based framework. The existing freight charges of the partner logistics company are based on a two-way or return trip (origin to destination and vice versa), making them high despite the fact that deliveries are made from one pick-up/delivery point to another rather than from the origin (often from the warehouse) to the corresponding delivery locations and vice versa. In addition, the fixed costs paid to the driver and helper per trip without reference to the actual distance traveled significantly contribute to the freight charges despite the fact that some packages require minimum effort from the helper and some delivery points are very near each other, which does not necessarily equate to a roundtrip distance per se. More established or large logistics companies implement a base fare on every trip and add a fee for every kilometer traveled to the destination [60]. This makes it fair not only for the customers but also for the company. With the software application, it is easier to adjust the rates being paid to the drivers and helpers, as well as the rates being charged to the customers, since the actual data on the distance traveled between points can now be extracted.
The fuel efficiency rate of 8 km/L and price of PHP 65.00/L in calculating the fuel consumption still apply, as per the computation in (1).
Fuel Consumption Cost = Fuel Price × No. of Kilometers/Fuel Efficiency
With the use of a software application, a new variable cost was introduced: the maintenance cost set at 5% of the final freight rate. The fees paid for the driver and helper were converted from a fixed to a variable cost set at 10% with a base pay of PHP 100, and 5% with a base pay of PHP 75, respectively. The base pay and percentage value ratio were maintained at 4:3, as in the fixed labor fees of the driver and helper in Section 2.7. These were also set at par with the regular service rates of existing 3PL software solutions for every individual end-user booking request and in consultation with R.J. Lanuza in a personal interview on 7 March 2024. The total expense value was now computed as the sum of the labor and maintenance fees and fuel expenses with reclaimed tax. A base fee with additional charge per km distance pricing strategy was applied for the new freight rate matrix. A base fee of PHP 200 and an additional PHP 55 per km were set at par with the regular pricing of existing online package delivery systems for 4-wheeled vehicles such as Grab and Lalamove. The total freight was still subjected to 12% VAT and rounded up to the nearest hundred. With the new costing of labor and pricing of the freight service, the percentage profit was expected to be from 2 up to 5 times higher than the percentage profit when using the conventional method depending on the distance traveled while maintaining a reasonable freight charge per km distance traveled by the courier.

3. Results and Discussions

3.1. Elapse Time and Job Request

Job request numbers were mapped based on the order of pick-up/delivery services that must be completed within the day as scheduled by the dispatcher (old framework) or the software app (new framework). There could be more than one reference number mapped in a single job request. This means that there could be multiple customers requesting a service in a similar location. But only one driver and one helper could be assigned for the series of job requests in a single trip/route, as in job request numbers 0 to 6 in Table 6 and Table 7. The service column indicates whether the job to be completed is a pick-up or delivery of a package. The elapsed time column shows the recorded duration in minutes when a job is completed from the previous to the current point. When comparing Table 6 and Table 7, it can be observed that the time it takes to arrive at all of the service locations is significantly shorter with the use of the software application. The difference in the total elapsed time between testing with and without the app is 105.3 min, which corresponds to a 36.05% saving in time, while the job requests completed see an increase of 42.86%, as shown in Table 8. The average percentage of turnaround time savings per completed customer service request is 91.85%, as shown in Table 9. Only the completed requests (picked up and delivered) in both approaches are considered in the computation of turnaround time for direct comparison. Hence, 11224-1B to 3B is reflected. In the old framework, the turnaround time per reference number is measured by the total elapsed time from the origin to its delivery point (in Table 6) plus 12 h, since the earliest delivery in the existing method is the next day. On the other hand, same-day delivery can be achieved with the new framework since the requests are received through the app and automatically dispatched to the available driver within the delivery area, unlike in the old method where all picked-up goods needed to be dropped off first at the logistics head office for dispatch scheduling by the person in charge. With this development, the turnaround time is measured by the total elapsed time between the pick-up and delivery points on the trip, as shown in Table 7.
In terms of the order of pick-up points, in Table 6 and Table 7, they only differ between the third and fourth points, which reflects that the familiarity of the assigned driver or the handling dispatcher with the test locations is coincidentally high since these are within the metro area only. However, this is not always the case. Other times, the integrated waypoint optimization algorithm offered by this study gains significance in the sense of managing the route for the driver automatically, thus reducing the elapsed time between test points, since the following have been potentially eliminated from the conventional approach: (1) coordination between the driver and the dispatcher/customer in terms of customer and package detail verification, (2) searching for directions to the next point either manually or with the aid of existing navigation apps, and (3) coordination with the contact person of the following pick-up point.

3.2. Distance Traveled, Fuel Expenses, and CO2 Emissions

Table 10 recorded the distance traveled from one point to another using the old and new frameworks. The rows are aligned with Table 6 and Table 7 in the previous section. Based on this, the total distance traversed per completed service request (picked up and delivered) was calculated and is summarized in Table 11. For the traditional approach, the distance travelled from the previous location, both for pick-up and delivery job requests, was considered in computing the total distance traversed per reference number since the two were performed on different days. On the other hand, only the distance traveled from the previous location for delivery job was considered as the distance traversed per reference number using the new framework since its corresponding pick-up job was performed simultaneously with a pick-up job for another customer on the same day. Hence, the driver saved time and fuel consumption by completing a single job for two customers with the exact same pick-up location but different delivery locations. Accordingly, the fuel consumption and carbon emissions were computed based on the distance traversed in Table 11. The carbon footprint was measured using the distance-based method considering a 0.454 CO2 emission factor for light-duty trucks, as listed in the emission factors for the greenhouse gas inventory as of April 2022 [61,62]. The average percentage savings/decrease per service request computed for distance, fuel, and carbon using the new framework equated to 43.12%.

3.3. Projected Savings from Operating Expenses

The corresponding expenses using the old and new frameworks are summarized in Table 12. The expenses considered were the labor cost from the driver’s and helper’s wage rates and the fuel cost incurred from the total consumption throughout the trip. Two days’ worth of fees were computed for the labor cost in the old method since delivery per reference number cannot be carried out on the same day as the pick-up. Hence, the fuel consumption doubled due to the resulting two-way trip performed per service request. For the computation of labor, fuel, and maintenance costs in the new framework, the freight matrix in Table 5 was used as the reference. A total of 57.40% was reduced in the operating expenses using the new framework.

3.4. Projected Revenue and Profit from Completed Service Requests

Revenues that can be generated from service requests are based on the corresponding freight charges. As discussed in Section 2.7 and Section 2.8, charges apply dependent on the two-way distance in km of pick-up and delivery points per reference number (see Table 3 for the test scenario). It can be seen from Table 13 that four out of seven requests were completed, since the three requests with delivery points outside the metro were considered for next-day delivery from the pick-up date. Hence, freight charges are not included in the computation of business earnings yet. The corresponding charges are indicated following the freight rates for the old and new frameworks (Table 4 and Table 5). It can be seen that freight charges using the new framework are lower than the old ones at shorter distances and higher at longer distances. This means that services over shorter distances will be more attractive to customers. However, the convenience offered by using the app means the higher freight charges at longer distances are still on par. In addition, longer distances have become more serviceable since the rates for drivers and helpers are made proportional to the distance. The use of the new framework yielded a 27% increase in revenue and, taking the total expenses from Table 12 into account, resulted in a profit increase of 72%.

3.5. User Acceptance

A survey was conducted to assess the users’ satisfaction with the developed app. A questionnaire was disseminated for users to rate the app on a five-point scale based on various categories, as listed in Table 14, where 5 means very satisfied, 3 means neutral, and 1 means very dissatisfied. The mean score from all of the answers received was computed per item and is indicated in the mean score column of Table 14. It can be observed that the survey results were mostly positive, with all mean scores ranging between 4 and 5, regarding the application software. The application will greatly benefit the company, especially the logistics operations, and logistics staff can easily use the application software after being taught how to use it. The most notable part of the survey results was the response of the drivers, who gave a positive response, especially on the driver app, as they would no longer need to manually plan their routes and would avoid traffic as much as possible. The results indicate that the software application based on the proposed GIS-based framework can positively impact the user experience, maintenance of vehicles, and safety, as well as allow for seamless navigation, operation optimization, and seamless integration.

4. Conclusions and Recommendations

In this study, we designed, developed, implemented, and built upon a small-scale application software for a dispatcher management system following the proposed GIS-based framework. The application programming interface of Google Maps was integrated to perform waypoint order optimization with the aid of parameters from Directions, Distance Matrix, and polyline utility. Next, return trip node-based order gathering within a small-scale-area application was established. After that, application software for multiple roles/users such as an admin, dispatcher, driver, and customer was also developed. Lastly, the operations with the application software were compared to operations without the application software, and the results showed significant improvements and cost savings for clients based on different success metrics.
The test results using the new framework show it has promising value as it can reduce the travel time of the driver by optimizing the order of pick-up addresses while also considering the live traffic information in Google. The application also provides a significant improvement for the company as it can allow return trips without spending much time planning them (with the click of a button). The company can also benefit from the time savings that the app provides due to its efficient routing. The role of technology in easing the work burden of dispatchers is evident in this application. Without the quick and efficient planning of the application software, dispatchers would have to spend an enormous amount of time planning the drivers’ trips to optimize their paths, and they would do so without live traffic information [63]. The improved delivery efficiency and reduction in operational costs brought by the app can offer significant value to the company because of the shorter time that the vehicle will spend on the road and the potential profits for the company from using the application. The positive remarks of the respondents show the potential that this application can bring to a business, covering its essential operations, starting from the dispatcher and driver and extending up to the customer. The comments and suggestions of the respondents can be taken into consideration during the second phase of this study or by other researchers who opt to enhance our work in the future.
Implementing the system on other platforms such as iOS and web, in addition to the current mobile application, is suggested to serve a more extensive variety of users and devices. For seamless integration with the existing Enterprise Resource Planning (ERP) systems, it is recommended that the dispatch status should be repackaged into a callable function or API so that SMEs and even larger e-commerce businesses may consider the software as their 3PL software solution. The dispatch route function can also be converted into an API so that existing 3PL companies can consider integrating this with their systems, to aid their drivers in finding the optimal waypoint for their multiple deliveries throughout the day. Moreover, we recommend testing the system in various settings like different types of vehicles, including electric vehicles, for value-added sustainability, increasing the simultaneous trip requests, and considering test locations in less familiar areas or outside the metro, as well as longer distances between pick-up/delivery points. It is also suggested that the research field would benefit from revisiting the ways cargo spaces can be optimally utilized to reduce courier activities on the road. Finally, implementing a feedback feature in the program might also be beneficial since it will support a continuous cycle of development and refinement of the application by allowing the users to provide input and suggestions for system improvement.
Overall, we were able to achieve our objectives and contribute positively to making operations for small and medium-sized third-party logistics businesses more sustainable in the future.

Author Contributions

Conceptualization, methodology, data curation, investigation, software, visualization, writing—original and draft preparation: Jonathan Agoo, Renz Joshua Lanuza, Jonathan Lee, and Paul Anthony Rivera; funding acquisition, project administration, writing—review and editing: Neil Oliver Velasco, Marielet Guillermo, and Arvin Fernando. All authors have read and agreed to the published version of the manuscript.

Funding

This research was funded by De La Salle University and DOST through its Engineering Research and Development for Technology (ERDT) faculty research dissemination grant.

Data Availability Statement

Data can be requested from the corresponding author as needed.

Acknowledgments

The authors would like to thank the Gokongwei College of Engineering of De La Salle University for the administrative and technical support with the use of laboratory resources and spaces. The authors would also like to thank the editorial board and peer reviewers for the improvement of this article.

Conflicts of Interest

The authors declare no conflicts of interest.

References

  1. Hendricks, S.; Mwapwele, S.D. A systematic literature review on the factors influencing e-commerce adoption in developing countries. Data Inf. Manag. 2024, 8, 100045. [Google Scholar] [CrossRef]
  2. Salah, O.H.; Ayyash, M.M. E-commerce adoption by SMEs and its effect on marketing performance: An extended of TOE framework with ai integration, innovation culture, and customer tech-savviness. J. Open Innov. Technol. Mark. Complex. 2024, 10, 100183. [Google Scholar] [CrossRef]
  3. Zeng, S.; Fu, Q.; Haleem, F.; Han, Y.; Zhou, L. Logistics density, E-commerce and high-quality economic development: An empirical analysis based on provincial panel data in China. J. Clean. Prod. 2023, 426, 138871. [Google Scholar] [CrossRef]
  4. Aristio, A.P.; Mudjahidin, M.; Halim, J.P.; Junaedi, L.; Supardi, S.; Utomu, G.P. Supardi, Ismail, Gatut Prijo Utomu, Model Development of Factors Affecting Intention to Use in Third-Party Logistics. Procedia Comput. Sci. 2024, 234, 813–820. [Google Scholar] [CrossRef]
  5. Zarbakhshnia, N.; Karimi, A. Enhancing third-party logistics providers partnerships: An approach through the D.L.A.R.C.S supply chain paradigm. Resour. Conserv. Recycl. 2024, 202, 107406. [Google Scholar] [CrossRef]
  6. Dolan, S. Last mile delivery logistics explained: Problems & solutions. Insid. Intell. 2022, 15. [Google Scholar]
  7. Chen, E.; Zhou, Z.; Li, R.; Chang, Z.; Shi, J. The multi-fleet delivery problem combined with trucks, tricycles, and drones for last-mile logistics efficiency requirements under multiple budget constraints. Transp. Res. Part E: Logist. Transp. Rev. 2024, 187, 103573. [Google Scholar] [CrossRef]
  8. Onfleet, Inc. What Is a last mile delivery? Delivered Blog. Available online: https://onfleet.com/blog/what-is-last-mile-delivery/ (accessed on 1 August 2024).
  9. Mai, T. What Is Reverse Logistics? How It Works and Types, March 2022, Magenest. Available online: https://magenest.com/en/what-is-reverse-logistics/ (accessed on 1 August 2024).
  10. Yanpirat, N.; Silva, D.F.; Smith, A.E. Sustainable last mile parcel delivery and return service using drones. Eng. Appl. Artif. Intell. 2023, 124, 106631. [Google Scholar] [CrossRef]
  11. Truck Dispatcher Job Description, Betterteam. Available online: https://www.betterteam.com/truck-dispatcher-job-description (accessed on 1 August 2024).
  12. Kaushik, S. Common Challenges in Scheduling and Dispatch Management, LinkedIn. Available online: https://www.linkedin.com/pulse/common-challenges-scheduling-dispatch-management-suyash-Kaushik (accessed on 1 August 2024).
  13. Büyükdeveci, Ö.; Özpeynirci, S.; Özpeynirci, Ö. Multi-objective shipment consolidation and dispatching problem. Comput. Oper. Res. 2024, 169, 106728. [Google Scholar] [CrossRef]
  14. Crippa, M.; Guizzardi, D.; Solazzo, E.; Muntean, M.; Schaaf, E.; Monforti-Ferrario, F.; Banja, M.; Olivier, J.; Grassi, G.; Rossi, S. GHG Emissions of All World Countries. EUR 30831 EN; Publications Office of the European Union: Luxembourg, 2021; ISBN 978-92-76-41546-6. [Google Scholar]
  15. Pörtner, H.-O.; Roberts, D.C.; Tignor, M.M.B.; Poloczanska, E.S.; Mintenbeck, K.; Alegría, A.; Craig, M.; Langsdorf, S.; Löschke, S.; Möller, V. (Eds.) Climate Change 2022: Impacts, Adaptation and Vulnerability. In Contribution of Working Group II to the Sixth Assessment Report of the Intergovernmental Panel on Climate Change; Cambridge University Press: Cambridge, UK; New York, NY, USA, 2022. [Google Scholar]
  16. Siragusa, C.; Tumino, A.; Mangiaracina, R.; Perego, A. Electric Vehicles Performing Last-Mile Delivery in B2C e-Commerce: An Economic and Environmental Assessment. Int. J. Sustain. Transp. 2022, 16, 22–33. [Google Scholar] [CrossRef]
  17. Ghosh, P.; Jha, A.; Sharma, R.R.K. Managing carbon footprint for a sustainable supply chain: A systematic literature review. Mod. Supply Chain. Res. Appl. 2020, 2, 123–141. [Google Scholar] [CrossRef]
  18. Sherafati, M.; Bashiri, M.; Tavakkoli-Moghaddam, R.; Pishvaee, M.S. Achieving sustainable development of supply chain by incorporating various carbon regulatory mechanisms. Transp. Res. Part D Transp. Environ. 2020, 81, 102253. [Google Scholar] [CrossRef]
  19. Quak, H.; Nesterova, N.; Rooijen, T.; Dong, Y. Zero emission city logistics: Current practices in freight electromobility and feasibility in the near future. Transp. Res. Procedia 2016, 14, 1506–1515. [Google Scholar] [CrossRef]
  20. Kopfer, H.W.; Schönberger, J.; Kopfer, H. Reducing Greenhouse Gas Emissions of a Heterogeneous Vehicle Fleet. Flex Serv. Manuf. J. 2014, 26, 221–248. [Google Scholar] [CrossRef]
  21. Schöder, D.; Ding, F.; Campos, J.K. The Impact of E-Commerce Development on Urban Logistics Sustainability. Open J. Soc. Sci. 2016, 4, 1–6. [Google Scholar] [CrossRef]
  22. Wang, J.; Lim, M.K.; Zhan, Y.; Wang, X. An intelligent logistics service system for enhancing dispatching operations in an IoT environment. Transp. Res. Part E Logist. Transp. Rev. 2020, 135, 101886. [Google Scholar] [CrossRef]
  23. Ouyang, Z.; Leung EK, H.; Huang, G.Q. Community logistics for dynamic vehicle dispatching: The effects of community departure “time” and “space”. Transp. Res. Part E Logist. Transp. Rev. 2022, 165, 102842. [Google Scholar] [CrossRef]
  24. Yücel, E.; Salman, F.S.; Erdoğan, G. Optimizing two-dimensional vehicle loading and dispatching decisions in freight logistics. Eur. J. Oper. Res. 2022, 302, 954–969. [Google Scholar] [CrossRef]
  25. Gendreau, M.; Guertin, F.; Potvin, J.Y.; Séguin, R. Neighborhood search heuristics for a dynamic vehicle dispatching problem with pick-ups and deliveries. Transp. Res. Part C Emerg. Technol. 2006, 14, 157–174. [Google Scholar] [CrossRef]
  26. Sallem, R.; Serbaji, M.M.; Alamri, A.M.; Kallel, A.; Trabelsi, I. Optimal routing of household waste collection using ArcGIS application: A case study of El Bousten district, Sfax city, Tunisia. Arab. J. Geosci. 2021, 14, 1038. [Google Scholar] [CrossRef]
  27. Akram, M.; Habib, A.; Alcantud, J.C.R. An optimization study based on Dijkstra algorithm for a network with trapezoidal picture fuzzy numbers. Neural Comput. Appl. 2021, 33, 1329–1342. [Google Scholar] [CrossRef]
  28. Zhu, S.; Wang, C. An interaction-enhanced co-evolutionary algorithm for electric vehicle routing optimization. Appl. Soft Comput. 2024, 165, 112113. [Google Scholar] [CrossRef]
  29. Yang, J.; Lau, H.C.; Wang, H. Optimization of customer service and driver dispatch areas for on-demand food delivery. Transp. Res. Part C Emerg. Technol. 2024, 165, 104653. [Google Scholar] [CrossRef]
  30. Ding, M.; Guo, Y.; Huang, Z.; Lin, B.; Luo, H. GROM: A generalized routing optimization method with graph neural network and deep reinforcement learning. J. Netw. Comput. Appl. 2024, 229, 103927. [Google Scholar] [CrossRef]
  31. Fernando, A.H.; Guillermo, M.A.; Lim, L.A.G.; Bandala, A.A.; Vicerra, R.R.P.; Dadios, E.P.; Naguib, R.N. Load Pushing Capacity Analysis of Individual and Multi-Cooperative Mobile Robot through Symbiotic Application. Int. J. Mech. Eng. Robot. Res. 2024, 13. [Google Scholar] [CrossRef]
  32. Fernando, A.; GanLim, L. Velocity analysis of a six wheel modular mobile robot using MATLAB-Simulink. IOP Conf. Ser. Mater. Sci. Eng. 2021, 1109, 012037. [Google Scholar] [CrossRef]
  33. Kumar, P.; Hariharan, K.; Manikandan, M.S.K. Hybrid long short-term memory deep learning model and Dijkstra’s Algorithm for fastest travel route recommendation considering eco-routing factors. Transp. Lett. 2023, 15, 926–940. [Google Scholar]
  34. Liu, Y.; Gao, X.; Wang, B.; Fan, J.; Li, Q.; Dai, W. A passage time–cost optimal A* algorithm for cross-country path planning. Int. J. Appl. Earth Obs. Geoinf. 2024, 130, 103907. [Google Scholar] [CrossRef]
  35. De Oliveira Mota, D. Dynamic dispatch algorithm proposal for last-mile delivery vehicle. IEEE Lat. Am. Trans. 2021, 19, 1618–1623. [Google Scholar] [CrossRef]
  36. Nakechbandi, M.; Colin, J.Y. Studying the rerouting of empty carriers during their return trips to manage rare mobile resources in a physical internet. In Proceedings of the 2020 5th International Conference on Logistics Operations Management (GOL), Rabat, Morocco, 28–30 October 2020; pp. 1–6. [Google Scholar]
  37. Azari, M.; Jawab, F.; Arif, J.; Khaoua, Y.; El Jaouhari, A.; Moustabchir, H. From City Logistics to a Merger of Smart Cities and Smart Logistics. In Proceedings of the 2022 14th International Colloquium of Logistics and Supply Chain Management (LOGISTIQUA), El Jadida, Morocco, 25–27 May 2022; pp. 1–5. [Google Scholar]
  38. McDougall, J.A.; Otero, L.D. Optimal transfer point locations in two-stage distribution systems. IEEE Access 2017, 6, 1974–1984. [Google Scholar] [CrossRef]
  39. Abhilashani, G.K.; Ranathunga, M.I.D.; Wijayanayake, A.N. Minimising Last Mile Delivery Cost and Vehicle Usage Through an Optimised Delivery Network Considering Customer-Preferred Time Windows. In Proceedings of the 2023 International Research Conference on Smart Computing and Systems Engineering (SCSE), Kelaniya, Sri Lanka, 29 June 2023; Volume 6, pp. 1–7. [Google Scholar]
  40. Shee, H.; Miah, S.; Taboada, I.; De Vass, T. Smart City–Smart Logistics Amalgamation. In Proceedings of the 2020 IEEE European Technology and Engineering Management Summit (E-TEMS), Dortmund, Germany, 5–7 March 2020; pp. 1–4. [Google Scholar]
  41. Yongmei, R.; Linghong, H.; Yongqing, M. Logistics distribution route optimization method for peach products transport. In Proceedings of the 2015 Seventh International Conference on Measuring Technology and Mechatronics Automation, Nanchang, China, 13–14 June 2015; pp. 609–612. [Google Scholar]
  42. Wanganoo, L.; Patil, A. Preparing for the smart cities: IoT enabled last-mile delivery. In Proceedings of the 2020 Advances in Science and Engineering Technology International Conferences (ASET), Dubai, United Arab Emirates, 4 February–9 April 2020; pp. 1–6. [Google Scholar]
  43. Samouh, F.; Gluza, V.; Djavadian, S.; Meshkani, S.; Farooq, B. Multimodal autonomous last-mile delivery system design and application. In Proceedings of the 2020 IEEE International Smart Cities Conference (ISC2), Piscataway, NJ, USA, 28 September–1 October 2020; pp. 1–7. [Google Scholar]
  44. Jeon, A.; Kang, J.; Choi, B.; Kim, N.; Eun, J.; Cheong, T. Unmanned aerial vehicle last mile delivery considering backhauls. IEEE Access 2021, 9, 85017–85033. [Google Scholar] [CrossRef]
  45. Huang, Z.; Huang, Z.; Li, J.; Huang, D.; Fan, J.; Ng, W.W. No-Load Backhaul Ratio Reduction by Interactive Routing for Small Goods Delivery with Time Window Constraints. In Proceedings of the 2017 IEEE International Conference on Internet of Things (iThings) and IEEE Green Computing and Communications (GreenCom) and IEEE Cyber, Physical and Social Computing (CPSCom) and IEEE Smart Data (SmartData), Exeter, UK, 21–23 June 2017; pp. 299–305. [Google Scholar]
  46. Ma, H.; Kuang, H.; Huang, M. A last-mile delivery problem with alternative delivery options based on prospect theory. In Proceedings of the 2021 33rd Chinese Control and Decision Conference (CCDC), Kunming, China, 22–24 May 2021; pp. 4202–4207. [Google Scholar]
  47. Liu, W. Route optimization for last-mile distribution of rural E-commerce logistics based on ant colony optimization. IEEE Access 2020, 8, 12179–12187. [Google Scholar] [CrossRef]
  48. Damayanti, T.R.; Kusumaningrum, A.L.; Susanty, Y.D.; Islam, S.S. Route optimization using saving matrix method—A case study at public logistics company in indonesia. In Proceedings of the International Conference on Industrial Engineering and Operations Management, Detroit, MI, USA, 10–14 August 2020; pp. 1583–1591. [Google Scholar]
  49. Zhou, H.; Wang, Q.; Wang, L.; Zhao, X.; Feng, G. Digitalization and third-party logistics performance: Exploring the roles of customer collaboration and government support. Int. J. Phys. Distrib. Logist. Manag. 2023, 53, 467–488. [Google Scholar] [CrossRef]
  50. Dimitrov, I.; Dimitrova, A. Impact of using third-party logistics provider on organizational performance in the Bulgarian context. In Proceedings of the 2021 IV International Conference on High Technology for Sustainable Development (HiTech), Sofia, Bulgaria, 7–8 October 2021; pp. 1–4. [Google Scholar]
  51. Mangiaracina, R.; Perego, A.; Seghezzi, A.; Tumino, A. Innovative solutions to increase last-mile delivery efficiency in B2C e-commerce: A literature review. Int. J. Phys. Distrib. Logist. Manag. 2019, 49, 901–920. [Google Scholar] [CrossRef]
  52. Marques, A.; Soares, R.; Santos, M.J.; Amorim, P. Integrated planning of inbound and outbound logistics with a Rich Vehicle Routing Problem with backhauls. Omega 2020, 92, 102172. [Google Scholar] [CrossRef]
  53. Afrapoli, A.M.; Tabesh, M.; Askari-Nasab, H. A multiple objective transportation problem approach to dynamic truck dispatching in surface mines. Eur. J. Oper. Res. 2019, 276, 331–342. [Google Scholar] [CrossRef]
  54. Shah, S.R.; See, H.H.; Samadi, S. Applicability of Digital Tracking System on Third Party Logistics (TPL) Services. In Proceedings of the 2021 IEEE International Conference on Technology Management, Operations and Decisions (ICTMOD), Marrakech, Morocco, 24–26 November 2021; pp. 1–6. [Google Scholar]
  55. Othman, M.F.I.; Masrom, N.R.; Isnin, I.F.; Rasi, R.Z.; Abd Rahim, Y.; Arshad, Y. Blockchain Adoption Intention by a Third-Party Logistics Company: A Malaysian Case Study. In Proceedings of the 2021 7th International Conference on Research and Innovation in Information Systems (ICRIIS), Johor Bahru, Malaysia, 25–26 October 2021; pp. 1–6. [Google Scholar]
  56. Francisco, K.G.; Vicerra, R.R.P.; Concepcion, R.S.; Bandala, A.A.; Fernando, A.H.; Guillermo, M.A. Soil Type Factor Estimation Based on ERT Apparent Resistivity Using Supervised Machine Learning Models. In Proceedings of the 2023 IEEE 15th International Conference on Humanoid, Nanotechnology, Information Technology, Communication and Control, Environment, and Management (HNICEM), Coron, Philippines, 19–23 November 2023; pp. 1–6. [Google Scholar] [CrossRef]
  57. Pascua, A.R.A.; Rivera, M.; Guillermo, M.; Bandala, A.; Sybingco, E. Face Recognition and Identification Using Successive Subspace Learning for Human Resource Utilization Assessment. In Proceedings of the 2022 13th International Conference on Information and Communication Technology Convergence (ICTC), Jeju Island, Republic of Korea, 19–21 October 2022. [Google Scholar]
  58. Fernando, A.H.; Lim, L.A.G.; Bandala, A.A.; Vicerra, R.R.P.; Dadios, E.P.; Guillermo, M.A.; Naguib, R.N. Simulated vs. Actual Application of Symbiotic Model on Six Wheel Modular Multi-Agent System for Linear Traversal Mission. J. Adv. Comput. Intell. Intell. Inform. 2024, 28, 12–20. [Google Scholar] [CrossRef]
  59. Ping, L. Strategy of green logistics and sustainable development. In Proceedings of the 2009 International Conference on Information Management, Innovation Management and Industrial Engineering, Xi’an, China, 26–27 December 2009; Volume 1, pp. 339–342. [Google Scholar]
  60. Lalamove, Delivery Pricing & Rates. Available online: https://www.lalamove.com/en-ph/all-delivery-pricing-detail (accessed on 1 August 2024).
  61. Available online: https://www.epa.gov/system/files/documents/2022-04/ghg_emission_factors_hub.pdf (accessed on 1 August 2024).
  62. Available online: https://ghgprotocol.org/sites/default/files/2023-03/Scope3_Calculation_Guidance_0%5B1%5D.pdf (accessed on 1 August 2024).
  63. Guillermo, M.; Francisco, K.; Concepcion, R.; Fernando, A.; Bandala, A.; Vicerra, R.R.; Dadios, E. A Comparative Study on Satellite Image Analysis for Road Traffic Detection using YOLOv3-SPP Keras RetinaNet and Full Convolutional Network. In Proceedings of the 2023 8th International Conference on Business and Industrial Research (ICBIR), Bangkok, Thailand, 18–19 May 2023; pp. 578–584. [Google Scholar]
Figure 1. Current dispatch management framework of 5RJS Lanuza Logistics Corp.
Ijgi 14 00001 g001
Figure 2. Proposed GIS framework for the partner Logistics Corp.
Ijgi 14 00001 g002
Figure 3. Use case diagram of the proposed GIS framework.
Ijgi 14 00001 g003
Figure 4. Dataflow diagram of the application software.
Ijgi 14 00001 g004
Figure 5. Home page of the mobile application developed for the (a) user and (b) driver.
Ijgi 14 00001 g005
Figure 6. Search destination page.
Ijgi 14 00001 g006
Figure 7. Manage trip page of the admin web panel.
Ijgi 14 00001 g007
Figure 8. Trip request page on driver app.
Ijgi 14 00001 g008
Figure 9. Trip request status on user app.
Ijgi 14 00001 g009
Figure 10. Multiple accepted trips page on driver app.
Ijgi 14 00001 g010
Table 1. Review of related studies—summary.
TitleDiscussionLacking Approaches
Dynamic Dispatch Algorithm Proposal for Last-Mile Delivery Vehicle [35]
  • Introduces an algorithmic solution to vehicle allocation, mathematical modeling, smart cities, and big data.
  • Resonates with creating a robust and efficient last-mile delivery system and promotes the importance of technology-driven solutions that tackle societal, environmental sustainability, and economic issues.
  • The study lacks an actual implementation and relied on datasets with limited constraints in constructing the model. In addition, some factors for optimizing last-mile delivery were not considered such as traffic congestion and fuel usage.
Studying the Rerouting of Empty Carriers during their Return Trips to Manage Rare Mobile Resources in a Physical Internet [36]
  • Primarily focuses on addressing the challenge of efficiently moving carriers to where they can also be of use in a logistics network and utilizing the return trips of carriers, which are often underutilized and may travel empty or partially empty.
  • Mirrors the innovative approach of leveraging return trips of carriers to optimize resource distribution within the logistics network. It reflects the researchers’ aim of efficient resource allocation in last-mile delivery.
  • The study needs follow-up research to design an actual experiment to prove the feasibility and effectiveness of the proposed solutions to optimize logistics resource distribution.
From City Logistics to a Merger of Smart Cities and Smart Logistics from City Logistics to a Merger of Smart Cities and Smart Logistics [37]
  • This study highlights the emergence of sustainable logistics management and the exploration of the components essential in creating a balance between economic growth and preservation of environmental and security aspects of logistics.
  • Addresses consumer needs such as on-demand deliveries and their desire for speed and flexibility in an omnichannel environment. In addition, it takes note of the growing consumer perceptions of sustainability and global warming.
  • Only studies the components required to create a sustainable logistics management system and has no implementation of the solutions proposed.
Optimal Transfer Point Locations in Two-Stage Distribution Systems [38]
  • The research paper explores how to further utilize unmanned aerial systems in last-mile retail distribution networks.
  • Strengthens the approach of optimizing resource allocation within last-mile delivery operations, offering valuable insights for software development and emphasizing the economic and efficiency benefits of delivery optimization.
  • The study does not apply to ground vehicles, which are in need of solutions. Hence, it cannot be adopted in existing logistics operations.
Minimizing Last-Mile Delivery Cost and Vehicle Usage Through an Optimized Delivery Network Considering Customer-Preferred Time Windows [39]
  • Introduced a cluster-based approach to optimize last-mile delivery while simultaneously considering time windows and other practical requirements such as package compatibility.
  • The study needs a follow-up with an actual implementation, as it used limited datasets in simulating the model. Important factors in optimizing the last-mile delivery such as traffic density and fuel consumption were not considered.
Smart City—Smart Logistics Amalgamation [40]
  • Stated that smart logistics has a positive influence on the performance of intelligent cities when integrated.
  • The proposed solution is within the scope of smart logistics since it is a software application that benefits the stakeholders in the logistics industry and may also influence smart cities positively.
  • The study focused on Melbourne and considered only business retailers, suppliers, and service providers as the stakeholders.
Logistics Distribution Route Optimization Method for Peach Products Transport [41]
  • Utilizes the ant colony algorithm to optimize the route for peach product delivery.
  • Route optimization is one of the ways to reduce operating costs, which is in line with the application.
  • The study needs a follow-up with an actual implementation since it relies only on datasets with limited constraints to simulate the model. The algorithm cannot be tested in real-time.
Preparing for the smart cities: IoT enabled last mile delivery [42]
  • This study suggests a conceptual framework that combines Global Positioning System (GPS), Internet of Things (IoT), and Transportation Management System (TMS) technologies to address the lack of descriptive delivery addresses in many locations and the reliance on antiquated, semi-digital methods for tracking and customer interactions by offering real-time visibility, dependability, and intelligent last-mile solutions.
  • The report recognizes the limitations of the data that were gathered for the investigation.
Multimodal Autonomous Last-Mile Delivery System Design and Application [43]
  • This study investigates creative last-mile food delivery methods employing autonomous cars (robot-based, drone-based, and hybrid delivery). Eighteen scenarios with various fleet sizes and demands were examined in an agent-based simulation using Mississauga as a case study.
  • Includes last-mile delivery optimization and a comparison between delivery models.
  • The study refers to stringent laws governing the use of drones for commercial purposes, which pose a significant restriction. It is crucial to continue investigating legal frameworks and potential modifications or adaptations to allow for autonomous food distribution systems.
Unmanned Aerial Vehicle Last-Mile Delivery Considering Backhauls [44]
  • This study proposes the FSTSP-B (Backhaul Deliveries in the Flying Sidekick Salesman Traveling Problem) concept, which considers both delivery and pick-up requirements for unmanned aerial vehicles (UAVs) in logistics.
  • Presents a new concept that incorporates backhaul deliveries.
  • The adjacent distance-based assignment (ADA) heuristic can manage instances with up to 100 customer nodes. However, it is essential to further improve the algorithm’s effectiveness and scalability to cope with greater datasets for larger-scale logistical operations.
No-Load Backhaul Ratio Reduction by Interactive Routing for Small Goods Delivery with Window Time Constraints [45]
  • This study introduces a novel interactive routing model that uses a movable storage house to dynamically match delivery trucks, lowering backhauling costs and increasing efficiency under time window restrictions.
  • The paper does not mention the interactive routing model’s scalability. It is crucial to ascertain how effectively the suggested strategy can manage more extensive and more complicated logistics networks as delivery volumes increase.
A last-mile delivery problem with alternative delivery options based on prospect theory [46]
  • The goal is to reduce overall costs, including transportation expenses and fines for customer complaints, and to increase the competitiveness of logistics companies. To solve the model effectively, the paper offers an improved adaptive extensive neighborhood search method (I-ALNS). Results demonstrate that I-ALNS boosts solutions well.
  • The study did not evaluate the suggested method’s scalability to address the challenges of more extensive logistics networks with high orders.
Route optimization for last-mile distribution of rural E-commerce logistics based on ant colony optimization [47]
  • This paper talks about finding a feasible route for last-mile distribution using ant colony optimization. Based on the results, the ant colony optimization reported increased profits for the logistics enterprise.
  • This study lacks an actual implementation of the proposed solution.
Route optimization using Saving Matrix Method—A Case study at Public Logistics Company in India [48]
  • The Saving Matrix Method allowed the company to save on the overall distance and monthly travel expenses.
  • The algorithm used in this study significantly benefited the companies in India.
  • The study does not include traffic jams and assumes that they do not affect the speed of the truck.
Digitalization and third-party logistics performance: exploring the roles of customer collaboration and government support [49]
  • Digitizing third-party logistics positively affected the financial and service performance in China.
  • Future research needs to specify and discuss thoroughly the type of digitization the company performed.
Impact of Using Third Party Logistics Provider on Organizational Performance in Bulgarian the Context [50]
  • The study proves through thorough statistical analysis that small and medium-sized manufacturing businesses perform better when outsourcing their supply chain integration, inventory management, transportation, and warehousing.
  • The research mainly focuses on small and medium-sized manufacturing companies in Bulgaria. The study’s conclusions are less broadly applicable to other sectors, firm sizes, or geographical regions.
Innovative solutions to increase last-mile delivery efficiency in B2C e commerce: a literature review [51]
  • Provides multiple solutions in different categories involved in last-mile delivery.
  • The study focuses on providing variables for computing the overall transportation costs.
  • The study should be extended with more suggestions with regard to algorithms for faster and more efficient routing for last-mile delivery.
Integrated planning of inbound and outbound logistics with a Rich Vehicle Routing Problem with backhauls [52]
  • Tested multiple strategies to solve vehicle problems with backhauling. The best solution provided a 2.7% decrease in costs.
  • The study used integrated inbound and outbound logistics planning for a company with backhauling.
  • The study lacks software and an actual implementation of the solution.
A multiple objective transportation problem approach to dynamic truck dispatching in surface mines [53]
  • Uses a dispatch management system for dump trucks that utilizes databases, a fleet system, and operational data management.
  • The study lacks an actual implementation of the fleet management system.
  • The study’s system might have a different effect in real-world scenarios.
Applicability of Digital Tracking System on Third Party Logistics (TPL) Services [54]
  • In this study, the usage of software applications for tracking delivery operations was evaluated. It was found that digitization of the process can help reduce waste such as time and other resources.
  • The study focuses on tracking the fleet and does not include actual management of trip requests.
Blockchain Adoption Intention by a Third-Party Logistics Company: A Malaysian Case Study [55]
  • The research is another digitization approach towards 3PL with blockchain as its reference. It offers new ways to track deliveries, such as with Facebook and WhatsApp to receive updates.
  • The study focuses on security and does not solve the efficiency problem in logistics operations.
Table 2. Roles and capabilities in the proposed application software.
RolesUser Access
Admin/Dispatcher
  • Accept or decline customer’s delivery requests.
  • Assign the accepted/accommodated delivery request to the drivers.
  • View customer’s pending delivery requests, available drivers, and progress of deliveries.
  • View, update, block/unblock, and delete user accounts in the application software.
Driver
  • Create an account.
  • Accept or decline trips assigned to them.
  • View pending tasks.
  • View routes and trip history.
  • Update availability status and progress of delivery.
Customer
  • Create an account.
  • Submit delivery requests.
  • View the progress of the delivery requests.
Table 3. Test scenario for the combined last-mile and return trip requests.
Reference No.LeadtimePick-upDelivery Area
11224-1B0 to 1 dayBr. Andrew Gonzales Hallwithin the Metro
11224-2B0 to 1 dayUniversity Pad Residences Taftwithin the Metro
11224-3B0 to 1 dayVista GL Taft by Vista Residenceswithin the Metro
11324-1B1 to 2 daysBr. Andrew Gonzales Halloutside the Metro
11324-2B1 to 2 daysUniversity Pad Residences Taftoutside the Metro
11324-3B1 to 2 daysVista GL Taft by Vista Residencesoutside the Metro
11324-4B1 to 2 daysRobinsons Place Manila*Return Request
Table 4. Freight rate matrix without toll fees for 4-wheeled vehicles provided by the partner logistics company.
Distance in km (2-Way)Fuel Expenses (PHP)Fuel Expenses (w/Reclaimed Tax) (PHP)Labor Cost (PHP)Total Expenses (PHP)Freight Rate (PHP)Freight Rate (Inc. of VAT) (PHP)Final Freight Rate (PHP)% Profit per Transaction
540.6336.16955.00991.161338.061498.631500.0033%
1081.2572.31955.001027.311386.871553.301600.0037%
15121.88108.47955.001063.471435.681607.961700.0041%
20162.50144.63955.001099.631484.491662.631700.0036%
25203.13180.78955.001135.781533.301717.301800.0039%
30243.75216.94955.001171.941582.121771.971800.0035%
35284.38253.09955.001208.091630.931826.641900.0038%
40325.00289.25955.001244.251679.741881.311900.0034%
45365.63325.41955.001280.411728.551935.972000.0037%
50406.25361.56955.001316.561777.361990.642000.0034%
Table 5. Freight rate matrix without toll fees for 4-wheeled vehicles proposed by the researchers.
Distance TravelledFuel Expenses (PHP)Fuel Expenses (w/Reclaimed Tax) (PHP)Driver’s Fee (PHP)Helper’s Fee (PHP)Maintenance Fee (PHP)Total Expenses (PHP)Base Freight (PHP)Per km Rate of PHP 55.00Total Freight Rate (PHP)Total Freight Rate (Inc. of VAT) (PHP)Final Freight Rate (PHP)% Profit per Transaction
540.6336.16160.00105.0030.00331.16200.00275.00475.00532.00600.0059%
1081.2572.31190.00120.0045.00427.31200.00550.00750.00840.00900.0085%
15121.88108.47220.00135.0060.00523.47200.00825.001025.001148.001200.00102%
20162.50144.63250.00150.0075.00619.63200.001100.001300.001456.001500.00113%
25203.13180.78280.00165.0090.00715.78200.001375.001575.001764.001800.00121%
30243.75216.94310.00180.00105.00811.94200.001650.001850.002072.002100.00128%
35284.38253.09340.00195.00120.00908.09200.001925.002125.002380.002400.00133%
40325.00289.25370.00210.00135.001004.25200.002200.002400.002688.002700.00137%
45365.63325.41400.00225.00150.001100.41200.002475.002675.002996.003000.00140%
50406.25361.56440.00245.00170.001216.56200.002750.002950.003304.003400.00146%
Table 6. Summary of elapsed time for testing without the application software.
Job Request No.Service LocationService (P/D)Elapsed Time (mins)Reference No.
Pick-Up LocationMega Pacific Freight Logistics, Inc.-0
0Br. Andrew Gonzales HallP4011324-1B
1University Pad Residences TaftP17.3511324-2B
2Vista GL Taft by Vista ResidencesP42.8311324-3B
3Robinsons Place ManilaP1811324-4B
4Adamson University Main BuildingD14.3511224-1B
5SM Mall of AsiaD47.9711224-3B
6SM City BicutanD61.8211224-2B
Drop-off LocationMega Pacific Freight Logistics, Inc.-49.75-
Job Total Time: 292.07
Table 7. Summary of elapsed time for testing with the application software.
Job Request No.Pick-up/Delivery Location No.Service (P/D)Elapsed Time (mins)Reference No.
Pick-Up LocationMega Pacific Freight Logistics, Inc.-0
0Br. Andrew Gonzales HallP3511324/11224-1B
1University Pad Residences TaftP8.2311324/11224-2B
2Vista GL Taft by Vista ResidencesP16.7811324/11224-3B
3Robinsons Place ManilaP8.611324-4B
4Adamson University Main BuildingD13.9311224-1B
5SM Mall of AsiaD31.6311224-3B
6SM City BicutanD52.8511224-2B
Drop-off LocationMega Pacific Freight Logistics, Inc.-19.75-
Job Total Time: 186.77
Table 8. Job request completed by framework.
Turnaround Time
Elapsed TimeJob Request
Old Framework292.077
New Framework186.7710
% Difference:36.05%42.86%
Table 9. Turnaround time per completed service request.
Turnaround Time
Reference No.Old FrameworkNew Framework% Time Savings
11224-1B852.5347.5494.42%
11224-2B962.32123.7987.14%
11224-3B900.554.1693.99%
Average % Time Savings per Request: 91.85%
Table 10. Summary of distance traveled from previous location using old and new frameworks.
Old FrameworkNew Framework
Job Request No.Service LocationService (P/D)Reference No.Distance Traveled from Previous Location (km)Reference No.Distance Traveled from Previous Location (km)
Pick-Up LocationMega Pacific Freight Logistics, Inc.- 0 0
0Br. Andrew Gonzales HallP11324-1B15.511324/11224-1B15.5
1University Pad Residences TaftP11324-2B0.711324/11224-2B0.7
2Vista GL Taft by Vista ResidencesP11324-3B2.511324/11224-3B2.6
3Robinsons Place ManilaP11324-4B0.411324-4B1.5
4Adamson University Main BuildingD11224-1B2.111224-1B1.6
5SM Mall of AsiaD11224-3B7.911224-3B6.9
6SM City BicutanD11224-2B11.811224-2B11.9
Drop-off LocationMega Pacific Freight Logistics, Inc.--4.1 3
Table 11. Summary of distances traversed, fuel expenses, and carbon emissions for completed service requests using old and new frameworks.
Distance Traversed (km)Fuel Expenses (PHP)CO2 Emissions
(kg/veh-km)
Reference No.OldNewOldNewOldNew% Savings
11224-1B17.601.60143.0013.004.965020.4513790.91%
11224-2B12.5011.90101.5696.693.526293.357034.80%
11224-3B10.406.9084.5056.062.933871.9465133.65%
Average % Savings per Request: 43.12%
Table 12. Summary of operating expenses using old and new frameworks.
OldNew
ParticularsAmount (PHP)Amount (PHP)Remarks
Labor Cost1910.00625.00see Table 5 for labor rates using new framework
Driver’s Wage1100.00400.00PHP 550 per day for 2 days
Helper’s Wage810.00225.00PHP 405 per day for 2 days
Fuel Cost650.81316.01
Day 1 Job Requests325.41-Pick-up of RF# 11224-1B to 3B
Day 2 Job Requests325.41-Delivery of Day 1 RF# and Pick-up of RF#11324-1B TO 4b
Maintenance Cost-150.00
Total Expenses:2560.811091.0157.40% savings
Table 13. Summary of revenue and profit using old and new frameworks.
Reference No.StatusDistance in km (2-Way)Old Freight Charge (PHP)New Freight Charge (PHP)
11224-1BComplete11.416001000
11224-2BComplete49.420003300
11224-3BComplete20.817001600
11324-1BFor Next-Day Delivery-
11324-2BFor Next-Day Delivery-
11324-3BFor Next-Day Delivery-
11324-4BComplete51.821003500% Increase
Total Revenue: 7400940027.03%
Total Expenses: 2560.811091.01
Total Profit: 4839.198308.9971.70%
Table 14. Summary of results gathered from user-acceptance survey.
CategorySurvey ItemMean Score
User ExperienceThe application software is user-friendly.4.1
The interface of the application software is intuitive and easy to navigate.4.0
Features on the application software will significantly improve workflow efficiency.4.4
Maintenance of VehiclesThe application software will help lessen the strain on vehicles.4.6
The application software will contribute to extending the lifespan of the vehicles in the fleet.4.7
SafetyThe application software will positively influence the safety of the driver and helper during operations.4.4
The route optimization will reduce fatigue and enhance the safety of the work environment since it will lessen the worry of manually planning the route ahead.4.8
Seamless NavigationI am satisfied with the accuracy and reliability of the navigation system within the application software.4.4
The navigation feature will help avoid delays and optimize delivery routes effectively.4.5
Optimization in OperationsThe application software has significantly reduced the manual effort required by dispatchers and drivers in logistics operations.4.8
Automated processes like order processing and inventory management will improve overall efficiency.4.9
Seamless IntegrationThe application software seamlessly integrates with existing systems (return trips and consolidated shipping) in operations.4.1
Disclaimer/Publisher’s Note: The statements, opinions and data contained in all publications are solely those of the individual author(s) and contributor(s) and not of MDPI and/or the editor(s). MDPI and/or the editor(s) disclaim responsibility for any injury to people or property resulting from any ideas, methods, instructions or products referred to in the content.

