2. Literature Review
In the field of urban resilience, especially concerning flood risks, the use of Geospatial AI (GeoAI) and predictive mapping techniques has significantly advanced our understanding and mitigation of natural disaster impacts on critical infrastructures, such as road networks.
A detailed analysis using Scopus’s advanced search parameters shows a growing scholarly interest in the topic of roads and floods, with a noticeable increase in publications from 2019 to 2023. This trend indicates a rising awareness of the serious effects that floods can have on road networks, possibly reflecting the global rise in flooding events and the corresponding need for more research in this area (see
Figure 1).
The distribution of research by subject area shows a major focus on environmental science (31%), engineering (23%), earth and planetary sciences (22%), and social sciences (21%). This interdisciplinary approach highlights the complexity of flood management in urban areas, covering the environmental effects of flooding, the technical challenges in road engineering, and the socio-economic impacts on communities. The emphasis on environmental and engineering disciplines reflects the technical and ecological challenges of urban flood management, while the significant representation of social sciences underscores the importance of human, policy, and governance aspects in addressing flood risks.
This systematic literature review, based on carefully selected articles, provides a thorough foundation for understanding the complex aspects of road infrastructure resilience against flooding. It emphasizes the importance of connecting environmental dynamics with engineered systems and the socio-economic structure of urban areas. The insights from this review are expected to contribute to the development of integrated strategies for improving urban flood resilience and guiding effective policymaking [
13].
This literature review examines various studies that shed light on the complex relationship between urban development, flood risk management, and transportation infrastructure. It covers different thematic areas, each addressing distinct aspects of this relationship.
The Socio-Economic Factors section highlights the intricate connections between human activities, socio-economic factors, and flood risks affecting road networks. Key findings reveal that environmental degradation, urbanization, and socio-economic development are significant drivers of floods [
14,
15,
16]. These studies stress the need for adaptive strategies in urban flood resilience and traffic management, particularly in response to climate change.
Miller, Ravens, and Dawod contribute further by focusing on flood risk mitigation in different regions, such as Hooper Bay, Alaska, and Makkah, Saudi Arabia [
14,
17]. These studies focus on assessing flood risks and evaluating mitigation strategies in vulnerable areas. One study introduces the concept of a “unit cost of flood exposure” to estimate flooding costs and compares different mitigation methods, finding that certain strategies may be more cost-effective. Another study models future flood hazards in a rapidly urbanizing area, highlighting the increased risks due to urbanization and the need for these findings to guide future urban planning. Both emphasize the importance of accurate flood risk assessment and effective mitigation planning.
Additional studies [
18,
19,
20] underscore the importance of prioritizing climate change adaptation for road networks and enhancing the resilience of urban roads against floods. The research calls for inclusive policies and Low Impact Development (LID) measures to improve flood resilience, highlighting the need for comprehensive flood risk management that considers both natural and human-induced factors.
The Case Studies and Regional Analyses section explores the vulnerability of urban road networks to floods in various regions, emphasizing the impact of flooding on transportation infrastructure and the importance of resilient urban planning.
Singh examines India’s urban road networks, revealing that over 40% become impassable during extreme rainfall [
21]. This study uses meteorological, land use, and hydrodynamic data to assess flood vulnerability, stressing the need for flood-resilient infrastructure. Similarly, Morelli and Cunha investigate São Carlos, Brazil, proposing a metric to evaluate flood impacts on transportation. Their findings support compact city planning and the resilience of non-motorized transport modes, contrasting with the vulnerabilities of car-centric policies [
10].
Liu provides a comprehensive flood susceptibility assessment in the Belt and Road region using logistic regression and support vector machines, highlighting Southeast Asia’s vulnerability and offering a spatial analysis for targeted flood mitigation [
22]. Marais and Gunthorp document the damage from the 1987 Natal floods, offering insights into infrastructure resilience. These case studies emphasize the importance of context-specific analysis and innovative methodologies in addressing flood impacts on urban road networks under various climatic conditions [
23].
The Climate Change and Resilience section includes studies that analyze the interaction between urban road networks, vehicular mobility, and flood events in a changing climate.
One study examines the impact of urban floods on vehicular mobility using the Multiple Centrality Assessment (MCA) approach [
24]. Conducted in rapidly urbanizing areas, this study finds a link between network centrality and road network availability during floods, suggesting the need for distributed major roads to maintain mobility. Vincendon focuses on flash floods in Southern France, using the ISBA-TOP hydrological model for road flooding monitoring [
25]. This work highlights the importance of accurate rainfall-runoff simulations for managing road submersion risks, stressing the need for tailored model inputs and calibration for effective flood risk assessment.
Popescu examines road accessibility in flood-prone areas of Romania, emphasizing how proximity to emergency centers affects intervention capacity [
26]. Benedetto and Chiavari introduce a new method for assessing road vulnerability during floods, using Multi-Criteria Decision Analysis (MCDA) to evaluate the structural and functional aspects of roads [
27]. Another study proposes the Road Network Resilience Index (RNRI) to measure urban road resilience during floods, identifying areas with different levels of resilience [
28]. Wisetjindawat uses stochastic modeling to evaluate road system performance under multiple hazards, pinpointing vulnerable areas in Japan’s Tokai region prone to both flash floods and earthquakes [
29]. These studies highlight the need for innovative methods and thorough planning to improve road network resilience in the face of climate change and multi-hazard events.
Research on Emergency Response and Evacuation highlights the critical role of road networks during floods, focusing on identifying and protecting essential road segments for effective emergency response and community resilience.
Helderop and Grubesic present a novel Geo spatial method to identify critical road segments after disasters, enhancing mobility and emergency response. Their approach, which includes non-road landscape features, provides better metrics for road criticality, with significant implications for urban planning and disaster preparedness [
30]. Chen assesses the importance of flooded road links under various scenarios, combining flood modeling with commute simulation. The study reveals uneven traffic flow distribution and emphasizes the importance of road proximity to water bodies and topography in prioritizing intervention sites [
31].
Panakkal addresses real-time flood impacts on roads by proposing an open-source framework that integrates rainfall data, flood modeling, and network analysis [
32]. This framework improves the assessment of roadway conditions by vehicle type and identifies areas lacking access to critical facilities during floods. Gangwal explores community access to essential services during floods, using travel speed reduction to account for partial road failures. The study’s modified betweenness centrality metric highlights the importance of certain roads in connecting communities to critical services, revealing disparities in access among vulnerable groups [
33].
Loreti proposes a new method for assessing transportation network resilience during floods, focusing on local towns’ accessibility [
34]. This approach, which deviates from traditional percolation frameworks, identifies key cities providing essential services during floods, necessary for risk management. Similarly, Zhou studies urban road network connectivity in southern China, using hydrodynamic modeling to evaluate flood impacts [
35]. The findings show a significant loss of road connectivity during heavy rainfall, stressing the need for adaptive flood control strategies. Miller presents a model-based framework to assess the changing accessibility of road networks during floods, showing substantial improvements in accessibility through targeted mitigation [
36].
These studies collectively emphasize the urgent need for innovative strategies to assess and enhance road network resilience and accessibility during floods. They highlight the importance of integrating hydrodynamic models, traffic simulations, and geographical analyses to support effective emergency response planning and infrastructure development in flood-prone areas [
37].
Environmental and infrastructural impacts are critical topics in this field. Scott’s study examined the effects of road de-icing salts on an urban stream and flood control reservoir, revealing high levels of chloride and sodium in the reservoir’s bottom layers during winter thaws. This contamination led to downstream water quality issues, highlighting the environmental consequences of urban infrastructure maintenance and the need for such impacts to be considered in urban planning [
38].
Winter explored the economic impacts of landslides and floods on road networks, dividing these impacts into direct and indirect consequences. These include cutting off access to remote communities, which affects employment, health, education, and social activities. The study introduces the concept of a “vulnerability shadow”, where the effects extend far beyond the disaster’s immediate area. This research underscores the broad socio-economic impacts of natural disasters on transportation networks and the need for resilient road infrastructure [
39].
La Marche and Lettenmaier investigated how forest roads affect flood flows in the Deschutes River, Washington. Their findings suggest that road construction in forested areas can significantly increase peak flood flows, affecting both local environments and broader watershed hydrology. This study highlights the environmental implications of infrastructure development in sensitive areas and the need for sustainable road construction practices [
40].
In the area of Flood Risk and Hazard Assessment, García and Lorenzo developed a method to evaluate the hazards of road crossings over ephemeral channels, a critical issue in semi-arid areas like the Murcia region. Their approach integrates hydrological, hydraulic, and morphological criteria to create hazard indicators, improving our understanding of flood impacts on road networks [
41].
Kalantari advanced flood risk mapping by developing a spatial-statistical method for predicting flood probability at critical road-stream intersections. Applied in Sweden, this method incorporates key watershed and road characteristics, enhancing our ability to predict and mitigate flood-related road damage [
42]. Van Ginkel assessed the robustness of European road networks against river flooding using percolation analysis, revealing varying levels of vulnerability across European countries and suggesting targeted flood-proofing measures [
43].
Qiao developed a standard risk assessment method to quantify flood risks to urban road users based on rainfall scenarios. Using the Storm Water Management Model (SWMM) and an Analytic Hierarchy Process (AHP), a case study in China showed significant financial risks due to flash flooding and recommended retrofitting measures to reduce this risk [
44].
Zhou’s analysis of river flood risks to the Chinese road network used metrics like expected annual damage (EAD) and network efficiency loss, highlighting the financial burden on lower-income regions and the need for integrated flood risk management [
45]. Shabou introduced MobRISK, a microsimulation system that assesses road user exposure to extreme hydrometeorological events. This model, which includes travel behaviors and mobility adaptation, offers valuable insights for flood risk management [
46].
These studies emphasize the urgent need for advanced, integrated approaches in flood risk and hazard assessment, focusing on the resilience of road networks and the safety of road users across different geographical areas.
The Policy and Management Strategies section explores various methods and frameworks developed to manage and mitigate flood risks, particularly concerning road networks and infrastructure.
Tunstall discusses England’s shift from traditional flood defense to a more comprehensive flood risk management approach, emphasizing the importance of spatial planning and development control [
47]. A case study in Surrey highlights the challenges of adapting to new government policies and the need for consensus on defining ‘safe’ development in flood-prone areas. Liang presents a methodology for strategic post-flood pavement recovery, using life-cycle analysis to assist road authorities in making effective recovery plans amid post-flood uncertainties [
48].
Samadi and Taslimi utilize machine learning and analytic hierarchy processes to create a prioritization program for flood management, enhancing resilience before and after floods. Their model optimizes administrative responses to minimize flood impacts [
49]. Osti addresses the gap between international disaster risk management policies and their implementation at local levels, proposing a framework for developing flood risk strategies, especially in developing countries [
50].
Nielsen introduces a method to assess flood risks on Danish national roads using a high-resolution digital terrain model, creating detailed maps that improve flood risk assessments [
51]. Khan proposes a post-flood maintenance strategy for road networks, integrating flooding into road deterioration models to guide maintenance decisions, even with budget constraints [
52]. Loftis validates a flood forecast model using citizen science in Hampton Roads, Virginia, combining hydrodynamic modeling with community input to enhance flood management [
53].
In remote sensing and data analysis, Li develops a model to evaluate the flood resilience of urban road traffic networks (URTN) using the 4R theory, revealing the low resilience of these networks in Nanjing, China, and suggesting the need for citizen participation and integrated engineering measures [
54]. Yin presents a method for assessing the impact of pluvial flash floods on Shanghai’s urban roads through high-resolution 2D inundation modeling, providing insights for managing urban streets under changing climate conditions [
55,
56]. These are the requirements in the age of digitalization where 2D and 3D models can also be considered since they have more resilient organization and enhance the digital maturity [
57,
58].
Watterson and Jones examine how floods and road networks contribute to exotic plant invasion in Oregon’s mountain streams, combining field surveys and GIS analysis to show the ecological impacts of infrastructure in forested areas [
59]. Wilson and Kousky study the time taken to adopt updated flood insurance maps in the U.S., revealing disparities in adoption times and raising concerns about the accuracy of flood risk information [
60]. Frey introduces a system that uses probabilistic models, GIS data, remote sensing, and elevation models to estimate the flood state of roads, enhancing flood risk management [
61].
Sultana investigates the rapid deterioration of flood-affected roads in Queensland, highlighting the need for robust models to predict pavement performance after disasters [
62]. Kalantari develops a method for mapping flood hazard probability along roads, identifying key predictors like topography, soil type, and land use to inform future road planning and maintenance [
63].
These studies underscore the importance of innovative, data-driven, and community-engaged approaches in flood risk management. They emphasize the need for multifaceted strategies that integrate physical, environmental, and socio-economic factors to enhance the resilience of road infrastructure.
Studies on technological and methodological innovations have made significant contributions to flood risk management. Elstohy and Ali used Sentinel-2 satellite imagery to identify areas affected by flash floods along the Zafaarana-Ras Ghareb coastal roads, achieving a 98.9% accuracy rate using the Normalized Difference Water Index (NDWI) and an Image Difference Feature (IDF) model [
64]. This approach showcases the power of remote sensing for effective flood management, providing data for emergency response planning.
Jing introduced a color-coding system for flood road gauges, which improves accuracy and response time over traditional digital gauges [
65]. This cost-effective solution is particularly useful in developing regions for early flood warnings. Similarly, Oduah developed a flood monitoring device for vehicles that detects rising flood levels and integrates with Google Maps for real-time updates [
66], helping drivers navigate safely during floods.
Kong used taxi GPS data to map post-flood road conditions, correlating traffic patterns with precipitation data to assess the real-time impact of floods on urban transportation [
67]. This method highlights the potential of crowdsourced data in creating accurate and timely flood maps, essential for urban planning and emergency response. These advancements demonstrate transformative solutions in flood risk management, particularly for assessing and responding to flood impacts on road networks and urban infrastructure.
In identifying trends and gaps, the field of flood risk management has evolved significantly, with interdisciplinary approaches becoming more common. Studies by Balikuddembe and Yin exemplify this trend by integrating hydrology, urban planning, and transportation engineering [
15,
56]. This comprehensive approach is necessary for understanding the complexities of flood impacts and developing effective mitigation strategies, particularly in urban settings.
Advancements in remote sensing and Geographic Information System (GIS) technologies have also revolutionized flood mapping and risk assessment. These technologies provide high-resolution data that are important for flood management and emergency planning [
54,
64]. They enable more precise and timely interventions, shifting flood risk management toward proactive and preventive approaches.
Another major trend is the focus on climate change and resilience in flood risk management. Studies by Mukesh and Versini emphasize the importance of incorporating climate change into flood risk analysis [
24,
68], reflecting the growing recognition of how global climate dynamics are altering flood hazards. This shift stresses the need to enhance the resilience of road networks and urban infrastructure to adapt to future climatic uncertainties.
In data analysis, the integration of machine learning and advanced analytics into flood risk assessment is a notable development. Samadi and Taslimi demonstrate how these technologies can handle large datasets for more accurate and predictive flood modeling [
49]. Machine learning offers new possibilities in predicting flood events and assessing vulnerabilities, which is invaluable for planning and emergency response.
Community engagement and citizen science are also emerging trends in flood risk management. Loftis shows how involving local communities can significantly enhance flood resilience [
53]. This participatory approach ensures that local knowledge and needs are incorporated into flood management strategies, making them more effective and inclusive.
Despite significant advancements in flood risk management, there are still crucial gaps that need to be addressed to improve resilience and response. A key gap is the limited focus on low-income and vulnerable regions, which face unique challenges due to inadequate resources and infrastructure. Targeted research is needed to understand these communities’ specific vulnerabilities and to develop customized flood management strategies.
Another gap lies in the lack of comprehensive analysis of the socio-economic impacts of floods. While physical damage to road networks is well-documented, the long-term socio-economic effects, particularly in recovery and resilience building, are underexplored. More in-depth studies are necessary to fully understand these impacts and to devise effective recovery strategies.
There is also a need for a better integration of flood risk management with urban development and land use planning. Current research often treats flood risk as a separate issue from urban development, but integrating these fields is essential for creating flood-resilient urban spaces. This means incorporating flood risk considerations into urban planning and adapting development strategies to mitigate these risks.
Another significant research gap is in the adaptation and retrofitting of existing infrastructure. While new developments often include flood risk management elements, older road networks and urban areas, which are also vulnerable to floods, are frequently overlooked. Research focused on adapting these existing structures to withstand flooding is essential [
69].
Real-time data acquisition and processing for immediate flood response, especially in fast-changing urban flood scenarios, also require more attention. Although remote sensing and GIS technologies have advanced, their application in real-time flood monitoring and response remains challenging. Developing tools and methods for real-time data processing could greatly improve flood response capabilities.
Addressing these gaps is crucial for building more resilient communities and infrastructure. The integration of a machine learning-based flood map with the Portuguese road network represents a significant step forward in dynamically linking flood risk assessments with transportation planning. By focusing on land characteristics rather than variable factors like weather, this approach provides a stable foundation for predicting flood impacts on infrastructure, enabling proactive risk management.
The study also introduces an economic model for urban flood risk management, including potential loss estimation and maintenance cost analysis. This model advances strategic asset management by emphasizing cost-effective resource allocation towards high-return areas in risk reduction and infrastructure resilience, essential for long-term urban planning in flood-prone areas [
70].
This literature review provides a well-rounded understanding of the strengths and limitations found in various flood risk management approaches, especially concerning road networks. By evaluating different methodologies, it reveals effective strategies, such as the use of advanced technologies and socio-economic considerations, while also pointing out areas that need further attention, like the resilience of infrastructure in vulnerable regions. This analysis supports the development of a new research methodology by illustrating the need for innovative solutions that address current shortcomings and enhance the protection of transportation networks against flood risks. It also underscores the importance of integrating a Geospatial AI approach to more precisely evaluate and mitigate the impacts of floods on critical infrastructure.
3. Methodology
Our previous research focused on developing a comprehensive flood risk (FR) assessment model for Portugal, leveraging the power of geospatial artificial intelligence (GeoAI) and machine learning (ML) techniques. The foundation of this model was built upon the integration of diverse datasets encompassing topographic factors like Digital Elevation Models (DEM) and slopes, proximity factors such as distance to rivers and the sea, and land characteristics including soil permeability, texture, stone content, and maximum filtration capacity [
71]. These datasets were meticulously processed and integrated with the Floods and Landslides Disaster database, providing a rich and spatially explicit dataset for training our ML model [
72].
Following data acquisition and pre-processing, a Random Forest (RF) classifier was implemented due to its robustness in handling complex, non-linear data and its ability to provide valuable insights into feature importance [
73,
74,
75]. The RF model was trained on a dataset of 3200 flood and landslide events recorded in Portugal between 1865 and 2020, spanning 96,399 data points across a 1 km-by-1 km grid covering the mainland. Each data point was assigned a flood risk score ranging from 1 to 5 based on a multi-criteria approach that considered thresholds for each of the aforementioned geographic and geological factors.
The feature selection and engineering process, of the previous work, was a major step in enabling the RF model to accurately capture the intricate relationships between these factors and their influence on flood risk. For example, areas with lower elevations, gentler slopes, and closer proximity to rivers or the sea were assigned higher risk scores, reflecting their increased susceptibility to flooding. Similarly, soil characteristics such as low permeability and poor infiltration capacity were also associated with higher risk scores.
Finally, the results of the RF model, including predicted flood risk probabilities, were visualized in QGIS, allowing for a spatially explicit understanding of flood-prone areas. This visualization provides valuable information for decision-makers and disaster management teams, enabling them to prioritize mitigation efforts and develop more effective emergency response strategies. While this previous work provided a valuable framework for assessing flood risk in Portugal, it also highlighted the need for further research to incorporate the temporal evolution of land use and other environmental factors, which can significantly influence flood probabilities over time. This limitation informs the direction of our current research, which aims to refine and enhance flood risk assessment by incorporating dynamic environmental factors.
The study combined geographic and geological data to understand how land features affect water flow and filtration. Soil properties like texture, stone content, filtration rates, and permeability were included in the model to show how different soil layers might influence flooding. This comprehensive dataset, which excluded precipitation data to focus on the land’s inherent flood risk, was analyzed using Python 3.11 and QGIS 3.32 Lima. These tools helped researchers better understand flood risks in Portuguese cities.
The study then incorporated OpenStreetMap (OSM) data, focusing on major roads such as motorways, freeways, and primary and secondary roads. These were chosen because of their importance for national and regional connectivity and the potential impact of flood damage on socio-economic activities.
The road network data were overlaid with the flood susceptibility model, which included 96,399 data points based on land characteristics and geographic features. Using QGIS’s ‘Nearest Neighbour’ algorithm, each road segment was assigned a flood risk based on nearby data points from the model.
This analysis helped identify road segments at high risk of flooding, which is crucial for infrastructure planning, emergency preparedness, and maintenance efforts. The resulting map serves as a tool for stakeholders to understand potential flood impacts on Portugal’s key transportation routes.
This approach provides a clear visualization to help improve road network resilience against flood disruptions. It informs both immediate preventive measures and long-term planning for infrastructure development and management.
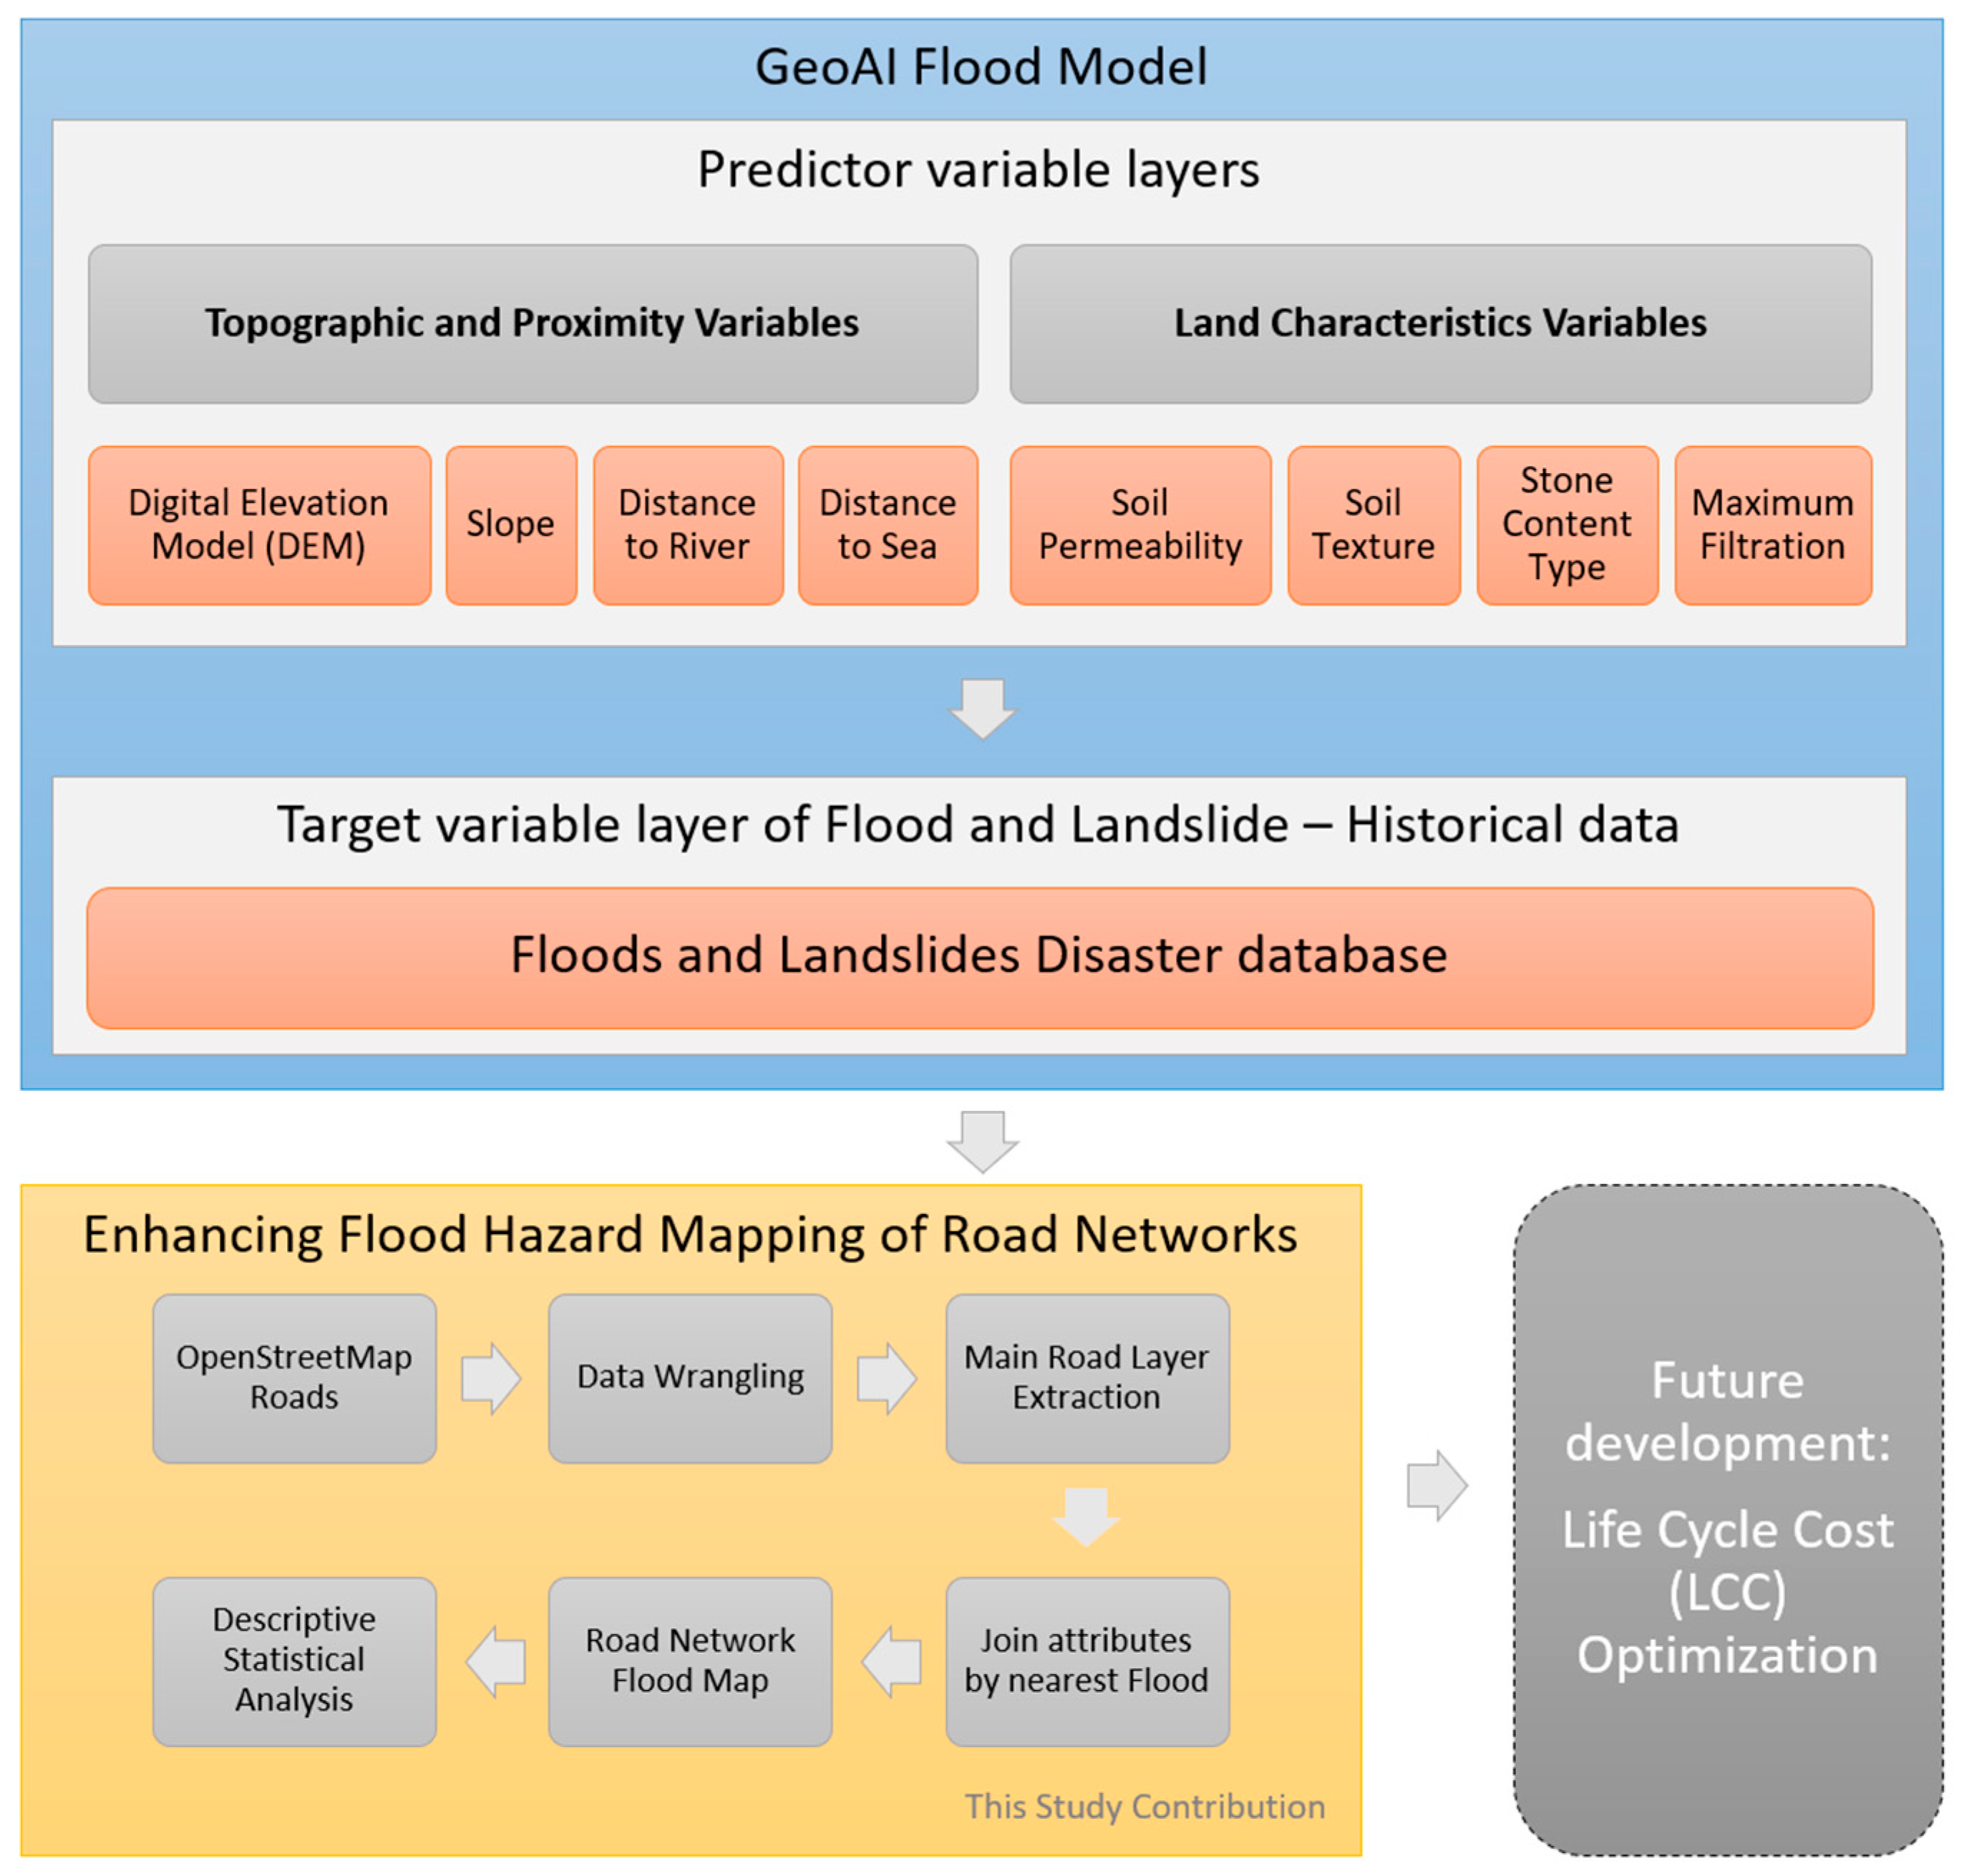
Figure 2 shows a diagram of the research method used to create the GeoAI flood model. The model analyzed various factors that predict flood and landslide risk, including topographic and land characteristic variables. These data were compared with a layer showing historical flood and landslide events from a comprehensive flood database.
This research builds upon previous work by carefully examining how floods might affect road networks. First, road network information was gathered from OpenStreetMap and prepared for use with a flood risk model. Then, these road data were combined with the model’s results to identify which road sections were most vulnerable to flooding. This was carried out using a ‘Nearest Neighbor’ algorithm, a geospatial tool that assigns risk levels to road segments based on their closeness to areas predicted to flood. A detailed statistical analysis further clarified the flood risk to the road network, leading to the creation of a comprehensive flood impact map.
Our methodology, while initially developed for Portugal, is designed to be adaptable for other regions with appropriate modifications. The approach leverages universally available datasets, such as Digital Elevation Models (DEM), proximity to water bodies, and soil characteristics, all of which can be sourced or derived for different geographic contexts. By substituting these local data inputs, the model can be recalibrated to assess flood risk in various environments. Additionally, the Random Forest classifier we used is a flexible machine learning technique that can handle the unique features of any dataset, making it suitable for global application.
To apply this methodology elsewhere, researchers would need to follow a similar process: acquire and integrate relevant local datasets, train the model on local historical flood data, and adjust feature selection criteria to reflect the region’s specific conditions. The visualization and analysis techniques used in this study, particularly with tools like QGIS, are standard and can be easily applied in different settings to produce actionable flood risk assessments for infrastructure planning and disaster management.
This study’s findings are valuable for future research, especially in planning cost-effective infrastructure maintenance to improve resilience. The data and methods used here can help create strategies to improve sustainability and preparedness for natural hazards.
4. Case Study
This section explores how combining GeoAI flood hazard mapping with road network data helps us understand flood risks in Portugal. We will look at where flooding is most likely to happen and what that means for roads, especially in major cities. By analyzing the relationship between road characteristics and flood susceptibility, we can identify the most vulnerable areas. This information will be useful for improving urban resilience and shaping future policy recommendations.
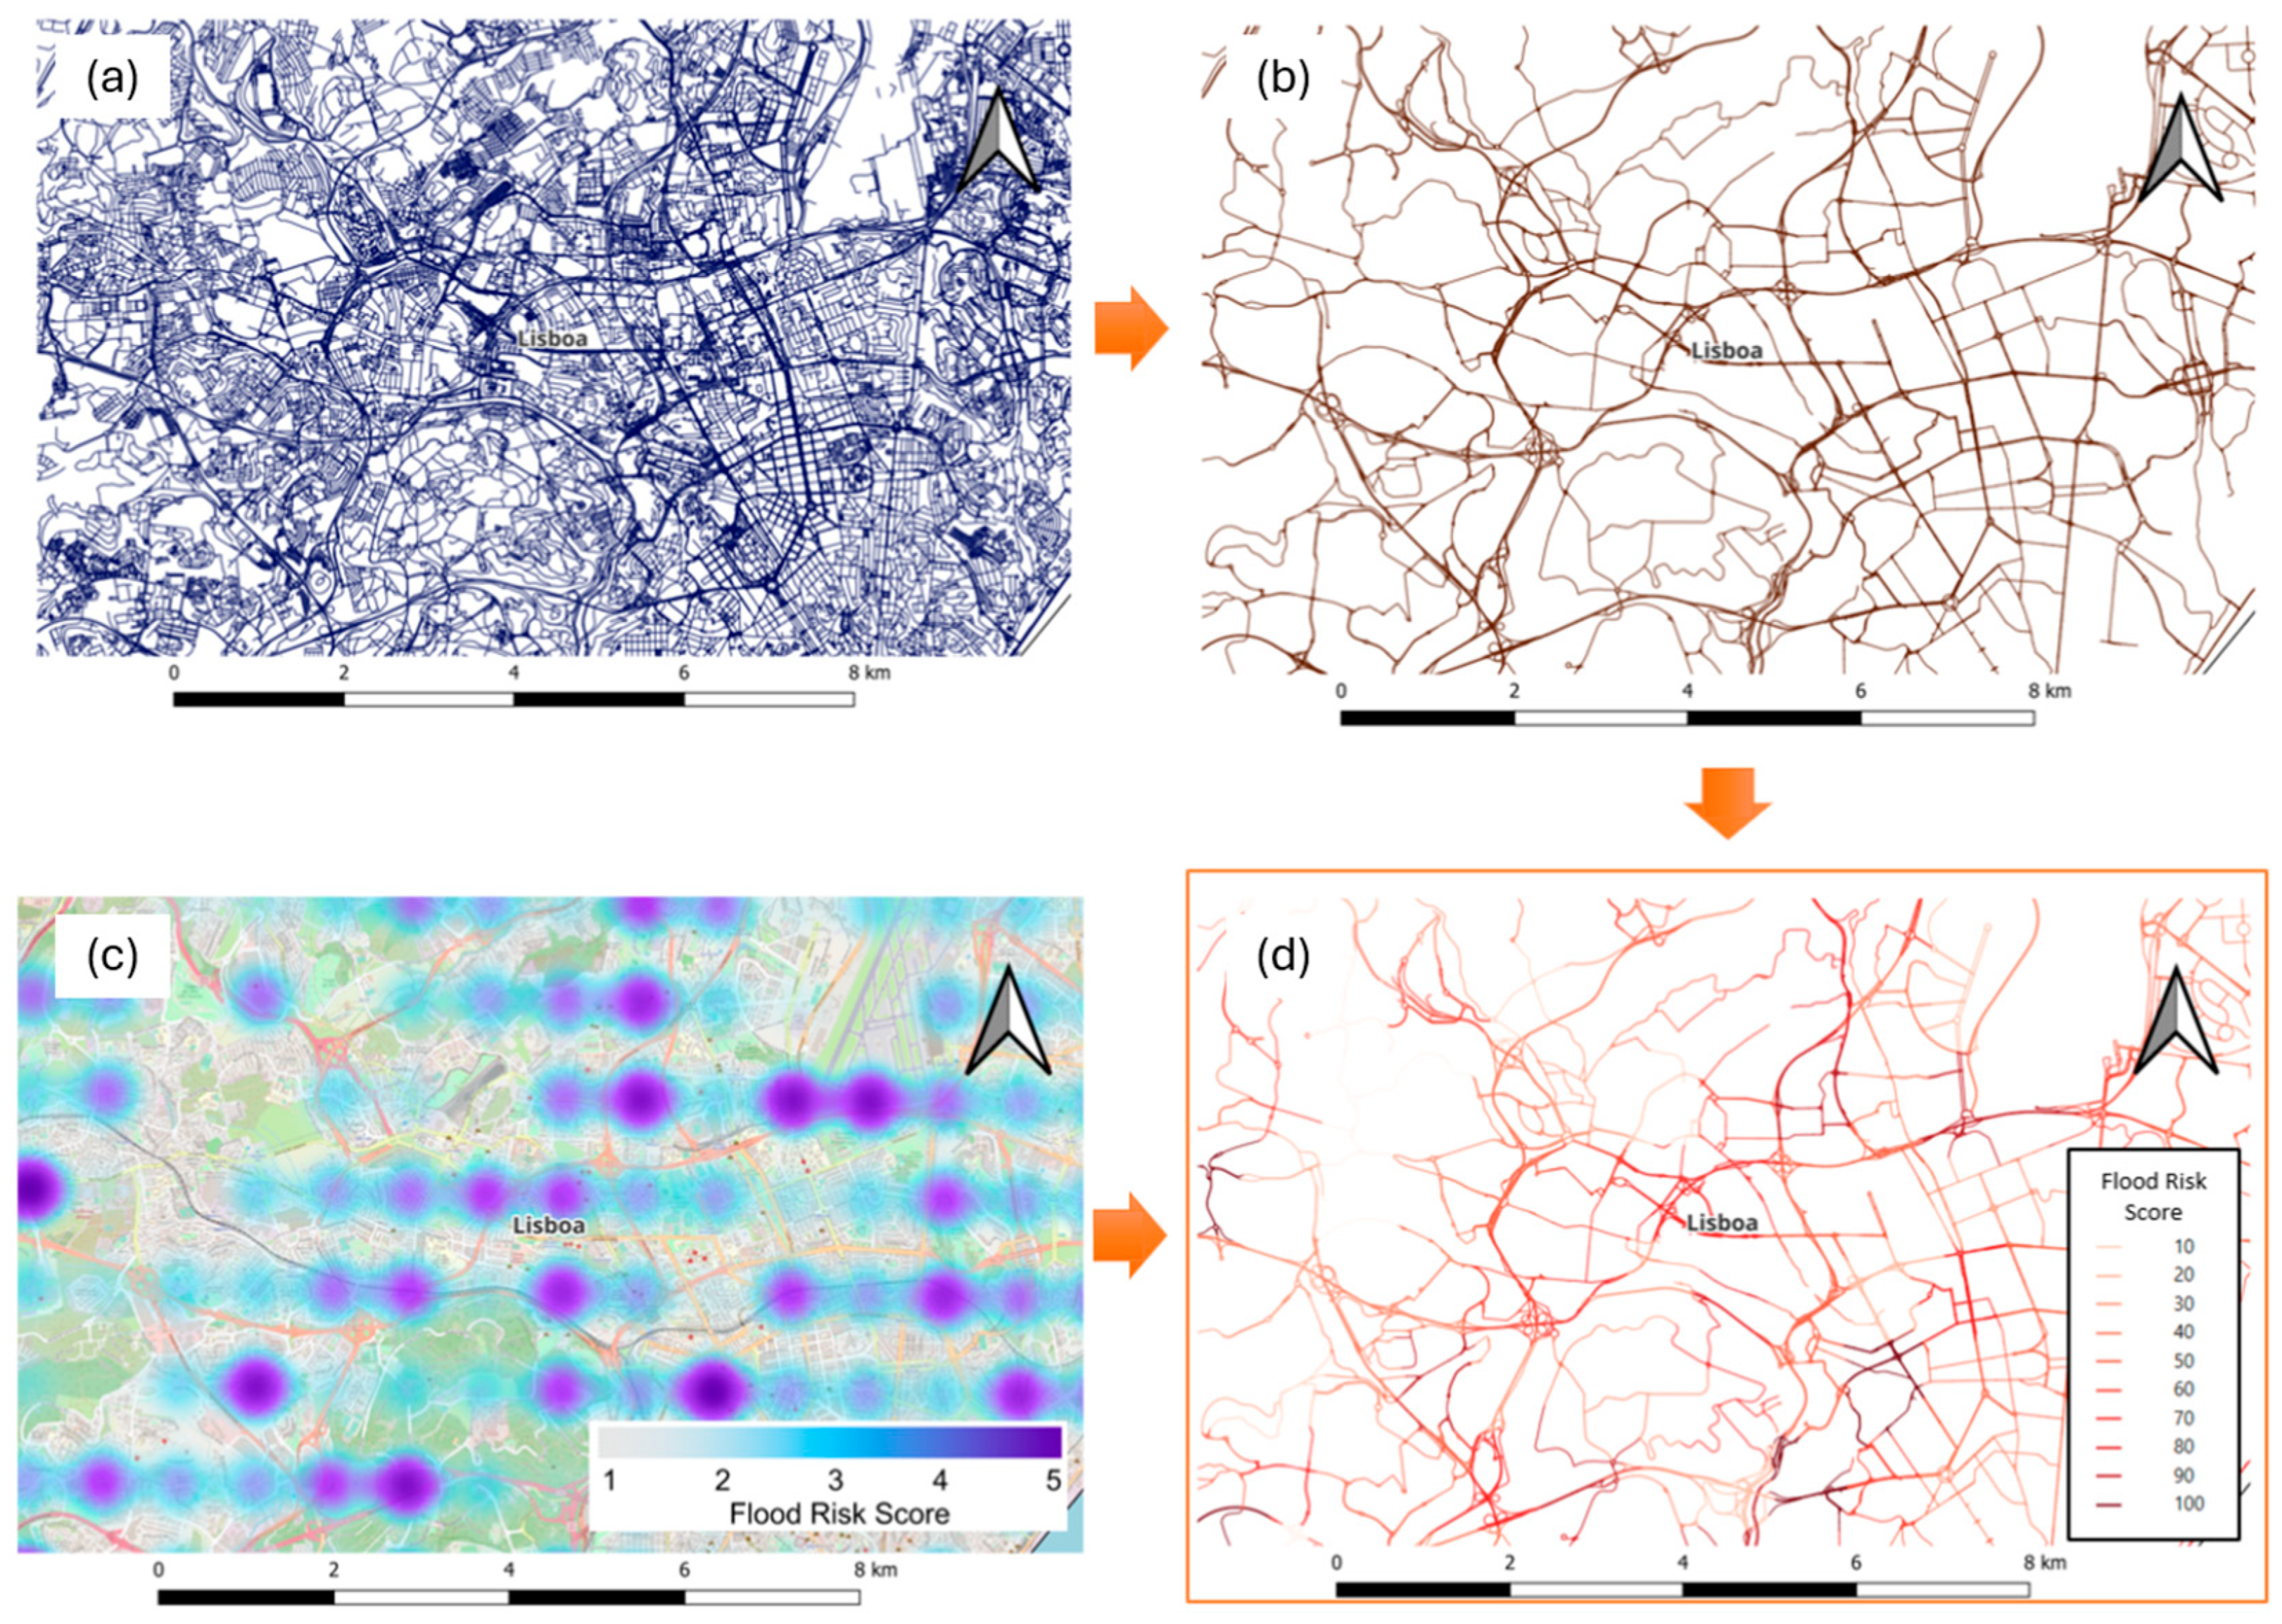
Figure 3 shows how we turned a large amount of road data into a useful tool for assessing flood risks on roads. This figure has four parts that show this process step by step: the first part shows all the roads from OpenStreetMap, which looks very complex, the second part simplifies this by showing only the main roads that are important for travel and emergency services, the third part adds information about flood risk from previous studies, using different colors to show how high the risk is in different areas, and the last part combines the simplified road map with the flood risk information. It gives each road a flood risk score, shown in different colors.
This process demonstrates how GeoAI can turn complicated data into a clear picture of flood risks on roads. The final map is a powerful tool that can help city planners and emergency managers make better decisions about how to prepare for and respond to floods. It shows which roads are most likely to flood, which is crucial information for keeping people safe and minimizing disruptions during flood events.
The study’s approach, as shown in
Figure 3, is thorough and practical. It takes raw data about roads and turns it into a detailed assessment of flood risks. This kind of tool can help cities become more resilient to floods by showing exactly where problems are likely to occur. It can also help officials make better decisions about where to invest in flood protection and how to plan emergency responses. By providing clear, visual information about flood risks, this tool can improve communication between different groups involved in city planning and emergency management.
To better understand Portuguese municipalities, we looked at the population size and land area of several districts using data from the National Institute of Statistics (INE) [
76]. This analysis helps us see how people and space are distributed across different parts of the country.
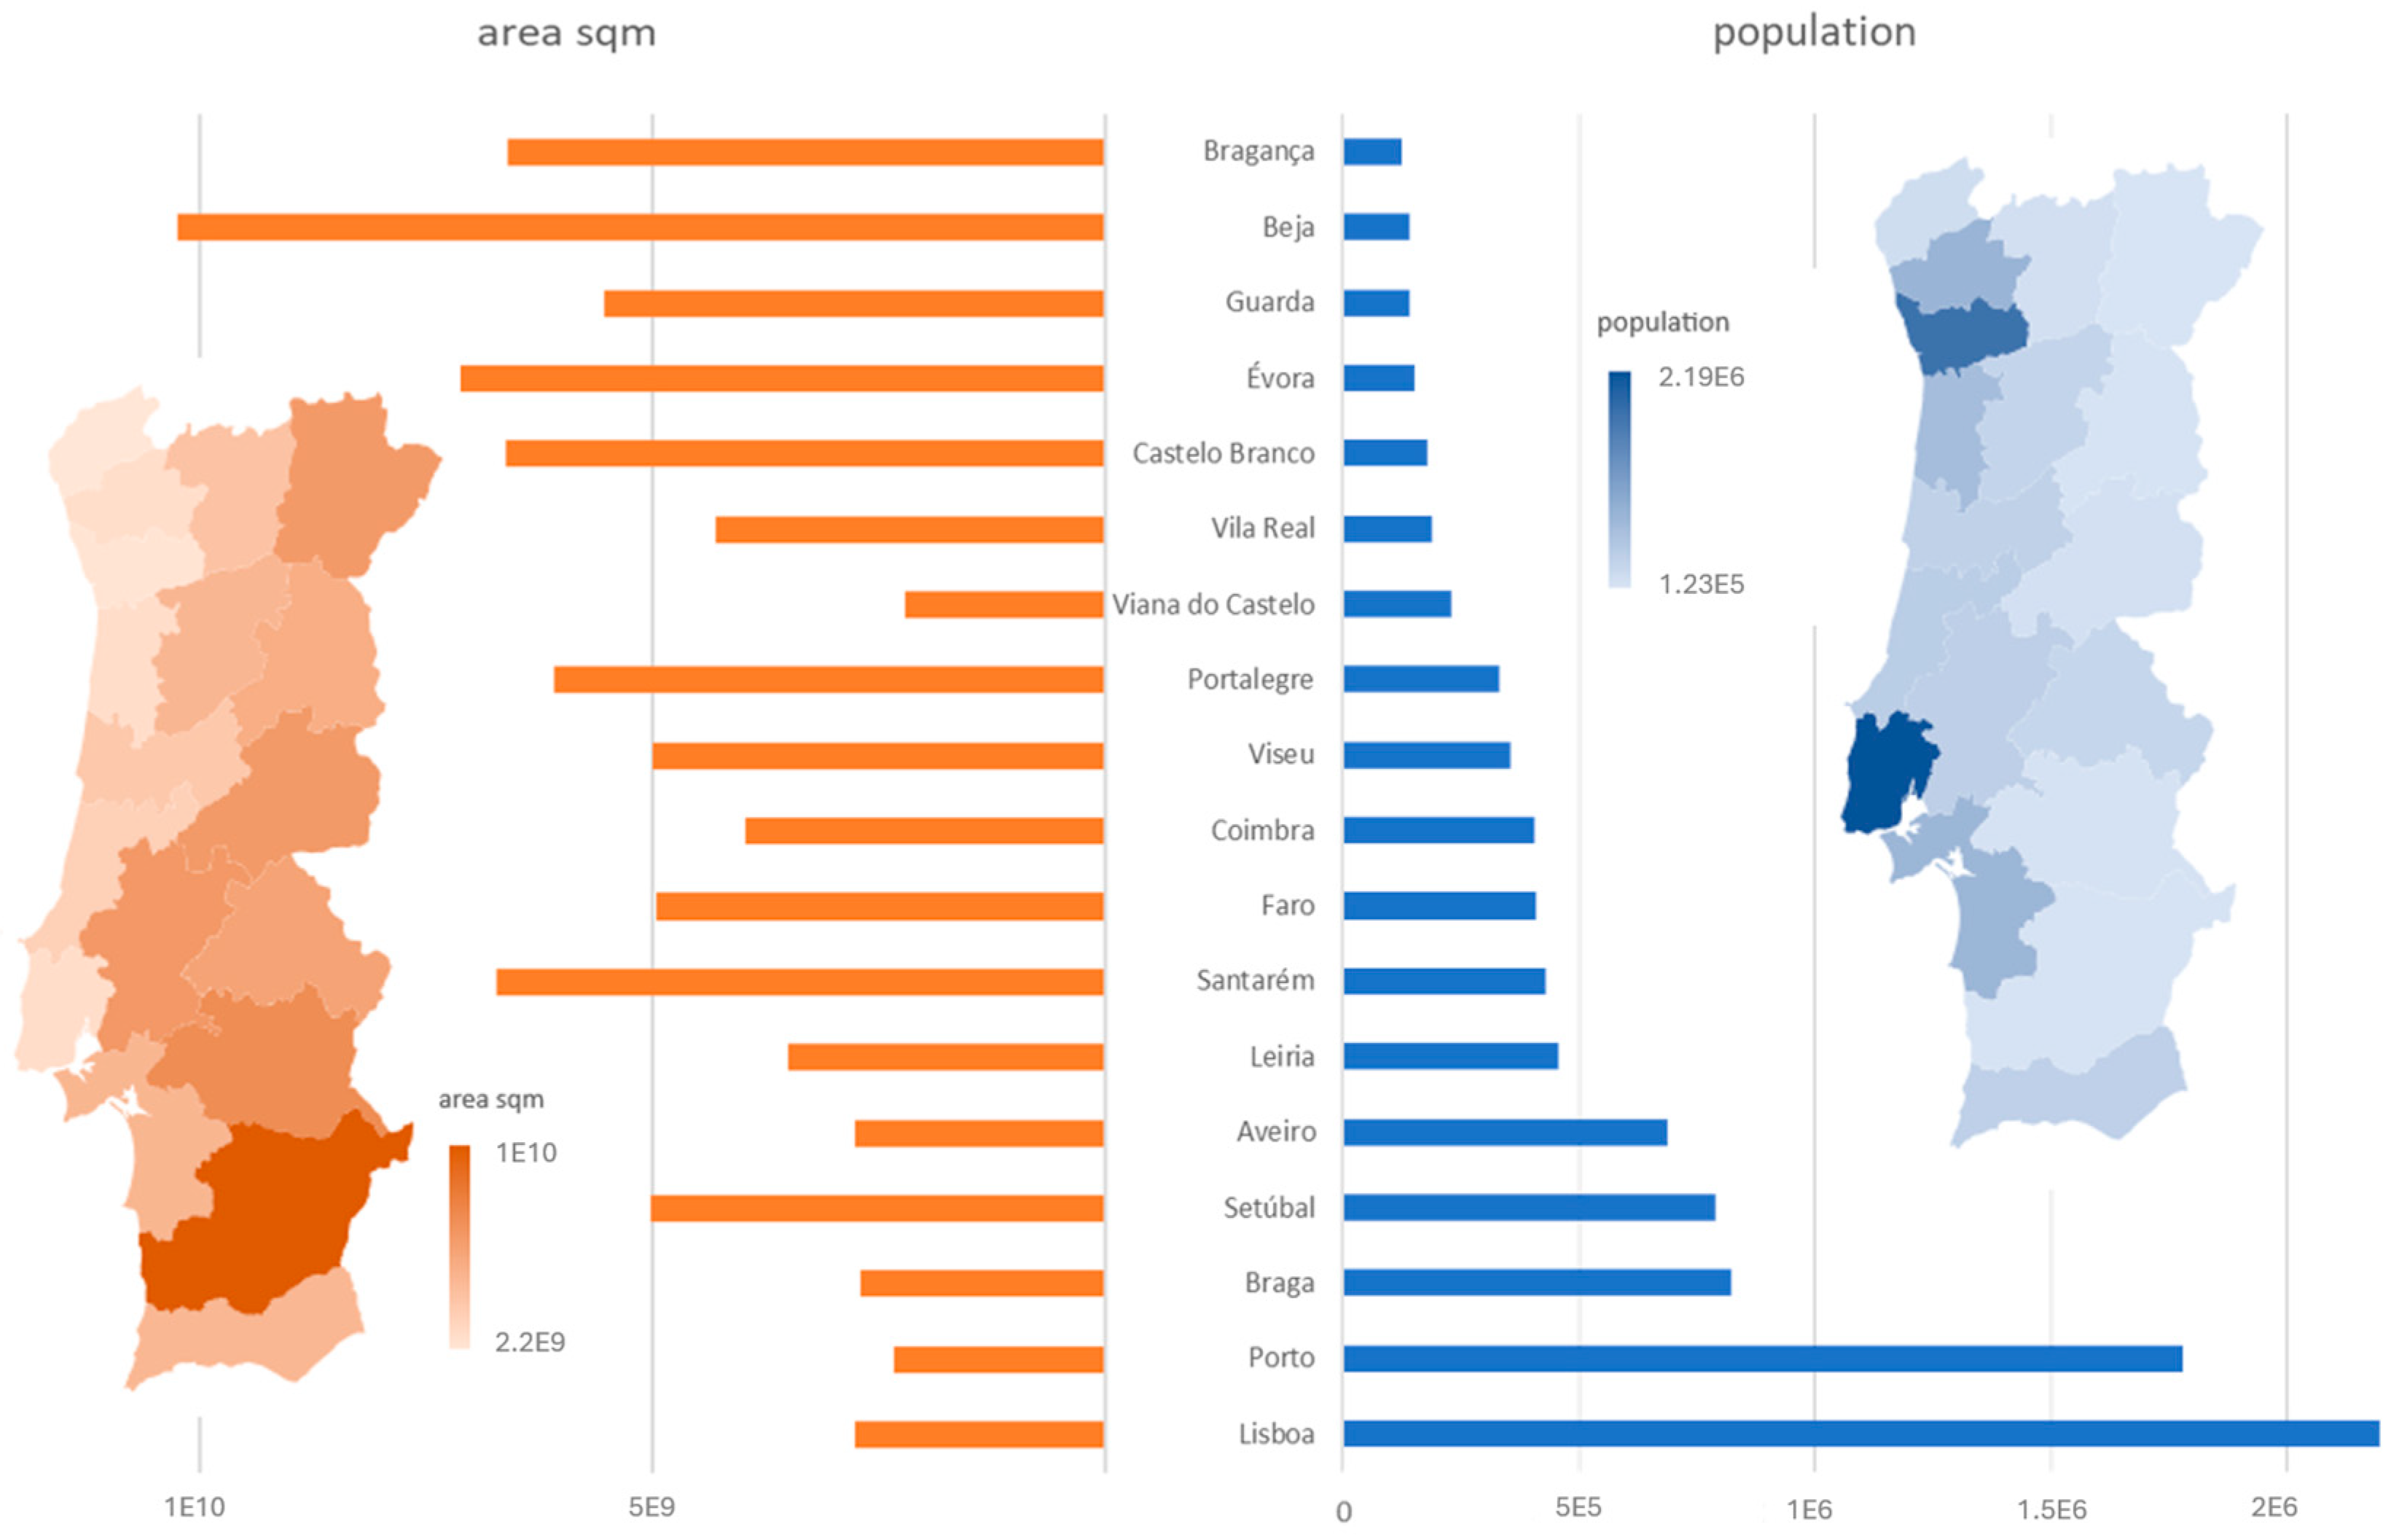
Figure 4 shows that urban districts like Lisbon and Porto have a lot of people living in relatively small areas. In the graph, the blue bars (representing population) are much taller than the orange bars (representing land area) for these cities [
77]. This is probably because these areas have many jobs, services, and facilities, which attract people looking for work and a better quality of life.
On the other hand, some districts have long orange bars but short blue bars. This means they have a lot of land but fewer people, which is typical of rural or less developed areas. These places might have more farms, fewer economic opportunities, or geographical features that make it harder for many people to live there.
The differences between land area and population density in these districts tell us a lot about the challenges each area faces. Big districts with few people might struggle to provide services and build infrastructure over large areas. Meanwhile, smaller districts with many people face urban problems like traffic congestion, environmental issues, and overloaded public services.
These differences show why it is important to have different policies for different districts. Each area has its own unique needs and capabilities, so a one-size-fits-all approach will not work. Instead, policies need to be tailored to address the specific challenges of each district, whether it is a bustling city or a sprawling rural area.
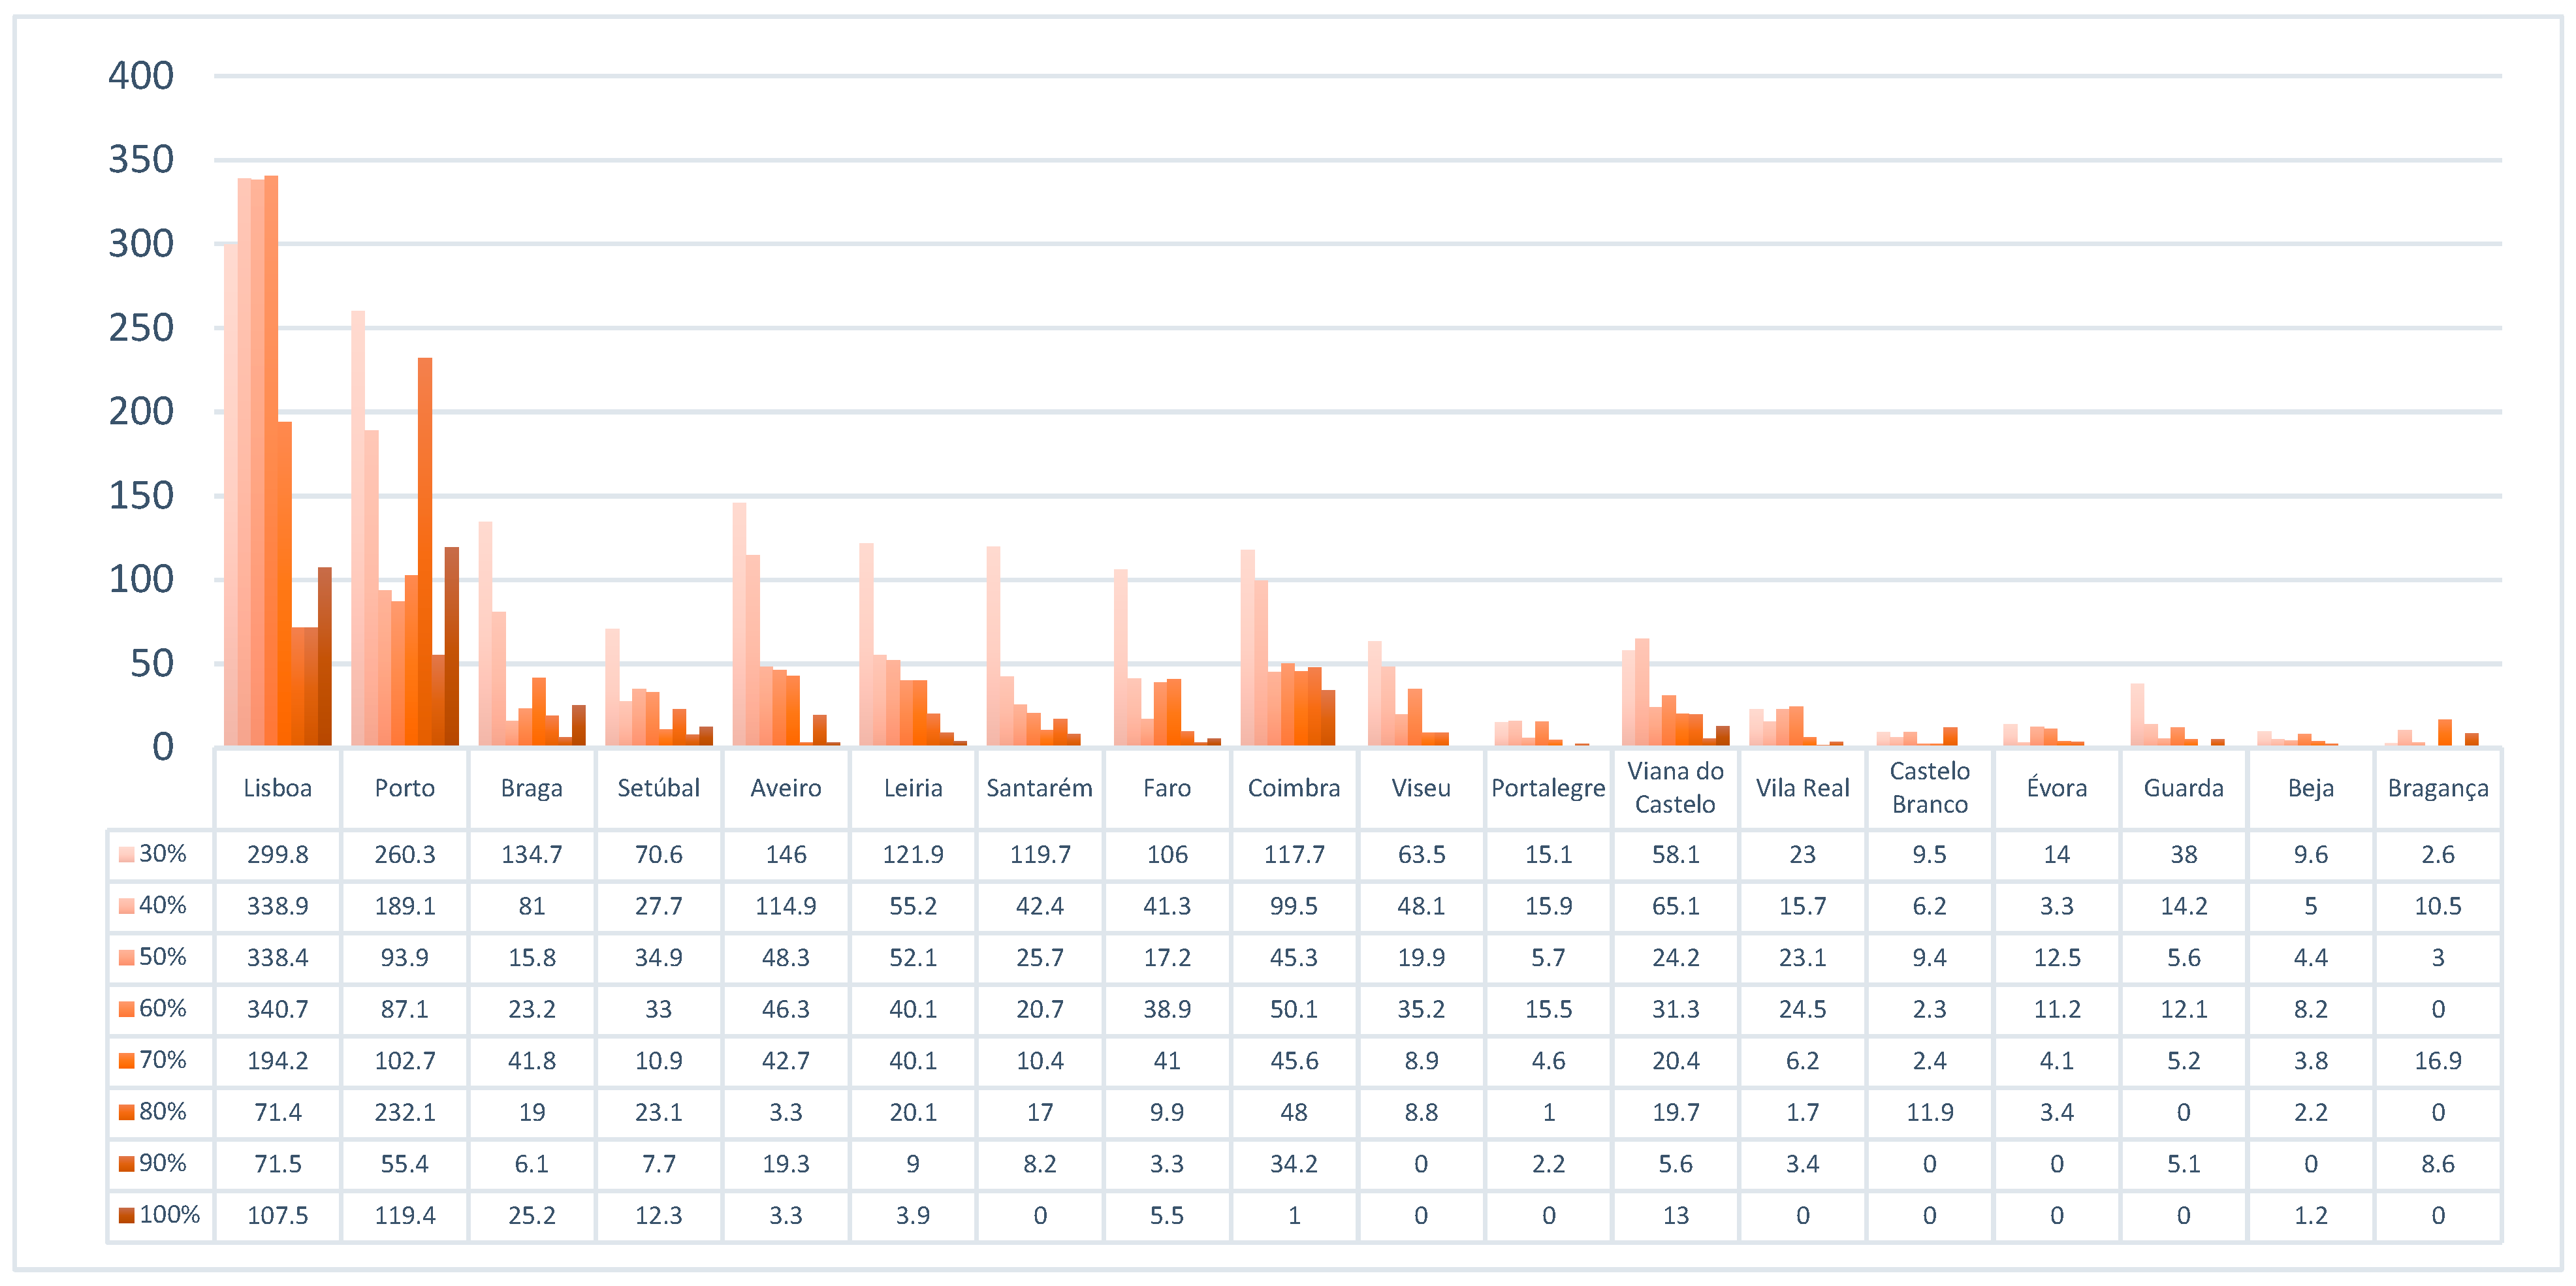
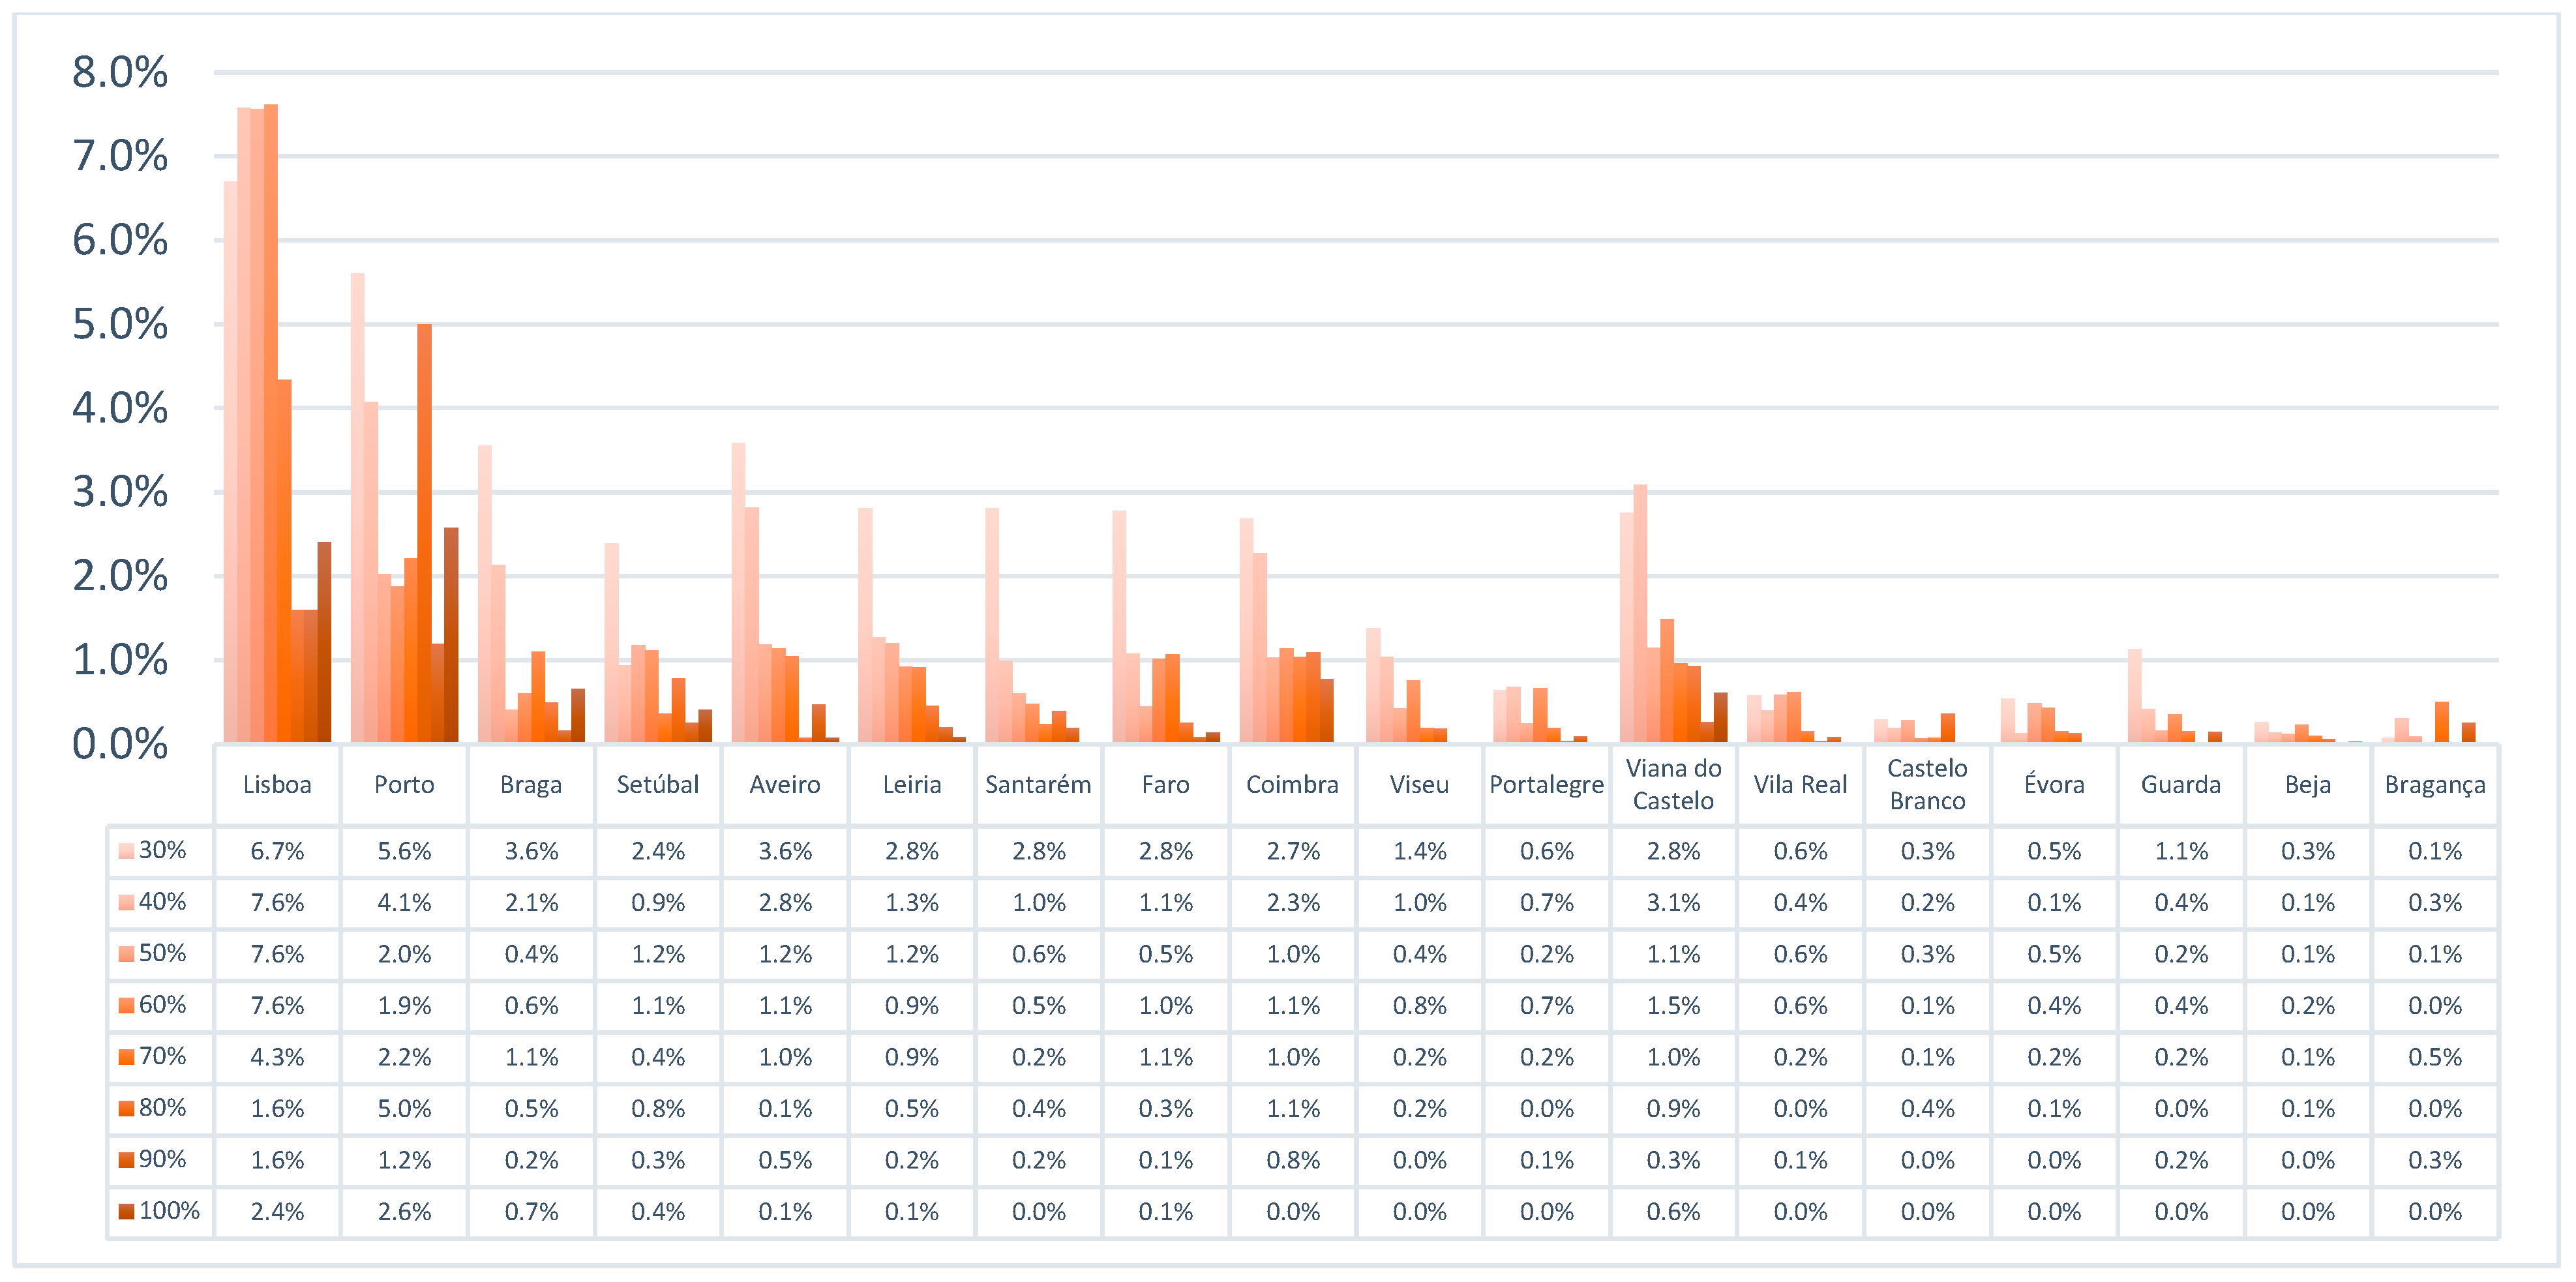
Figure 5 and
Figure 6 shows how flooding might affect the main roads in different parts of mainland Portugal. The graph measures the length of roads in kilometers that could be impacted by floods. On the bottom of the graph, you can see the names of different districts in Portugal. The side of the graph shows how long the affected roads are. The graph uses different colors to show the chance of flooding, from 30% to 100%. This way of presenting the data helps us understand how likely floods are to affect roads in each district and how much of the road network might be impacted.
The graph shows that most of the affected roads fall into the lower risk categories (30–50%), especially in Lisbon and Porto. This suggests these areas are more likely to experience minor flooding that affects a lot of roads. As we look at higher flood risks, we see fewer roads affected. This pattern is the same for all districts, meaning severe floods are less common but might cause more damage to the roads they do hit.
Looking closely at these data, we can say that while small floods might disrupt traffic and need repairs on many roads, the bigger, rarer floods could seriously damage the roads they affect. This chart is very useful for city planners and emergency managers. It helps them figure out which areas are at high risk and where to focus their efforts to prevent flood damage and prepare for emergencies.
Figure 7 focuses on roads with a 50% or higher chance of flooding. To find out which cities have the most roads at risk, we need to look at the bars in the graph that show 50% and above for each city and add them up. This helps us understand which areas might need more attention to protect their roads from flooding.
This figure also shows that Lisbon and Porto seem to have the most extensive lengths of road networks, falling from 50% to 100% flood risk score categories. Specifically, Lisbon has substantial lengths of road in the 50%, 60%, and 70% categories, with diminishing lengths as the probability increases. Porto follows a similar trend, although with generally lower lengths across the higher probability categories when compared to Lisbon.
The other analyzed cities have significantly less road length affected as the flood risk score increases above 50%. This indicates that while Lisbon and Porto may not only be susceptible to frequent low-impact floods but also to less frequent but more disruptive high-impact floods, other districts may face lower risks of such high-impact events.
For urban planning and risk mitigation purposes, the focus would likely be on Lisbon and Porto for interventions aimed at reducing flood risk to critical infrastructure. The data suggest that these two cities would need to benefit most from enhanced flood defenses and emergency response strategies due to the higher lengths of roads at risk.
Due to the constraints imposed by the length of the study and word limitations, it is not feasible to conduct an in-depth analysis for all cities. Consequently, a selection process must be employed to identify which cities warrant detailed examination. This process is informed by strategic considerations, aiming to optimize the utility of the analysis within the given constraints. The criteria for selecting cities for an in-depth analysis have been based on two factors, population and length of road networks.
The rationale for focusing on districts with populations above half a million is grounded in the potential impact on a larger number of inhabitants. High population density can compound the effects of flooding, resulting in more significant economic damage, infrastructural strain, and potential loss of life. In such areas, even minor floods can have far-reaching consequences due to the number of people and assets at risk. Lisbon and Porto, being the districts with the highest populations, are logical choices for detailed study. Braga, Setúbal, and Aveiro also meet the population criterion, suggesting that flood events in these districts could affect substantial portions of the Portuguese population.
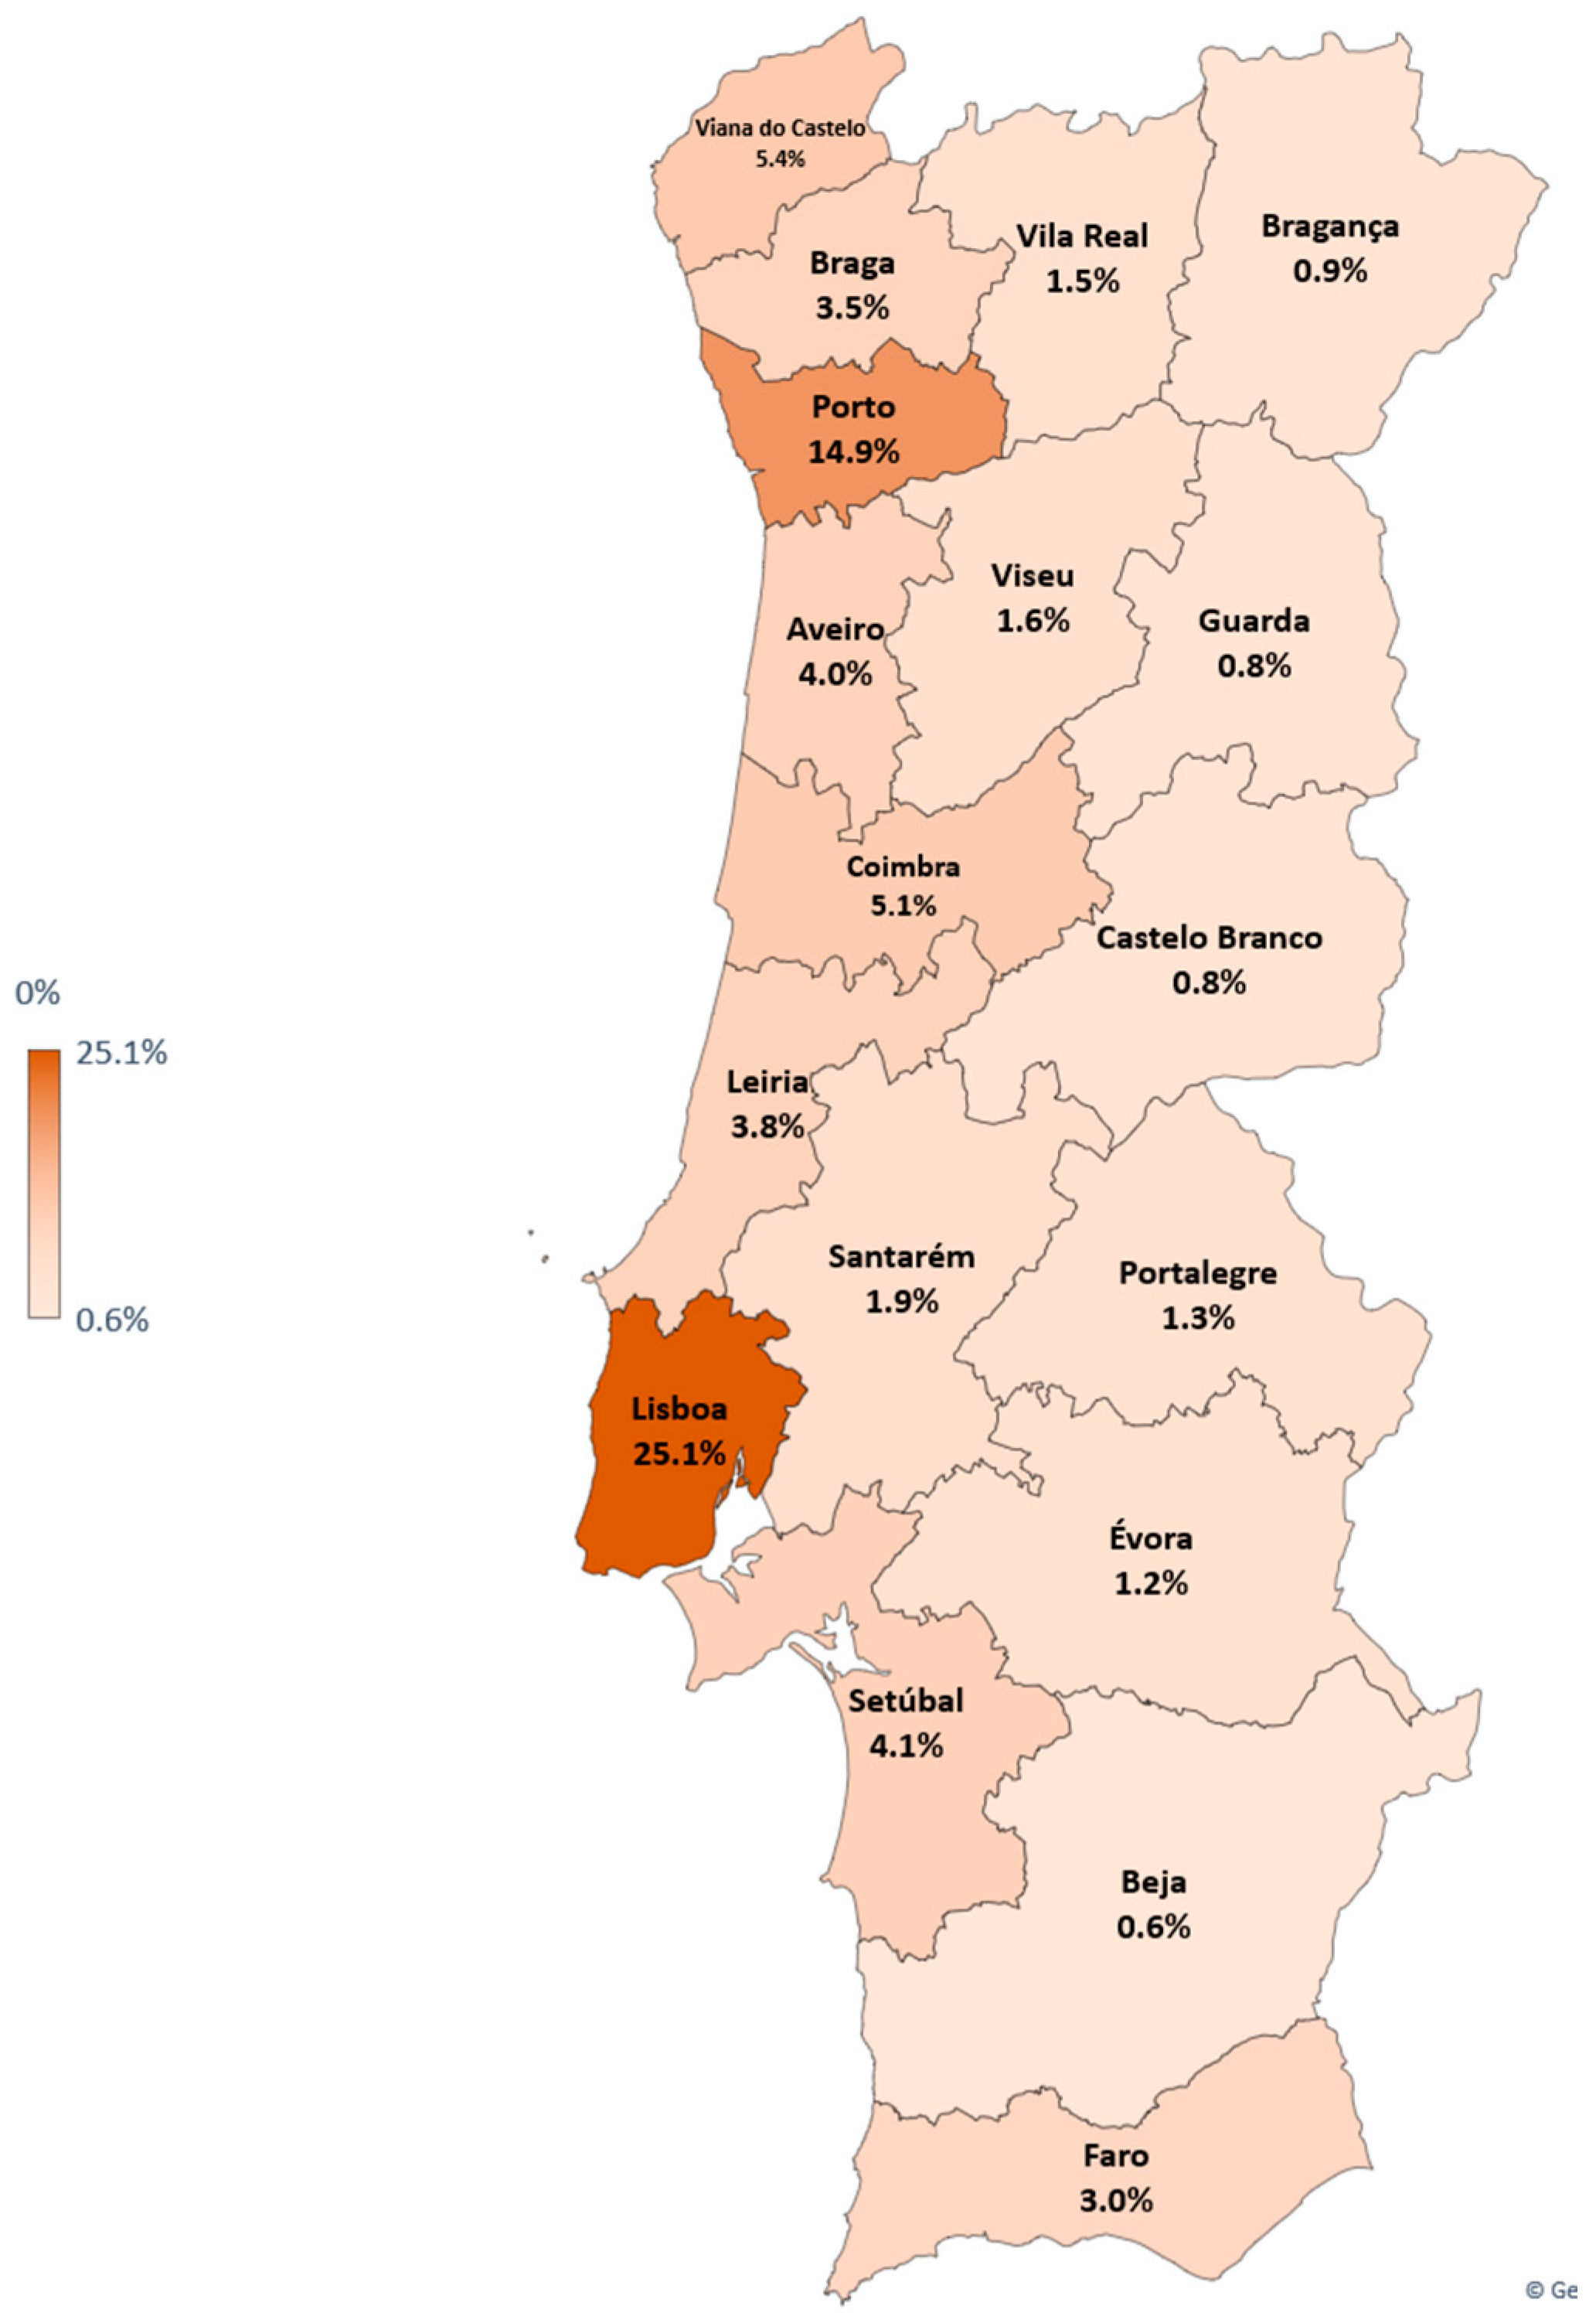
The further refinement of city selection considers the length of road networks involved in flood risks, with all mentioned districts exhibiting more than 4% of their roads at risk. High percentages indicate greater vulnerability and, consequently, a higher priority for detailed risk assessment and mitigation planning.
Lisbon leads this category with 25.1% of its road network at flood risk, followed by Porto with 14.9%. These percentages underscore the importance of these cities in the analysis due to the combined factors of high population and the significant infrastructure at risk. Setúbal, Aveiro, Coimbra, and Viana do Castelo also have notable percentages, albeit lower than Lisbon and Porto, warranting their inclusion for further study (see
Figure 8).
This study will focus on four cities: Lisbon, Porto, Setúbal, and Aveiro. We chose these cities to understand how floods affect areas where they can cause the most damage. This information will help create better policies and manage flood risks. Lisbon and Porto are the largest cities and face significant flood risks. Setúbal and Aveiro, while smaller, have a large portion of their roads at risk, making them important examples to study.
5. Discussion of the Obtained Results
Mapping high-risk road segments across Lisbon, Porto, Setúbal, and Aveiro is crucial for flood management and infrastructure planning. Using advanced technologies like GeoAI and GIS helps us understand potential flood locations and their impacts on these cities. By analyzing maps and data, we can identify the most vulnerable roads and develop strategies to make them safer. This technology-driven approach to mapping flood risks enables better planning to protect our cities and ensure public safety.
Lisbon, Portugal’s capital, is a symbol of the country’s rich history, vibrant culture, and economic strength. As a hub for government, finance, and commerce, it plays a vital role in the national economy. This importance highlights the need for comprehensive flood risk management strategies. Lisbon’s coastal location and vulnerability to sea-level rise due to climate change make it urgent to find innovative ways to protect its infrastructure, cultural heritage, and economic power. The city’s diverse economy, from services to tourism, presents unique challenges and opportunities for urban planning and building resilience against flood risks.
Lisbon’s high population density and mix of historical and modern infrastructure require a careful approach to flood risk assessment. The potential impact on evacuation plans, emergency response, and preserving cultural sites shows why it is important to use GeoAI and GIS mapping technologies. These tools can provide detailed insights into flood patterns, allowing for targeted interventions to protect both people and the city’s cultural assets. Lisbon’s strategies for managing flood risks and strengthening infrastructure can provide valuable lessons for other coastal cities facing similar challenges [
78].
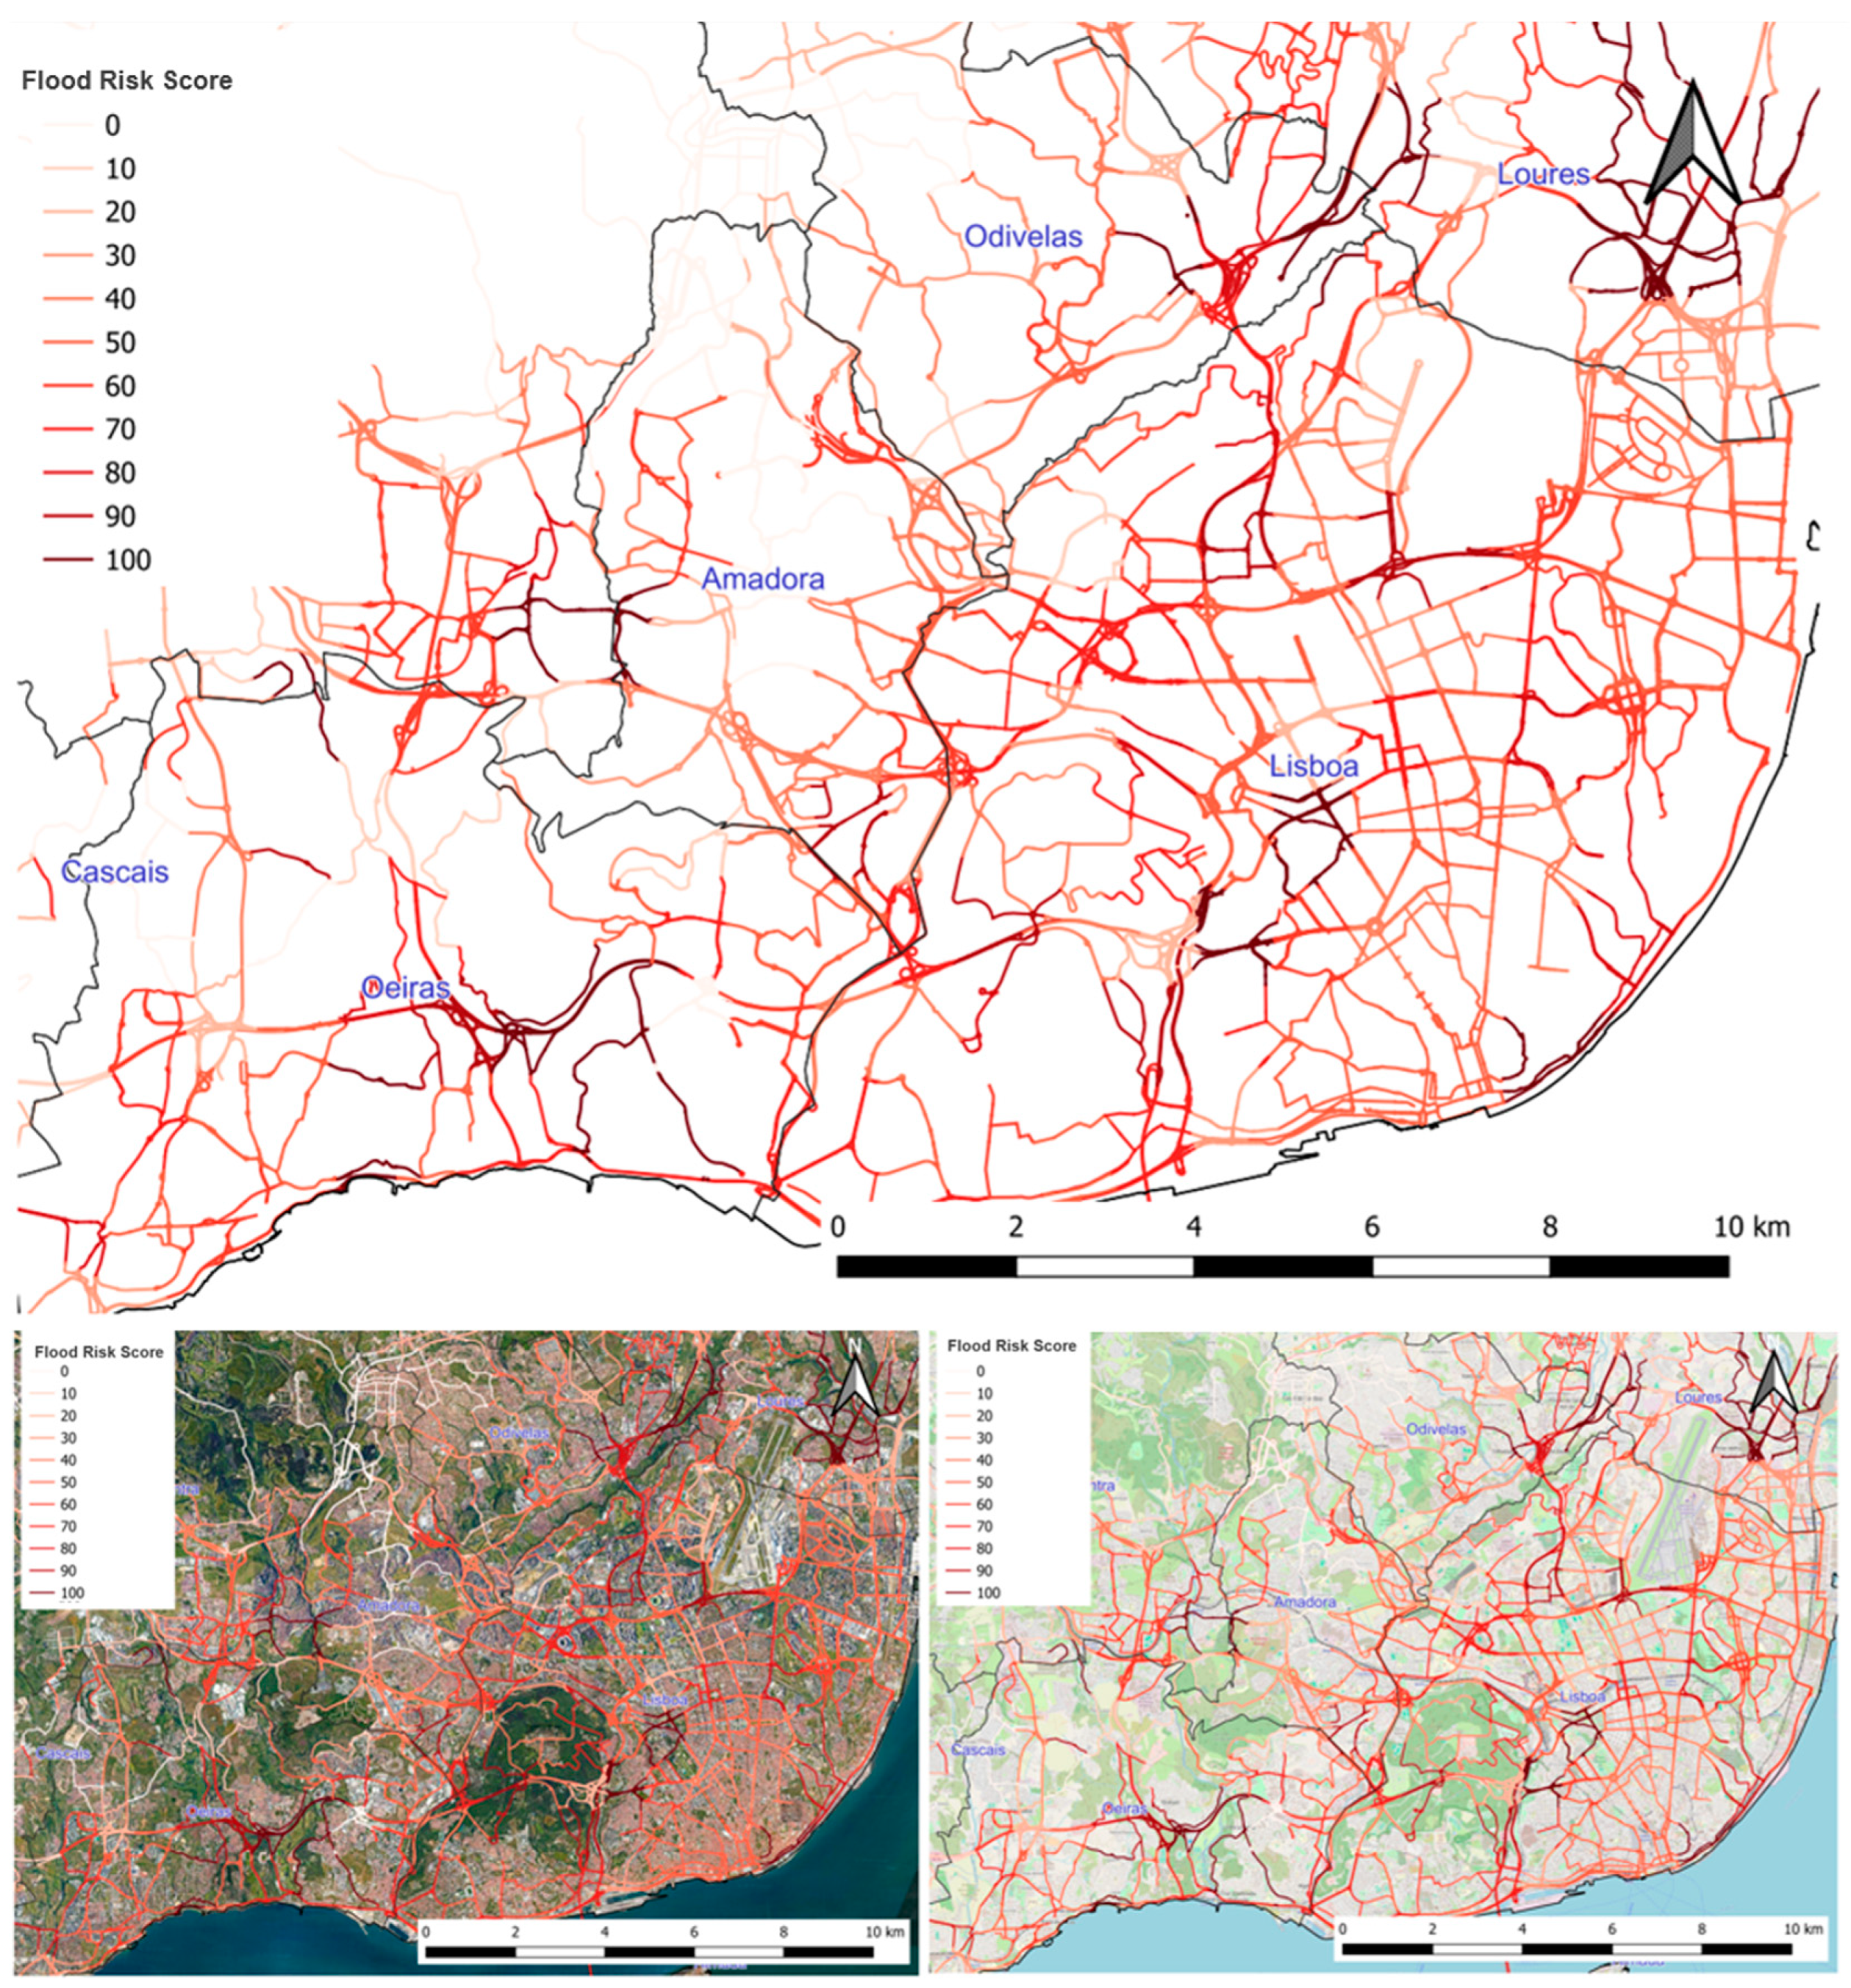
Figure 9 shows the likelihood of flooding on Lisbon’s roads based on a machine learning model using decision trees. It highlights the areas most at risk, rating them from 0 to 100. This map helps identify which parts of the city’s transportation network could be affected during heavy rain or extreme weather events.
A close look at
Figure 9 can help guide decisions about planning and managing the city’s infrastructure. It points out which roads are at higher risk and need more protection against floods. This could involve improving drainage or changing road designs. By focusing on these high-risk areas, the city can better use its resources to strengthen its road network against floods, helping to protect Lisbon’s economy and historical sites.
Porto, known for its historic architecture and important industrial and trade sectors, faces the challenge of balancing historical preservation with modernization in the face of flood risks. The city’s location along the Douro River estuary brings risks of river flooding, requiring specific strategies for water management and urban planning. Porto’s industrial base, combined with its role as an educational and innovation center, emphasizes the need for resilient infrastructure to support its economic activities and protect its communities from flood-related disruptions.
The challenge of maintaining connections in Porto’s densely populated areas during floods calls for developing alternative routes and advanced warning systems. These measures, along with efforts to protect the city’s cultural heritage and support its industrial and service sectors, require a coordinated approach using GeoAI and GIS mapping. This can help Porto improve its emergency preparedness, reduce economic losses, and maintain its cultural and economic integrity despite increasing flood risks.
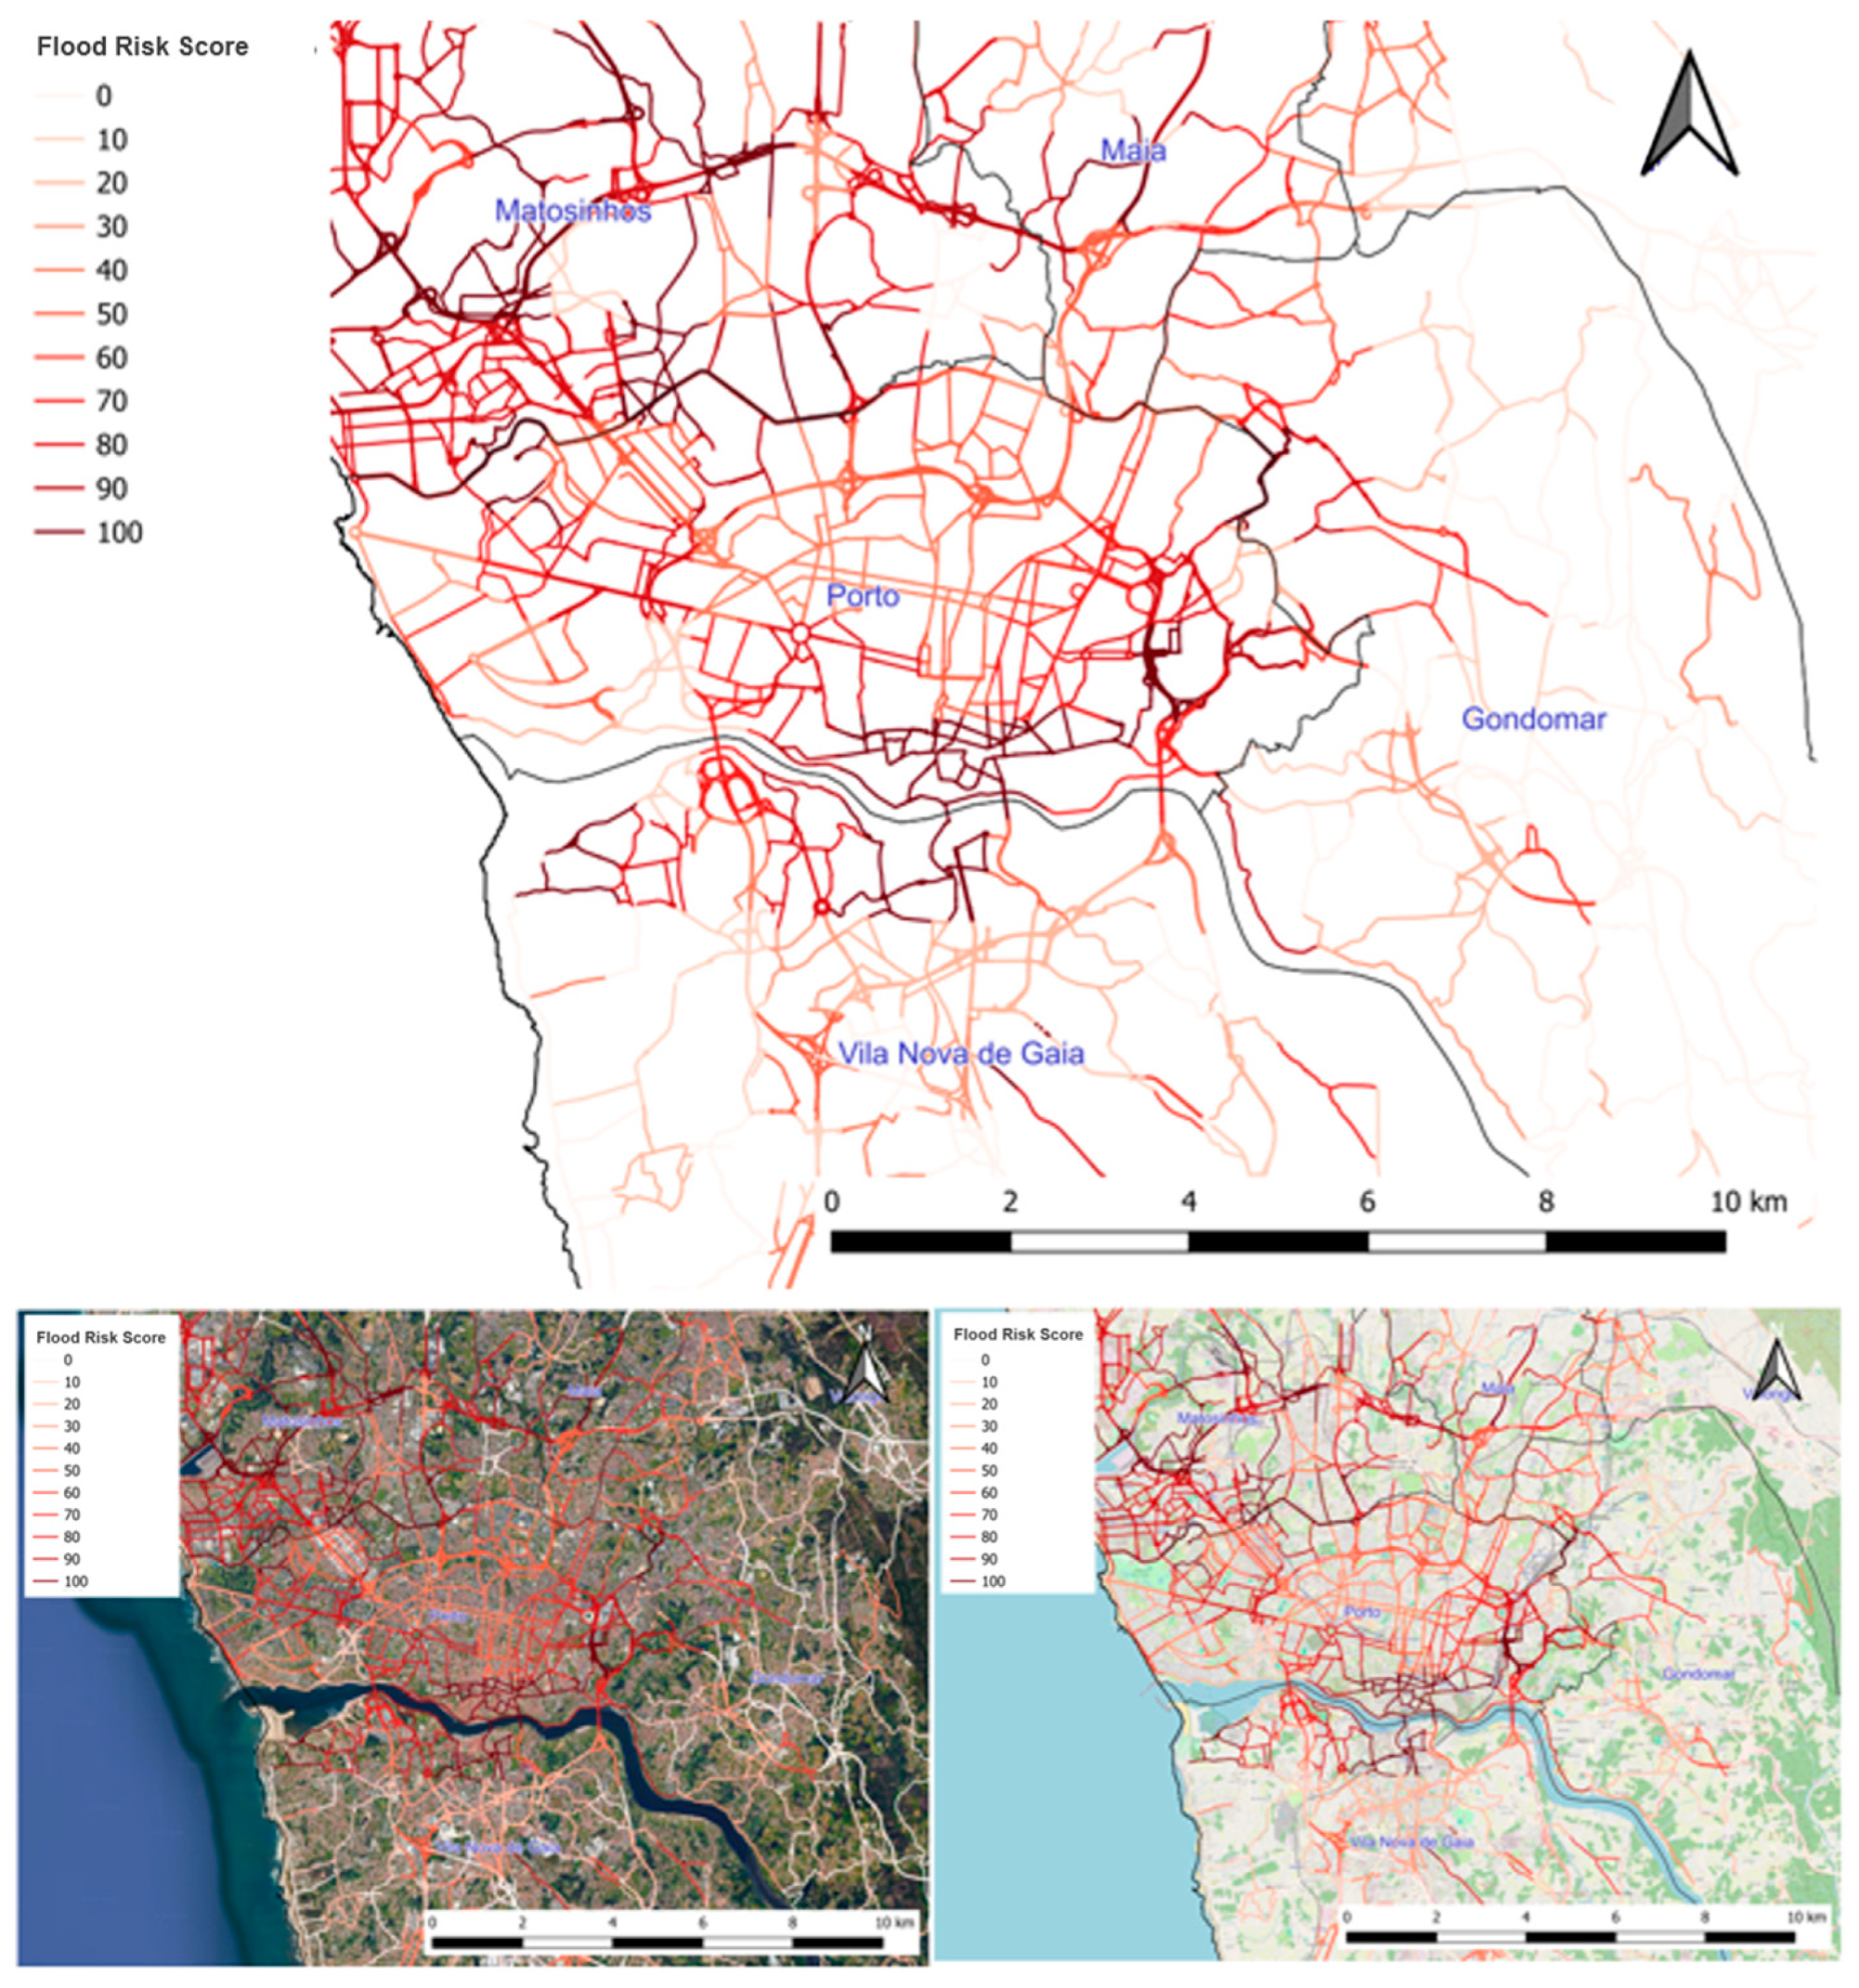
Figure 10 shows the flood risk score for Porto’s roads, as determined by a machine learning Random Forest model. This model predicts flood likelihood based on patterns learned from data. The map identifies city areas with different flood probabilities, scored from 0 to 100, reflecting the model’s analysis of various contributing factors. This information is crucial for preparing for and responding to flood conditions.
Using the insights from
Figure 10, Porto can strategically plan to improve its flood defenses. Roads at higher risk can be targeted for infrastructure improvements, such as better drainage systems, and for creating emergency routes. This proactive planning is essential for Porto to protect its economic stability and the cultural heritage that shapes its character and attractiveness.
Setúbal’s strategic coastal location and its economic reliance on shipbuilding, fishing, and tourism make it particularly vulnerable to flooding. The city’s proximity to the Sado River and the Atlantic Ocean creates unique challenges that require specialized flood risk management and mitigation strategies. Protecting Setúbal’s economy from the negative effects of flooding requires understanding the city’s specific geographical and economic context, using GeoAI and GIS to accurately map flood susceptibility.
Investments in flood defenses and infrastructure resilience are essential for Setúbal to protect its maritime and logistics hubs, ensuring the continuity of economic activities and the well-being of its population. The city’s approach to integrating flood risk assessment with economic and urban planning can serve as a model for other coastal cities. By addressing the socio-economic factors influencing emergency response and infrastructure resilience, Setúbal can enhance its preparedness and reduce the impact of future flood events.
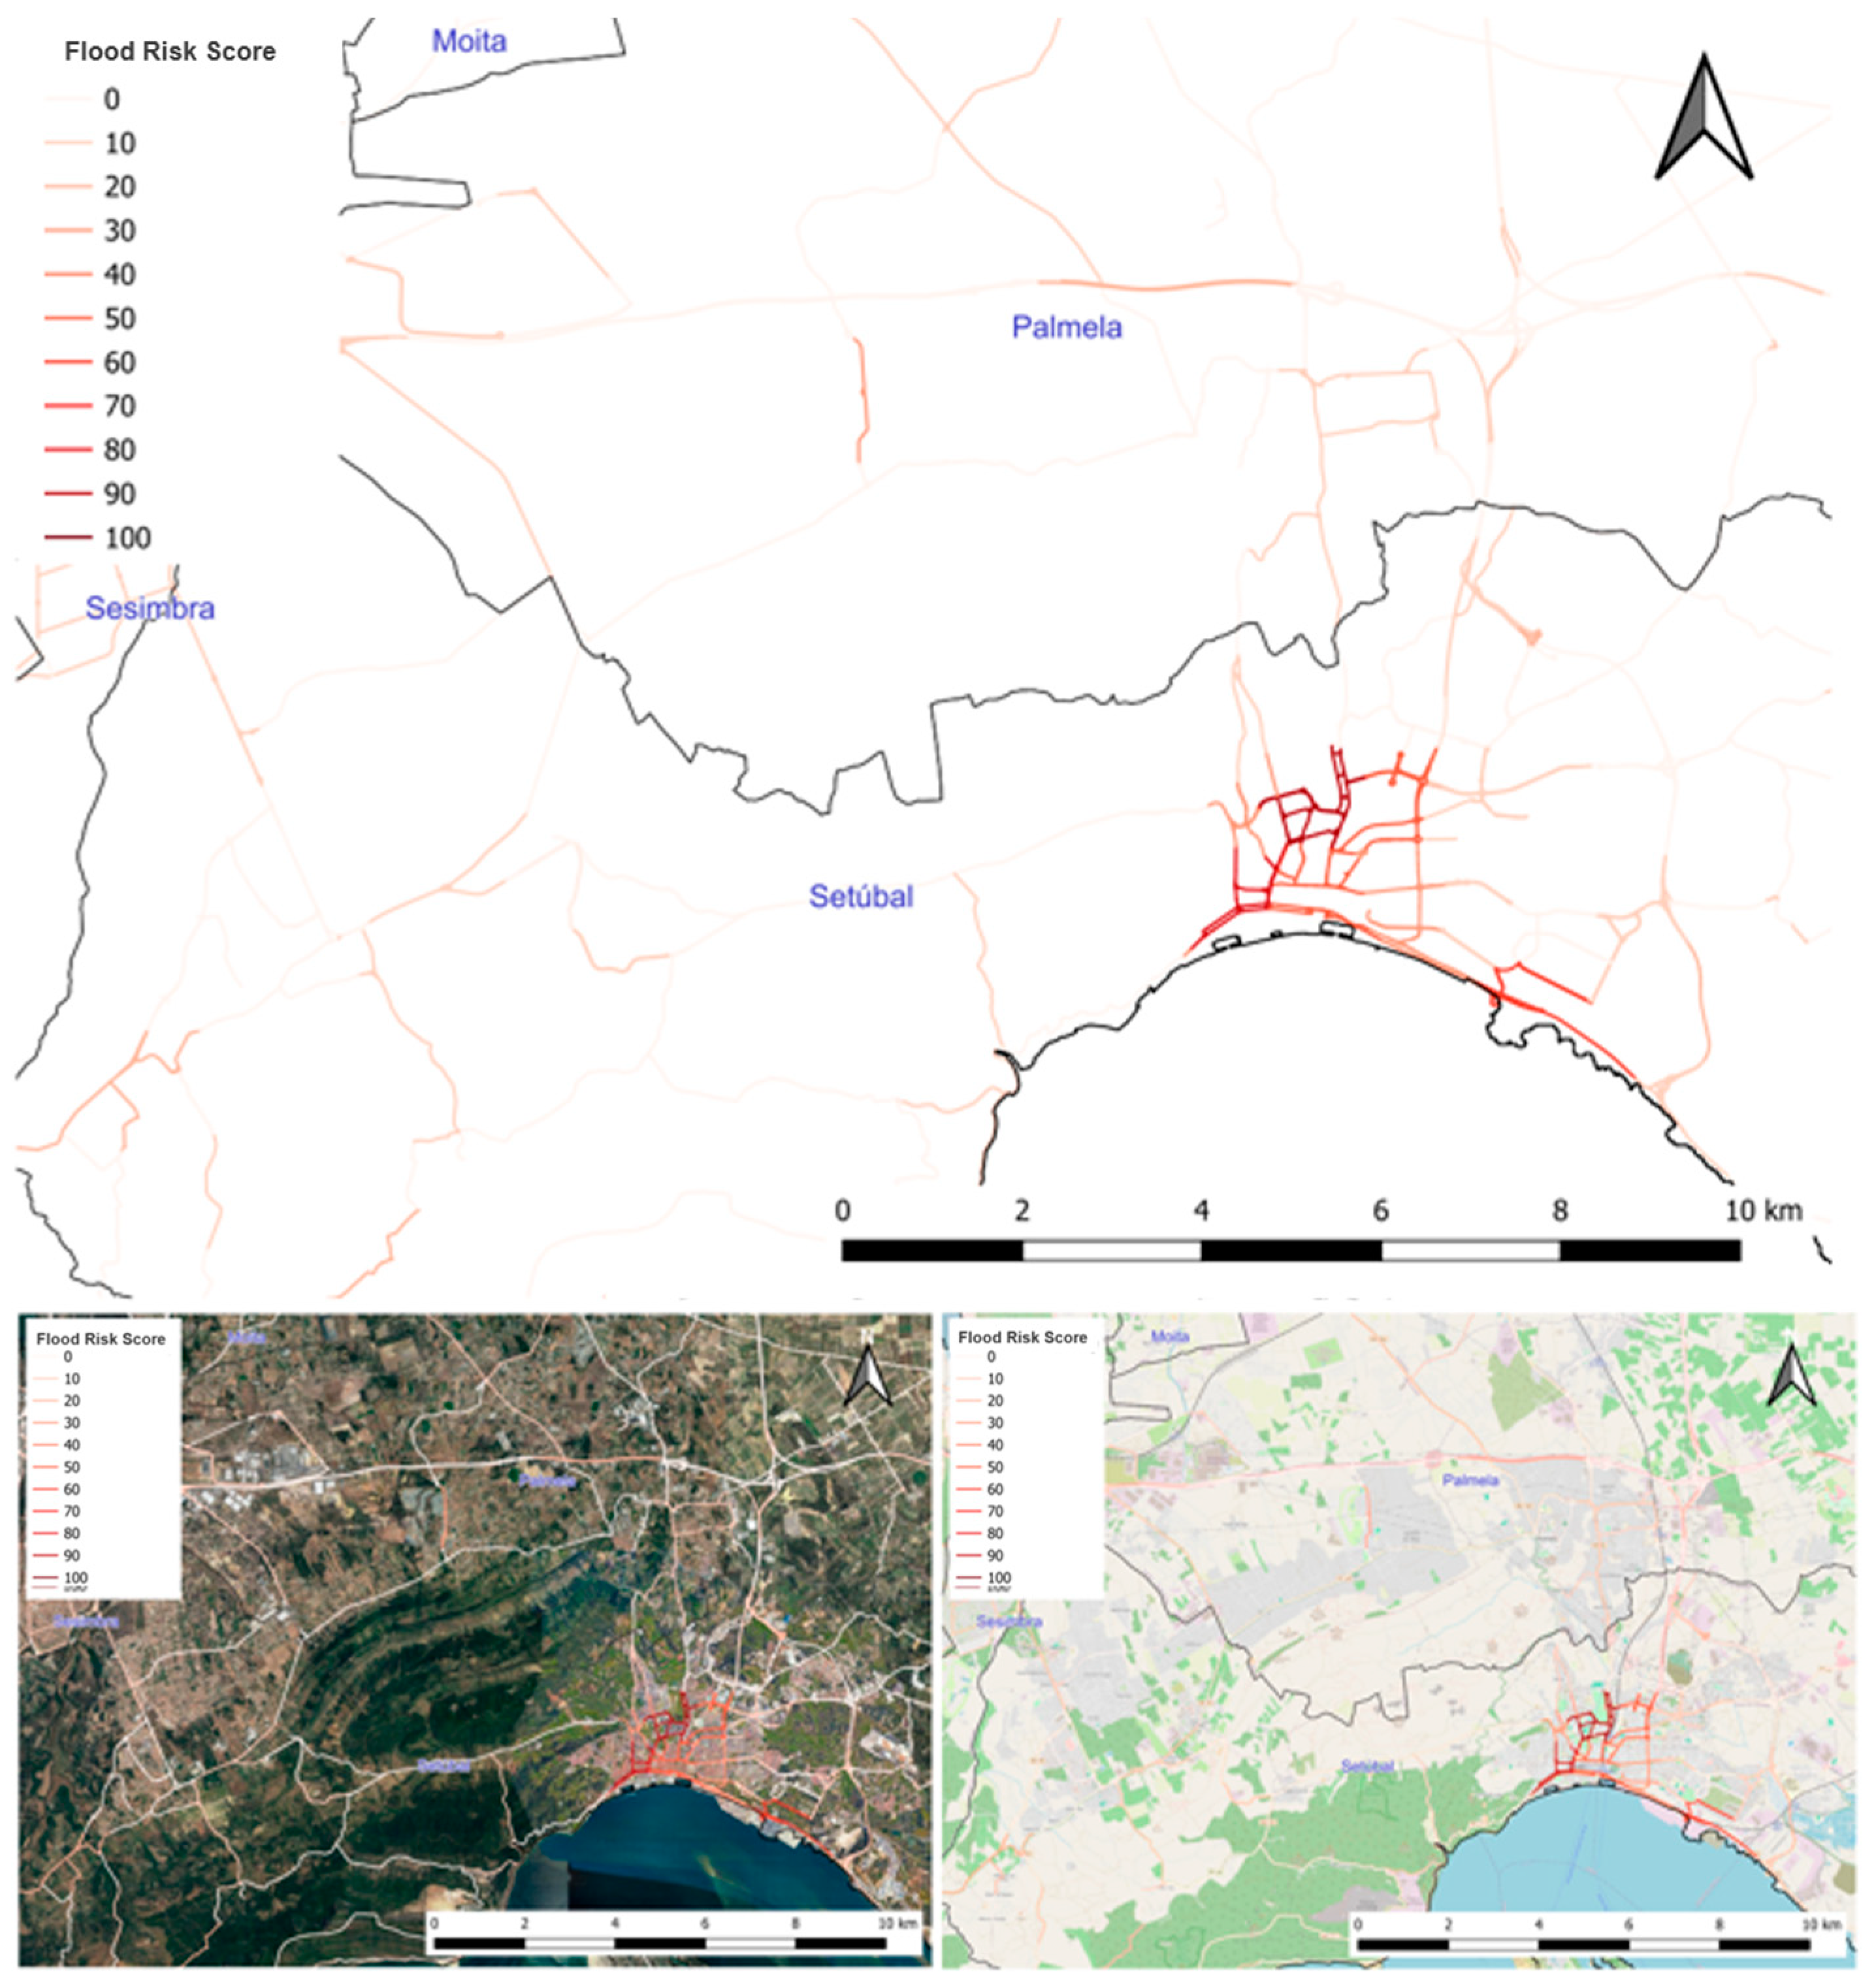
Figure 11 shows the flood mapping for Setúbal’s road network, generated from a machine learning model using Random Forest. The map highlights areas at risk of flooding based on the model’s analysis, which considers various factors. These areas are ranked for flood likelihood on a scale from 0 to 100, helping to identify critical zones.
This figure can inform strategic planning for Setúbal’s flood defense and infrastructure resilience. It can guide where to focus on strengthening maritime and logistics facilities and ensure economic activities and public safety are not compromised by floods. By integrating such data into urban planning, Setúbal can improve its response to flood events and protect its economic sectors and residents more effectively.
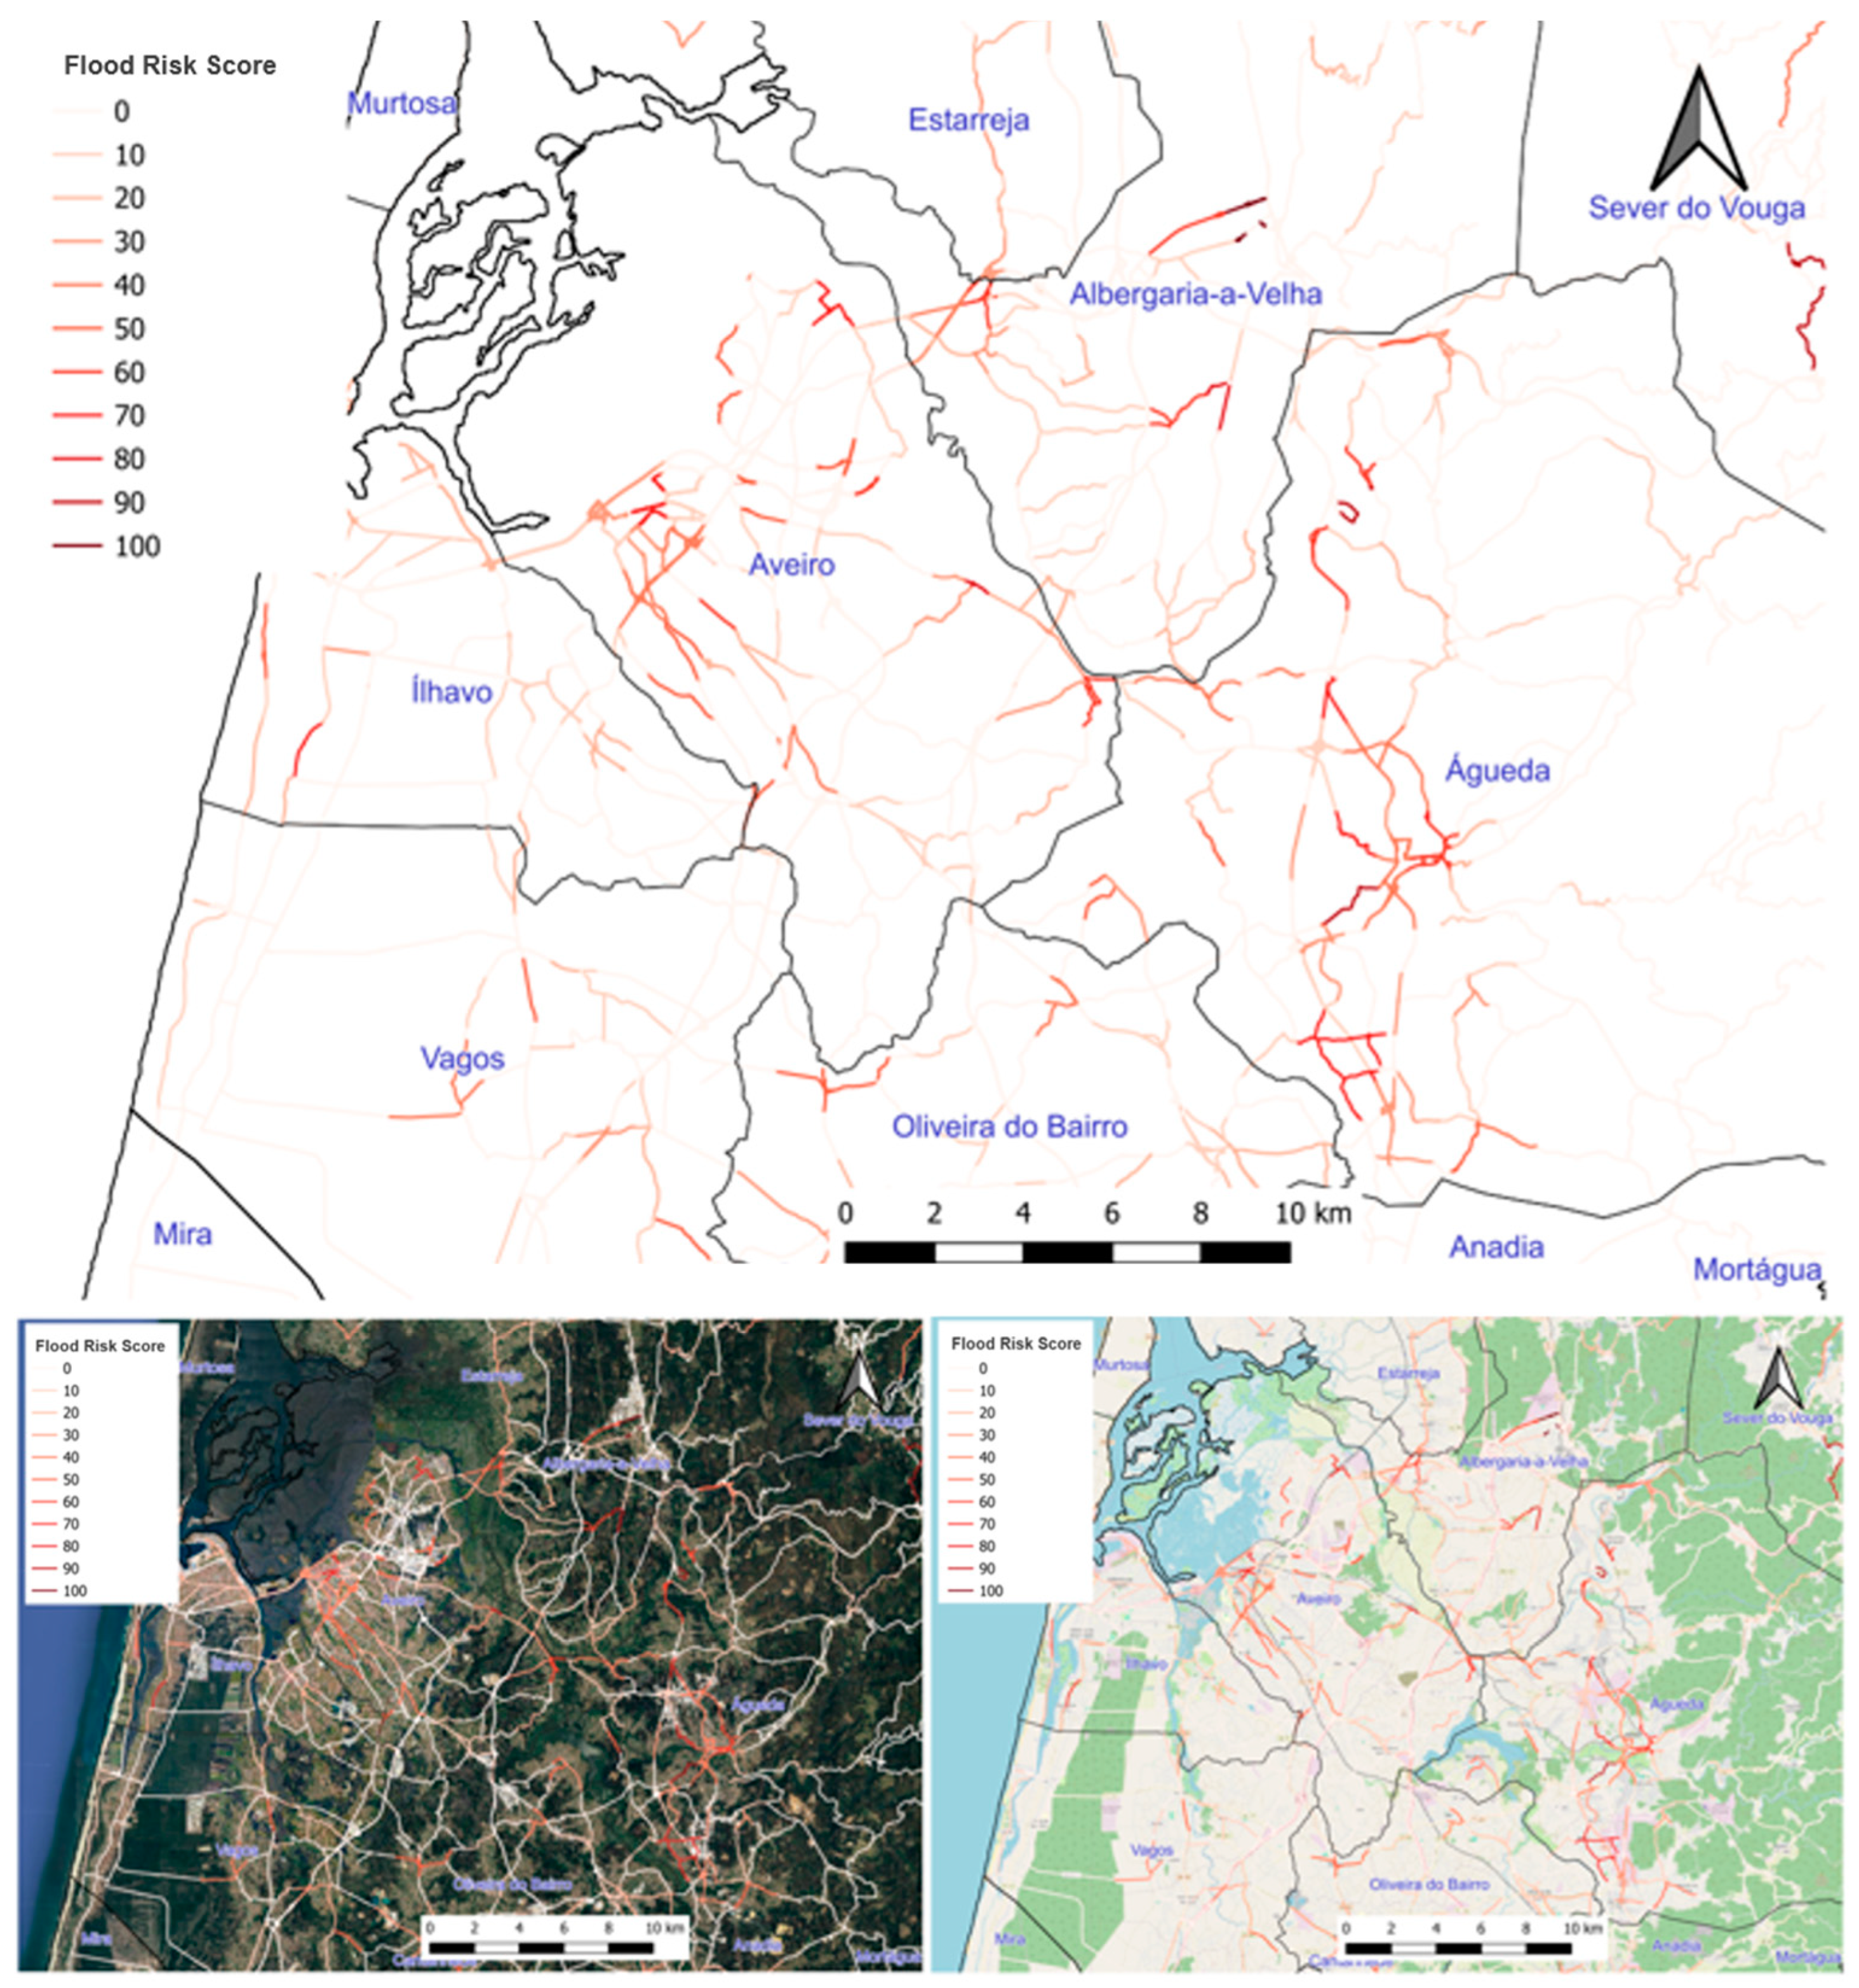
Figure 12 shows the flood risks for roads in Aveiro, using a Random Forest machine learning model. This model calculates the likelihood of flooding by analyzing various factors and presents it on a scale from 0 to 100. The map helps identify which parts of the city’s extensive canal network and road system are at a higher risk of flooding during adverse weather conditions.
Aveiro’s unique network of canals and its vulnerability to both river and rain-induced flooding require innovative approaches to urban and environmental planning. The city’s reliance on water transport and its attraction as a tourist destination increase the need for comprehensive flood risk assessments that consider Aveiro’s distinct geographical features. By using GeoAI and GIS mapping, Aveiro can gain detailed insights into flood risks, guiding the development of resilient infrastructure and effective emergency preparedness strategies.
The challenges Aveiro faces in managing flood risks highlight the importance of considering climate change’s long-term impacts on infrastructure resilience. The city’s efforts to maintain its cultural and economic strength in the face of these risks require a holistic approach to flood risk management. This approach must account for the complexity of Aveiro’s infrastructure, its population density, and its economic diversity, ensuring that the city remains a vibrant and safe place for residents and visitors alike.
This information helps Aveiro strengthen its infrastructure and create better emergency plans, considering how important its canals and waterways are to the city. With this knowledge, Aveiro can prepare better for floods, protecting its historical charm and economic activities. It also helps the city think about how climate change might affect its urban landscape in the future.
The use of geospatial artificial intelligence (GeoAI) and Geographic Information System (GIS) mapping is changing how we assess and manage flood risks. This approach, especially when using machine learning methods like Random Forest, gives us a more accurate way to predict flood and landslide risks based on historical and geographical data. This new method has important implications for improving how we manage flood risks and plan our cities.
The GeoAI model using Random Forest was found to be 96% accurate in predicting flood and landslide risks and 92% when predicting the flood prone roads. This high accuracy means the model was very good at predicting where floods and landslides might happen based on past events and geographical information. The model’s success comes from its ability to understand the complex relationships between different factors that contribute to these events.
This high accuracy is important for several reasons. First, it shows that the model could be a reliable tool for predicting where floods and landslides might occur. This is very valuable for reducing disaster risks and managing emergencies. It allows cities to plan ahead, allocate resources where they are needed most, and warn people in areas that might be affected. For urban planning, this model could help inform decisions about where to build new infrastructure and how to prepare for emergencies.
The model was checked against historical data, including a study by Zêzere that recorded flood and landslide events in Portugal from 1865 to 2020 [
72]. By comparing the model’s predictions with actual events, researchers could see how well the model performed and make it even better. This validation is important because it shows that the model’s predictions match up with real-world events, which makes it more likely that policymakers and planners will trust and use the model.
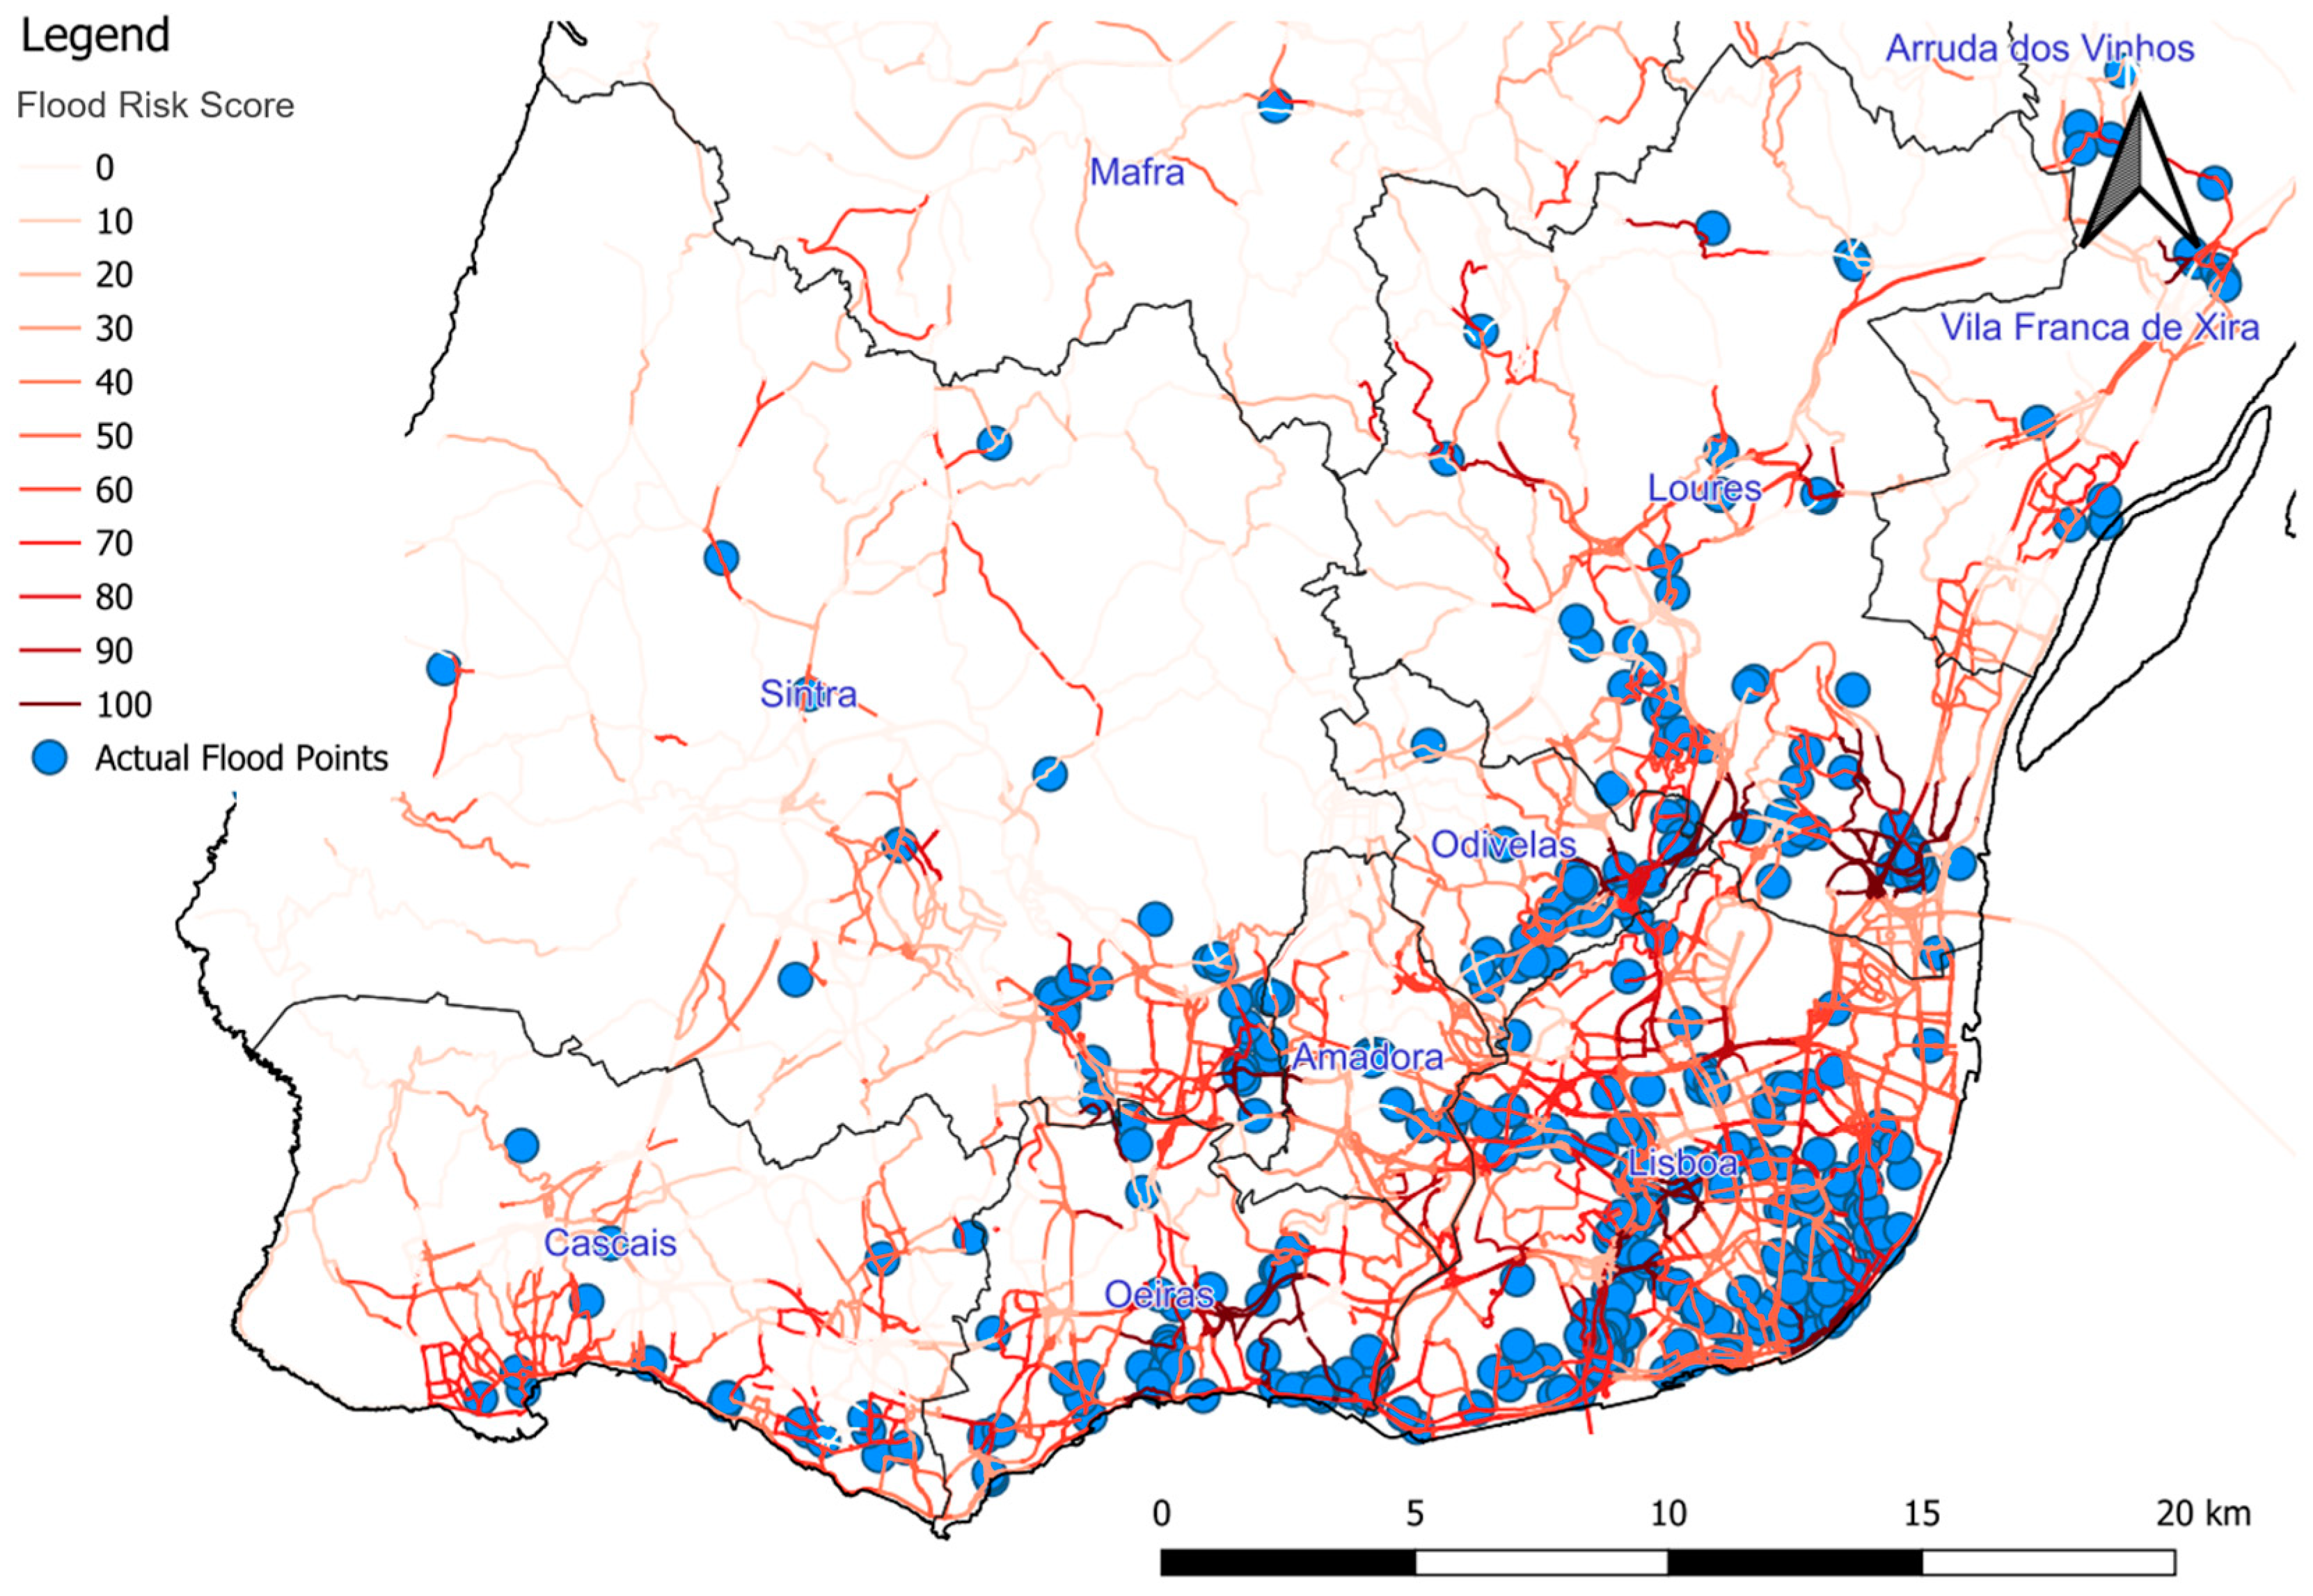
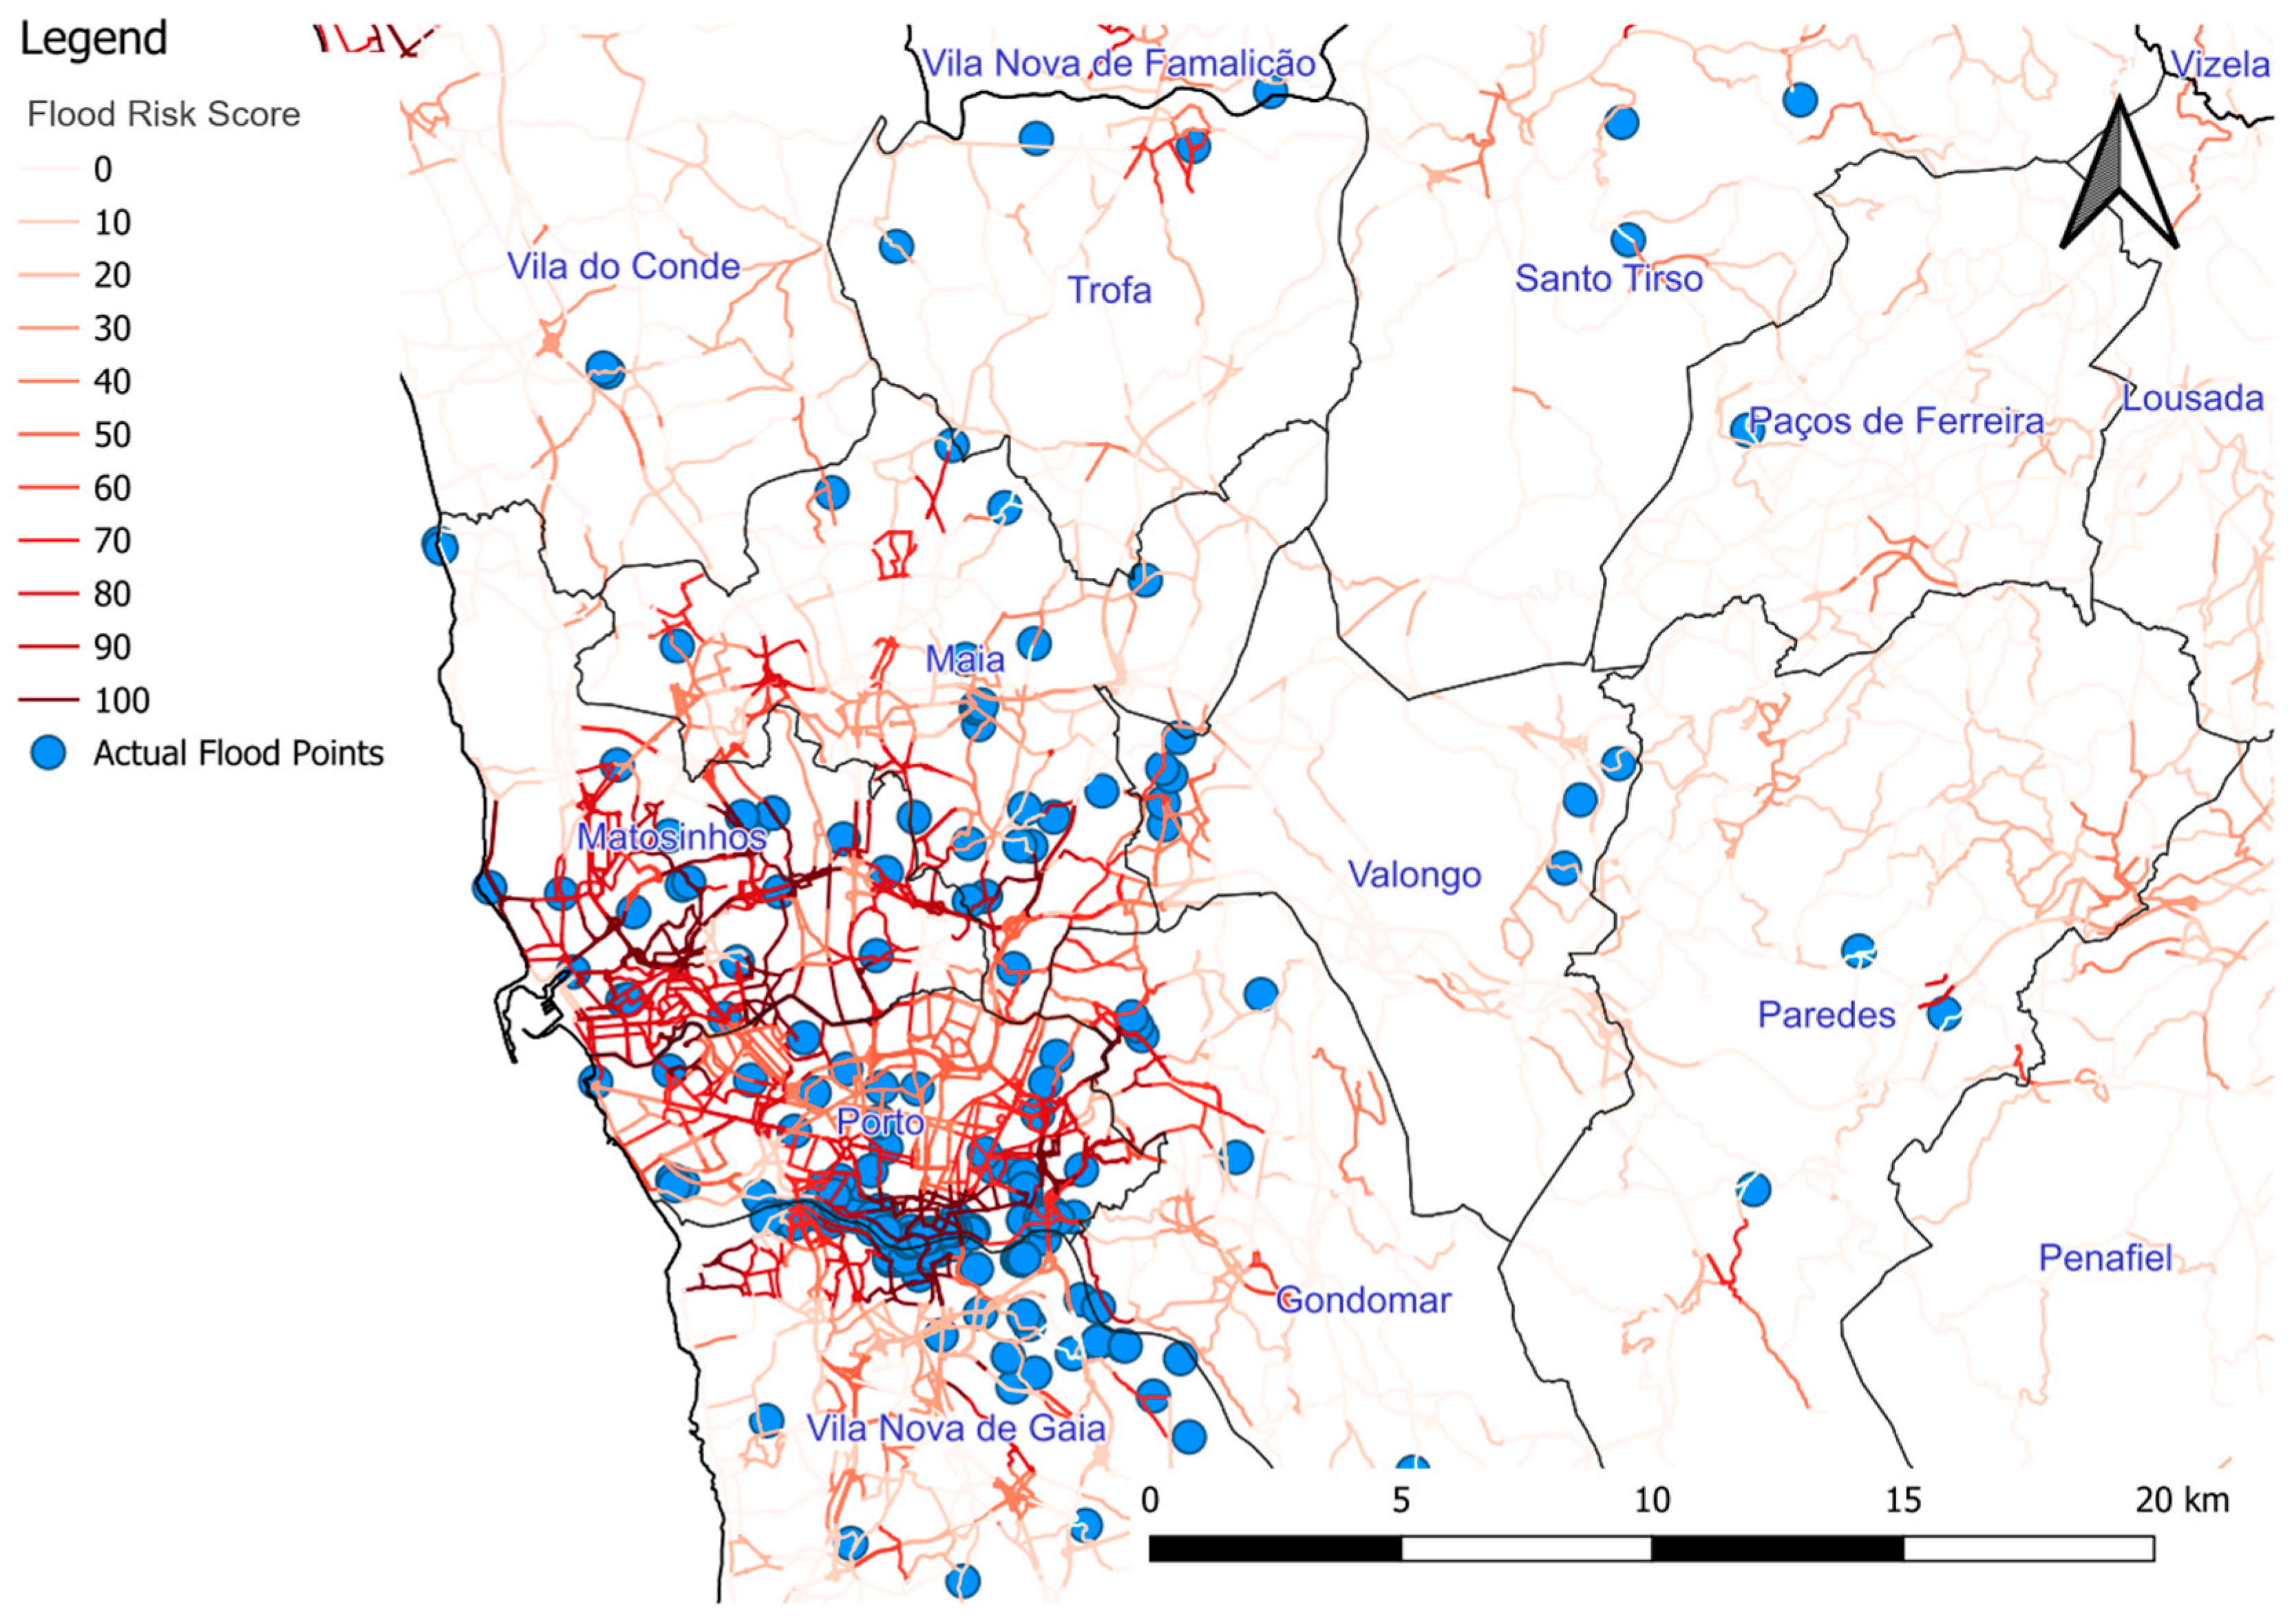
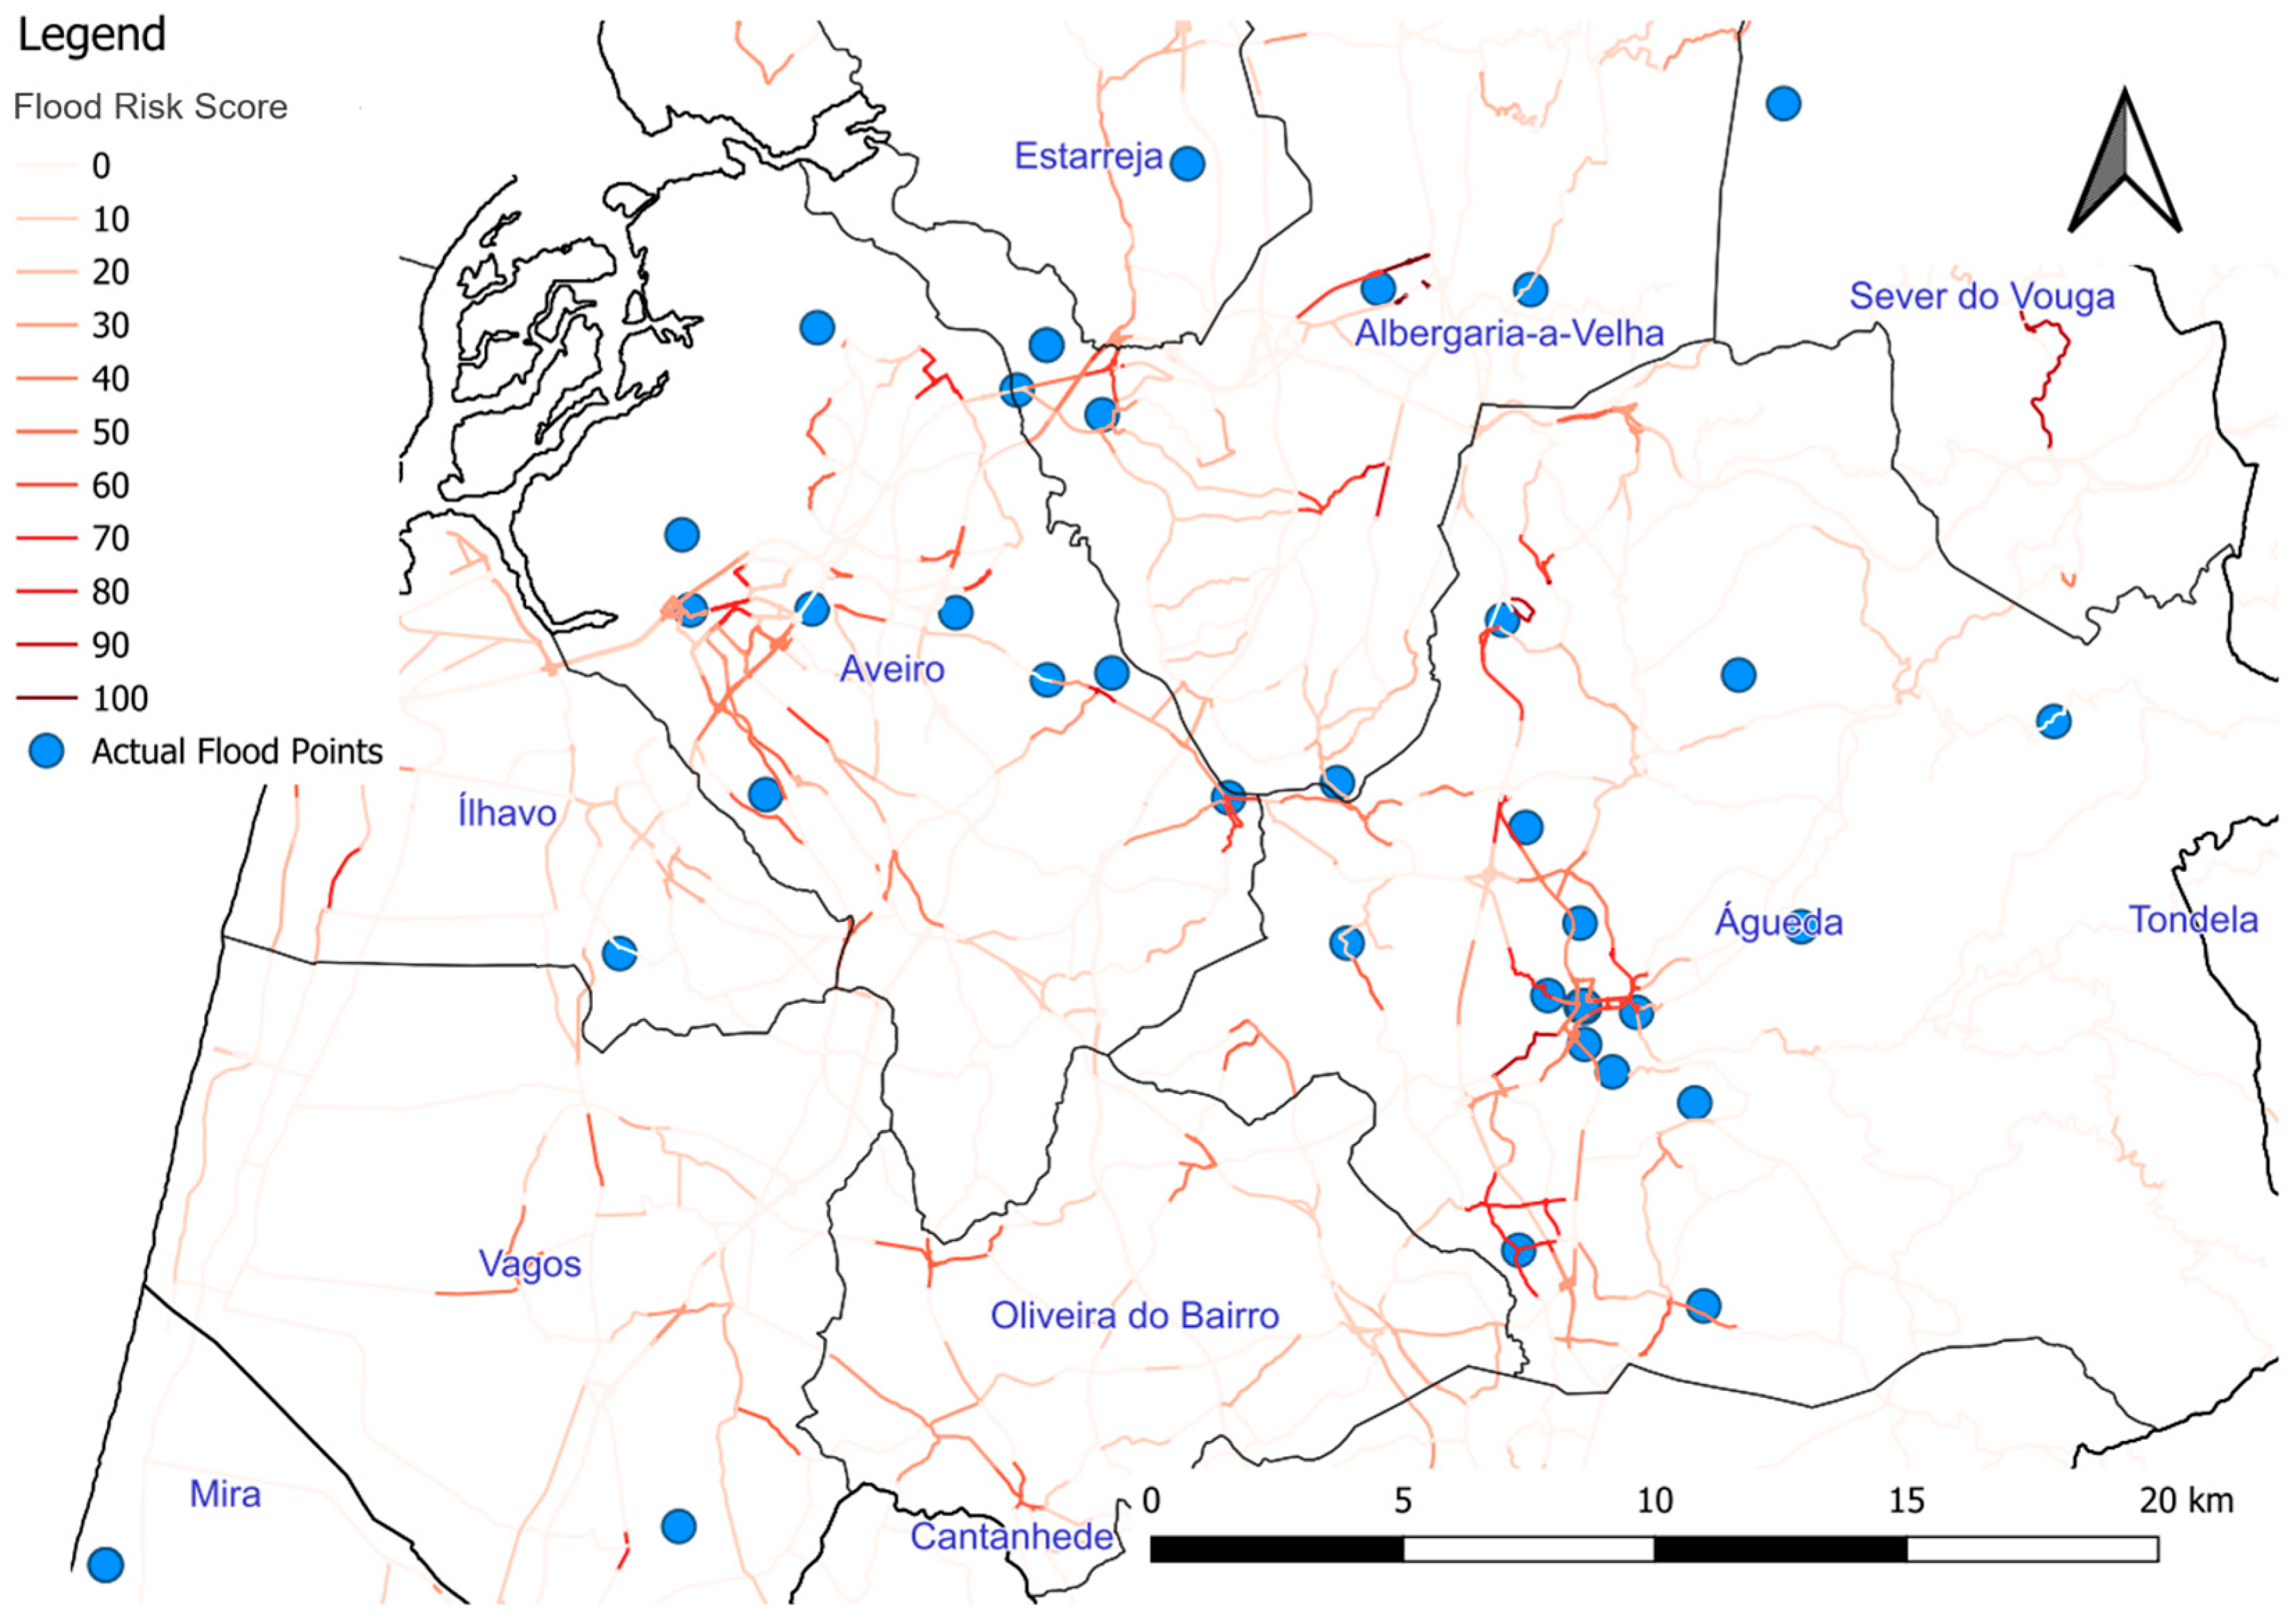
Figure 13,
Figure 14,
Figure 15 and
Figure 16 illustrate how the flood prediction model was tested in four different areas of Portugal. These figures compare where the model predicted floods might happen on roads with where floods actually occurred between 1865 and 2020. This visual comparison in the Lisbon, Porto, Setubal, and Aveiro districts helps to show how accurate the model is at predicting floods.
The validation of the flood risk score model was conducted using a qualitative approach (see
Table 1). We categorized the model’s predictions into two groups: above 50% probability and below 50% probability. These predictions were then compared to the actual flood occurrences, where 1 indicates a flood event and 0 indicates no flood.
The results show that the model correctly predicted 167,386 cases out of a total of 182,616 instances. This translates to an accuracy of 92%, which indicates a high level of predictive performance. The model demonstrates strong capability in distinguishing between flood and non-flood events based on the 50% probability threshold.
It is important to note that while the overall accuracy is high, there may be variations in performance across different probability ranges. A further analysis of specific probability brackets could provide more detailed insights into the model’s strengths and potential areas for improvement.
Table 1 provides a clear overview of the model’s performance, showing the distribution of correct and incorrect predictions for both high and low probability categories. The high number of correct predictions in both categories contributes to the model’s overall accuracy of 92%.
This analysis shows that the predictive model is quite accurate. Areas predicted to have a high flood risk generally had a lot of actual flooding, especially where infrastructure and water systems contribute to that risk. Conversely, areas with low predicted risk experienced fewer floods, highlighting the model’s accuracy. Any discrepancies likely stem from the limits of predictive models or factors not included in the model’s parameters. Looking at the actual flood points compared to the predicted probabilities in Lisbon, Porto, Setubal, and Aveiro provides a detailed understanding of the model’s effectiveness and helps to refine it further.
The GeoAI model’s accuracy, proven by its validation against historical data, makes it a crucial tool for improving urban resilience [
79]. As cities face growing climate change risks, such models provide a strong scientific foundation for sustainable urban living, protecting communities, and ensuring ongoing socio-economic activities despite environmental challenges.
Understanding urban resilience and its role in infrastructure planning is essential for sustainable development and disaster mitigation. Urban resilience is the ability of cities to withstand, adapt to, and quickly recover from disasters, and is increasingly important in urban planning. Flood risk assessments, like those conducted for Lisboa, Porto, Setúbal, and Aveiro, are key contributors [
6,
77]. By understanding the extent of flood-prone roads and connecting this with population data, planners can see where vulnerabilities exist, and which infrastructure is most critical. This data-driven approach helps prioritize infrastructure improvements and design adaptable urban landscapes that can better handle the uncertainties of climate change and urbanization.
Analyzing road networks alongside flood probabilities helps create more resilient transportation systems. Roads are vital for urban centers, essential for moving people, goods, and services. Identifying high-risk areas allows for strategic management, such as building flood barriers or redesigning drainage systems to prevent flooding. Integrating these findings into urban planning tools can streamline resilience building by providing simulations to predict the impacts of various mitigation strategies.
Beyond immediate flood mitigation, this study helps to inform long-term urban development. Zoning laws can be adjusted to limit development in high-risk areas or require flood-resistant designs in new projects. The research emphasizes the need for collaboration between urban planners, engineers, policymakers, and communities to create a holistic approach to resilience [
78]. This collaboration is key to developing a comprehensive urban strategy that reflects local socio-economic needs and aligns with broader environmental sustainability goals.
The model’s findings for the selected Portuguese cities provide a basis for strong policy recommendations. It is crucial to establish an updated flood risk management framework. Policies should require regular updates to flood risk maps and models, incorporating new data on climate change, urban growth, and infrastructure development [
80]. This framework should include an urban resilience index [
81] to measure and compare how well different districts mitigate flood risks, encouraging continuous improvement.
Infrastructure investment should be guided by these flood risk models. Policies should encourage, or even require, strengthening critical infrastructure in high-risk areas. This could include funding for raising roads, improving drainage, and building flood barriers. There should also be a focus on green infrastructure, such as wetlands and permeable pavements, to improve natural water absorption and reduce runoff [
82]. Financial incentives could be offered for private developments that incorporate these features, promoting a city-wide approach to flood mitigation.
Finally, community engagement and public education are vital for urban resilience. Policies should not only address infrastructure but should also build citizens’ capacity to respond to floods. This includes clear communication channels for disaster response, regular drills, and educational programs to raise public awareness. Infrastructure planning must consider the people it serves; therefore, a policy that empowers and prepares communities, especially in high-risk areas, is as important as the physical improvements it prescribes. Through these comprehensive measures, cities can translate model findings into real-world improvements that protect lives and livelihoods from the threat of flooding.
6. Conclusions
This study explores the integration of GeoAI and road network analysis for flood risk assessment in Portuguese municipalities, highlighting implications for infrastructure resilience and emergency preparedness. While acknowledging its limitations, the research proposes expanding the scope to include other infrastructure types, validation in other countries, incorporating real-time environmental data, and conducting cost–benefit analyses of mitigation strategies.
The findings provide a clear interpretation of flood risk across various Portuguese cities using GeoAI and GIS mapping techniques. Each city presented unique vulnerabilities, from high-density population areas to economically significant zones, demonstrating the need for tailored approaches to flood risk management. Lisbon’s analysis focused on critical areas of potential inundation, Porto’s on protecting industrial sectors and historical architecture, Setúbal’s on targeted flood defenses for maritime activities, and Aveiro’s on safeguarding its canal network and waterborne transport systems.
These results underscore the potential of GeoAI and GIS as essential tools in urban resilience and infrastructure development. The assessments facilitate the identification of vulnerabilities, enabling cities to prioritize investments and enhance emergency preparedness measures. The models’ high predictive accuracy across diverse urban landscapes showcases their versatility and applicability, setting a benchmark for future urban planning and disaster risk management initiatives.
The integration of GeoAI and GIS mapping into flood risk assessments has significant implications for enhancing road network resilience and emergency preparedness. By identifying high-risk areas, these tools can guide strategic infrastructure upgrades, reduce service disruptions, and support the development of resilient transportation routes. Early warning systems bolstered by these data can be seamlessly integrated into urban planning and community alert strategies.
GeoAI and GIS insights can optimize the positioning of new developments, formulate effective evacuation plans, and inform data-driven decisions on flood defense investments. These tools can also enhance training programs for emergency personnel and analyze supply chain vulnerabilities. Cross-sector collaboration underpinned by comprehensive mapping is crucial for a unified risk management strategy.
However, the current study has limitations that may impact its predictive accuracy and applicability. The model’s reliance on static data and historical flood information restricts its effectiveness in forecasting unprecedented scenarios. The potential variability in OpenStreetMap data quality and the omission of socio-economic factors further complicate the model’s reliability. These gaps suggest a need for a more holistic approach encompassing economic, social, and environmental considerations.
To enhance the model’s utility, future research should expand its application to other critical infrastructures such as schools, hospitals, power plants, and communication networks. Incorporating dynamic environmental data, including historical, current, and projected precipitation patterns, could substantially refine its predictive capabilities [
83]. A rigorous cost–benefit analysis for implementing mitigation strategies in high-risk areas is also necessary to inform fund allocation and intervention prioritization.
The integration of advanced geospatial analysis into flood risk management represents a shift towards more informed and strategic planning. The continuous refinement of these analytical tools, including the incorporation of additional data layers and sophisticated algorithms, will further empower decision-makers to anticipate flood events and take proactive measures. This ongoing development aims to transform flood risk management, enabling the precise identification of high-risk areas, optimizing resource allocation, and guiding the development of robust mitigation strategies to safeguard communities and their critical assets.

