Abstract
This paper introduces an intelligent model that combines military expertise with the latest advancements in machine learning (ML) and Geographic Information Systems (GIS) to support humanitarian demining decision-making processes, by predicting mined areas and classifying them by mine type, difficulty and priority of clearance. The model is based on direct input and validation from field decision-makers for their practical applicability and effectiveness, and accurate historical demining data extracted from military databases. With a survey polling the inputs of demining experts, 95% of the responses came with an affirmation of the potential of the model to reduce threats and increase operational efficiency. It includes military-specific factors that factor in the proximity to strategic locations as well as environmental variables like vegetation cover and terrain resolution. With Gradient Boosting algorithms such as XGBoost and LightGBM, the accuracy rate is almost 97%. Such precision levels further enhance threat assessment, better allocation of resources, and around a 30% reduction in the cost and time of conducting demining operations, signifying a strong synergy of human expertise with algorithmic precision for maximal safety and effectiveness in demining.
1. Introduction
Humanitarian demining is a complex and high-stakes process; it includes complicated decisions at every step for safe and effective mine-clearance operations. This would require the decision-makers from demining authorities and organizations to identify, from historical data and current intelligence, what the most likely mine locations are [1], along with the types of mines found there and the hazards associated with them. This should also ensure that there is a cautious balance of operational efficiency, safety, cost and potential socioeconomic benefit weighed against clearing land for safe use. This is a process dependent on knowledge and expertise, executed by military and demining professionals with a mix of conventional knowledge and information-processing approaches such as GIS and ML to assist them in rapid and efficient decisions. Thus, humanitarian demining is not only about removing mines, but it is also an attempt to produce sensitive and strategic decisions that focus on human life and community restoration.
Landmines are types of explosive devices left concealed or camouflaged on the ground. Their main aim is to kill or injure enemy soldiers and incapacitate vehicles and tanks that move close to or over them. Broadly, there are two major categories of landmines:
- Anti-personnel landmines: These mines are designed to explode when as little as two kilograms of pressure is applied, or when a person steps on or disturbs them. They have caused great suffering in the past decades and are prohibited under the Convention on the Prohibition of the Use, Stockpiling, Production, and Transfer of Anti-Personnel Mines and Their Destruction [2].
- Anti-vehicle landmines: These mines are specifically designed to target vehicles and tanks. They have different mechanisms for detonation and are intended to disable or destroy armored vehicles [3].
Landmine clearance is carried out by special demining teams. The process includes the survey and mapping of the area, marking, and fencing against accidental entry. Additionally, the process directs the clearance teams when mines are first detected and then disarmed or destroyed before the land is released to the owner [4]. Landmines pose a big threat long after the conflict has finished; natural phenomena such as rain, the movement of soil, growth of vegetation, or forest fires make clearing even harder, and the deminers are exposed to a still bigger threat. Other challenges include vegetation [5], which involves large-scale efforts in clearing, especially in high-vegetation and dense areas. Careful attention must be paid to activities while demining so that ecology is not harmed. Landmines threaten Lebanon with real and massive danger. All the parties involved during the Civil War placed them all along the southern border and into the country. The southern border is almost totally covered with anti-personnel and anti-vehicle mines. Lebanon is among 162 countries that have joined the Mine Ban Treaty. The Lebanese Mine Action Center (LMAC) [6] is the national authority charged with the task of conducting and directing supervision of the humanitarian demining process in Lebanon.
In this regard, this paper seeks to determine if machine learning methods, together with GIS and under the supervision of military experts, can help solve the problem of demining in Lebanon. The focus is on the proper identification of anti-vehicle landmines within mined areas, and, second, the classification of those areas according to socioeconomic factors. The study then goes on to develop a predictive model based on direct feedback from the decision-makers for safe demining. Therefore, military officers are key collaborators in ensuring that in general, the model is practical, expert-approved and easily understood. Their feedback emphasizes the originality and importance the model has for better decisions on demining.
The work presented in this paper is an extension and amelioration of the work carried out previously in Reference [1] titled “A location-based model using GIS with machine learning, and a human-based approach for demining a post-war region”. In that work, the input features used to train the model were extracted from local databases (land use, transportation and 3D data), military features were included (related to the confrontation lines and observation posts), and the main target feature was the area classified as mined or not, for which the data sources are the clearance reports filled by military experts working in demining in Lebanon more than 20 years ago, and as the main author is one of those experts, we obtained access to that military data. Two target features were added difficulty and priority of clearance to tackle the socioeconomic side of humanitarian demining. The process is further explained in Section 3.1 titled “Background Model”.
Technically, the extended model includes a new military-specific feature (added to the variables list from previous work [1]) that relates to distance calculations from an observation post, which deepens the respective military contextual analysis in terms of the mine location. We also fine-tuned past work on the classification of cleared areas by difficulty of clearance with more consistent and strong results [1], by including the vegetation type as a primary feature to classify by difficulty of clearance, along with the slope and elevation, and lowering down the resolution of the digital surface model to obtain smoother results. If an area contains high vegetation and is hard to access, its clearance is more difficult. This improvement would enable the model to reflect socioeconomic considerations and lead more effectively to proper and strategic resource deployment for the mine-affected areas. These are technical enhancements, based on practical suggestions by demining experts, that further improve model accuracy and make the results truly useful, bringing a technological edge to human needs.
The rest of the paper is organized as follows: Section 2 discusses related work, Section 3 summarizes the referenced and proposed models, Section 4 presents the implementation principles, and Section 5 illustrates the experiments and analyses of the results. Finally, Section 6 concludes the paper and suggests future directions for research.
2. Related Work
Using ML algorithms to analyze big, unstructured spatial datasets can help GIS experts identify new patterns and relationships within that data that conventional GIS methods cannot detect [7,8]. Combining GIS with ML is a growing trend. ML can extract and classify land coverage and land use from satellite or aerial imagery [9], and pinpoint regions susceptible to natural disasters [10,11] and flooding [12]. The combination of GIS and machine learning is used in several studies to forecast occurrences of rare events, including areas with landmines [13] with an accuracy of 89%, earthquake vulnerability assessments [14] with an accuracy of 96.2% and wildfire [15] with an accuracy of 88%.
To the best of our knowledge, context-based demining operations have only been considered in one paper [1], with an accuracy rate of 97.5%. An analysis of landmine-detection techniques and deep learning has been presented [16], concentrating on integrating deep learning to enhance their accuracy and learn how to apply GIS and ML to optimize demining equipment usage. By combining GIS tools and remote sensing techniques, another study [17] assesses the impact of demining operations in a different way, emphasizing the negative effects of mechanical demining on the soil as its usage resulted in a significant change in land cover. The use of drones equipped with magnetometers and ground-penetrating radars is another approach for detecting landmines, but the effectiveness of these methods is restricted by the capabilities of the sensors used and the properties of the soil [18,19,20,21]. After using historical data and machine learning to predict the main mined areas, we will consider drones as a complementary tool to identify potential mine locations.
Most of these studies, if not all (except for our previous paper [1]), do not consider military expertise, which is a significant drawback because mining and demining are military-based operations. Some of the studies mentioned above addressed the issue of demining, but none of them address particularly the prediction of mined areas and identification of different types of landmines, and the socioeconomic classification of those areas by difficulty and priority of clearance. Additionally, there is a need for a decision-based approach to the demining process, taking into account the socioeconomic factors involved. This requires a classification system based on the priority and difficulty of clearance.
It is at the crossroads of military expertise and technological innovation and lays down a scientific line of force: the association of ML and GIS with human expertise in the field of demining. Such integration seeks to amalgamate algorithm accuracy with problem subtlety through the experienced eyes of the demining officer. In this context, there is a dual approach: the first is the aggregation of military-based variables related to observation posts to better converge the approach to the problem. Second is a further refinement of the existing model so that more uniform classifications are made by adjusting the vegetation weight in predictions of the mined area from one side, and the reduction of the effect of minor terrain undulations on the assessment of elevation and slope from the other side. Moreover, we expand our predictive capability to detect anti-vehicle mines more explicitly, which we have realized clearly carries great danger with socioeconomic implications. In addition, expert supervision within the loop of expert demining is a quintessential part of our strategy. Such continuous engagement will not only validate the outputs of the machine learning processes but also open the possibility of further increasing the operational applicability of the findings. It also takes into account this continuum of development not only in the technological fields but also in practical, field-tested expertise for development, and in the loop of the decision-making demining process.
3. Model Principles
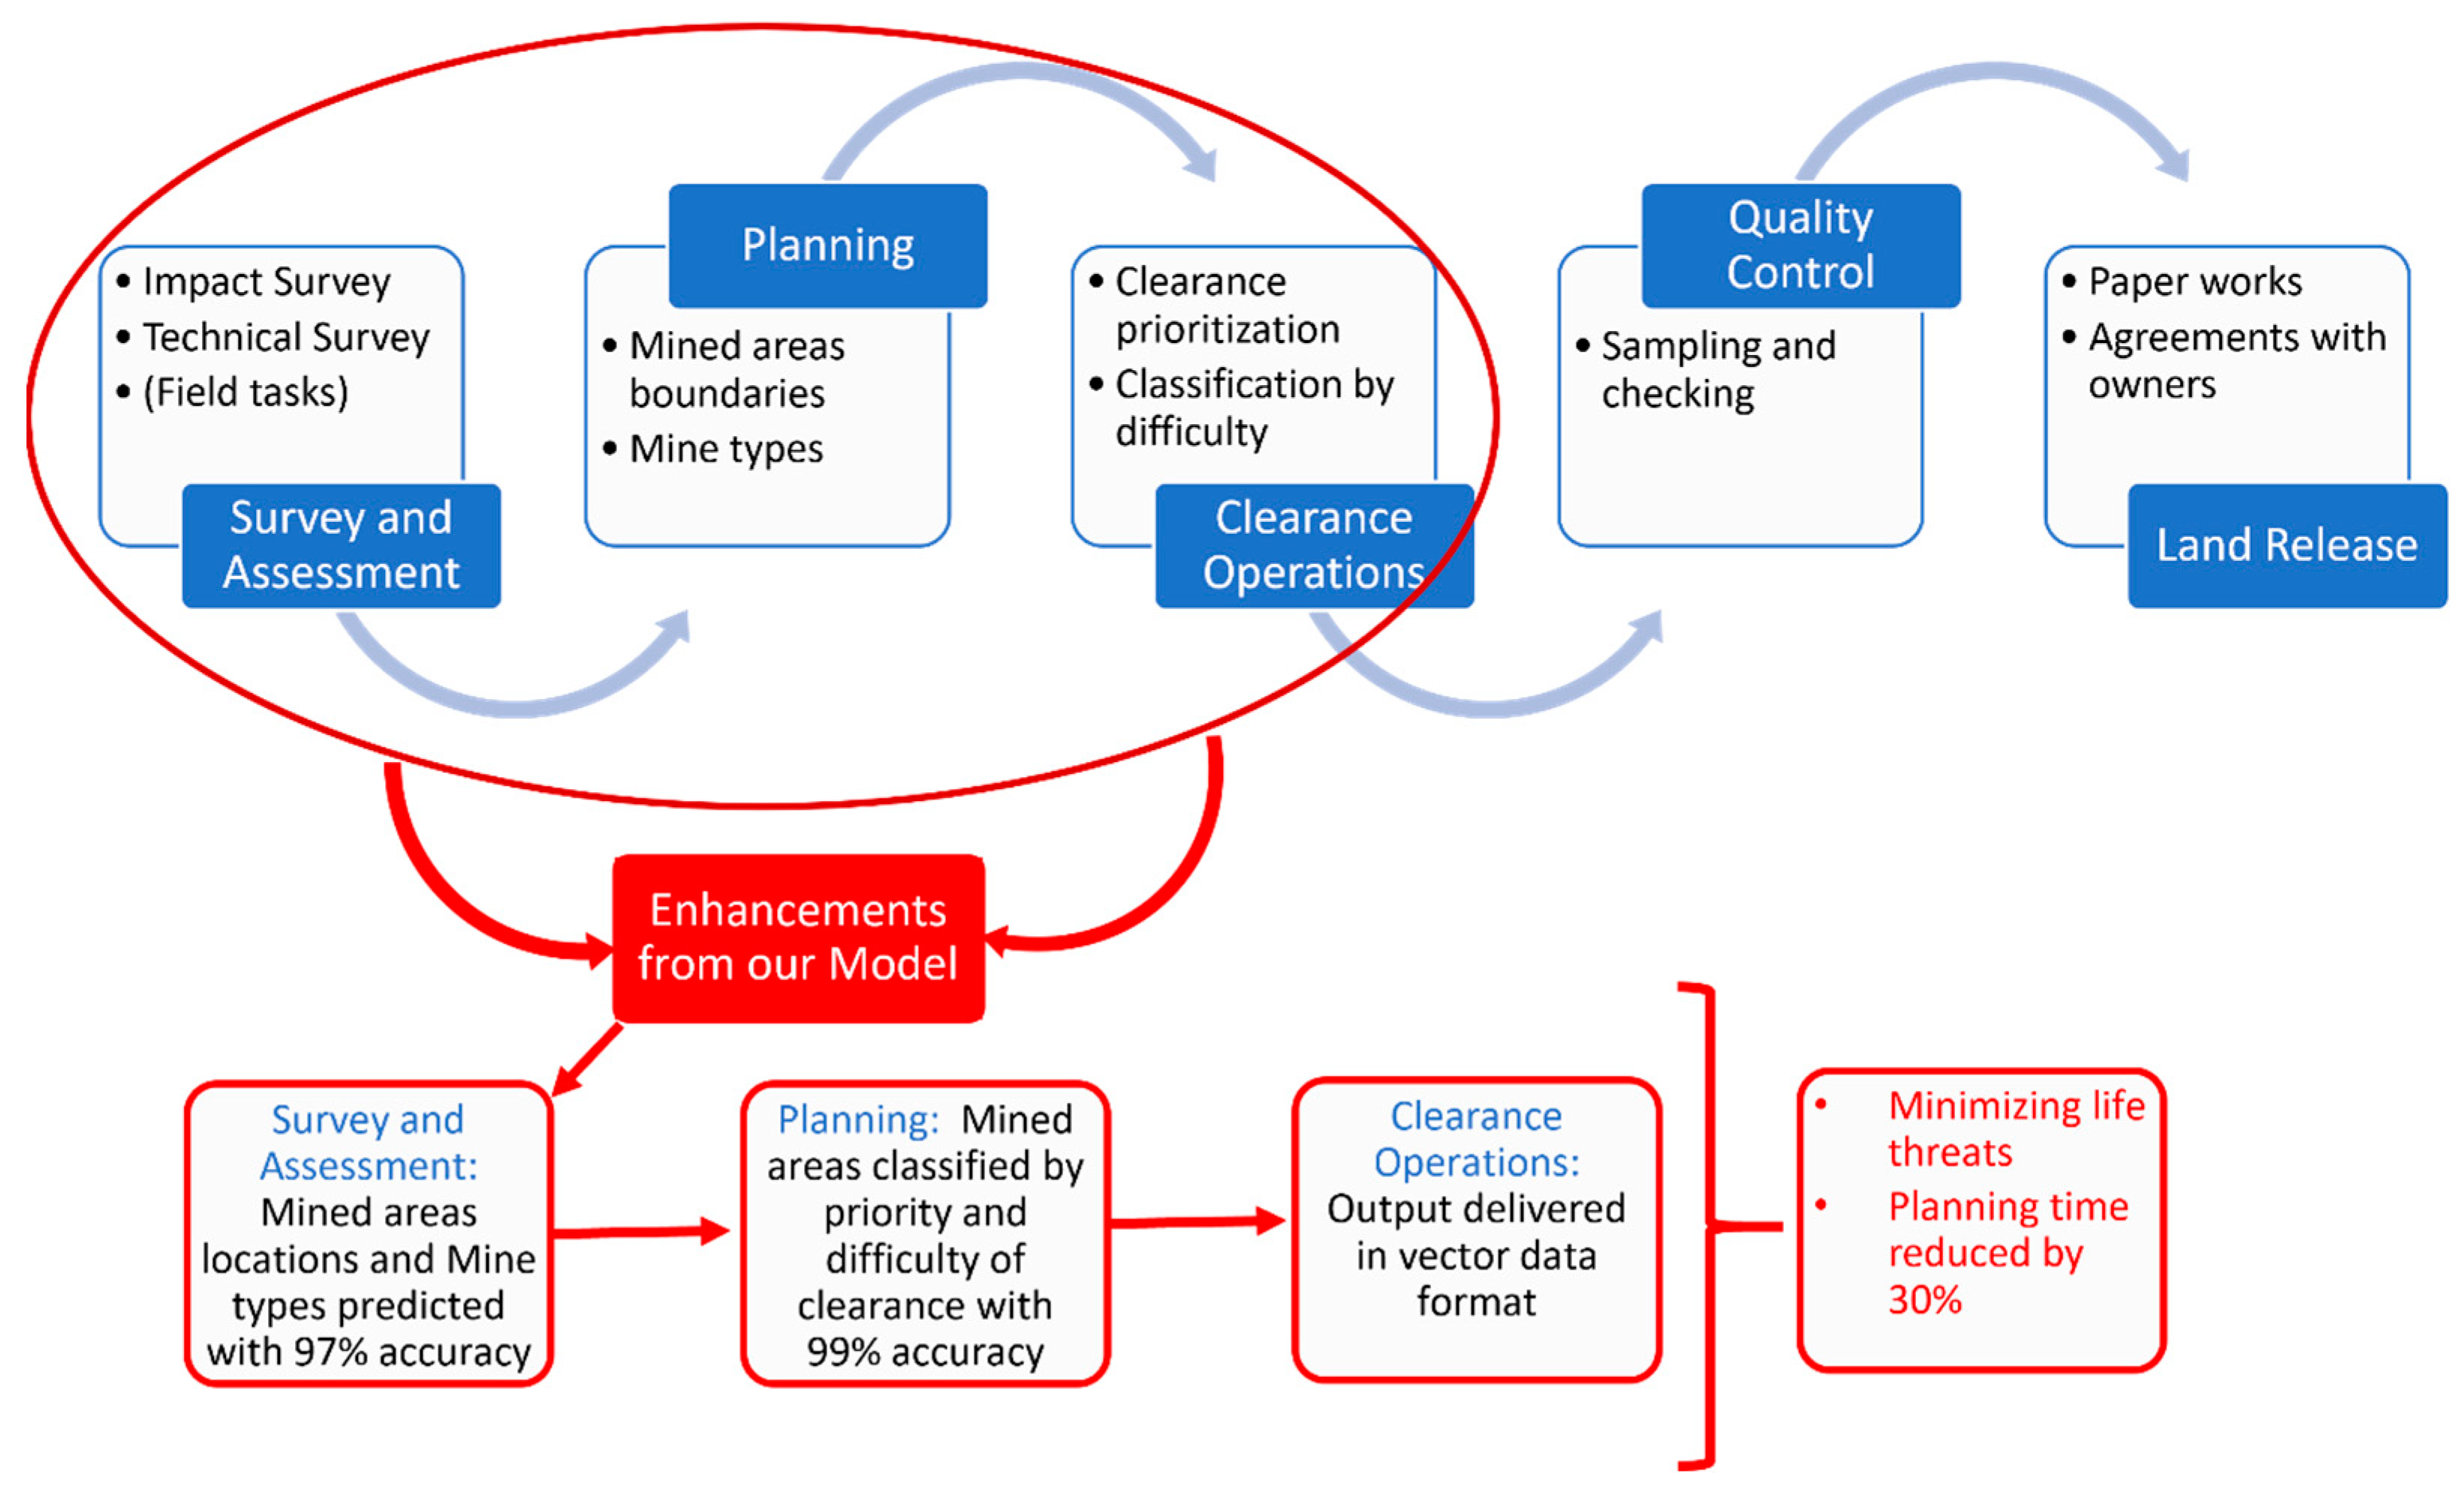
The process of demining starts with a survey and assessment where the polluted area is defined by performing an impact survey (first level) where the general areas specified as dangerous areas are defined and a technical survey (second level) where the perimeters of the minefields are defined, then the decision-makers evaluate the threats, classify the areas, plan the missions and assign the tasks to the demining organizations to start the clearance operations. Finally, a quality-control check is conducted, and the cleared land is released to its owner. Figure 1 illustrates the humanitarian demining process and the enhancements provided with our model in the matter of minimizing threats to lives and reducing planning time.
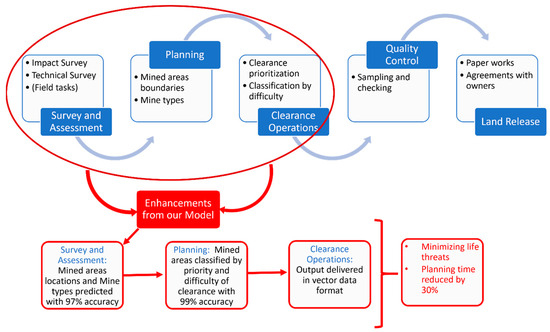
Figure 1.
Demining process and extensions.
The demining activities in Lebanon started around 20 years ago, and most of the country is cleared and the relative clearance reports have been generated. Impact (or first-level survey) and technical surveys (or second-level survey) have been carried out all over the country, and as a result, the perimeters of the mined areas are well-defined. After those surveys, clearance activities took place, and for each minefield, the exact number, location and type of cleared mines were recorded, and the perimeter of the minefield was updated. Clearance has almost been completed all over the country. As a military officer who is EOD (Explosive Ordnance Disposal) and IED (Improvised Explosive Device) qualified, the main author had access to those detailed clearance reports, and the data extracted were integrated within the GIS system as a target feature (mined or not mined area) to train the model and give accurate predictions. Next, the ML algorithm was executed and the predictions were made and verified on unseen data, and confirmed by military experts.
Our approach starts by defining the military situation including the observation posts and the confrontation lines in the post-conflict zone and specifying the study area surrounding those lines. The military-based variables introduced in Reference [1] are visibility from the observation posts and distance to the confrontation line. In the current study, we added a new variable: the distance to observation posts.
We shall, in the section below, outline the methodologies in the referenced model, emphasizing the approach to data preparation, data processing and result interpretation. We shall also highlight new extensions and innovations introduced by us in the current approach and the proposed model. These categories include critical evaluation, mine-type classification and the introduction of a new feature.
3.1. Background Model
In [1], data preparation is performed with military-qualified personnel that defines the military variables: confrontation lines and observation posts in the post-conflict zone. A study area is selected covering an offset distance up to 1 km from the confrontation lines and divided into small samples (10 × 10 m), and the required features are valued by extracting data from local databases (LMAC and National Database). The selected features are as follows: slope, elevation, visibility from observation posts, distance to confrontation lines, distance to urban areas, distance to agricultural areas, distance to forests, distance to desert areas, distance to roads and population density. The target features are the following: mined, difficulty of clearance, and priority of clearance. The mined class is extracted from the clearance reports and given a value of 1 if the sample belongs to a mined area, and a value of 0 if it belongs to a clear area. Classes related to priority of clearance are filled as an aggregation of weights related to distances from different land aspects (roads, agricultural areas, urban areas, etc.). In contrast, for the classes related to difficulty of clearance, only slope and elevation are applied.
The data are then processed to train the ML algorithms. Three ML techniques (Support Vector Machine (SVM), Random Forest (RF) and Extreme Gradient Boosting (XGBoost)) were applied and compared. The accuracy metrics were, respectively, 95.5%, 97.5% and 94.1%. The RF algorithm, which yielded the best results in predicting mined areas, was subsequently used to categorize the affected regions based on clearance priority and difficulty. The results are then interpreted and analyzed, providing clearance organizations with good resource allocation for their operations.
In order to consider the opinions of demining experts about the referenced model, discussions were held and they all agreed (by 95%) that it is a great assistance for demining operations in terms of reducing threats, enhancing personnel safety and planning missions. However, they did find a drawback in the output’s heterogeneity regarding the classification of clearance difficulty (by 70%). The results showed a variety of classes within relatively small areas due to the usage of a high-resolution DSM (Digital Surface Model) that recorded tiny changes in slope, which was the main factor used to train the model on difficulty classes.
3.2. Extended Model
The extended model introduces a novelty by including a new classification based on mine types, incorporating a new feature (distance to observation posts) to improve accuracy, refining the existing model’s output in the classification by difficulty of clearance, and most importantly validating the output with certified officers who accredited the novelty of our work and the socioeconomic importance of the classification we made.
3.2.1. Usability Study and Critical Evaluation
Our model is built in close cooperation with leading professionals and decision-makers in the field of humanitarian demining represented by demining authorities, or x-officers working in demining organizations. It delves deep into the important role of human expertise in demining, whereby it brings out how to harness the insights of military officers integrated with advanced ML and GIS to boost the prediction and classification of mined areas. This is an invaluable contribution from the point of view that officers with a lot of experience in demining offer them invaluable knowledge in making more exact predictions about mine types and location and setting up priorities for demining operations in relation to the difficulty level and socioeconomic repercussions.
Such an approach can ensure that the technology solutions are not only academically sound but also operationally applicable, and reflective of real-world complexities and requirements. With their deep understanding of military strategies and ground realities, those officers help in making ML models look deeper and identify patterns that might not be visible through automated processes only. Continuous feedback is important for continuing to refine the model, so it remains effective and relevant in the operational context of demining.
The pillar of our study is the collaboration between technology experts and field veterans. This partnership is important in the formulation of our solution to pursue optimized safety protocols and clearance strategies that would reduce the risks and improve the efficacy of demining initiatives. As a part of our work, we conducted an assessment to evaluate our progress. The assessment focused on two categories of officers based on their years of experience (more or less than 10 years), and their level of involvement (on-site work or supervision from offices). The assessment included questions related to the importance of predicting mined areas, differentiating anti-personnel from anti-vehicle mines, the impact of difficulty and priority of clearance classification on demining operations, the quality, scale and resolution of the figures presented in the study and the preferred output format (whether as vector data or raster figures).
The evaluation study is in a question-oriented form; it contains sixteen questions. They are designed to identify the years of experience, the level of involvement in the demining sector, familiarity with GIS and the meaning of good maps’ resolution and scale. The questionnaire also sought to discover the challenges of using GIS outputs, the sample division of the area of the study most preferred and whether differentiating between mine types in the demining strategies used is effective. In addition, the questionnaire seeks to bring out the effects of the output format preference by the participant and how important or not important it is to include military features in the prediction process. Other questions sought to answer the patterns of mining from a military perspective. The questionnaire also contained questions concerning the importance of necessity with human expertise, or the human experience, in the prediction process.
During the interview, 95% of the officers believed that it is important to foresee the area mined in the post-conflict area, classifying the mines according to type, priority and level of difficulty of clearing them has a beneficial impact on socioeconomic factors. Among the officers, 98% were familiar with GIS and found the scale of the map very handy and demanded outputs in vector and raster formats. Furthermore, all the participants stressed that the need for a human expert in prediction is of the highest importance. They also emphasized the fact that military aspects and other variables like observation posts and confrontation lines have to be included in the key features during the prediction and that differentiating between mine types in the demining strategies used is effective. In total, 96% found the sample division of the area of the study most preferred.
3.2.2. Extended Classification
Our study developed a method to accurately distinguish between anti-personnel and anti-vehicle mines. We extracted data from historical clearance reports in the LMAC databases, focusing on sites contaminated by anti-vehicle mines, and used these data to train the model on the type of mines. The first run’s predictions for each mined area were used as features in our model, along with the slope and distance to observation posts. These three features were utilized to predict and label mine types.
We began by predicting mined areas and then identifying mine types within those areas, which helped prevent misclassification. This significantly improved the algorithm’s performance and efficiency in recognizing different mine types. Our goal was to create the most accurate and effective algorithm to identify and locate mines in conflict zones, reducing accidents and injuries. This advancement could make a substantial difference in mine detection and clearance, greatly enhancing safety and quality of life for those living and working in affected areas.
3.2.3. Additional Feature
Another variable is “distance from observation posts”, which we shall introduce into our dataset based on distance from the military observation sites. With this variable, we can capture even more of the military constraints in every zone. It seeks to calculate the distance of mined areas to the nearest observation posts or vantage points important for overseeing the zones. It, among other factors, considers the visibility range and, more importantly, the weapon range. This feature that was added enriches our knowledge concerning military factors around mining sites in an even deeper analysis of threat and risk potential. Such insight is invaluable in the formulation of effective strategies that are geared towards the protection of military personnel and articulating measures that would minimize the effect of mining activities on the environment and the respective communities.
3.2.4. Reducing Heterogeneity in Difficulty Classes
We made two modifications: first, we weighted high vegetation more heavily than slope and elevation for difficulty class thresholds, acknowledging that clearing minefields in thick vegetation is more challenging. Second, we smoothed the slope raster with a 30 m Digital Surface Model to homogenize the terrain representation, improving clearance prediction reliability. Difficulty levels now consider gradient, terrain and natural features like vegetation. These improvements enhance the accuracy of clearance difficulty predictions, increasing safety and efficiency in mine-clearance operations. The classification prioritizes vegetation, assigning a difficulty value of 2 to high-vegetation areas, while low-vegetation areas’ difficulty is based on elevation and slope thresholds. For example, an elevation less than 500 m and a slope less than 15% received a value of 0. An elevation between 500 and 1000 m and a slope between 15% and 30% received a value of 1. An elevation greater than 1000 m and a slope greater than 30% received a value of 2.
4. Implementation
The implementation phase is led by demining officers who are experts in military aspects such as military observation posts and confrontation lines. They are capable of accurately identifying model variables related to these features and continuously monitoring and interpreting the results in real-life situations. This is the principle of integrating machine learning with human expertise.
As mentioned earlier, this paper builds upon previous research [1]. However, we narrowed our focus to the southern border of Lebanon, simplified the difficulty levels, added new military features, improved the XGBoost algorithm results and introduced a new classification system based on mine types.
4.1. ML Algorithms
From the big list of available classifiers, several resources discuss and compare their performance in various applications [22,23], and knowing their popularity, speed of execution and good figures in different classification tasks, we chose in our study XGBoost and LightGBM, and tuned using the Optuna library. Optuna is one important tool for hypertuning [24]; it enables automated search for optimal hyperparameters (eager search spaces), pruning uncompromising trials for faster results, and easy parallelization over multiple threads or processes without modifying code. The metrics watched for are accuracy, precision, recall, area under curve and confusion matrix.
In order to predict results on new and unseen data, a technique called cross-validation is utilized. Specifically, stratified cross validation is employed, which involves dividing the original dataset into n subsets. The model is then trained on n-1 subsets and tested on the remaining subset, which serves as the unseen dataset. This process is repeated n times, with each subset serving as the unseen dataset exactly once. By doing so, we can obtain a more accurate estimation of the model’s performance on new and unseen data.
4.2. Workflow
Military demining specialists employ a systematic method to prioritize the clearance of minefields according to their socioeconomic impact. Areas that are more accessible to people are given higher priority for clearance (Reference [1]). Furthermore, the experts categorize minefields according to their elevation above sea level and the local weather conditions, as well as the slope of the terrain and its vegetation type (high or low vegetation). This information helps to determine the level of difficulty involved in clearing the minefields. Once the mined areas have been identified, they are classified by priority of clearance and difficulty of clearance.
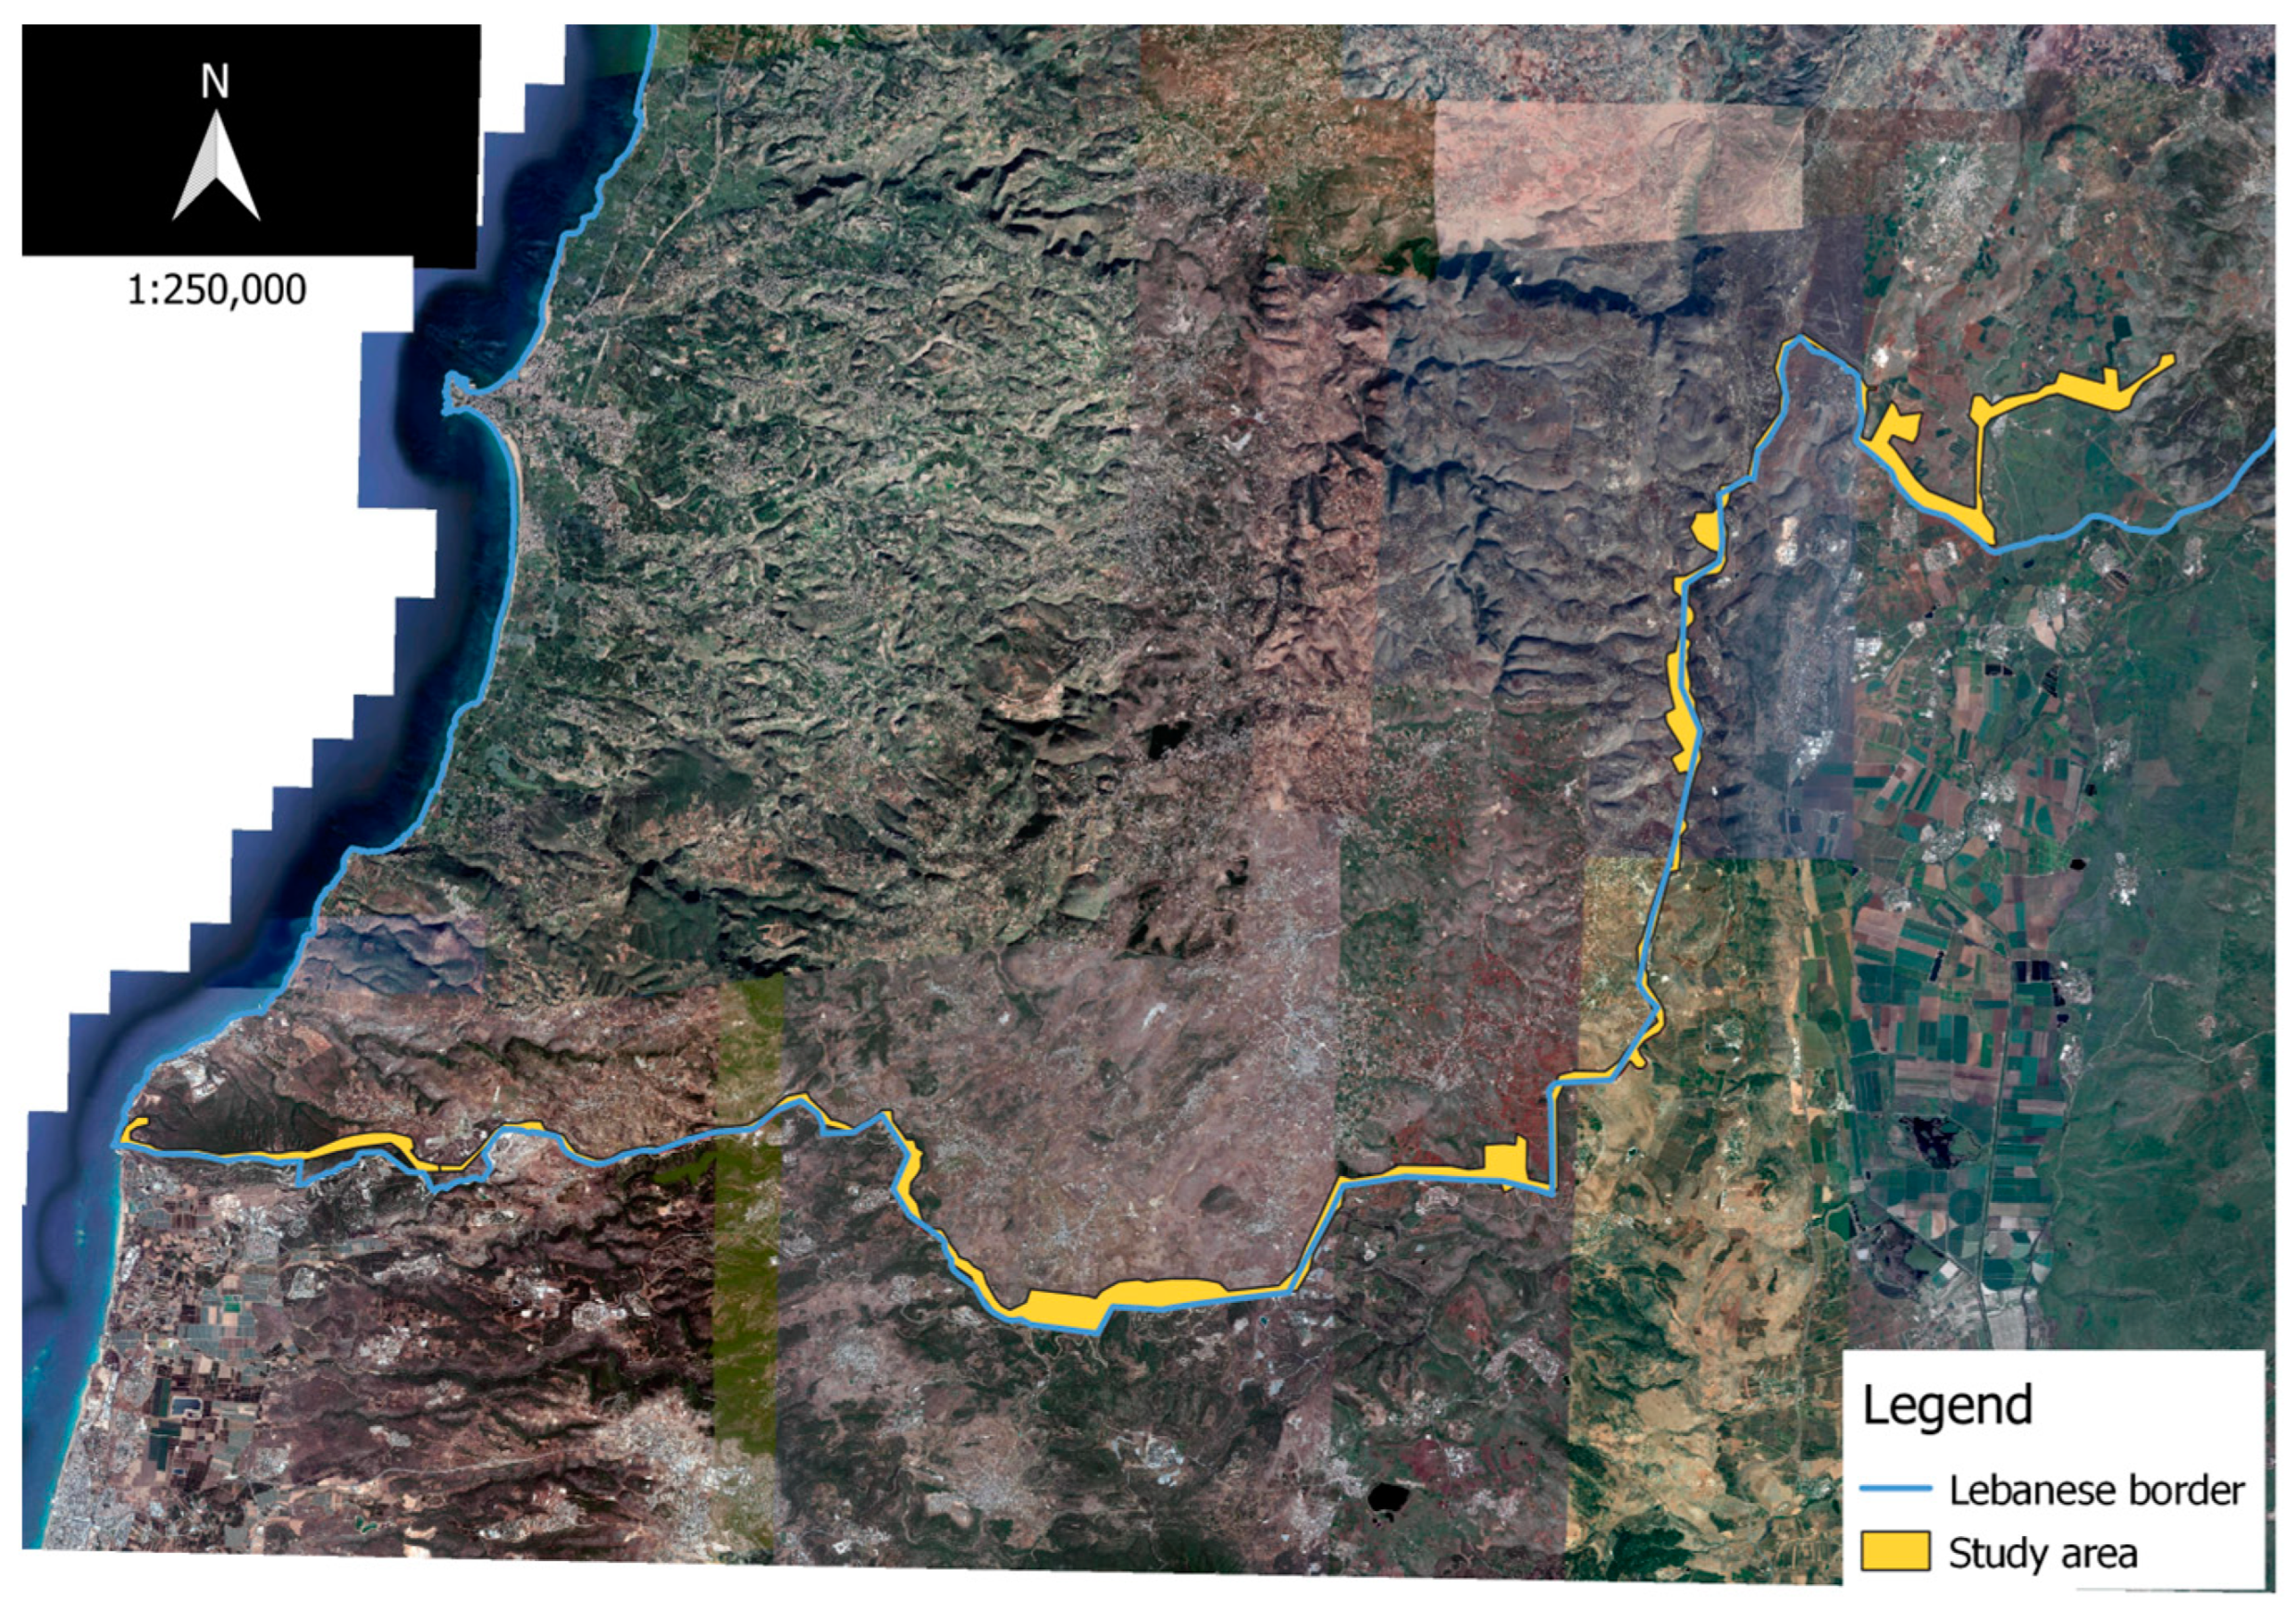
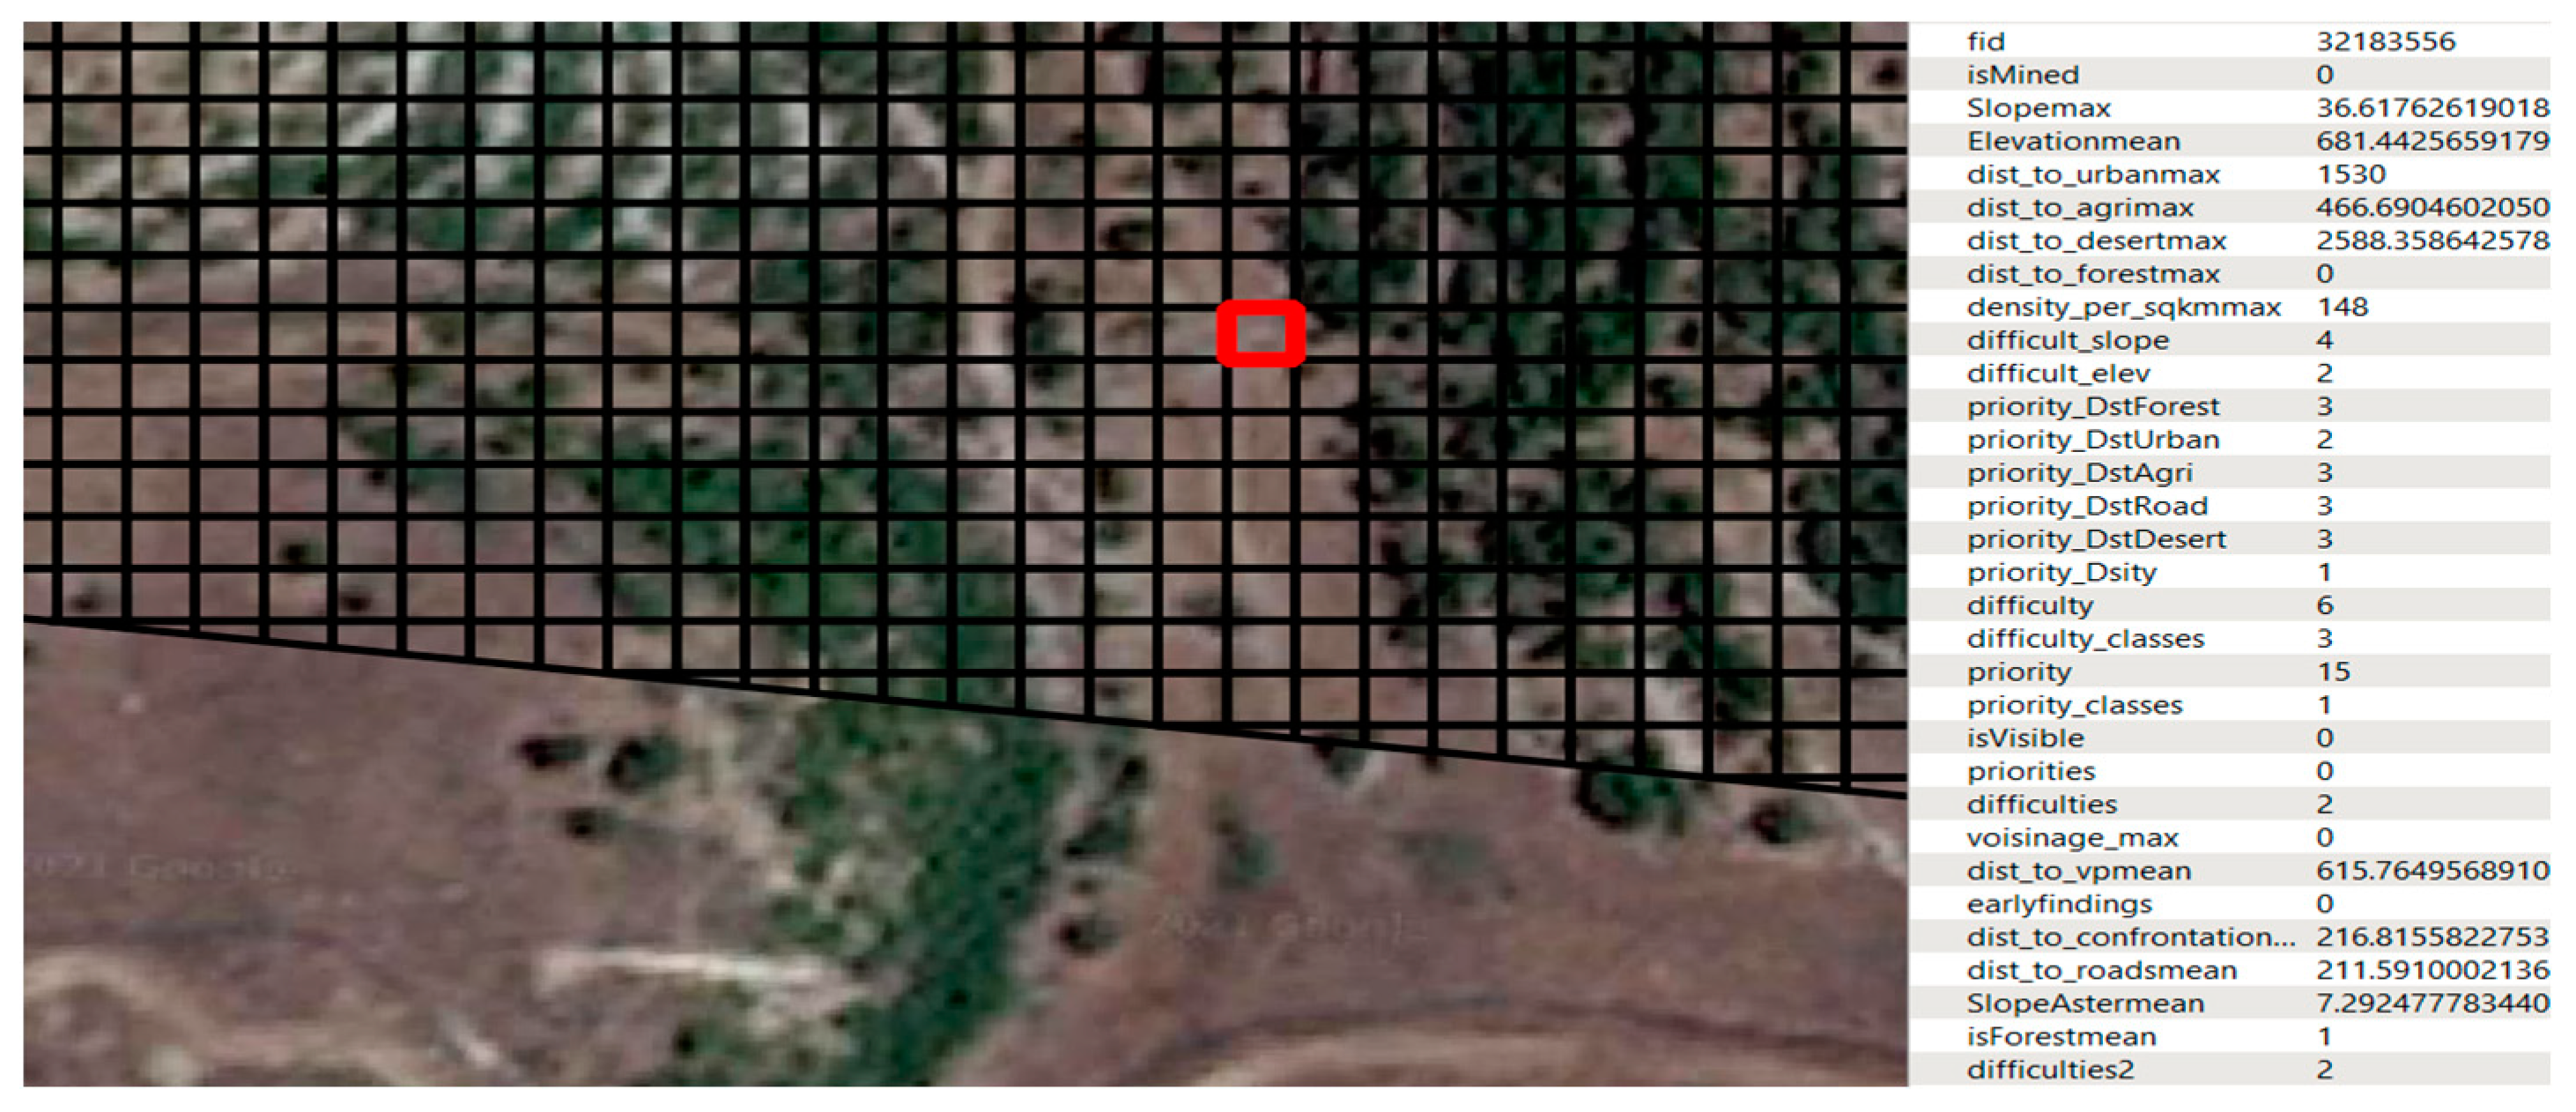
The study established distance and population thresholds of between 500 and 2500 m and 200 and 800 persons per square kilometer, respectively. These thresholds were used to define priority classes (as per Reference [1]). Also, mean sea elevation thresholds were set at 500 and 1000, while slope thresholds were defined as 15% and 30%. The data were prepared and transformed into an appropriate format. They were then sent to the XGBoost and LightGBM algorithms, which were tuned to achieve the best parameters. The data were classified as mined or not mined, and the mined areas were further classified according to whether they contained anti-vehicle mines or not, as well as to their priority and difficulty of clearance. The data are collected via local databases: LMAC for the demining data and the national database for the remaining features. The demining data are stored in shapefile format and accessible via IMSMA in LMAC, while the remaining data are gathered in a PostGIS database. The study area extends to 1000 m from the confrontation line, processed as a grid of 10 × 10 m polygons (around 293,000 samples) with a buffer zone of 10 km added. Figure 2 shows the study area along the southern border of Lebanon, while Figure 3 displays the 10 × 10 sample grid and its features. The satellite imagery used in the figures is exported from Google Earth and dated 2021.
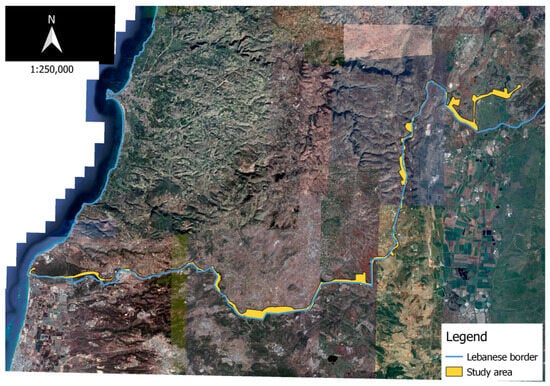
Figure 2.
Study area.
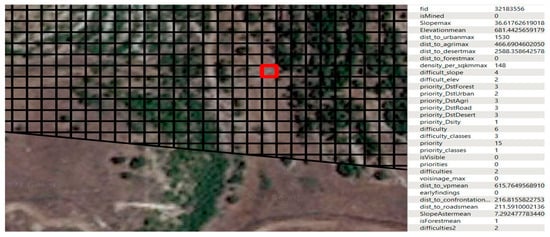
Figure 3.
Study area samples (grid 10 × 10) (Reference [1]).
Figure 4 illustrates an example of confrontation lines and observation points, and Figure 5 displays a sample of mined areas containing anti-vehicle mines along the southern border of Lebanon. The resulting maps (i.e., Figure 2, Figure 3, Figure 4 and Figure 5) are produced using the open-source GIS application for mapping and analysis, Quantum GIS (QGIS).
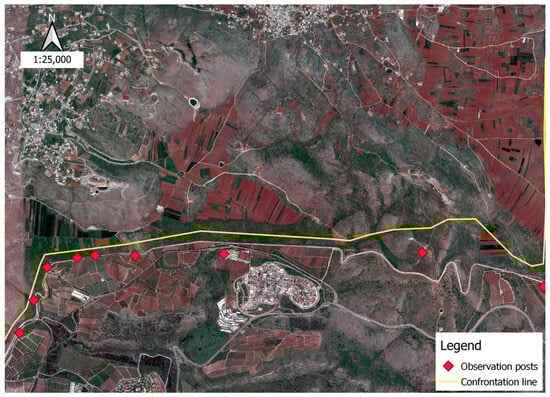
Figure 4.
Observation posts and confrontation line.
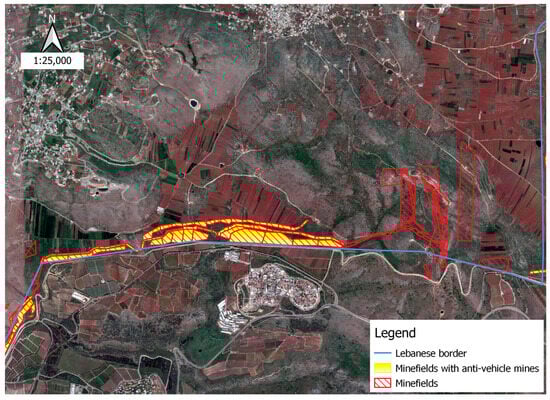
Figure 5.
Anti-vehicle mines along the southern border.
As introduced in Reference [1], the vector features of the input data are converted into a basic unit, and their values are incorporated into the samples vector. To analyze visibility from observation posts, a Digital Elevation Model (DEM) is used. The samples vector has features like distance from urban zones, forests and other relevant areas, population density, and 3D-derived data like elevation and slope. The predictive model is trained with two new features, clearance priority and clearance difficulty. Following data preparation, the resulting proportion of positive samples (those identified as mined, with a value of 1) to negative samples (not mined, with a value of 0) stands at 1 to 3.
4.3. Algorithm Parameter Settings and Hypertuning
The process of selecting and configuring a machine learning model critically involves combining its parameters. This includes determining the optimal mix of data-preparation techniques, learning algorithms and model hyperparameters to construct the desired predictive model. To determine the optimal combination of these components for a given dataset, controlled experiments must be conducted. This approach was conducted by military expertise where experts combined data preparation, learning algorithms and hyperparameters to achieve a global optimization task. After preparing the data and populating it with essential features, priority and difficulty classifications, machine learning is employed to build a suitable model and train it to accurately predict the correct categories.
XGBoost and LightGBM classifiers were chosen due to their wide usage and very good results, and tremendous speed of execution. We used the Optuna library to hypertune the parameters. The best parameters for XGBoost were determined to be max_depth = 33, learning_rate = 0.02896501698938145, n_estimators = 407, gamma = 0.3024780986776537, reg_alpha = 1.0916353748572334, reg_lambda = 2.234220534492662 and early_stopping_rounds = 8. While for LightGBM, the best parameters were max_depth = 14, learning_rate = 0.17334614308, num_leaves = 195, min_data_in_leaf = 211 and early_stopping_rounds = 10.
However, it is important to note that our selection of the area of interest, based on military constraints, neglected the possibility of falling into an imbalanced dataset. After identifying the mined areas, we extracted them from the dataset and ran the algorithm a second time to predict the areas containing anti-vehicle mines. The mined areas were then reclassified based on the clearance priority and difficulty. This procedure guarantees that the data are prepared and available for demining organizations, enabling them to start the clearance process safely and cost-effectively.
5. Experiments
From the GIS, the data are exported to a CSV file, and by implementing Python, Scikit-Learn and Pandas and related libraries, the dataset is fed to the ML algorithms and processed. This section reports on the predictions’ results of the ML algorithms, compares the metrics and chooses the best one, and then reapplies it in a second run to obtain all the desired classes. The output maps are also generated using open-source software (QGIS 3.28.6).
5.1. Predictions
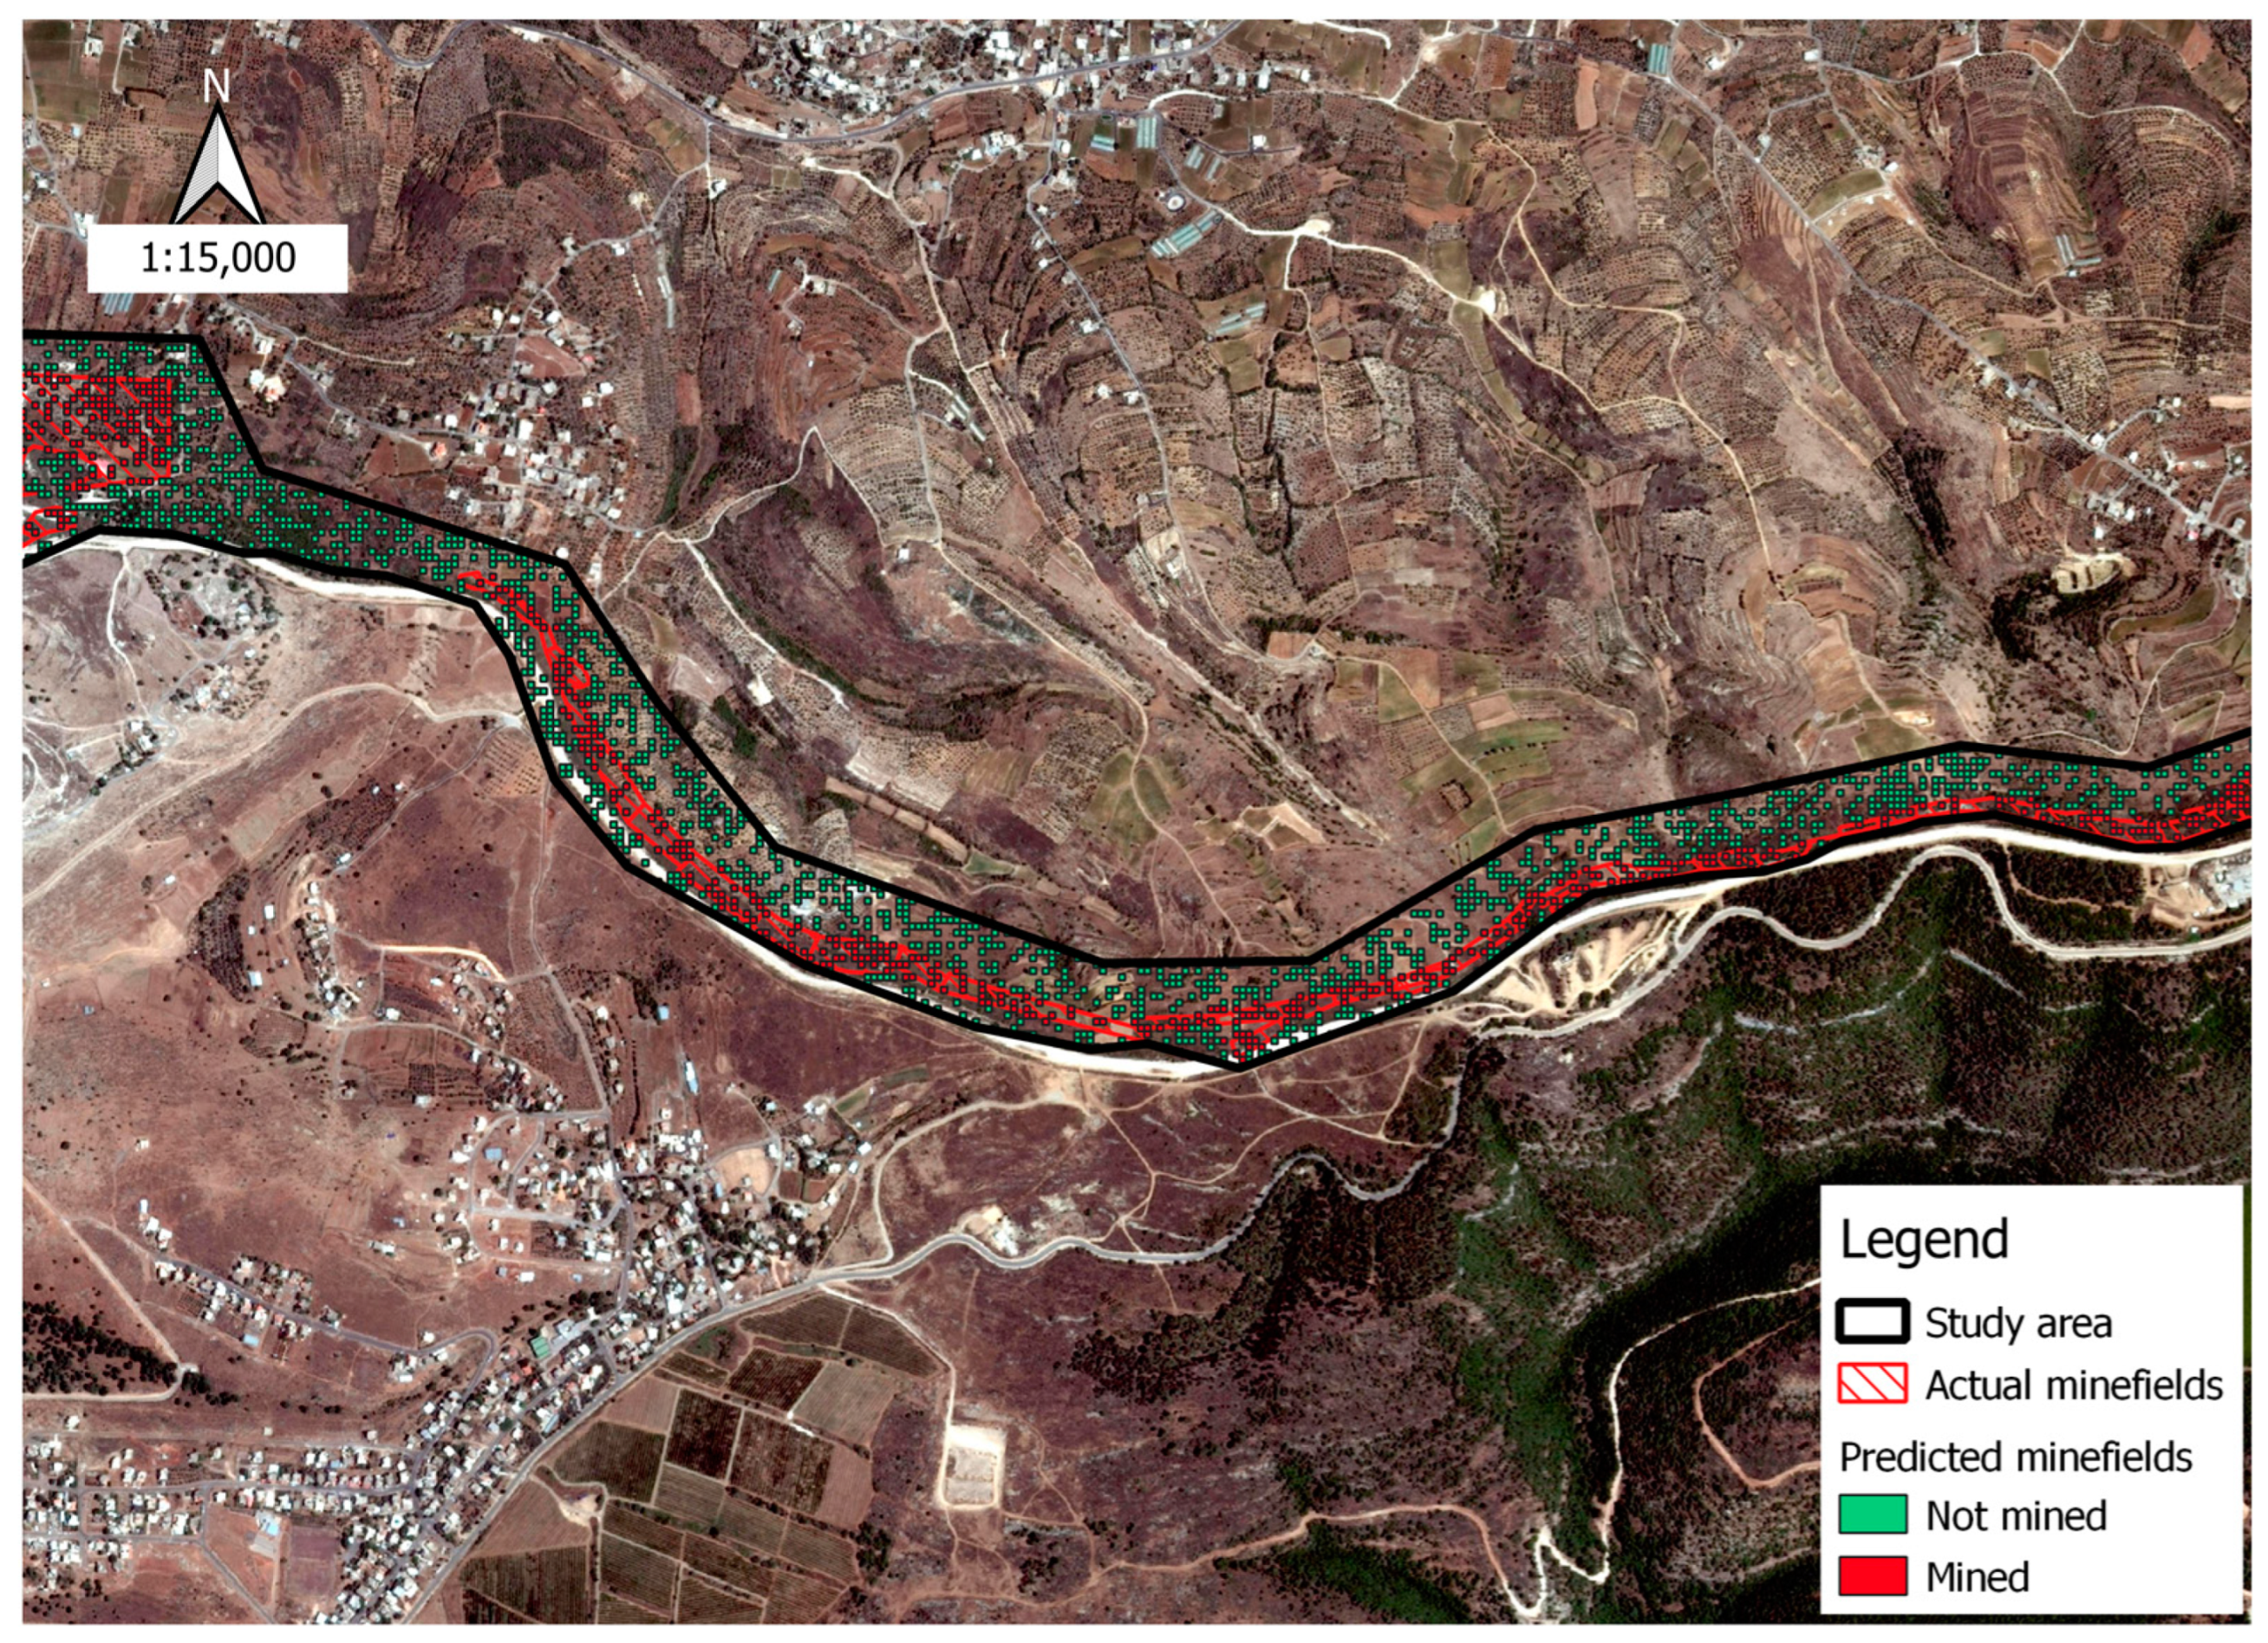
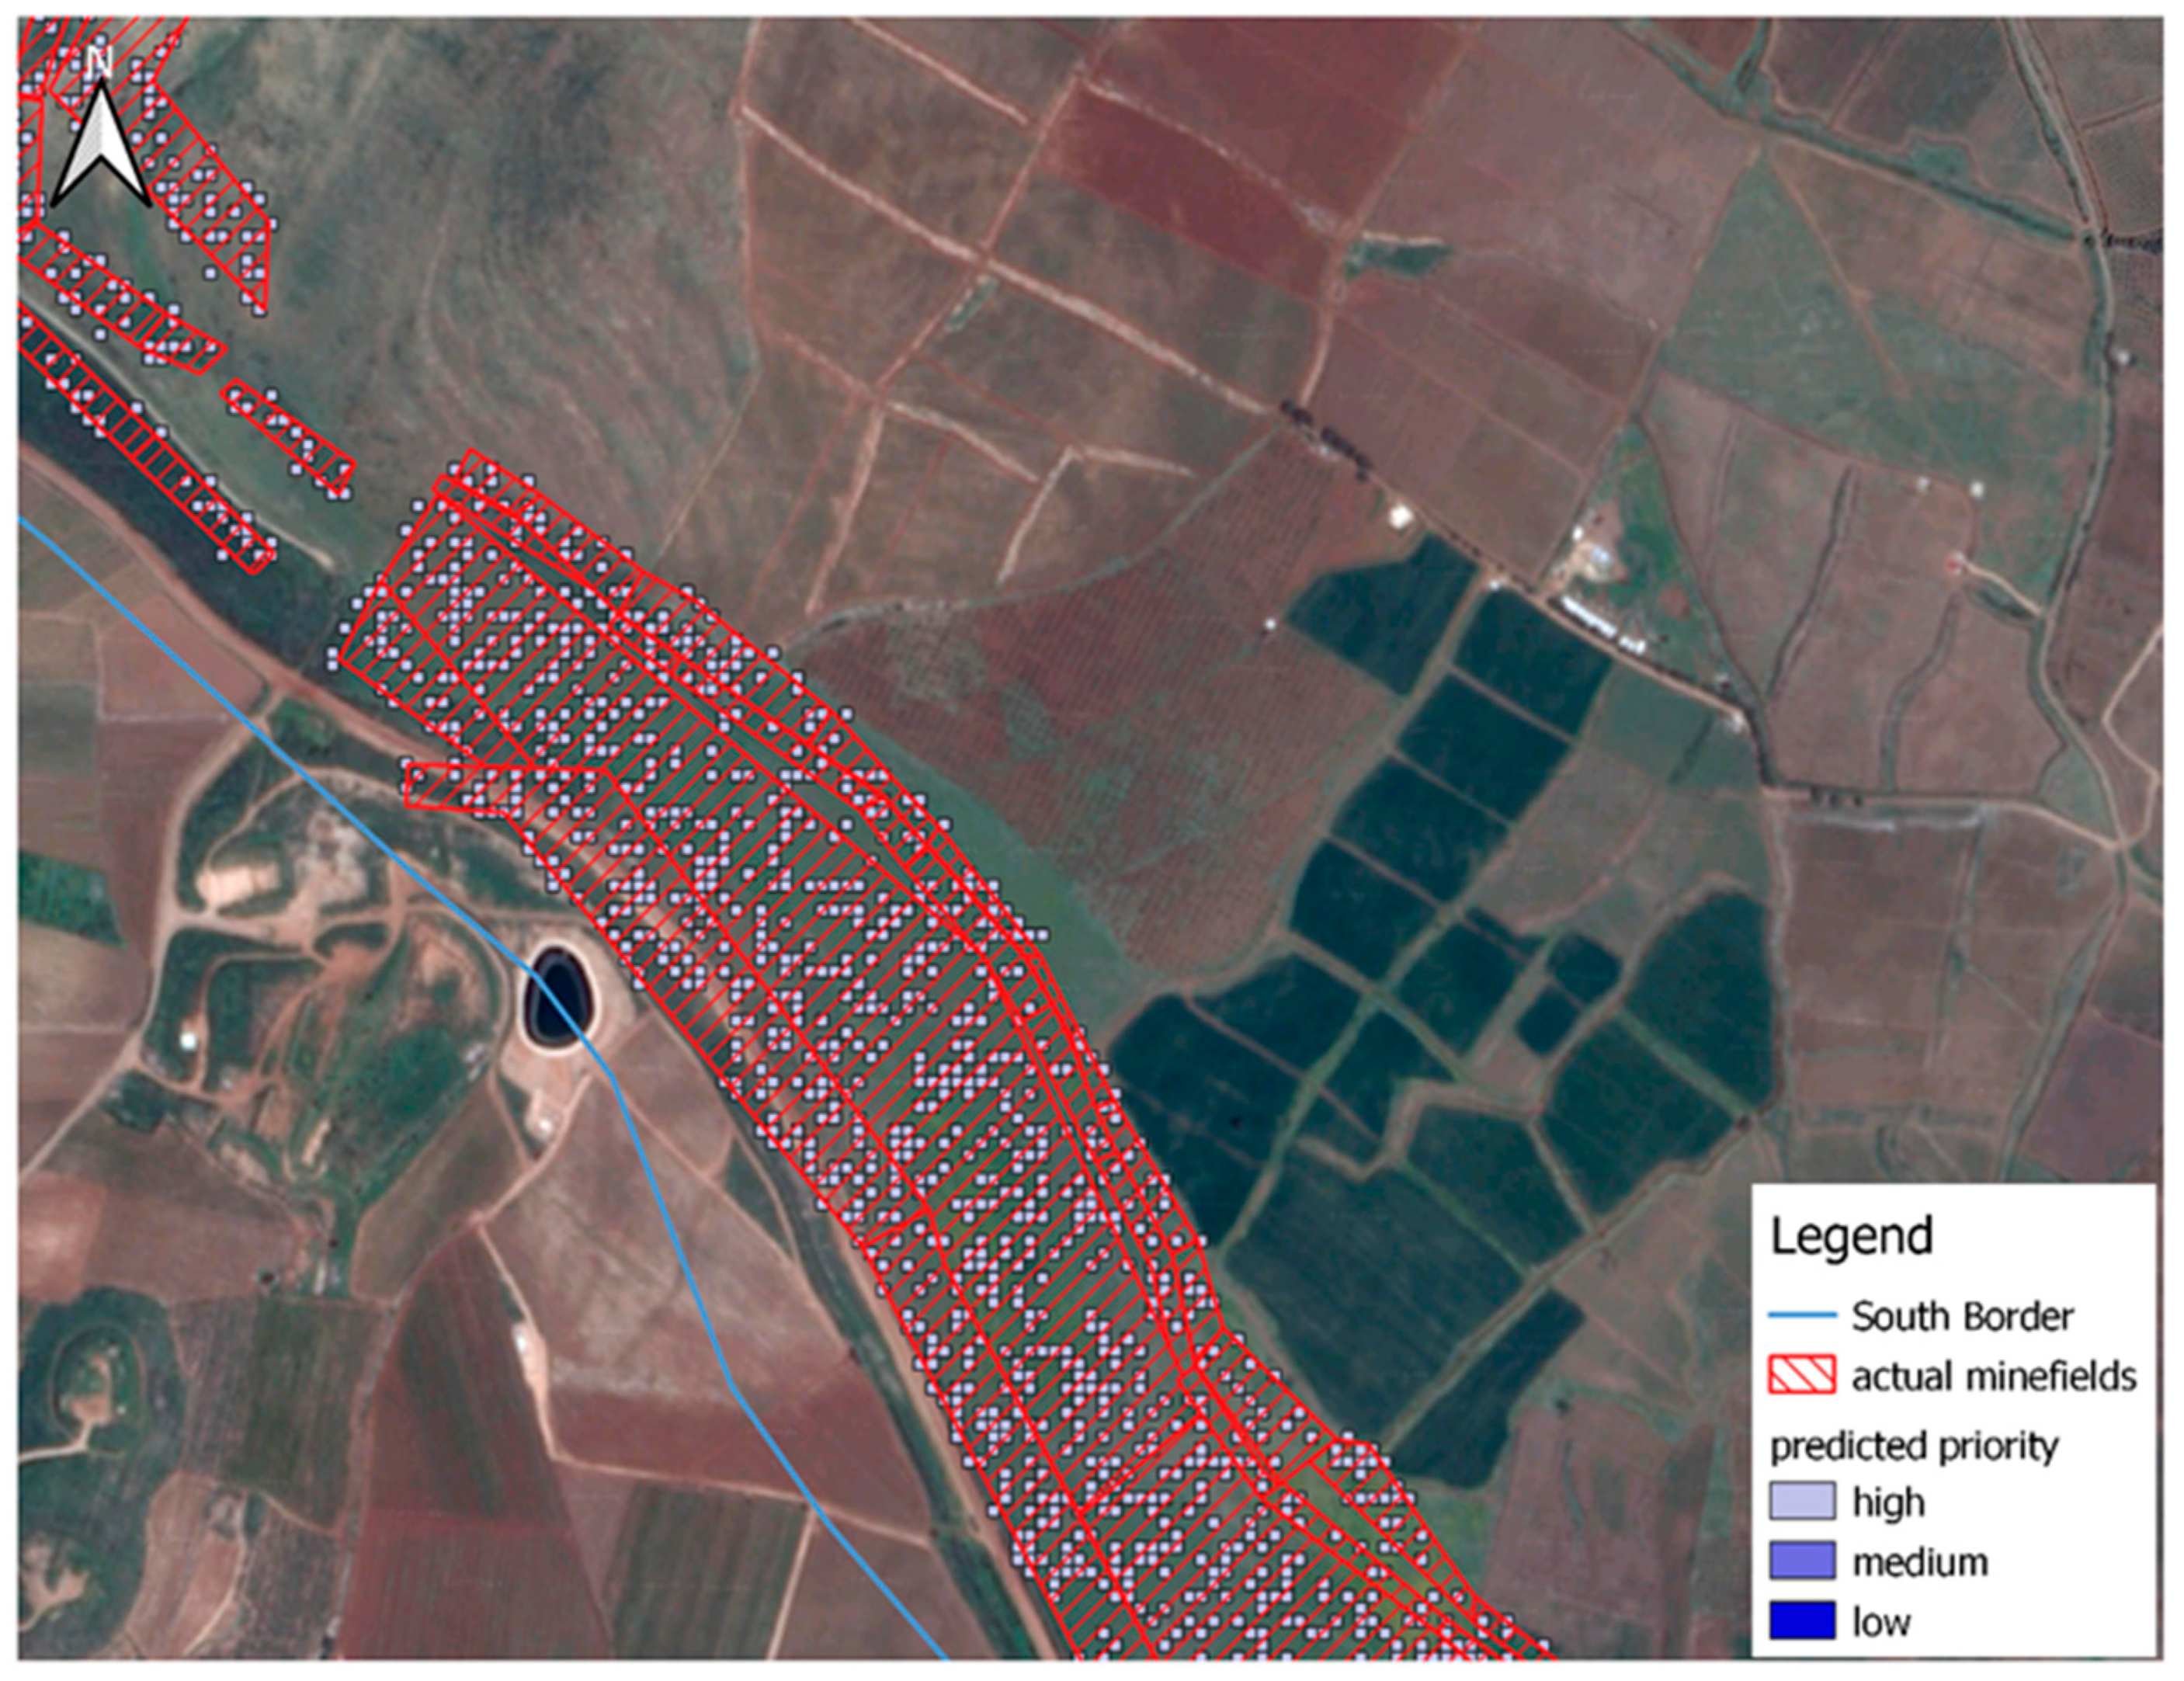
Figure 6, along with subsequent figures created using QGIS, displays the prediction outcomes for the selected testing splits (10 × 10 m). These results are part of a 70/30 split where 30% of the samples were used for testing and 70% for training, mirroring the proportions used in Reference [1]. The predictions are localized in South Lebanon and demonstrate effective convergence of the model in accurately identifying mined zones within comparatively small regions. Figure 6 shows the minefield predictions within the study area, the green polygons represent the part predicted as not mined, while the red polygons represent the part predicted as mined, and you can see the accuracy of the predictions in relation to actual minefields.
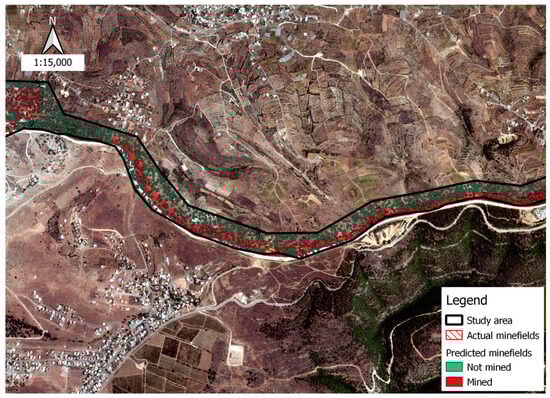
Figure 6.
Predictions for mined areas along the southern border.
Mined areas are predicted with an accuracy of 97.5%; mine types must be distinguished, whether or not anti-vehicle mines are present. The areas predicted as mined are extracted from the samples, and the XGBoost algorithm is reapplied to predict the presence of anti-vehicle mines within those areas. The dataset is divided into a 70% training segment and a 30% testing segment, with the optimal parameters employed for predicting types of mines. The results were also promising, and the accuracy obtained was 99.3%.
Figure 7 shows the prediction results obtained for mined areas containing anti-vehicle mines, and, as shown, the results were quite accurate and converged well towards an excellent prediction.
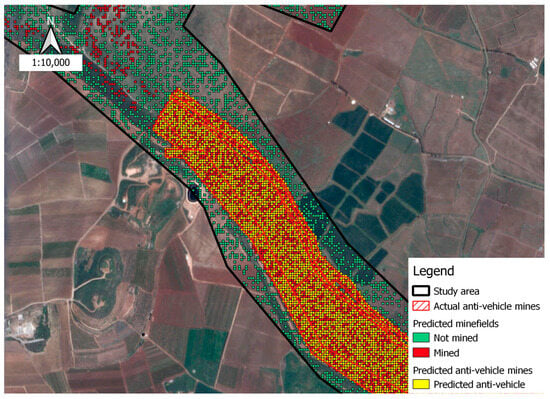
Figure 7.
Predictions for anti-vehicle mined areas.
The XGBoost was applied (because it gave better accuracy than LightGBM, as explained in Section 5) and the results were 99% for all the metrics used (i.e., accuracy, precision and recall) compared to the classification by priority made by military demining experts. The final stage involves classifying mined areas based on the difficulty of clearance, with the results achieving 99% across all metrics used, matching the classifications provided by military experts. It is important to note that the high results were achieved due to the clear and well-defined boundaries that separate the priority and difficulty classes, based on ranges of values, and the well-known impact of various features (Reference [1]). For example, in categorizing difficulty, variables such as elevation and slope were divided into intervals, specifically, 0 to 500, 500 to 2500 and over 2500 for elevation, and 0 to 15, 15 to 30 and above 30 for slope, and where the vegetation is high the mined area is directly classified as hard to clear; this simplifies the process of accurately classifying within these ranges.
In an agricultural area, the predictions for priority are shown in Figure 8. The results indicate that high priority is given, as expected.
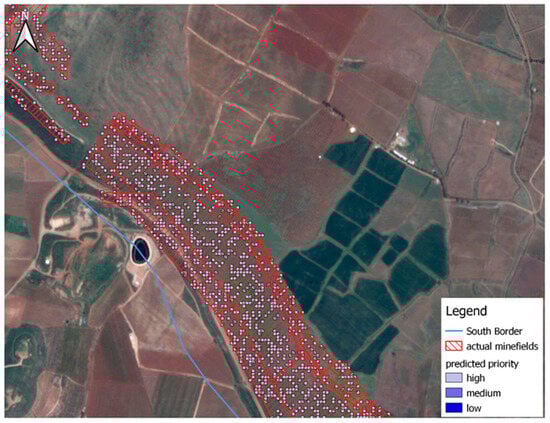
Figure 8.
High-priority prediction in agricultural areas.
Figure 9 displays the difficulty predictions from a previous study (Reference [1]) that used a high-resolution DSM (10 m). Meanwhile, Figure 10 shows the difficulty predictions for the same area but with a lower resolution DSM (30 m) and the inclusion of high vegetation as the primary indices of clearance difficulty. The increase in homogeneity is evident in Figure 11.
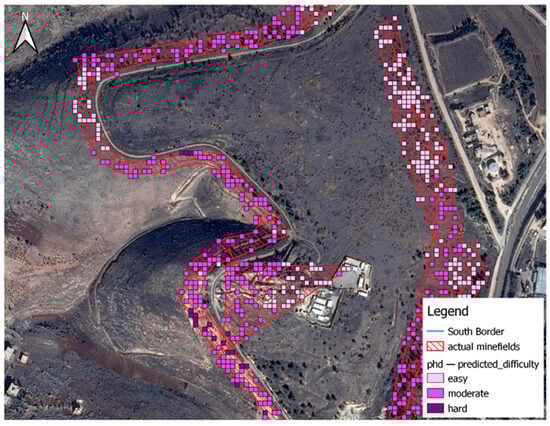
Figure 9.
Difficulty prediction from the referenced model.
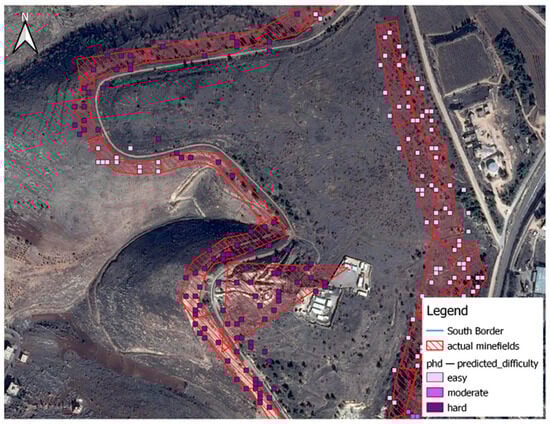
Figure 10.
Difficulty prediction from the current model.
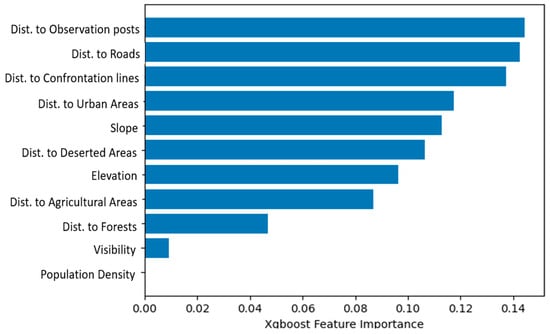
Figure 11.
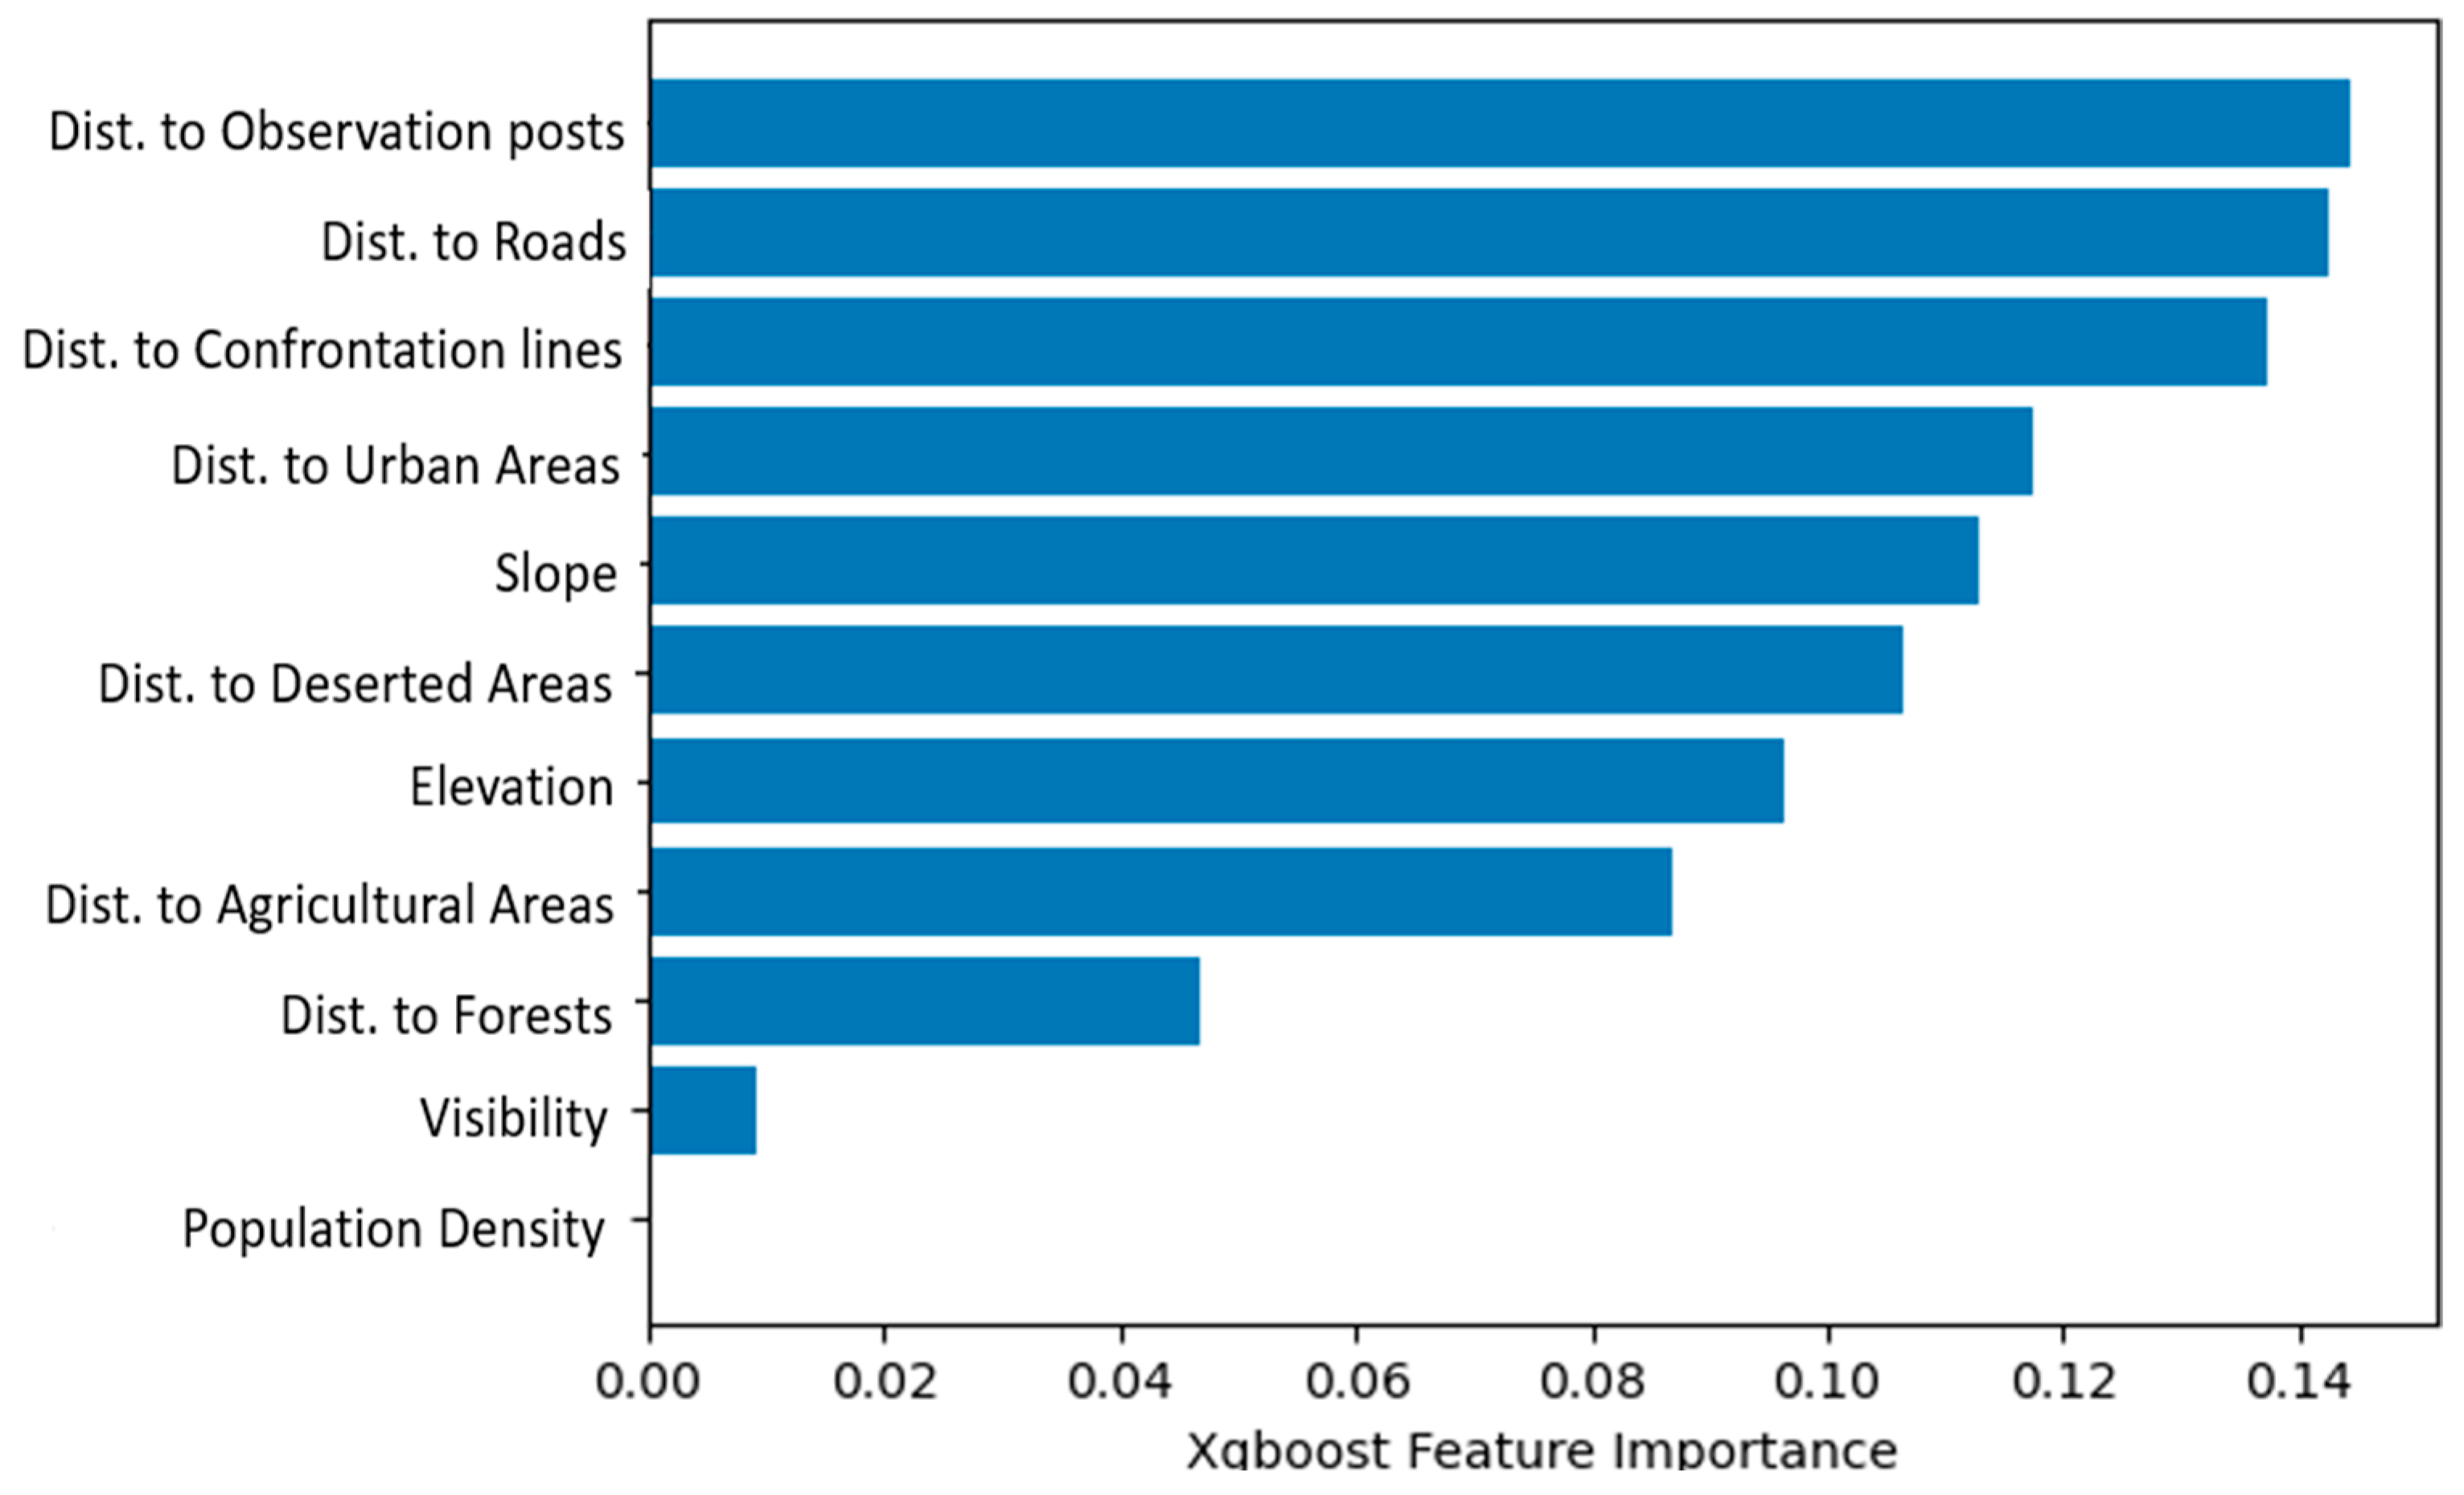
Feature importance.
Our modeling framework supplies military experts overseeing the demining system with well-defined, location-based vector data as a service. The data cover the areas that are predicted to be mined and those that are likely to contain anti-vehicle mines. The data also provide information on the prioritization of areas and the relative difficulty of clearance. This assists in clearing the areas that are highly prioritized and less difficult first, while progressively covering all areas.
5.2. Evaluation
The evaluation process has two main parts: the first is carried out by military experts and was explained earlier in Section 3, where 95% of the demining experts valued and accredited our work in a matter of prediction and classifications; and the second one is the results obtained by the ML algorithms and discussed hereafter.
Gradient boosting has the advantage of providing importance scores for each attribute once the boosted trees are constructed. These scores indicate the usefulness and value of each feature in the construction of the boosted decision trees in the model. The more an attribute is used to make key decisions with decision trees, the higher its relative importance. Importance is explicitly calculated for each attribute in the dataset to allow attributes to be ranked and compared to each other. A single decision tree’s importance is calculated by the amount that each attribute split point improves the performance measure, which is weighted by the number of observations the node is responsible for. The performance measure might be the purity (Gini index) used to select the split points or another more specific error function. The feature importances are then averaged across all the decision trees in the model.
In XGBoost, feature importance is measured by calculating the gain of each feature. Gain is the accuracy improvement brought by a feature to the branches it is on. The higher the gain, the more important the feature is.
The results of our model feature importance are displayed in Figure 11, ranked in descending order. The most significant contributions were from the distance to observation posts (dist_to_vpmean), distance to roads and distance to confrontation lines, while the population density had the smallest effect on the predictions.
All experiments were carried out using the open-source software QGIS, which offered the required versatility and functionality for data handling. The Python programming language and the Scikit-learn library were employed to develop all code implementations.
As in Reference [1], the data are split into three parts for testing and validation: 70% for training, 15% for testing and 15% for validation. The model is evaluated using several metrics, including accuracy, precision, recall, confusion matrix and area under curve (Table 1 for mine area predictions). The results show that the models perform well in predicting mined areas, as well as in other metrics such as recall, precision and AUC. This indicates that the model’s performance has been improved by increasing the sample size and incorporating military expertise.

Table 1.
Results for mined area prediction.
It appears that LightGBM ran faster than XGBoost but the latter gave more accuracy and better metrics. For this reason, XGBoost was chosen for the remaining experiments’ evaluations. Cross-validation is utilized to address model performance on unseen data. Table 2 displays the confusion matrices for five cross-validation folds, with maximum and minimum accuracies of 97.5% and 97.29%, respectively.
Table 2.
Confusion matrices for 5 folds (cross-validation).
Table 3 shows the results of the test and validation datasets, whose figures are almost equal and above 97% which indicates that our model performs well.
Table 3.
Accuracy of test and validation datasets.
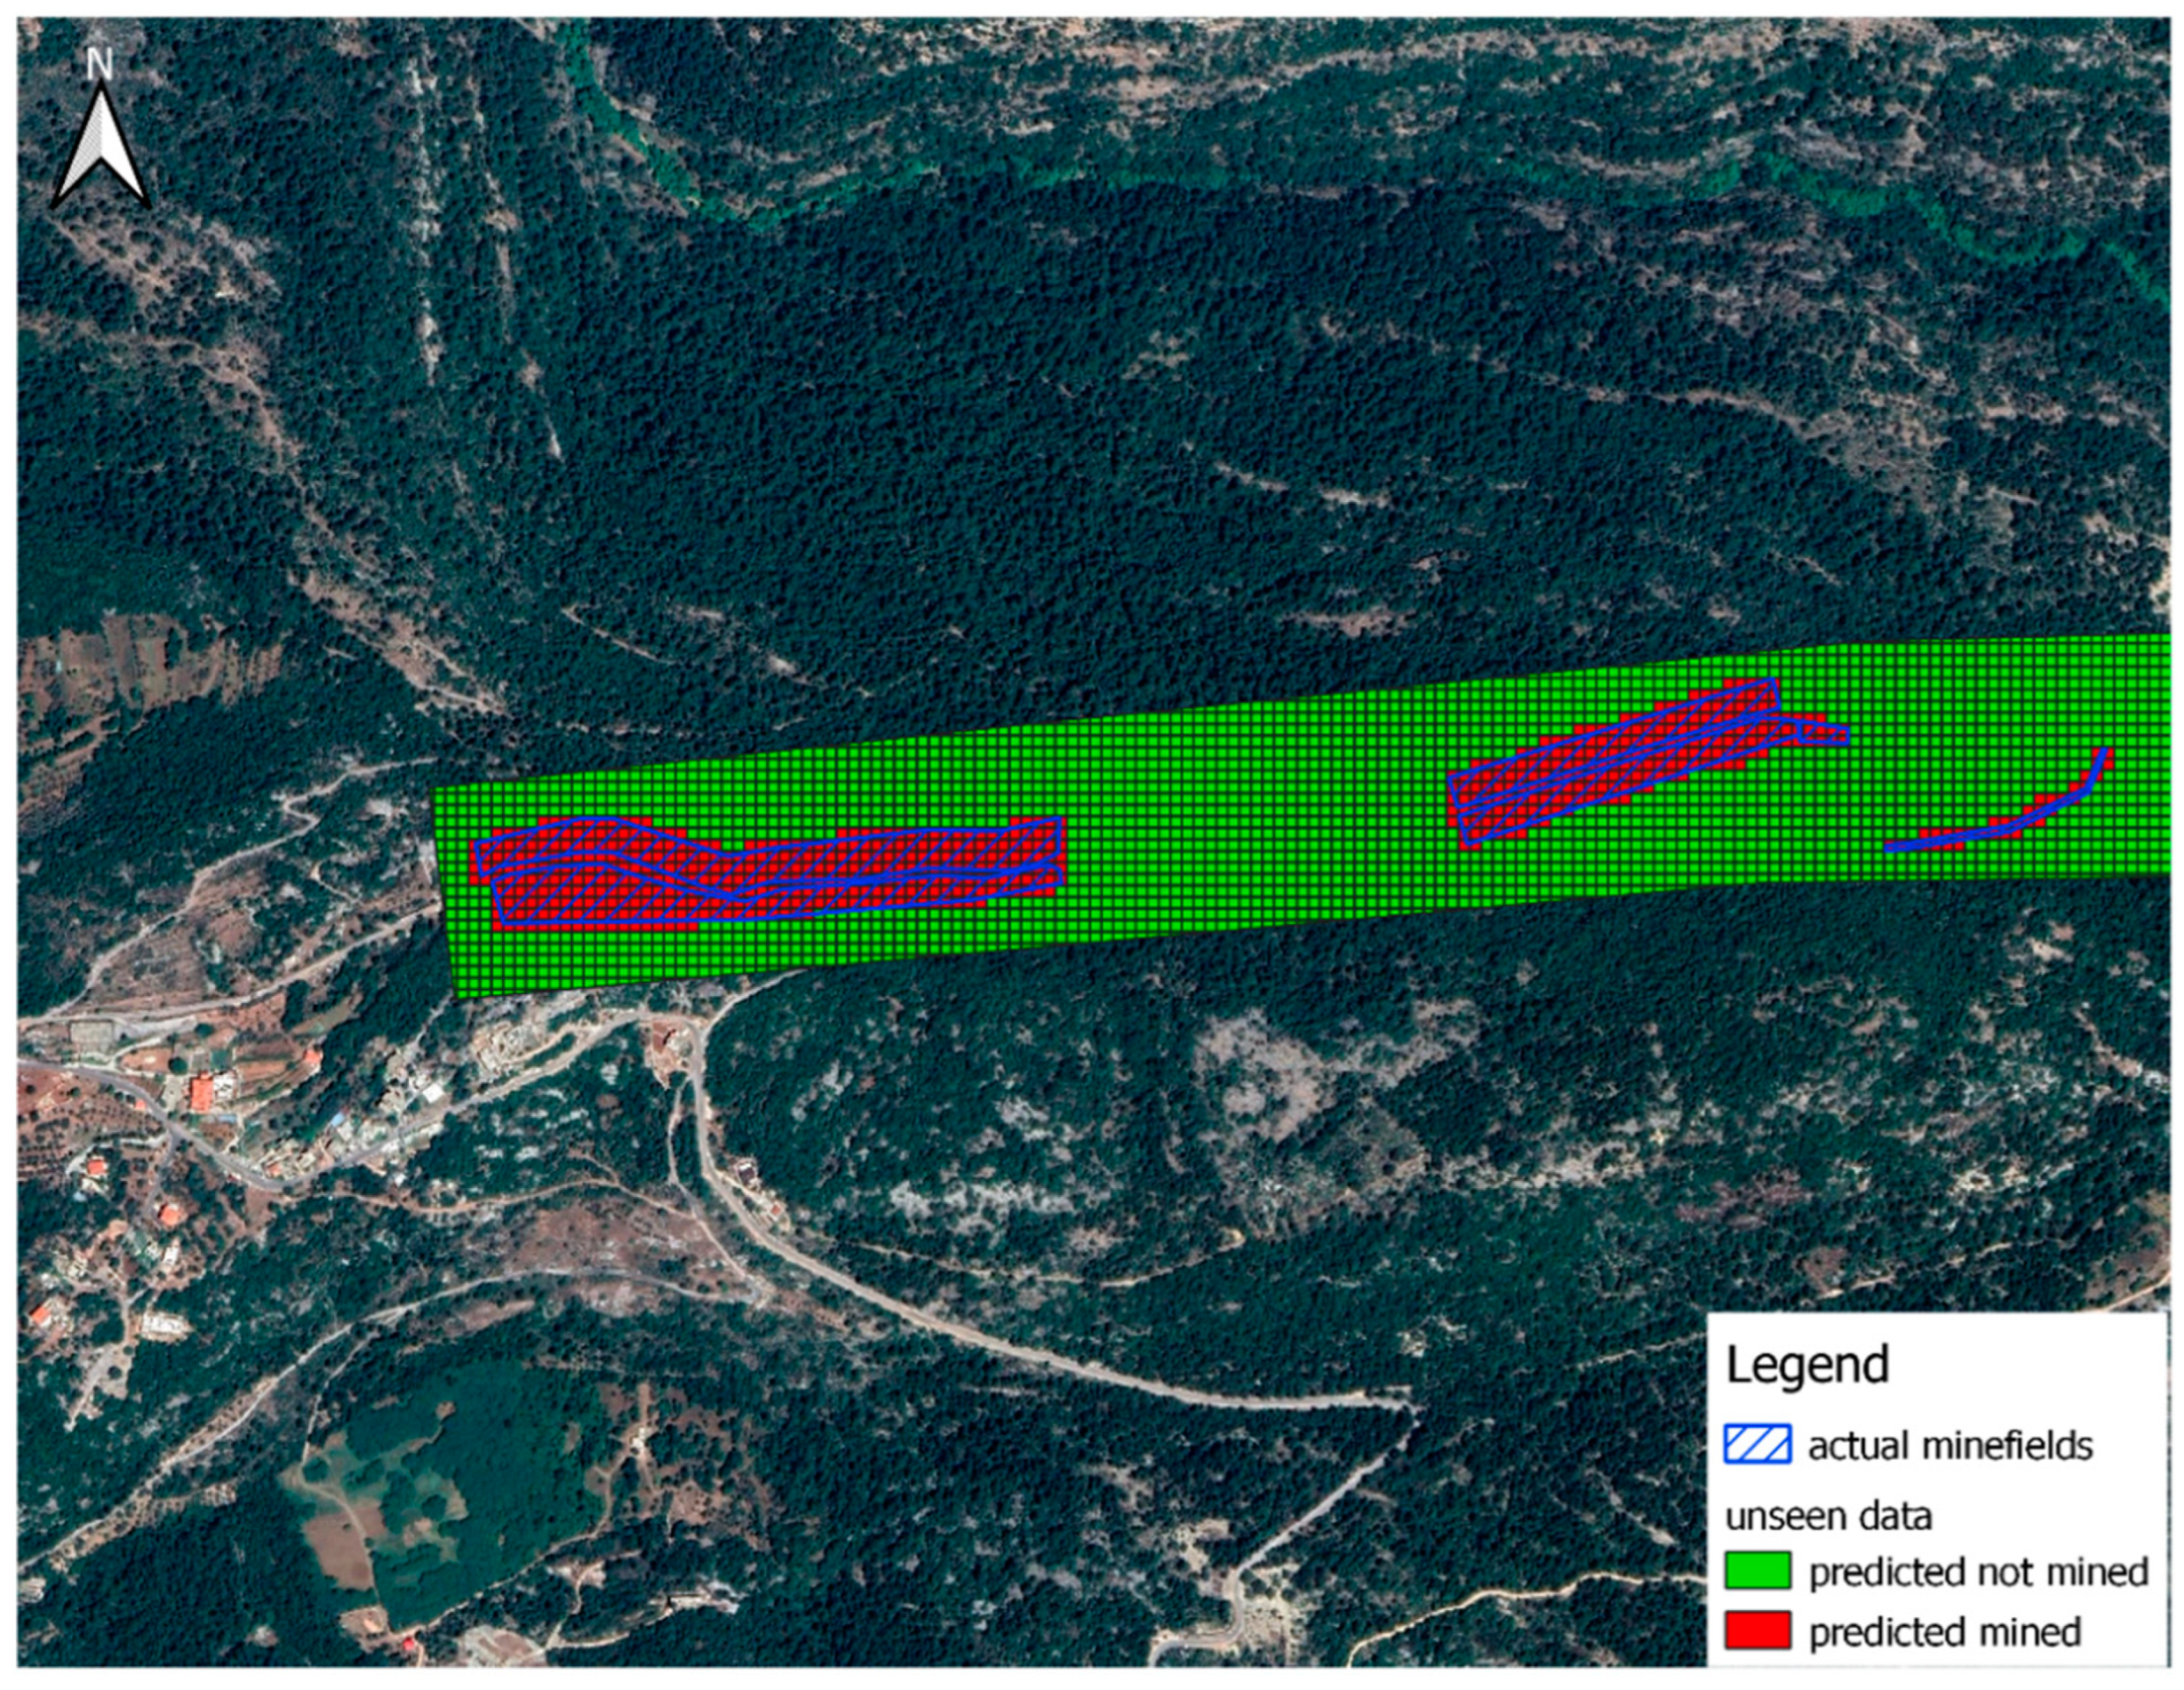
In addition to the tests explained above, validation has been carried out on a new unseen dataset, prepared inside the country in the Mount Lebanon governorate where the internal conflict took place. The dataset is filled in obeisance to the same military constraints: confrontation line and observation posts were carefully defined, and relevant data were extracted from local databases to fill the features or independent variables, giving a resulting dataset containing 44,617 samples of 10 × 10 m. Our XGBoost model has been fine-tuned (using the .fit method) on the new data and then applied to predict mined areas. The resulting confusion matrix was as follows:
[[26,449 8]
[6 3924]]
Our model achieved an accuracy of around 99%, with very low FN and FP values. Upon examining the FN values, we discovered that they relate to samples located along the edge of the minefield, which will be accounted for by including a safety distance around the danger area when defining the minefield’s perimeters before the clearance operations. For the false positive samples, they will cause no threat to the lives of the deminers; their clearance effect is a waste of resources on an empty land, but as their number is small, their effect is reduced. Figure 12 displays the prediction results on new data, demonstrating the alignment between actual and predicted minefields.
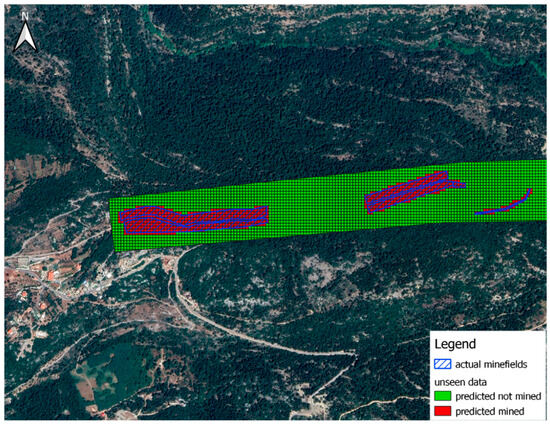
Figure 12.
Predictions on unseen data.
As a summary of the interpretation of the prediction results, the true positive predictions, or the area correctly predicted as mined and the false positive or wrongly predicted as mined will be delivered to the demining authorities in a vector data format as mined areas to conduct the clearance operations on it. The low false positive rate will reduce the waste of resources effect related to clearance. To mitigate the effect of false negative predictions or the missed mined areas, safety precautions must be applied around the perimeter of the mined areas in such a way as to engulf those missed dangerous areas in the clearance process.
6. Conclusions and Future Work
The scientific novelty in our study could be resumed in the application of ML and GIS techniques altogether to resolve a rare event problem occurrence, only made possible by working under the umbrella of military decision-makers with proven expertise in the demining sector.
This research paper highlights the way military expertise mixed with GIS and machine learning could help demining field decision-makers, as it could become combined in a bid to provide excellent prediction and classification to a great degree of potential landmine locations by type, their urgency and how complex it is to remove them. This further addition will be a breakthrough in increasing the safety and efficiency of clearing landmines on the ground. However, in this field, data collection poses a serious problem, as landmines are poorly available, and data usually have to be seriously converted to become useful and understood. For this reason, our trained model could be applied in other regions where there is a lack of minefield data, as long as the military features are explicitly applied, and the study area is well defined. That could mean that the respective machine learning, in combination with military expertise in this case, would yield very high competence-level predictions.
This knowledge of minefields and the characteristics of the ground belong to the effective military expert and are at his disposal to help decision-makers determine geographical areas subject to being mined. In such a system, they may give further classifications regarding the type of the mine, priority and the level of difficulty for its clearance, since they re-structure data within a context-aware system. This study may exhibit promising results for the valuable contribution of military expertise in its process.
This paper seeks to detail the applicability of our model to military experts in practical, real-life cases. This will include defining the following: observation and military posts, confrontation lines, 3D terrain features, visibility from the observation posts, population, and land use. This will be then followed by the selection of a region that is supposed to contain mines, segmenting it into small segments, populating the relevant features (variables) and finally applying the prediction model.
Theoretically, our model could be generalized to other regions, because the different geographical properties considered are general enough and common, and extracted from conventional geographical databases (land use, land cover, transportation, population) and in the present case extended toward military data. These data are specific to each country or region for a precise timeframe, and as long as they are available for access and use, the model could be fit to them. As the main author of the paper is a military officer, permission was given to access military data so the model was trained and tested on one unseen dataset. Whenever the data are specific to another region and other specific local contacts, and indeed as far as military expertise and data are available and accessible, the model could be certainly fit and trained under similar principles.
The soldiers or ex-soldiers who qualified as deminers are in the first place miners, their first military qualification is “miners”, then some deminers follow extra courses for Explosive Ordnance Disposal (EOD) or Improvised Explosives Disposal (IED). So, the demining experts are already classified as mining experts. As explained before, our task is to predict mined areas or the areas susceptible to containing mines, regardless of the mining techniques or procedures followed in mining; we are not providing a sketch with detailed mines’ locations; we are just predicting the area containing those mines and delivering the result to demining authorities, and this approach could certainly be applied elsewhere and not only in Lebanon.
Future studies in this area might concentrate on accurately locating mines within mined areas, which would facilitate the creation of a detailed map of the minefield. This is especially important in systematic minefields laid by armies, where the pattern of mining is usually known. However, in a scattered minefield, the task would be more challenging, and the mined area would generally be larger. Creating a detailed map of the minefield would be of immense importance for demining organizations, as it would allow them to conduct demining operations more safely and efficiently, ultimately resulting in positive socioeconomic outcomes.
Additional work can be done to predict the most suitable demining asset for clearance, whether it be mechanical, mine-detection dogs (MDD) or manual. This would be of great importance when planning demining missions.
It would be helpful to develop a system that can locate military posts in a post-war zone based on the location of minefields. If we have information about the geographic location of mined areas, we can determine the location of the military posts responsible for those areas. This research indicates that integrating machine learning with military knowledge can significantly enhance the effectiveness of landmine clearance efforts, potentially saving lives and enhancing safety.
Author Contributions
Conceptualization, Adib Saliba, Kifah Tout, Chamseddine Zaki and Christophe Claramunt; methodology, Adib Saliba, Kifah Tout, Chamseddine Zaki and Christophe Claramunt; software, Adib Saliba; validation, Adib Saliba, Kifah Tout, Chamseddine Zaki and Christophe Claramunt; formal analysis, Adib Saliba; investigation, Adib Saliba and Chamseddine Zaki; resources, Adib Saliba; data curation, Adib Saliba; writing—original draft preparation, Adib Saliba, Kifah Tout, Chamseddine Zaki and Christophe Claramunt; writing—review and editing, Adib Saliba, Kifah Tout and Christophe Claramunt; visualization, Adib Saliba; supervision, Kifah Tout and Christophe Claramunt; project administration, Adib Saliba All authors have read and agreed to the published version of the manuscript.
Funding
This research received no external funding.
Data Availability Statement
Dataset available on request from the authors.
Conflicts of Interest
The authors declare no conflict of interest.
References
- Saliba, A.; Tout, K.; Claramunt, C.; Zaki, C. A location-based model using GIS with machine learning, and a human-based approach for demining a post-war region. J. Locat. Based Serv. 2023, 18, 162–184. [Google Scholar] [CrossRef]
- United Nations. Convention on the Prohibition of the Use, Stockpiling, Production and Transfer of Anti-Personnel Mines and on Their Destruction; United Nations: New York, NY, USA, 1997. [Google Scholar]
- Geneva International Centre for Humanitarian Demining GICHD. A Guide to Mine Action; Geneva International Centre for Humanitarian Demining GICHD: Geneva, Switzerland, 2014; Chapter 1; p. 16. [Google Scholar]
- Geneva International Centre for Humanitarian Demining GICHD. A Guide to International Mine Action Standards; Geneva International Centre for Humanitarian Demining GICHD: Geneva, Switzerland, 2010; pp. 62–132. [Google Scholar]
- Geneva International Centre for Humanitarian Demining GICHD. A Guide to Mine Action; Geneva International Centre for Humanitarian Demining GICHD: Geneva, Switzerland, 2014; Chapter 5; p. 125. [Google Scholar]
- Lebanon Mine Action Center LMAC. Lebanon Mine Action Strategy; Lebanon Mine Action Center LMAC: Fayadiyeh, Lebanon, 2011. [Google Scholar]
- Choi, Y. GeoAI: Integration of Artificial Intelligence, Machine Learning, and Deep Learning with GIS. Appl. Sci. 2023, 13, 3895. [Google Scholar] [CrossRef]
- Zhao, G.; Li, Z.; Yang, M. Comparison of Twelve Machine Learning Regression Methods for Spatial Decomposition of Demographic Data Using Multisource Geospatial Data: An Experiment in Guangzhou City, China. Appl. Sci. 2021, 11, 9424. [Google Scholar] [CrossRef]
- Digra, M.; Dhir, R.; Sharma, N. Land Use Land Cover Classification of Remote Sensing Images Based on the Deep Learning Approaches: Statistical Analysis and Review. Arab. J. Geosci. 2022, 15, 1003. [Google Scholar] [CrossRef]
- Milton, R.; Roumpani, F. Accelerating Urban Modelling Algorithms with Artificial Intelligence. In Proceedings of the 5th International Conference on Geographical Information Systems Theory, Applications and Management, Heraklion, Crete, Greece, 3–5 May 2019; Volume 1, pp. 105–116. [Google Scholar]
- Krtalić, A.; Bajić, M. Development of the TIRAMISU Advanced Intelligence Decision Support System. Eur. J. Remote Sens. 2019, 52, 40–55. [Google Scholar] [CrossRef]
- Mosavi, A.; Ozturk, P.; Chau, K.-W. Flood Prediction Using Machine Learning Models: Literature Review. Water 2018, 10, 1536. [Google Scholar] [CrossRef]
- Rafique, W.; Zheng, D.; Barras, J.; Joglekar, S.; Kosmas, P. Predictive Analysis of Landmine Risk. IEEE Access 2019, 7, 107259. [Google Scholar] [CrossRef]
- Shafapourtehrany, M.; Yariyan, P.; Özener, H.; Pradhan, B.; Shabani, F. Evaluating the Application of K-mean Clustering in Earthquake Vulnerability Mapping of Istanbul, Turkey. Int. J. Disaster Risk Reduct. 2022, 79, 103154. [Google Scholar] [CrossRef]
- Gholamnia, K.; Nachappa, T.G.; Ghorbanzadeh, O.; Blaschke, T. Comparisons of diverse Machine Learning Approaches for Wildfire Susceptibility Mapping. Symmetry 2020, 12, 604. [Google Scholar] [CrossRef]
- Barnawi, A.; Budhiraja, I.; Kumar, K.; Kumar, N.; Alzahrani, B.; Almansour, A.; Noor, A. A Comprehensive Review on Landmine Detection Using Deep Learning Techniques in 5G Environment: Open Issues and Challenges. Neural Comput. Appl. 2022, 34, 21657–21676. [Google Scholar] [CrossRef]
- Hamad, R.; Kolo, K.; Balzter, H. Land Cover Changes Induced by Demining Operations in Halgurd-Sakran National Park in the Kurdistan Region of Iraq. Sustainability 2018, 10, 2422. [Google Scholar] [CrossRef]
- Yoo, L.S.; Lee, J.H.; Ko, S.H.; Jung, S.K.; Lee, S.H.; Lee, Y.K. A Drone Fitted with a Magnetometer Detects Landmines. IEEE Geosci. Remote Sens. Lett. 2020, 17, 2035–2039. [Google Scholar] [CrossRef]
- Jangra, V.; Dalal, S. A Semi-Autonomous Drone for Surveillance and Security. INCAS Bull. 2020, 12, 267–270. [Google Scholar] [CrossRef]
- Colorado, J.; Perez, M.; Mondragon, I.; Mendez, D.; Parra, C.; Devia, C.; Martinez-Moritz, J.; Neira, L. An Integrated Aerial System for Landmine Detection: SDR-based Ground Penetrating Radar onboard an autonomous drone. Adv. Robot. 2017, 31, 791–808. [Google Scholar] [CrossRef]
- Garcia-Fernandez, M.; Morgenthaler, A.; Alvarez-Lopez, Y.; Heras, F.L.; Rappaport, C. Bistatic Landmine and IED Detection Combining Vehicle and Drone Mounted GPR Sensors. Remote Sens. 2019, 11, 2299. [Google Scholar] [CrossRef]
- Jafarzadeh, H.; Mahdianpari, M.; Gill, E.; Mohammadimanesh, F.; Homayouni, S. Bagging and Boosting Ensemble Classifiers for Classification of Multispectral, Hyperspectral and PolSAR Data: A Comparative Evaluation. Remote Sens. 2021, 13, 4405. [Google Scholar] [CrossRef]
- Shao, Z.; Ahmad, M.N.; Javed, A. Comparison of Random Forest and XGBoost Classifiers Using Integrated Optical and SAR Features for Mapping Urban Impervious Surface. Remote Sens. 2024, 16, 665. [Google Scholar] [CrossRef]
- Akiba, T.; Sano, S.; Yanase, T.; Ohta, T.; Koyama, M. Optuna: A Next-generation Hyperparameter Optimization Framework. arXiv 2019, arXiv:1907.10902. [Google Scholar]


Disclaimer/Publisher’s Note: The statements, opinions and data contained in all publications are solely those of the individual author(s) and contributor(s) and not of MDPI and/or the editor(s). MDPI and/or the editor(s) disclaim responsibility for any injury to people or property resulting from any ideas, methods, instructions or products referred to in the content. |
© 2024 by the authors. Licensee MDPI, Basel, Switzerland. This article is an open access article distributed under the terms and conditions of the Creative Commons Attribution (CC BY) license (https://creativecommons.org/licenses/by/4.0/).