

A Knowledge-Guided Intelligent Analysis Method of Geographic Digital Twin Models: A Case Study on the Diagnosis of Geometric Deformation in Tunnel Excavation Profiles
Abstract
1. Introduction
2. Methods
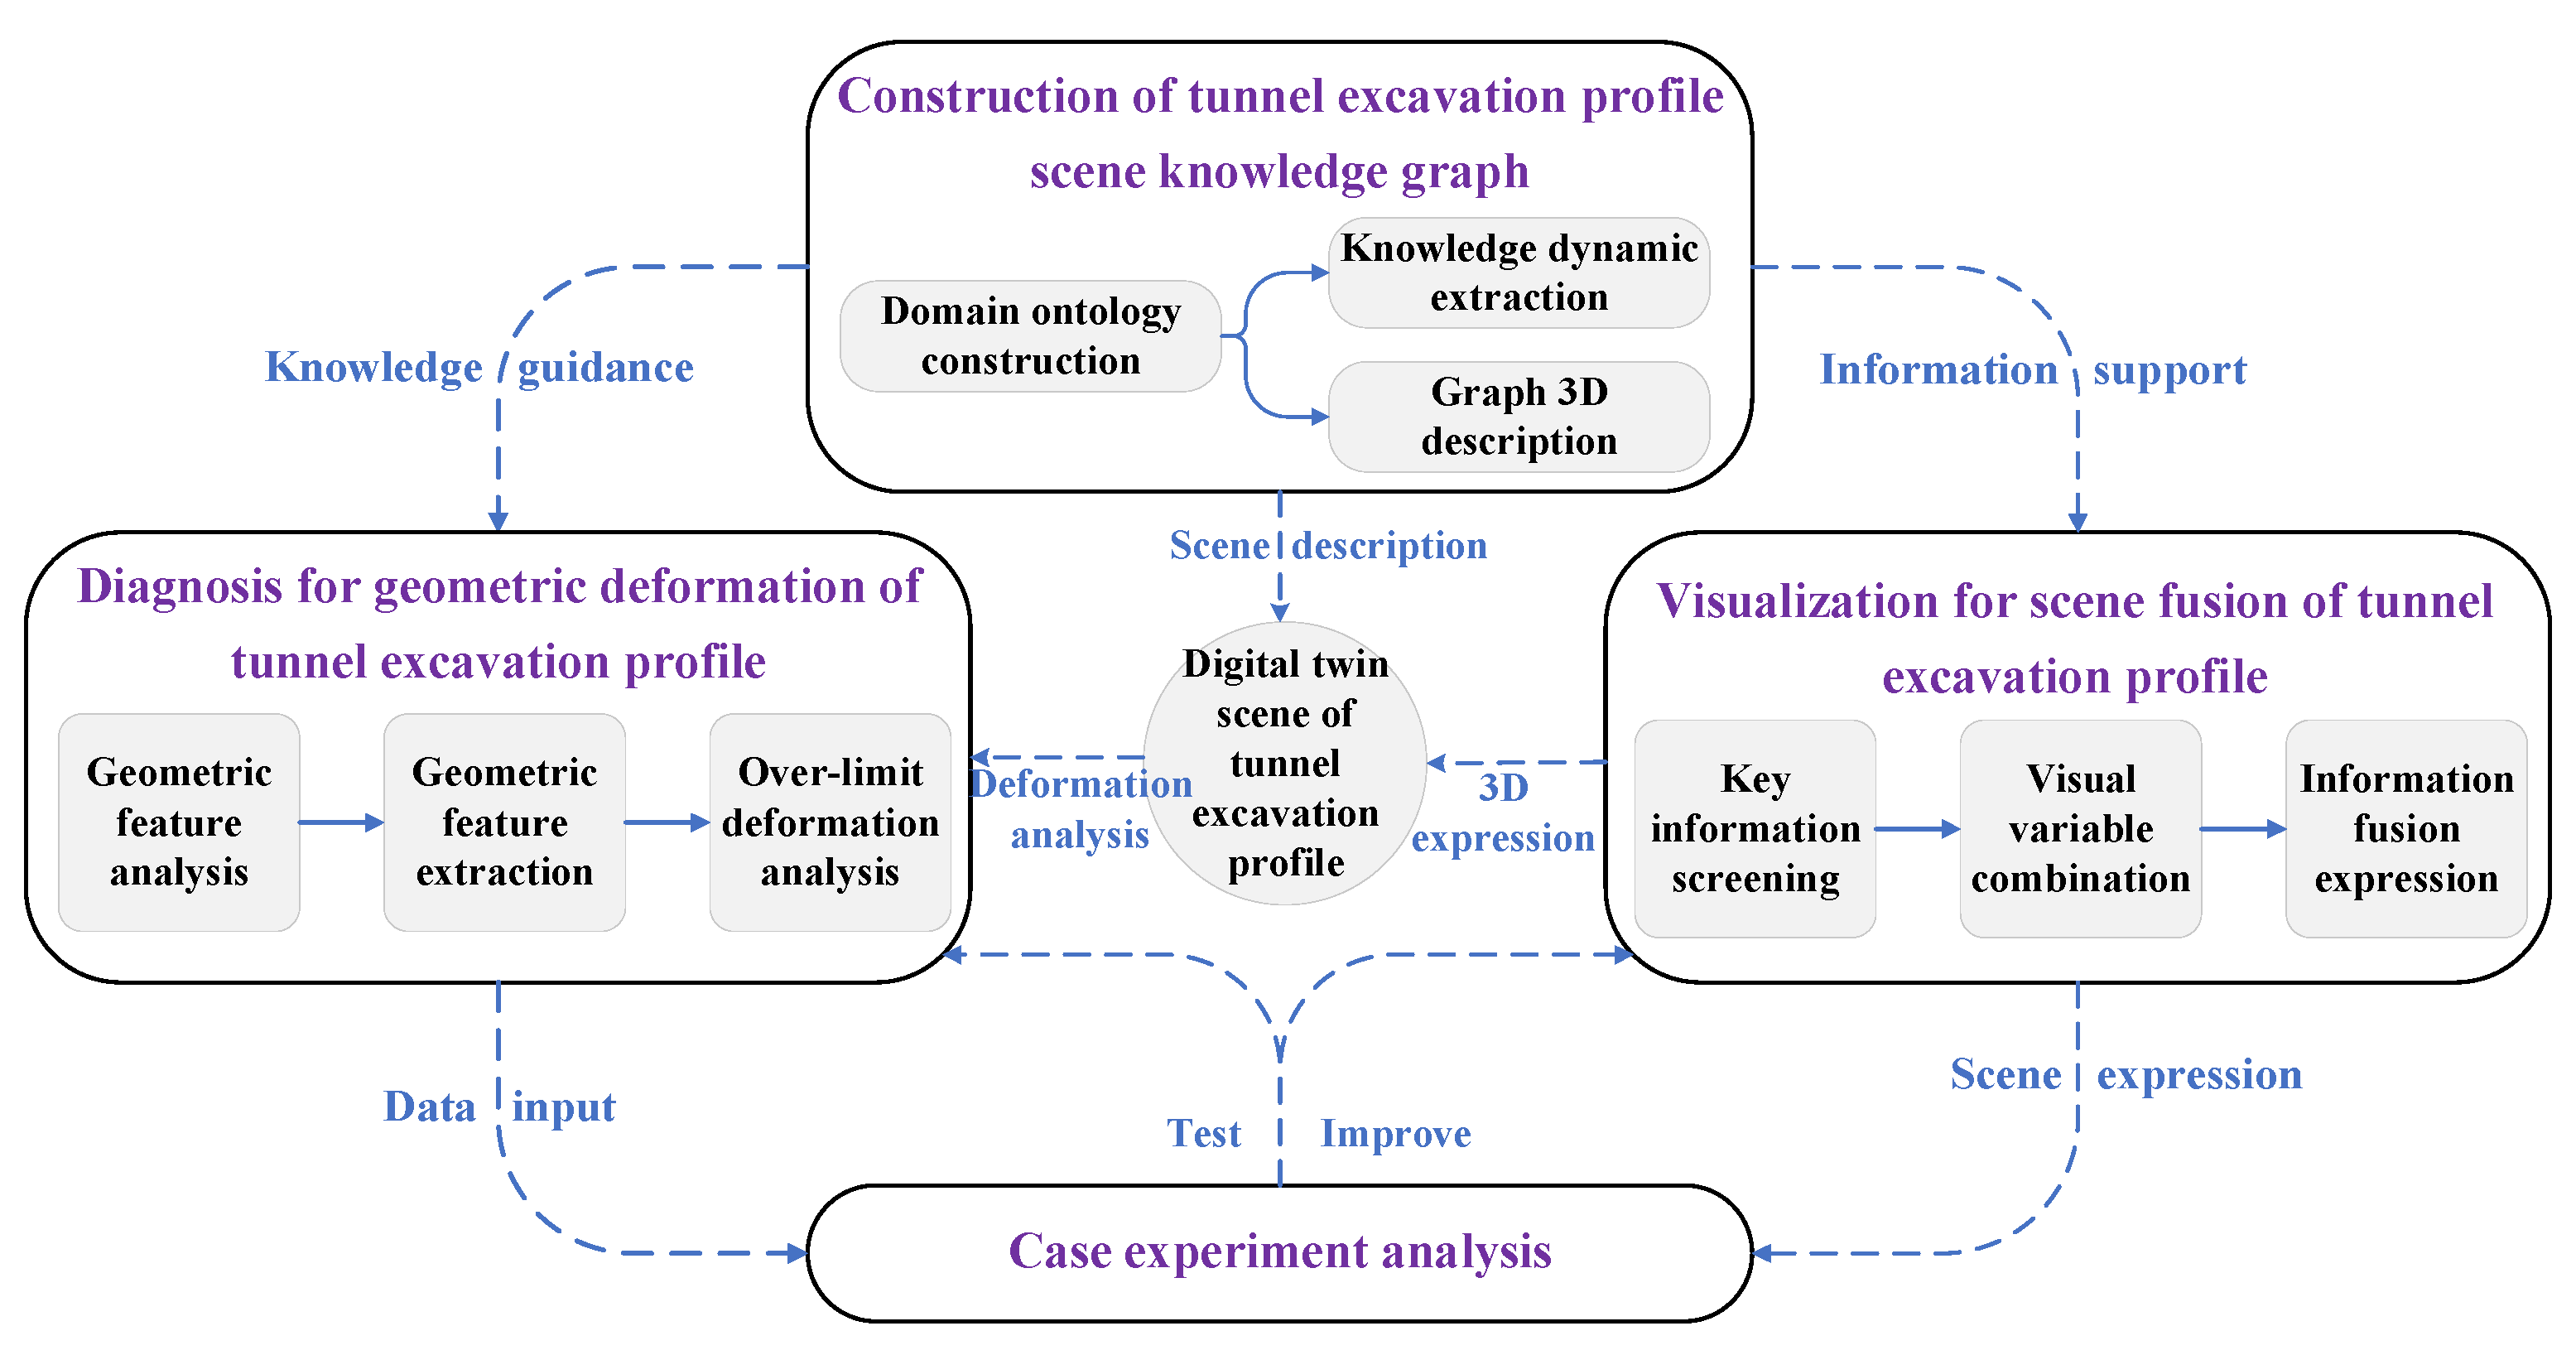
2.1. Framework
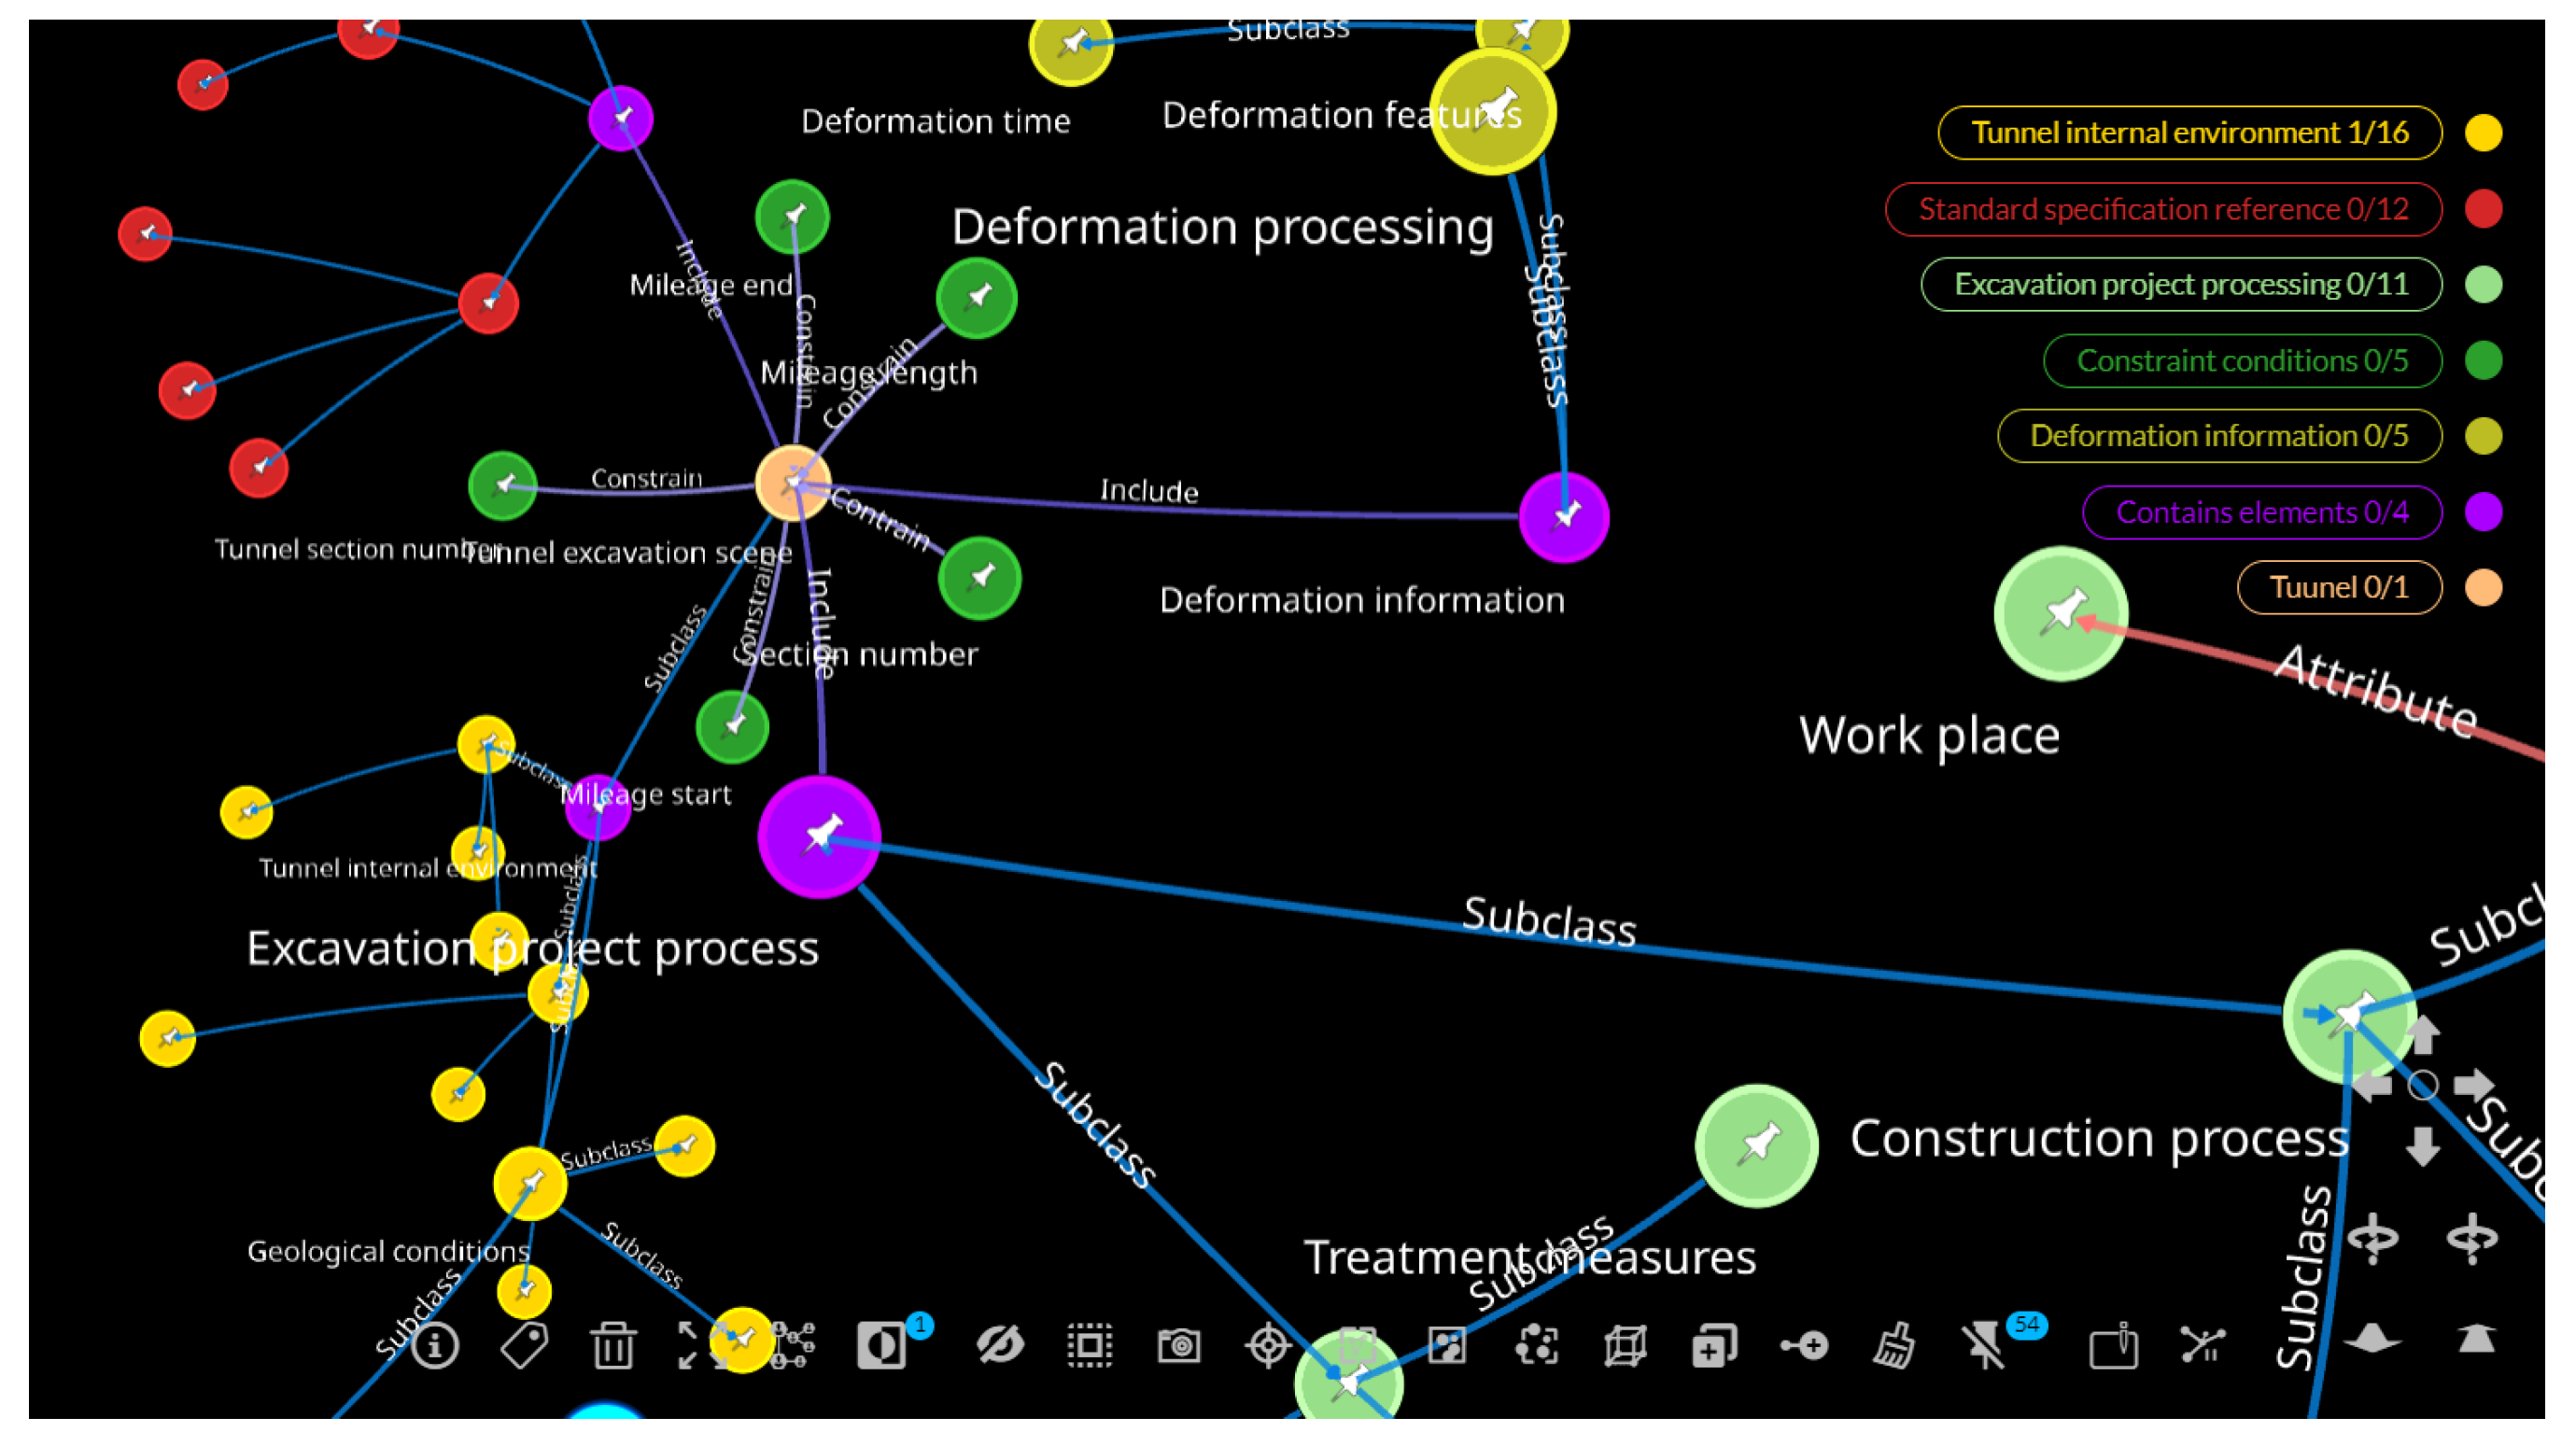
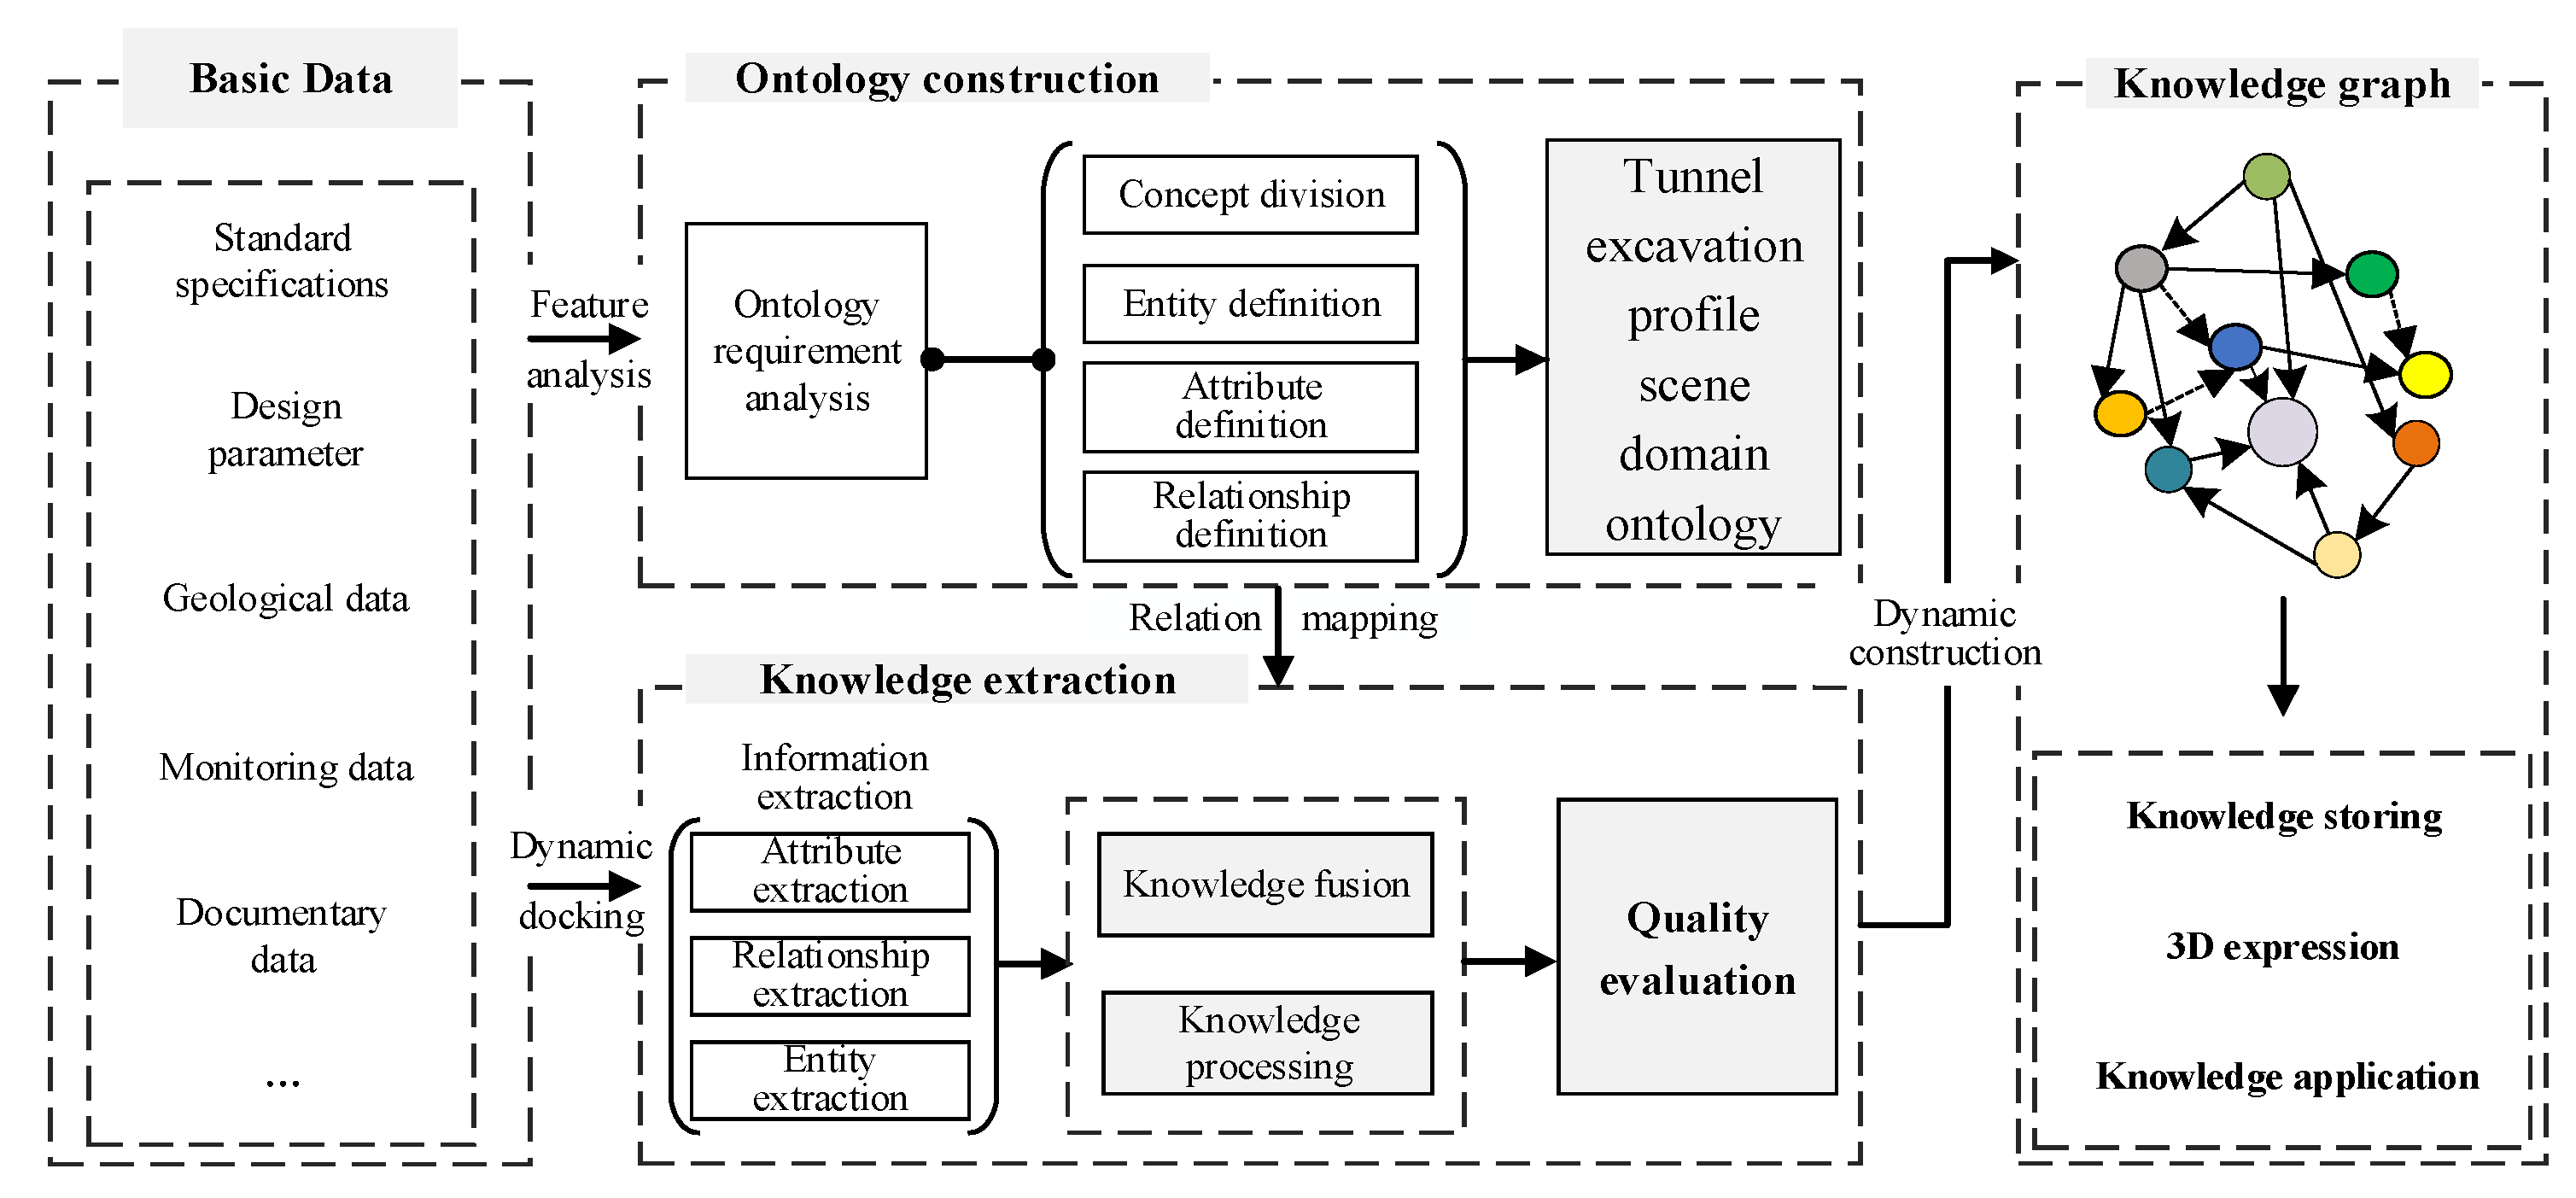
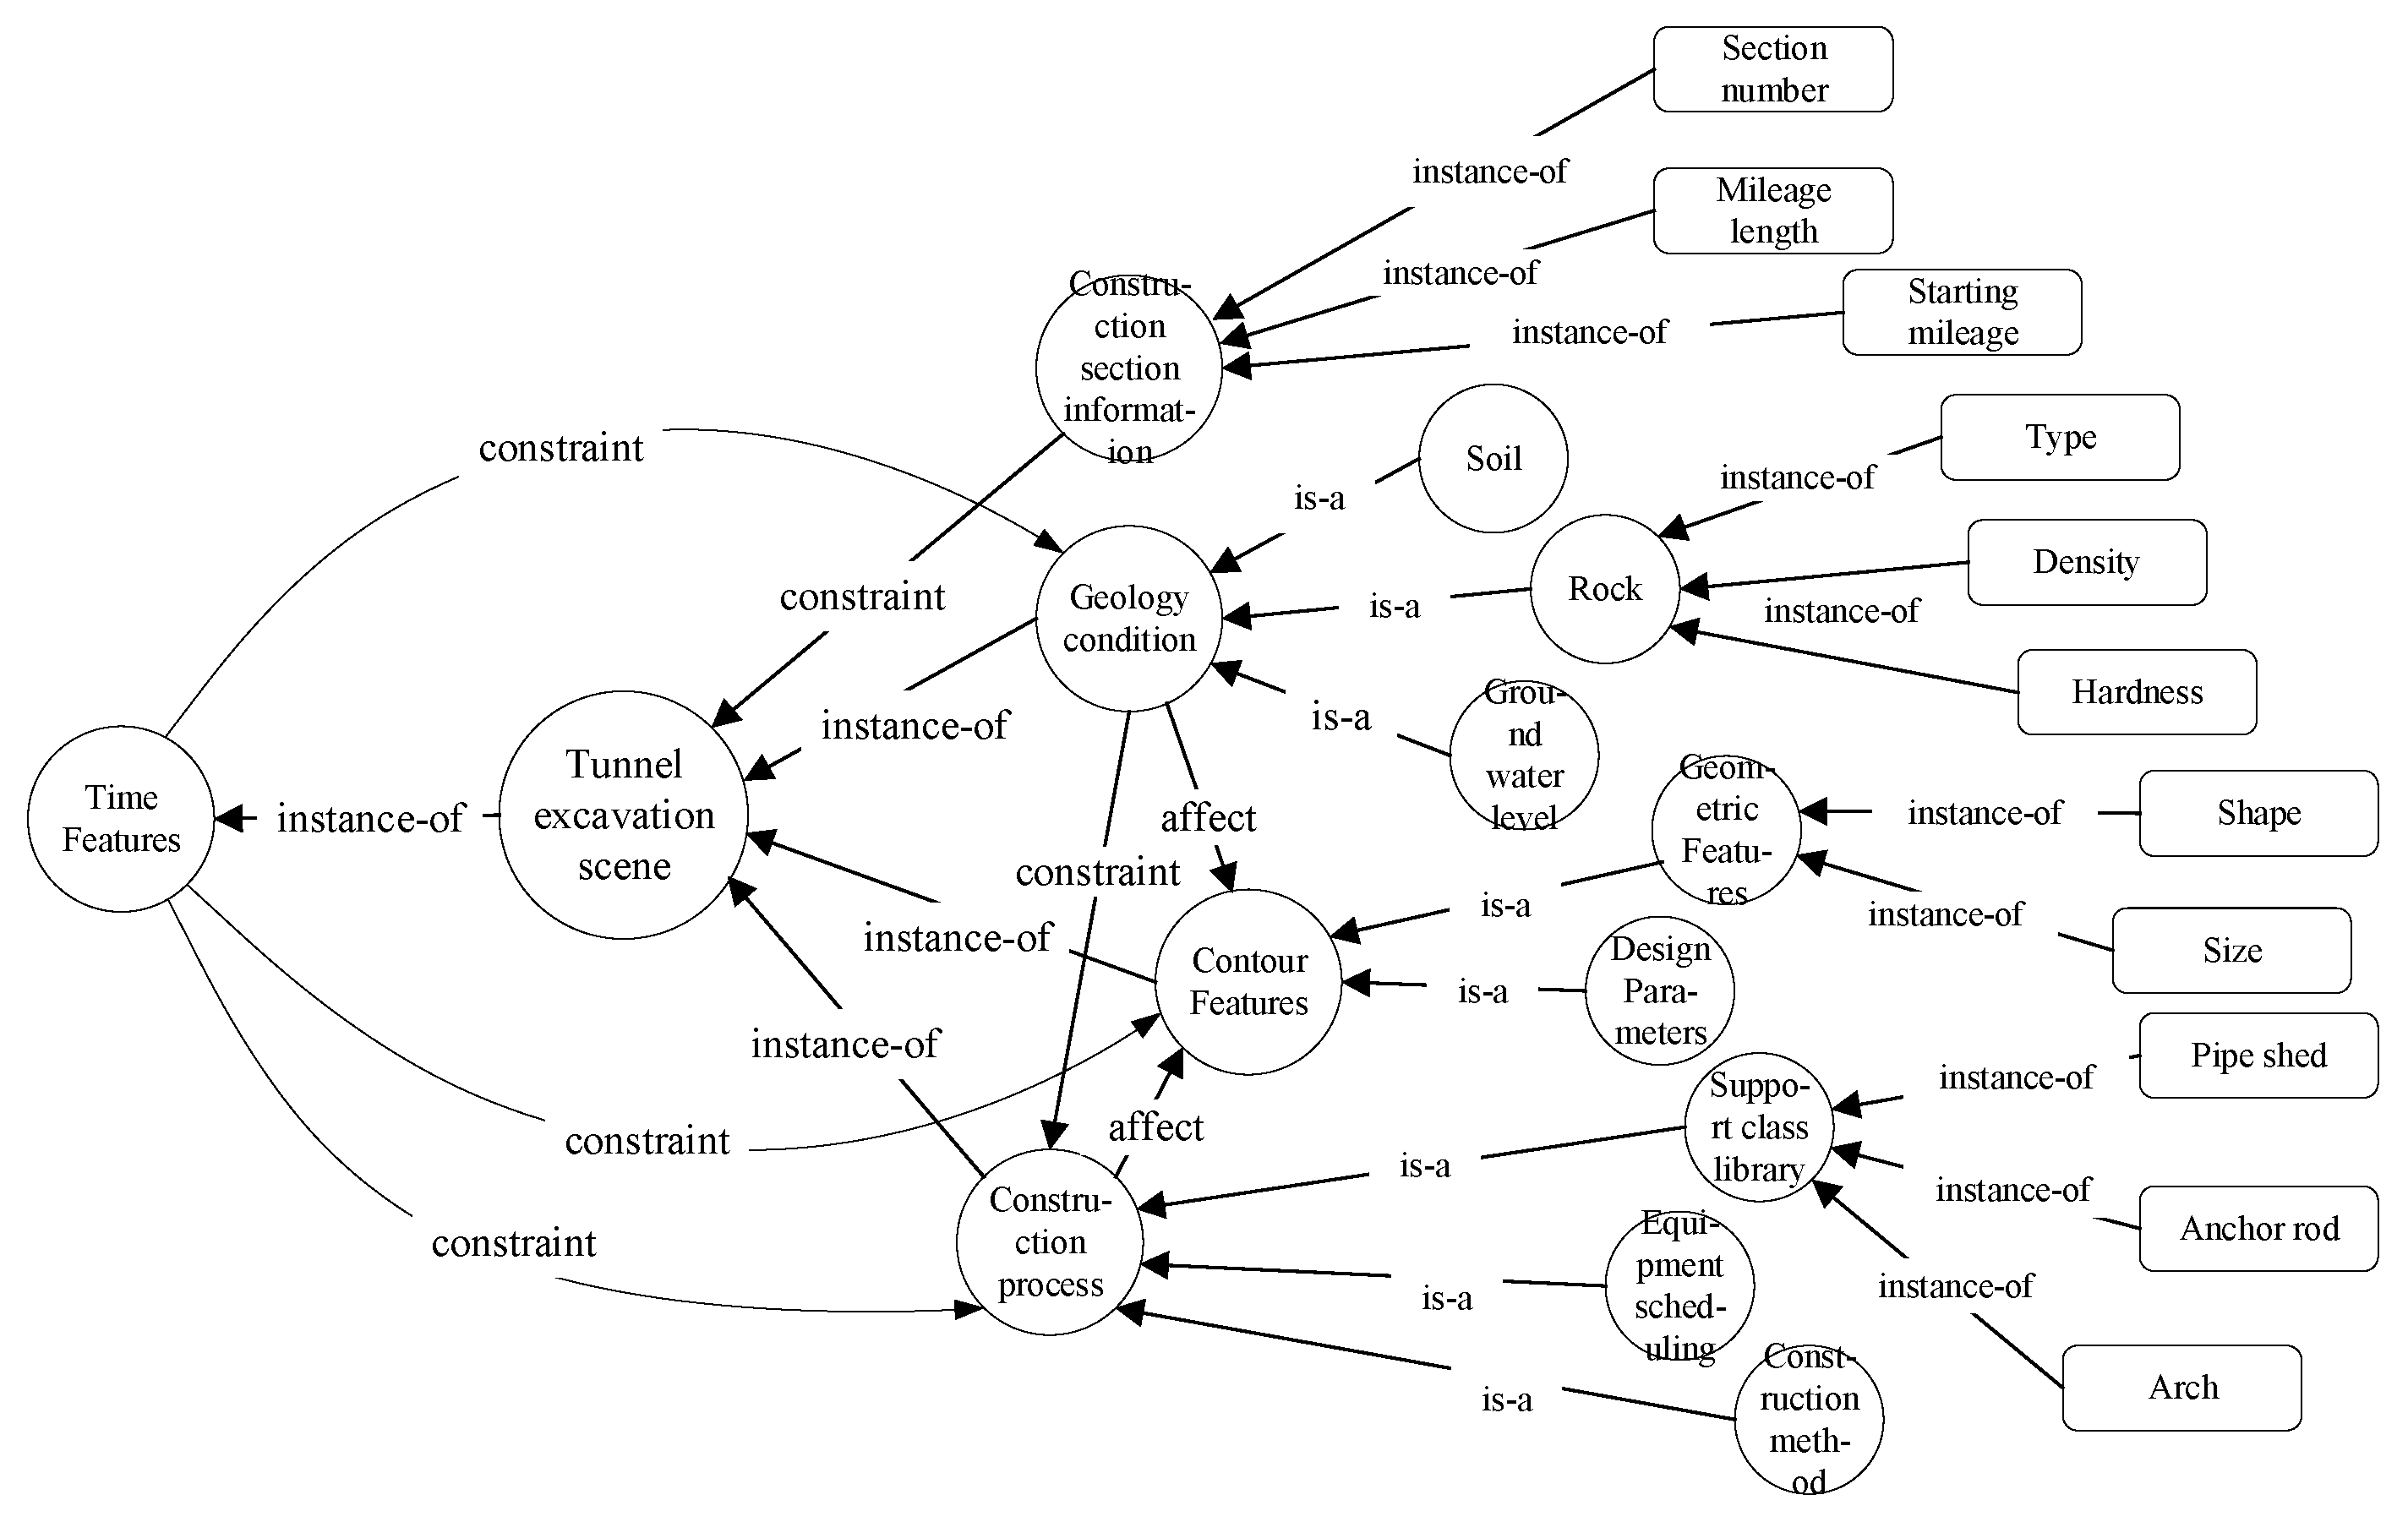
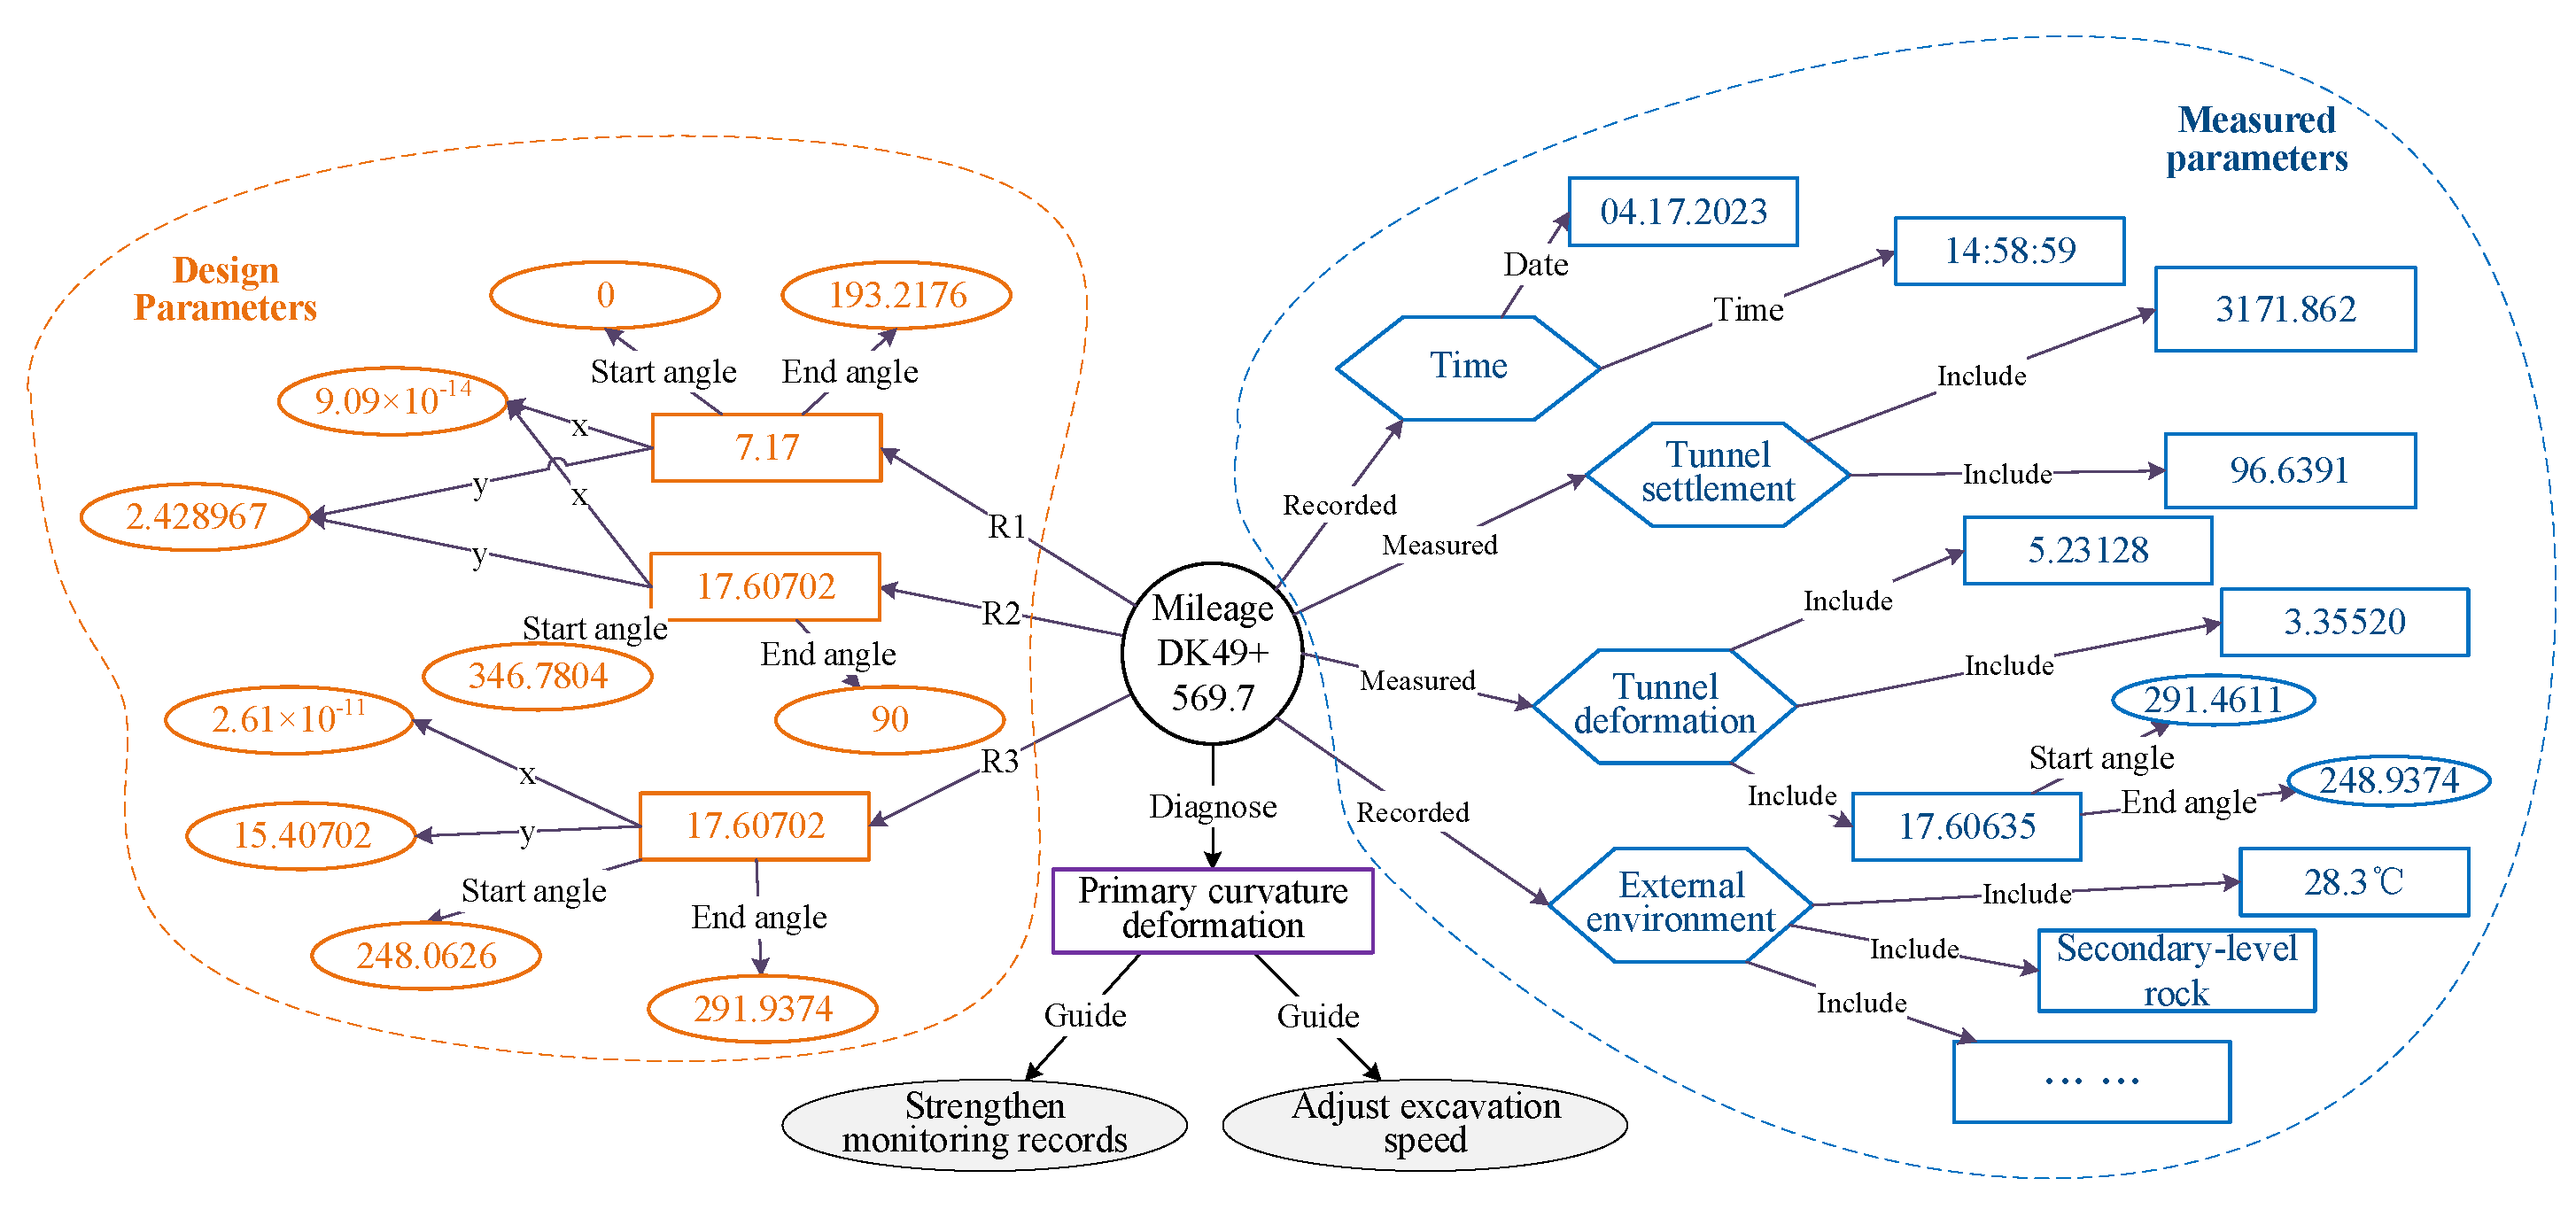
2.2. Dynamic Data-Driven Construction of Knowledge Graphs for Twin Tunnel Excavation Scene
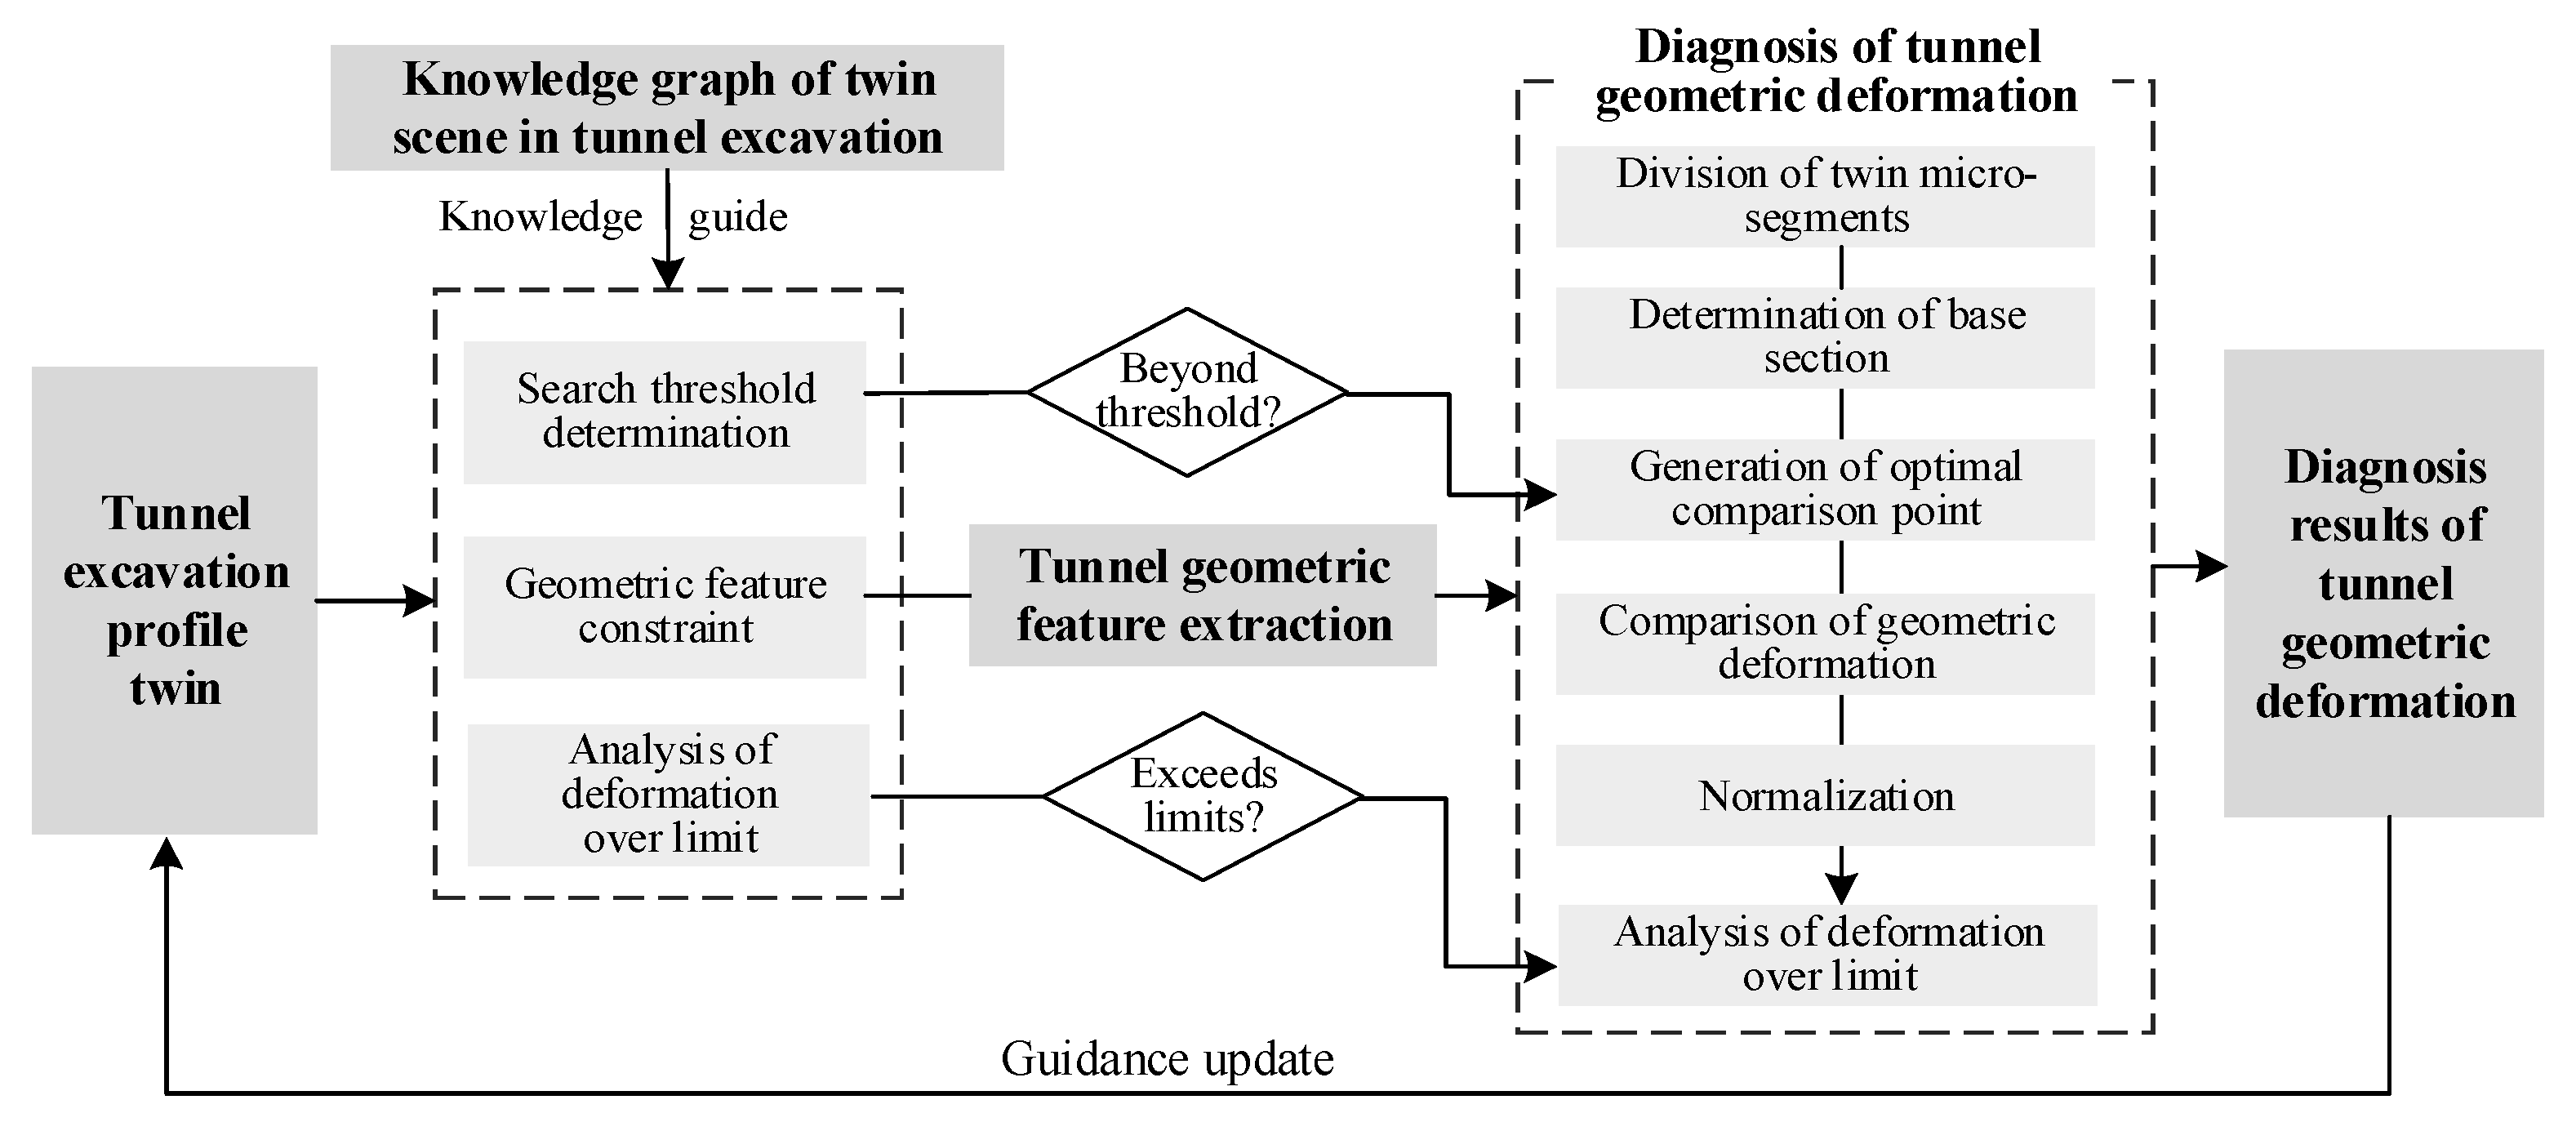
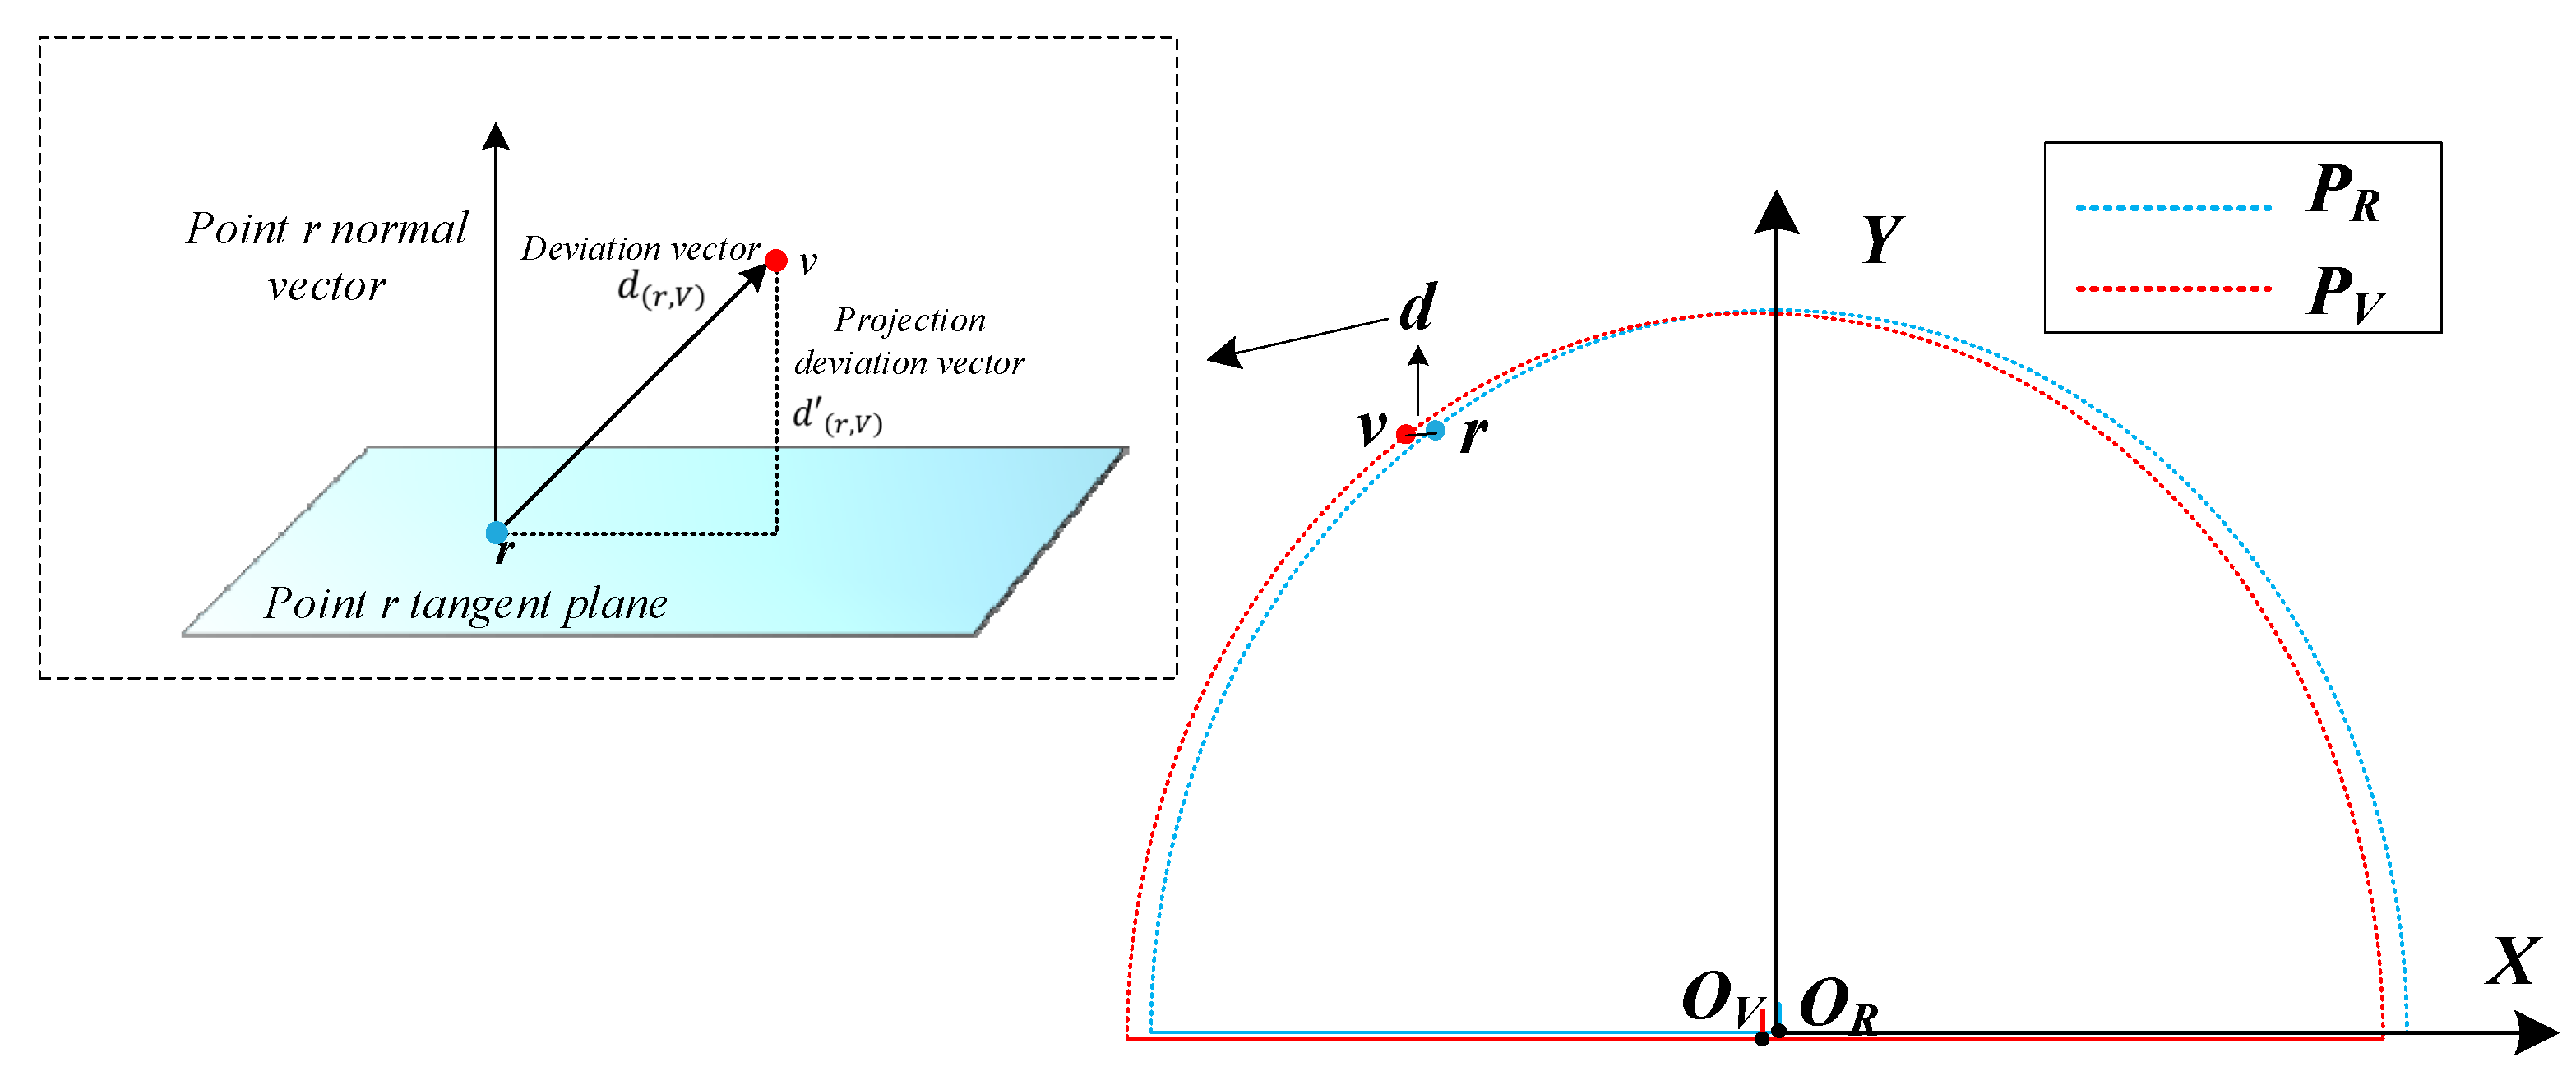
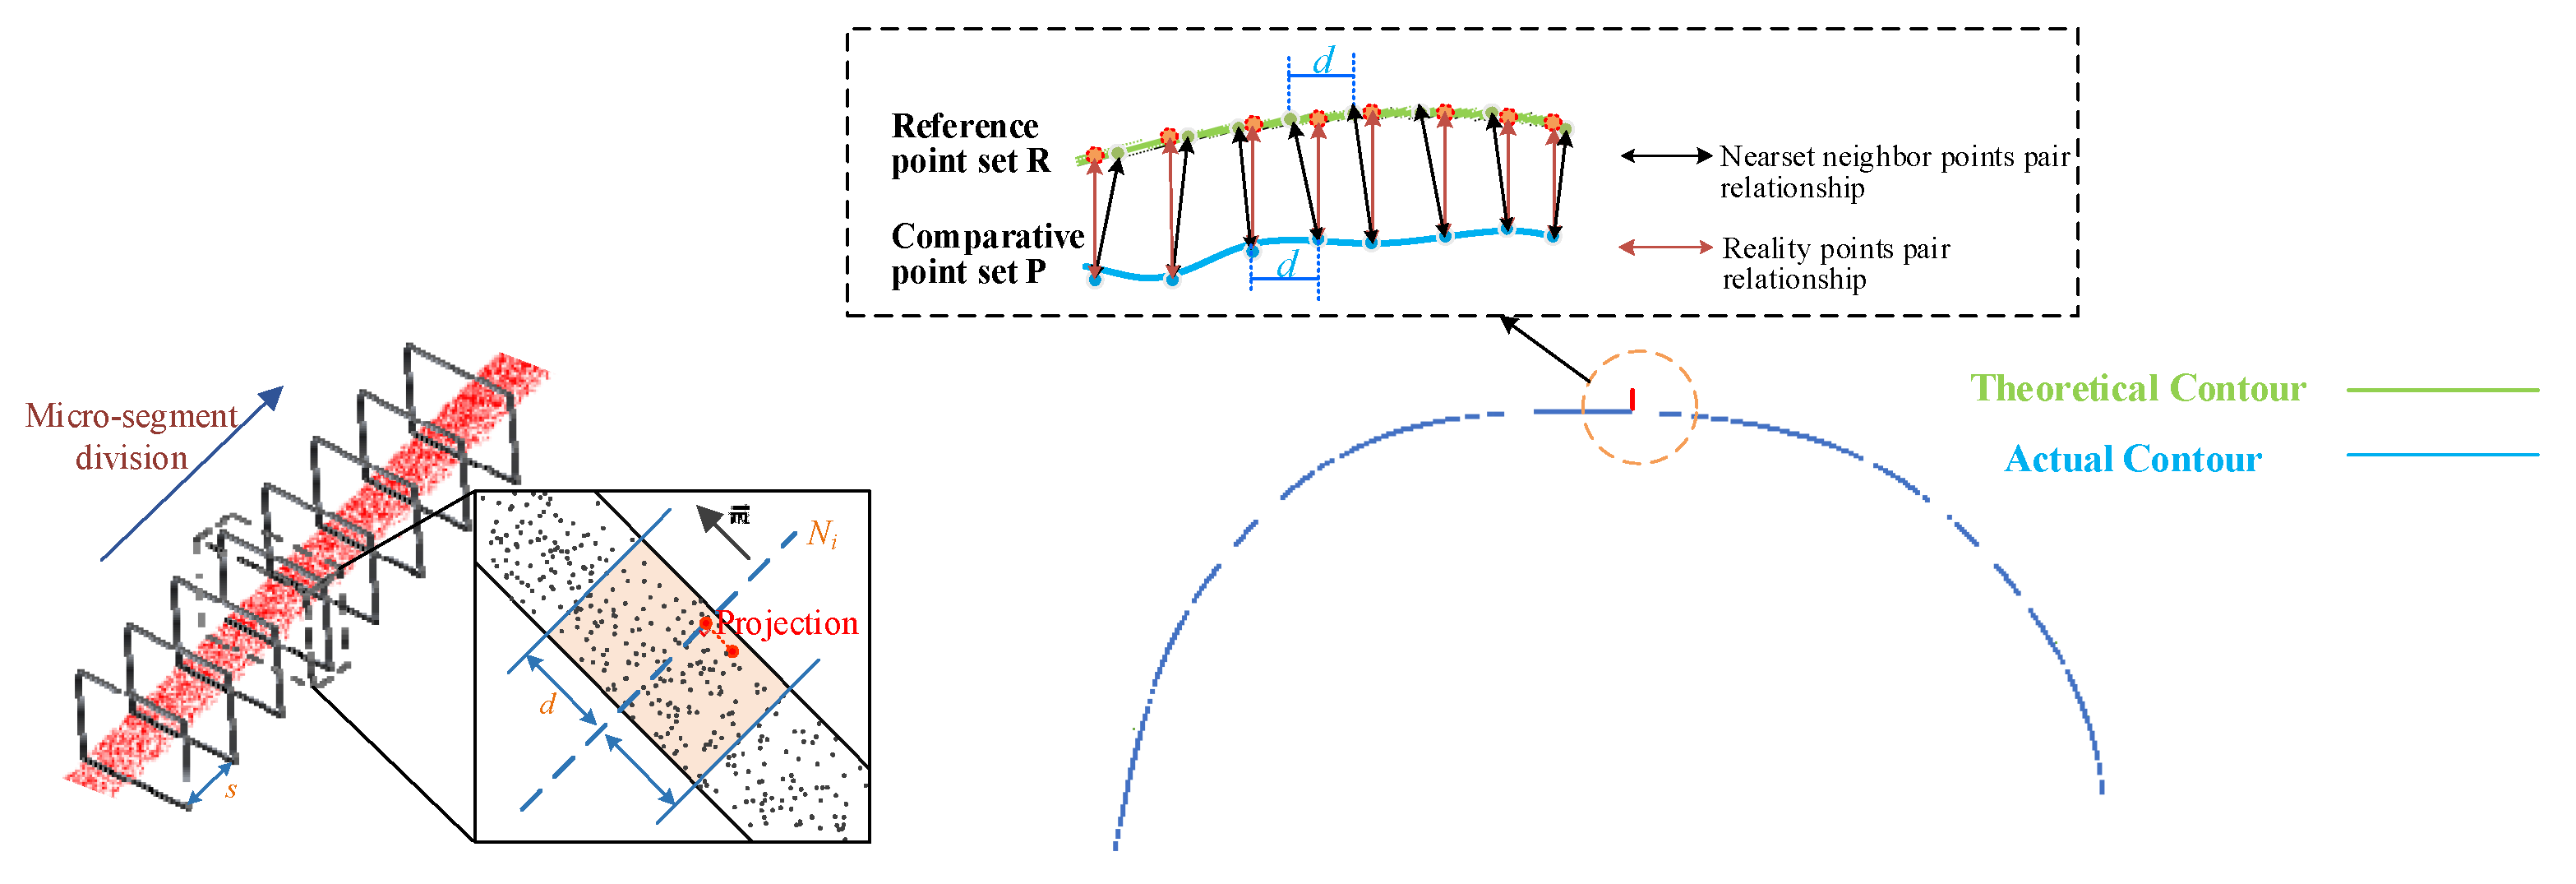
2.3. Knowledge-Guided Geometric Deformation Intelligent Diagnosis Algorithm of Tunnel Excavation Profile Twin
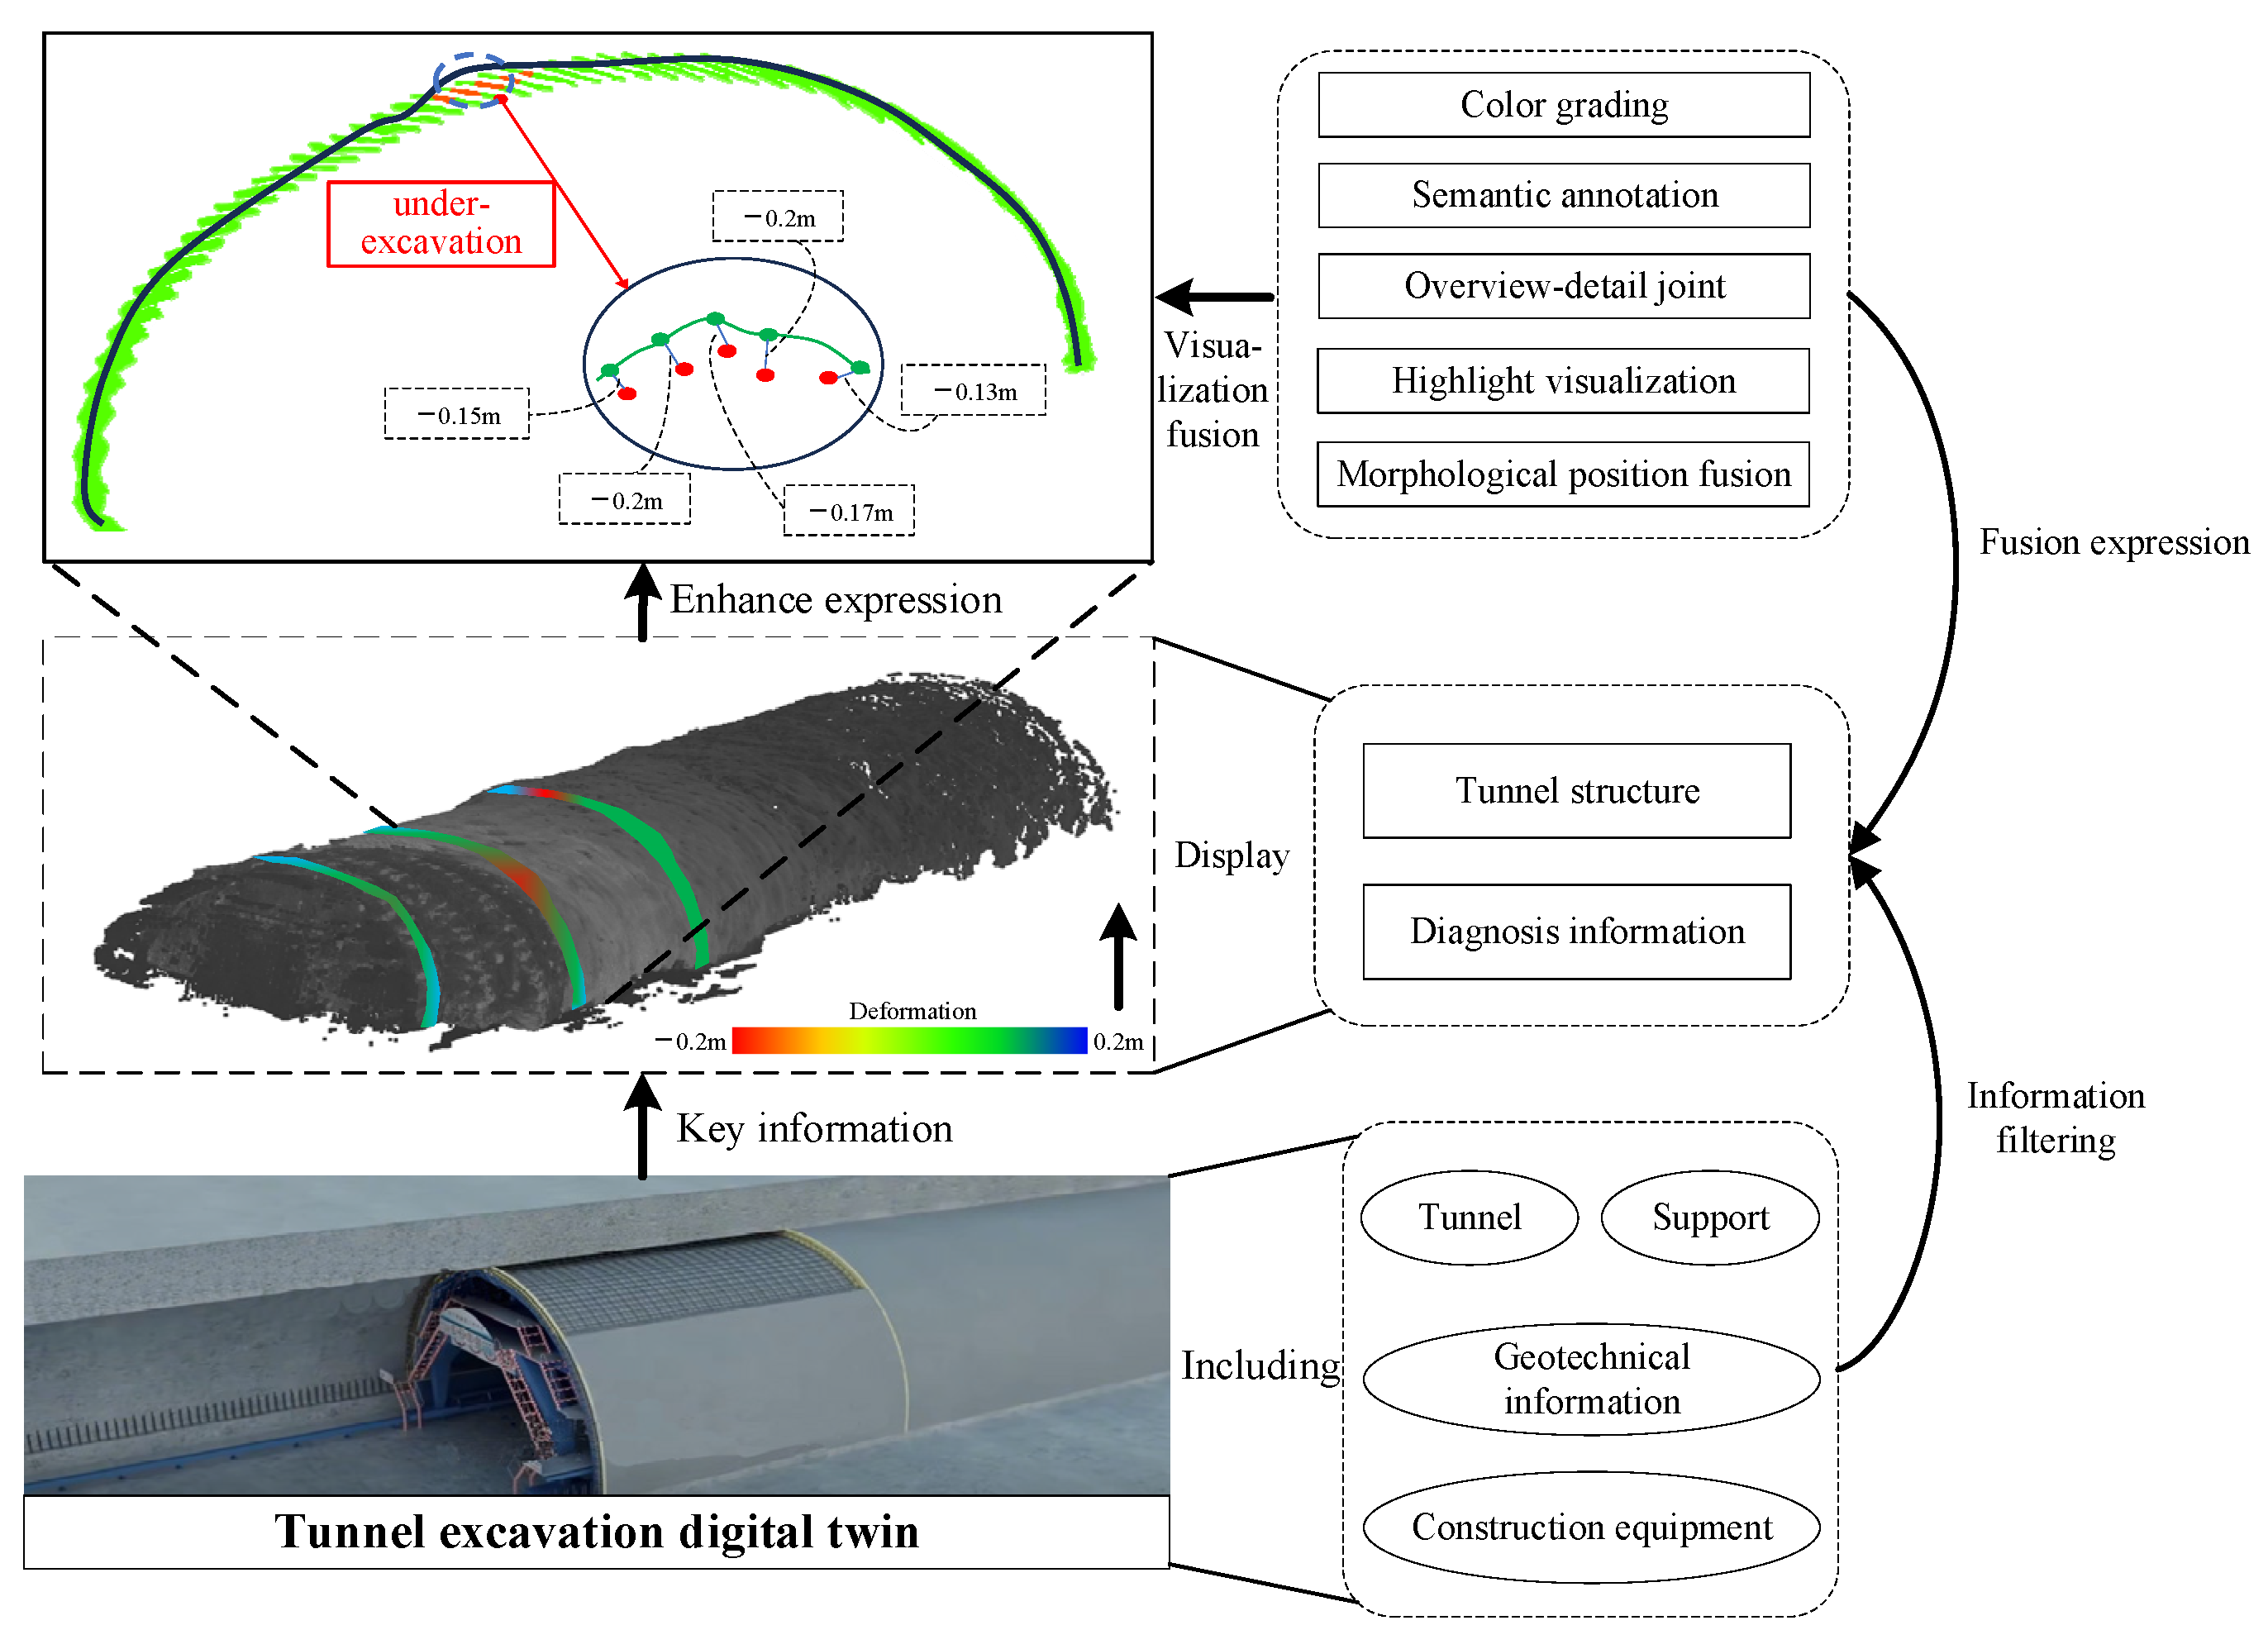
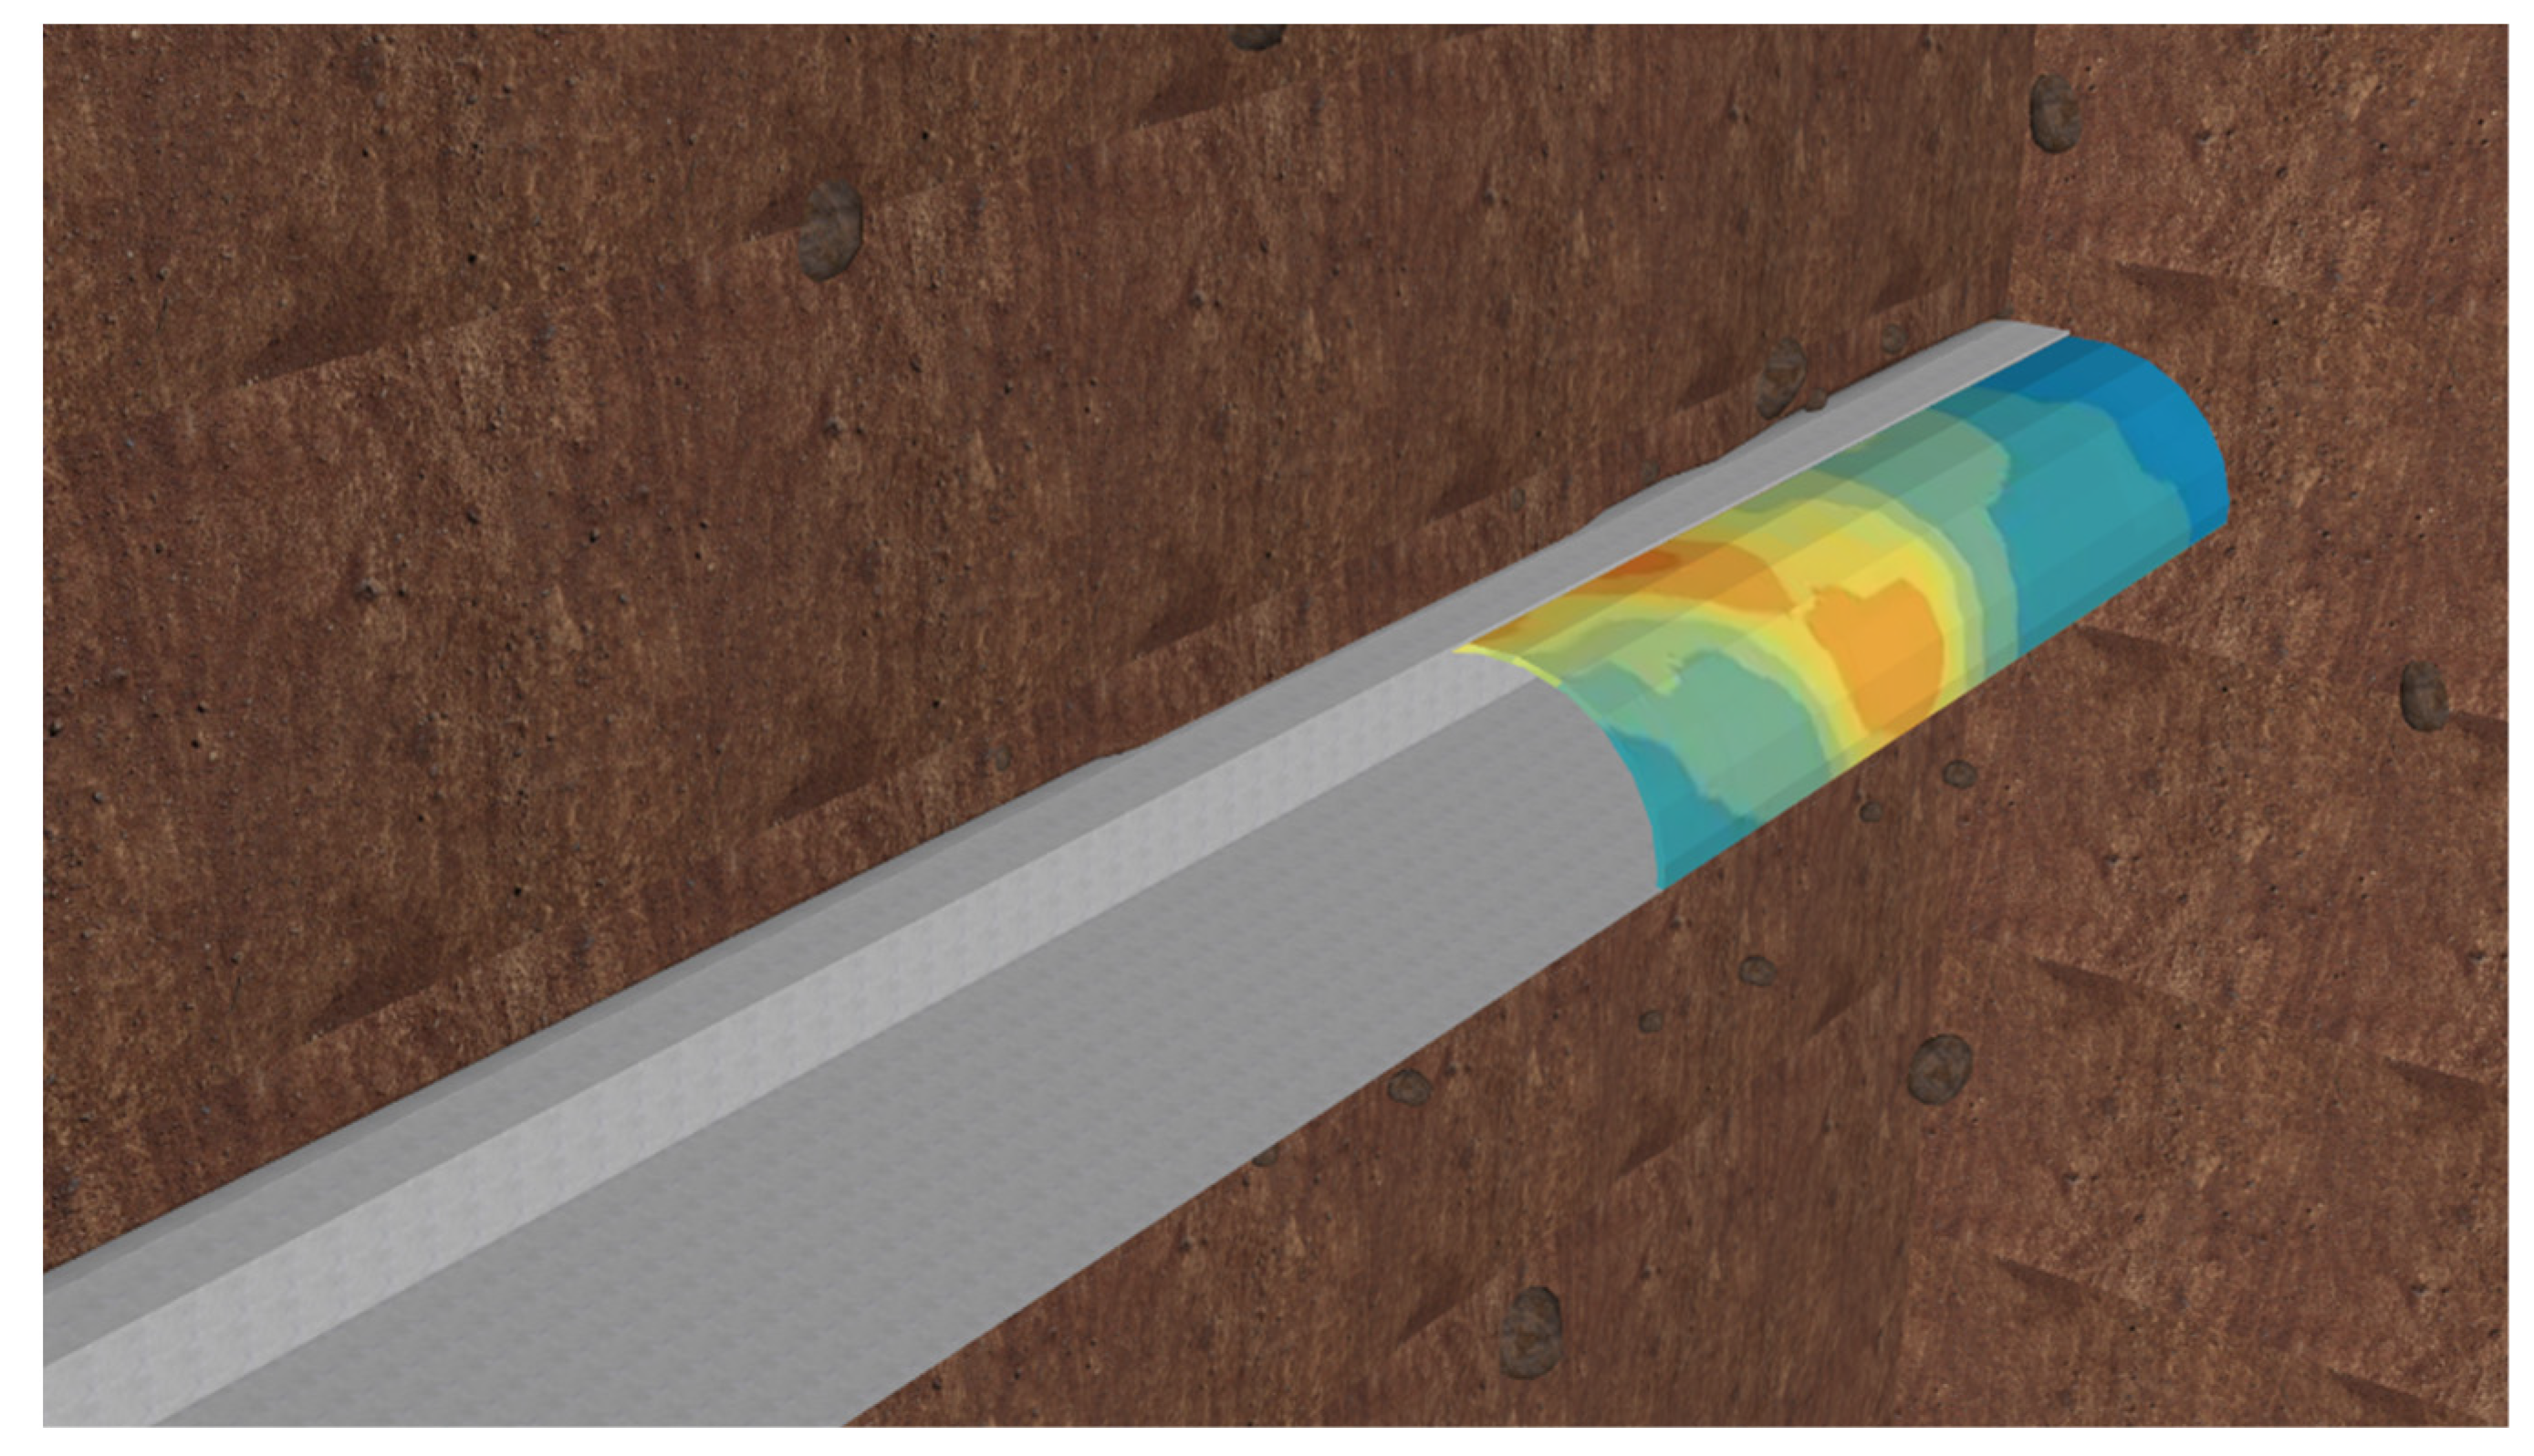
2.4. Multivariate Visual Variable Integration in the Digital Twin Visualization of Tunnel Excavation Scenes
3. Experiments and Results
3.1. Case Study
3.2. Experimental Results and Analysis
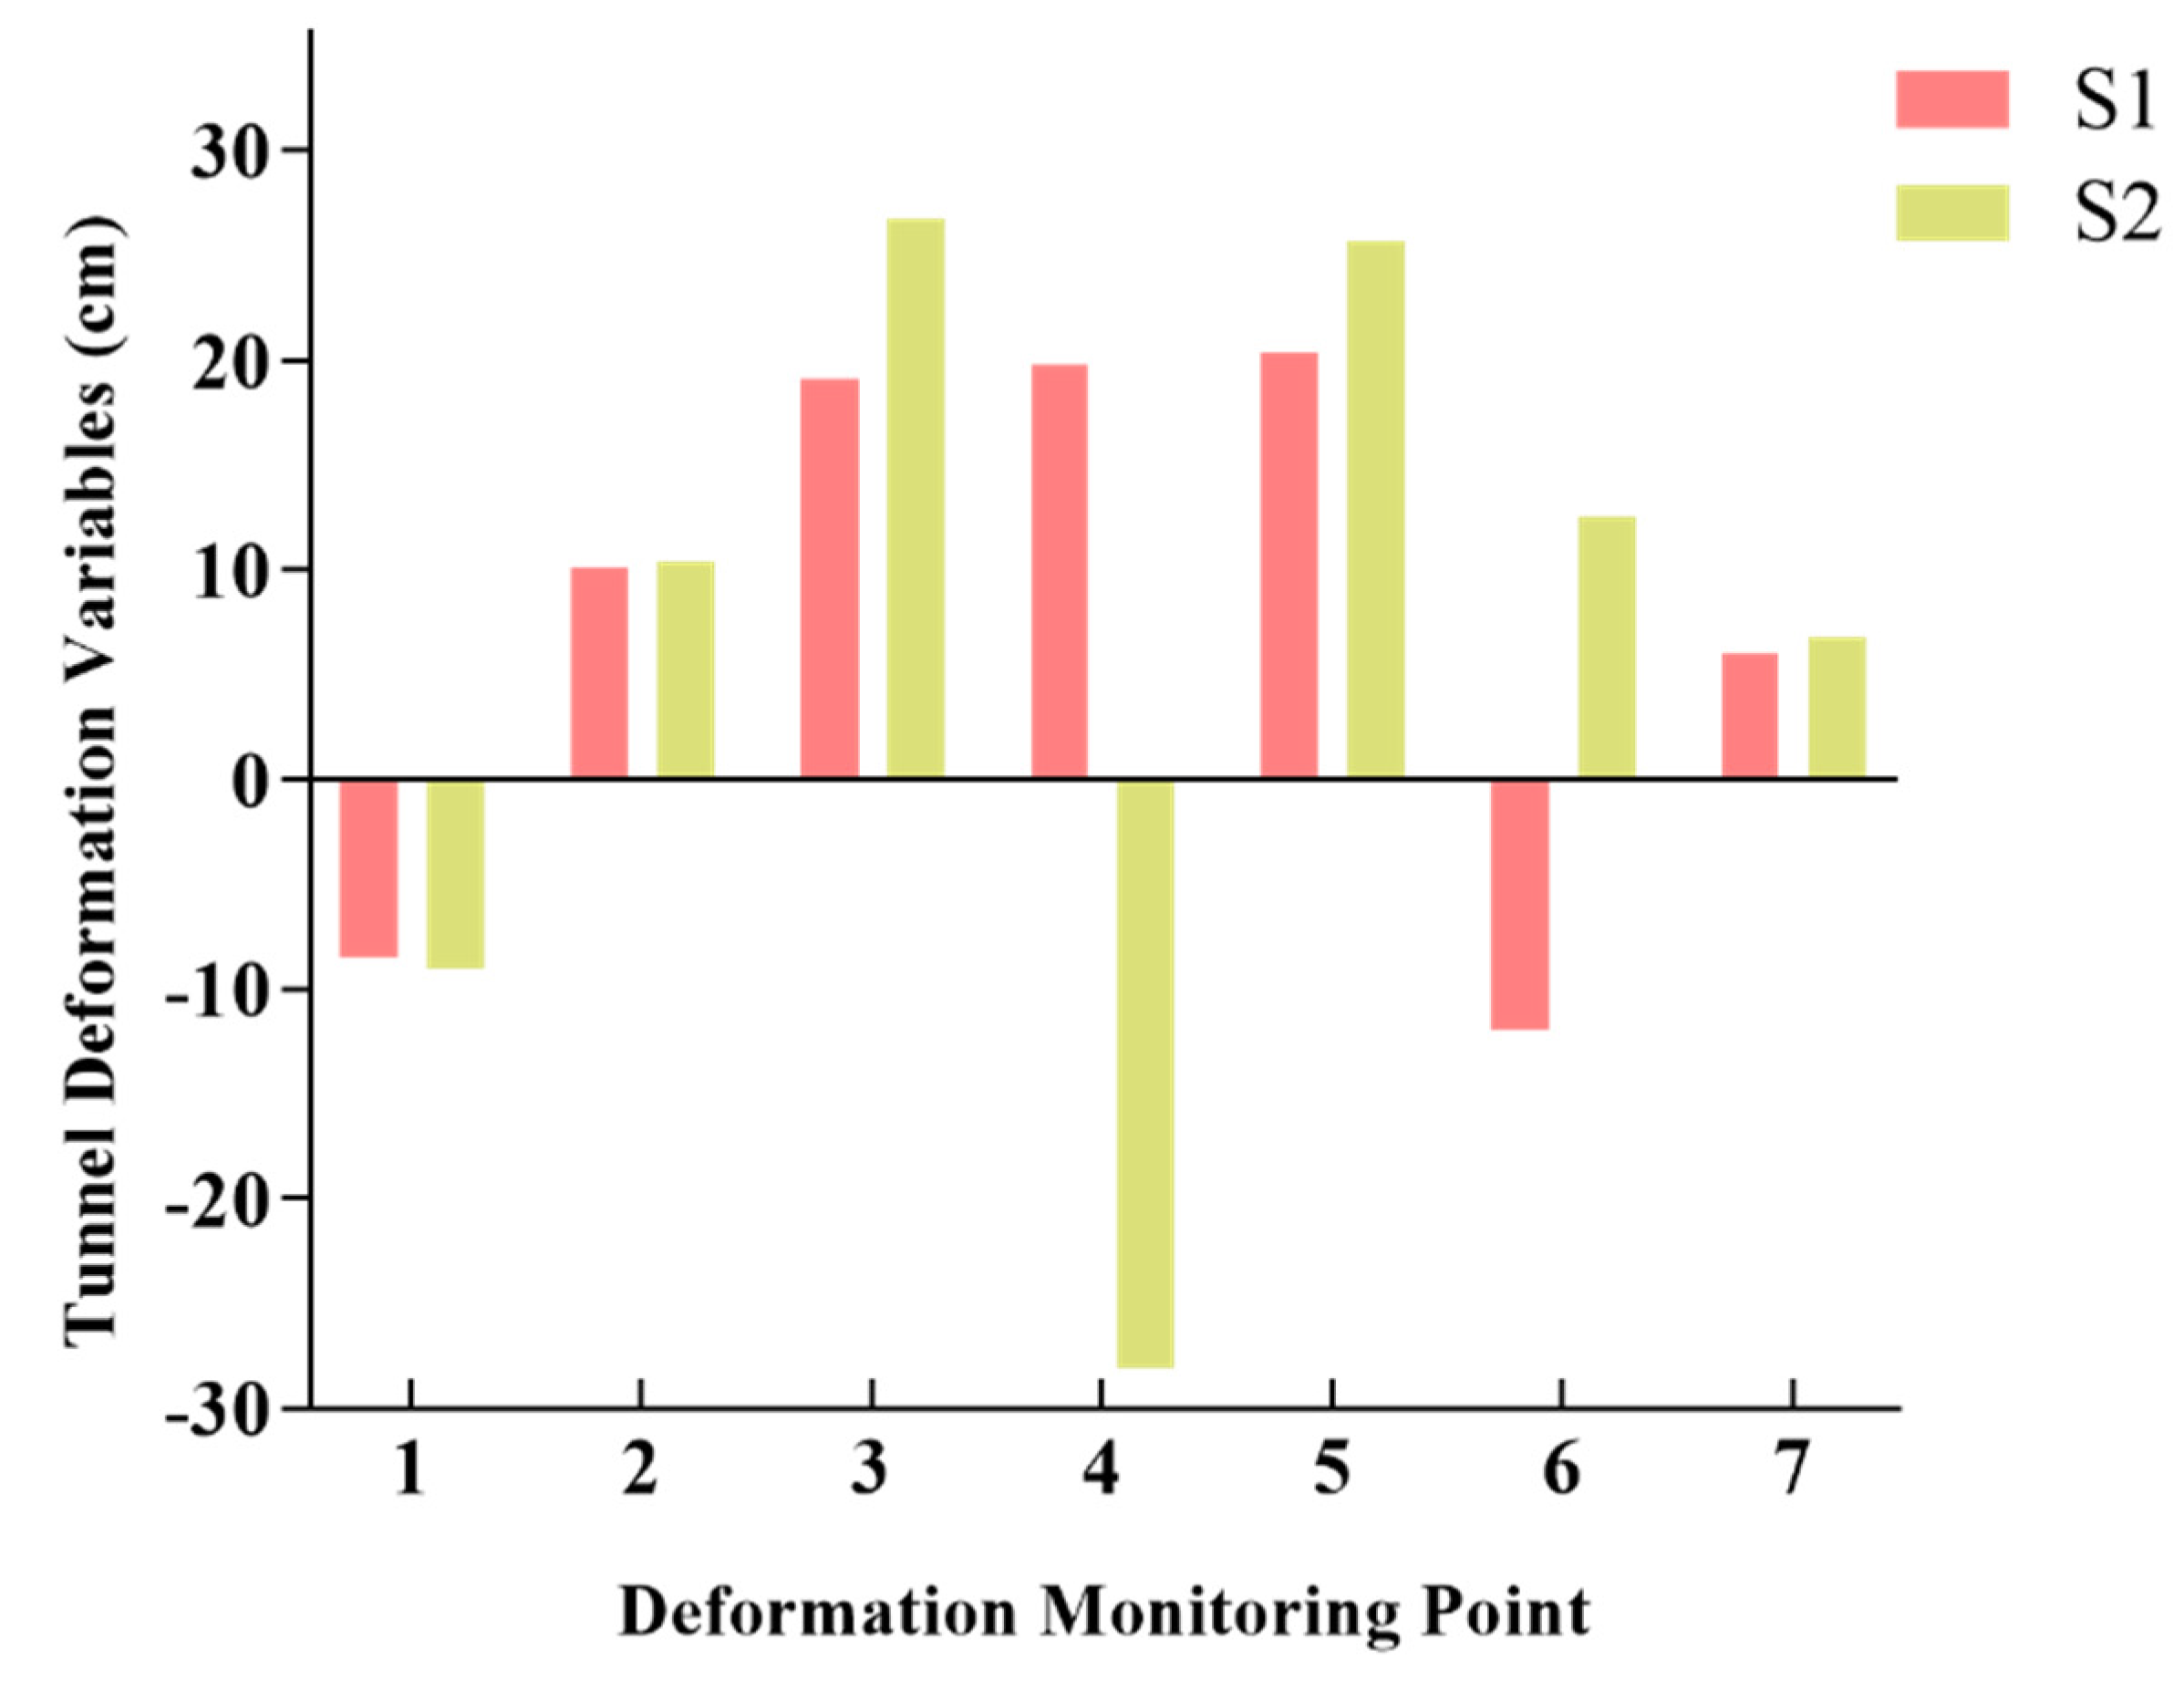
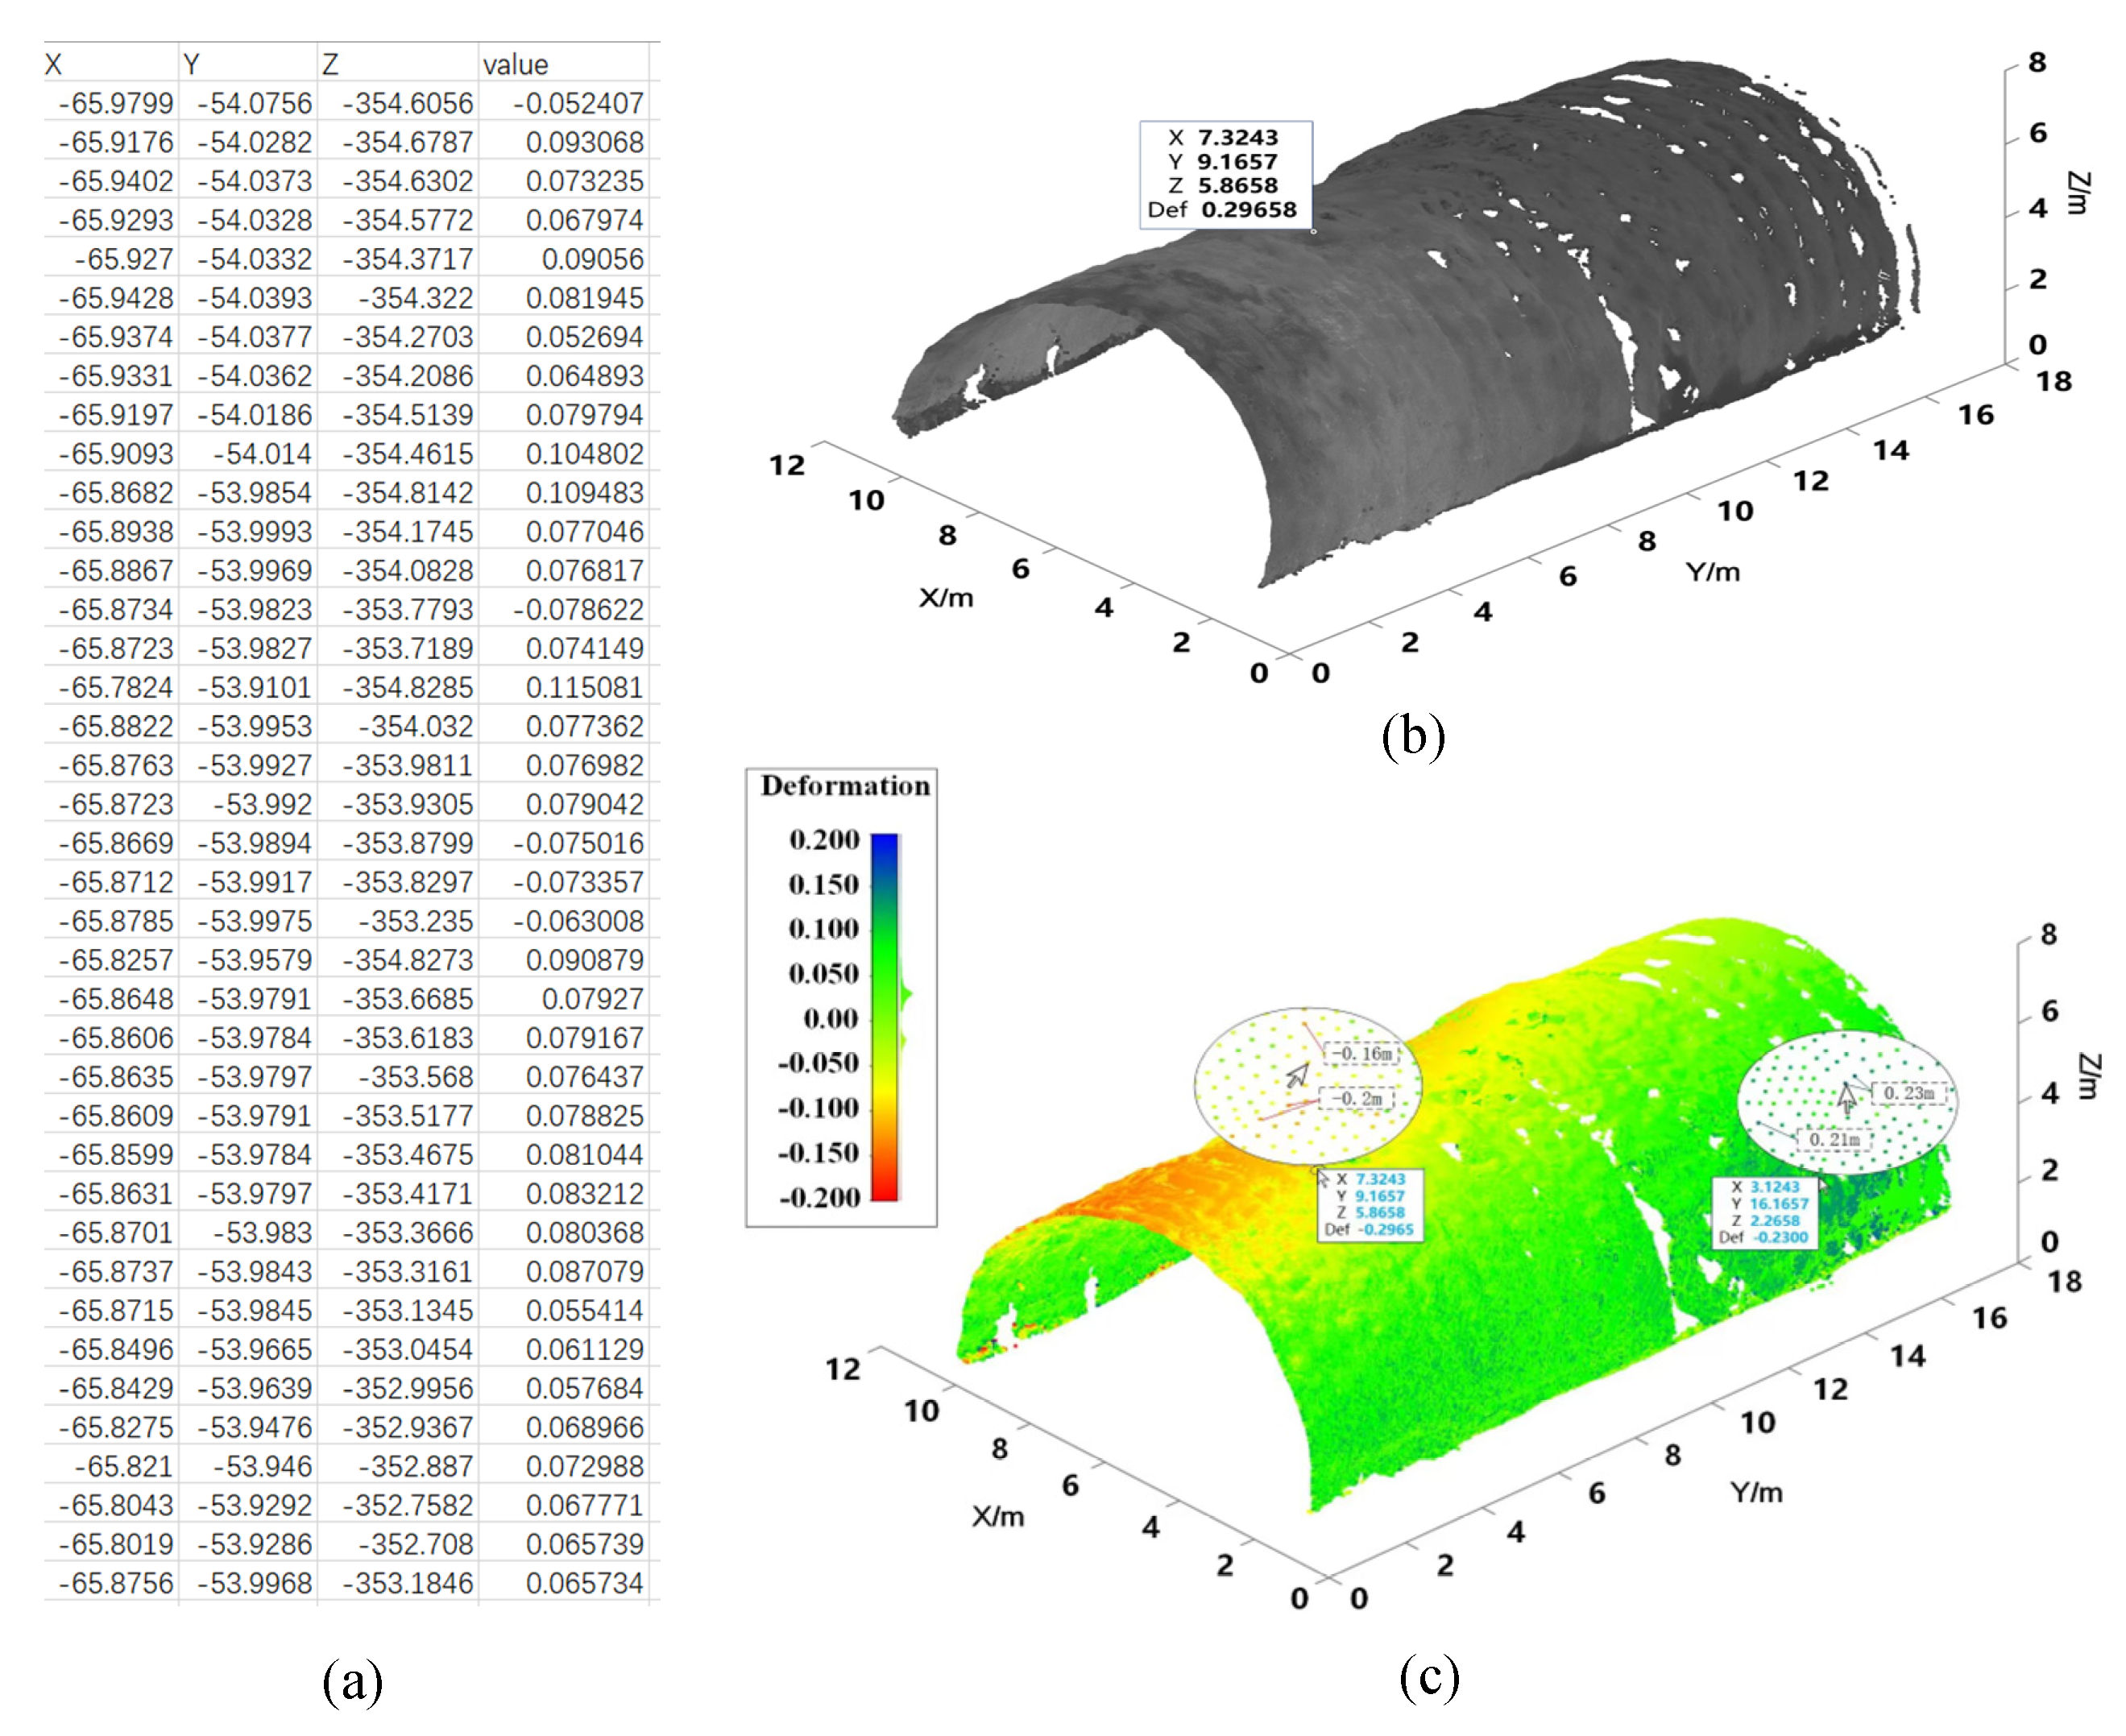
3.2.1. Tunnel Geometric Deformation Diagnosis Experiment and Analysis
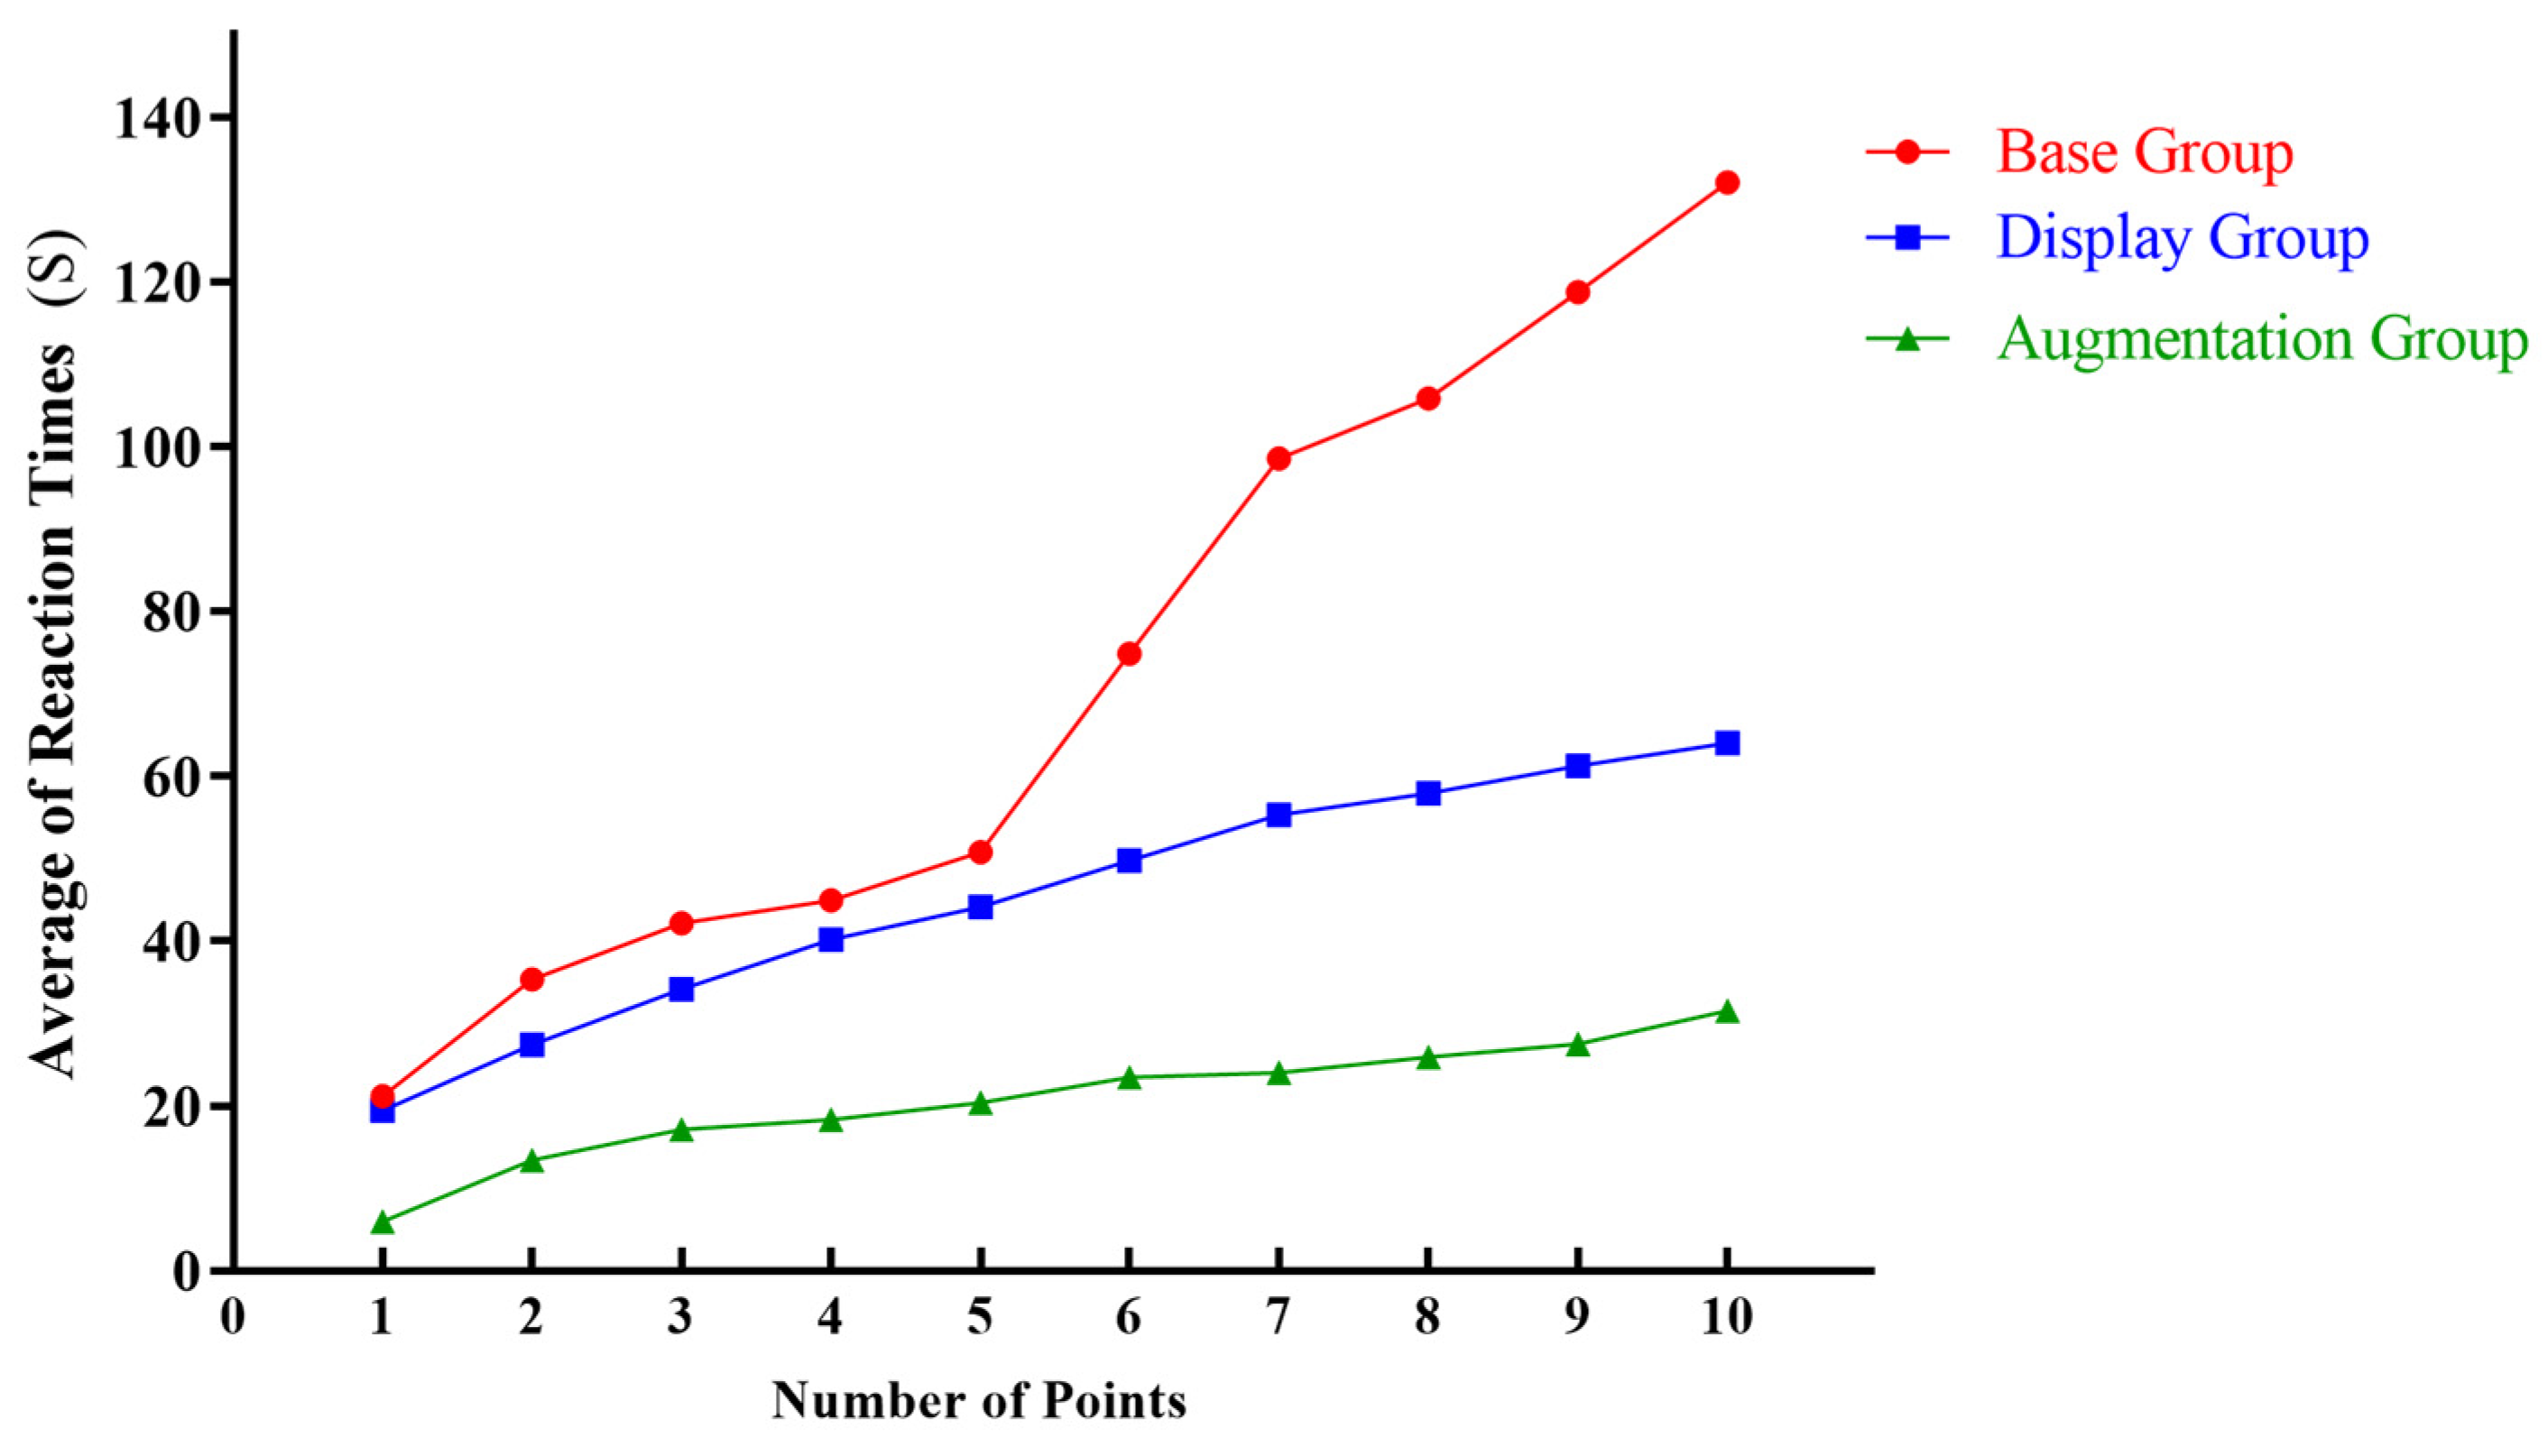
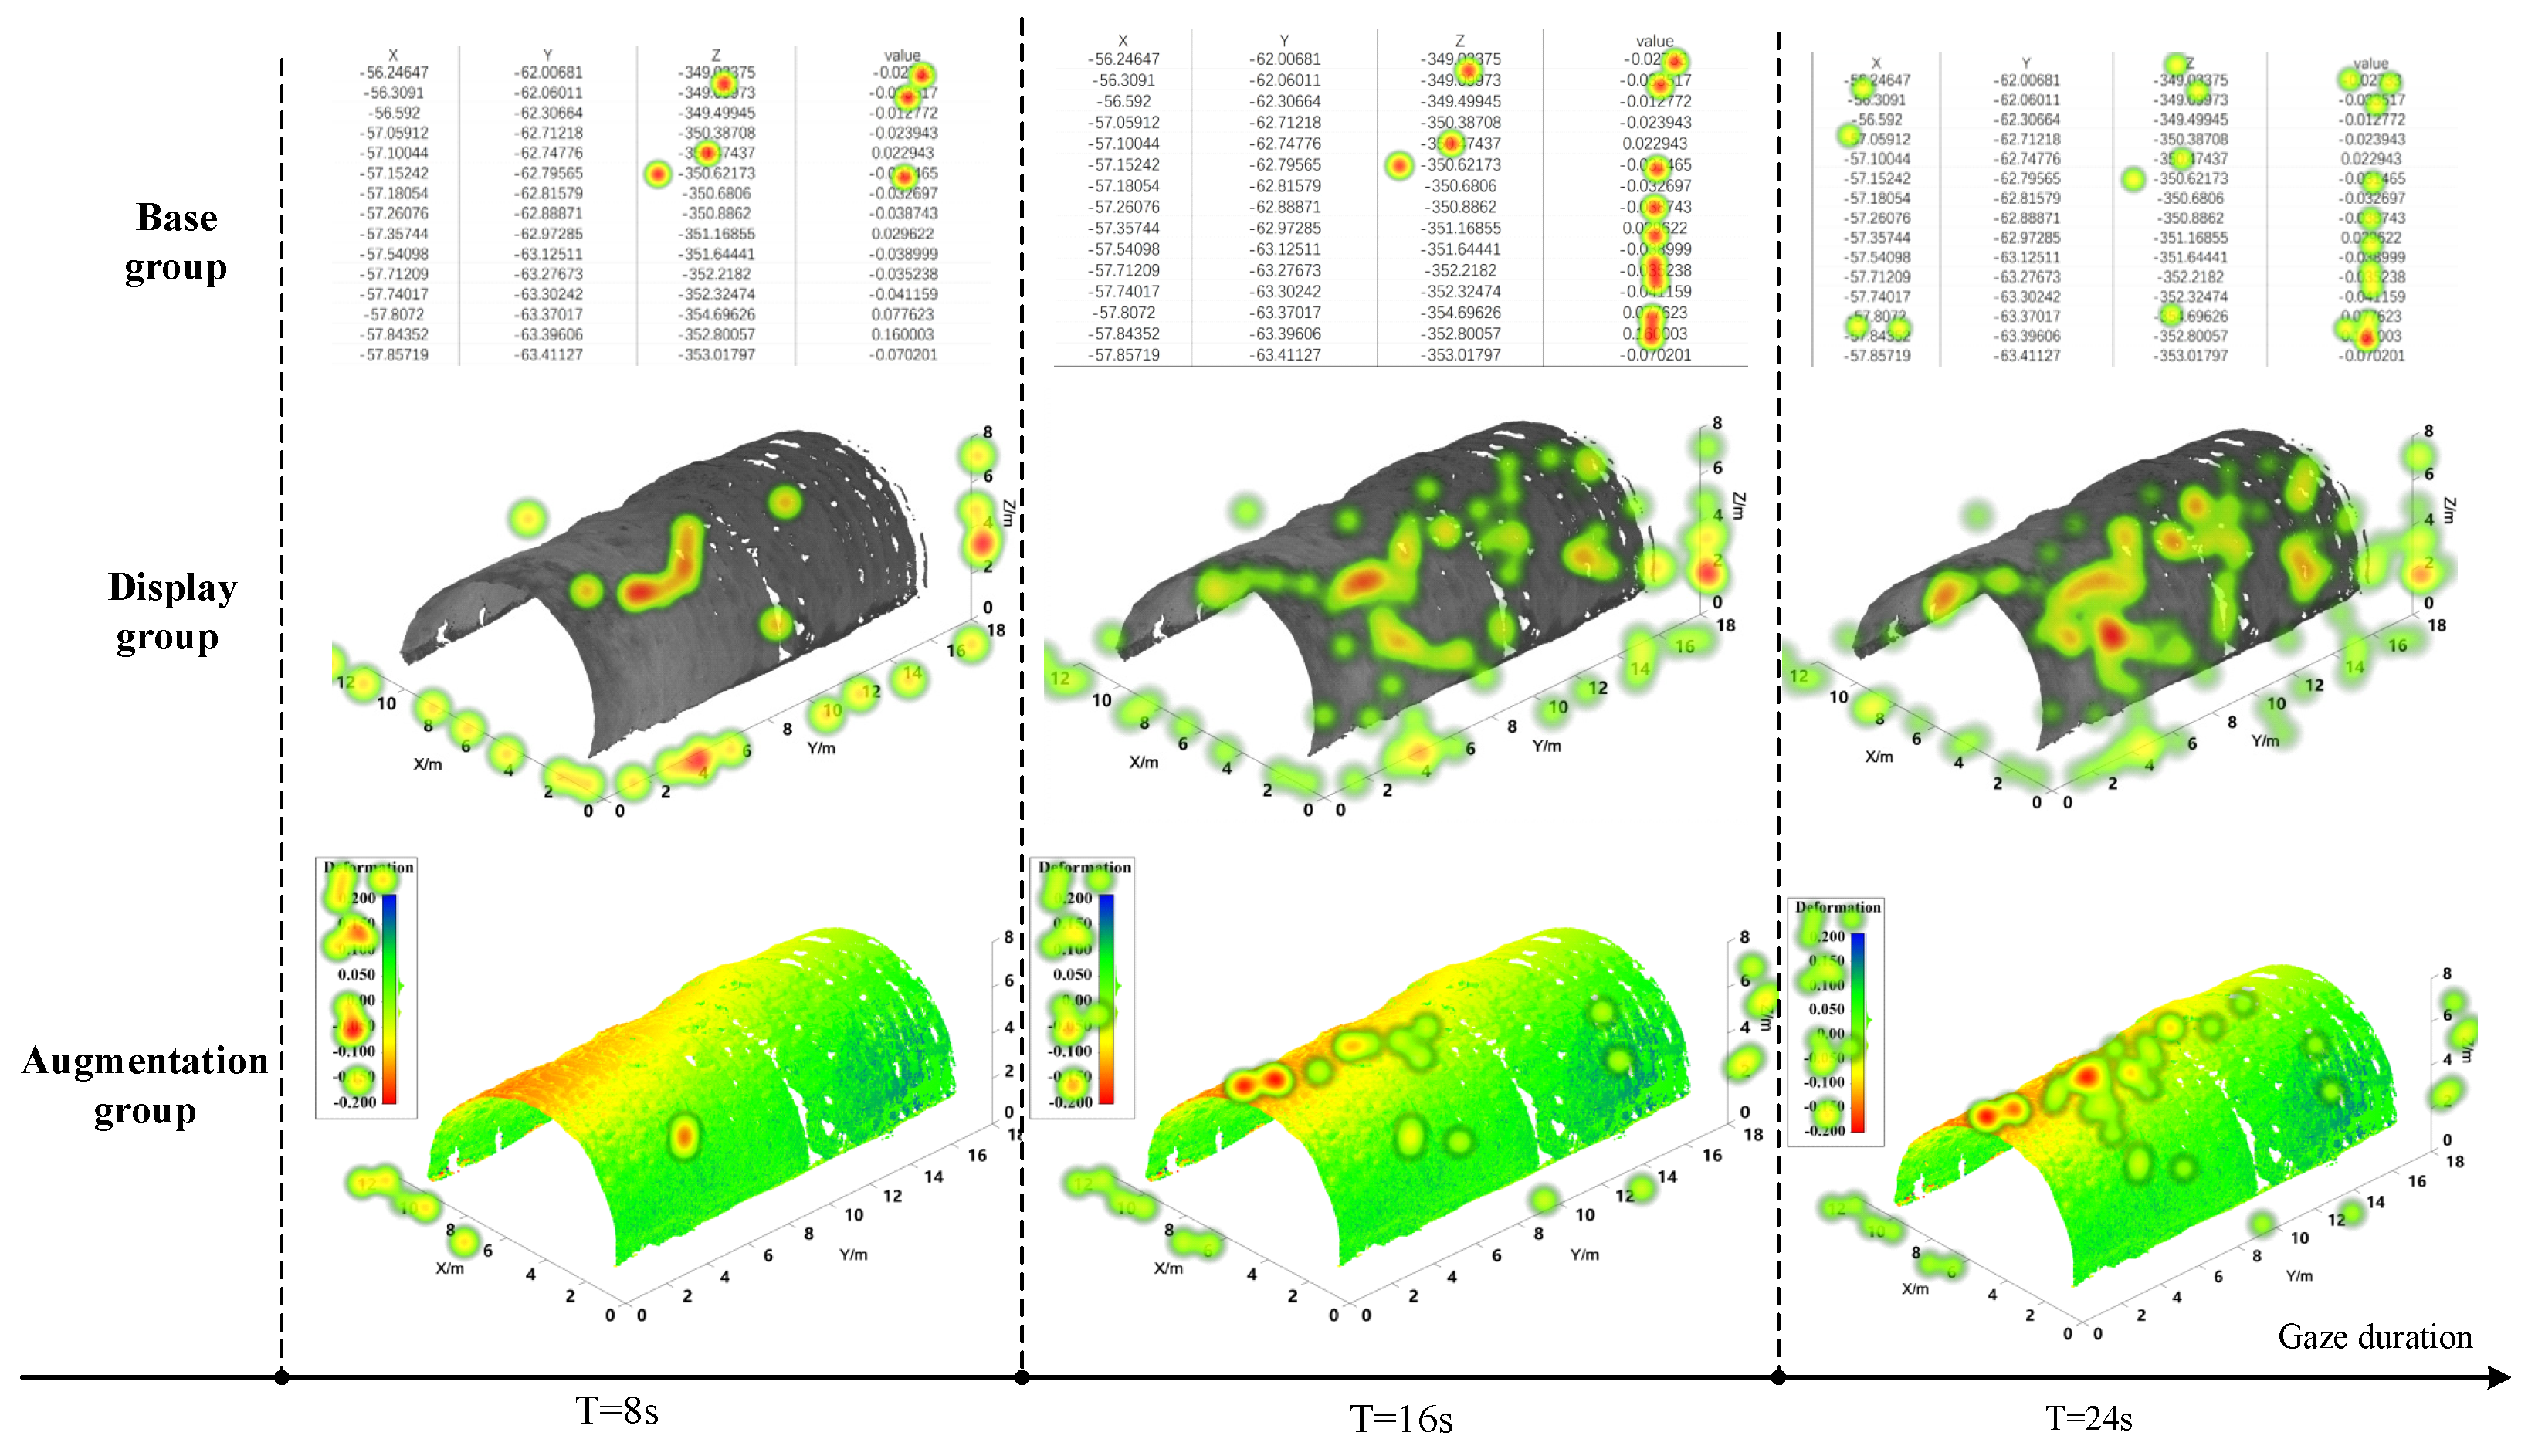
3.2.2. Experiment and Analysis of Visual Cognition
- Introduce the meaning of the data to participants;
- Distribute tasks to participants, who need to search for 10 points with a deformation value of −0.16 in the visualization materials of their group;
- Participants wear an eye tracker to search for points and record the time for each point they find;
- Wait for the participants to complete the search for 10 points, stop the timer, and end the experiment.
4. Conclusions and Future Work
Author Contributions
Funding
Data Availability Statement
Conflicts of Interest
References
- Huang, W.; Zhang, Y.; Zeng, W. Development and application of digital twin technology for integrated regional energy systems in smart cities. Sust. Comput. 2022, 36, 100781. [Google Scholar] [CrossRef]
- Lee, A.; Lee, K.; Kim, K.; Shin, S. A geospatial platform to manage large-scale individual mobility for an urban digital twin platform. Remote Sens. 2022, 14, 723. [Google Scholar] [CrossRef]
- Nica, E.; Popescu, G.; Poliak, M.; Kliestik, T.; Sabie, O. Digital Twin Simulation Tools, Spatial Cognition Algorithms, and Multi-Sensor Fusion Technology in Sustainable Urban Governance Networks. Mathematics 2023, 11, 1981. [Google Scholar] [CrossRef]
- Yang, J.; Zhang, Y.; Zhu, Z.; Fu, J.; Xie, Z.; Wang, L. Study on tunnel under-over break detection method based on three-dimensional image reconstruction technology. J. Cent. South Univ. 2020, 51, 714–723. [Google Scholar]
- Song, S.; Xu, G.; Bao, L.; Xie, Y.; Lu, W.; Liu, H.; Wang, W. Classifying the surrounding rock of tunnel face using machine learning. Front. Earth Sci. 2023, 10, 2179. [Google Scholar] [CrossRef]
- Li, J.; Jing, L.; Zheng, X.; Li, P.; Yang, C. Application and outlook of information and intelligence technology for safe and efficient TBM construction. Tunn. Undergr. Space Technol. 2019, 93, 103097. [Google Scholar] [CrossRef]
- Tian, S.; Wu, K.; Wang, Z.; Ma, W.; Yi, W. Development Status and Implementation Path Analysis on Intelligent Construction of Mountain Tunnels in China. J. China Railw. Soc. 2022, 44, 134–142. [Google Scholar]
- Tao, F.; Liu, W.; Liu, J.; Liu, X.; Liu, Q.; Ting, Q.; Hu, T.; Zhang, Z.; Xiang, F.; Xu, W.; et al. Digital twin and its potential application exploration. Comput. Integr. Manuf. Syst. 2018, 24, 1–18. [Google Scholar]
- Opoku, D.; Perera, S.; Osei-Kyei, R.; Rashidi, M. Digital twin application in the construction industry: A literature review. J. Build. Eng. 2021, 40, 102726. [Google Scholar] [CrossRef]
- Uhlemann, T.; Schock, C.; Lehmann, C.; Freiberger, S.; Steinhilper, R. The digital twin: Demonstrating the potential of real time data acquisition in production systems. Procedia Manuf. 2017, 9, 113–120. [Google Scholar] [CrossRef]
- Wu, Y.; Zhou, Z.; Shao, S.; Zhao, Z.; Hu, K.; Wang, S. Monitoring and Analysis of Deformation Refinement Characteristics of a Loess Tunnel Based on 3D Laser Scanning Technology. Appl. Sci. 2022, 12, 5136. [Google Scholar] [CrossRef]
- Ye, J.; Che, D.; Ma, B.; Liu, Q.; Qiu, K.; Shang, X. Construction Method for a Three-Dimensional Tunnel General Monomer Model Based on Parallel Pathfinding. ISPRS Int. J. Geo-Inform. 2023, 12, 270. [Google Scholar] [CrossRef]
- Yu, G.; Wang, Y.; Mao, Z.; Hu, M.; Sugumaran, V.; Wang, Y.K. A digital twin-based decision analysis framework for operation and maintenance of tunnels. Tunn. Undergr. Space Technol. 2021, 116, 104125. [Google Scholar] [CrossRef]
- Grégorio, J.; Lartigue, C.; Thiébaut, F.; Lebrun, R. A digital twin-based approach for the management of geometrical deviations during assembly processes. J. Manuf. Syst. 2021, 58, 108–117. [Google Scholar] [CrossRef]
- Wang, L.; Xu, S.; Qiu, J.; Wang, K.; Ma, E.; Li, C.; Guo, C. Automatic monitoring system in underground engineering construction: Review and prospect. Adv. Civ. Eng. 2020, 2020, 3697253. [Google Scholar] [CrossRef]
- Sabato, A.; Niezrecki, C.; Fortino, G. Wireless MEMS-based accelerometer sensor boards for structural vibration monitoring: A review. IEEE Sens. J. 2016, 17, 226–235. [Google Scholar] [CrossRef]
- Shiau, J.; Keawsawasvong, S.; Seehavong, S. Stability of Unlined Elliptical Tunnels in Rock Masses. Rock Mech. Rock Eng. 2022, 55, 7307–7330. [Google Scholar] [CrossRef]
- Li, W.; Zhu, J.; Fu, L.; Zhu, Q.; Xie, Y.; Hu, Y. An augmented representation method of debris flow scenes to improve public perception. Int. J. Geogr. Inf. Sci. 2021, 35, 1521–1544. [Google Scholar] [CrossRef]
- Jiang, Q.; Zhong, S.; Pan, P.; Shi, Y.; Guo, H.; Yang, J. Observe the temporal evolution of deep tunnel’s 3D deformation by 3D laser scanning in the Jinchuan No. 2 Mine. Tunn. Undergr. Space Technol. 2020, 97, 103237. [Google Scholar] [CrossRef]
- Cui, H.; Ren, X.; Mao, Q.; Hu, Q.; Wang, W. Shield subway tunnel deformation detection based on mobile laser scanning. Autom. Constr. 2019, 106, 102889. [Google Scholar] [CrossRef]
- Han, J.; Guo, J.; Jiang, Y. Monitoring tunnel profile by means of multi-epoch dispersed 3-D LiDAR point clouds. Tunn. Undergr. Space Technol. 2013, 33, 186–192. [Google Scholar] [CrossRef]
- Shen, Y.; Wang, J.; Wang, J.; Duan, W.; Ferreira, V. Methodology for extraction of tunnel cross-sections using dense point cloud data. J. Geodesy Geoinform. Sci. 2021, 4, 56. [Google Scholar]
- Zhou, Z.; Zhao, J.; Tan, Z.; Zhou, X. Mechanical responses in the construction process of super-large cross-section tunnel: A case study of Gongbei tunnel. Tunn. Undergr. Space Technol. 2021, 115, 104044. [Google Scholar] [CrossRef]
- Liu, W.; Chen, J.; Chen, L.; Luo, Y.; Shi, Z.; Wu, Y. Nonlinear deformation behaviors and a new approach for the classification and prediction of large deformation in tunnel construction stage: A case study. Eur. J. Environ. Civil Eng. 2022, 26, 2008–2036. [Google Scholar] [CrossRef]
- Guo, Y.; Zhu, J.; You, J.; Pirasteh, S.; Li, W.; Wu, J.; Lai, J.; Dang, P. A dynamic visualization based on conceptual graphs to capture the knowledge for disaster education on floods. Nat. Hazards 2023, 119, 203–220. [Google Scholar] [CrossRef]
- Lai, J.B.; Zhu, J.; Luo, N.Y.; Zhang, Y.; Zuo, L.; Guo, Y.K.; You, J.G. Visual supervision of large-scope heat source factories based on knowledge graph. Trans. GIS 2023, 27, 408–424. [Google Scholar] [CrossRef]
- Zhu, J.; Luo, N.; Guo, Z.; Lai, J.; Zuo, L.; Zhang, C.; Guo, Y.; Hu, Y. Feature-constrained automatic geometric deformation analysis method of bridge models toward digital twin. Int. J. Digit. Earth 2024, 17, 2312219. [Google Scholar] [CrossRef]
- Mai, G.; Huang, W.; Cai, L.; Zhu, R.; Lao, N. Narrative cartography with knowledge graphs. J. Geovisualization Spat. Anal. 2022, 6, 4. [Google Scholar] [CrossRef]
- Zhu, J.; Dang, P.; Cao, Y.; Lai, J.; Guo, Y.; Wang, P.; Li, W. A flood knowledge-constrained large language model interactable with GIS: Enhancing public risk perception of floods. Int. J. Geogr. Inf. Sci. 2024, 1–23. [Google Scholar] [CrossRef]
- Wu, J.; Zhu, J.; Zhang, J.; Dang, P.; Li, W.; Guo, Y.; Fu, L.; Lai, J.; You, J.; Xie, Y.; et al. A dynamic holographic modelling method of digital twin scenes for bridge construction. Int. J. Digit. Earth 2023, 16, 2404–2425. [Google Scholar] [CrossRef]
- Fu, L.; Zhu, J.; Li, W.; Zhu, Q.; Xu, B.; Xie, Y.; Zhang, Y.; Hu, Y.; Dang, P.; You, J. Tunnel vision optimization method for VR flood scenes based on Gaussian blur. Int. J. Dig. Earth 2021, 14, 821–835. [Google Scholar] [CrossRef]
- Zhu, J.; Zhang, J.; Zhu, Q.; Li, W.; Wu, J.; Guo, Y. A knowledge-guided visualization framework of disaster scenes for helping the public cognize risk information. Int. J. Geograph. Inform. Sci. 2024, 1–28. [Google Scholar] [CrossRef]
- Mulangi, R.H.; Kulkarni, V. Visualization and assessment of the effect of roadworks on traffic congestion using AVL data of public transit. J. Geovisualization Spat. Anal. 2022, 6, 28. [Google Scholar]
- Li, W.; Zhu, J.; Dang, P.; Wu, J.; Zhang, J.; Fu, L.; Zhu, Q. Immersive virtual reality as a tool to improve bridge teaching communication. Expert Syst. Appl. 2023, 217, 119502. [Google Scholar] [CrossRef]
- Zhang, J.; Zhu, J.; Dang, P.; Wu, J.; Zhou, Y.; Li, W.; Guo, Y.; You, J. An improved social force model (ISFM)-based crowd evacuation simulation method in virtual reality with a subway fire as a case study. Int. J. Digit. Earth 2023, 16, 1186–1204. [Google Scholar] [CrossRef]
- Dang, P.; Zhu, J.; Zhou, X.; Rao, Y.; You, J.; Wu, J.; Zhang, M.; Li, W. A 3D-Panoramic fusion flood enhanced visualization method for VR. Environ. Model. Softw. 2023, 169, 105810. [Google Scholar] [CrossRef]
- Li, W.; Zhu, J.; Zhu, Q.; Zhang, J.; Han, X.; Dehbi, Y. Visual attention-guided augmented representation of geographic scenes: A case of bridge stress visualization. Int. J. Geograph. Inform. Sci. 2024, 38, 527–549. [Google Scholar] [CrossRef]
- Ying, S.; Van Oosterom, P.; Fan, H. New Techniques and Methods for Modelling, Visualization, and Analysis of a 3D City. J. Geovisualization Spat. Anal. 2023, 7, 26. [Google Scholar] [CrossRef]
- Li, W.; Zhu, J.; Fu, L.; Zhu, Q.; Guo, Y.; Gong, Y. A rapid 3D reproduction system of dam-break floods constrained by post-disaster information. Environ. Modell. Softw. 2021, 139, 104994. [Google Scholar] [CrossRef]


| Content | Details | |
|---|---|---|
| Hardware | CPU | InteI) I(TM) i5-10210U CPU @1.60 GHz 2.11 GHz |
| GIIntel(R) UHD Graphics | ||
| Memory | 16 GB | |
| Eye tracker | Tobii Pro Spectrum | |
| Software | IDE | Visual Studio 2019 |
| System server | Node.js v6.11.2 | |
| Graph database | Neo4j community 4.4.2 | |
| Digital twin platform | Cesium.js v1.45 | |
| System | Windows 10 | |
| Monitoring Point | Theoretical Position | S1 Cross-Section Point Cloud Position | S2 Cross-Section Point Cloud Position | Direction Deviation (cm) | ||||
|---|---|---|---|---|---|---|---|---|
| X (m) | Y (m) | X (m) | Y (m) | X (m) | Y (m) | S1 Dxy | S2 Dxy | |
| P01 | −7.2066 | 3.2451 | −7.2848 | 3.2123 | −7.2916 | 3.2156 | −8.48 | −9.00 |
| P02 | −6.2435 | 6.0158 | −6.2528 | 6.1165 | −6.2549 | 6.1198 | 10.11 | 10.46 |
| P03 | −3.6656 | 8.7455 | −3.5359 | 8.8864 | −3.5366 | 8.9806 | 19.15 | 26.82 |
| P04 | 0 | 9.6355 | 0 | 9.8339 | 0 | 9.9164 | 19.84 | −28.09 |
| P05 | 3.6301 | 8.739 | 3.4960 | 8.8929 | 3.484 | 8.9508 | 20.41 | 25.73 |
| P06 | 6.2188 | 6.2516 | 6.2501 | 6.1369 | 6.2523 | 6.1304 | −11.89 | 12.57 |
| P07 | 7.2142 | 3.1214 | 7.2612 | 3.1618 | 7.2656 | 3.1659 | 6.20 | 6.80 |
| Monitoring Point | Theoretical Position | Control Group | Experimental Group (With Knowledge Constraints) | Accuracy Improvement | |||||
|---|---|---|---|---|---|---|---|---|---|
| X (m) | Y (m) | X (m) | Y (m) | Direction Deviation | X (m) | Y (m) | Direction Deviation | ||
| P01 | −7.2066 | 3.2451 | −7.2848 | 3.2123 | 0.0848 | −7.2554 | 3.2310 | 0.0508 | 40.10% |
| P02 | −6.2435 | 6.0158 | −6.2528 | 6.1165 | 0.1011 | −6.2498 | 6.0903 | 0.0748 | 45.75% |
| P03 | −3.6656 | 8.7455 | −3.5359 | 8.8864 | 0.1915 | −3.5954 | 8.8229 | 0.1045 | 45.44% |
| P04 | 0 | 9.6355 | 0 | 9.8339 | 0.1984 | 0 | 9.7410 | 0.1055 | 46.82% |
| P05 | 3.6301 | 8.739 | 3.4960 | 8.8929 | 0.2041 | 3.5677 | 8.8155 | 0.0987 | 51.64% |
| P06 | 6.2188 | 6.2516 | 6.2501 | 6.1369 | 0.1189 | 6.2408 | 6.1948 | 0.0609 | 48.77% |
| P07 | 7.2142 | 3.1214 | 7.2612 | 3.1618 | 0.0620 | 7.2447 | 3.1445 | 0.0383 | 48.36% |
| Monitoring Mileage Range | Data Scale (Points) | Time Consumed (min) | Efficiency Improvement | |
|---|---|---|---|---|
| Cloud Compare Processing | Method of Processing in This Paper | |||
| 1 # Tunnel Twin Model | 182,359 | 31.14 | 2.75 | 91.17% |
| 2 # Tunnel Twin Model | 236,877 | 32.86 | 3.12 | 90.50% |
| 3 # Tunnel Twin Model | 240,688 | 36.18 | 3.57 | 90.13% |
| 4 # Tunnel Twin Model | 276,445 | 39.45 | 4.11 | 89.58% |
| 5 # Tunnel Twin Model | 199,709 | 30.25 | 3.08 | 89.98% |
Disclaimer/Publisher’s Note: The statements, opinions and data contained in all publications are solely those of the individual author(s) and contributor(s) and not of MDPI and/or the editor(s). MDPI and/or the editor(s) disclaim responsibility for any injury to people or property resulting from any ideas, methods, instructions or products referred to in the content. |
© 2024 by the authors. Licensee MDPI, Basel, Switzerland. This article is an open access article distributed under the terms and conditions of the Creative Commons Attribution (CC BY) license (https://creativecommons.org/licenses/by/4.0/).
Share and Cite
Liang, C.; Zhu, J.; Zhang, J.; Zhu, Q.; Lu, J.; Lai, J.; Wu, J. A Knowledge-Guided Intelligent Analysis Method of Geographic Digital Twin Models: A Case Study on the Diagnosis of Geometric Deformation in Tunnel Excavation Profiles. ISPRS Int. J. Geo-Inf. 2024, 13, 78. https://doi.org/10.3390/ijgi13030078
Liang C, Zhu J, Zhang J, Zhu Q, Lu J, Lai J, Wu J. A Knowledge-Guided Intelligent Analysis Method of Geographic Digital Twin Models: A Case Study on the Diagnosis of Geometric Deformation in Tunnel Excavation Profiles. ISPRS International Journal of Geo-Information. 2024; 13(3):78. https://doi.org/10.3390/ijgi13030078
Chicago/Turabian StyleLiang, Ce, Jun Zhu, Jinbin Zhang, Qing Zhu, Jingyi Lu, Jianbo Lai, and Jianlin Wu. 2024. "A Knowledge-Guided Intelligent Analysis Method of Geographic Digital Twin Models: A Case Study on the Diagnosis of Geometric Deformation in Tunnel Excavation Profiles" ISPRS International Journal of Geo-Information 13, no. 3: 78. https://doi.org/10.3390/ijgi13030078
APA StyleLiang, C., Zhu, J., Zhang, J., Zhu, Q., Lu, J., Lai, J., & Wu, J. (2024). A Knowledge-Guided Intelligent Analysis Method of Geographic Digital Twin Models: A Case Study on the Diagnosis of Geometric Deformation in Tunnel Excavation Profiles. ISPRS International Journal of Geo-Information, 13(3), 78. https://doi.org/10.3390/ijgi13030078