
Identification and Causes of Neighborhood Commercial Areas: Focusing on the Development of Daily Life Circles in Urban Built Environments


Abstract
1. Introduction
2. Materials and Methods
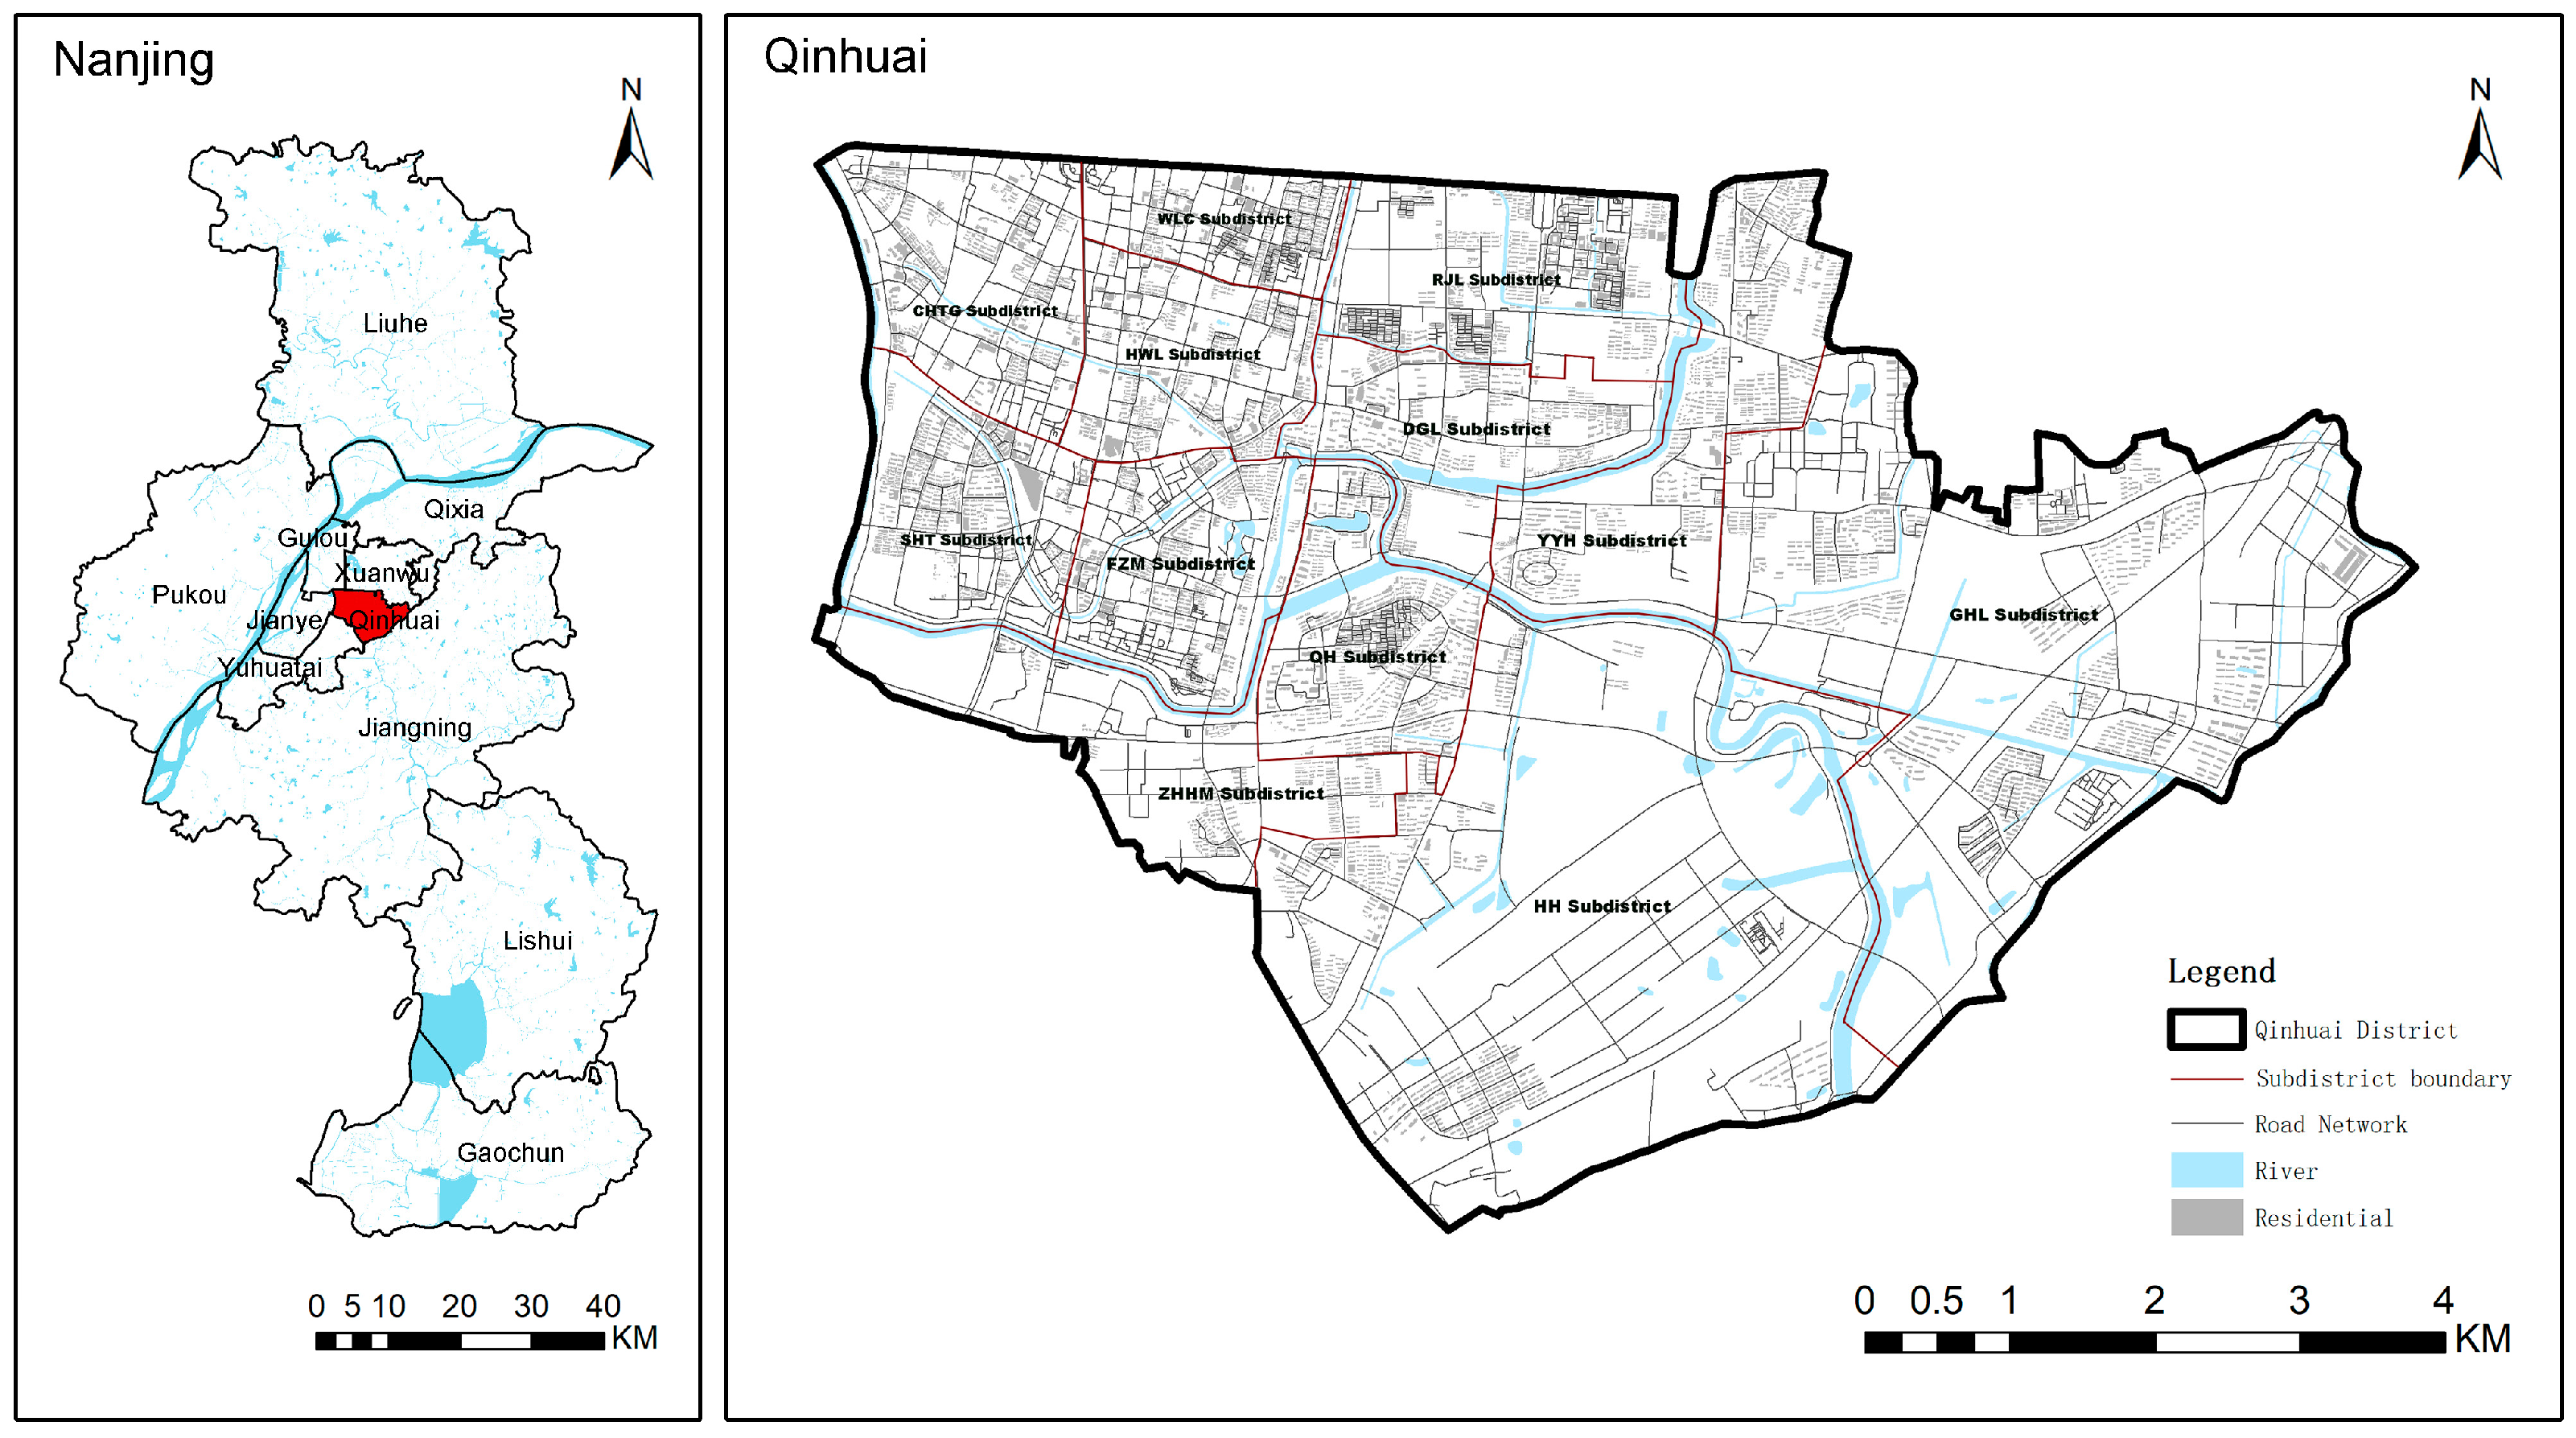
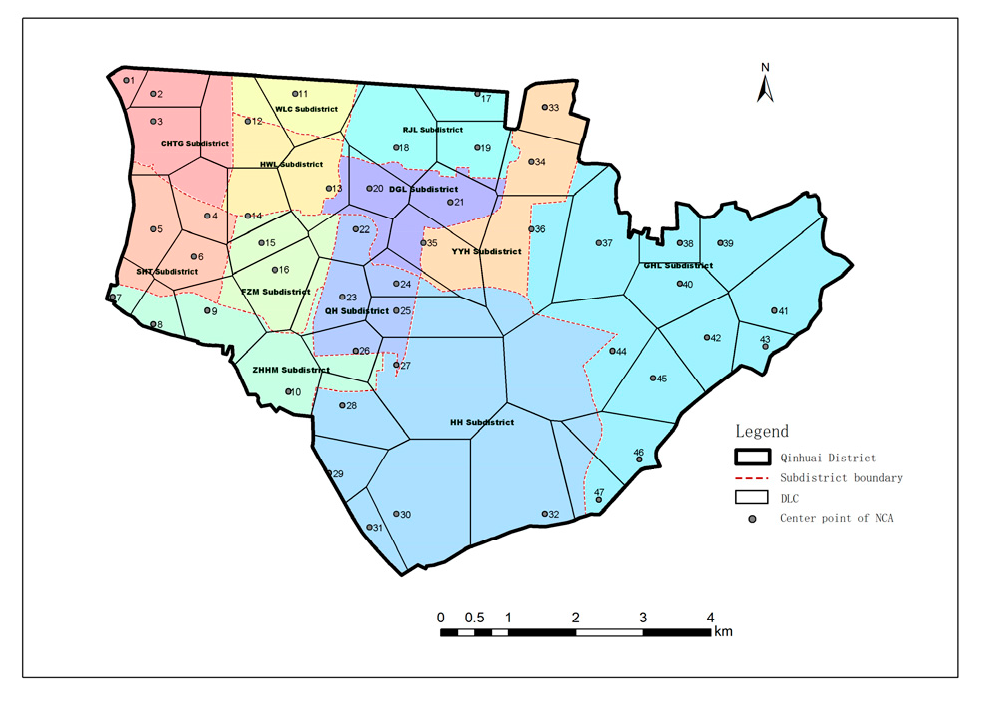
2.1. Study Area
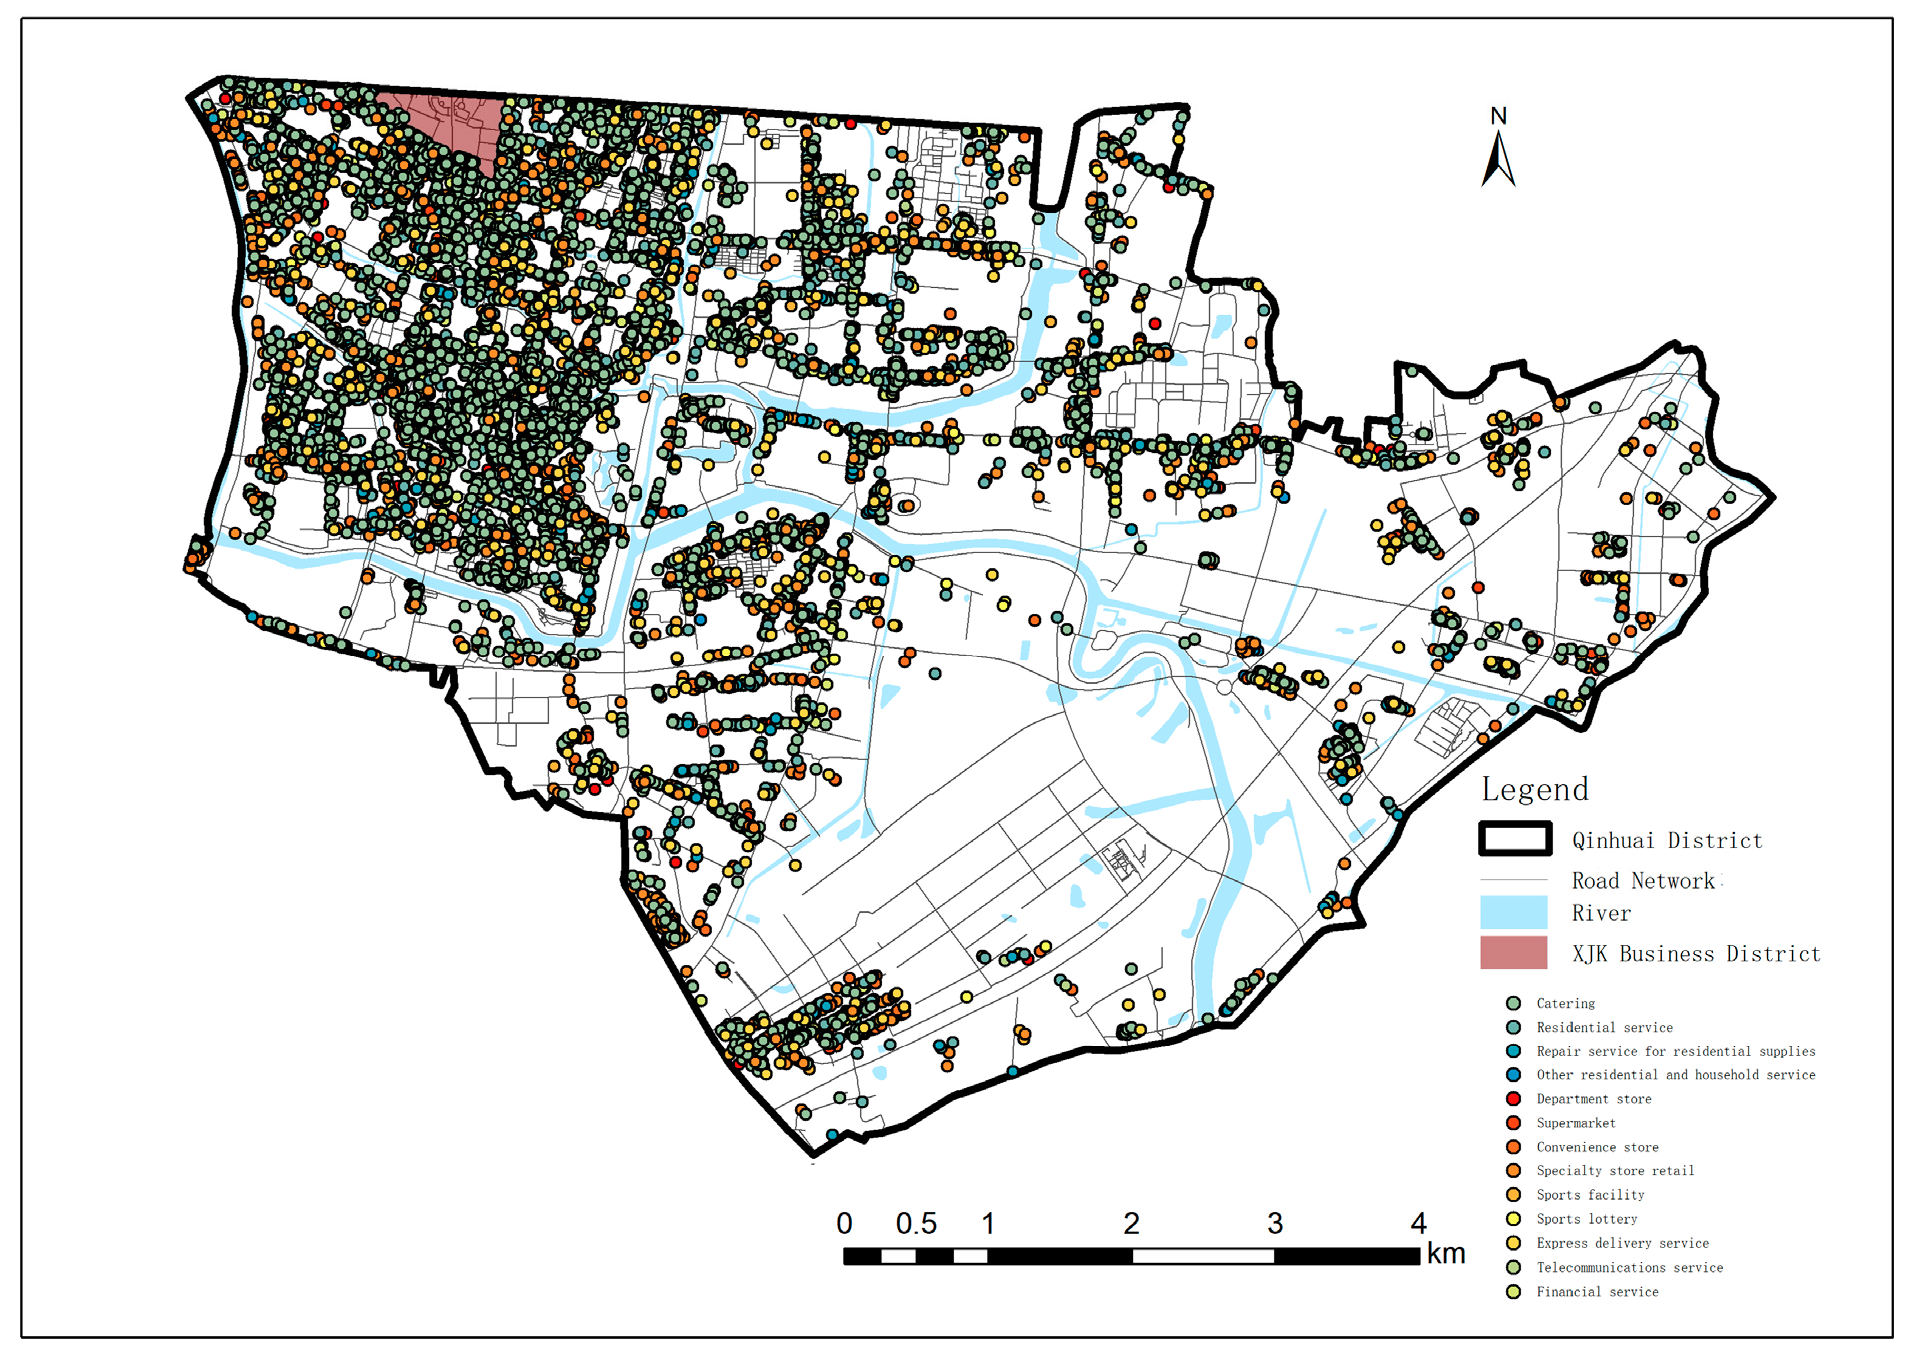
2.2. Data
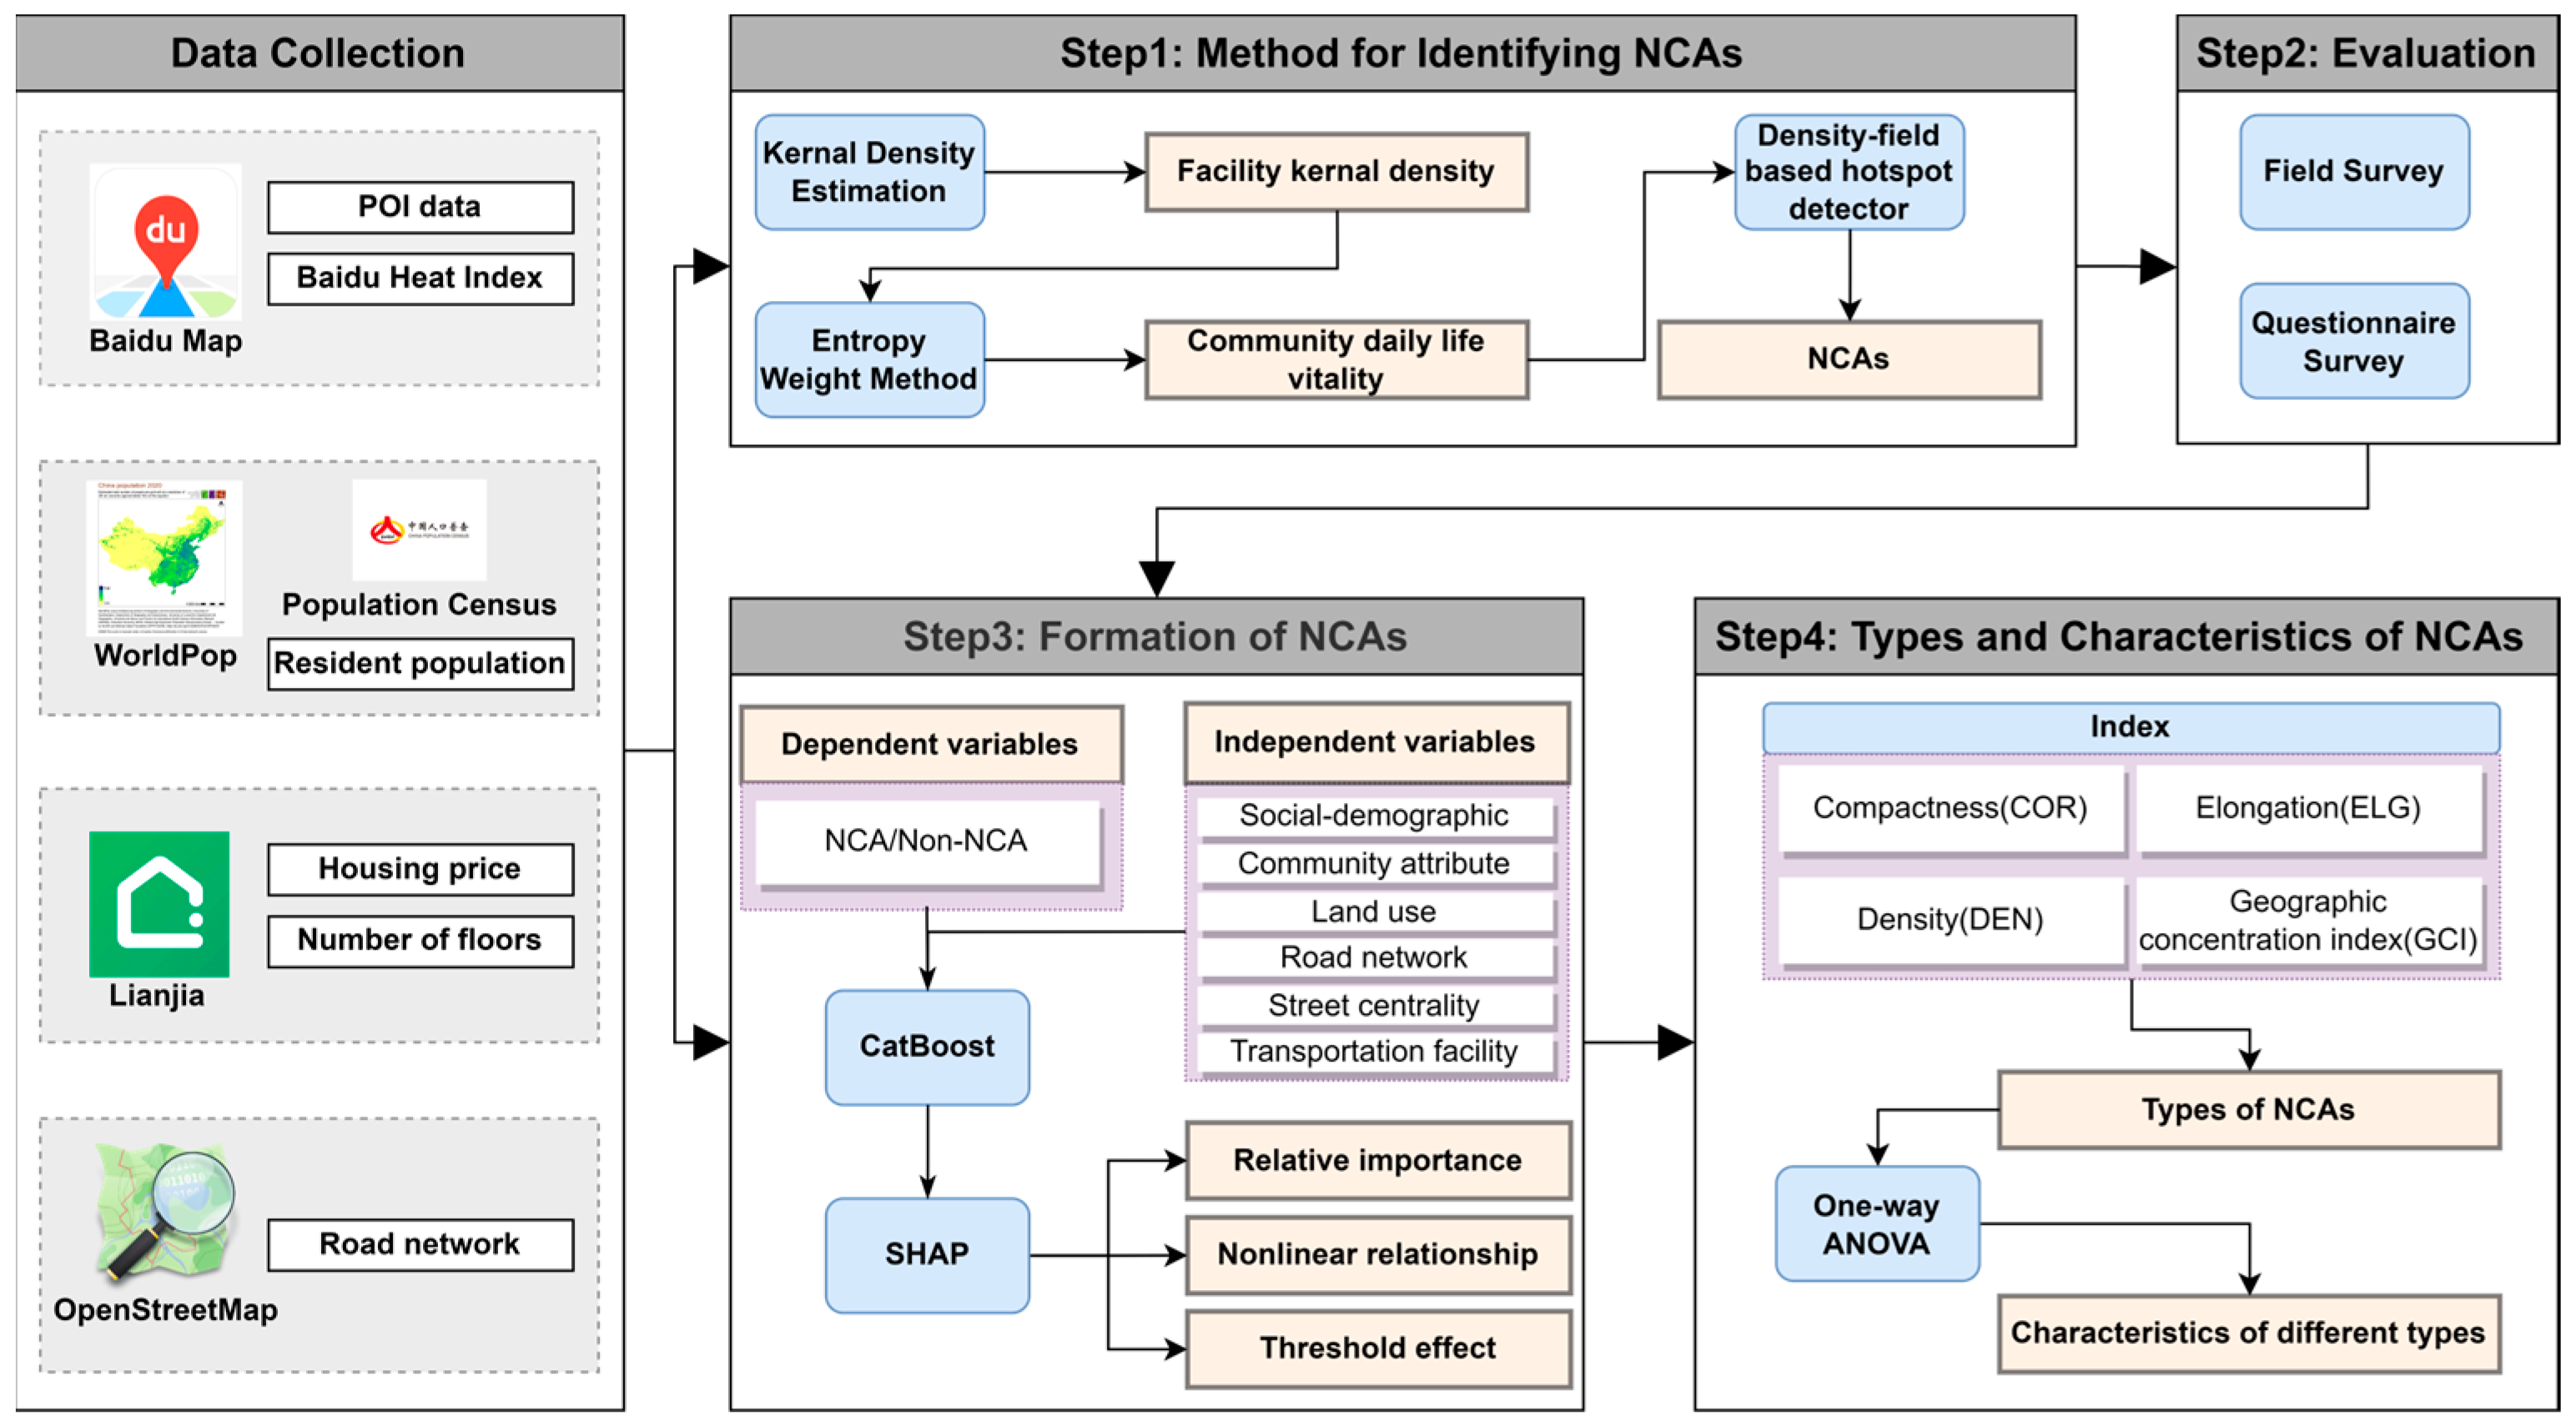
2.3. Identification Method
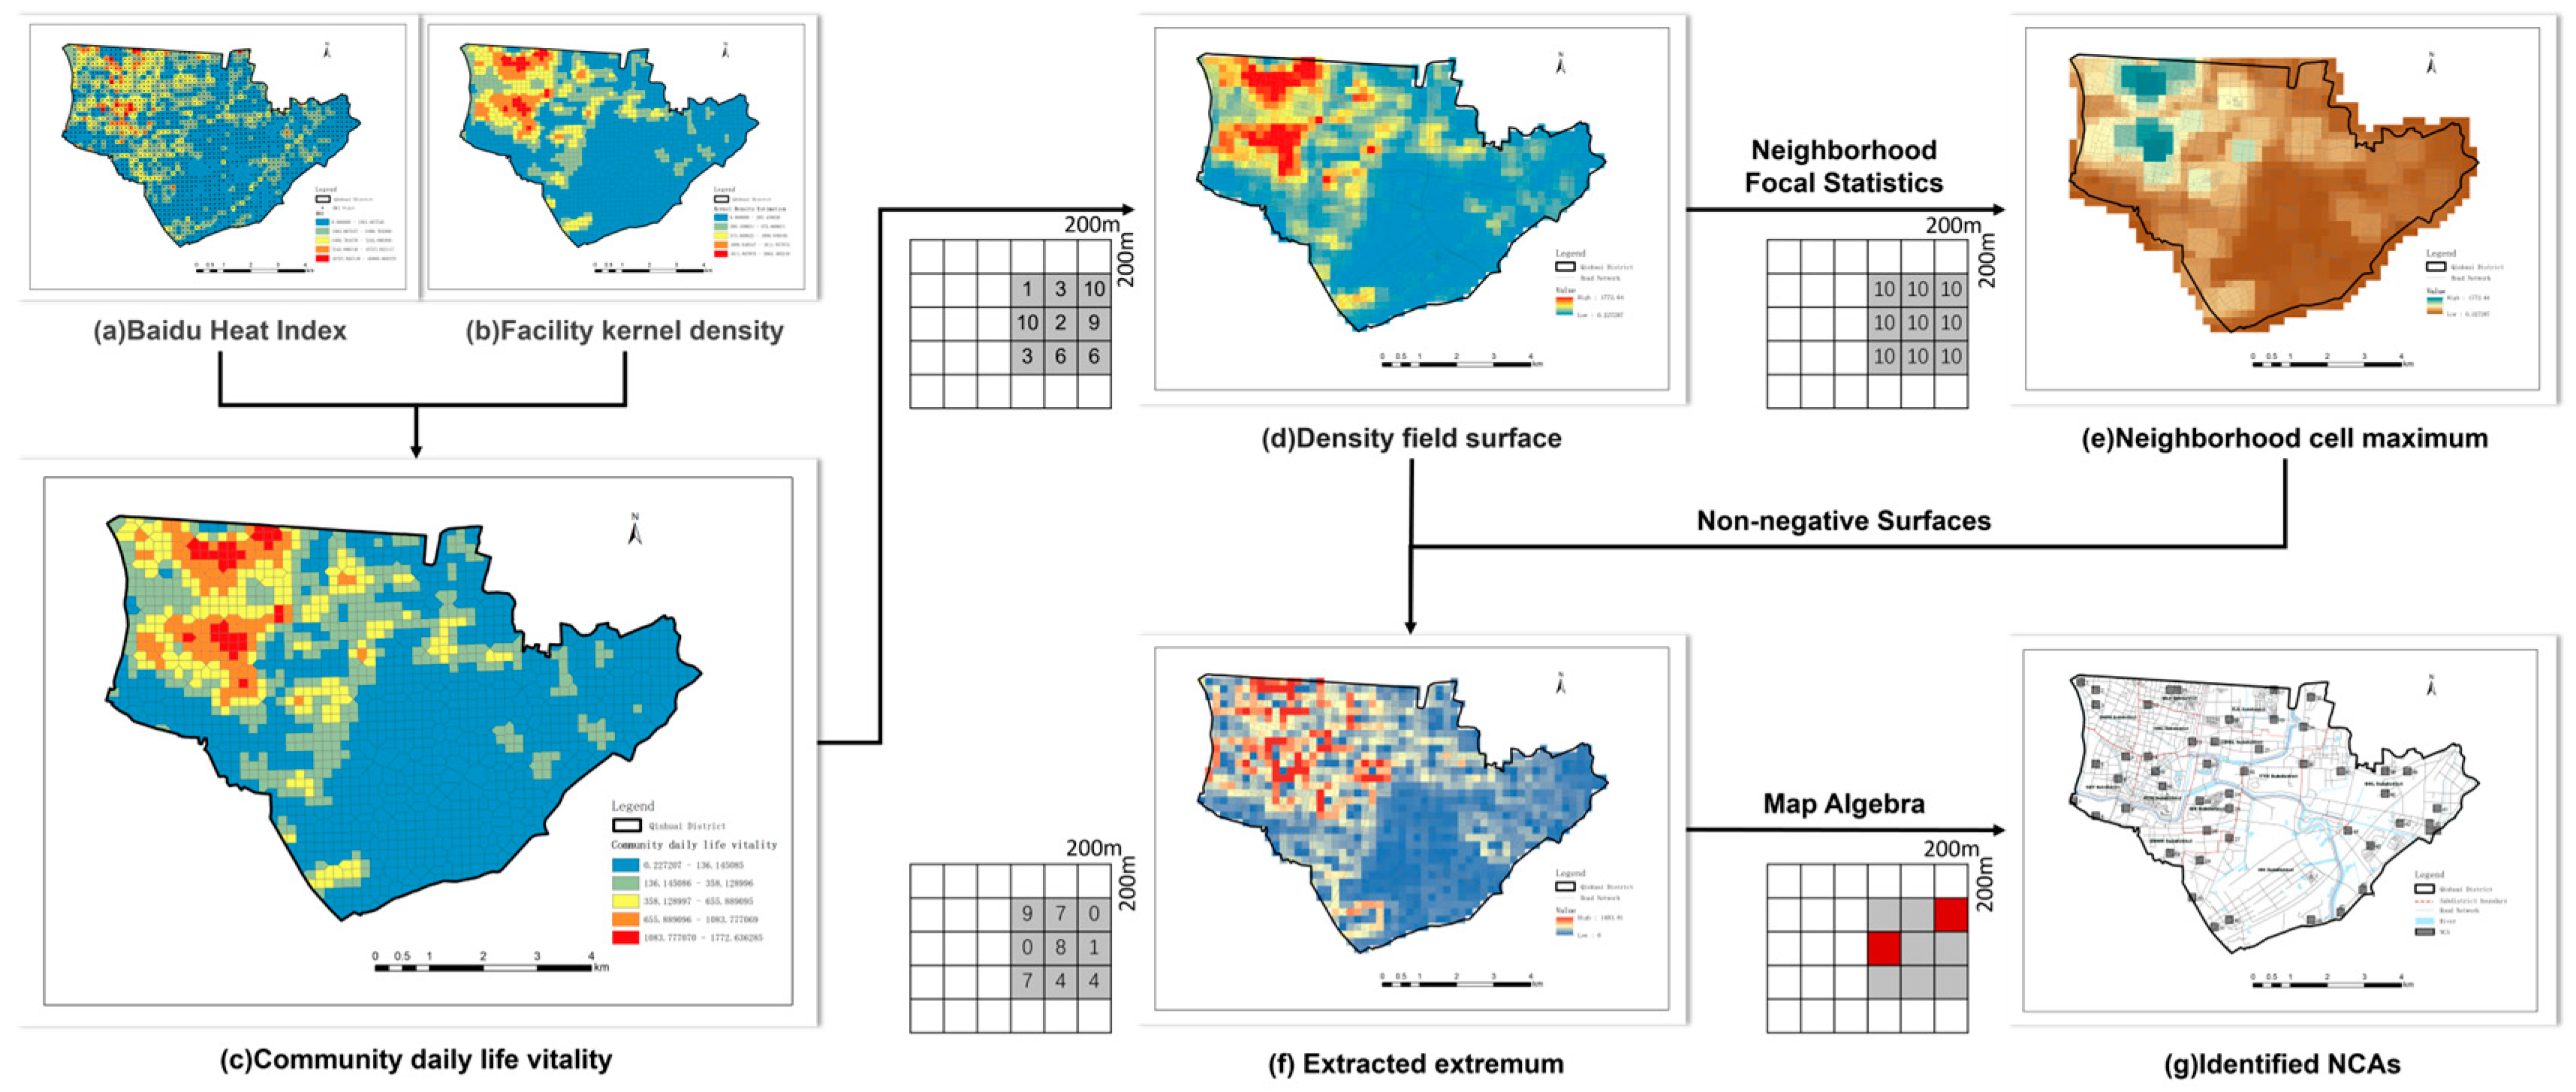
2.3.1. Measuring Community Daily Life Vitality
2.3.2. Detecting Vitality Hotspots
2.4. Analysis of Formation Factors
2.4.1. Potential Variables
2.4.2. Analysis Model
2.5. Classification
3. Results
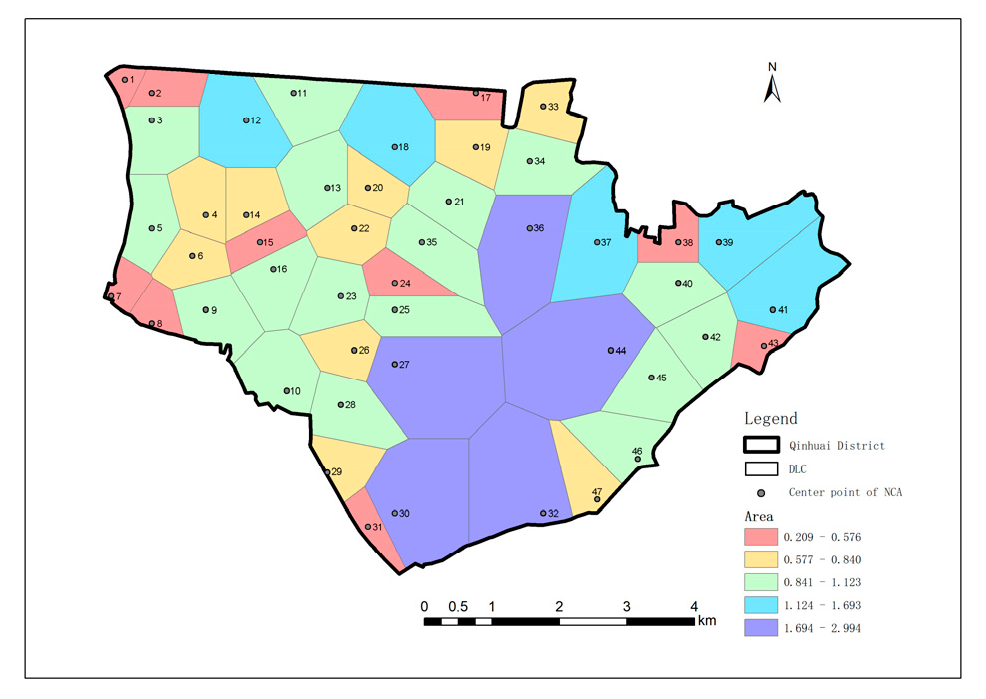
3.1. Identification Results
3.2. Evaluation of the Identification Method
3.3. Formation of Neighborhood Commercial Areas
3.3.1. Establishment and Evaluation of the CatBoost Model
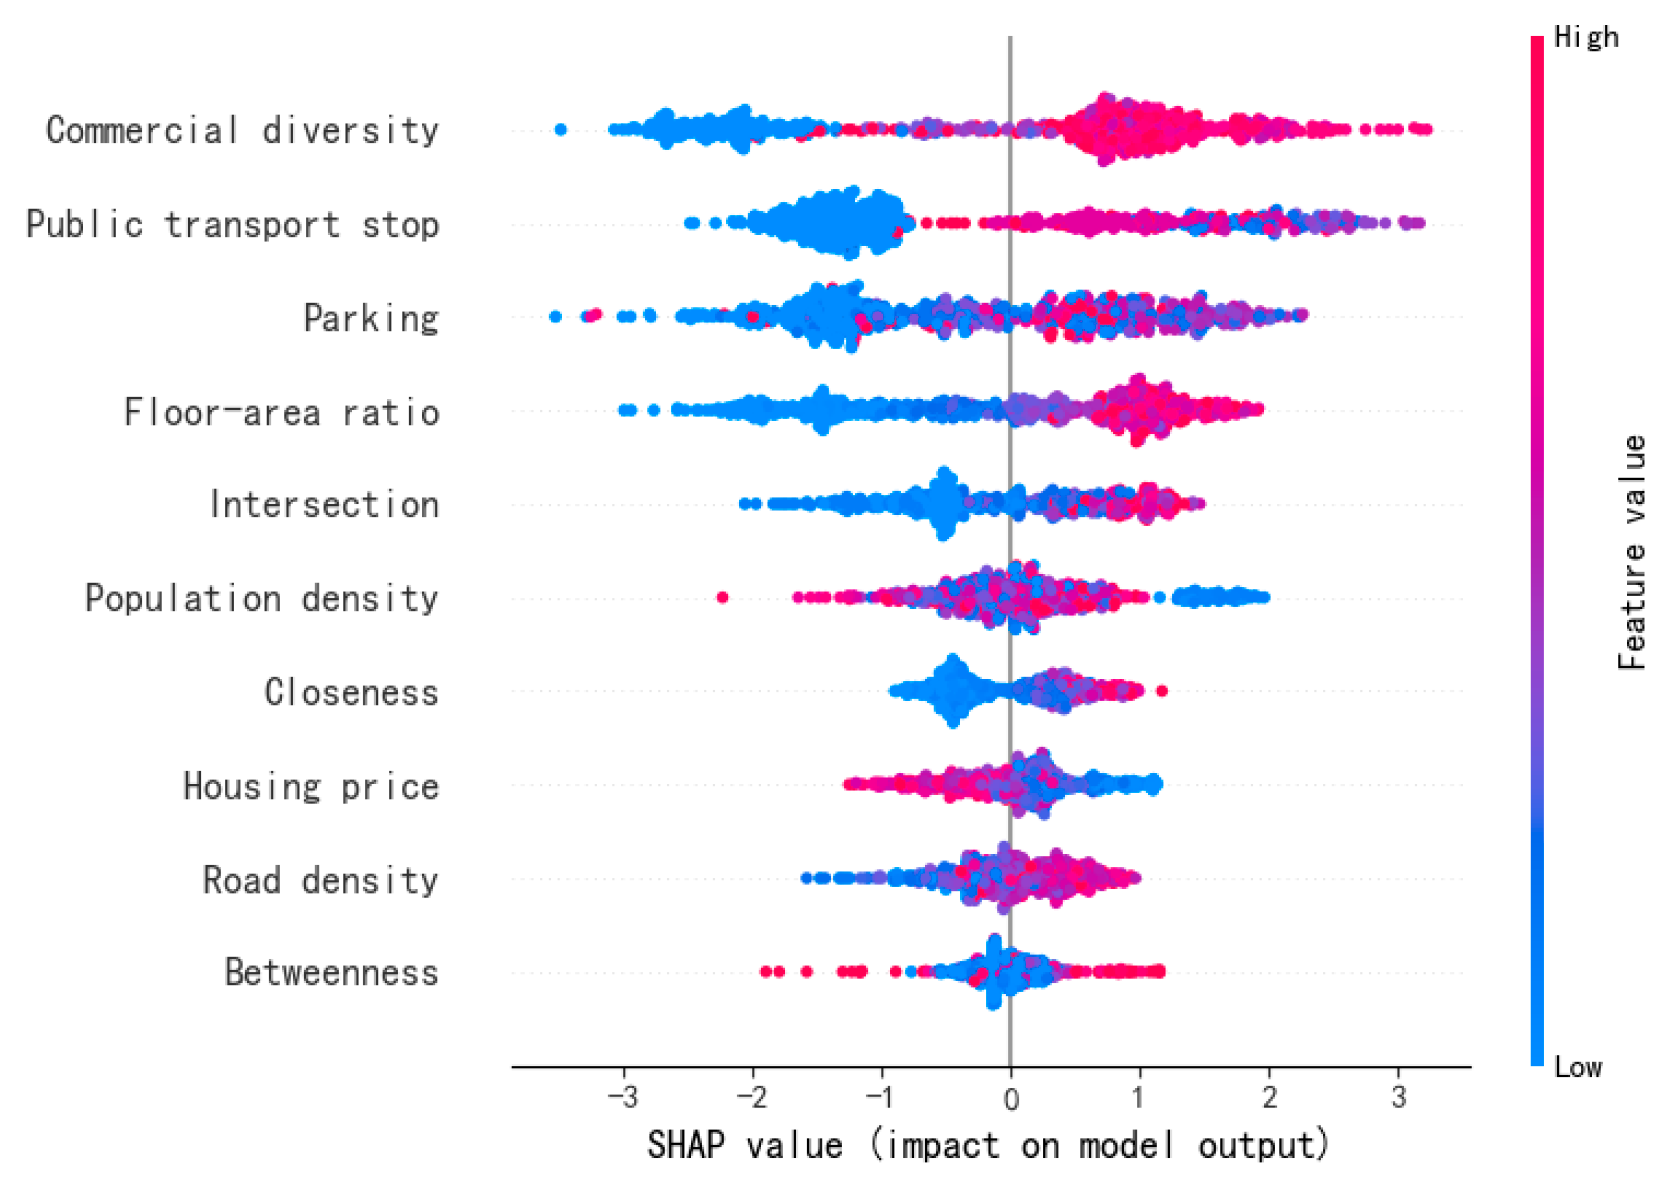
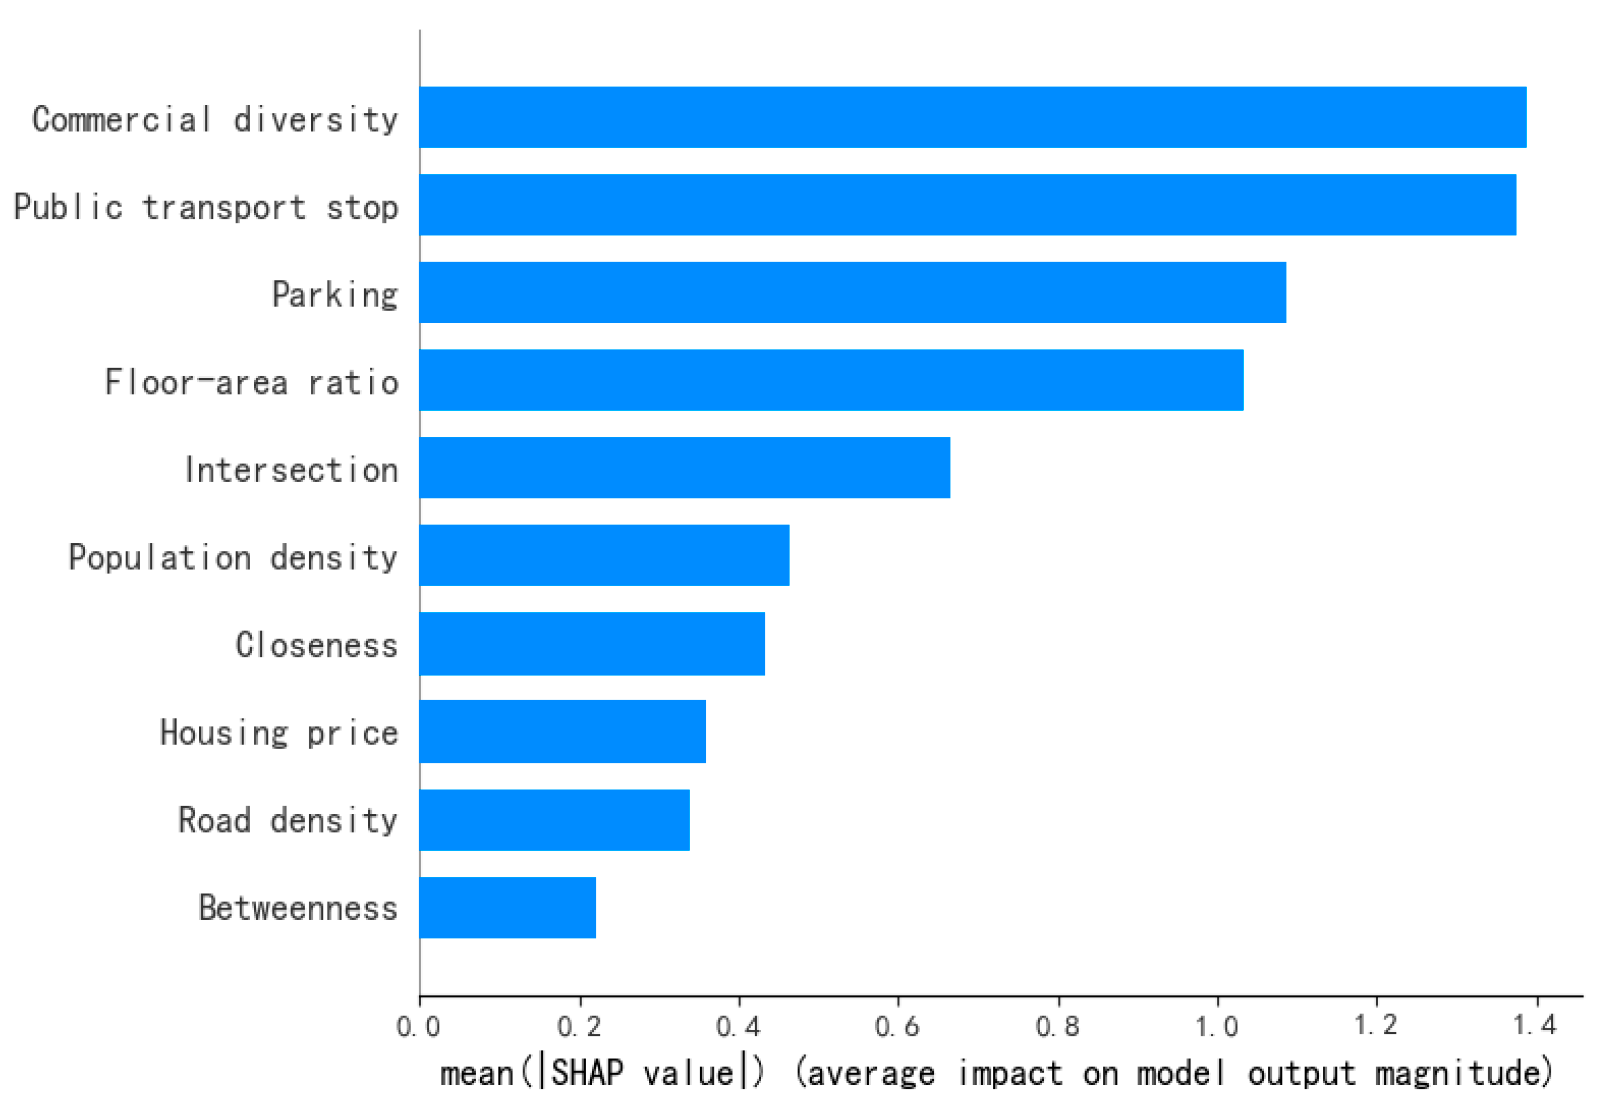
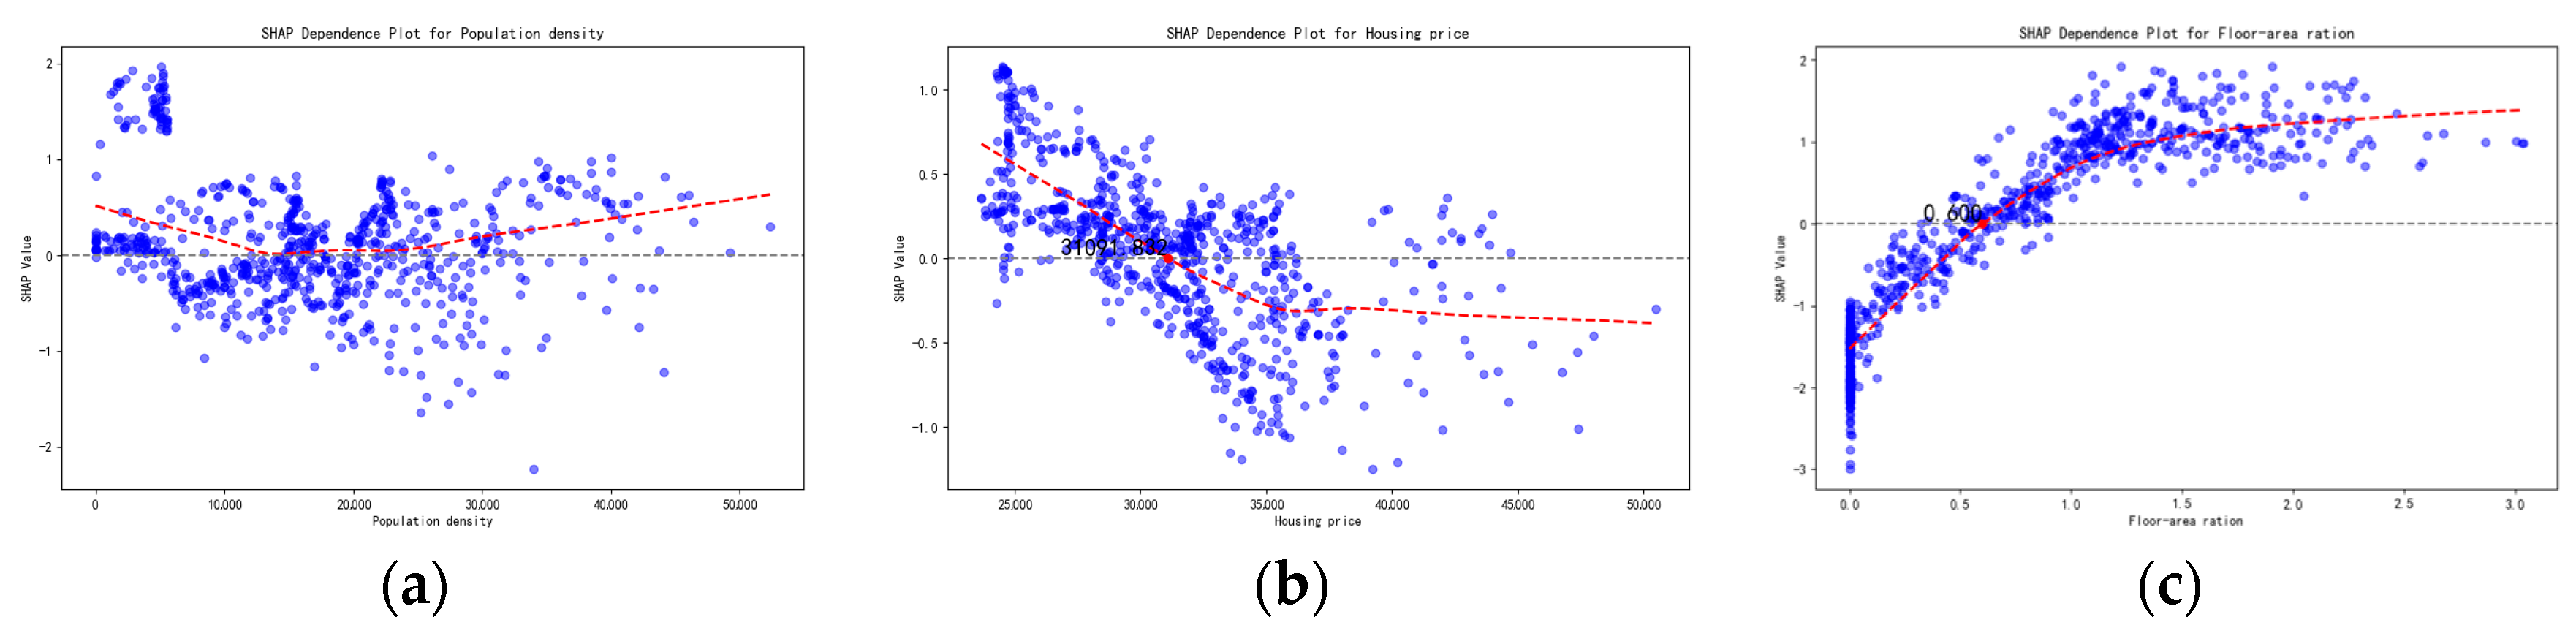
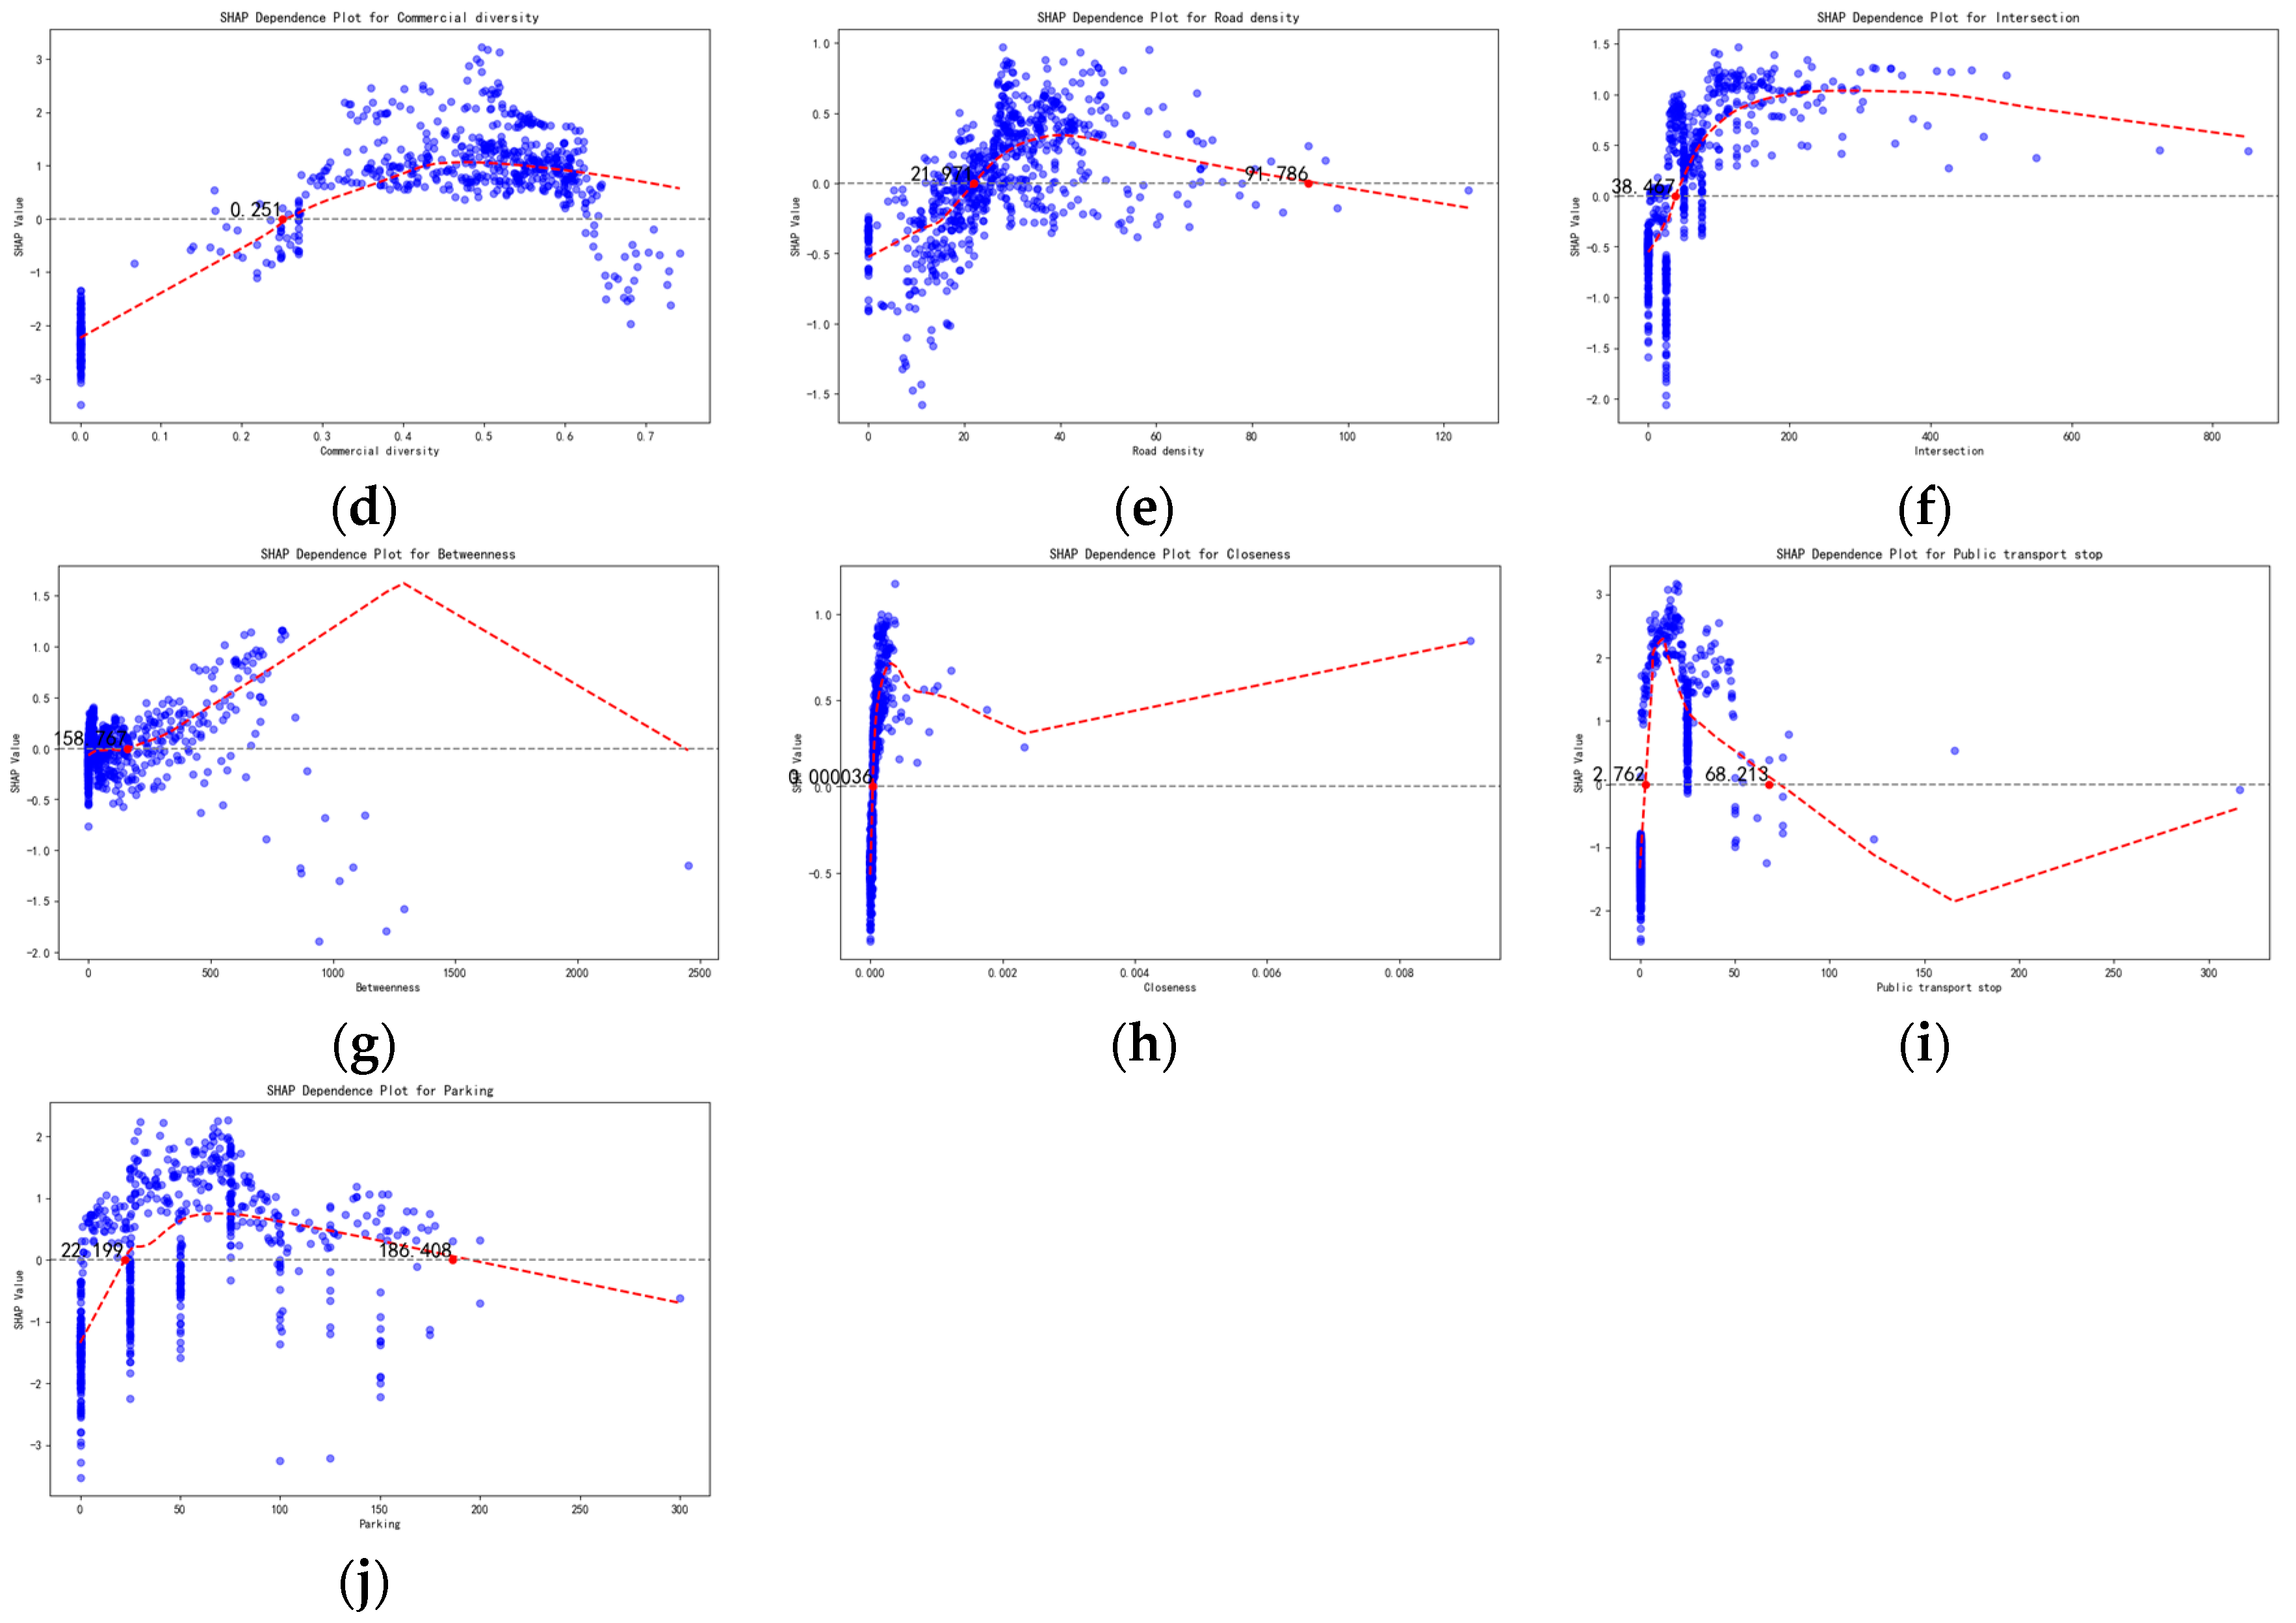
3.3.2. Interpretation of the Model
3.4. Types and Characteristics of Neighborhood Commercial Areas
4. Discussion
4.1. Neighborhood Commercial Areas and Daily Life Circles
4.1.1. Differences from Urban Commercial Central Districts
4.1.2. Delineation of Daily Life Circles
4.2. Method for Identifying Neighborhood Commercial Areas
4.3. Causes of Neighborhood Commercial Areas
4.3.1. Factors Influencing Formation
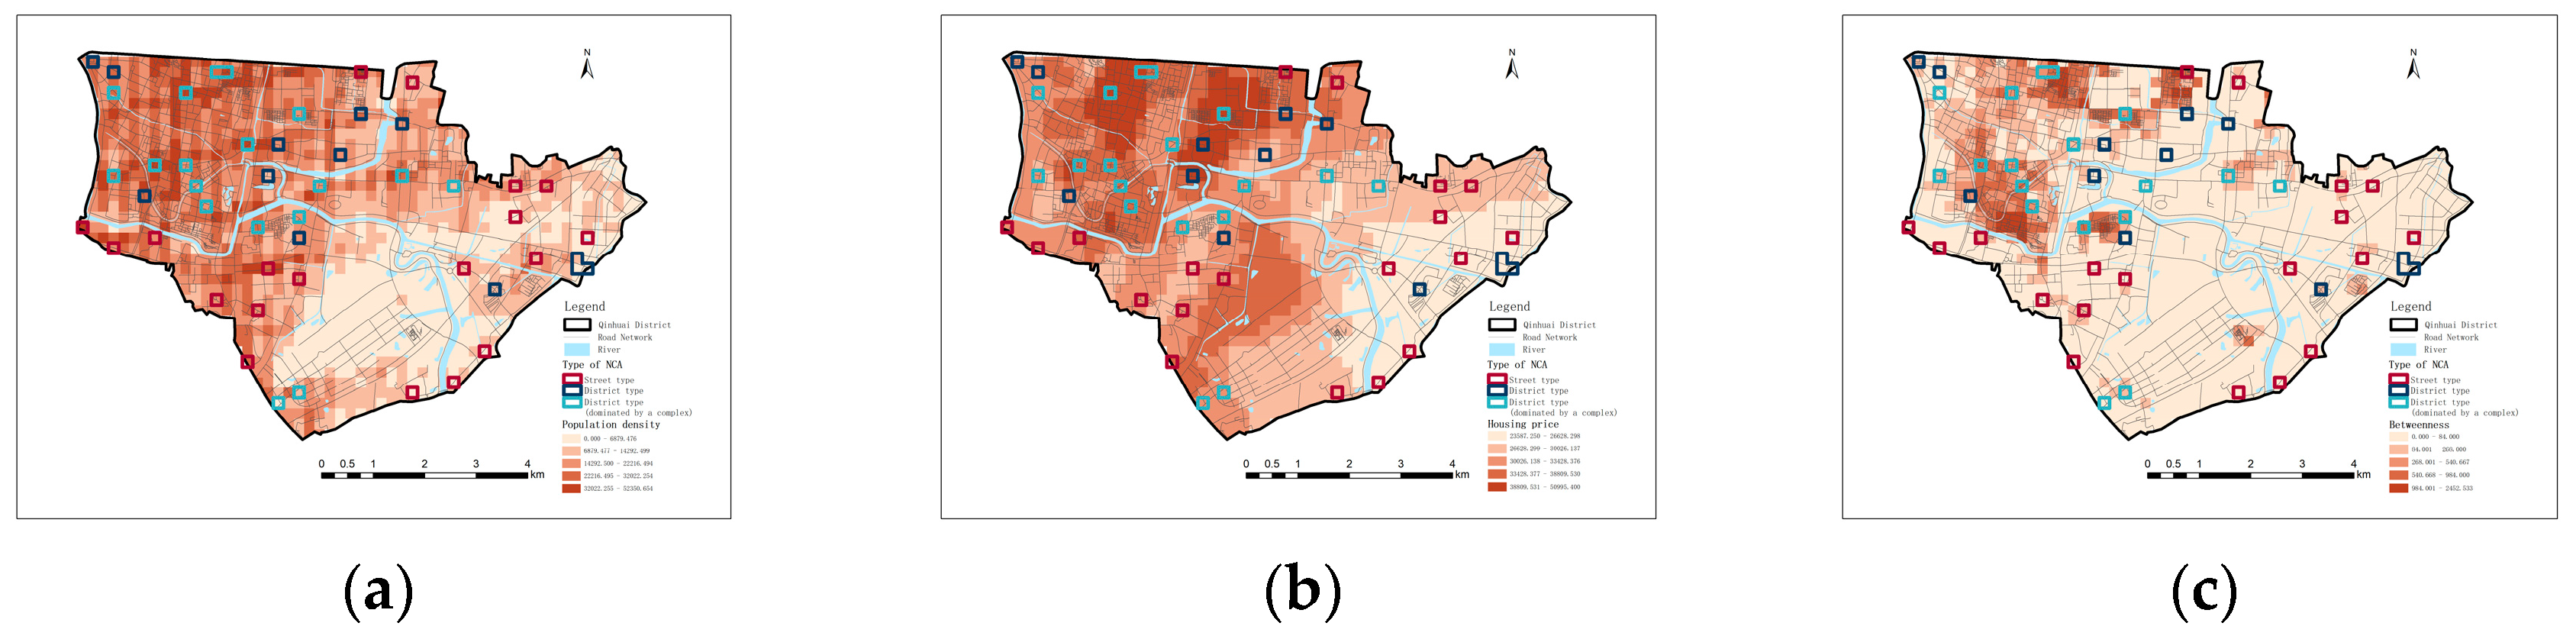
4.3.2. Factors Influencing Types
5. Conclusions
Author Contributions
Funding
Data Availability Statement
Conflicts of Interest
Appendix A

| Subdistrict | Number of the NCA | Number of the Neighboring NCA | Euclidean Distance (m) | Area Served (km2) | Residents Served (People) |
|---|---|---|---|---|---|
| GHTG | 1 | 2 | 447 | 0.209 | 4794 |
| 2 | 3 | 400 | 0.538 | 13,989 | |
| 3 | 2 | 400 | 0.956 | 23,729 | |
| SHT | 4 | 14 | 600 | 0.840 | 22,885 |
| 5 | 6 | 721 | 0.892 | 21,259 | |
| 6 | 4 | 632 | 0.676 | 17,647 | |
| ZHHM | 7 | 8 | 721 | 0.333 | 6990 |
| 8 | 7 | 721 | 0.400 | 7461 | |
| 9 | 6 | 825 | 1.054 | 20,969 | |
| 10 | 28 | 825 | 1.123 | 22,970 | |
| WLC | 11 | 12 | 806 | 1.058 | 31,150 |
| HWL | 12 | 11 | 806 | 1.490 | 45,663 |
| 13 | 20 | 600 | 1.097 | 28,068 | |
| FZM | 14 | 15 | 447 | 0.749 | 22,031 |
| 15 | 16 | 447 | 0.528 | 13,329 | |
| 16 | 15 | 447 | 1.021 | 20,729 | |
| RJL | 17 | 19 | 800 | 0.559 | 10,995 |
| 18 | 20 | 721 | 1.504 | 33,829 | |
| 19 | 17 | 800 | 0.830 | 12,301 | |
| DGL | 20 | 18 | 721 | 0.604 | 13,626 |
| 21 | 32 | 721 | 0.967 | 16,709 | |
| QH | 22 | 20 | 632 | 0.770 | 15,873 |
| 23 | 24 | 825 | 0.929 | 19,833 | |
| 24 | 25 | 400 | 0.576 | 8880 | |
| 25 | 24 | 400 | 1.057 | 14,830 | |
| 26 | 27 | 632 | 0.713 | 14,733 | |
| 27 | 26 | 632 | 2.588 | 16,055 | |
| HH | 28 | 26 | 825 | 1.057 | 17,137 |
| 29 | 34 | 1000 | 0.619 | 11,108 | |
| 30 | 31 | 447 | 2.305 | 19,734 | |
| 31 | 30 | 447 | 0.405 | 5961 | |
| 32 | 47 | 825 | 2.315 | 13,686 | |
| YYH | 33 | 34 | 825 | 0.681 | 8903 |
| 34 | 33 | 825 | 1.095 | 17,203 | |
| 35 | 21 | 721 | 1.115 | 16,709 | |
| GHL | 36 | 34 | 1000 | 2.060 | 30,534 |
| 37 | 36 | 1020 | 1.693 | 23,555 | |
| 38 | 39 | 600 | 0.538 | 7652 | |
| 39 | 38 | 600 | 1.404 | 13,006 | |
| 40 | 38 | 600 | 0.956 | 4360 | |
| 41 | 43 | 550 | 1.561 | 9483 | |
| 42 | 43 | 877 | 0.993 | 11,213 | |
| 43 | 41 | 550 | 0.404 | 3266 | |
| 44 | 45 | 721 | 2.994 | 7927 | |
| 45 | 44 | 721 | 1.109 | 10,491 | |
| 46 | 47 | 850 | 0.961 | 3505 | |
| 47 | 46 | 850 | 0.745 | 3386 |
References
- Xu, Z.; Shang, Z.; Zhong, Y.; Han, L.; Li, M.; Yang, Y. Evaluating 15-min Walkable Life Circles for the Senior: A Case Study of Jiande, China. J. Asian Archit. Build. Eng. 2024, 1–17. [Google Scholar]
- Moreno, C.; Allam, Z.; Chabaud, D.; Gall, C.; Pratlong, F. Introducing the “15-min City”: Sustainability, Resilience and Place Identity in Future Post-Pandemic Cities. Smart Cities 2021, 4, 93–111. [Google Scholar] [CrossRef]
- Liu, T.; Chai, Y. Daily Life Circle Reconstruction: A Scheme for Sustainable Development in Urban China. Habitat Int. 2015, 50, 250–260. [Google Scholar] [CrossRef]
- Langdon, P. Portland Pursues the ‘20-min Neighborhood’. 2008. Available online: https://www.cnu.org/publicsquare/portland-pursues-%E2%80%9820-minute-neighborhood%E2%80%99 (accessed on 24 August 2024).
- Nanjing Municipal Bureau of Planning and Natural Resources. Nanjing Planning Guidance of 15-min Community Life Circle. 2023. Available online: http://ghj.nanjing.gov.cn/njsgtzyj/202306/t20230608_3931597.html (accessed on 22 August 2024).
- Department of Transport and Planning, Victoria State Government. 20-min Neighbourhoods. 2024. Available online: https://www.planning.vic.gov.au/guides-and-resources/strategies-and-initiatives/20-minute-neighbourhoods (accessed on 24 August 2024).
- Tong, M. 2023 Graduate Design Course|Research on the Ecology and Structure of Nanjing Fireworks Circle. 2023. Available online: https://arch.seu.edu.cn/2024/0124/c9122a479875/page.htm (accessed on 20 August 2024).
- Ministry of Housing and Urban-Rural Development of the People’s Republic of China. Standard for Urban Residential Area Planning and Design. 2018. Available online: https://www.mohurd.gov.cn/gongkai/zhengce/zhengcefilelib/201811/20181130_238590.html (accessed on 24 August 2024).
- Hu, S.; Song, W.; Li, C.; Lu, J. A Multi-Mode Gaussian-Based Two-Step Floating Catchment Area Method for Measuring Accessibility of Urban Parks. Cities 2020, 105, 102815. [Google Scholar] [CrossRef]
- Song, L.; Kong, X.; Cheng, P. Supply-Demand Matching Assessment of the Public Service Facilities in 15-min Community Life Circle Based on Residents’ Behaviors. Cities 2024, 144, 104637. [Google Scholar] [CrossRef]
- Jing, C.; Zhou, W.; Qian, Y.; Zheng, Z.; Wang, J.; Yu, W. Trajectory Big Data Reveals Spatial Disparity of Healthcare Accessibility at the Residential Neighborhood Scale. Cities 2023, 133, 104127. [Google Scholar] [CrossRef]
- Xie, H.; Wang, X.; Wang, Z.; Shi, Z.; Hu, X.; Lin, H.; Xie, X.; Liu, X. Mismatch between Infrastructure Supply and Demand within a 15-min Living Circle Evaluation in Fuzhou, China. Heliyon 2023, 9, e20130. [Google Scholar] [CrossRef]
- Smith, D.A.; Shen, Y.; Barros, J.; Zhong, C.; Batty, M.; Giannotti, M. A Compact City for the Wealthy? Employment Accessibility Inequalities between Occupational Classes in the London Metropolitan Region 2011. J. Transp. Geogr. 2020, 86, 102767. [Google Scholar]
- Gehl, J. Life Between Buildings: Using Public Space, 3rd ed.; Island Press: Washington, DC, USA, 2011. [Google Scholar]
- Cheng, L.; De Vos, J.; Shi, K.; Yang, M.; Chen, X.; Witlox, F. Do Residential Location Effects on Travel Behavior Differ between the Elderly and Younger Adults? Transp. Res. Part D Transp. Environ. 2019, 73, 367–380. [Google Scholar] [CrossRef]
- Zheng, J.; Hu, M.; Wang, C.; Wang, S.; Han, B.; Wang, H. Spatial Patterns of Residents’ Daily Activity Space and Its Influencing Factors Based on the CatBoost Model: A Case Study of Nanjing, China. Front. Archit. Res. 2022, 11, 1193–1204. [Google Scholar] [CrossRef]
- Duan, Z.; Zhao, H.; Li, Z. Non-Linear Effects of Built Environment and Socio-Demographics on Activity Space. J. Transp. Geogr. 2023, 111, 103671. [Google Scholar] [CrossRef]
- Rappaport, J. Consumption Amenities and City Population Density. Reg. Sci. Urban Econ. 2008, 38, 533–552. [Google Scholar] [CrossRef]
- Huang, Z.; Yin, G.; Peng, X.; Zhou, X.; Dong, Q. Quantifying the Environmental Characteristics Influencing the Attractiveness of Commercial Agglomerations with Big Geo-Data. Environ. Plan. B Urban Anal. City Sci. 2023, 50, 2470–2490. [Google Scholar] [CrossRef]
- Tan, D.; Nguyen, M.Q. Beyond the Palimpsest: Traditions and Modernity in Urban Villages of Shenzhen, China. Cities 2024, 151, 105093. [Google Scholar] [CrossRef]
- Mehta, V.; Mahato, B. Measuring the Robustness of Neighbourhood Business Districts. J. Urban Des. 2019, 24, 99–118. [Google Scholar] [CrossRef]
- Hernández, T.; Bennison, D. The Art and Science of Retail Location Decisions. Int. J. Retail Distrib. Manag. 2000, 28, 357–367. [Google Scholar] [CrossRef]
- Oppewal, H.; Holyoake, B. Bundling and Retail Agglomeration Effects on Shopping Behavior. J. Retail. Consum. Serv. 2004, 11, 61–74. [Google Scholar] [CrossRef]
- Hidalgo, C.A.; Castañer, E.; Sevtsuk, A. The Amenity Mix of Urban Neighborhoods. Habitat Int. 2020, 106, 102205. [Google Scholar] [CrossRef]
- Jones, M. For a “New New Regional Geography”: Plastic Regions and More-than-Relational Regionality. Geogr. Ann. Ser. B-Human Geogr. 2022, 104, 43–58. [Google Scholar] [CrossRef]
- Hasanzadeh, K.; Kyttä, M.; Lilius, J.; Ramezani, S.; Rinne, T. Centricity and Multi-Locality of Activity Spaces: The Varying Ways Young and Old Adults Use Neighborhoods and Extra-Neighborhood Spaces in Helsinki Metropolitan Area. Cities 2021, 110, 103062. [Google Scholar] [CrossRef]
- Hasanzadeh, K. Exploring Centricity of Activity Spaces: From Measurement to the Identification of Personal and Environmental Factors. Travel Behav. Soc. 2019, 14, 57–65. [Google Scholar] [CrossRef]
- Huang, H.; Zhou, D.; Wang, Y. An Analysis of the Spatial Organization of Community Life-cycle under Residential Morphological Categories. Urban Plan. 2021, 02, 94–101. [Google Scholar]
- Li, J.; Li, J.; Yuan, Y.; Li, G. Spatiotemporal Distribution Characteristics and Mechanism Analysis of Urban Population Density: A Case of Xi’an, Shaanxi, China. Cities 2019, 86, 62–70. [Google Scholar] [CrossRef]
- Song, Y.; Lyu, Y.; Qian, S.; Zhang, X.; Lin, H.; Wang, S. Identifying Urban Candidate Brownfield Sites Using Multi-Source Data: The Case of Changchun City, China. Land Use Policy 2022, 117, 106084. [Google Scholar] [CrossRef]
- Pavlis, M.; Dolega, L.; Singleton, A. A Modified DBSCAN Clustering Method to Estimate Retail Center Extent. Geogr. Anal. 2018, 50, 141–161. [Google Scholar] [CrossRef]
- Wei, J.; Sun, S. Commercial Activity Cluster Recognition with Modified DBSCAN Algorithm: A Case Study of Milan. In Proceedings of the 2019 IEEE International Smart Cities Conference (ISC2), Casablanca, Morocco, 14–17 October 2019; pp. 228–234. [Google Scholar]
- Li, J.; Long, Y.; Dang, A. Live-Work-Play Centers of Chinese Cities: Identification and Temporal Evolution with Emerging Data. Comput. Environ. Urban Syst. 2018, 71, 58–66. [Google Scholar] [CrossRef]
- Yang, J.; Zhu, J.; Sun, Y.; Zhao, J. Delimitating Urban Commercial Central Districts by Combining Kernel Density Estimation and Road Intersections: A Case Study in Nanjing City, China. ISPRS Int. J. Geo-Inf. 2019, 8, 93. [Google Scholar] [CrossRef]
- Han, Z.; Song, W. Identification and Geographic Distribution of Accommodation and Catering Centers. ISPRS Int. J. Geo-Inf. 2020, 9, 546. [Google Scholar] [CrossRef]
- Long, Y.; Huang, C.C. Does Block Size Matter? The Impact of Urban Design on Economic Vitality for Chinese Cities. Environ. Plan. B-Urban Anal. City Sci. 2019, 46, 406–422. [Google Scholar] [CrossRef]
- Sevtsuk, A. Location and Agglomeration: The Distribution of Retail and Food Businesses in Dense Urban Environments. J. Plan. Educ. Res. 2014, 34, 374–393. [Google Scholar] [CrossRef]
- Lin, G.; Chen, X.; Liang, Y. The Location of Retail Stores and Street Centrality in Guangzhou, China. Appl. Geogr. 2018, 100, 12–20. [Google Scholar] [CrossRef]
- Lu, C.; Yu, C.; Xin, Y.; Zhang, W. Spatial Distribution Characteristics and Influencing Factors on the Retail Industry in the Central Urban Area of Lanzhou City at the Scale of Daily Living Circles. ISPRS Int. J. Geo-Inf. 2023, 12, 344. [Google Scholar] [CrossRef]
- Larsson, J.P.; Öner, Ö. Location and Co-Location in Retail: A Probabilistic Approach Using Geo-Coded Data for Metropolitan Retail Markets. Ann. Reg. Sci. 2014, 52, 385–408. [Google Scholar] [CrossRef]
- Wu, H.; Chen, Y.; Jiao, J. Impact of Neighborhood Built Environments on Shopping Travel Modes in Shanghai, China. Transp. Res. Rec. 2019, 2673, 669–681. [Google Scholar] [CrossRef]
- Gunn, L.D.; Mavoa, S.; Boulangé, C.; Hooper, P.; Kavanagh, A.; Giles-Corti, B. Designing Healthy Communities: Creating Evidence on Metrics for Built Environment Features Associated with Walkable Neighbourhood Activity Centres. Int. J. Behav. Nutr. Phys. Act. 2017, 14, 164. [Google Scholar] [CrossRef] [PubMed]
- Hahm, Y.; Yoon, H.; Choi, Y. The Effect of Built Environments on the Walking and Shopping Behaviors of Pedestrians; A Study with GPS Experiment in Sinchon Retail District in Seoul, South Korea. Cities 2019, 89, 1–13. [Google Scholar] [CrossRef]
- De Gruyter, C.; Truong, L.T.; Zahraee, S.M.; Young, W. Street and Activity Centre Characteristics Associated with the Use of Different Transport Modes. Cities 2023, 141, 104468. [Google Scholar] [CrossRef]
- Bai, X.; Zhou, M.; Li, W. Analysis of the Influencing Factors of Vitality and Built Environment of Shopping Centers Based on Mobile-Phone Signaling Data. PLoS ONE 2024, 19, e0296261. [Google Scholar] [CrossRef]
- Liu, J.; Wang, B.; Xiao, L. Non-Linear Associations between Built Environment and Active Travel for Working and Shopping: An Extreme Gradient Boosting Approach. J. Transp. Geogr. 2021, 92, 103034. [Google Scholar] [CrossRef]
- CTR Mobile User Index Division CTR. China Search Engine Industry Research Report. 2023. Available online: https://www.itopmarketing.com/uploads/soft/20230613/1686633779.pdf (accessed on 24 August 2024).
- Yang, J.; Cao, J.; Zhou, Y. Elaborating Non-Linear Associations and Synergies of Subway Access and Land Uses with Urban Vitality in Shenzhen. Transp. Res. Part A Policy Pract. 2021, 144, 74–88. [Google Scholar] [CrossRef]
- Ye, Z.; Chen, Y.; Zhang, L. The Analysis of Space Use around Shanghai Metro Stations Using Dynamic Data from Mobile Applications. Transp. Res. Procedia 2017, 25, 3147–3160. [Google Scholar] [CrossRef]
- Fan, Z.; Duan, J.; Lu, Y.; Zou, W.; Lan, W. A Geographical Detector Study on Factors Influencing Urban Park Use in Nanjing, China. Urban For. Urban Green. 2021, 59, 126996. [Google Scholar] [CrossRef]
- Wu, C.; Ye, X.; Ren, F.; Du, Q. Check-in Behaviour and Spatio-Temporal Vibrancy: An Exploratory Analysis in Shenzhen, China. Cities 2018, 77, 104–116. [Google Scholar] [CrossRef]
- Hongbo, Z.; Difei, Y.; Changhong, M.; Guanghui, L.; Yuanbo, F.; Qianlong, B. The Location Distribution Characteristics and Influencing Factors of Cultural Facilities in Zhengzhou Based on POI Data. Sci. Geogr. Sin. 2018, 38, 1525–1534. [Google Scholar]
- Shen, Y.; Karimi, K. Urban Function Connectivity: Characterisation of Functional Urban Streets with Social Media Check-in Data. Cities 2016, 55, 9–21. [Google Scholar] [CrossRef]
- National Bureau of Statistics. Statistical Classification of Life—Related Service Industries. 2019. Available online: https://www.gov.cn/zhengce/zhengceku/2019-09/03/content_5426962.htm (accessed on 31 August 2024).
- Baidu Map POI Industry Classification. Available online: https://doc.bce.baidu.com/bce-documentation/DUMAP/tag.pdf (accessed on 31 August 2024).
- Nanjing Municipal Statistics Bureau. Nanjing Seventh National Population Census Bulletin. 2021. Available online: https://tjj.nanjing.gov.cn/bmfw/njsj/202105/t20210524_2945571.html (accessed on 31 August 2024).
- Anderson, T.K. Kernel Density Estimation and K-Means Clustering to Profile Road Accident Hotspots. Accid. Anal. Prev. 2009, 41, 359–364. [Google Scholar] [CrossRef]
- Lan, F.; Gong, X.; Da, H.; Wen, H. How Do Population Inflow and Social Infrastructure Affect Urban Vitality? Evidence from 35 Large- and Medium-Sized Cities in China. Cities 2020, 100, 102454. [Google Scholar] [CrossRef]
- Rui, J.; Li, X. Decoding Vibrant Neighborhoods: Disparities between Formal Neighborhoods and Urban Villages in Eye-Level Perceptions and Physical Environment. Sustain. Cities Soc. 2024, 101, 105122. [Google Scholar] [CrossRef]
- Tu, W.; Zhu, T.; Zhong, C.; Zhang, X.; Xu, Y.; Li, Q. Exploring Metro Vibrancy and Its Relationship with Built Environment: A Cross-City Comparison Using Multi-Source Urban Data. Geo-Spat. Inf. Sci. 2022, 25, 182–196. [Google Scholar] [CrossRef]
- Zhang, H.; Zhou, X.; Tang, G.; Zhou, L.; Ye, X. Hotspot discovery and its spatial pattern analysis for catering service in cities based on field model in GIS. Geogr. Res. 2020, 39, 354–369. [Google Scholar]
- Li, X.; Li, Y.; Jia, T.; Zhou, L.; Hijazi, I.H. The Six Dimensions of Built Environment on Urban Vitality: Fusion Evidence from Multi-Source Data. Cities 2022, 121, 103482. [Google Scholar] [CrossRef]
- Sevtsuk, A.; Mekonnen, M. Urban Network Analysis. A New Toolbox for ArcGIS. Rev. Int. Géomatique 2012, 287, 305. [Google Scholar] [CrossRef]
- Freeman, L.C. A Set of Measures of Centrality Based on Betweenness. Sociometry 1977, 40, 35–41. [Google Scholar] [CrossRef]
- Sabidussi, G. The Centrality Index of a Graph. Psychometrika 1966, 31, 581–603. [Google Scholar] [CrossRef]
- Hancock, J.T.; Khoshgoftaar, T.M. CatBoost for Big Data: An Interdisciplinary Review. J. Big Data 2020, 7, 94. [Google Scholar] [CrossRef]
- Huang, G.; Wu, L.; Ma, X.; Zhang, W.; Fan, J.; Yu, X.; Zeng, W.; Zhou, H. Evaluation of CatBoost Method for Prediction of Reference Evapotranspiration in Humid Regions. J. Hydrol. 2019, 574, 1029–1041. [Google Scholar] [CrossRef]
- Prokhorenkova, L.; Gusev, G.; Vorobev, A.; Dorogush, A.V.; Gulin, A. CatBoost: Unbiased boosting with categorical features. In Proceedings of the Neural Information Processing Systems (NeurIPS 2018), Montréal, QC, Canada, 3 December 2018. [Google Scholar]
- Lundberg, S.M.; Lee, S.-I. A Unified Approach to Interpreting Model Predictions. In Proceedings of the 31st Conference on Neural Information Processing Systems (NIPS 2017), Long Beach, CA, USA, 4 December 2017. [Google Scholar]
- Yu, B.; Shu, S.; Liu, H.; Song, W.; Wu, J.; Wang, L.; Chen, Z. Object-Based Spatial Cluster Analysis of Urban Landscape Pattern Using Nighttime Light Satellite Images: A Case Study of China. Int. J. Geogr. Inf. Sci. 2014, 28, 2328–2355. [Google Scholar] [CrossRef]
- Bergstra, J.; Bengio, Y. Random Search for Hyper-Parameter Optimization. J. Mach. Learn. Res. 2012, 13, 281–305. [Google Scholar]
- Hu, Q.; Bai, G.; Wang, S.; Ai, M. Extraction and Monitoring Approach of Dynamic Urban Commercial Area Using Check-in Data from Weibo. Sustain. Cities Soc. 2019, 45, 508–521. [Google Scholar] [CrossRef]
- Zwanziger, J.; Mukamel, D.B.; Indridason, I. Use of Resident-Origin Data to Define Nursing Home Market Boundaries. Inq. J. Health Care Organ. Provis. Financ. 2002, 39, 56–66. [Google Scholar] [CrossRef]
- Ruan, Y.; Liu, S.; Li, W.; Zhang, M. Spatial characteristics and influence factors of urban community center: Evidence from the Xihu District in Hangzhou City. Sci. Geogr. Sin. 2021, 41, 74–82. [Google Scholar]
- Taecharungroj, V. Google Maps Amenities and Condominium Prices: Investigating the Effects and Relationships Using Machine Learning. Habitat Int. 2021, 118, 102463. [Google Scholar] [CrossRef]
- Schuetz, J.; Kolko, J.; Meltzer, R. Are Poor Neighborhoods “Retail Deserts”? Reg. Sci. Urban Econ. 2012, 42, 269–285. [Google Scholar] [CrossRef]
- Fan, Y.; Khattak, A.J. Urban Form, Individual Spatial Footprints, and Travel Examination of Space-Use Behavior. Transp. Res. Rec. 2008, 2082, 98–106. [Google Scholar] [CrossRef]
- Yan, X.; Zhao, W. Variegated Urban Entrepreneurialism and Its Contested Results in the Boom of Neighborhood Center Complexes in Chengdu, China. Cities 2024, 150, 105039. [Google Scholar] [CrossRef]
- Porta, S.; Strano, E.; Iacoviello, V.; Messora, R.; Latora, V.; Cardillo, A.; Wang, F.; Scellato, S. Street Centrality and Densities of Retail and Services in Bologna, Italy. Environ. Plan. B Plan. Des. 2009, 36, 450–465. [Google Scholar] [CrossRef]


| Study Area and Scale | Outcomes | Facility Categories | Density Analysis Method |
|---|---|---|---|
| 8 regions in the UK (Pavlis, M., Dolega, L., and Singleton, A., 2018) [31] | Retail centers | Retail service | DBSCAN clustering method |
| Milan, Italy (Wei, J. and Sun, S., 2019) [32] | Commercial activity clusters | 26 types of commercial facilities (accommodation, bar, restaurant, takeaway, supermarket, among others) | DBSCAN clustering method |
| 285 Chinese cities (Li, J., Long, Y., and Dang, A., 2018) [33] | Live-Work-Play centers | Residential community, community service, company, office building, commercial site, catering site, among others | Local POI density peak indicator |
| Nanjing, China (Yang, J., Zhu, J., Sun, Y. et al., 2019) [34] | Urban commercial central districts | Administration and public service, commercial and business facilities, residential land, transportation facilities, municipal utilities | Kernel density estimation |
| Beijing, China (Han, Z. and Song, W., 2020) [35] | Accommodation and catering centers | Leisure catering, commercial accommodation, fast food, restaurant | Kernel density estimation |
| Category | Study Area and Scale | Outcomes | Methods | Results |
|---|---|---|---|---|
| Distribution of commercial facilities | 286 largest cities in China (Long, Y. and Huang, C.C., 2017) [36] | Economic vitality | Ordinary least squares regression | Positive correlation: intersection density, POI density, population density, mixed use, access to transit, and access to amenities. |
| Cambridge and Somerville, MA, USA (Sevtsuk, A., 2014) [37] | Location patterns of retail and food establishments | Spatial lag model | Positive correlation: subway stations, building footprint area, sidewalk width, and betweenness, among others. Negative correlation: residents, housing vacancy rate, and rental ratio, among others. | |
| Guangzhou, China (Lin, G., Chen, X., and Liang, Y., 2018) [38] | Location of retail stores | Correlation analysis and regression analysis | Shopping centers and convenience stores prefer locations with high road network closeness, while other retail stores are more common in areas with high betweenness. | |
| Central urban area of Lanzhou, China (Lu, C., Yu, C., Xin, Y. et al., 2023) [39] | Distribution of the retail industry | Geodetector | Positive correlation: population density, housing unit price, public transport coverage density, and road network density. | |
| Vitality of commercial areas | 21 neighborhoods in Shanghai, China (Wu, H., Chen, Y., and Jiao, J., 2011) [41] | Using walking as the primary shopping mode | Multinomial logistic regression | Positive correlation: road network density, average sidewalk width, and presence of primary schools. |
| 534 neighborhood activity centers (NACs) in Melbourne, Australia (Gunn, L.D., Mavoa, S., Boulangé, C. et al., 2017) [42] | Walkability of NAC | Multilevel logistic regressions | Highly walkable NAC: street connectivity, destination diversity, net residential density, and transport stops, among others. | |
| Sinchon retail area, Seoul, South Korea (Hahm, Y., Yoon, H., and Choi, Y., 2019) [43] | Walking behavior and shopping behavior | Path analysis | Positive correlation: street centrality, store diversity, and vehicular lanes, among others. Negative correlation: shared streets and building age, among others. | |
| 57 activity centers in Melbourne, Australia (De Gruyter, C., Truong, L.T., Zahraee, S.M. et al., 2023) [44] | Use of different transport modes | Fractional logistic regression | Positively correlated: width of footpaths, 4+ way intersection density (for walking); presence of bicycle lanes, clearways, tram services, bus services, and total intersection density (for cycling). Negative correlation: network distance to the nearest train station, supermarket, and pharmacy (for walking); distance to the CBD (for cycling). | |
| 12 shopping centers in Nanshan District, Shenzhen, China (Bai, X., Zhou, M., and Li, W., 2024) [45] | Vitality of the shopping center | Correlation analysis and linear regression | Positive correlation: commercial area, public service land area, residential area, POI mixing degree, and traffic accessibility, among others. Negative correlation: industrial area, among others. |
| Data | Data Source |
|---|---|
| BHI | Baidu Huiyan Platform (https://huiyan.baidu.com; accessed on 12 April 2023 and 12 July 2023) |
| POI data (commercial facilities and transportation facilities) | Baidu Map (https://map.baidu.com/; accessed in June 2023) |
| Community attribute | Lianjia (https://nj.lianjia.com/; accessed on 12 April 2023 and 12 July 2023) |
| Resident population | WorldPop Dataset (https://hub.worldpop.org/; accessed in June 2023) National Bureau of Statistics, Seventh National Population Census(https://www.stats.gov.cn/; accessed in June 2023) |
| Urban administration map | OpenStreetMap(https://www.openstreetmap.org; accessed in June 2023) |
| Category | Subcategory | Numbers |
|---|---|---|
| Catering service | Catering | 7030 |
| Residential and household service | Residential service | 2007 |
| Repair service for residential supplies | 268 | |
| Other residential and household service | 73 | |
| Retail service | Department store | 80 |
| Supermarket | 283 | |
| Convenience store | 732 | |
| Specialty store retail | 4424 | |
| Sports service | Sports facility | 162 |
| Sports lottery | 240 | |
| Express delivery service | Express delivery service | 334 |
| Other life service | Telecommunications service | 96 |
| Financial service | 637 |
| Category | Variable | Definition | Mean | Std. | Min | Max |
|---|---|---|---|---|---|---|
| Socio-demographic | Population density | Resident population/analysis unit area (people/km2) | 15,061.000 | 10,065.982 | 0 | 52,350.654 |
| Community attribute | Housing price | Average housing price per square meter within communities (CNY/m2) | 31,298.146 | 4899.830 | 23,578.250 | 50,995.400 |
| Land use | Floor–area ratio | Total residential area/analysis unit area | 0.553 | 0.723 | 0 | 5.297 |
| Commercial diversity | where Ei represents the commercial diversity of unit i, pi is the proportion of each of the thirteen service facility types in unit i, and k is the number of facility types (with k = 13). | 0.230 | 0.258 | 0 | 0.798 | |
| Road network | Road density | Road centerline length/analysis unit area (km/km2) | 24.656 | 19.639 | 0 | 177.660 |
| Intersection | Number of road centerline intersections/analysis unit area (counts/km2) | 42.192 | 86.208 | 0 | 850 | |
| Street centrality | Betweenness | The proportion of shortest paths that pass through a specific node between any two nodes in the road network [64] | 102.896 | 231.520 | 0 | 2452.533 |
| Closeness | The reciprocal of the average distance from a node to all other nodes along the shortest paths in the network [65] | 0.000106 | 0.000690 | 0 | 0.015501 | |
| Transportation facility | Public transport stop | Number of public transit stations (including bus and metro)/analysis unit area (counts/km2) | 8.441 | 26.855 | 524.453 | 0 |
| Parking | Number of parking spots/analysis unit area (counts/km2) | 29.443 | 44.481 | 300.000 | 0 |
| Index | Definition |
|---|---|
| COR | where A is the area of the minimum convex hull, and P is the circumference of the minimum convex hull. |
| ELG | where l is the length of the major axis of the minimum boundary rectangle, and w is the length of the minimum boundary rectangle. |
| DEN | where n is the number of commercial facilities within the NCA, and A is the area of the minimum convex hull. |
| GCI | where Xr is the number of commercial facilities within the NCAr, m is the total number of commercial facilities within all NCAs, and N is the number of the NCA. |
| Attribute | Min | Max | Mean | Median |
|---|---|---|---|---|
| Euclidean distance (m) | 400 | 1020 | 680 | 721 |
| Residents served (people) | 3266 | 45,663 | 15,748 | 14,733 |
| Residents aged 60 and older served (people) | 620 | 8667 | 2989 | 2796 |
| Area served (km2) | 0.209 | 2.994 | 1.044 | 0.956 |
| Resident density served (people/km2) | 2648 | 30,646 | 16,943 | 17,279 |
| Performance Metric | Value |
|---|---|
| Training Accuracy | 1.000 |
| Testing Accuracy | 0.980 |
| AUC | 0.997 |
| F1 Score | 0.980 |
| Precision | 0.980 |
| Recall | 0.980 |
| MCC | 0.960 |
| Type | Spatial Form | Description | Numbers |
|---|---|---|---|
| ST | Low COR, Low GCI | Commercial facilities are distributed along one street. | 19 |
| DT | High COR, Low DEN, Low GCI | It is in the shape of a lump, with commercial facilities distributed along two or more streets. | 10 |
| DT-DC | Low ELG, High GCI | It consists of commercial facilities distributed along the street and a complex of centralized facilities, forming a lump. | 18 |
| Variable | Type | Mean | SD | F | p-Value | (I) | (J) | Mean Difference (I–J) | p-Value |
|---|---|---|---|---|---|---|---|---|---|
| Population density | A | 15,012 | 10,305 | 3.350 | 0.044 ∗ | A | B | −2496.233105 | 1.000 |
| B | 17,104 | 8653 | A | C | −8768.737053 | 0.044 ∗ | |||
| C | 23,061 | 10,763 | B | C | −6272.503947 | 0.353 | |||
| Housing price | A | 29,169.764 | 3491.244 | 4.852 | 0.012 ∗ | A | B | −2652.545496 | 0.446 |
| B | 31,248.635 | 5648.692 | A | C | −4948.203053 | 0.009 ∗∗ | |||
| C | 34,506.561 | 5266.486 | B | C | −2295.657557 | 0.63 | |||
| Betweenness | A | 72.008 | 186.926 | 6.343 | 0.004 ∗∗ | A | B | −14.47486 | 0.993 |
| B | 87.862 | 134.674 | A | C | −217.351842 | 0.014 ∗ | |||
| C | 252.839 | 240.920 | B | C | −202.876982 | 0.021 ∗ |
Disclaimer/Publisher’s Note: The statements, opinions and data contained in all publications are solely those of the individual author(s) and contributor(s) and not of MDPI and/or the editor(s). MDPI and/or the editor(s) disclaim responsibility for any injury to people or property resulting from any ideas, methods, instructions or products referred to in the content. |
© 2024 by the authors. Published by MDPI on behalf of the International Society for Photogrammetry and Remote Sensing. Licensee MDPI, Basel, Switzerland. This article is an open access article distributed under the terms and conditions of the Creative Commons Attribution (CC BY) license (https://creativecommons.org/licenses/by/4.0/).
Share and Cite
Feng, T.; Zhou, Y. Identification and Causes of Neighborhood Commercial Areas: Focusing on the Development of Daily Life Circles in Urban Built Environments. ISPRS Int. J. Geo-Inf. 2024, 13, 406. https://doi.org/10.3390/ijgi13110406
Feng T, Zhou Y. Identification and Causes of Neighborhood Commercial Areas: Focusing on the Development of Daily Life Circles in Urban Built Environments. ISPRS International Journal of Geo-Information. 2024; 13(11):406. https://doi.org/10.3390/ijgi13110406
Chicago/Turabian StyleFeng, Tianyi, and Ying Zhou. 2024. "Identification and Causes of Neighborhood Commercial Areas: Focusing on the Development of Daily Life Circles in Urban Built Environments" ISPRS International Journal of Geo-Information 13, no. 11: 406. https://doi.org/10.3390/ijgi13110406
APA StyleFeng, T., & Zhou, Y. (2024). Identification and Causes of Neighborhood Commercial Areas: Focusing on the Development of Daily Life Circles in Urban Built Environments. ISPRS International Journal of Geo-Information, 13(11), 406. https://doi.org/10.3390/ijgi13110406