Article

Examining the Causal and Heterogeneous Influence of Three-Dimensional Urban Forms on CO2 Emissions in 285 Chinese Cities

1
Department of Urban Design, College of Landscape Architecture, Nanjing Forestry University, No. 159 Longpan Road, Nanjing 210037, China
2
School of Architecture, Southeast University, Nanjing 210096, China
*
Author to whom correspondence should be addressed.
ISPRS Int. J. Geo-Inf. 2024, 13(11), 372; https://doi.org/10.3390/ijgi13110372
Submission received: 30 August 2024 / Revised: 18 October 2024 / Accepted: 19 October 2024 / Published: 22 October 2024

Abstract

:
Despite the efforts to examine the influence of urban forms on CO2 emissions, most studies have mainly measured urban forms from a two-dimensional perspective, with relatively little attention given to three-dimensional urban forms and their causal relationships. Utilizing the built-up area dataset from the Global Human Settlement Layer (GHSL) project and the carbon emission dataset from the China City Greenhouse Gas Working Group (CCG), we examine a causal and heterogeneous effect of three-dimensional urban forms on CO2 emissions—specifically urban height, density, and intensity—in 285 Chinese cities. The empirical results reveal a robust and positive causal effect of 3D urban forms on carbon emissions. Even when incorporating the spatial spillover effect, the positive effect of 3D urban forms remains. Moreover, GDP per capita and total population have a greater impact on urban CO2 emissions. Additionally, we find that the influence of 3D urban forms on CO2 emissions is U-shaped, with total population serving as a moderating factor in this effect. Importantly, there is significant geographic and sectoral heterogeneity in the influence of 3D urban forms on CO2 emissions. Specifically, the influence of 3D urban forms is greater in eastern cities than in non-eastern cities. Furthermore, 3D urban forms primarily influence household carbon emissions rather than industrial and transportation carbon emissions. Therefore, in response to the growing challenges of global climate change and environmental issues, urban governments should adopt various strategies to develop more rational three-dimensional urban forms to reduce CO2 emissions.

1. Introduction

Nowadays, global warming has emerged as an increasingly critical challenge to contemporary human existence [1]. Estimates suggest that global surface temperatures have risen more rapidly since 1970 than in any other 50-year period over the past 2000 years [2]. As the primary greenhouse gas resulting from human activities, carbon dioxide (CO2) leads to remarkable increases in atmospheric temperature and thus significantly contributes to global warming and climate change [3]. However, despite international efforts to curb carbon emissions through agreements like the 2015 Paris Agreement, global carbon emissions continue to rise at an alarming rate, posing profound environmental and societal threats to human beings. For example, the International Energy Agency (IEA) points out that the world’s CO2 emissions associated with energy consumption increased by 1.1% in 2023, reaching a new record high of 37.4 billion tons [4]. Simultaneously, as cities have become major centers of population and economic activity, mitigating their environmental impact and promoting sustainable cities and communities have become crucial aspects of global sustainable development. Consequently, how to reduce urban carbon emissions has attracted growing attention among scholars and policymakers.
The existing literature has demonstrated that CO2 emissions are strongly linked to economic growth [5,6], industrial structure [7,8], technological progress [9,10] and urbanization rate [11,12], amongst many other social and economic factors. However, it is difficult and even unrealistic to reduce carbon emissions solely by restricting socioeconomic development, as this would undoubtedly hamper the improvement of human well-being. Therefore, in addition to socioeconomic factors, recent studies have increasingly focused on investigating other alternative factors that could influence carbon emissions. Among these factors, urban forms have obtained increasing attention. In fact, though occupying roughly 3% of the Earth’s land, cities make up about 70% of the world’s CO2 emissions associated with energy consumption, with transport and buildings being among the largest contributors [2,13]. Moreover, it has been estimated that global urban land areas will grow by nearly two times during the 2000–2030 period [14]. Consequently, urban forms, which represent how cities are spatially and physically arranged, exert a profound effect on carbon emissions, as they influence people’s transportation behaviors and energy consumption patterns.
The influence of urban forms on CO2 emissions has been mainly explored from four aspects, these being land-use change, built environment, transportation network, as well as urban expansion pattern [15]. As for land use change, studies have shown that the urbanization process drives the transformation of agricultural land to urban construction land, which would decrease the carbon sink [16]. Furthermore, other scholars have argued that CO2 emissions could be influenced by land use structure and land management strategies, as the capacities to generate and absorb carbon dioxide may vary among different categories of land uses [17]. With regard to the built environment, indicators such as population density [18,19] and land mixing degree [20] have been commonly used in empirical studies. For instance, in a case study of more than 120 of the largest urbanized areas in the US, Lee and Lee [18] showed that population density is negatively linked to CO2 emissions from household travel. In another empirical study focusing on 268 Chinese cities, Li et al. [20] found that effect of land use mix on CO2 emissions is U-shaped, indicating that a moderate level of land use mix is conducive to carbon reductions. In terms of transportation networks, empirical studies have mainly focused on accessibility, road network density, and other indicators that might influence carbon emissions by affecting people’s travel behavior and cities’ traffic environment. For example, Wang et al. [6] showed that transportation energy consumption is negatively linked to road network density, as a higher road network density usually leads to a higher accessibility and connectivity of urban traffic, thus reducing traffic congestion. As for urban expansion patterns, urban compactness [21] and urban polycentricity [22,23] are two indicators that have been widely used in empirical studies. While scholars have generally shown that more compact urban development is linked to less carbon emissions, the influence of urban polycentricity on CO2 emissions is usually inconclusive. For instance, Sha et al. [24] showed that urban polycentricity helps improve carbon emission efficiency across 232 Chinese cities. However, Zhu et al. [25] found that the role of polycentric urban spatial structure in reducing CO2 emissions could be moderated by urban economic strength.
Despite the efforts to examine the influence of urban forms on CO2 emissions, most scholars have measured urban forms from a two-dimensional (2D) perspective, with relatively little attention being paid to three-dimensional (3D) urban forms. For example, Wang et al. [26] analyzed the effects of three two-dimensional urban form characteristics (extension, irregularity, and compactness) on CO2 emission. However, urban forms represent not only how cities are horizontally structured but also how they are vertically organized. Furthermore, urban forms measured in 2D terms are not necessarily positively correlated with those in 3D terms. For instance, a compact city in 2D terms might not be regarded as compact if measured from a 3D perspective. Taking this a step further, we can argue that the positive influence of urban compact development in reducing CO2 emissions from a 2D perspective, which has been verified in many studies [15,26], might not hold if it is measured in 3D terms. Moreover, with increasing land use efficiency and tighter land resource supply, urban forms in many cities tend to grow taller rather than expand horizontally [27], making it increasingly important to examine the influence of 3D urban forms on CO2 emissions.
Notably, some scholars have already examined how 3D urban forms are linked to CO2 emissions. At the building scale, studies have shown that the operations of buildings make up over 1/3 of global final energy-related emissions [28]. As buildings continue to grow vertically, it can be expected that carbon emissions from buildings will rise [29]. Moreover, some studies have argued that high-rise and high-density buildings may increase carbon emissions through different mechanisms, such as reducing air flow and ventilation capacity [30], causing the urban heat island effect [31], increasing the frequent use of lights and air conditioners [32], and transforming the vertical roughness of urban landscapes [33]. Additionally, the shape, typology, and orientation of buildings have been found to be closely associated with CO2 emissions [34].
At the city scale, since large-scale data on urban buildings are usually unavailable, empirical investigations of the role of 3D urban forms in reducing CO2 emissions have been quite limited. One notable study is that by Xu et al. [35], which investigated the impact of 3D urban structures on CO2 emissions across 86 Chinese cities. The empirical results show that the total building volume contributes the most to accelerated carbon emissions, followed by building height and building heat dissipation area. In addition, the results show that urban compactness measured in 3D terms might cause CO2 emissions to rise. Another notable study is that by Du et al. [36], which explored how 2D and 3D urban forms influence CO2 emissions across 2813 urban functional zones of Beijing. They found that commercial zones account for the highest carbon emissions, and factors such as building height, base area, and average building volume are all correlated with carbon emissions. Similarly, Lin et al. [37] adopted a random forest regression approach to examine the influence of 3D building structure on grid-level CO2 emissions in Shenzhen. They found that carbon emissions are closely correlated with 3D urban form factors such as building coverage ratio and floor area ratio.
Overall, existing studies have contributed to our understanding of the effect of 3D urban forms on CO2 emissions at the city scale. However, there remains much room for further investigation. First and perhaps foremost, existing studies have largely ignored the causal influence of 3D urban forms on CO2 emissions. Nonetheless, identifying this causal relationship is crucial to revealing whether 3D urban forms truly exert an impact on carbon emissions, which is important for effectively making low-carbon strategies. Second, existing studies have mainly focused on a single Chinese city [36,37] or a group of Chinese cities [35]. An empirical study focusing on all the Chinese cities would thus contribute comprehensively to the literature. Third, it remains unclear whether the effect of 3D urban forms on CO2 emissions is heterogeneous.
This paper contributes to the existing literature by conducting an empirical study of 285 Chinese cities at the prefecture and above level to investigate the causal and heterogeneous influence of 3D urban forms on CO2 emissions at the city scale. Our empirical findings show a robust, positive causal influence of 3D urban forms on CO2 emissions. This conclusion remains valid even when the spatial spillover effect is taken into account. Additionally, we provide evidence that the influence of 3D urban forms on CO2 emissions is U-shaped and that total population plays a moderating role in this relationship. Importantly, the influence of 3D urban forms on CO2 emissions exhibits geographic and sectoral heterogeneity. Specifically, the influence of 3D urban forms is greater in eastern cities than in non-eastern cities. Furthermore, 3D urban forms primarily affect household carbon emissions rather than industrial and transportation carbon emissions.
The structure of this paper is organized as follows. Section 2 describes the data and methodology used in this study. Then, Section 3 shows the regression results. Section 4 discusses the empirical results as well as policy implications. Finally, Section 5 concludes with future research suggestions.

2. Materials and Methods

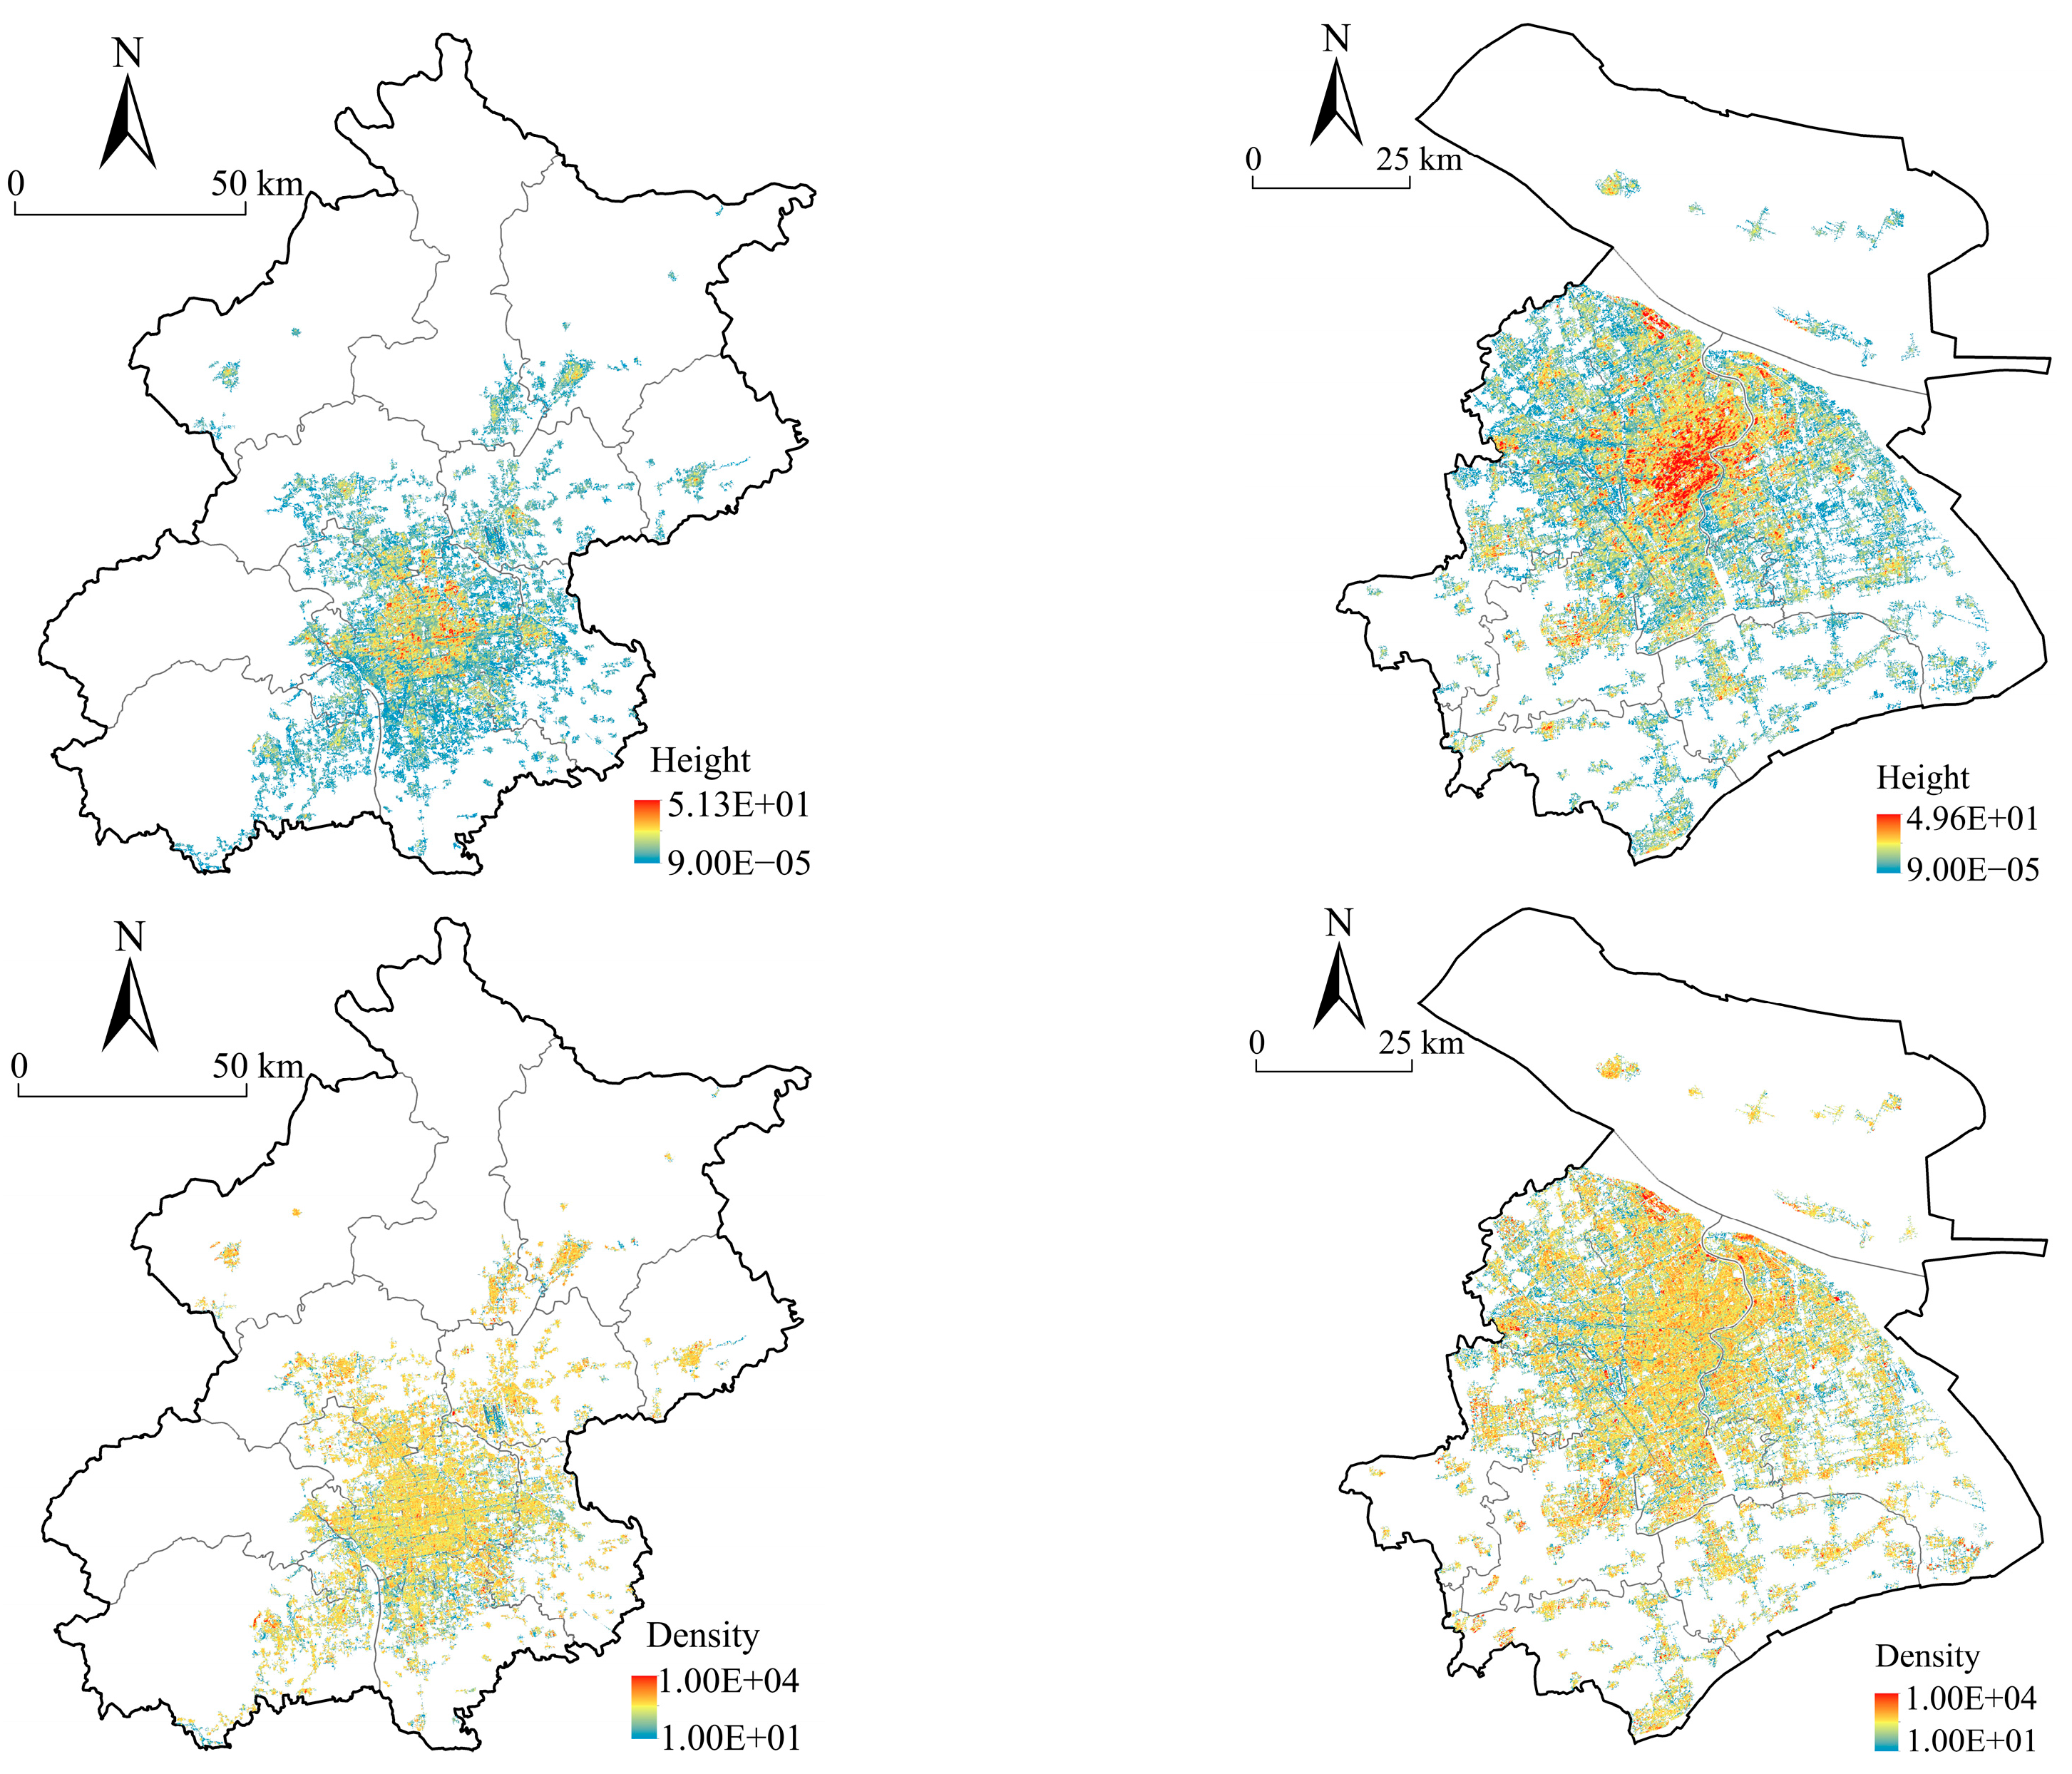
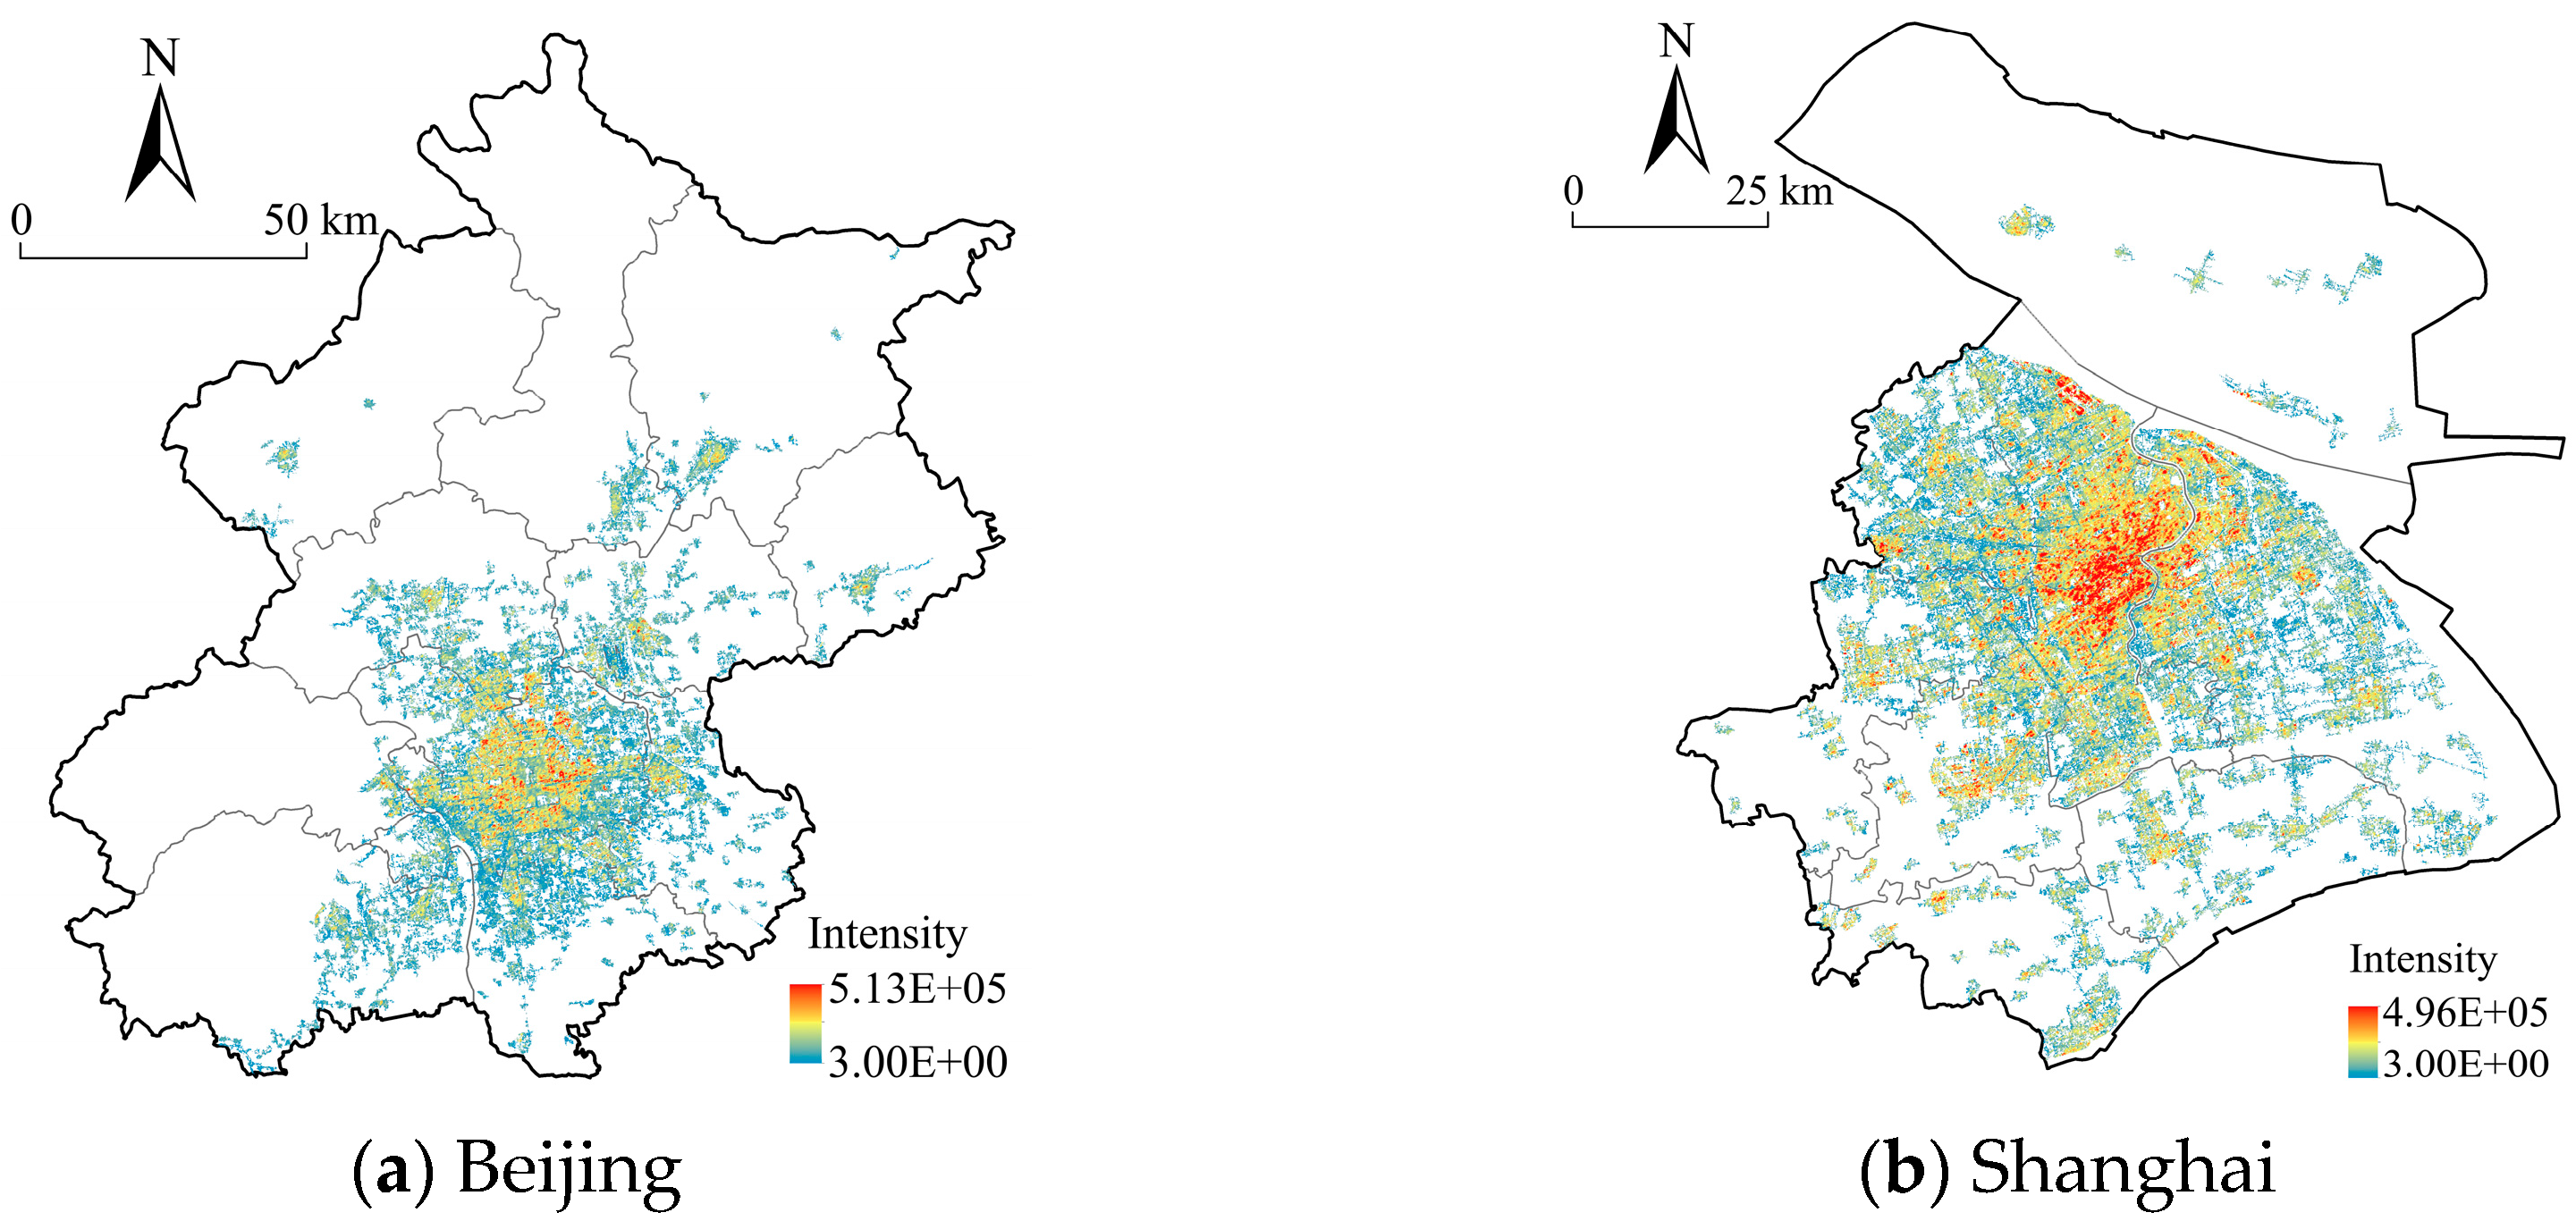
2.1. Carbon Emissions and 3D Urban Forms Dataset

This paper takes prefecture-level and above cities in China as the research objects, excluding cities with missing data from Tibet, Hainan, and Xinjiang, resulting in a total of 285 cities. Data on carbon emissions for 285 Chinese cities at the prefectural and above level in 2020 were obtained from the China City Carbon Dioxide Emissions Dataset by the China City Greenhouse Gas Working Group (CCG) (https://www.cityghg.com/, accessed on 17 March 2024), which includes 137 persons from 76 organizations [35]. Given space constraints, a detailed description of how this dataset was produced is not provided here and can be found in Cai et al. [38] and Cai et al. [39]. Overall, the data provided in this dataset consist of two components: direct CO2 emissions within the administrative boundaries of the cities, such as those from residential, industrial, commercial, and transportation related energy consumptions; and indirect CO2 emissions from electricity purchases by the cities [38]. The CCG first established the 2015 dataset of CO2 emissions for all Chinese cities and later extended it to establish a uniform carbon emissions inventory for 2005, 2010, 2015, and 2020 at the city level. Given the lack of official statistics on carbon emissions in Chinese cities, the reliability of this dataset for our analysis can be demonstrated by publications describing the datasets [38,39] and studies drawing upon the datasets [35]. The distribution of CO2 emissions for 285 Chinese cities in 2020 is shown in Figure 1.
Data on 3D urban forms for Chinese cities in 2020 were obtained from the 2023 data package released by the Global Human Settlement Layer (GHSL) project (https://human-settlement.emergency.copernicus.eu, accessed on 10 April 2024), which provides the spatial distribution of global human presence in the form of time series built-up maps, population density maps and settlement maps. For the purpose of this research, we utilized the built-up maps that include the datasets of GHS-BUILT-H (building heights), GHS-BUILT-S (built-up surfaces), and GHS-BUILT-V (built-up volume). Specifically, the GHS-BUILT-H dataset provides a spatial raster dataset with a resolution of 100 m, measured in meters, which describes the spatial distribution of building heights derived from a combination of global DEM data and satellite imagery, filtered through linear regression techniques [40]. The GHS-BUILT-S dataset provides a spatial raster dataset with resolutions of 10, 100, and 1000 m, which shows the spatial distribution of built-up surfaces, measured in square meters [41]. The GHS-BUILT-V dataset provides a spatial raster dataset with resolutions of 10, 100, and 1000 m, which demonstrates the spatial distribution of built-up volumes, measured in cubic meters [42]. Note that the GHS-BUILT-H dataset only provides building height data for 2018, while the other two datasets provide data for 2020. Since building heights should be relatively stable within two years, we believe that this inconsistency is acceptable. To ensure consistency in resolution, all the three datasets were used with a resolution of 100 m.

2.2. Measurement of 3D Urban Forms

Three proxy indicators of 3D urban forms are considered here: building height, building density, and building intensity. Specifically, for each 100 m grid cell, we derived data on building heights, built-up surfaces, and built-up volumes from the above-mentioned three datasets, respectively. Given that each grid cell is at the 100 m scale, the values of building heights, built-up surfaces, and built-up volumes can directly represent each grid’s building height (m), building density (m2), and building intensity (m3). We then calculated urban height (H), urban density (D), and urban intensity (I) at the city level. Since the grid-level spatial distributions of building heights, densities, and intensities are skewed (see Figure 2 for the distributions of the three indicators in representative cities), we use the median values of these metrics to represent the city-level building heights (m), densities (m2), and intensities (m3). Table 1 provides a descriptive statistical analysis of urban height, density and intensity.
Though it could be ideal to include the three indicators together in regression models, we found a strong correlation among them, with the KMO statistic for the three indicators being 0.711. This would cause serious multicollinearity in regression models. Therefore, we adopted a principal component analysis (PCA) approach to downscale the three indicators. Specifically, in the PCA analysis, only one principal component had an eigenvalue greater than 1 and accounts for 93.77% of the variance, yielding a comprehensive 3D urban form indicator (HDI) (Figure 3).

2.3. Model Specification

Given that the distribution of CO2 emissions for Chinese cities exhibits strong spatial correlation, we utilize the following model to regress the effect of 3D urban forms on CO2 emissions at the city scale:
C E i = α + ρ j w i j C E i + β H D I i + γ X i + ε i
where C E i denotes CO2 emissions for city i. j w i j C E i is the spatial lag term, with w i j being the spatial components of the spatial weight matrix W. Here, we use the inverse distance weight matrix to capture the spatial relationships between cities i and j. H D I i denotes the comprehensive 3D urban form indicator derived from the PCA analysis for city i, and X i is a set of control variables affecting the city-level CO2 emissions.   ρ represents the spatial autoregressive coefficient, which captures the spatial dependence of carbon emissions. β is the coefficient of the key independent variable, while γ represents the coefficients of the control variables. α denotes the constant term and ε i represents the error term.
Table 2 shows the measurement of all the variables. Except for the key independent variable, this paper includes a set of control variables that have been found to be associated with carbon emissions in existing studies. Specifically, we control for the impact of per capita GDP (PGDP) [19], population (POP) [24], population density (POPDEN) [19], industrial structure (INS) [22], economic openness (OPEN) [43], financial level (FIN) [22], government intervention (GOV) [44], and transportation infrastructure (INF) [12]. Data for these control variables were obtained from China Urban Construction Statistical Yearbook and China City Statistical Yearbook. To reduce the influence of heteroskedasticity, all control variables except for those measured in ratio forms (i.e., INS, FIN, and GOV) have been logarithmically transformed.

3. Empirical Results

3.1. The Benchmark Regression Results

Table 3 shows the benchmark regression results. Specifically, in Model 1, we examine the effects of all control variables on CO2 emissions. The empirical results show that the coefficients for PGDP, POP, POPDEN, and INS are statistically significant, while others are insignificant. Among them, the coefficients of PGDP, POP, and INS are positive and statistically significant at the 1% level, while POPDEN is negatively correlated at the 10% significance level. This indicates that the influences of per capita GDP, total population, and industrial structure on CO2 emissions are significantly positive. This empirical finding aligns with those of many existing studies [22]. Conversely, population density (POPDEN) has a weak negative correlation with carbon emissions, suggesting that carbon emissions tend to decrease as urban population density increases. Theoretically, higher urban population density could lead to increased carbon emissions due to greater concentrations of individuals and associated production and daily life activities [19]. However, higher population density can also enhance the development of public transportation, promote resource recycling, and improve energy efficiency, which may reduce CO2 emissions [18,43]. Our empirical findings here indicate that the positive impact of population density might outweigh its negative impact on CO2 emissions.
In Models 2 and 3, we further examine the effect of 3D urban forms on CO2 emissions. In Model 2, without control variables, the result reveals that the influence of HDI on CO2 emissions is positive and statistically significant. In Model 3, which includes the control variables, the positive estimated coefficient for HDI remains significant at the 10% level. These results align with the empirical findings shown in Xu et al. [35], suggesting that cities with higher building height, density, and intensity on average might lead to more carbon emissions. Furthermore, the estimated coefficients for PGDP, POP, INS, and POPDEN remain consistent with those in Model 1 with regard to their signs and significance, implying that the influence of these variables on CO2 emissions is robust.
In Model 4, the influence of the spatial lag of the dependent variable is taken into account. Obviously, the estimated coefficient of lnCE × W is positive at the 5% significance level, indicating that cities tend to produce more carbon emissions if their neighboring cities produce more carbon emissions. In line with the empirical results shown in Li et al. [20] and Zhu et al. [25], urban CO2 emissions exhibit spatial correlation, and the influence of their spatial lag is significant. Despite this spatial correlation, the coefficient for HDI remains significantly positive, further demonstrating the positive influence of 3D urban forms on CO2 emissions.
In Models 5 and 6, we added separately the squared term of HDI and the interaction term between HDI and lnPOP to examine the nonlinear and moderating effects of 3D urban forms on CO2 emissions. The result in Model 5 shows that the coefficient of HDI2 is positive and statistically significant at the 1% level, implying that the influence of 3D urban forms on carbon emissions is U-shaped. This suggests that below a certain threshold, an increase in 3D urban forms may intensify the use of land resources, protect the urban ecosystem, and improve energy use efficiency, thereby reducing energy consumption by residents and contributing to lower carbon emissions. However, when 3D urban forms exceed a certain threshold, the situation reverses. Thus, a moderate level of 3D urban forms might be conducive to reducing carbon emissions. In Model 6, the coefficient of HDI × lnPOP is positive and statistically significant at the 5% level, suggesting that total population plays a moderating role in the way that 3D urban forms affect carbon emissions. Specifically, when the total population is greater than 1.521 million (simply let −0.412 + 0.082 × lnPOP = 0), an increase in the comprehensive indicator of 3D urban forms leads to more carbon emissions. Although 3D urban forms can enhance energy use efficiency, when a city’s population size exceeds a certain threshold, the city’s socioeconomic vitality and residents’ living needs change significantly. As 3D urban forms continue to increase, the demand for resources and energy in these cities rises substantially, which would increase CO2 emissions.

3.2. The Causal Effect of 3D Urban Forms on CO2 Emissions

The influence of 3D urban forms on CO2 emissions may be subject to potential endogeneity issues, such as reverse causality and omitted variables. Specifically, higher carbon emission intensity implies weaker environmental regulations and more extensive industrial structures, which can lead to disordered development and construction in cities, thereby affecting 3D urban forms. Additionally, although this study controls for a range of variables affecting carbon emissions based on existing studies, there may still be issues related to omitted variables. Consequently, this paper uses the instrumental variable (IV) approach [45] to address the endogeneity issues and investigate whether 3D urban forms are truly a driving force for carbon emissions.
Drawing on the approach adopted in Combes et al. [46], this paper uses the sum of distances from each city to 69 modern China treaty port cities, such as Guangzhou, Xiamen, Shanghai, Fuzhou, and Ningbo, as an IV, and employs the two-stage least squares method for estimation. The rationale for using this instrumental variable is as follows. On one hand, the presence of modern China treaty port cities has been in place for a long period and is unlikely to have a direct impact on carbon emissions in 2020, which provides strong exogeneity. On the other hand, modern China treaty port cities and their neighboring cities have been strongly influenced by western social, economic, and architectural forms, leading to profound changes in their socioeconomic and urban development. This, in turn, might affect the current spatial patterns of Chinese cities through the change of urban systems in China.
Table 4 presents the IV regression results. Specifically, the first-stage regression results show that the coefficients of the IV are negative and statistically significant, indicating that cities that are closer to modern China treaty port cities tend to have higher values of the comprehensive 3D urban form indicator. This is generally in line with our theoretical expectations, as cities closer to these treaty port cities are more likely to be influenced by western social, cultural, and architectural forms, leading to changes in their traditional low-density urban forms. The Kleibergen–Paap rk LM statistic is positive at the 1% significance level, and the Kleibergen–Paap rk Wald F statistic for instrumental variables exceeds 16.38, demonstrating that the instrumental variable passes both the under-identification and weak instrument tests. The second-stage regression results show that the coefficient of urban form is still significantly positive, indicating that we can capture the causal influence of 3D urban forms on CO2 emissions while addressing the endogeneity issue. The effect estimated by the instrumental variable regression increases significantly compared to the benchmark regressions. This suggests that potential endogeneity does not change the direction of the influence of 3D urban forms on CO2 emissions, and the positive influence of 3D urban forms may be underestimated in the baseline regression models.

3.3. Heterogeneity Analysis

The IV approach is further used to examine whether the influence of 3D urban forms on CO2 emissions is heterogeneous among different cities and sectors producing carbon emissions. Specifically, Models 1–2 compare the causal influence of 3D urban forms on CO2 emissions in eastern cities with that in non-eastern cities, while Models 3–5 divide carbon emissions into those from industry, households, and transport sectors.
In Models 1 and 2 of Table 5, we observe that the HDI coefficients are positive and statistically significant. However, the HDI coefficient for eastern cities is larger than that for non-eastern cities, suggesting that the influence of 3D urban forms on CO2 emissions is greater in eastern cities than in non-eastern cities. Furthermore, PGDP, POP, and INS have significant and positive effects on CO2 emissions in non-eastern cities, but not in eastern cities. This disparity may be attributed to the substantial differences in urban expansion patterns and economic development structures between the two regions. In Model 1, the coefficient of POPDEN is negative at the 1% significance level, whereas it has a negative and statistically insignificant coefficient in Model 2. This indicates that in eastern cities, higher population density has a notable inhibiting influence on CO2 emissions, likely due to its relatively advanced level of urban development. In fact, existing studies have also found that in more urbanized areas, increased population density might drive a rapid development of public transport systems and enhance resource recycling, reducing overall CO2 emissions [18].
In Models 3–5, the influence of HDI on household CO2 emissions is positive at the 1% significance level, while its impact on industrial and transportation carbon emissions is not significant. The result suggests that the influence of 3D urban forms on CO2 emissions is primarily focused on household carbon emissions. This is because 3D urban forms indirectly reflect the number of households. Higher height, density, and intensity of cities usually indicate a larger number of urban households, leading to increased household carbon emissions. In contrast, industrial carbon emissions mainly arise from the production of goods and services, which can be affected by urban population, economic growth, and industrial structure. Similarly, carbon emissions from the transportation sector are primarily affected by urban population and economic level. Specifically, cities with larger populations and higher economic levels tend to have more rail and air travel, resulting in higher levels of transportation-related carbon emissions.

3.4. Robustness Tests

The robustness of the causal influence of 3D urban forms on CO2 emissions is tested by continuing to use the instrumental variable and excluding certain special samples. In Model 1 of Table 6, we exclude the samples of Beijing, Shanghai, Tianjin, and Chongqing, which are four centrally administered municipalities, and have larger populations and more built-up areas. Additionally, these cities are significantly more exposed to government and planning policy interventions than others. Based on Model 1, provincial capitals are further excluded in Model 2, as these cities tend to be supported by more development policies than other ordinary cities. In Model 3, we exclude megacities with an urban population exceeding 5 million. Taken together, the empirical findings of the three models show that the coefficients for HDI remain positive at the 5% significance level, suggesting that the causal influence of 3D urban forms on CO2 emissions is robust.

4. Discussion

Overall, our empirical findings demonstrate a significant, positive, and causal effect of 3D urban forms on carbon emissions, indicating that cities with higher building heights, density, and intensity contribute to greater carbon emissions. These findings generally align with those of other studies [35,37]. For instance, Xu et al. [35] showed that total building volume and average building height are positively related with CO2 emissions. Theoretically, higher urban height results in increased solar radiation absorption, leading to higher carbon emissions for ventilation and cooling purposes [30]. Additionally, greater building height necessitates increased energy consumption for facilities such as water supply and elevator operation, thereby raising carbon emissions [47]. Higher building density and intensity indicate a greater proportion of impervious surfaces in the city, which not only enhances the urban heat island effect and increases carbon emissions due to ventilation and cooling needs [30], but also compresses green spaces such as urban green areas, wetlands, and farmlands, thereby reducing the carbon sink [37,48].
This paper also demonstrates a nonlinear and spatially autocorrelated influence of 3D urban forms on CO2 emissions. In terms of the nonlinear relationship, we find that the influence of 3D urban forms on CO2 emissions is U-shaped, and total population acts as a moderating factor in the influence of 3D urban forms on CO2 emissions. This suggests that a moderate level of 3D urban forms might be conducive to reducing carbon emissions. Beyond this moderate level, the intensification of urban density and building heights may lead to the overconcentration of buildings and reduced green spaces, which can further intensify the urban heat island effect and raise energy consumption for cooling and ventilation [30]. Similarly, the influence of 3D urban forms on CO2 emissions may be stronger in cities with larger populations, as the demand for energy and resources increases significantly with population growth. With regard to the spatially autocorrelated relationship, the results show that the influence of 3D urban forms on CO2 emissions remains positive even when considering the spatial spillover effect of neighboring cities. As noted in existing studies [20,25], ignoring the spatial correlation of carbon emissions may skew the results. In our analysis, when the spatial lag term for CO2 emissions is included in the regression models, the influence of 3D urban forms on CO2 emissions is reduced.
Our empirical findings also show significant geographic and sectoral heterogeneity in the influence of 3D urban forms on CO2 emissions. According to the estimation results of sectoral heterogeneity, higher 3D urban forms significantly contribute to household carbon emissions, while the influence of 3D urban forms on industrial and transportation carbon emissions is not significant. Constrained by government urban planning, the proportion of land use for residential, industrial, and public service facilities is controlled, so 3D urban forms can indirectly reflect the number of urban households. In other words, higher 3D urban forms generally indicate more households, leading to greater energy consumption for maintaining daily urban life, which results in higher carbon emissions. Additionally, denser and taller residential buildings in a city lead to increased consumption of services and facilities, further raising the city’s CO2 emissions. Comparatively, CO2 emissions from urban industries mainly come from the production of goods and services, which are influenced by urban economic development level, population size, and industrial structure. This finding is in line with the hypothesis of Xu et al. [35] that 3D urban forms are independent of agricultural and industrial energy consumption. The urban transportation CO2 emissions primarily results from the energy consumption of cars, subways, trains, and airplanes, which also mainly depend on urban population size and economic development level. The sectoral heterogeneity in the influence of 3D urban forms on CO2 emissions helps further explain the possible reasons for the geographic heterogeneity in the influence of 3D urban forms. Specifically, since 3D urban forms mainly affect household carbon emissions in cities, residents in eastern cities, compared to those in central and western cities, have higher incomes, pursue more comfortable living conditions, and have more diversified living service facilities. This, in turn, generates more energy consumption and carbon emissions. Studies on the influence of residents’ income and energy consumption on CO2 emissions show that higher income levels of the population may lead to higher energy consumption and CO2 emissions [49].
Our empirical findings have some policy implications. Since 3D urban forms are important factors affecting carbon emissions, low-carbon city planning needs to account for 3D urban forms. Guided by the theory of agglomeration economies and the concept of compact city planning, vertical high-density cities have gradually become a key development mode for large cities worldwide. However, our empirical results show that greater height, density, and intensity of a city contribute to higher levels of carbon emissions. To achieve low-carbon development and address the climate change and environmental crises caused by excessive CO2 emissions, policymakers, scholars, planners, and urban residents should collaborate to plan and build more rational 3D urban forms. First, urban planning should include control requirements for urban neighborhood construction to manage the height, density, and intensity of different functional neighborhoods and prevent disorderly building development. Second, promoting third spaces can facilitate multifunctional urban development and enhance the city’s walkability [50], thereby reducing carbon emissions from residents’ daily commutes. Third, protecting the urban ecosystem, increasing the proportion of green open spaces, and upgrading the greening of streets and squares can alleviate the urban heat island effect and reduce energy consumption for ventilation and cooling. Fourth, through vertical greening and green roofs, we can reduce solar radiation in summer and increase energy utilization efficiency in winter, which is conducive to decreasing CO2 emissions from vertically high-density cities.

5. Conclusions

Recently, many studies have focused on the influence of urban forms on CO2 emissions. However, due to the unavailability of large-scale data on urban buildings, scholars have mainly examined the impact of 2D urban forms on CO2 emissions, while the causal and heterogeneous influences of 3D urban forms on CO2 emissions have been significantly underexplored. This paper aims to address this gap by examining the causal and heterogeneous influence of 3D urban forms on CO2 emissions. Firstly, based on the 2022 global built-up area dataset, we constructed metrics for measuring the 3D urban forms of 285 Chinese cities. Furthermore, the causal influence of 3D urban forms on CO2 emissions was validated through an econometric model and instrumental variable (IV) approach. The empirical results show that cities with greater height, density, and intensity are likely to have higher carbon emissions. Moreover, we find that the influence of 3D urban forms on CO2 emissions remains positive even when considering the spatial spillover effect of neighboring cities. The influence of 3D urban forms on CO2 emissions is U-shaped, and total population plays a moderating role in this relationship. The estimated results of instrumental variable regression further demonstrate a causal influence of 3D urban forms on CO2 emissions. Besides this, the heterogeneity analysis shows significant geographic and sectoral differences in the influence of 3D urban forms on CO2 emissions. Specifically, the influence of 3D urban forms is greater in eastern cities than in non-eastern cities. Furthermore, the influence of 3D urban forms on household carbon emissions is positive and statistically significant, while their influence on industrial and transportation carbon emissions is not significant. The empirical results remain robust even when excluding certain special samples. Overall, the empirical findings provide robust evidence that 3D urban forms exert a positive and causal influence on CO2 emissions.
Our study has limitations that provide opportunities for future research. For instance, we used only three metrics—height, density, and intensity—to synthesize 3D urban forms. Future studies can establish a more comprehensive system of indicators for measuring 3D urban forms as large-scale building data become more available. Additionally, although this paper combines existing studies to theoretically elucidate the possible pathways through which 3D urban forms affect carbon emissions, subsequent studies should empirically test these pathways through methods such as structural equation modeling. Thirdly, since our study focuses on the overall urban scale, future studies can target individual cities and draw on the methodology of related studies [51] to predict the CO2 emission pattern based on 3D urban forms. Fourthly, cities in different regions of China have varying climatic conditions, which may affect the relationship between 3D urban forms and CO2 emissions from different sectors. Further research on this hypothesis is needed.

Author Contributions

Conceptualization, Weiting Xiong and Jingang Li; methodology, Jingang Li and Weiting Xiong; software, Yedong Zhang; validation, Weiting Xiong; formal analysis, Weiting Xiong and Jingang Li; resources, Jingang Li; data curation, Jingang Li; writing—original draft preparation, Yedong Zhang and Weiting Xiong; writing—review and editing, Weiting Xiong and Yedong Zhang; visualization, Jingang Li; supervision, Weiting Xiong and Jingang Li. All authors have read and agreed to the published version of the manuscript.

Funding

This research was funded by National Natural Science Foundation of China, grant number 52208063; Natural Science Foundation of Jiangsu Province, China, grant number BK20220424; The General Project of Basic Science (Natural Science) Research in universities of Jiangsu Province (Grant No. 22KJB560025) and The General Project of Philosophy and Social Science Research in Colleges and Universities in Jiangsu Province (Grant No. 2021SJA0143).

Data Availability Statement

The data used in this study are reasonably available through the corresponding author.

Conflicts of Interest

The authors declare no conflicts of interest.

References

  1. Root, T.L.; Price, J.T.; Hall, K.R.; Schneider, S.H.; Rosenzweig, C.; Pounds, J.A. Fingerprints of Global Warming on Wild Animals and Plants. Nature 2003, 421, 57–60. [Google Scholar] [CrossRef] [PubMed]
  2. Intergovernmental Panel on Climate Change. Climate Change 2021: The Physical Science Basis. Contribution of Working Group I to the Sixth Assessment Report of the Intergovernmental Panel on Climate Change; Cambridge University Press: Cambridge, UK, 2021. [Google Scholar]
  3. Meinshausen, M.; Meinshausen, N.; Hare, W.; Raper, S.C.; Frieler, K.; Knutti, R.; Frame, D.J.; Allen, M.R. Greenhouse-Gas Emission Targets for Limiting Global Warming to 2 °C. Nature 2009, 458, 1158–1162. [Google Scholar] [CrossRef] [PubMed]
  4. International Energy Agency. CO2 Emissions in 2023; IEA: Paris, France, 2024. [Google Scholar]
  5. Soytas, U.; Sari, R. Energy Consumption, Economic Growth, and Carbon Emissions: Challenges Faced by an EU Candidate Member. Ecol. Econ. 2009, 68, 1667–1675. [Google Scholar] [CrossRef]
  6. Wang, S.; Liu, X.; Zhou, C.; Hu, J.; Ou, J. Examining the Impacts of Socioeconomic Factors, Urban Form, and Transportation Networks on CO2 Emissions in China’s Megacities. Appl. Energy 2017, 185, 189–200. [Google Scholar] [CrossRef]
  7. Dong, B.; Ma, X.; Zhang, Z.; Zhang, H.; Chen, R.; Song, Y.; Shen, M.; Xiang, R. Carbon Emissions, the Industrial Structure and Economic Growth: Evidence from Heterogeneous Industries in China. Environ. Pollut. 2020, 262, 114322. [Google Scholar] [CrossRef]
  8. Li, Y. Path-Breaking Industrial Development Reduces Carbon Emissions: Evidence from Chinese Provinces, 1999–2011. Energy Policy 2022, 167, 113046. [Google Scholar] [CrossRef]
  9. Zhang, F.; Deng, X.; Phillips, F.; Fang, C.; Wang, C. Impacts of Industrial Structure and Technical Progress on Carbon Emission Intensity: Evidence from 281 Cities in China. Technol. Forecast. Soc. Chang. 2020, 154, 119949. [Google Scholar] [CrossRef]
  10. Xie, Z.; Wu, R.; Wang, S. How Technological Progress Affects the Carbon Emission Efficiency? Evidence from National Panel Quantile Regression. J. Clean. Prod. 2021, 307, 127133. [Google Scholar] [CrossRef]
  11. Luqman, M.; Rayner, P.J.; Gurney, K.R. On the Impact of Urbanisation on CO2 Emissions. NPJ Urban Sustain. 2023, 3, 6. [Google Scholar] [CrossRef]
  12. Pu, Y.; Wang, Y.; Wang, P. Driving Effects of Urbanization on City-Level Carbon Dioxide Emissions: From Multiple Perspectives of Urbanization. Int. J. Urban Sci. 2022, 26, 108–128. [Google Scholar] [CrossRef]
  13. Seto, K.C.; Dhakal, S.; Bigio, A.; Blanco, H.; Carlo Delgado, G.; Dewar, D.; Huang, A.; Inaba, A.; Kansal, S.; Zwickel, T.; et al. Human Settlements, Infrastructure, and Spatial Planning; Cambridge University Press: Cambridge, UK, 2014. [Google Scholar]
  14. Seto, K.C.; Güneralp, B.; Hutyra, L.R. Global Forecasts of Urban Expansion to 2030 and Direct Impacts on Biodiversity and Carbon Pools. Proc. Natl. Acad. Sci. USA 2012, 109, 16083–16088. [Google Scholar] [CrossRef] [PubMed]
  15. Sun, C.; Zhang, Y.; Ma, W.; Wu, R.; Wang, S. The Impacts of Urban Form on Carbon Emissions: A Comprehensive Review. Land 2022, 11, 1430. [Google Scholar] [CrossRef]
  16. Xu, Q.; Yang, R.; Dong, Y.X.; Liu, Y.X.; Qiu, L.R. The Influence of Rapid Urbanization and Land Use Changes on Terrestrial Carbon Sources/Sinks in Guangzhou, China. Ecol. Indic. 2016, 70, 304–316. [Google Scholar] [CrossRef]
  17. Yang, B.; Chen, X.; Wang, Z.; Li, W.; Zhang, C.; Yao, X. Analyzing Land Use Structure Efficiency with Carbon Emissions: A Case Study in the Middle Reaches of the Yangtze River, China. J. Clean. Prod. 2020, 274, 123076. [Google Scholar] [CrossRef]
  18. Lee, S.; Lee, B. The Influence of Urban Form on GHG Emissions in the U.S. Household Sector. Energy Policy 2014, 68, 534–549. [Google Scholar] [CrossRef]
  19. Liu, Y.; Gao, C.; Lu, Y. The Impact of Urbanization on GHG Emissions in China: The Role of Population Density. J. Clean. Prod. 2017, 157, 299–309. [Google Scholar] [CrossRef]
  20. Li, Q.; Chen, X.; Jiao, S.; Song, W.; Zong, W.; Niu, Y. Can Mixed Land Use Reduce CO2 Emissions? A Case Study of 268 Chinese Cities. Sustainability 2022, 14, 15117. [Google Scholar] [CrossRef]
  21. Xu, C.; Haase, D.; Su, M.; Yang, Z. The Impact of Urban Compactness on Energy-Related Greenhouse Gas Emissions across EU Member States: Population Density vs. Physical Compactness. Appl. Energy 2019, 254, 113671. [Google Scholar] [CrossRef]
  22. Shi, K.; Liu, G.; Cui, Y.; Wu, Y. What Urban Spatial Structure Is More Conducive to Reducing Carbon Emissions? A Conditional Effect of Population Size. Appl. Geogr. 2023, 151, 102855. [Google Scholar] [CrossRef]
  23. Li, Y.; Liu, X. How Did Urban Polycentricity and Dispersion Affect Economic Productivity? A Case Study of 306 Chinese Cities. Landsc. Urban Plan. 2018, 173, 51–59. [Google Scholar] [CrossRef]
  24. Sha, W.; Chen, Y.; Wu, J.; Wang, Z. Will Polycentric Cities Cause More CO2 Emissions? A Case Study of 232 Chinese Cities. J. Environ. Sci. 2020, 96, 33–43. [Google Scholar] [CrossRef] [PubMed]
  25. Zhu, K.; Tu, M.; Li, Y. Did Polycentric and Compact Structure Reduce Carbon Emissions? A Spatial Panel Data Analysis of 286 Chinese Cities from 2002 to 2019. Land 2022, 11, 185. [Google Scholar] [CrossRef]
  26. Wang, S.; Wang, J.; Fang, C.; Li, S. Estimating the Impacts of Urban Form on CO2 Emission Efficiency in the Pearl River Delta, China. Cities 2019, 85, 117–129. [Google Scholar] [CrossRef]
  27. Harris, A. Vertical Urbanisms: Opening Up Geographies of the Three-Dimensional City. Prog. Hum. Geogr. 2015, 39, 601–620. [Google Scholar] [CrossRef]
  28. Zhong, X.; Hu, M.; Deetman, S.; Steubing, B.; Lin, H.X.; Hernandez, G.A.; Zhang, C.; Tukker, A.; Behrens, P. Global Greenhouse Gas Emissions from Residential and Commercial Building Materials and Mitigation Strategies to 2060. Nat. Commun. 2021, 12, 6126. [Google Scholar] [CrossRef] [PubMed]
  29. Röck, M.; Saade, M.R.M.; Balouktsi, M.; Rasmussen, F.N.; Birgisdottir, H.; Frischknecht, R.; Habert, G.; Lützkendorf, T.; Passer, A. Embodied GHG Emissions of Buildings-The Hidden Challenge for Effective Climate Change Mitigation. Appl. Energy 2020, 258, 114107. [Google Scholar] [CrossRef]
  30. Perini, K.; Magliocco, A. Effects of Vegetation, Urban Density, Building Height, and Atmospheric Conditions on Local Temperatures and Thermal Comfort. Urban For. Urban Green. 2014, 13, 495–506. [Google Scholar] [CrossRef]
  31. Coseo, P.; Larsen, L. How Factors of Land Use/Land Cover, Building Configuration, and Adjacent Heat Sources and Sinks Explain Urban Heat Islands in Chicago. Landsc. Urban Plan. 2014, 125, 117–129. [Google Scholar] [CrossRef]
  32. Yu, C.; Pan, W. Inter-Building Effect on Building Energy Consumption in High-Density City Contexts. Energy Build. 2023, 278, 112632. [Google Scholar] [CrossRef]
  33. Cao, Q.; Luan, Q.; Liu, Y.; Wang, R. The Effects of 2D and 3D Building Morphology on Urban Environments: A Multi-Scale Analysis in the Beijing Metropolitan Region. Build. Environ. 2021, 192, 107635. [Google Scholar] [CrossRef]
  34. Camporeale, P.E.; Mercader-Moyano, P. Towards Nearly Zero Energy Buildings: Shape Optimization of Typical Housing Typologies in Ibero-American Temperate Climate Cities from a Holistic Perspective. Sol. Energy 2019, 193, 738–765. [Google Scholar] [CrossRef]
  35. Xu, X.; Ou, J.; Liu, P.; Liu, X.; Zhang, H. Investigating the Impacts of Three-Dimensional Spatial Structures on CO2 Emissions at the Urban Scale. Sci. Total Environ. 2021, 762, 143096. [Google Scholar] [CrossRef] [PubMed]
  36. Du, S.; Zhang, Y.; Sun, W.; Liu, B. Quantifying Heterogeneous Impacts of 2D/3D Built Environment on Carbon Emissions across Urban Functional Zones: A Case Study in Beijing, China. Energy Build. 2024, 319, 114513. [Google Scholar] [CrossRef]
  37. Lin, J.; Lu, S.; He, X.; Wang, F. Analyzing the Impact of Three-Dimensional Building Structure on CO2 Emissions Based on Random Forest Regression. Energy 2021, 236, 121502. [Google Scholar] [CrossRef]
  38. Cai, B.; Cui, C.; Zhang, D.; Cao, L.; Wu, P.; Pang, L.; Zhang, J.; Dai, C. China City-Level Greenhouse Gas Emissions Inventory in 2015 and Uncertainty Analysis. Appl. Energy 2019, 253, 113579. [Google Scholar] [CrossRef]
  39. Cai, B.; Liu, H.; Zhang, X.; Pan, H.; Zhao, M.; Zheng, T.; Nie, J.; Du, M.; Dhakal, S. High-Resolution Accounting of Urban Emissions in China. Appl. Energy 2022, 325, 119896. [Google Scholar] [CrossRef]
  40. Pesaresi, M.; Politis, P. GHS-BUILT-H R2023A—GHS Building Height, Derived from AW3D30, SRTM30, and Sentinel2 Composite (2018); European Commission, Joint Research Centre (JRC): Brussels, Belgium, 2023. [Google Scholar]
  41. Pesaresi, M.; Politis, P. GHS-BUILT-S R2023A—GHS Built-Up Surface Grid, Derived from Sentinel2 Composite and Landsat, Multitemporal (1975–2030); European Commission, Joint Research Centre (JRC): Brussels, Belgium, 2023. [Google Scholar]
  42. Pesaresi, M.; Politis, P. GHS-BUILT-V R2023A—GHS Built-Up Volume Grids Derived from Joint Assessment of Sentinel2, Landsat, and Global DEM Data, Multitemporal (1975–2030); European Commission, Joint Research Centre (JRC): Brussels, Belgium, 2023. [Google Scholar]
  43. Yi, Y.; Wang, Y.; Li, Y.; Qi, J. Impact of Urban Density on Carbon Emissions in China. Appl. Econ. 2021, 53, 6153–6165. [Google Scholar] [CrossRef]
  44. López, R.; Palacios, A. Why Has Europe Become Environmentally Cleaner? Decomposing the Roles of Fiscal, Trade and Environmental Policies. Environ. Resour. Econ. 2014, 58, 91–108. [Google Scholar] [CrossRef]
  45. Li, Y.; Du, R. Polycentric Urban Structure and Innovation: Evidence from a Panel of Chinese Cities. Reg. Stud. 2022, 56, 113–127. [Google Scholar] [CrossRef]
  46. Combes, P.P.; Démurger, S.; Li, S. Migration Externalities in Chinese Cities. Eur. Econ. Rev. 2015, 76, 152–167. [Google Scholar] [CrossRef]
  47. Borck, R. Will Skyscrapers Save the Planet? Building Height Limits and Urban Greenhouse Gas Emissions. Reg. Sci. Urban Econ. 2016, 58, 13–25. [Google Scholar] [CrossRef]
  48. Yu, S.; Hu, S.; Ren, Y.; Xu, H.; Song, W. Leverage Effect of New-Built Green Spaces on Housing Prices in a Rapidly Urbanizing Chinese City: Regional Disparities, Impact Periodicity, and Park Size. Land 2024, 13, 1663. [Google Scholar] [CrossRef]
  49. Miao, L. Examining the Impact Factors of Urban Residential Energy Consumption and CO2 Emissions in China-Evidence from City-Level Data. Ecol. Indic. 2017, 73, 29–37. [Google Scholar] [CrossRef]
  50. Li, J.; Li, Y.; Tu, M.; Liu, X. Third Places as Catalysts for Technological Innovation? Evidence from a Grid Cell Level Analysis of Nanjing, China. Int. J. Urban Sci. 2024, 28, 105–123. [Google Scholar] [CrossRef]
  51. Hu, X.; Zhu, W.; Shen, X.; Bai, R.; Shi, Y.; Li, C.; Zhao, L. Exploring the Predictive Ability of the CA–Markov Model for Urban Functional Area in Nanjing Old City. Sci. Rep. 2024, 14, 18453. [Google Scholar] [CrossRef]
Figure 1. The distribution of CO2 emissions for 285 Chinese cities.
Ijgi 13 00372 g001
Figure 2. The distributions of the three indicators for representative cities.
Ijgi 13 00372 g002aIjgi 13 00372 g002b
Figure 3. The distribution of HDI for 285 Chinese cities.
Ijgi 13 00372 g003
Table 1. Description of urban height, density, and intensity.
3D Urban FormsMeanS.D.MaxMin
Urban height2.4340.8545.1380.166
Urban density2908.456551.3604276612
Urban intensity25,003.3208512.94451,5611885
Table 2. Description of the variables.
VariablesDescription
Carbon emissions (CE)Total CO2 emissions
3D urban forms (HDI)The principal component of city-level height, density, and intensity
Economic level (PGDP)Per capita GDP
Population (POP)Total population
Population density (POPDEN)Permanent resident population per km2
Industrial structure (INS)Ratio of value added of the secondary sector to total GDP
Economic openness (OPEN)Volume of export trade
Financial level (FIN)Ratio of deposit and loan balances of financial institutions to total GDP
Government intervention (GOV)Ratio of fiscal expenditure to total GDP
Transportation infrastructure (INF)Per capita road areas
Table 3. Results of benchmark regressions.
VariableModel 1Model 2Model 3Model 4Model 5Model 6
HDI 0.097 ***0.047 *0.043 *0.056 **−0.412 **
(0.028)(0.027)(0.024)(0.026)(0.206)
HDI2 0.027 ***
(0.010)
HDI × lnPOP 0.082 **
(0.036)
lnPGDP0.536 *** 0.574 ***0.636 ***0.544 ***0.485 ***
(0.148) (0.150)(0.146)(0.148)(0.152)
lnPOP0.631 *** 0.619 ***0.533 ***0.626 ***0.614 ***
(0.084) (0.084)(0.093)(0.083)(0.086)
lnPOPDEN−0.104 * −0.113 *−0.091−0.112 *−0.138 **
(0.063) (0.063)(0.057)(0.063)(0.065)
INS0.018 *** 0.018 ***0.015 ***0.018 ***0.018 ***
(0.006) (0.006)(0.006)(0.005)(0.006)
lnOPEN0.012 0.0060.0070.0200.015
(0.035) (0.034)(0.033)(0.034)(0.034)
FIN0.000 0.000−0.0000.0000.000
(0.000) (0.000)(0.000)(0.000)(0.000)
GOV0.666 0.7590.7090.7430.414
(0.744) (0.762)(0.627)(0.731)(0.742)
lnINF0.038 0.0690.0380.1010.058
(0.123) (0.125)(0.116)(0.123)(0.122)
lnCE × W 0.036 **
(0.018)
Constant−3.0727.982 ***−3.492 *−3.632 **−3.555 *0.485 ***
(1.879)(0.049)(1.915)(1.689)(1.860)(0.152)
Observations285285285285285285
R2/Pseudo R20.4100.0380.4180.4140.4340.432
Note: (1) *** p < 0.01, ** p < 0.05, * p < 0.1; (2) robust standard errors are in parentheses.
Table 4. Results of the two-stage least squares estimation using IV.
VariableFirst Stage: HDISecond Stage: lnCE
DIS−0.022 ***
(0.005)
HDI 0.253 **
(0.122)
lnPGDP−0.634 **0.740 ***
(0.299)(0.165)
lnPOP0.0710.570 ***
(0.202)(0.099)
lnPOPDEN0.020−0.149 **
(0.151)(0.074)
INS−0.0150.019 ***
(0.014)(0.007)
lnOPEN0.109−0.018
(0.094)(0.038)
FIN−0.0000.000
(0.000)(0.000)
GOV−2.2871.165
(1.667)(0.855)
lnINF−0.828 ***0.203
(0.301)(0.165)
Constant10.756 ***−5.332 **
(3.797)(2.114)
Kleibergen–Paap rk LM statistic19.478 ***
Kleibergen–Paap rk Wald F statistic20.267
Stock–Yogo critical value (10% maximal IV)16.38
Observations285285
R20.1920.270
Note: (1) *** p < 0.01, ** p < 0.05; (2) robust standard errors are in parentheses.
Table 5. Heterogeneity analysis estimates.
VariableBy GeographyBy Sector
Model 1: EasternModel 2: Non-EasternModel 3: IndustryModel 4: HouseholdModel 5: Transportation
HDI0.696 ***0.212 *0.2700.435 ***0.031
(0.269)(0.124)(0.166)(0.166)(0.052)
lnPGDP0.3670.707 **0.583 ***0.477 **0.590 ***
(0.281)(0.279)(0.217)(0.201)(0.082)
lnPOP0.4220.490 ***0.595 ***1.045 ***0.844 ***
(0.350)(0.115)(0.136)(0.115)(0.055)
lnPOPDEN−0.644 ***−0.140−0.282 **−0.1250.121 ***
(0.249)(0.088)(0.111)(0.089)(0.045)
INS−0.0010.023 ***0.033 ***0.008−0.007 *
(0.013)(0.009)(0.011)(0.008)(0.003)
lnOPEN−0.010−0.031−0.001−0.161 ***0.013
(0.097)(0.049)(0.051)(0.050)(0.019)
FIN0.0000.0000.0000.000 **−0.000 **
(0.000)(0.000)(0.000)(0.000)(0.000)
GOV−4.0860.9341.1110.4711.499 ***
(2.972)(1.068)(1.017)(1.162)(0.318)
lnINF−0.2750.1970.1890.168−0.123 *
(0.311)(0.216)(0.204)(0.197)(0.069)
Constant1.421−4.797−5.260 **−6.449 **−5.540 ***
(4.301)(3.472)(2.523)(2.648)(0.874)
Kleibergen–Paap rk LM statistic8.930 ***16.481 ***19.478 ***19.478 ***19.478 ***
Kleibergen–Paap rk Wald F statistic10.07519.27220.26720.26720.267
Stock–Yogo critical value (10% maximal IV)16.3816.3816.3816.3816.38
Observations86199285285285
R20.0120.1820.1740.1960.775
Note: (1) *** p < 0.01, ** p < 0.05, * p < 0.1; (2) robust standard errors are in parentheses.
Table 6. Robustness tests.
VariableModel 1Model 2Model 3
HDI0.257 **0.221 **0.242 **
(0.125)(0.111)(0.105)
lnPGDP0.632 ***0.628 ***0.522 ***
(0.171)(0.189)(0.194)
lnPOP0.513 ***0.609 ***0.536 ***
(0.104)(0.102)(0.108)
lnPOPDEN−0.152 **−0.195 ***−0.160 **
(0.073)(0.073)(0.073)
INS0.019 ***0.027 ***0.023 ***
(0.007)(0.007)(0.008)
lnOPEN−0.018−0.025−0.022
(0.039)(0.037)(0.038)
FIN0.000 *0.000 **0.000
(0.000)(0.000)(0.000)
GOV0.7600.8710.342
(0.863)(0.981)(0.864)
lnINF0.2660.273 *0.286 *
(0.173)(0.156)(0.162)
Constant−3.943 *−5.368 **−3.293
(2.169)(2.250)(2.368)
Kleibergen–Paap rk LM statistic18.722 ***16.319 ***23.685 ***
Kleibergen–Paap rk Wald F statistic19.52417.88329.894
Stock–Yogo critical value (10% maximal IV)16.3816.3816.38
Observations281258264
R20.2300.3230.231
Note: (1) *** p < 0.01, ** p < 0.05, * p < 0.1; (2) robust standard errors are in parentheses.
Disclaimer/Publisher’s Note: The statements, opinions and data contained in all publications are solely those of the individual author(s) and contributor(s) and not of MDPI and/or the editor(s). MDPI and/or the editor(s) disclaim responsibility for any injury to people or property resulting from any ideas, methods, instructions or products referred to in the content.

