Article

A New Urban Built-Up Index and Its Application in National Central Cities of China

1
College of Geo-Exploration Science and Technology, Jilin University, Changchun 130026, China
2
School of Geographic and Environmental Sciences, Tianjin Normal University, Tianjin 300387, China
*
Author to whom correspondence should be addressed.
ISPRS Int. J. Geo-Inf. 2024, 13(1), 21; https://doi.org/10.3390/ijgi13010021
Submission received: 24 October 2023 / Revised: 26 December 2023 / Accepted: 5 January 2024 / Published: 7 January 2024
(This article belongs to the Topic Urban Sensing Technologies)

Abstract

:
Accurately mapping urban built-up areas is critical for monitoring urbanization and development. Previous studies have shown that Night light (NTL) data is effective in characterizing the extent of human activity. But its inherently low spatial resolution and saturation effect limit its application in the construction of urban built-up extraction. In this study, we developed a new index called VNRT (Vegetation, Nighttime Light, Road, and Temperature) to address these challenges and improve the accuracy of built-up area extraction. The VNRT index is the first to fuse the Normalized Difference Vegetation Index (NDVI), NPP-VIIRS Nighttime NTL data, road density data, and land surface temperature (LST) through factor multiplication. To verify the good performance of VNRT in extracting built-up areas, the built-up area ranges of four national central cities in China (Chengdu, Wuhan, Xi’an, and Zhengzhou) in 2019 are extracted by the local optimum thresholding method and compared with the actual validation points. The results show that the spatial distribution of VNRT is highly consistent with the actual built-up area. THE VNRT increases the variability between urban built-up areas and non-built-up areas, and can effectively distinguish some types of land cover that are easily ignored in previous urban indices, such as urban parks and water bodies. The VNRT index had the highest Accuracy (0.97), F1-score (0.94), Kappa coefficient (0.80), and overall accuracy (92%) compared to the two proposed urban indices. Therefore, the VNRT index could improve the identification of urban built-up areas and be an effective tool for long-term monitoring of regional-scale urbanization.

1. Introduction

Cities represent an inevitable consequence of human social development and serve as important indicators of human civilization’s progress [1]. Although urban areas only comprise a small fraction of the Earth’s surface, they have a substantial impact on climate, biogeochemical cycles, ecosystems, air quality, and other regional or global factors [2,3,4,5]. Urban built-up areas, as defined by areas with essential municipal and public facilities within urban administrative boundaries [6], are the most densely populated and concentrated regions within a city. They reflect a city’s form and structure, delineating the distribution of urban functions, and are thus vital indicators for monitoring the urbanization process [7]. As urbanization continues to progress, the exploration of methods capable of rapidly and accurately acquiring spatial distribution information of urban built-up areas at both regional and global scales holds significant importance for future urban dynamic development management, planning, and land resource utilization [8,9].
A more efficient method for mapping urban built-up areas, compared to census data, is provided by remote sensing data [10]. Initially, the extraction of urban built-up areas heavily relied on traditional visible light remote sensing imagery as the primary data source. This involved employing supervised classification or index construction methods. The combination of an index with the threshold method is widely used for extracting built-up areas [11]. This approach utilizes statistical data and indices to establish thresholds and accurately define the spatial extent of urban built-up areas. The introduction of the Normalized Difference Built-up Index (NDBI) [12,13] has facilitated the development of various indices for extracting impervious surfaces. These indices enable the gathering of built-up area data for specific locations [14,15]. It is important to consider that not all impervious surfaces qualify as urban built-up areas in practical scenarios, as they may include features such as vacant construction land or residential buildings in small towns. This consideration is crucial to avoid misclassifications when categorically identifying them as urban built-up areas [16]. The emergence of NTL data has opened up a novel technological avenue for obtaining spatial distribution information in urban areas. While NTL data does not directly measure land use, it is commonly utilized as an indicator for urban built-up area extraction due to its strong correlations with economic and population density [17,18]. Numerous studies have demonstrated that NTL data is suitable for large-scale urban extent extraction and dynamic monitoring of urbanization processes, as the NTL information emitted by urban areas can be distinctly different from non-urban regions [19,20].
Currently, the most widely used datasets for studying urban expansion are the Defense Meteorological Satellite Program Operational Linescan System (DMSP-OLS) and the Suomi National Polar-orbiting Partnership Visible Infrared Imaging Radiometer Suite (NPP-VIIRS) data. While DMSP-OLS data has inherent limitations such as low spatial resolution and saturation effects [21]. It only provides a continuous time series from 1992 to 2013, and its limited spatial and temporal resolution restricts its applicability in urban development studies. NPP-VIIRS data, with a spatial resolution of approximately 500 m, has been continuously updated since 2012 [22]. NPP-VIIRS data offers higher suitability for spatial and temporal analyses of urban built-up areas and land use compared to DMSP-OLS data. Its regularly updated long-term time series data hold significant practical value in studying urban development and transformation. Although NPP-VIIRS data mitigate saturation effects compared to DMSP-OLS data, they do not entirely solve the problem and still contains background noise, such as fire gas flares, that can affect the extraction of built-up areas [23]. Therefore, relying solely on NTL data for extracting built-up areas has limitations. To address these issues, many scholars have employed various remote sensing data sources in combination with NTL data.
The most commonly used approach involves leveraging the negative correlation between urban built-up areas and vegetation abundance and incorporating vegetation information to correct NTL data overflow. The Human Settlements Index (HSI) was developed based on this concept. It achieves built-up area extraction by combining DMSP-OLS data and MODIS NDVI data in regional and global settlement mapping [24]. The relationship between HSI and NDVI can lead to erroneous estimations of built-up area extents in regions with less vegetation. Building upon this, the Vegetation Adjusted NTL Urban Index (VANUI) is proposed as a means to simplify the complex algorithm of HSI and effectively alleviate the spillover effect of NTL data [25]. Although HSI and VANUI are commonly used among numerous urban indices, they possess inherent limitations. Integrating a single NDVI factor into both HSI and VANUI results in increased variability among land cover types within a certain range. For example, non-vegetated land cover types like bare soil and urban built-up areas can exhibit similar NDVI values, challenging the distinction of built-up areas from other land cover types. Furthermore, in cities where urban expansion is approaching saturation, vegetation coverage often remains relatively stable, and the expansion of built-up areas involves the extension of suburbs and urban villages into existing built-up areas. In such cases, urban built-up area information may not be effectively represented by a single NDVI datum. Therefore, the inclusion of datasets that have been verified to provide valuable built-up area information is being considered in urban built-up area extraction studies.
Previous research has indicated that urban regions generally exhibit higher land surface temperatures compared to non-urban areas, and land surface temperature (LST) demonstrates a close correlation with different land cover types [26,27]. The expansion of urban built-up areas leads to an increase in sensible heat flux and a decrease in latent heat flux, resulting in higher surface and air temperatures when built-up areas replace undeveloped surfaces [28,29,30]. Several models, such as the Point of Interest (POI) and LST-adjusted NTL Urban Index (PLANUI) [31], the Vegetation Temperature Light Index (VTLI) [32], and the Vegetation, Building, and LST-Adjusted NTL Urban Index (VBTANUI) [33], have shown promising results in validation. These models assume a direct relationship between temperature and urban built-up areas to characterize them. Although incorporating LST data can provide additional information about urban areas, its coarse spatial resolution may still result in the blooming effect of nighttime lights data, making it lower extraction accuracy in small areas. Furthermore, LST data is influenced by a range of complex factors, including building shapes, materials, and underlying surface properties. Even with the inclusion of LST, these built-up area indices fail to capture certain socioeconomic and geographical information inherent to urban built-up areas [32]. Therefore, including LST data as a valuable segment in the calculation of the index necessitates incorporating additional information containing socio-economic factors, for instance, data on road network density. The increasing availability of road data from authoritative mapping organizations has led to a growing interest in utilizing road network data for delineating built-up areas [34,35,36]. Given the influence of road networks on human activities and their reflection of urban expansion trends, integrating this data holds significant potential for accurately depicting urban built-up areas. Previous studies have successfully demonstrated the feasibility of extracting urban built-up areas through road density computation, further emphasizing the utility of road network data in delineating built-up areas [34,37]. Relatively limited research has been conducted on the use of road network data as Geographic Information System (GIS) data for extracting urban built-up areas [38]. This study aims to address this gap by considering road density data as a crucial factor to be incorporated into the model alongside remote sensing data for accurate built-up area extraction.
The main objective of this study was to introduce a novel urban index named the Vegetation, Road Network, and Temperature Common Adjusted Nighttime Light Urban Index (VNRT). This index was developed by integrating NTL, NDVI, LST, and Road Density data, with the aim of enhancing the accuracy of identifying urban built-up areas. The proposed index is then applied in four central cities in China including Chengdu, Wuhan, Xian, and Zhengzhou, respectively. Our method proves to be a more favorable tool for the extraction of urban built-up areas.

2. Materials and Methods
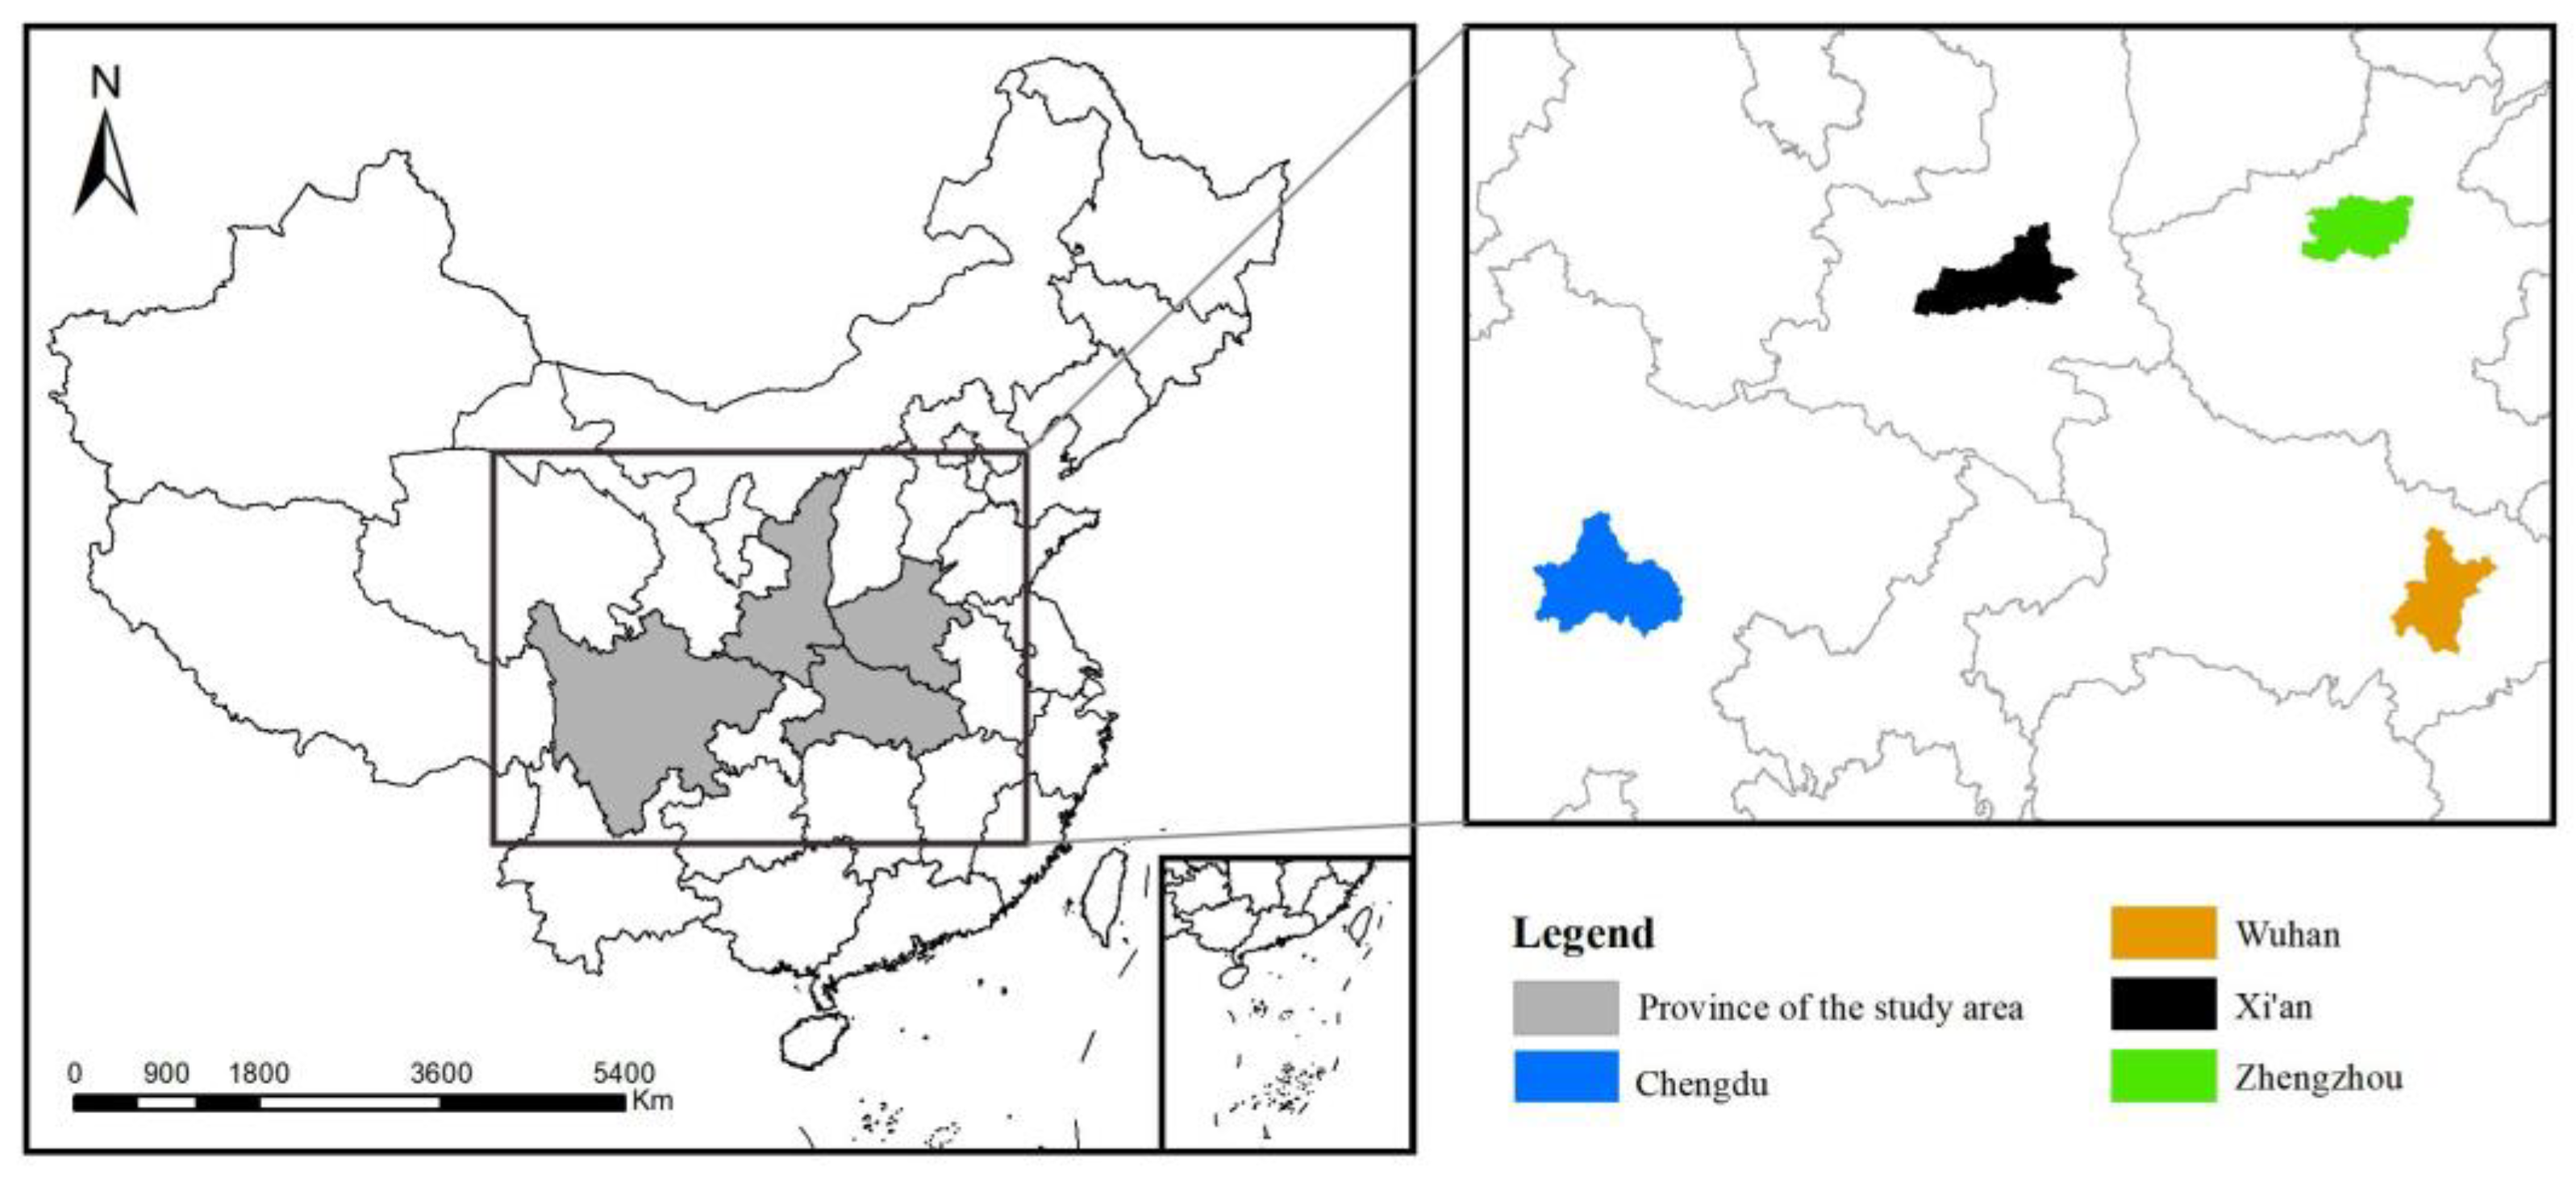
2.1. Study Areas

National central cities represent the highest level of development within a country and serve as hubs with aggregating, radiating, and driving functions [39]. This designation originated from the “National Urban System Planning (2010–2020)” issued by the Ministry of Housing and Urban-Rural Development in 2010, which initially identified five national central cities (Beijing, Tianjin, Shanghai, Guangzhou, and Chongqing). Subsequently, from 2016 to 2018, the National Development and Reform Commission and the Ministry of Housing and Urban-Rural Development successively issued support letters to Chengdu, Wuhan, Zhengzhou, and Xi’an, recognizing their rapid development and great potential as national central cities. These four cities are located in different regions in the central part of China (Figure 1) and serve as significant representatives of the urbanization process during a certain period. Taking these four national central cities as examples, studying the extraction of their internal built-up areas holds important value for evaluating the speed and rationality of land use in the urban development process.

2.2. Data and Preprocessing

2.2.1. Nighttime Light Data

The NPP-VIIRS data, provided by the National Oceanic and Atmospheric Administration (NOAA) of the United States, are primarily used for environmental monitoring. Within this dataset, the Visible Infrared Imaging Radiometer’s Day-Night Band (DNB) is utilized to monitor global nighttime light brightness. The NPP-VIIRS NTL data, initially released in April 2012, are available in yearly, monthly, and daily formats. In this study, we selected the monthly data from the cloud-free version of the VIIRS Corrected Monthly Composites (VCM) in 2019. This version effectively eliminates stray light interference, lightning, moonlight, and cloud cover, while preserving transient light sources like atmospheric flares, auroras, oil and gas flares, fires, and other background noise [40,41]. To further eliminate these irrelevant noises and ensure the data quality, we applied an outlier detection method based on spatial relationships and radiance attributes, using a sliding window of 3*3 size for spatial outlier detection and removal. By integrating the outlier identification and removal methods, we finally generated the 2019 annual night light dataset with a spatial resolution of 500 m, which significantly improved the reliability of the NTL data. By using the NPP-VIIRS data with outliers removed, the calculation of the VNRT index can effectively mitigate the interference caused by high DN values of pixels far from urban areas [42].

2.2.2. Normalized Difference Vegetation Index

The Terra MODIS NDVI data used in this study were the MOD13A2 products, which are provided every 16 days. This product has been continually updated since February 2000, with a spatial resolution of 1 km. It provides normalized vegetation index values after atmospheric correction [43]. Leveraging this dataset, we used the Google Earth Engine (GEE) platform to compute and generate annual maximum NDVI dataset for each city. The use of annual maximum NDVI data helps reduce interference from vegetation information when extracting urban built-up areas. This method ensures that vegetation’s impact is minimized during the extraction process.

2.2.3. Land Surface Temperature Data

In this study, the land surface temperature data required to calculate the VNRT index were obtained from the MODIS LST product with a spatial resolution of 1000 m. The MOD11A2 product was derived from Terra MODIS imagery acquired at either 10:30 (daytime) or 22:30 (nighttime) local time and was based on an 8-day mean LST generated by a radiation correction, cloud removal, atmospheric water vapor, and temperature-corrected split-window algorithm to produce daily LSTs that provide 8-day mean LST [44]. By using the GEE platform, we calculated and generated 2019 mean LST datasets with a spatial resolution of 1000 m within each study area.

2.2.4. Road Network Density Data

Open Street Map (OSM) is a widely adopted platform that provides users with freely accessible digital map resources, making it one of the most popular forms of Volunteered Geographic Information (VGI) [45]. OSM offers accurate positioning and topological relationships for its road network, including vital spatial details like latitude and longitude, as well as attributes such as road names, types, maximum speeds, and one-way designations. The official Open Street Map website allows users to download this data [45]. The study utilized road data from the 2019 OSM dataset to perform a kernel density estimation using the default search radius algorithm in ArcGIS. It shows the density of the road network in 2019 with a spatial resolution of 1 km.
Given the intricate artificial impacts of the COVID-19 pandemic on the pace and characteristics of urban expansion, as well as the influence of diverse policy factors on nighttime light brightness during the pandemic, this study aims to emphasize the correlation between built-up areas and nighttime light brightness under natural conditions. Consequently, all calculations and validations conducted in this study are based on data from the year 2019, prior to the outbreak of the pandemic. To ensure that data format discrepancies do not affect subsequent analyses, we performed preprocessing on all data sources. This included projecting all datasets to the same coordinate system, resampling to a consistent resolution using nearest-neighbor resampling, and clipping to the same vector extent.

2.3. The VNRT

NPP-VIIRS data serves as a valuable resource for extracting built-up areas as it objectively reflects the characteristics of human activities and societal expansion within a region [23]. Its continuously updated long-term time series adds to its significance. Challenges arise from the inherent overflow effects and resolution issues in the NTL data, making it difficult to solely rely on this data for extracting built-up areas [39]. To address this limitation, we consider the integration of additional data sources. The NDVI and LST are two important land cover variables [27]. NDVI exhibit a strong negative correlation between vegetation abundance and built-up areas, making them commonly used factors in index construction. Furthermore, LST data is gradually being employed to assist in mapping the distribution of impervious surfaces due to the urban heat island effect, which leads to increased surface temperatures in urban areas [46]. For more accurate extraction of city parks or built-up areas with weak street lighting, We consider road network density data that has been shown to be closely related to urban development but is rarely used to extract built-up areas. Unlike the previous two types of remote sensing data, which possess natural attributes, road network data represents GIS data with socio-economic attributes. In recent years, acquiring road network data has become increasingly convenient, offering high accuracy and flexibility [34].
Based on this, we can infer that urban built-up areas may exhibit distinct characteristics compared to other land cover types in the spatial distribution of NTL-NDVI-LST-ROAD. For instance, urban built-up areas typically display high NTL values, low NDVI values, high road network density values, and high LST values. Conversely, non-built-up areas such as forests and agricultural land demonstrate contrasting trends. In the case of atypical built-up areas, such as well developed municipal parks within cities, which are classified as built-up areas by definition, they are often categorized as non-built-up areas in traditional urban indices due to their high NDVI values. In VNRT, they can be more appropriately classified as urban built-up areas based on their higher road network density values and surface temperature values, which are characteristic of urban centers. Another significant land cover type in urban delineation is water bodies. In HSI and VANUI, the reflectance of water bodies is amplified, sometimes exceeding that of built-up areas, which affects water body extraction, especially at the boundaries of built-up areas [31,47,48]. Based on the structure of VANUI, we utilize the same factor multiplication approach to create a modified urban index, VNRT, by incorporating multi-angle urban information. The objective is to enhance consistency among factors while preserving their differences, with the ultimate goal of improving the precision of built-up area extraction (Equation (1)).
V N R T = N T L ( 1 N D V I ) L S T R O A D
where NTL is annual nighttime light data from NPP-VIIRS, NDVI is the annual maximum NDVI value from MODIS. LST stands for annual average LST value from MODIS, and ROAD represents the road network density value calculated after kernel density estimation. To ensure a more even distribution of results, the four variables are normalized to a range of 0 to 1.0 in the VNRT calculations and then multiplied together.

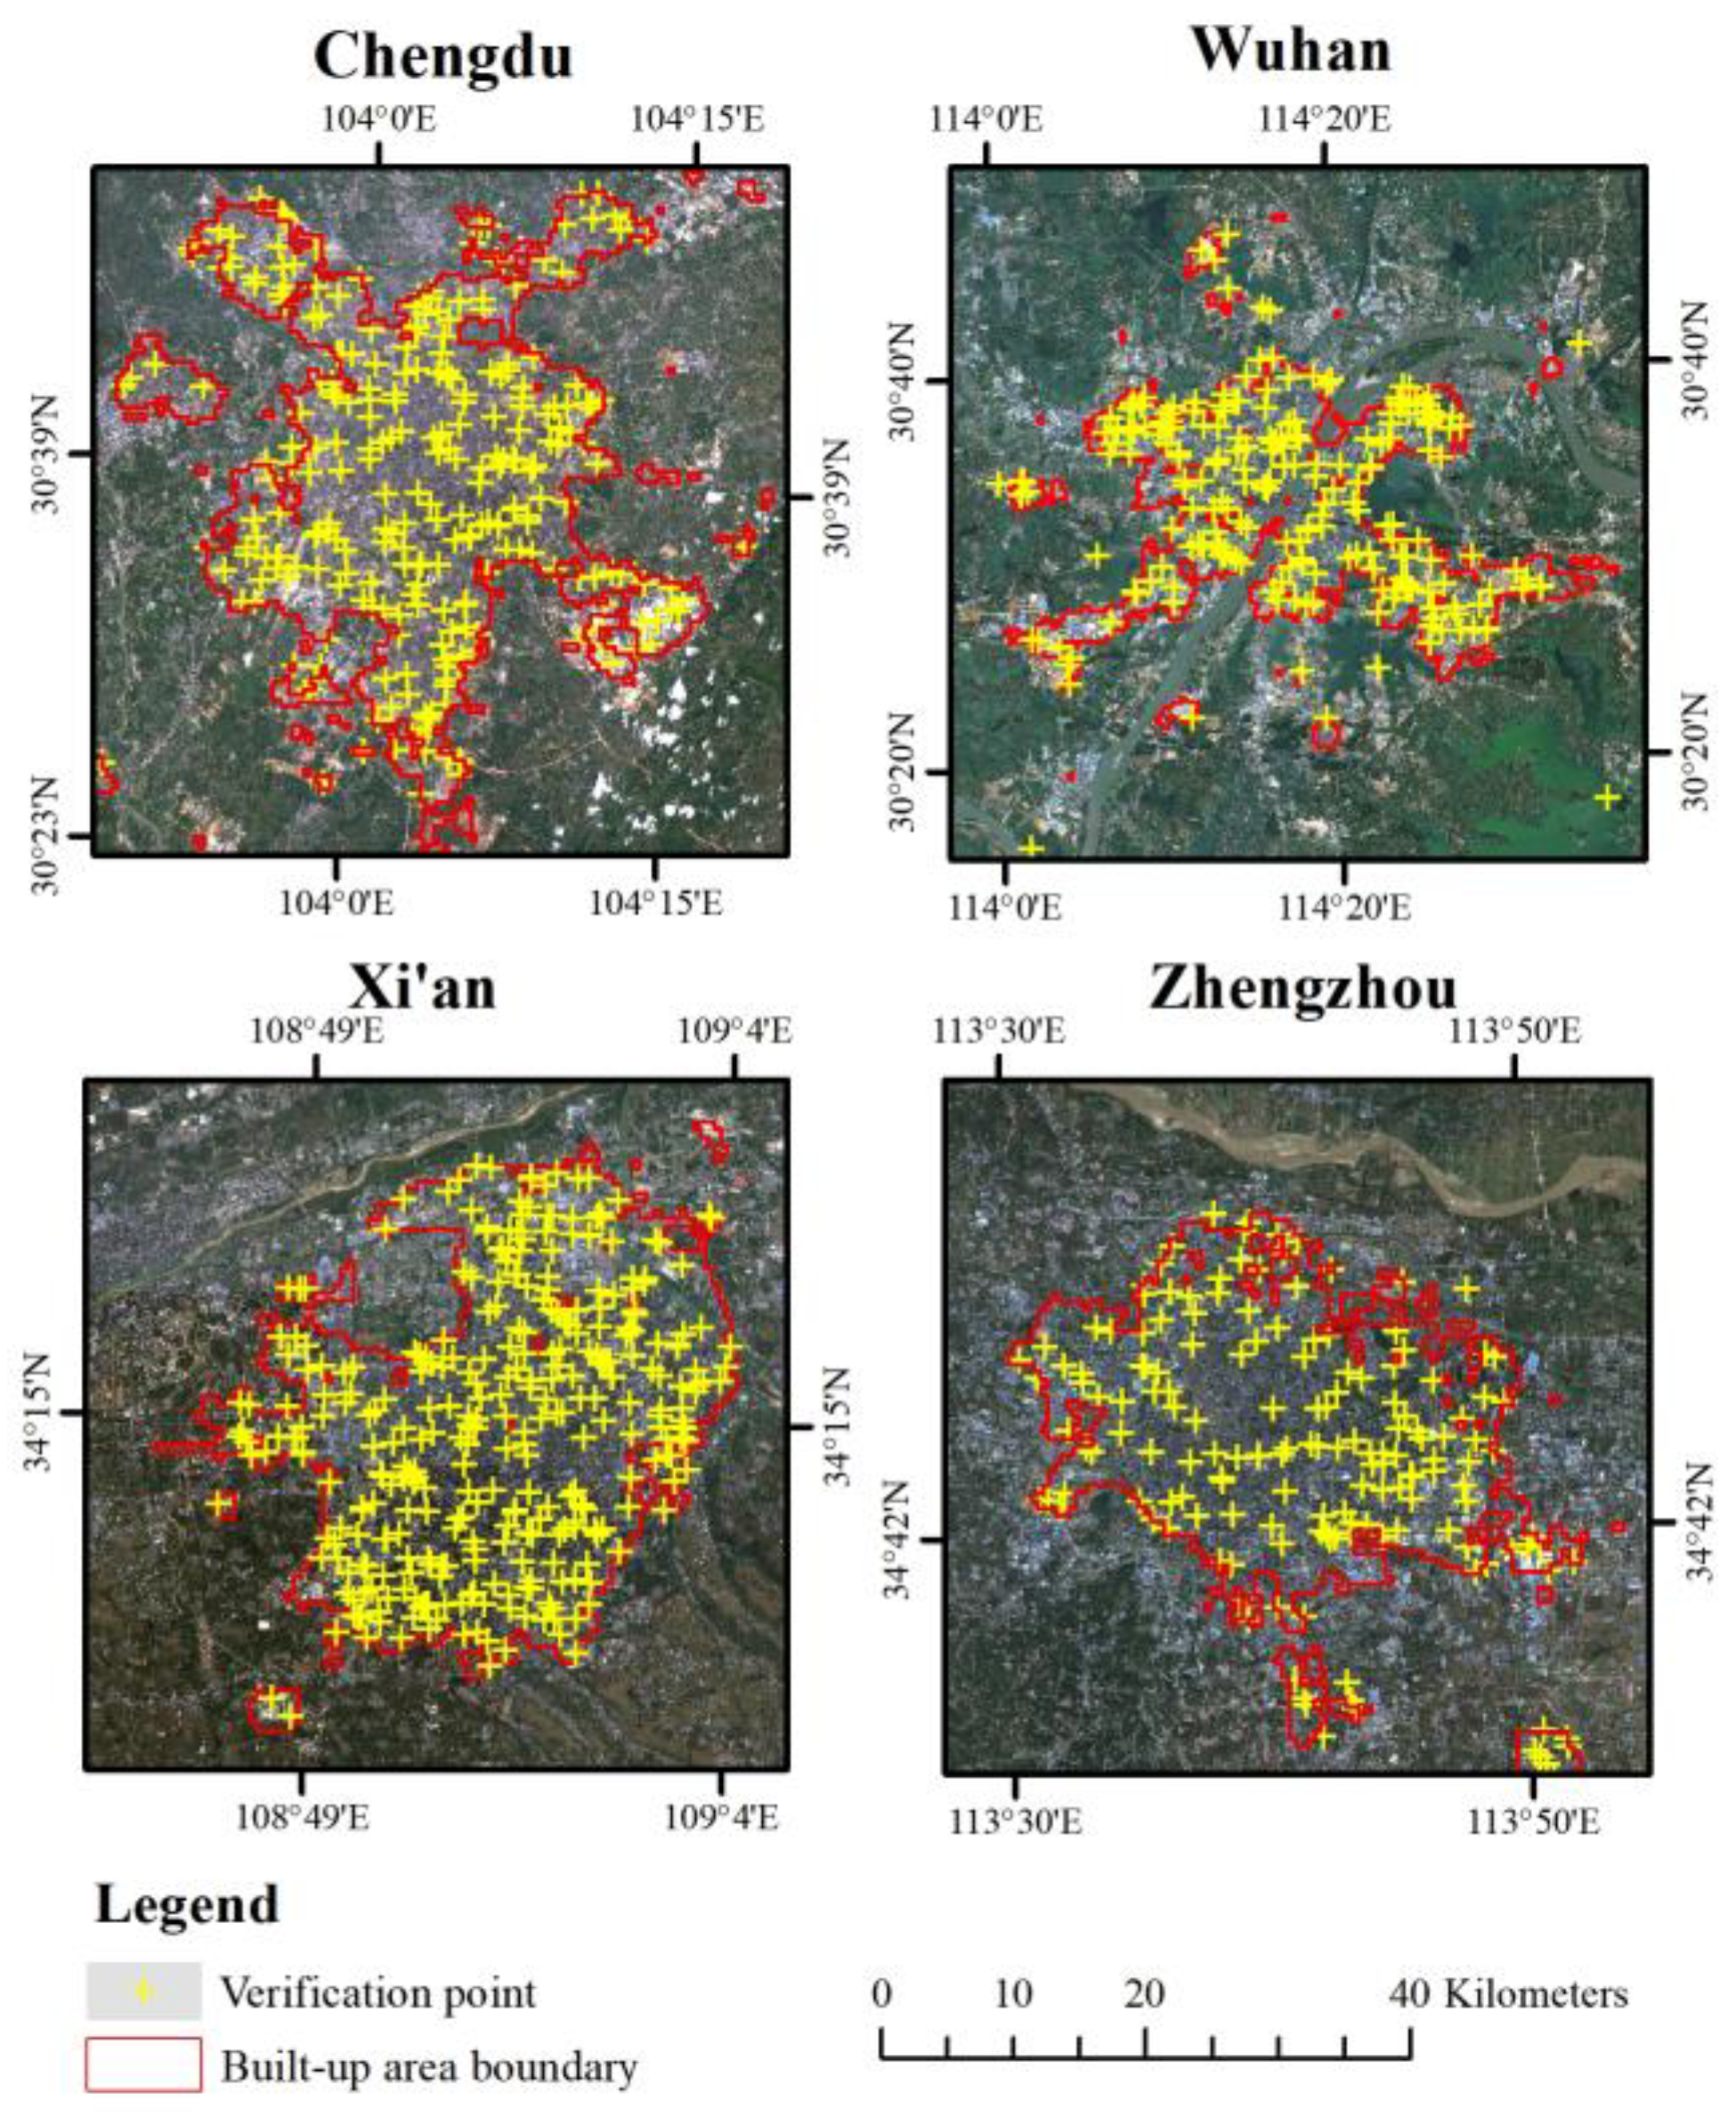
2.4. Validation of the VNRT Index

To validate the effectiveness of the proposed index, three methods were employed for analysis.
Firstly, Visual comparison was conducted to evaluate the spatial distribution of VNRT within the central urban areas of four cities and assess its consistency with the actual distribution of built-up areas. The reference for the actual built-up area extent was based on the 2019 global urban built-up area dataset at a 1 km resolution [48], generated through signal clustering analysis of multi-temporal nighttime light data. Qualitative analysis enabled a direct comparison of the index’s effectiveness in reducing blooming effects in NTL data [32].
Then, four cities were selected, and using a transect sampling approach, VNRT and two commonly used urban indices, HSI (Equation (2)) and VANUI (Equation (3)), were extracted for representative land cover types near these surfaces. By comparing the similarities and differences among the three indices for different land cover types, further evaluation of VNRT’s performance in urban information extraction was conducted.
At last, the Local Optimum Threshold (LOT) method, which is both accurate and easy to implement, was employed. This method involved comparing the index image with official statistical data to calculate specific thresholds for each city, optimizing the possible match, and determining the spatial extent of built-up areas in the region [25,49]. Three validation indicators, Accuracy, F1-score, kappa coefficient, and overall accuracy (OA) of the confusion matrix, are used to assess the effectiveness of VNRT’s extraction of urban built-up areas in comparison to two other proposed urban indices, based on the attributes of actual sample points obtained from higher resolution Sentinel-2 imagery. The F1 score is a value between 0 and 1, calculated as the harmonic average of recall and precision. A higher value indicates higher precision. Quantitative analysis facilitated a scientific evaluation of the extraction capabilities of each index for urban built-up areas [32]. The kappa coefficient, accuracy and F1-score are calculated as follows:
k a p p a = p 0 p e 1 p e
where p0 is the proportion of correctly classified pixels and pe is the expected probability of agreement when the classifier labels classes at random.
A c c u r a c y = T P + T N T P + T N + F P + F N
F 1 - s c o r e = 2 × p r e c i s i o n × r e c a l l p r e c i s i o n + r e c a l l
where precision is the accuracy of positive class predictions, which can be calculated as the ratio of True Positive Predictions (TP) to the sum of all positive results (including TP and False Positive FP). The recall of relevant samples, which can be calculated by dividing the number of true positives (TP) by the total number of relevant samples (true positives plus false negatives FN). In addition, TN is the number of true negative results. The flow chart of this approach is shown in Figure 2.

3. Results

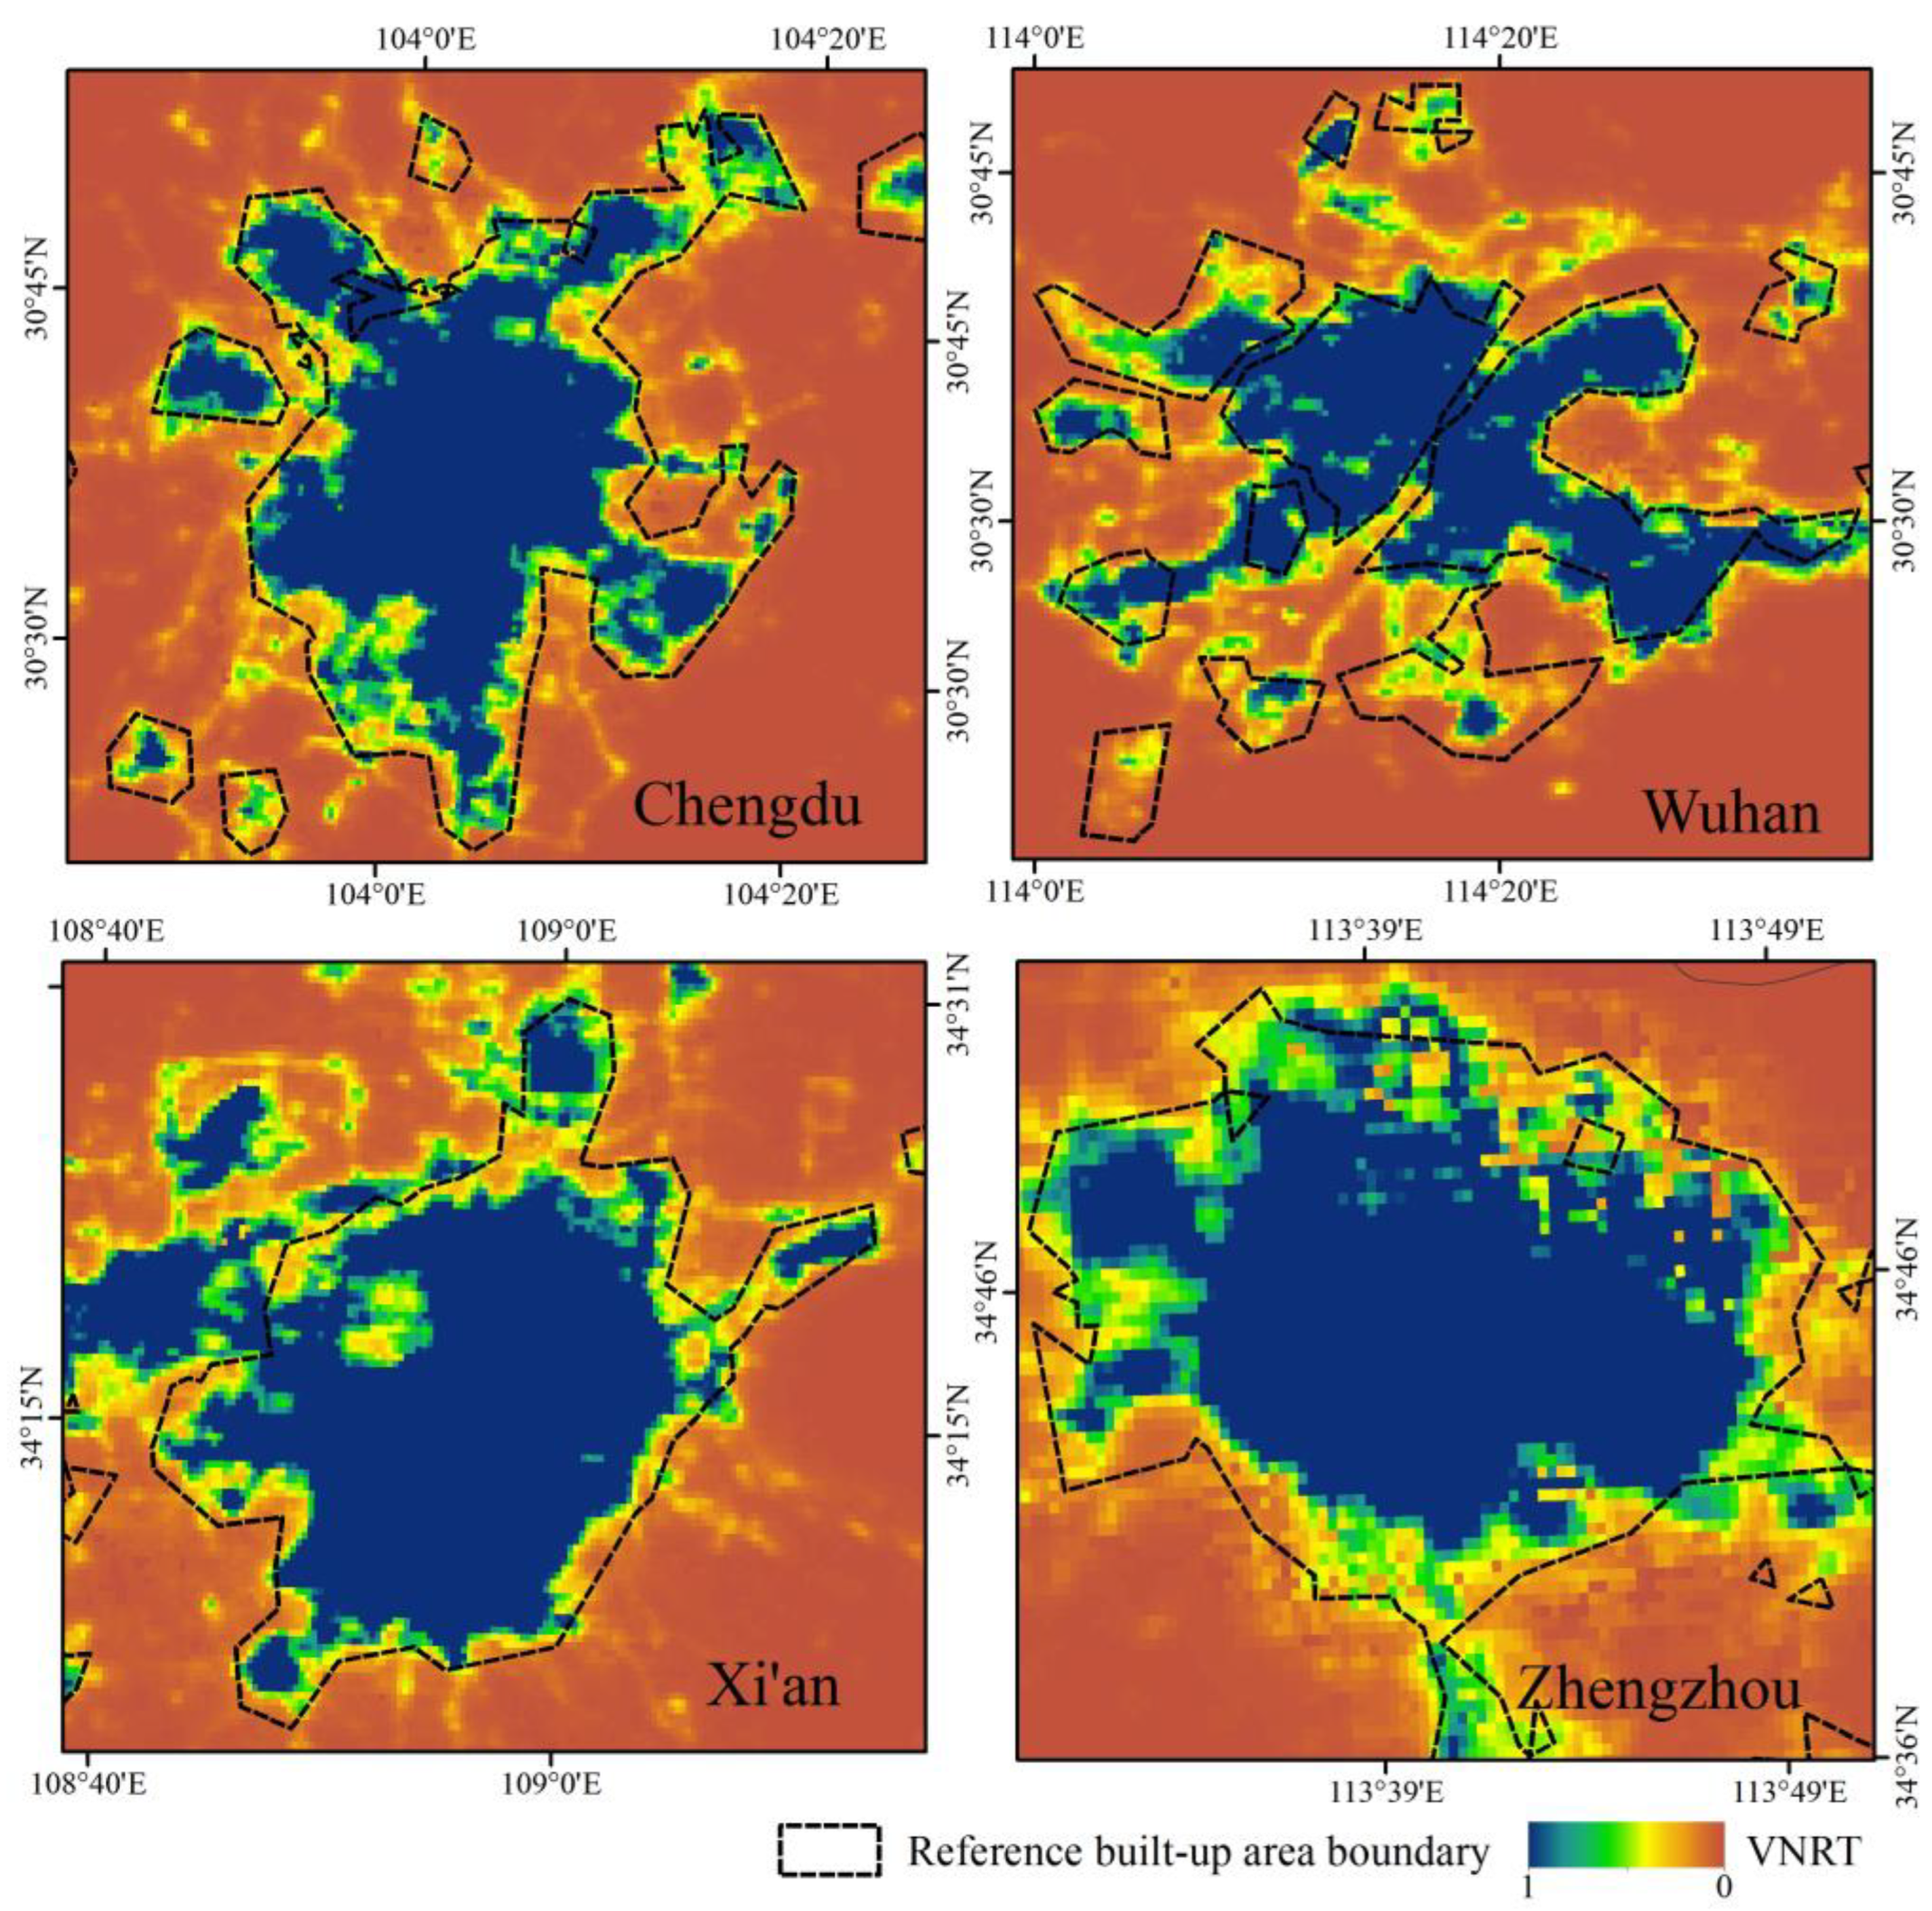
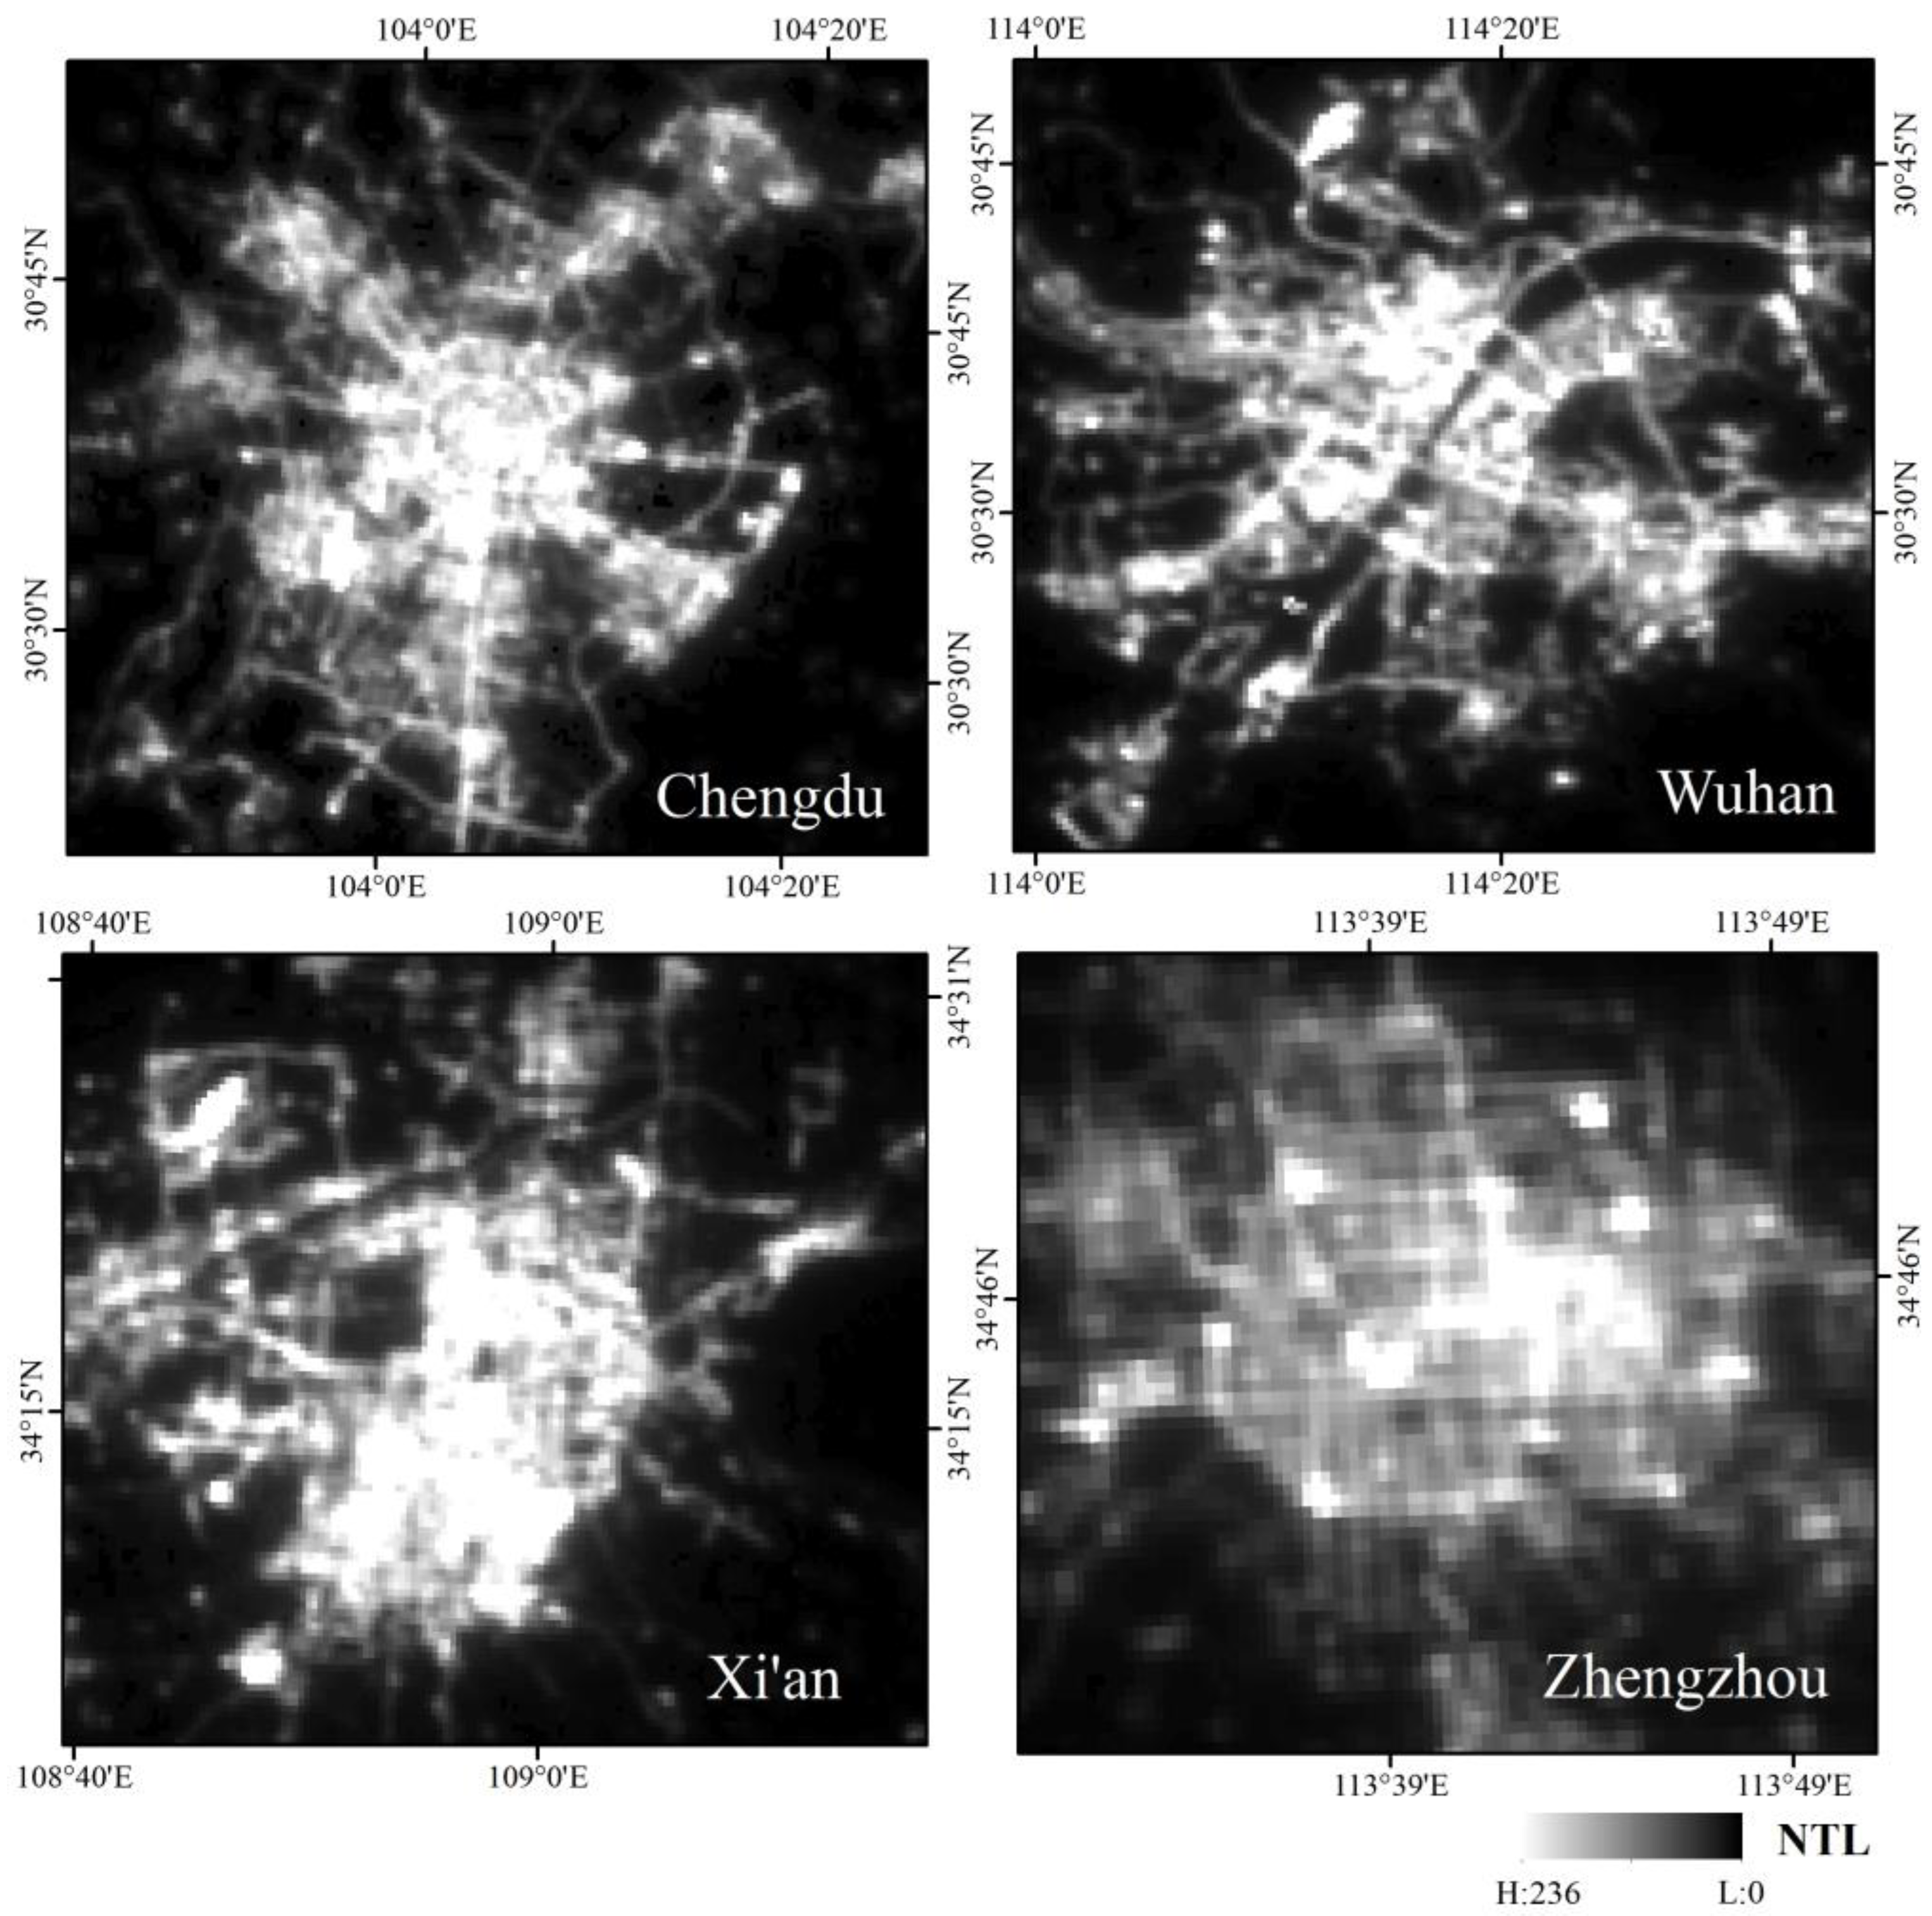
3.1. Spatial Distribution

In order to visually analyze and compare the urban information extraction capabilities of the VNRT, as well as the differences and similarities between the VNRT and the distribution of built-up areas, a preliminary visual assessment of the spatial distribution of the VNRT values from a global perspective was conducted with reference to the global 1 km resolution built-up area boundaries provided by Zhao [48]. Figure 3 shows the spatial distribution of VNRT index within the central urban areas of four major cities in China. The boundaries of the reference built-up areas are represented by black dashed lines. Due to the special geographic location of Xi’an, a part of the high VNRT distribution in the southwest of its central urban area belongs to an adjacent city within its administrative boundaries, and this part is not compared to the reference built-up area boundaries here.
It can be observed that VNRT value shows significant gradient changes, with high values concentrated in the urban built-up areas and low values in the non-built-up areas. The spatial distribution range of the high values in the VNRT has a very similar consistency with the boundaries of the reference urban built-up area, although in some areas of Zhengzhou and Wuhan, some of the high values in the VNRT are distributed in a slightly smaller area than the reference urban built-up area. In addition, the high values of the VNRT are homogeneously distributed in the center of the city, with fewer low-value pixels within the urban center and few fragmented high-value pixels outside the boundary of the referenced built-up area. The distribution pattern of the VNRT is clear, showing a noticeable decrease from the interior of the built-up areas to the edges and further to the non-built-up areas.
Figure 4 shows the corresponding NPP-VIIRS NTL imagery of the four national central cities. The NTL data can not only reflect the human activities and internal structure of the city, but also be used to identify the city center and urban pattern [50,51]. By comparing the distribution of the NTL data with that of the VNRT, we initially found that the spatial distribution of the VNRT index matches well with the actual distribution of the built-up areas of the cities, which indicates that the VNRT index has the potential to effectively capture and represent urban information.

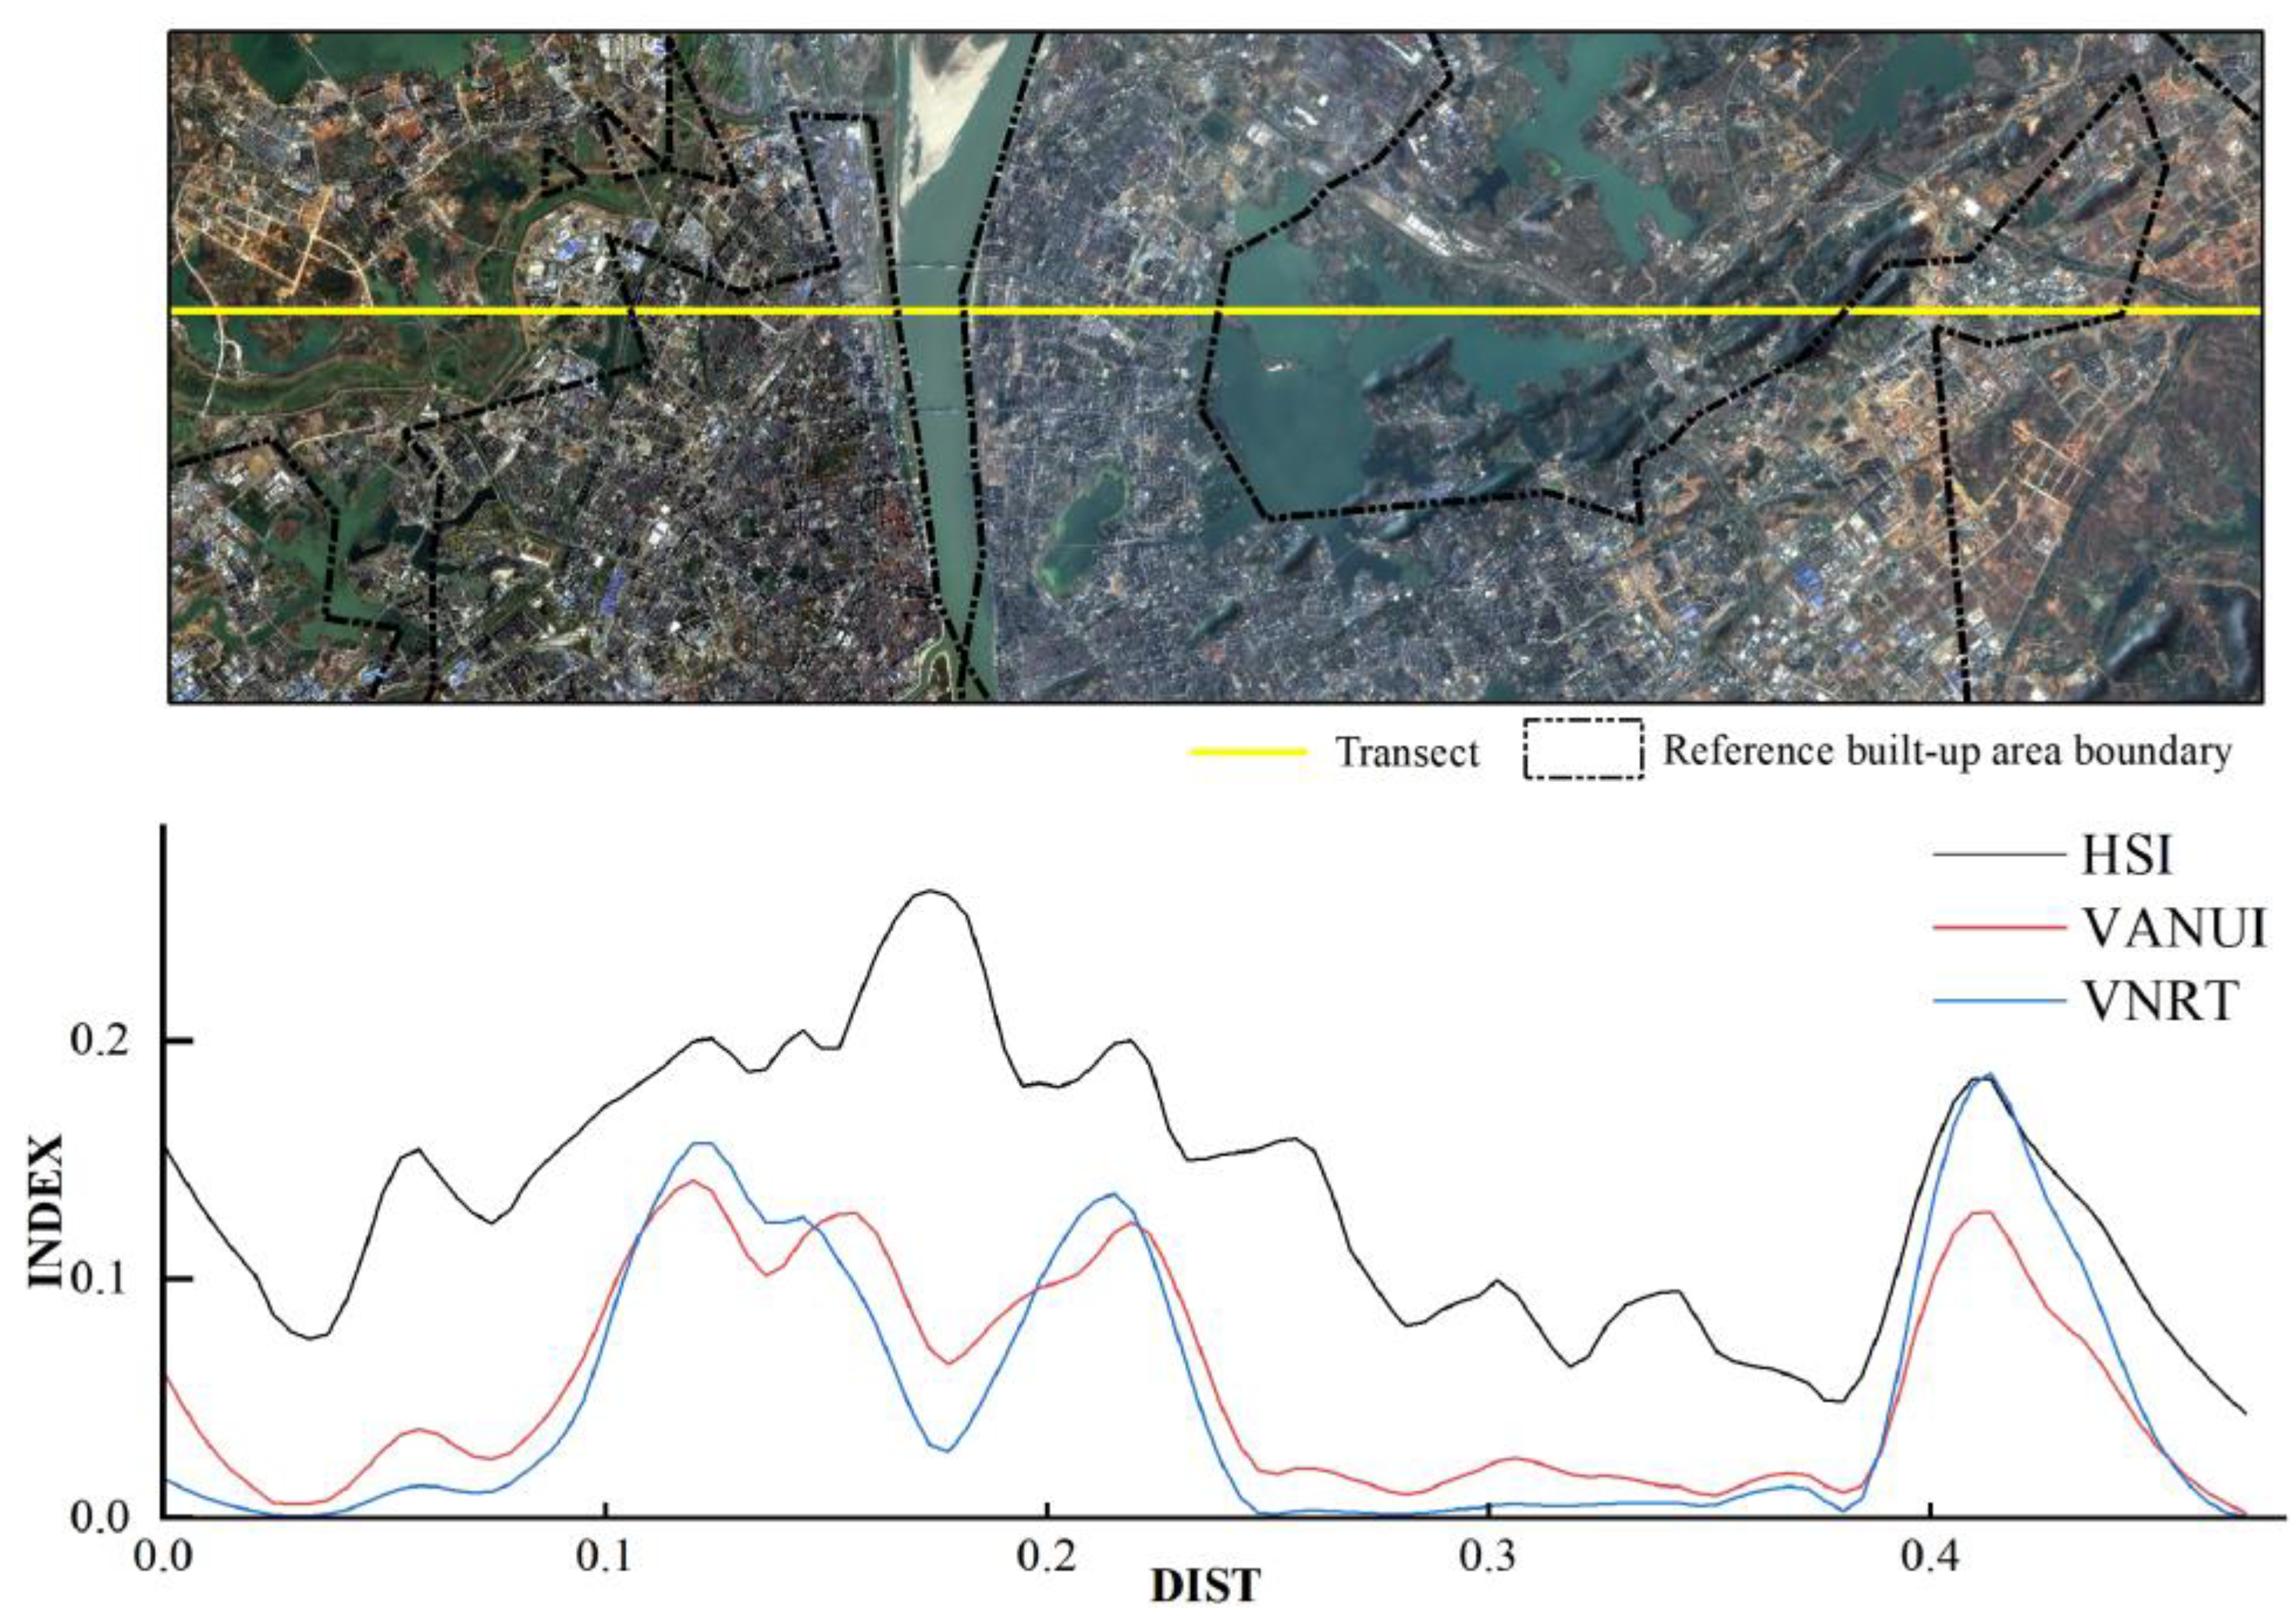
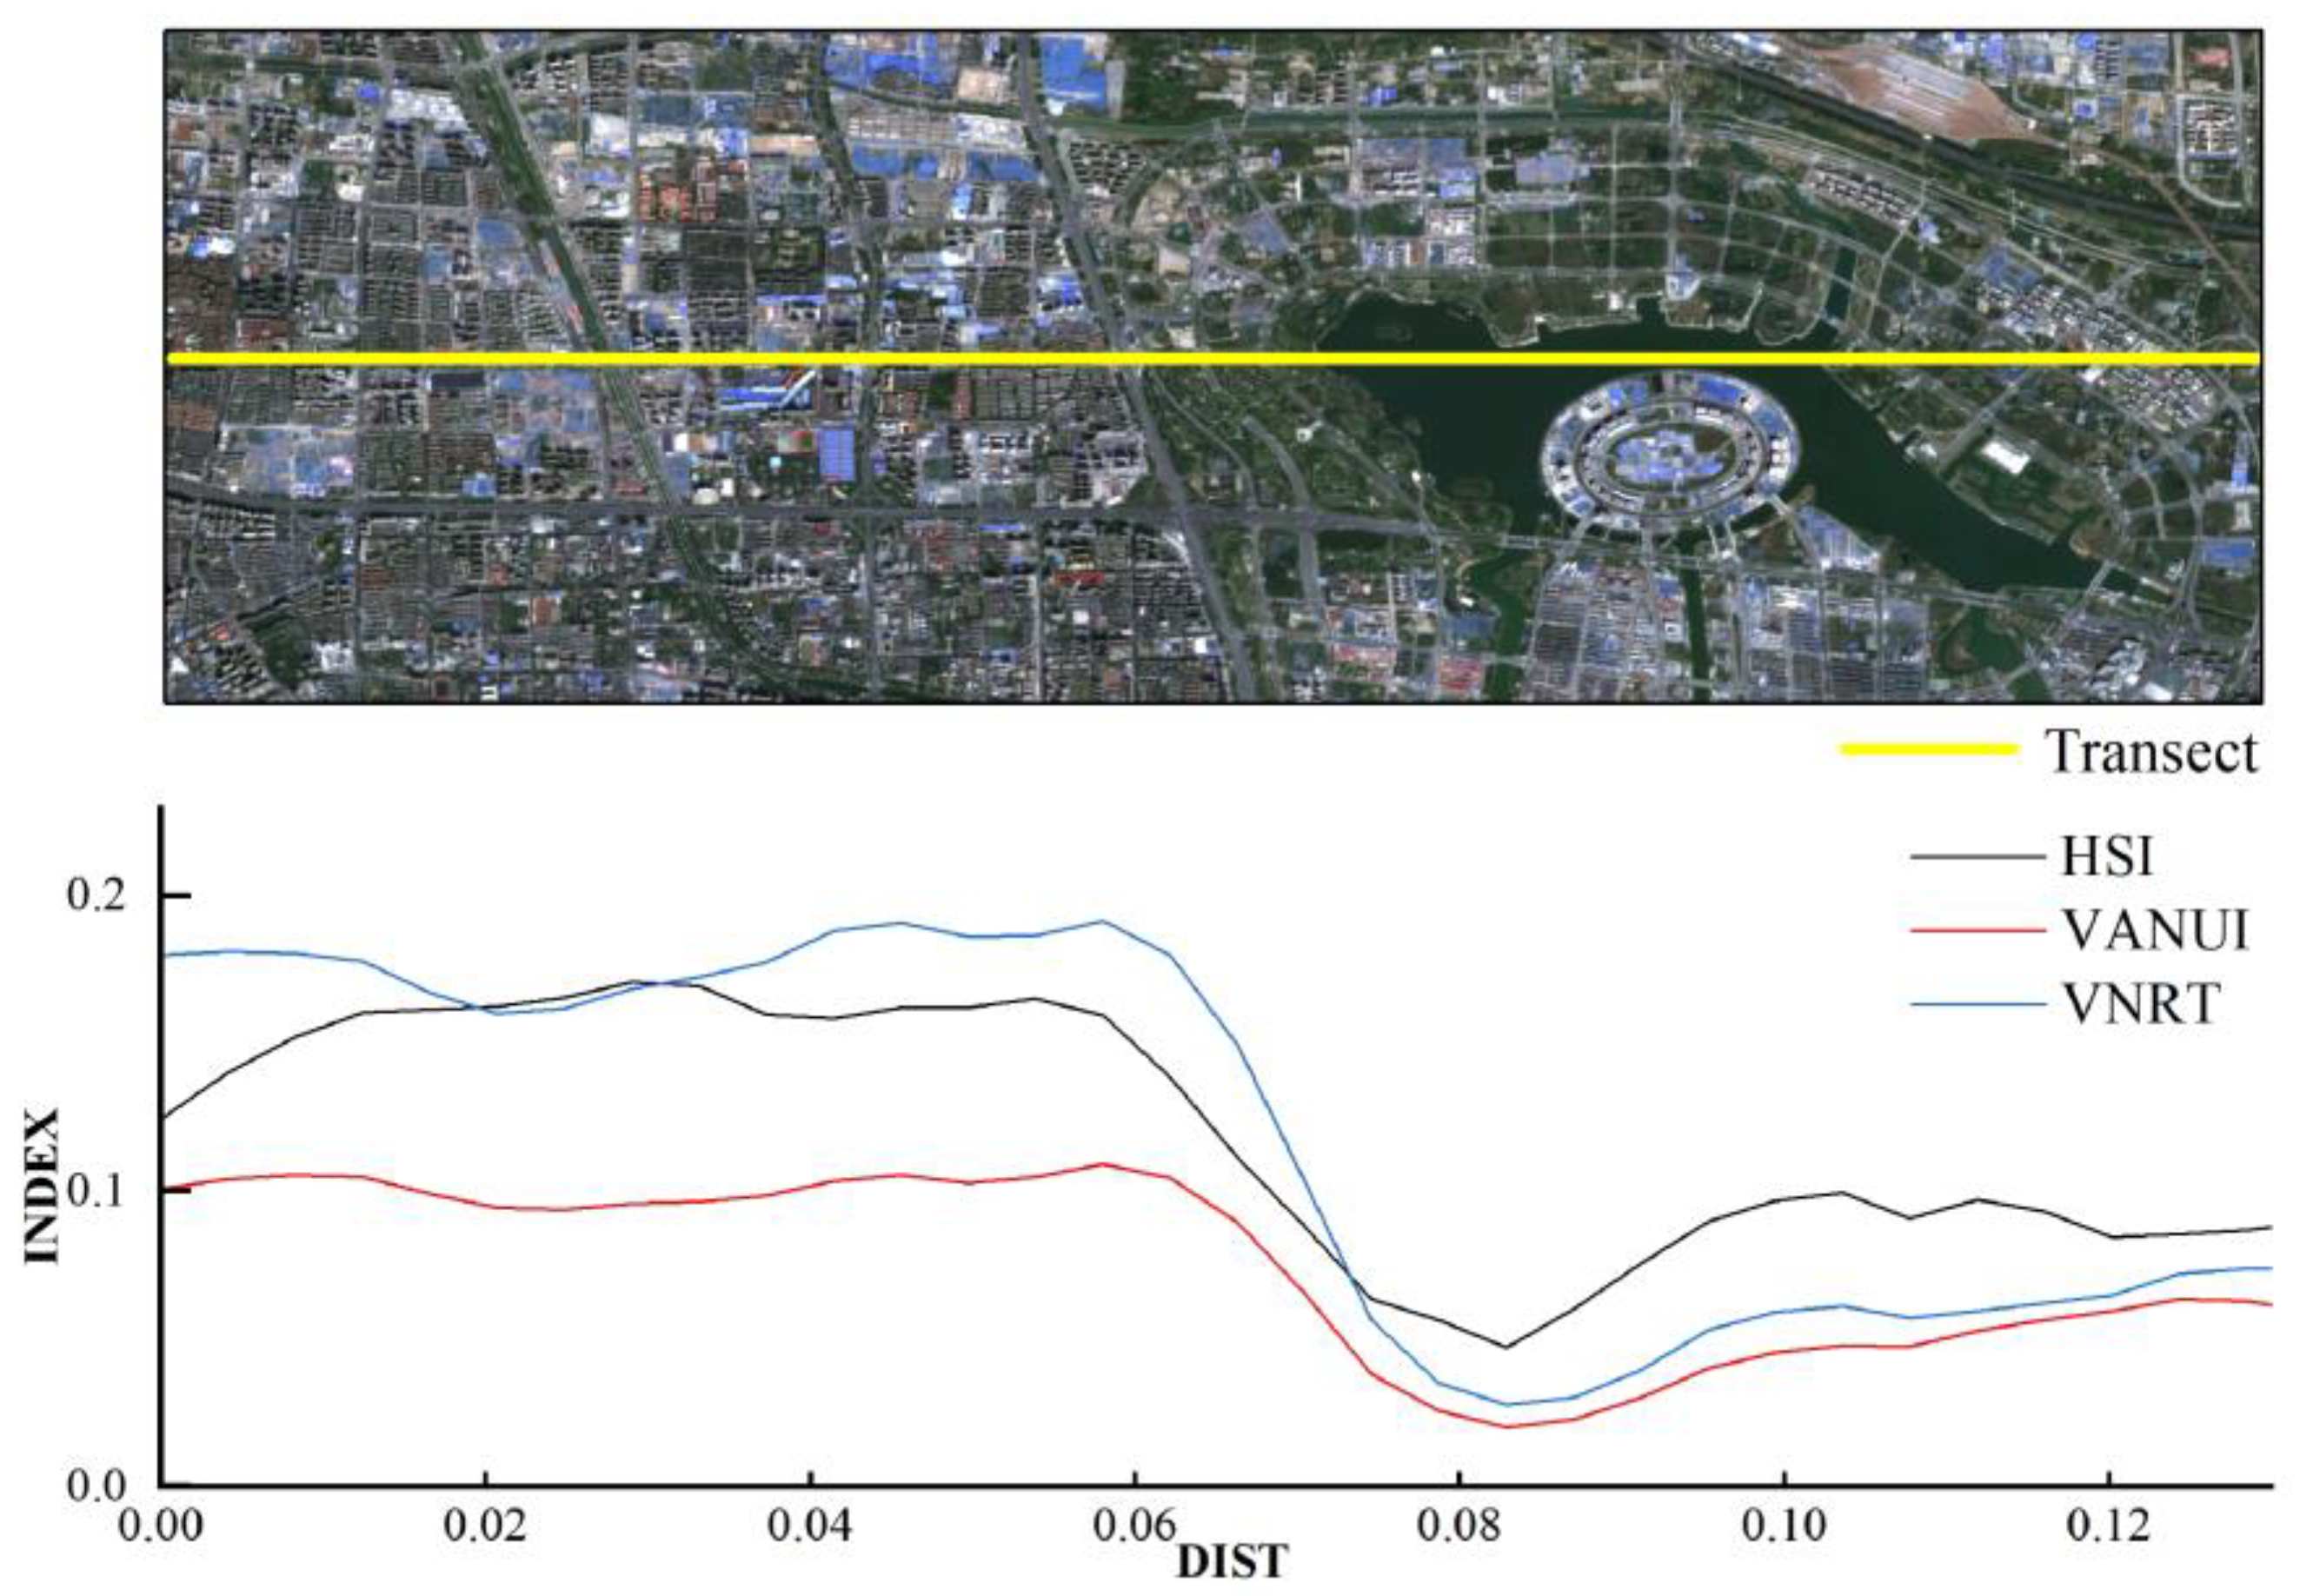
3.2. Transect Comparison in Typical Land Cover
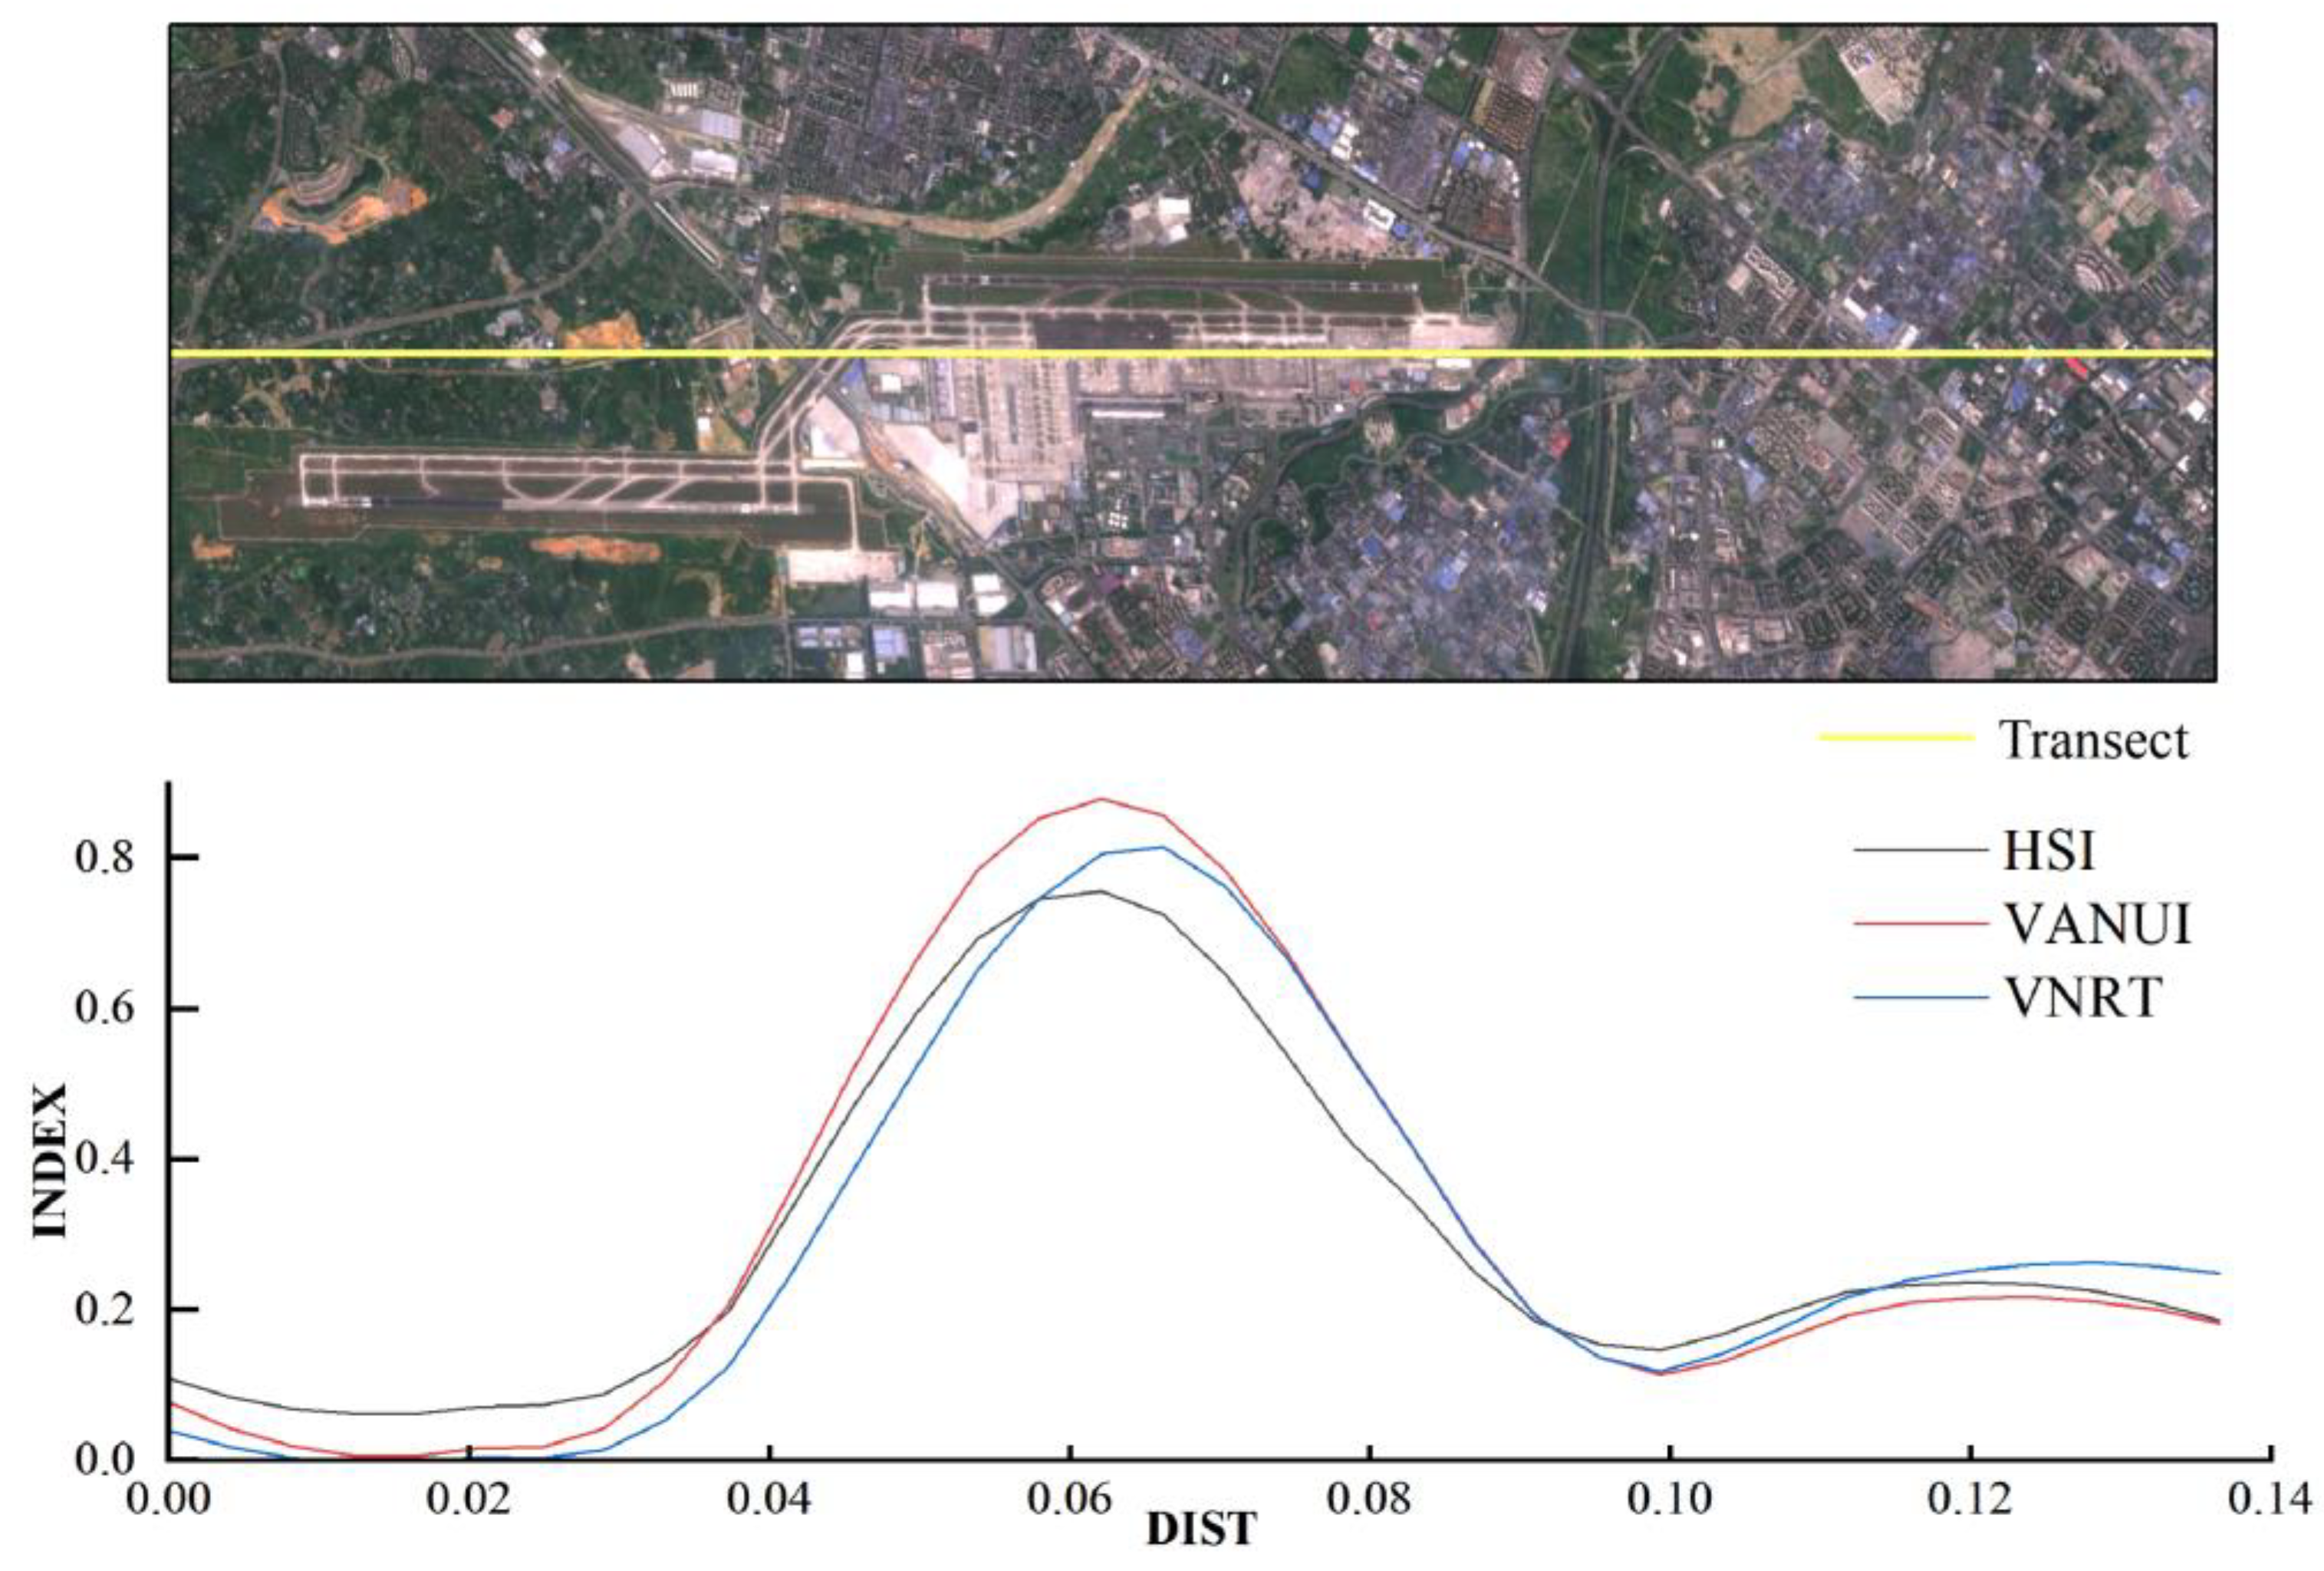
To further analyze the changes in the distribution of VNRT on different feature types at the regional scale, we selected three representative land cover types that are easily misclassified when extracting urban built-up areas, including airports, city parks, and water bodies. The transect sampling approach was employed to analyze the variations of urban indices on these land cover surfaces and their surroundings. In addition to VNRT index, two commonly used urban indices, HSI and VANUI, were included in this analysis to compare their differences and similarities. By employing this approach, the differences and similarities among the three indices could be comprehensively assessed, providing insights into their performance in capturing urban information across various land cover types within the selected cities.

3.2.1. Airport

The Airport, as an important part of the urban built-up area, has a very high level of NTL, which means a high level of human activity and urbanization. However, due to its typical distribution in areas that are often far from the urban center, it is prone to being overlooked during the process of built-up area extraction. The variation curves of the three indices nearby Shuangliu Airport in Chengdu were extracted to analyze their properties.
Figure 5 depicts the results of the transect analysis conducted in the vicinity of Chengdu Shuangliu Airport. Overall, the three urban indices show a consistent trend across different land cover types, with higher values observed in urban built-up areas and lower values in non-built-up areas. Furthermore, different functional zones within the built-up area exhibit distinct characteristics, with the airport area showing higher values compared to residential areas. Comparing the three urban indices, VANUI has the highest value in the airport area, followed by VNRT. In the residential area to the right of the airport, VNRT index has a slightly higher value than the other two indices, and in the undeveloped, non-built-up area to the left of the airport, VNRT index has the lowest value, which is close to 0. Although the three indices display a consistent trend around Shuangliu Airport, it is important to note that VNRT demonstrates greater variance within both the built-up and non-built-up areas. This is particularly evident in the airport area and the non-built-up area to the left of the airport, due to the minimization of non-urban information by factor multiplication in the calculation of the VNRT index.

3.2.2. City Park

City parks, as an important part of urban built-up areas, are often incorrectly identified as non-built-up areas in HSI and VANUI due to their low NTL and high NDVI. The Daming Palace Park, situated in the city center of Xi’an and with a relatively high vegetation cover, is a representative city park with frequent human activities. We take it as an example to study the changes of the three indices’ performance in city parks.
Figure 6 illustrates the transect variations of urban indices near the Daming Palace Park in Xi’an. In the vicinity of Daming Palace Park, the curves of the three urban indices demonstrate consistent trends. The values at Daming Palace Park are lower compared to the built-up areas, with VANUI exhibiting the lowest value and VNRT showing the highest value among them. During the process of extracting the built-up area using the local optimal thresholding method, VNRT index successfully extracted the built-up area attributes of Daming Palace Park by combining the road network data. This was a challenging task for HSI and VANUI Although the city park is part of the built-up area in this example, it is different from the commercial and residential areas in the level of development, so the three urban indices show obvious fluctuations in Figure 6. The non-built-up area and the city park in the index images of HSI and VANUI have similar index values, slightly lower than the built-up area. The VNRT, with its much lower value close to 0 in the non-built-up area, can effectively identify city parks as a built-up area.

3.2.3. Water

Water bodies are another important type of landscape characteristic that can be confused with built-up areas in the HSI and VANUI. Wuhan is a city with plenty of water bodies, its urban built-up area is distributed on both sides of the Yangtze River, and it is necessary to differentiate the built-up area of Wuhan from the neighboring Yangtze River when extracting the built-up area of Wuhan. Taking this transect in Wuhan as an example, the values of the three urban indices were extracted, spanning a considerable geographical range and various land cover types. To reduce curve fluctuations, a Savitzky-Golay (S-G) filter was applied to smooth the curves, and the 2019 global 1 km built-up area dataset was included as a reference [48].
Figure 7 illustrates the results of the transect analysis conducted along both sides of the Yangtze River in Wuhan. From Figure 7, it can be observed that all three indices exhibit higher values in the built-up area portion. VANUI and VNRT show a more similar trend, displaying distinct high values in the built-up area compared to the non-built-up area. The HSI curve, on the other hand, exhibits more fluctuations that do not entirely align with the distribution pattern of the built-up area, and overall, its index values are higher than the other two indices. In Wuhan, in the vicinity of the Yangtze River, the HSI curves show a higher peak than the built-up areas due to the complex algorithms of the HSI and its lower NDVI [32,33]. Therefore, it is more likely to be classified as a built-up area. However, the VNRT index performs better in this regard, as its low values at water bodies can be distinguished from built-up features. It is worth noting that in the transition from built-up to non-built-up areas, VNRT declines the fastest of the three indices, reaching relatively stable values more quickly. The same pattern is observed in the transition from the non-built-up area to the built-up area. Figure 7 shows that VNRT is not only sensitive to water bodies, but also shows better convergence at the boundary of urbanized areas and more variability between urbanized areas and other feature types, highlighting the information of the urban boundary.
Longhu is a small water body within the administrative area of Zhengzhou City, located in the suburbs of Zhengzhou City. According to the built-up area structure map published by the Zhengzhou Municipal Government, part of the area surrounding Longhu belongs to the built-up area and the other part belongs to the unbuilt area, which is not fully developed.
Figure 8 presents the results of the transect analysis near Longhu Lake in Zhengzhou City. Unlike the Yangtze River in Figure 8, it typically occupies a smaller land area, making it more challenging to identify during the extraction of the built-up area. In the built-up area on the left side of Longhu Lake, all three indices exhibit relatively high values, with VNRT demonstrating the highest value. In the vicinity of Longhu Lake, however, the values of the three indices are relatively low, with VANUI exhibiting the lowest value. It is worth noting that during the transition from the built-up area to the water body, both VANUI and VNRT show low values in the water body region. However, VNRT exhibits the greatest variation between the built-up area and the water body, which is advantageous for reducing misclassification of the water body during the process of built-up area extraction using the local threshold method.

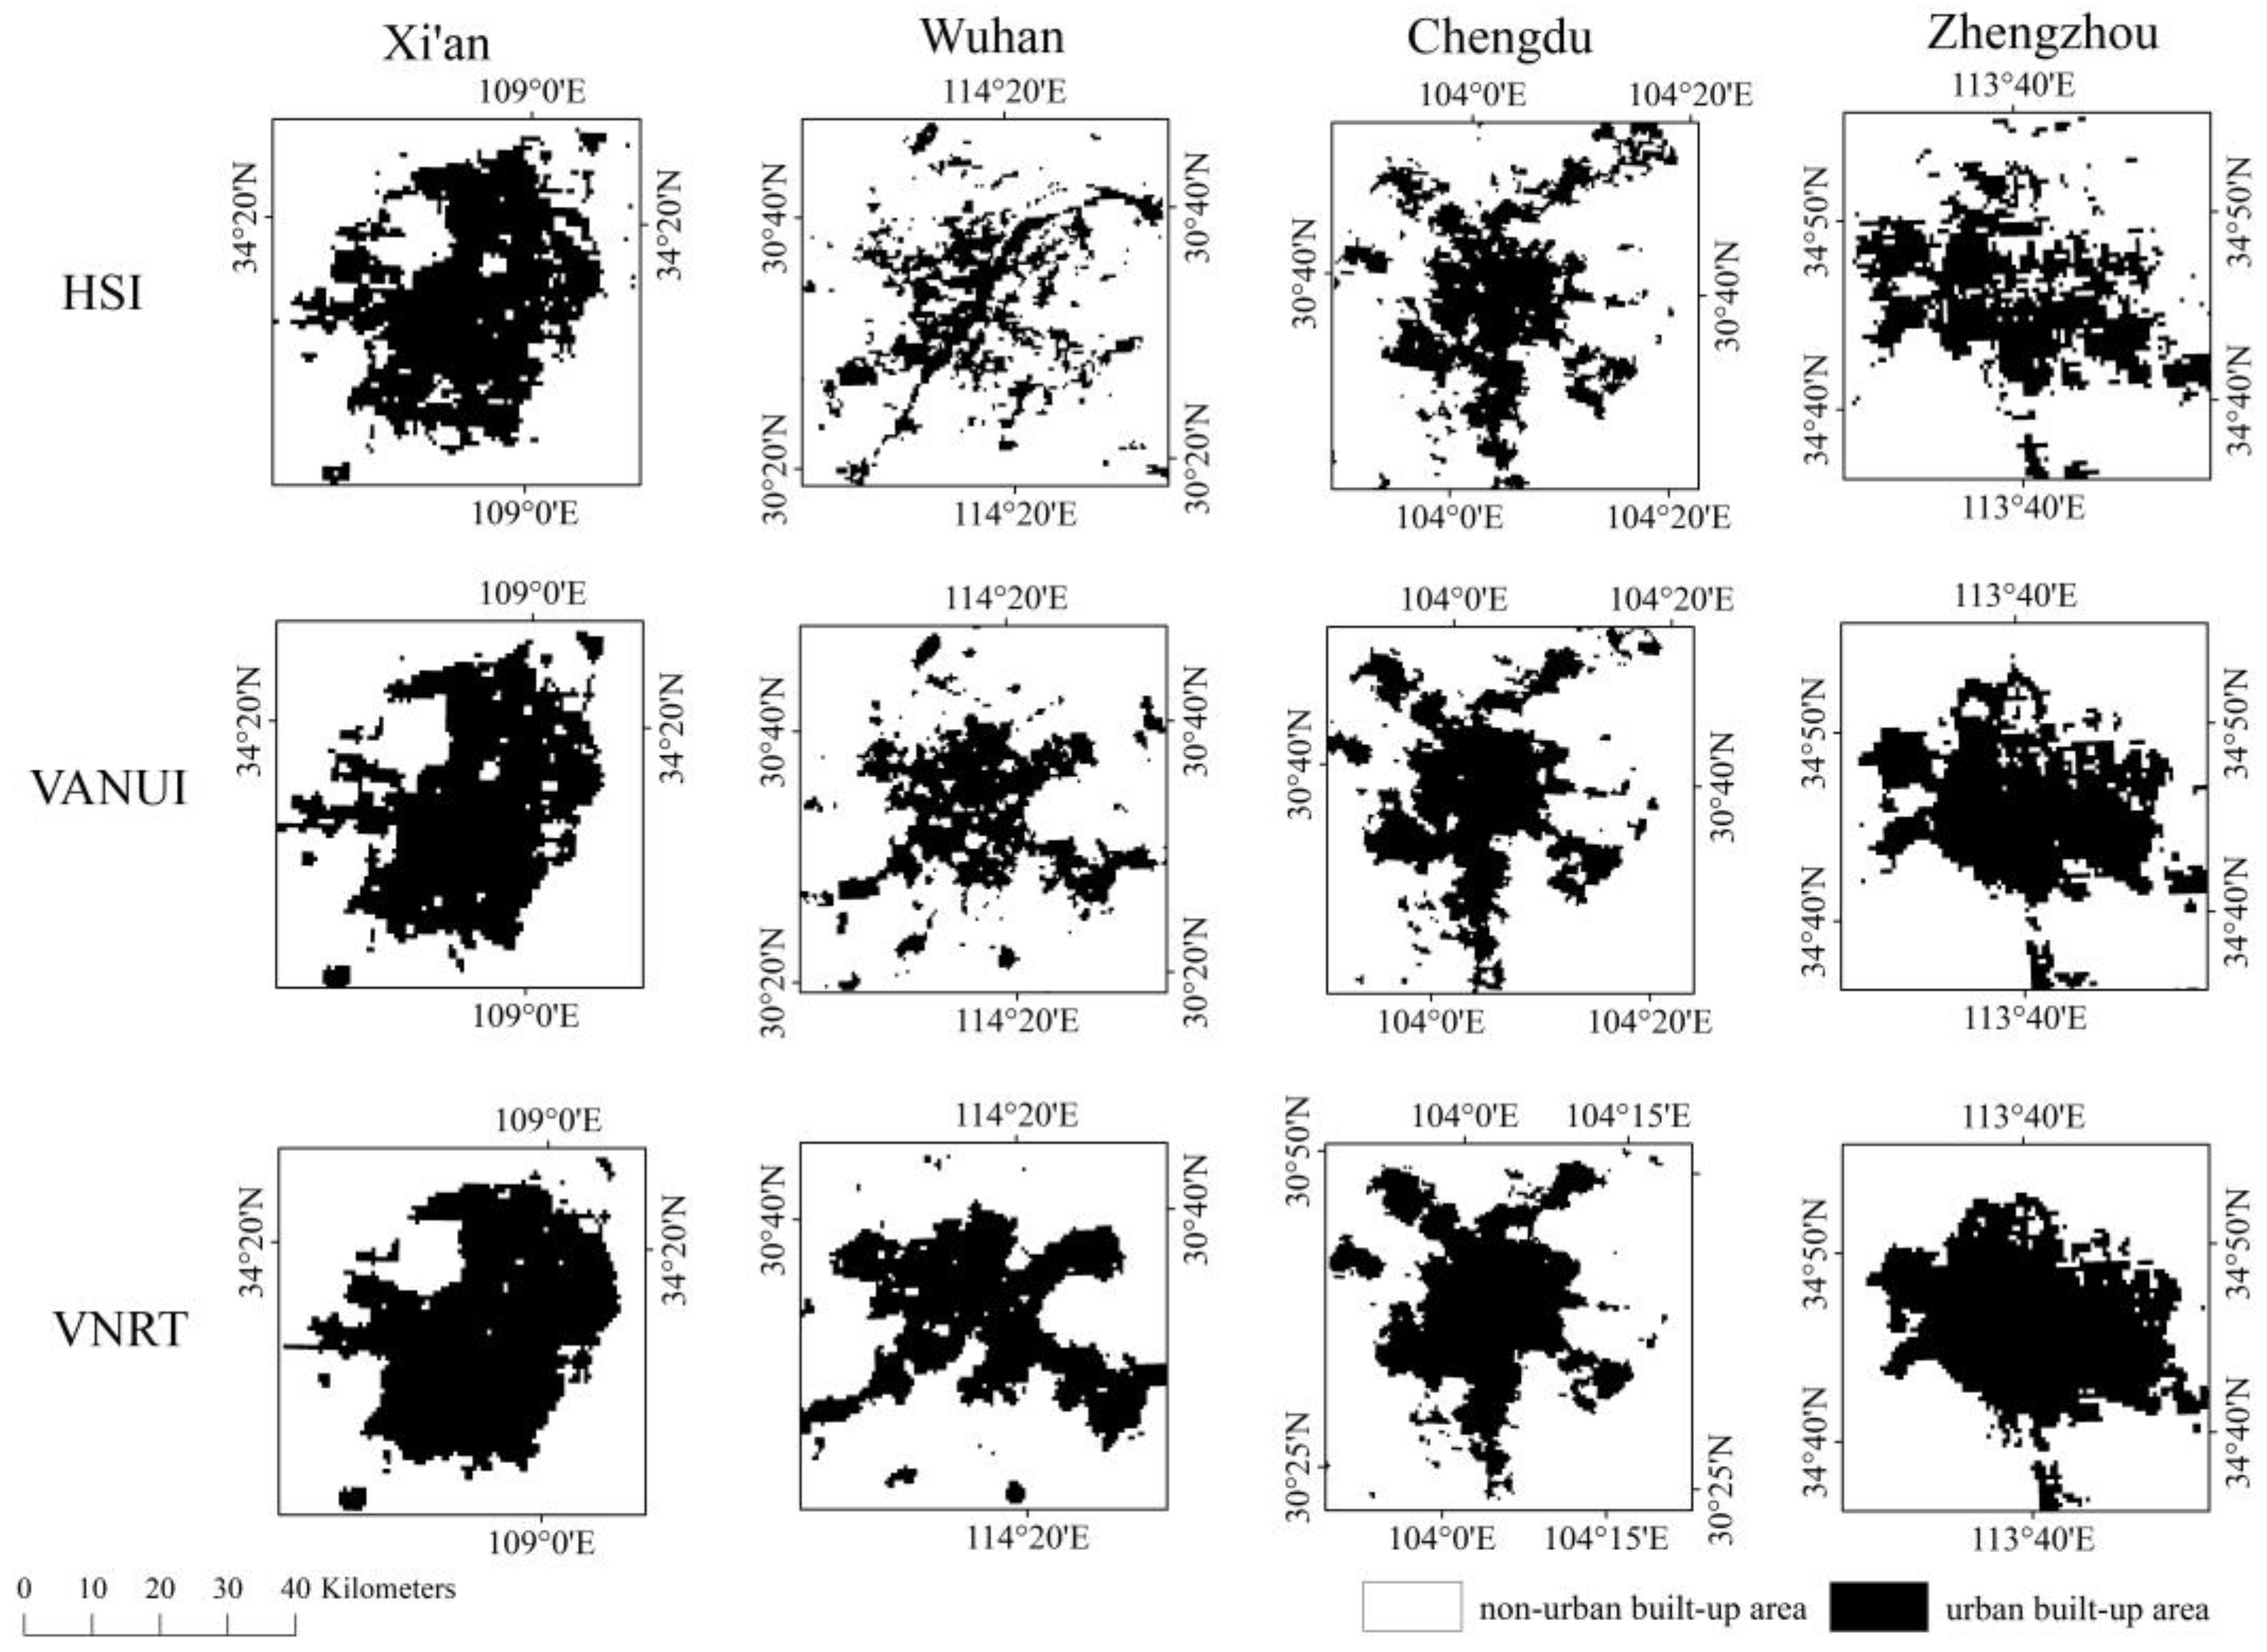
3.3. Urban Area Extracting Results

3.3.1. Local Threshold Method

The local optimum threshold method, in combination with the VNRT index imagery and statistical data, was employed to determine the spatial extent of the urban built-up area. The statistical data used in this study were obtained from the “2019 Statistical Yearbook of Urban Construction” provided by the Ministry of Housing and Urban-Rural Development of the People’s Republic of China, which includes the actual built-up area of each city. We extracted the portion of the index imagery with brightness values greater than the threshold “q” to closely match the actual built-up area of each city in the specific index imagery. In this process, the “q” value for extracting the built-up area of each city under the respective index imagery was determined using the R programming language. The official statistical data on the built-up area and the specific thresholds extracted are presented in Table 1.

3.3.2. Extracting Results from Local–Optimal Threshold Method

The spatial distribution of urban built-up areas extracted using the local optimum threshold method under three different indices is illustrated in Figure 9. From the extraction results of the HSI, it is evident that many pixels are distributed in areas far from the center of the built-up area, and the extracted boundaries of the built-up area are blurry due to the excessive saturation correction near the urban core, leading to the loss of valuable data at the boundaries [25]. VANUI and VNRT exhibit better performance in this regard as they address the complexity of the HSI algorithm. VANUI delineates the boundaries of the built-up area more clearly with fewer fragmented pixels in non-built-up areas while it suffers from numerous gaps within the built-up area, particularly prominent in Wuhan City. VANUI solely considering the spatial distribution of vegetation within the urban area, while neglecting other factors that influence the evolution of the internal structure of the urban region. In addition, in the built-up area extracted using the HSI and VANUI indices in Xi’an City, there is a large gap that corresponds to the presence of the Daming Palace Park. This gap can be attributed to the high NDVI values associated with the park, which attenuate the brightness values that typically represent built-up areas in these two indices. By comparison, VNRT extracts the boundaries of the built-up area in Xi’an more sharply, with a more complete internal structure and fewer scattered patches outside the built-up area. The same performance was shown in three other cities.

3.3.3. Accuracy Assessment

To quantitatively evaluate the effectiveness of the VNRT index in extracting built-up areas, we created a buffer zone for each city that simultaneously encompassed the extraction results of the three urban indices. Using the “Create Random Points” tool in ArcGIS, we generated 1000 random points within each buffer zone. These random points were visually interpreted based on higher-resolution Sentinel-2 imagery to classify them into built-up and non-built-up categories. The main criteria for classification were primarily based on the actual attributes of constructed buildings, while considering the presence of undeveloped wasteland and clearly visible farmland within a 1 km radius. The resulting classified validation points were then compared with the built-up area extraction results using three validation metrics: Accuracy, F1-score, Kappa coefficient and overall accuracy from confusion matrix validation. The validation results are presented in Table 2.
In each of the four selected cities, the VNRT index demonstrated superior verification results in terms of accuracy, F1-score, Kappa coefficient and OA, surpassing the other two proposed urban indices. The average accuracy of HSI for extracting urban built-up areas was 0.87, while VANUI reached 0.93. VNRT index achieved the highest average accuracy of 0.97. This trend was consistently present in the results of the four cities, with a particularly notable difference in Wuhan. In Wuhan, VNRT exhibited a precision that was 0.17 higher than HSI and 0.05 higher than VANUI. In the four national center cities, VNRT index achieved an average F1-score of 0.94, which is about 0.23 higher than HSI, and VANUI exhibited an average F1-score that is approximately 0.14 higher than HSI.
Table 2 also illustrates the kappa coefficient and OA. In Wuhan, VNRT index exhibited a Kappa coefficient of 0.75, which is 0.42 higher than HSI and around 0.12 higher than VANUI. This indicates that VNRT index showed the most significant improvement in performance among the four cities. In Xi’an, VNRT index reached a Kappa coefficient of 0.87 for the extraction of built-up areas, which was only 0.09 higher than VANUI and 0.15 higher than HSI. In all four cities, HSI had the lowest average Kappa coefficient of 0.56, indicating the lowest accuracy. VANUI had an average Kappa coefficient of 0.70, while VNRT index increased it to 0.80. It is suggested that VNRT index is more effective than HSI and VANUI in extracting built-up areas in urban areas. Among the four cities, Chengdu and Xi’an exhibited higher extraction results, with OA value above 85% for all three urban indices. Wuhan and Zhengzhou had relatively lower extraction performance. Figure 10 displays the final urban built-up area boundaries extracted using the VNRT index in the four selected cities. The yellow dots represent validation points classified as urban built-up areas.

4. Discussion

Nighttime light data is extensively employed in studies pertaining to urban built-up areas, with a plethora of urban indices relying on its utilization [52]. Among the commonly used indices, such as HSI [24] and VANUI [25], both are derived from a combination of NTL and NDVI to accurately extract urban information. Numerous studies have shown that using vegetation indices alone to correct nighttime light data for urban information extraction has limitations [11,33,37]. This study proposes a new urban built-up area index, VNRT, based on NTL, NDVI and LST data, and for the first time includes road density data, which is highly correlated with urban distribution. NTL and road density data provide information on urban social attributes, while NDVI and LST data provide information on urban natural attributes. The results indicate a high degree of consistency between the spatial distribution of the VNRT index and the reference built-up area dataset. The spatial distribution image of the VNRT index (Figure 3) shows a gradual decrease in the value of the VNRT index from the urban built-up area to the non-built-up area. In the center of the urban built-up area, VNRT index has high values approximately greater than 0.8 or even close to 1. At the boundary of the built-up area, VNRT index value decreases to around 0.5 and tends to be lower in the non-built-up area. The VNRT index successfully distinguishes the values inside the urban built-up area, making it easier to differentiate between the urban built-up area and the non-built-up area using the local optimum threshold method. Both the HSI and VANUI indices usually present challenges in distinguishing between water bodies and built-up areas [47,53], whereas the VNRT index showed superior performance in this regard (Figure 5). This may be due to the use of the LST factor, with water bodies presenting significantly lower surface temperature values compared to urban areas [54], resulting in a smaller VNRT index value for the water body than for normal built-up areas during the calculation. In addition, the urban built-up areas extracted by VNRT provide a more complete coverage and successfully extract some atypical urban built-up areas, such as urban green zones and urban parks, thus reducing the unnecessary internal vacancies that appear in the results of the proposed urban index extraction (Figure 9). By comparing the details with the real imagery, we find that the pixel vacancies covered by VNRT are mainly some street lights with weak NTL brightness and urban parks that are difficult to detect, and these features have similar characteristics to the non-built-up areas in terms of NTL and NDVI information [55], which are easily neglected in the previously proposed built-up area indices. However, these features, as part of the urban built-up area, have high road network density values, and the VNRT index compensates for this shortcoming in the extracted results of other urban indices by including the road network density factor.
Although the results of this study demonstrate the effectiveness of applying the VNRT index over the proposed urban built-up indices in the specific four national center cities of China, we find that the extraction accuracy of Wuhan and Zhengzhou is relatively lower than that of the other two cities when comparing the results of the four cities (Table 2). We consider that this is related to the city scale and geographical location of Wuhan and Zhengzhou. Considering that the urban heat island intensity is affected by the city scale and geographic location [56,57], the urban heat island effect is significantly mitigated in areas near water bodies, and their urban surface temperatures are relatively lower [58,59,60]. In this study, the extraction accuracy of Xi’an and Chengdu, which have an administrative area of more than 10,000 square kilometers, is better than that of Wuhan and Zhengzhou, which have an administrative area of less than 10,000 square kilometers. The reason may be due to the fact that Wuhan and Zhengzhou are located near the Yangtze River and the Yellow River, respectively, and are close to large water bodies, which mitigates the urban heat island effect, leading to the weakening of the effect of LST in the extraction process. Although the overall accuracy of the VNRT index for extraction of built-up areas is higher than the other two proposed indices, further research on its stability and applicability in areas with different city scales and geographical locations is still needed in the future.
By analyzing the impact of each factor individually on the results in VNRT, we try to remove a factor from Eq.1 and calculate the impact of the remaining three factors on the extraction accuracy. First, it was found that when LST, road density, and NDVI were removed from the VNRT equations, the kappa coefficients obtained were 0.66, 0.58, and 0.61, respectively, which were lower than the accuracy of the four factors interacting with each other. It is worth noting that although the four factors together have the best extraction performance, it is evident that they do not influence the results to the same extent. Each of these four factors represents a different attribute in the urban information, and the improvement of VNRT accuracy is not only attributed to the integration of additional data information, but how each of them affects the extraction of built-up area and the magnitude of their respective influence is still the goal of our further research in the future. Alternative methods other than equal-weight factor multiplication can be considered to explore the degree of influence on the results under different factors by assigning different combinations of weights to them, which may be a valuable direction to further improve the accuracy of VNRT.

5. Conclusions

Accurately and timely delineation of urban built-up areas is crucial for monitoring the urbanization process and development. Previous studies mostly focus on the extraction of built-up areas by using NTL data and NDVI data, but these proposed urban built-up area indices are still deficient in local feature extraction and overall accuracy. We proposed a new urban built-up area index, VNRT, to extract the spatial distribution information of urban built-up areas by combining NPP-VIIRS NTL, MODIS NDVI, LST, and OSM road network data. The results are compared with two proposed urban indices (HSI and VANUI), and the performance is evaluated by taking four central cities in China in 2019 as an example. The results demonstrate that the spatial distribution of the VNRT index is in good correspondence with the reference urban built-up area spatial distribution, and can effectively provide information on urban built-up areas. Furthermore, the VNRT index effectively increases the variability between built-up and non-built-up areas by raising the index value within the built-up areas and lowering the index value in non-built-up areas. This can be verified by the profile analysis of local typical features. VNRT also demonstrated good extraction performance for water bodies, city parks, and weakly illuminated paths at night, which are typical features that are easily misclassified in the current built-up area indices. The spatial extent of the built-up area was extracted using the optimal threshold method in combination with official statistics, and the accuracy was verified with reference to the actual sampling points. The verification results indicate that the VNRT index achieved an average accuracy, F1 score, and kappa coefficient of 0.97, 0.94, and 0.80, respectively, for the extracted built-up areas, which are higher than those of the two proposed urban indices, HSI and VANUI. In conclusion, the VNRT index can effectively be used to extract the area of urban built-up areas by combining multi-source data based on NPP-VIIRS to realize the acquisition of long time-series urban built-up area information on a large scale. Although the method may still be influenced by potential urban spatial patterns, it provides a low-cost, high-precision, intuitive, and easy-to-use approach for quickly and accurately delineating the urban built-up area within a region. This can be used as a basis for urban development planning and dynamic monitoring.

Author Contributions

Methodology, Linfeng Wang and Lei Chen; data processing, Zibo Wang and Yucheng Xu; validation, Bin Liu; writing—original draft preparation, Linfeng Wang and Lei Chen; writing—review and editing, Linfeng Wang, Shengbo Chen, Lei Chen, Zibo Wang, Bin Liu and Yucheng Xu; funding acquisition, Shengbo Chen. All authors have read and agreed to the published version of the manuscript.

Funding

This research was funded by the National Key Research and Development Program of China (grant No. 2020YFA0714103).

Data Availability Statement

Data are contained within the article.

Conflicts of Interest

The authors declare no conflicts of interest.

References

  1. UN-Habitat. World Cities Report 2020; UN-Habitat: New York, NY, USA, 2020; Available online: https://unhabitat.org/sites/default/files/2020/10/wcr_2020_report.pdf (accessed on 2 October 2023).
  2. Ewing, R.; Rong, F. The Impact of Urban Form on US Residential Energy Use. Hous. Policy Debate 2008, 19, 1–30. [Google Scholar] [CrossRef]
  3. Foley, J.A.; DeFries, R.; Asner, G.P.; Barford, C.; Bonan, G.; Carpenter, S.R.; Chapin, F.S.; Coe, M.T.; Daily, G.C.; Gibbs, H.K.; et al. Global Consequences of Land Use. Science 2005, 309, 570–574. [Google Scholar] [CrossRef] [PubMed]
  4. Pataki, D.E.; Alig, R.J.; Fung, A.S.; Golubiewski, N.E.; Kennedy, C.A.; McPherson, E.G.; Nowak, D.J.; Pouyat, R.V.; Lankao, P.R. Urban Ecosystems and the North American Carbon Cycle. Glob. Change Biol. 2006, 12, 2092–2102. [Google Scholar] [CrossRef]
  5. Shukla, V.; Parikh, K. The Environmental Consequences of Urban-Growth—Cross-National Perspectives on Economic-Development, Air-Pollution, and City Size. Urban Geogr. 1992, 13, 422–449. [Google Scholar] [CrossRef]
  6. Xia, N.; Cheng, L.; Li, M. Mapping Urban Areas Using a Combination of Remote Sensing and Geolocation Data. Remote Sens. 2019, 11, 1470. [Google Scholar] [CrossRef]
  7. Hu, T.; Huang, X.; Li, D.; Jin, S.; Yan, Q. Comprehensive evaluation of the urban built-up areas mapping ability from Luojia 1-01 nighttime light imagery over China. Acta Geod. Cart. Sin. 2023, 52, 432–442. [Google Scholar]
  8. Yang, J. The Research on the Development Level Evaluation and Realization Path of Green Urbanization in China. Ph.D. Thesis, Northwest University, Kirkland, WA, USA, 2021. [Google Scholar] [CrossRef]
  9. Herold, M. Some Recommendations for Global Efforts in Urban Monitoring and Assessments from Remote Sensing. In Global Mapping of Human Settlement; Gamba, P., Herold, M., Eds.; Remote Sensing Applications Series; CRC Press: Boca Raton, FL, USA, 2009; Volume 20090662, ISBN 978-1-4200-8339-2. [Google Scholar]
  10. Ma, T.; Zhou, C.; Pei, T.; Haynie, S.; Fan, J. Quantitative Estimation of Urbanization Dynamics Using Time Series of DMSP/OLS Nighttime Light Data: A Comparative Case Study from China’s Cities. Remote Sens. Environ. 2012, 124, 99–107. [Google Scholar] [CrossRef]
  11. Liu, Y.; Yang, Y.; Jing, W.; Yao, L.; Yue, X.; Zhao, X. A New Urban Index for Expressing Inner-City Patterns Based on MODIS LST and EVI Regulated DMSP/OLS NTL. Remote Sens. 2017, 9, 777. [Google Scholar] [CrossRef]
  12. Zha, Y.; Gao, J.; Ni, S. Use of Normalized Difference Built-up Index in Automatically Mapping Urban Areas from TM Imagery. Int. J. Remote Sens. 2003, 24, 583–594. [Google Scholar] [CrossRef]
  13. Zha, Y.; Ni, S.; Yang, S. An Effective Approach to Automatically Extract Urban Land-use from TM Imagery. J. Remote Sens. 2003, 7, 37–40+82. [Google Scholar]
  14. Chen, X.-L.; Zhao, H.-M.; Li, P.-X.; Yin, Z.-Y. Remote Sensing Image-Based Analysis of the Relationship between Urban Heat Island and Land Use/Cover Changes. Remote Sens. Environ. 2006, 104, 133–146. [Google Scholar] [CrossRef]
  15. Xu, H. A New Index for Delineating Built-up Land Features in Satellite Imagery. Int. J. Remote Sens. 2008, 29, 4269–4276. [Google Scholar] [CrossRef]
  16. Xu, Z.; Gao, X. A novel method for identifying the boundary of urban built-up areas with POI data. Acta Geogr. Sin. 2016, 71, 928–939. [Google Scholar]
  17. Sutton, P.C.; Elvidge, C.; Obremski, T. Building and Evaluating Models to Estimate Ambient Population Density. Photogramm. Eng. Remote Sens. 2003, 69, 545–553. [Google Scholar] [CrossRef]
  18. Zhuo, L.; Ichinose, T.; Zheng, J.; Chen, J.; Shi, P.J.; Li, X. Modelling the Population Density of China at the Pixel Level Based on DMSP/OLS Non-Radiance-Calibrated Night-Time Light Images. Int. J. Remote Sens. 2009, 30, 1003–1018. [Google Scholar] [CrossRef]
  19. Cao, W.; Li, J.; Zhang, X. Research and Application of Rapid Extraction Method of Urban Built—Up Area by Using Night—Time Light Data: Taking Sichuan Province as an Example. Geomat. Spat. Inf. Technol. 2020, 43, 60–62+67. [Google Scholar]
  20. Zheng, Q.; Weng, Q.; Wang, K. Characterizing Urban Land Changes of 30 Global Megacities Using Nighttime Light Time Series Stacks. ISPRS J. Photogramm. Remote Sens. 2021, 173, 10–23. [Google Scholar] [CrossRef]
  21. Cao, X.; Hu, Y.; Zhu, X.; Shi, F.; Zhuo, L.; Chen, J. A Simple Self-Adjusting Model for Correcting the Blooming Effects in DMSP-OLS Nighttime Light Images. Remote Sens. Environ. 2019, 224, 401–411. [Google Scholar] [CrossRef]
  22. Li, X.; Xu, H.; Chen, X.; Li, C. Potential of NPP-VIIRS Nighttime Light Imagery for Modeling the Regional Economy of China. Remote Sens. 2013, 5, 3057–3081. [Google Scholar] [CrossRef]
  23. Shi, K.; Huang, C.; Yu, B.; Yin, B.; Huang, Y.; Wu, J. Evaluation of NPP-VIIRS Night-Time Light Composite Data for Extracting Built-up Urban Areas. Remote Sens. Lett. 2014, 5, 358–366. [Google Scholar] [CrossRef]
  24. Lu, D.; Tian, H.; Zhou, G.; Ge, H. Regional Mapping of Human Settlements in Southeastern China with Multisensor Remotely Sensed Data. Remote Sens. Environ. 2008, 112, 3668–3679. [Google Scholar] [CrossRef]
  25. Zhang, Q.; Schaaf, C.; Seto, K.C. The Vegetation Adjusted NTL Urban Index: A New Approach to Reduce Saturation and Increase Variation in Nighttime Luminosity. Remote Sens. Environ. 2013, 129, 32–41. [Google Scholar] [CrossRef]
  26. Zhao, L.; Lee, X.; Smith, R.B.; Oleson, K. Strong Contributions of Local Background Climate to Urban Heat Islands. Nature 2014, 511, 216–219. [Google Scholar] [CrossRef] [PubMed]
  27. Zhang, X.; Li, P. A Temperature and Vegetation Adjusted NTL Urban Index for Urban Area Mapping and Analysis. ISPRS-J. Photogramm. Remote Sens. 2018, 135, 93–111. [Google Scholar] [CrossRef]
  28. Gao, Z.; Hou, Y.; Chen, W. Enhanced Sensitivity of the Urban Heat Island Effect to Summer Temperatures Induced by Urban Expansion. Environ. Res. Lett. 2019, 14, 094005. [Google Scholar] [CrossRef]
  29. Peng, S.; Piao, S.; Ciais, P.; Friedlingstein, P.; Ottle, C.; Bréon, F.-M.; Nan, H.; Zhou, L.; Myneni, R.B. Surface Urban Heat Island across 419 Global Big Cities. Environ. Sci. Technol. 2012, 46, 696–703. [Google Scholar] [CrossRef] [PubMed]
  30. Han, W.; Tao, Z.; Li, Z.; Cheng, M.; Fan, H.; Cribb, M.; Wang, Q. Effect of Urban Built-Up Area Expansion on the Urban Heat Islands in Different Seasons in 34 Metropolitan Regions across China. Remote Sens. 2023, 15, 248. [Google Scholar] [CrossRef]
  31. Li, F.; Yan, Q.; Bian, Z.; Liu, B.; Wu, Z. A POI and LST Adjusted NTL Urban Index for Urban Built-Up Area Extraction. Sensors 2020, 20, 2918. [Google Scholar] [CrossRef]
  32. Hao, R.; Yu, D.; Sun, Y.; Cao, Q.; Liu, Y.; Liu, Y. Integrating Multiple Source Data to Enhance Variation and Weaken the Blooming Effect of DMSP-OLS Light. Remote Sens. 2015, 7, 1422–1440. [Google Scholar] [CrossRef]
  33. Chang, D.; Wang, Q.; Xie, J.; Yang, J.; Xu, W. Research on the Extraction Method of Urban Built-UP Areas with an Improved Night Light Index. IEEE Geosci. Remote Sens. Lett. 2022, 19, 1–5. [Google Scholar] [CrossRef]
  34. Zhou, Q. Comparative Study of Approaches to Delineating Built-Up Areas Using Road Network Data. Trans. GIS 2015, 19, 848–876. [Google Scholar] [CrossRef]
  35. Jia, T.; Jiang, B. Measuring Urban Sprawl Based on Massive Street Nodes and the Novel Concept of Natural Cities. arXiv 2010, arXiv:1010.0541. [Google Scholar]
  36. Borruso, G. Network Density and the Delimitation of Urban Areas. Trans. GIS 2003, 7, 177–191. [Google Scholar] [CrossRef]
  37. Zhou, Q.; Guo, L. Empirical Approach to Threshold Determination for the Delineation of Built-up Areas with Road Network Data. PLoS ONE 2018, 13, e0194806. [Google Scholar] [CrossRef] [PubMed]
  38. Strano, E.; Nicosia, V.; Latora, V.; Porta, S.; Barthélemy, M. Elementary Processes Governing the Evolution of Road Networks. Sci. Rep. 2012, 2, 296. [Google Scholar] [CrossRef] [PubMed]
  39. Zheng, Y.; Tang, L.; Wang, H. An Improved Approach for Monitoring Urban Built-up Areas by Combining NPP-VIIRS Nighttime Light, NDVI, NDWI, and NDBI. J. Clean. Prod. 2021, 328, 129488. [Google Scholar] [CrossRef]
  40. Zhao, M.; Zhou, Y.; Li, X.; Zhou, C.; Cheng, W.; Li, M.; Huang, K. Building a Series of Consistent Night-Time Light Data (1992–2018) in Southeast Asia by Integrating DMSP-OLS and NPP-VIIRS. IEEE Trans. Geosci. Remote Sens. 2020, 58, 1843–1856. [Google Scholar] [CrossRef]
  41. Elvidge, C.D.; Zhizhin, M.; Ghosh, T.; Hsu, F.-C.; Taneja, J. Annual Time Series of Global VIIRS Nighttime Lights Derived from Monthly Averages: 2012 to 2019. Remote Sens. 2021, 13, 922. [Google Scholar] [CrossRef]
  42. Wang, Z.; Chen, S. Development of the Remote Sensing Datasets of the Annual Nighttime Light in China from 1992 to 2021. Master’s, Thesis, Jilin University, Changchun, China, 2022. [Google Scholar] [CrossRef]
  43. Fensholt, R.; Rasmussen, K.; Nielsen, T.T.; Mbow, C. Evaluation of Earth Observation Based Long Term Vegetation Trends—Intercomparing NDVI Time Series Trend Analysis Consistency of Sahel from AVHRR GIMMS, Terra MODIS and SPOT VGT Data. Remote Sens. Environ. 2009, 113, 1886–1898. [Google Scholar] [CrossRef]
  44. Ren, T.; Zhou, W.; Wang, J. Beyond Intensity of Urban Heat Island Effect: A Continental Scale Analysis on Land Surface Temperature in Major Chinese Cities. Sci. Total Environ. 2021, 791, 148334. [Google Scholar] [CrossRef]
  45. Moradi, M.; Roche, S.; Mostafavi, M.A. Exploring Five Indicators for the Quality of OpenStreetMap Road Networks: A Case Study of Québec, Canada. Geomatica 2021, 75, 178–208. [Google Scholar] [CrossRef]
  46. Li, J.; Song, C.; Cao, L.; Zhu, F.; Meng, X.; Wu, J. Impacts of Landscape Structure on Surface Urban Heat Islands: A Case Study of Shanghai, China. Remote Sens. Environ. 2011, 115, 3249–3263. [Google Scholar] [CrossRef]
  47. Zheng, Y.; Zhou, Q.; He, Y.; Wang, C.; Wang, X.; Wang, H.; Ghosh, T. An Optimized Approach for Extracting Urban Land Based on Log-Transformed DMSP-OLS Nighttime Light, NDVI, and NDWI. Remote Sens. 2021, 13, 766. [Google Scholar] [CrossRef]
  48. Zhao, M.; Cheng, C.; Zhou, Y.; Li, X.; Shen, S.; Song, C. A Global Dataset of Annual Urban Extents (1992–2020) from Harmonized Nighttime Lights. Earth Syst. Sci. Data 2022, 14, 517–534. [Google Scholar] [CrossRef]
  49. Henderson, M.; Yeh, E.T.; Gong, P.; Elvidge, C.; Baugh, K. Validation of Urban Boundaries Derived from Global Night-Time Satellite Imagery. Int. J. Remote Sens. 2003, 24, 595–609. [Google Scholar] [CrossRef]
  50. Chen, Z.; Yu, B.; Song, W.; Liu, H.; Wu, Q.; Shi, K.; Wu, J. A New Approach for Detecting Urban Centers and Their Spatial Structure with Nighttime Light Remote Sensing. IEEE Trans. Geosci. Remote Sens. 2017, 55, 6305–6319. [Google Scholar] [CrossRef]
  51. Kii, M.; Tamaki, T.; Suzuki, T.; Nonomura, A. Estimating Urban Spatial Structure Based on Remote Sensing Data. Sci. Rep. 2023, 13, 8804. [Google Scholar] [CrossRef]
  52. Liu, X.; Hu, G.; Ai, B.; Li, X.; Shi, Q. A Normalized Urban Areas Composite Index (NUACI) Based on Combination of DMSP-OLS and MODIS for Mapping Impervious Surface Area. Remote Sens. 2015, 7, 17168–17189. [Google Scholar] [CrossRef]
  53. Li, F.; Liu, X.; Liao, S.; Jia, P. The Modified Normalized Urban Area Composite Index: A Satelliate-Derived High-Resolution Index for Extracting Urban Areas. Remote Sens. 2021, 13, 2350. [Google Scholar] [CrossRef]
  54. آذین نوروزی; الدوز نوروزی کاربرد الگوریتم پنجرة مجزا در شناسایی جزایر حرارتی شهرستان یزد: Application of Split-Window Algorithm to Study Urban Heat Island in Yazd County. Water Soil Manag. Model. Mudil Sazī Va Mudīriyyat-I Āb Va Khāk 2023, 3, 115–129. [CrossRef]
  55. Wang, M.; Song, Y.; Wang, F.; Meng, Z. Boundary Extraction of Urban Built-Up Area Based on Luminance Value Correction of NTL Image. IEEE J. Sel. Top. Appl. Earth Obs. Remote Sens. 2021, 14, 7466–7477. [Google Scholar] [CrossRef]
  56. Zhou, B.; Rybski, D.; Kropp, J.P. The Role of City Size and Urban Form in the Surface Urban Heat Island. Sci. Rep. 2017, 7, 4791. [Google Scholar] [CrossRef] [PubMed]
  57. Oke, T.R. City Size and the Urban Heat Island. Atmos. Environ. 1973, 7, 769–779. [Google Scholar] [CrossRef]
  58. Peng, J.; Liu, Q.; Xu, Z.; Lyu, D.; Du, Y.; Qiao, R.; Wu, J. How to Effectively Mitigate Urban Heat Island Effect? A Perspective of Waterbody Patch Size Threshold. Landsc. Urban Plan. 2020, 202, 103873. [Google Scholar] [CrossRef]
  59. Chen, H.; Jeanne Huang, J.; Li, H.; Wei, Y.; Zhu, X. Revealing the Response of Urban Heat Island Effect to Water Body Evaporation from Main Urban and Suburb Areas. J. Hydrol. 2023, 623, 129687. [Google Scholar] [CrossRef]
  60. Ghosh, S.; Das, A. Modelling Urban Cooling Island Impact of Green Space and Water Bodies on Surface Urban Heat Island in a Continuously Developing Urban Area. Model. Earth Syst. Environ. 2018, 4, 501–515. [Google Scholar] [CrossRef]
Figure 1. The geographical location of the study areas in China.
Ijgi 13 00021 g001
Figure 2. The flow chart of VNRT index.
Ijgi 13 00021 g002
Figure 3. Spatial distribution of VNRT index in four central cities in China.
Ijgi 13 00021 g003
Figure 4. NPP-VIIRS NTL data in four central cities in China of 2019.
Ijgi 13 00021 g004
Figure 5. Analysis of sectional transect in Shuangliu Airport.
Ijgi 13 00021 g005
Figure 6. Analysis of sectional transect in the Daminggong city park.
Ijgi 13 00021 g006
Figure 7. Analysis of sectional transect in Wuhan.
Ijgi 13 00021 g007
Figure 8. Analysis of sectional transect in Longhu Lake.
Ijgi 13 00021 g008
Figure 9. Urban built-up area spatial extent extracted using local–optimum thresholding method.
Ijgi 13 00021 g009
Figure 10. Urban built-up area extracted by VNRT and the distribution of validation points.
Ijgi 13 00021 g010
Table 1. Extracted thresholds HSI, VANUI and VNRT for built-up areas in four central cities.
CityStatistical Data (km2)Extraction Threshold (q)
HSIVANUIVNRT
Chengdu1111.590.140.090.05
Wuhan812.390.180.060.06
Xi’an700.690.140.110.07
Zhengzhou750.860.120.050.05
Table 2. Comparative validation of built-up area extraction accuracy for HSI, VANUI, and VNRT.
CityIndexAccuracyF1-ScoreKappaOA (%)
ChengduHSI0.890.800.6685.70
VANUI0.930.870.7690.02
VNRT0.970.950.8694.24
WuhanHSI0.790.480.4274.26
VANUI0.910.780.6386.67
VNRT0.960.890.7590.95
Xi’anHSI0.900.860.7286.97
VANUI0.930.890.7886.41
VNRT0.970.960.8793.96
ZhengzhouHSI0.880.700.4578.24
VANUI0.940.840.6084.35
VNRT0.980.940.7088.29
Disclaimer/Publisher’s Note: The statements, opinions and data contained in all publications are solely those of the individual author(s) and contributor(s) and not of MDPI and/or the editor(s). MDPI and/or the editor(s) disclaim responsibility for any injury to people or property resulting from any ideas, methods, instructions or products referred to in the content.

