

The Patterns and Mechanisms of Residential Mobility in Nanjing, China: Insights from the Mantel Test

Abstract
1. Introduction
2. Materials and Methods
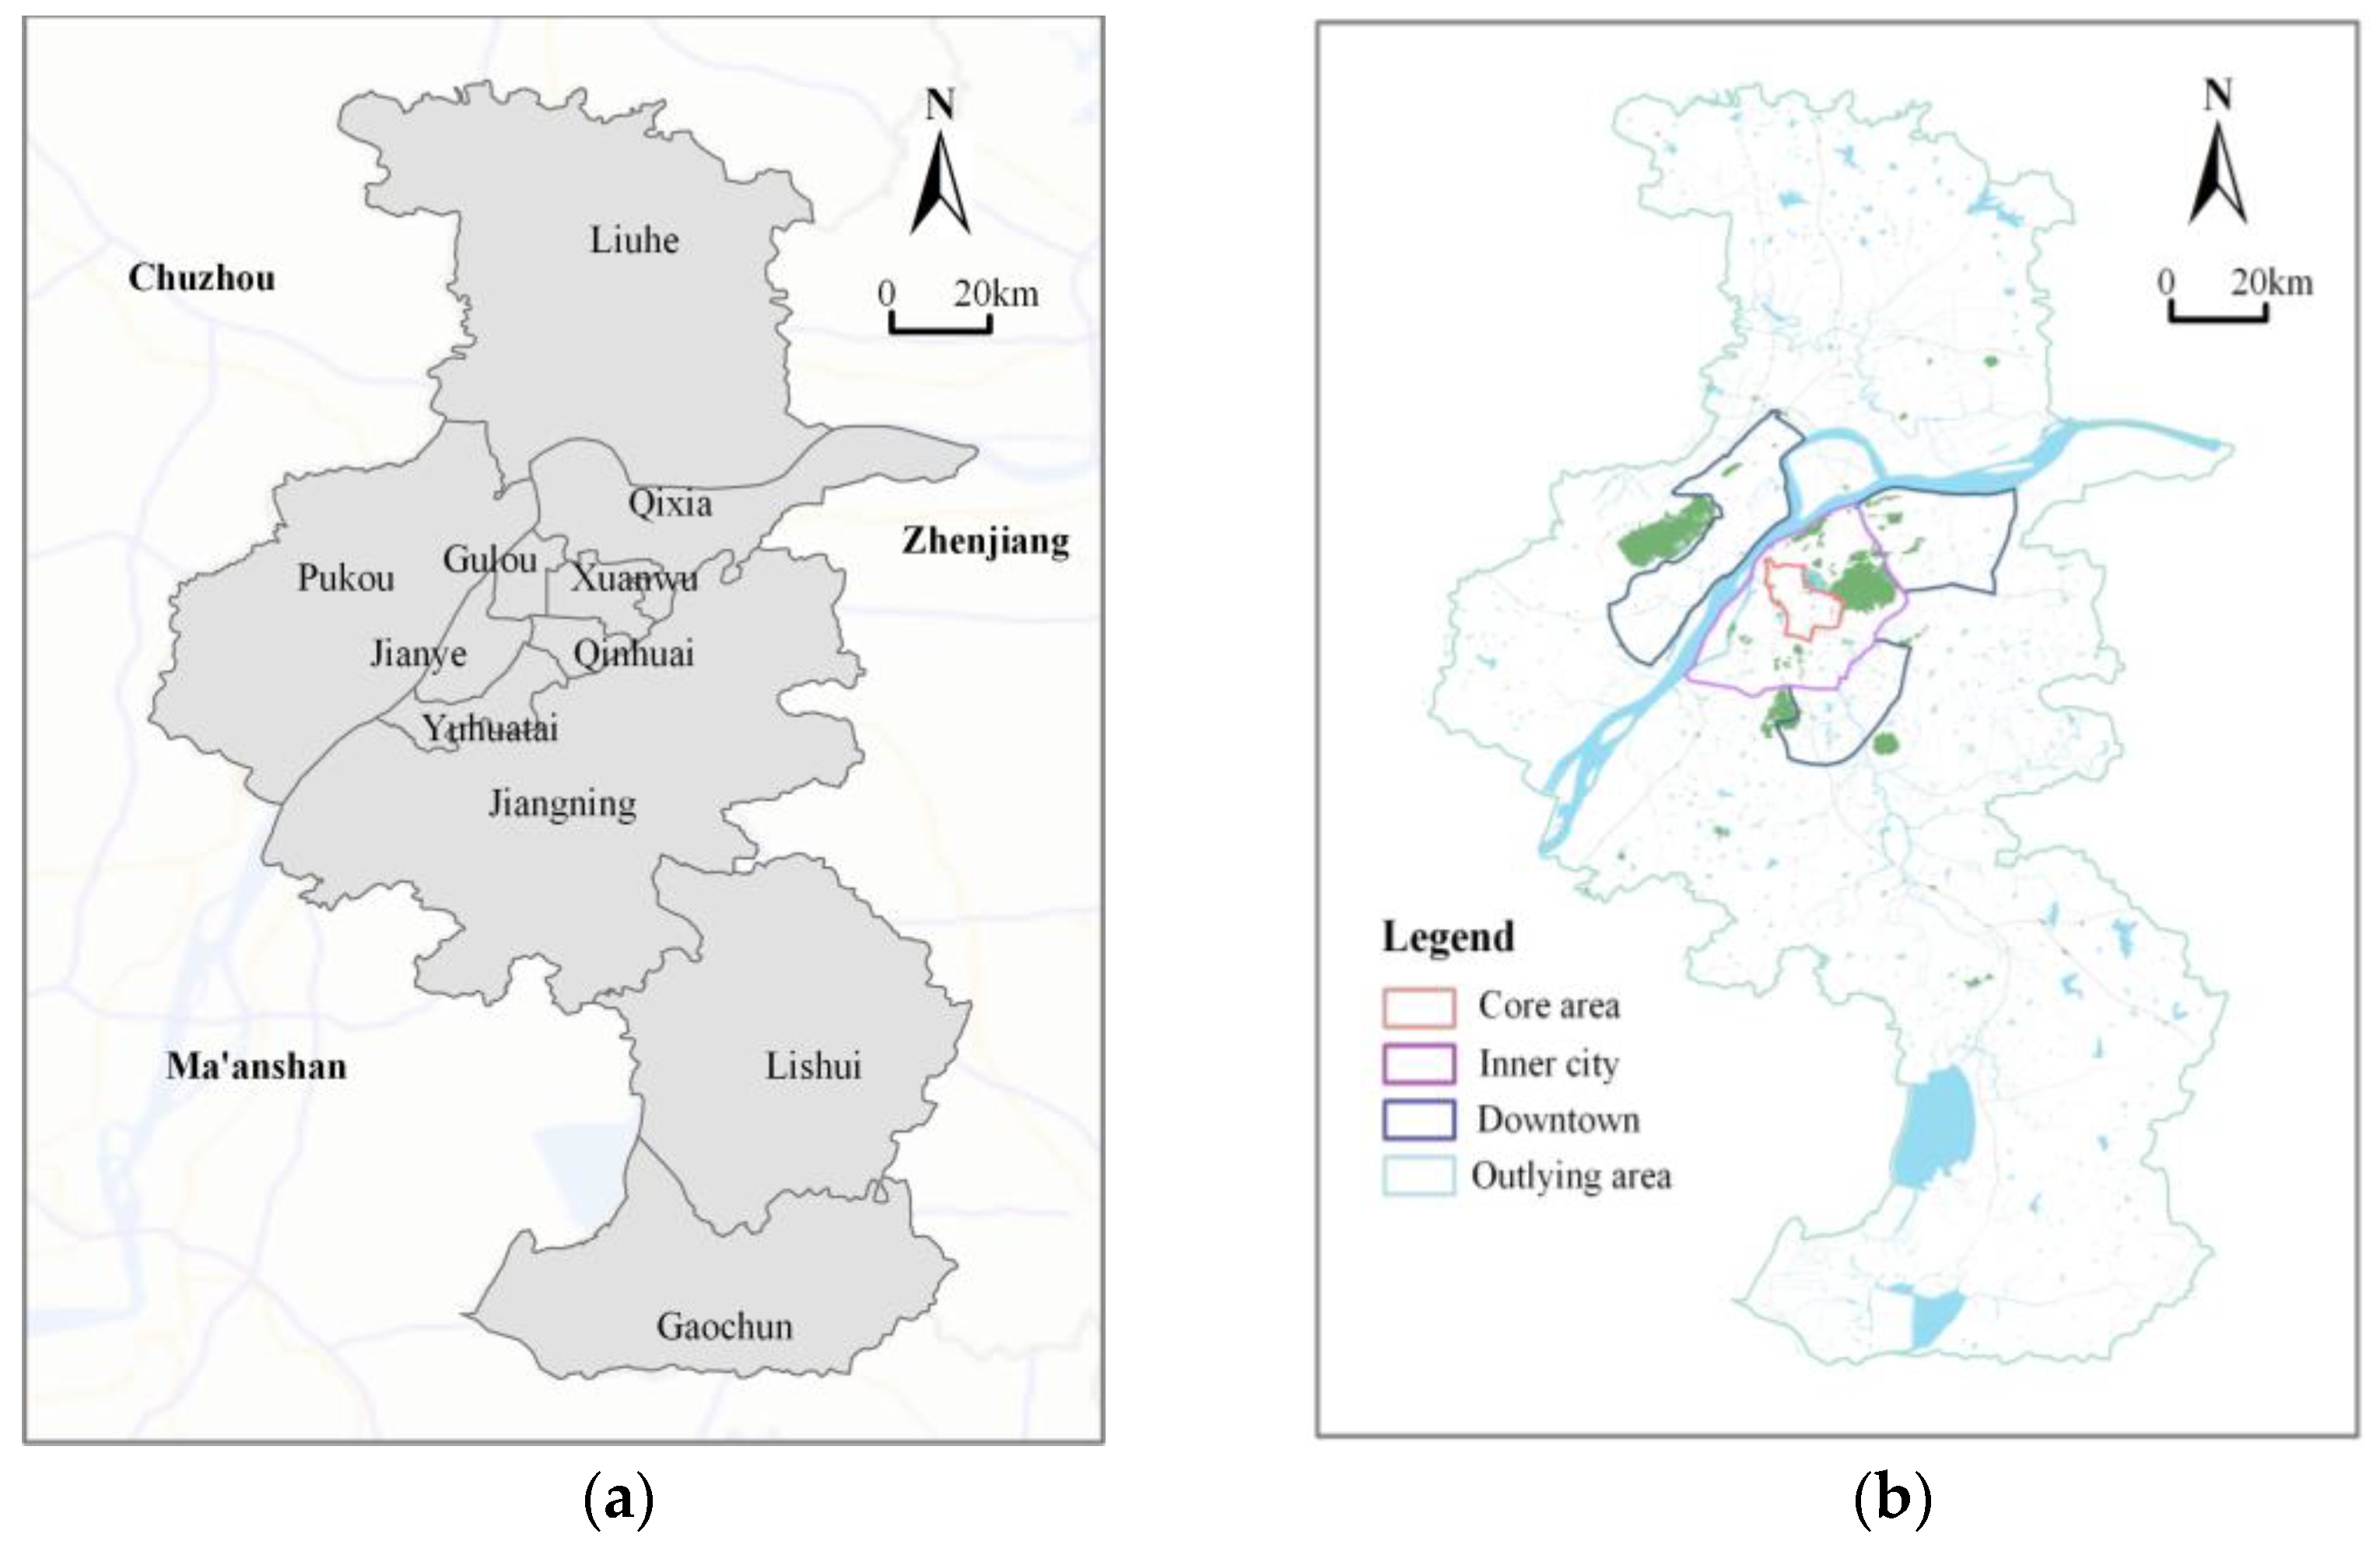
2.1. Research Area and Data
2.2. Methods
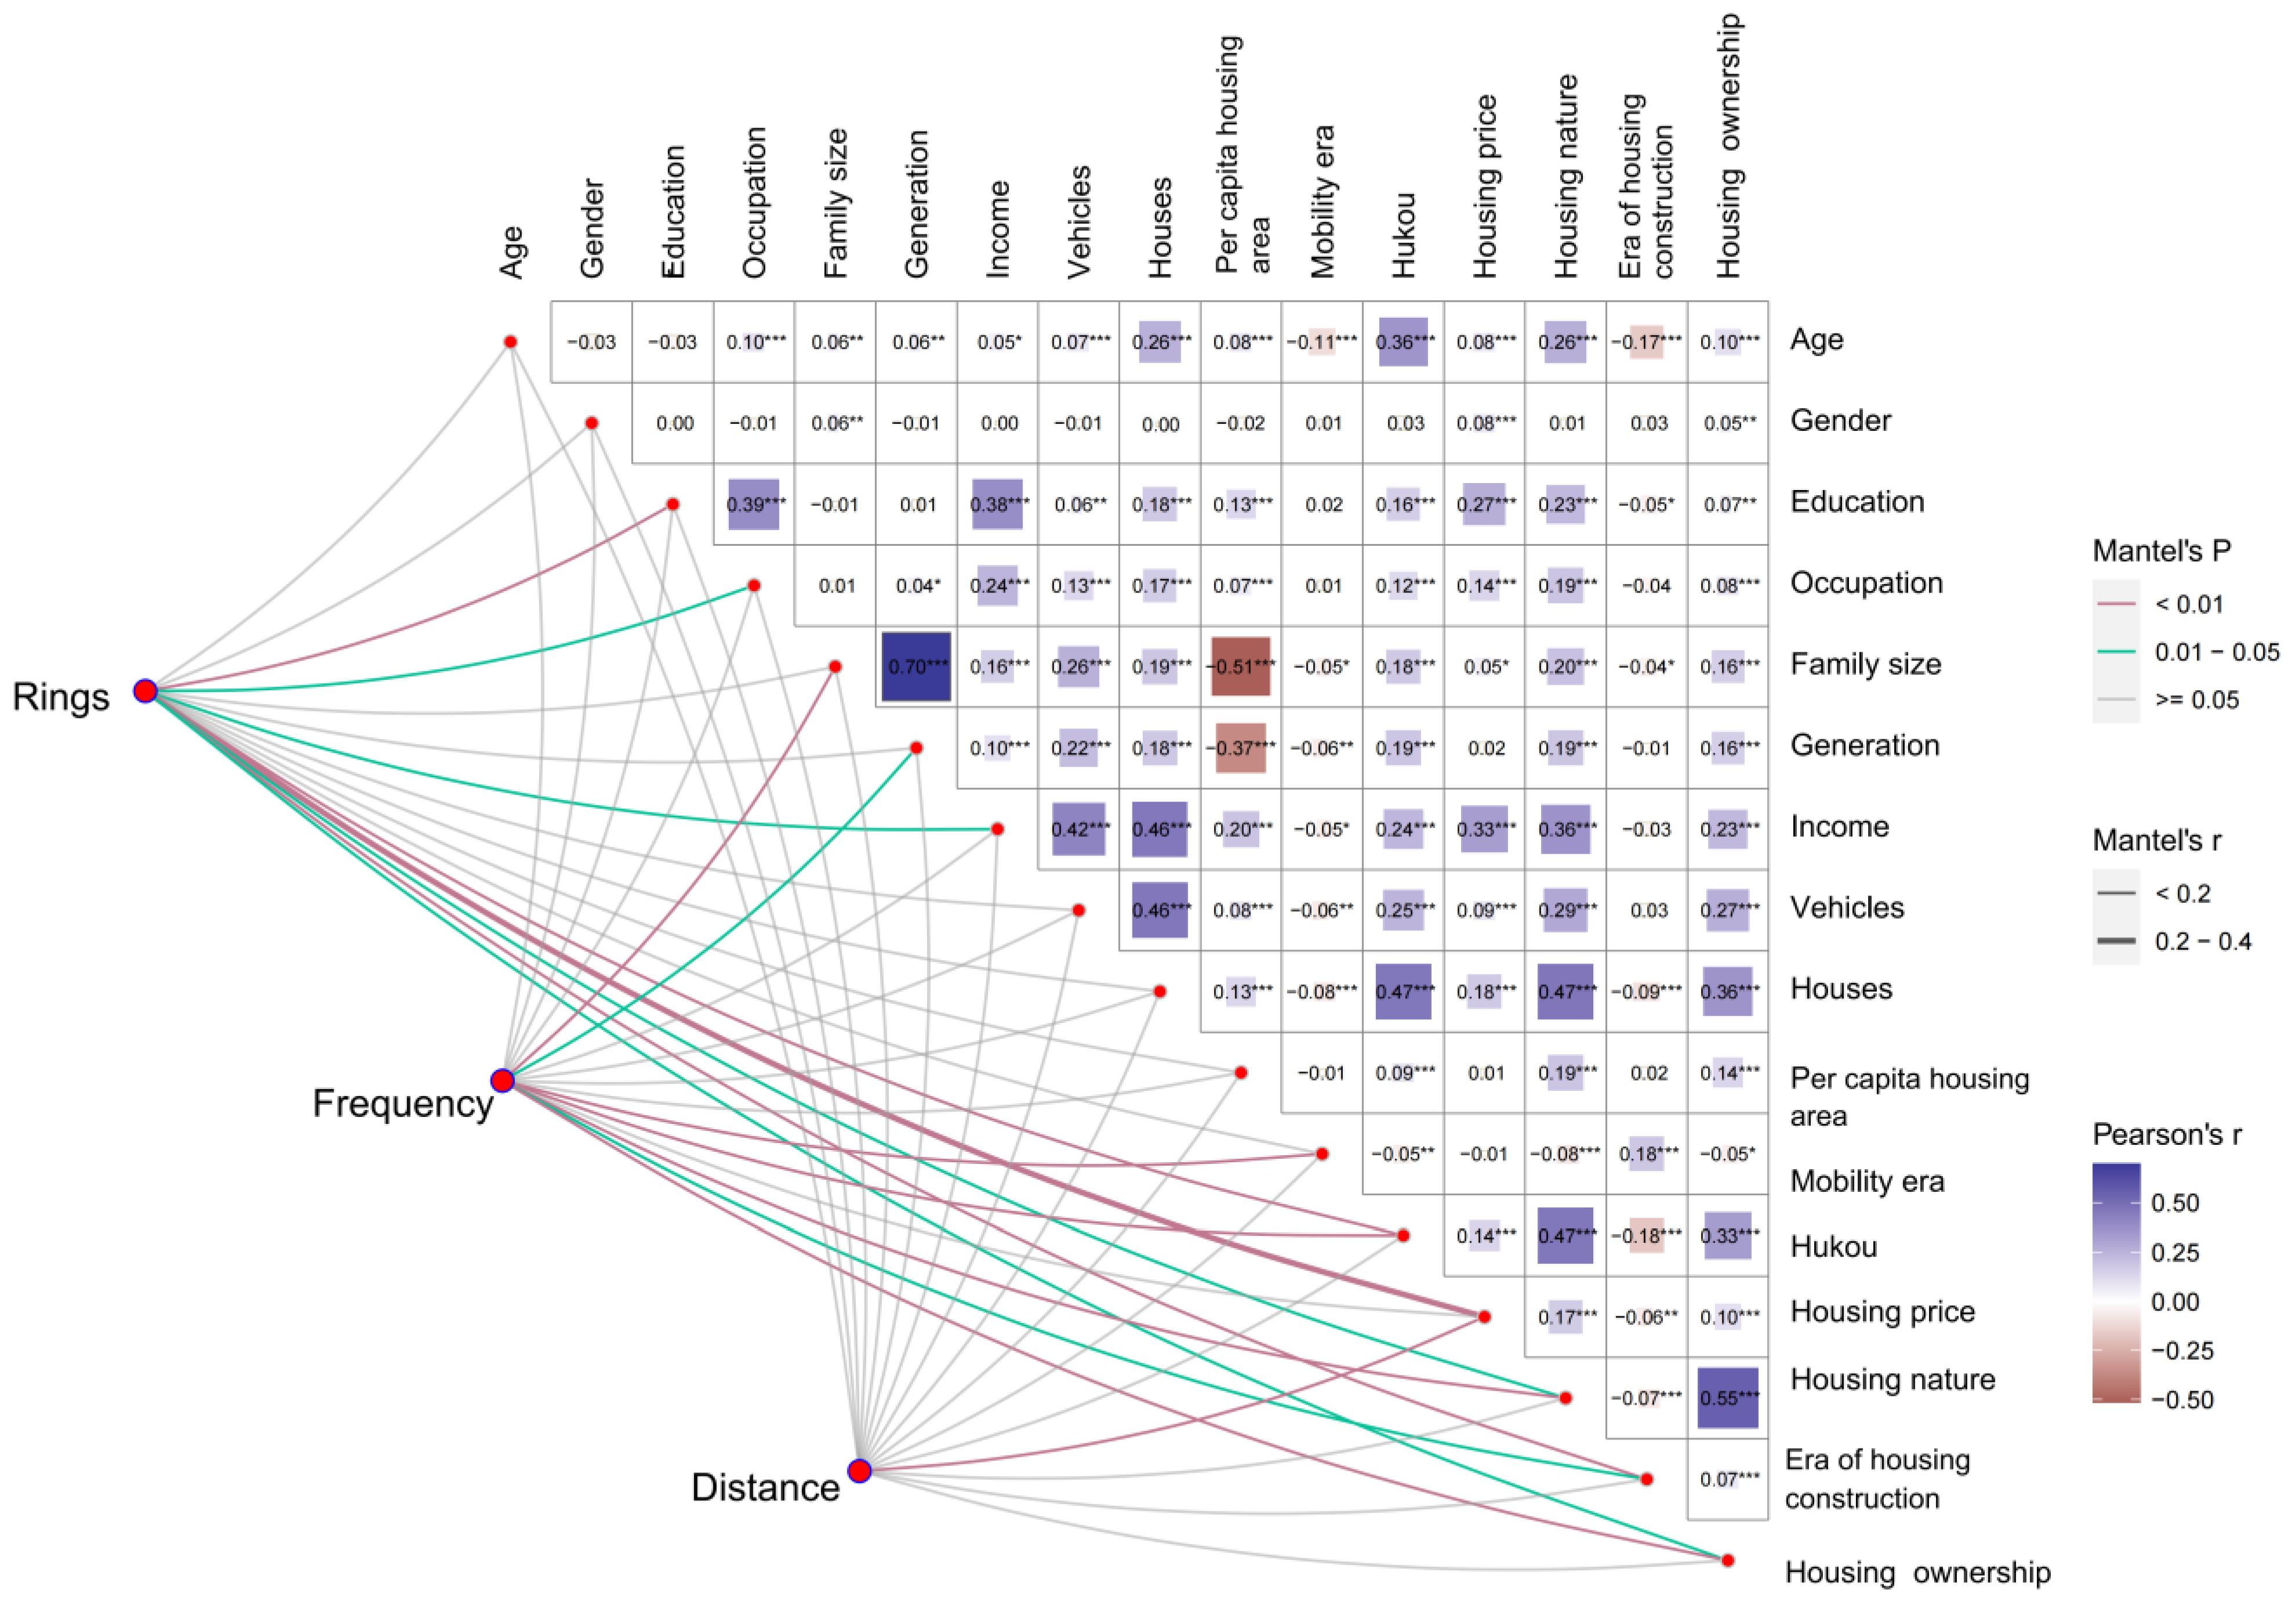
2.2.1. Mantel Test
2.2.2. Multinomial Logistic Regression Model
3. Spatial and Temporal Characteristics of Nanjing Residents’ Mobility
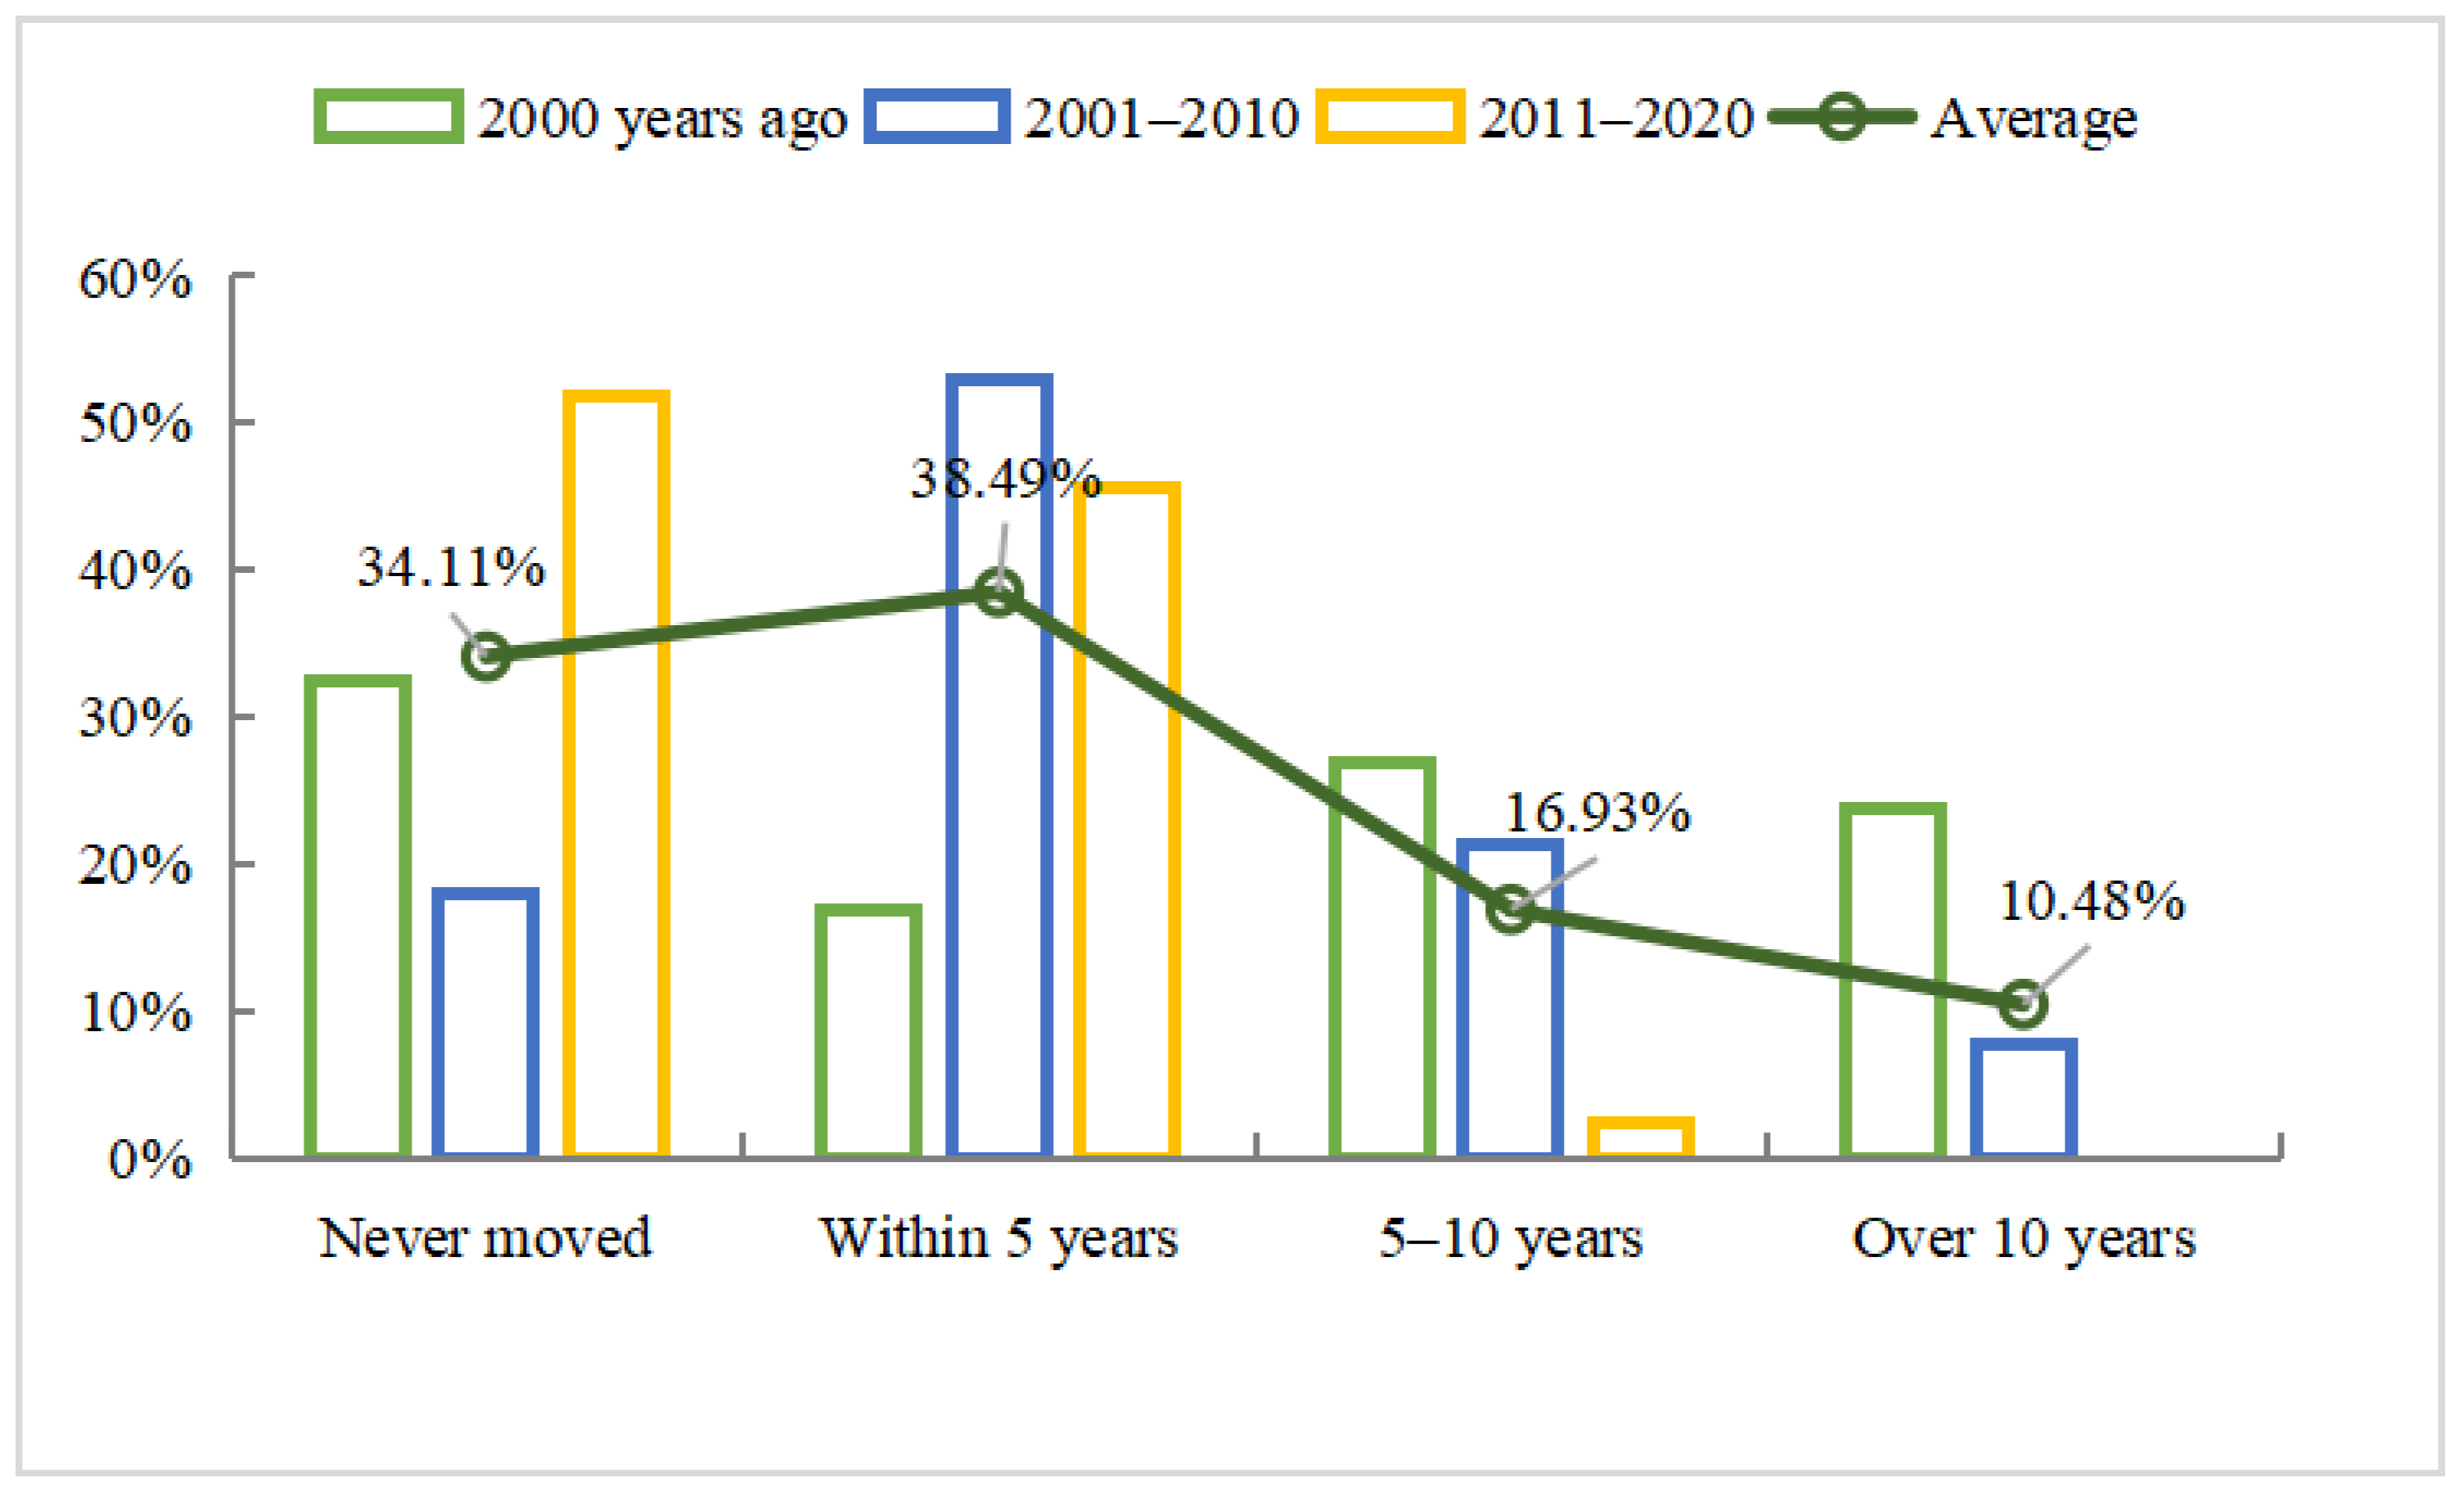
3.1. Frequency of Mobility
3.2. Mobility Distance
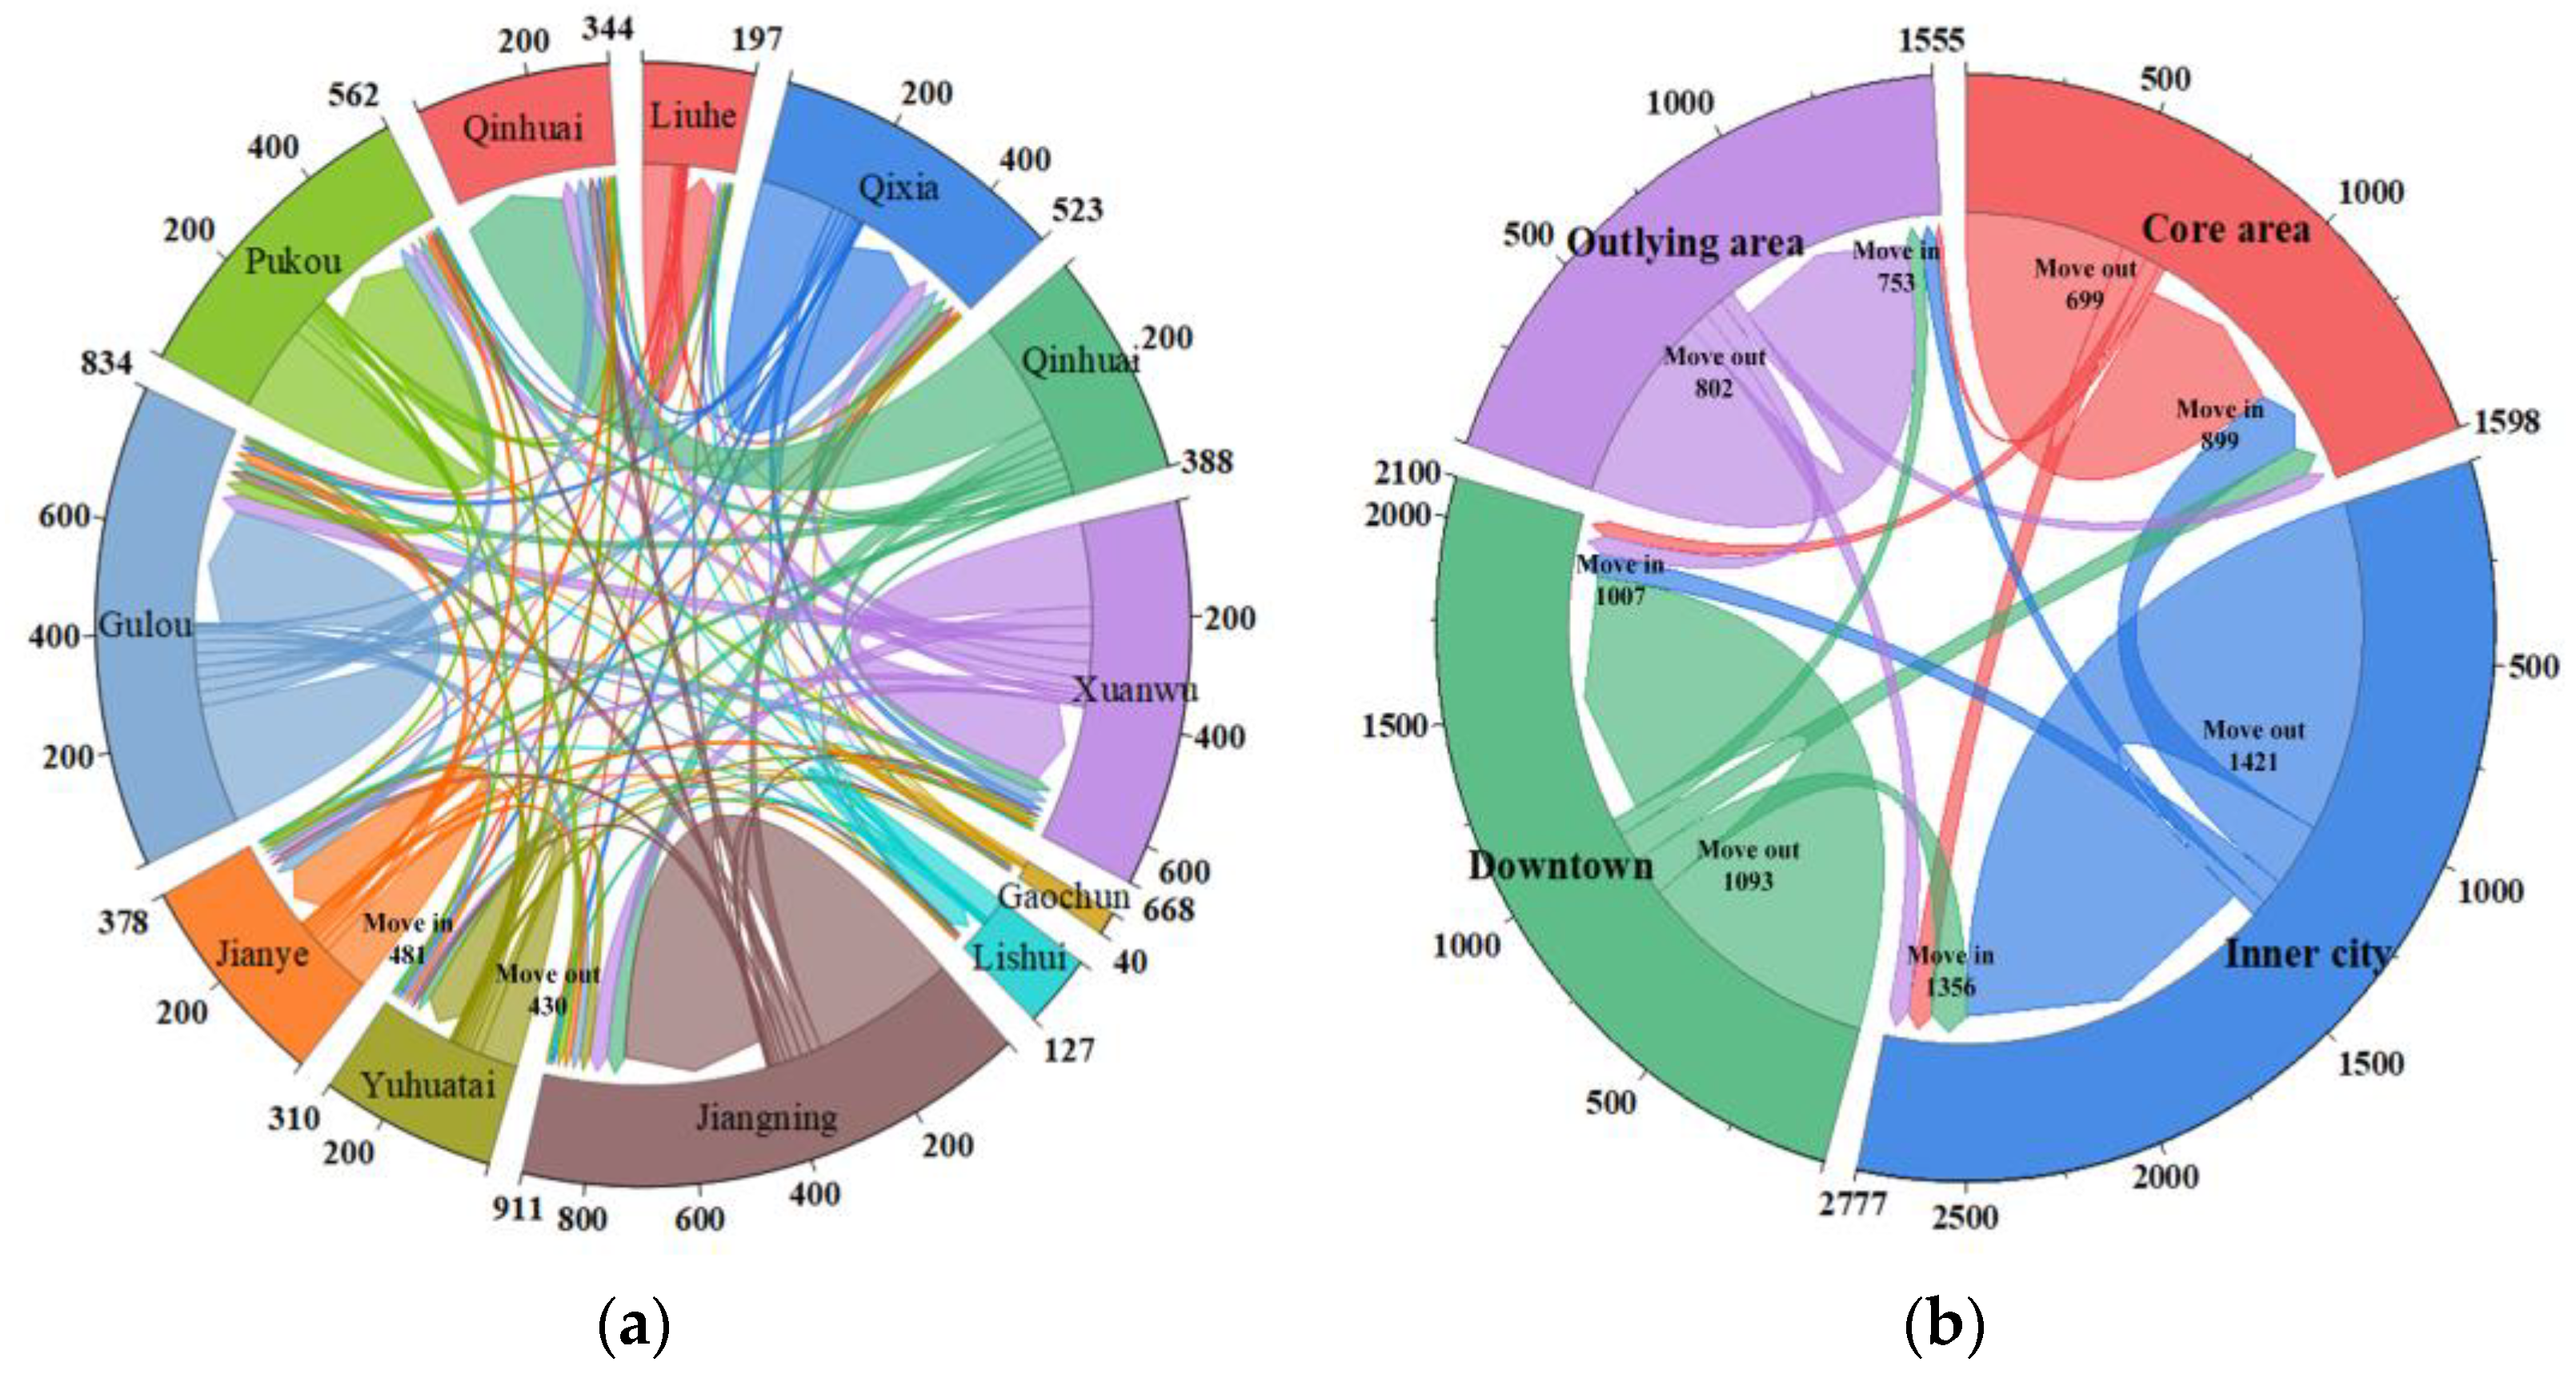
3.3. Mobility Direction
4. The Patterns and Mechanisms of Residential Mobility
4.1. Spatial Changes in Mobility
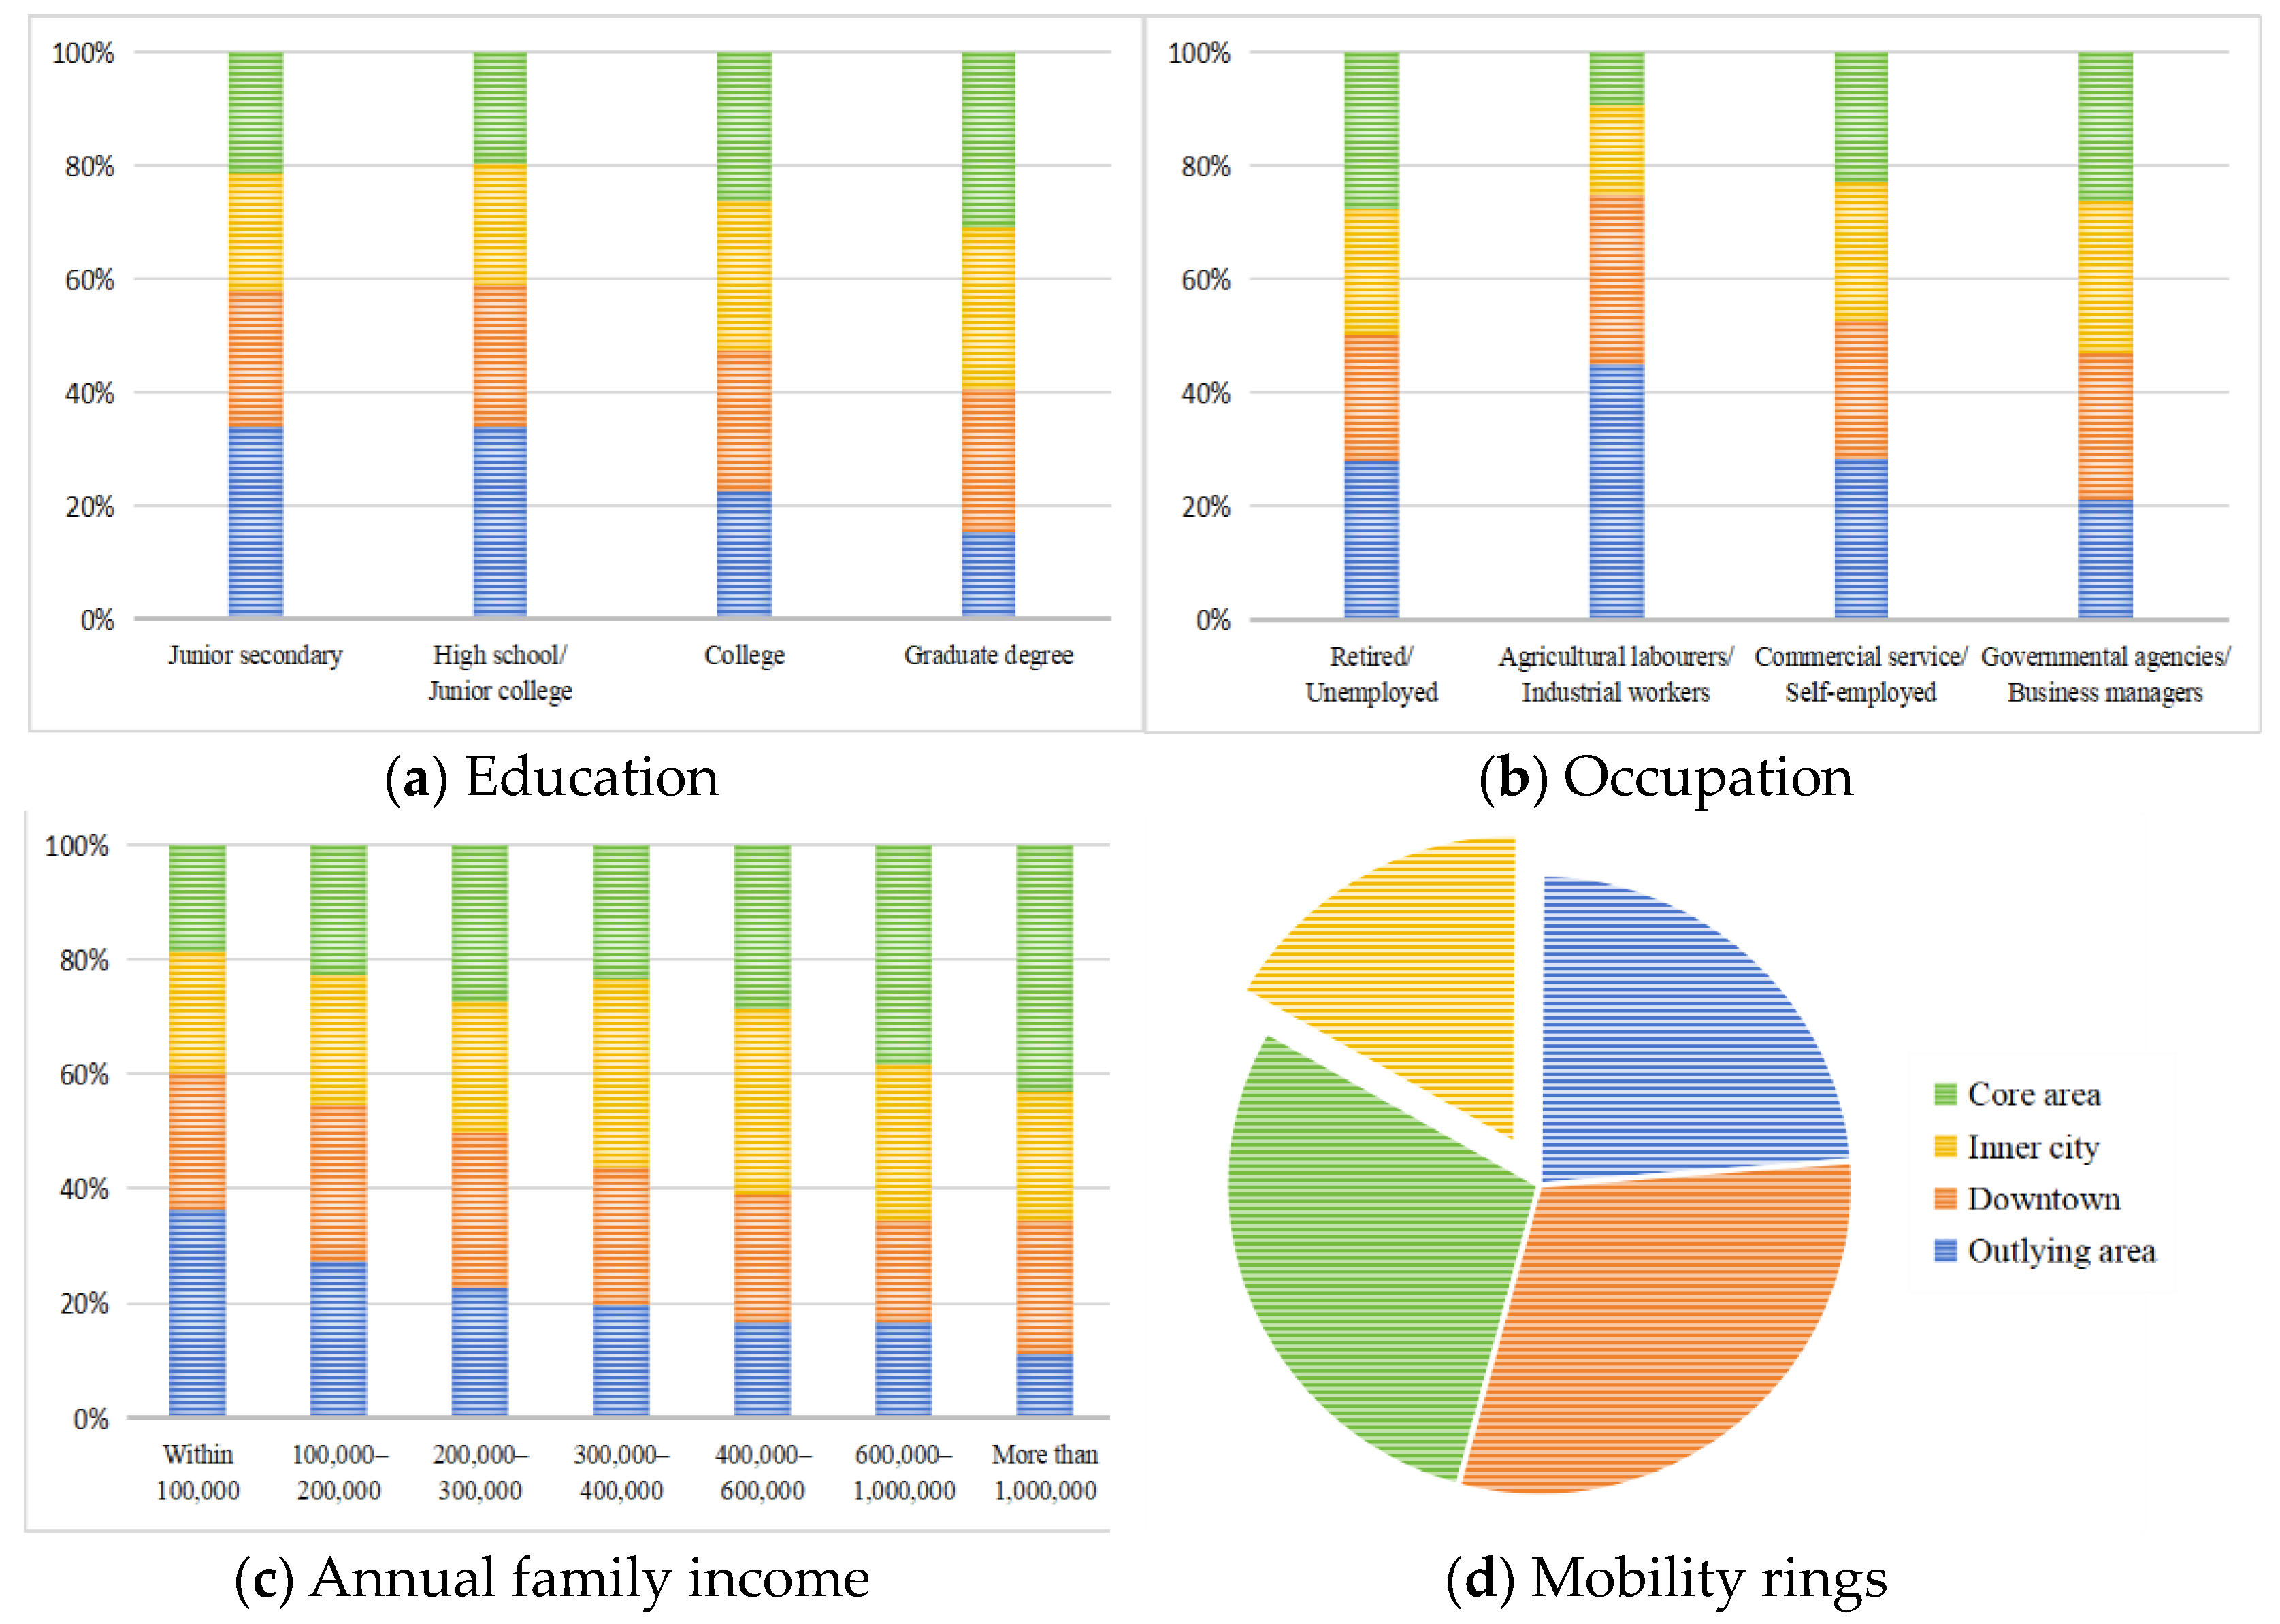
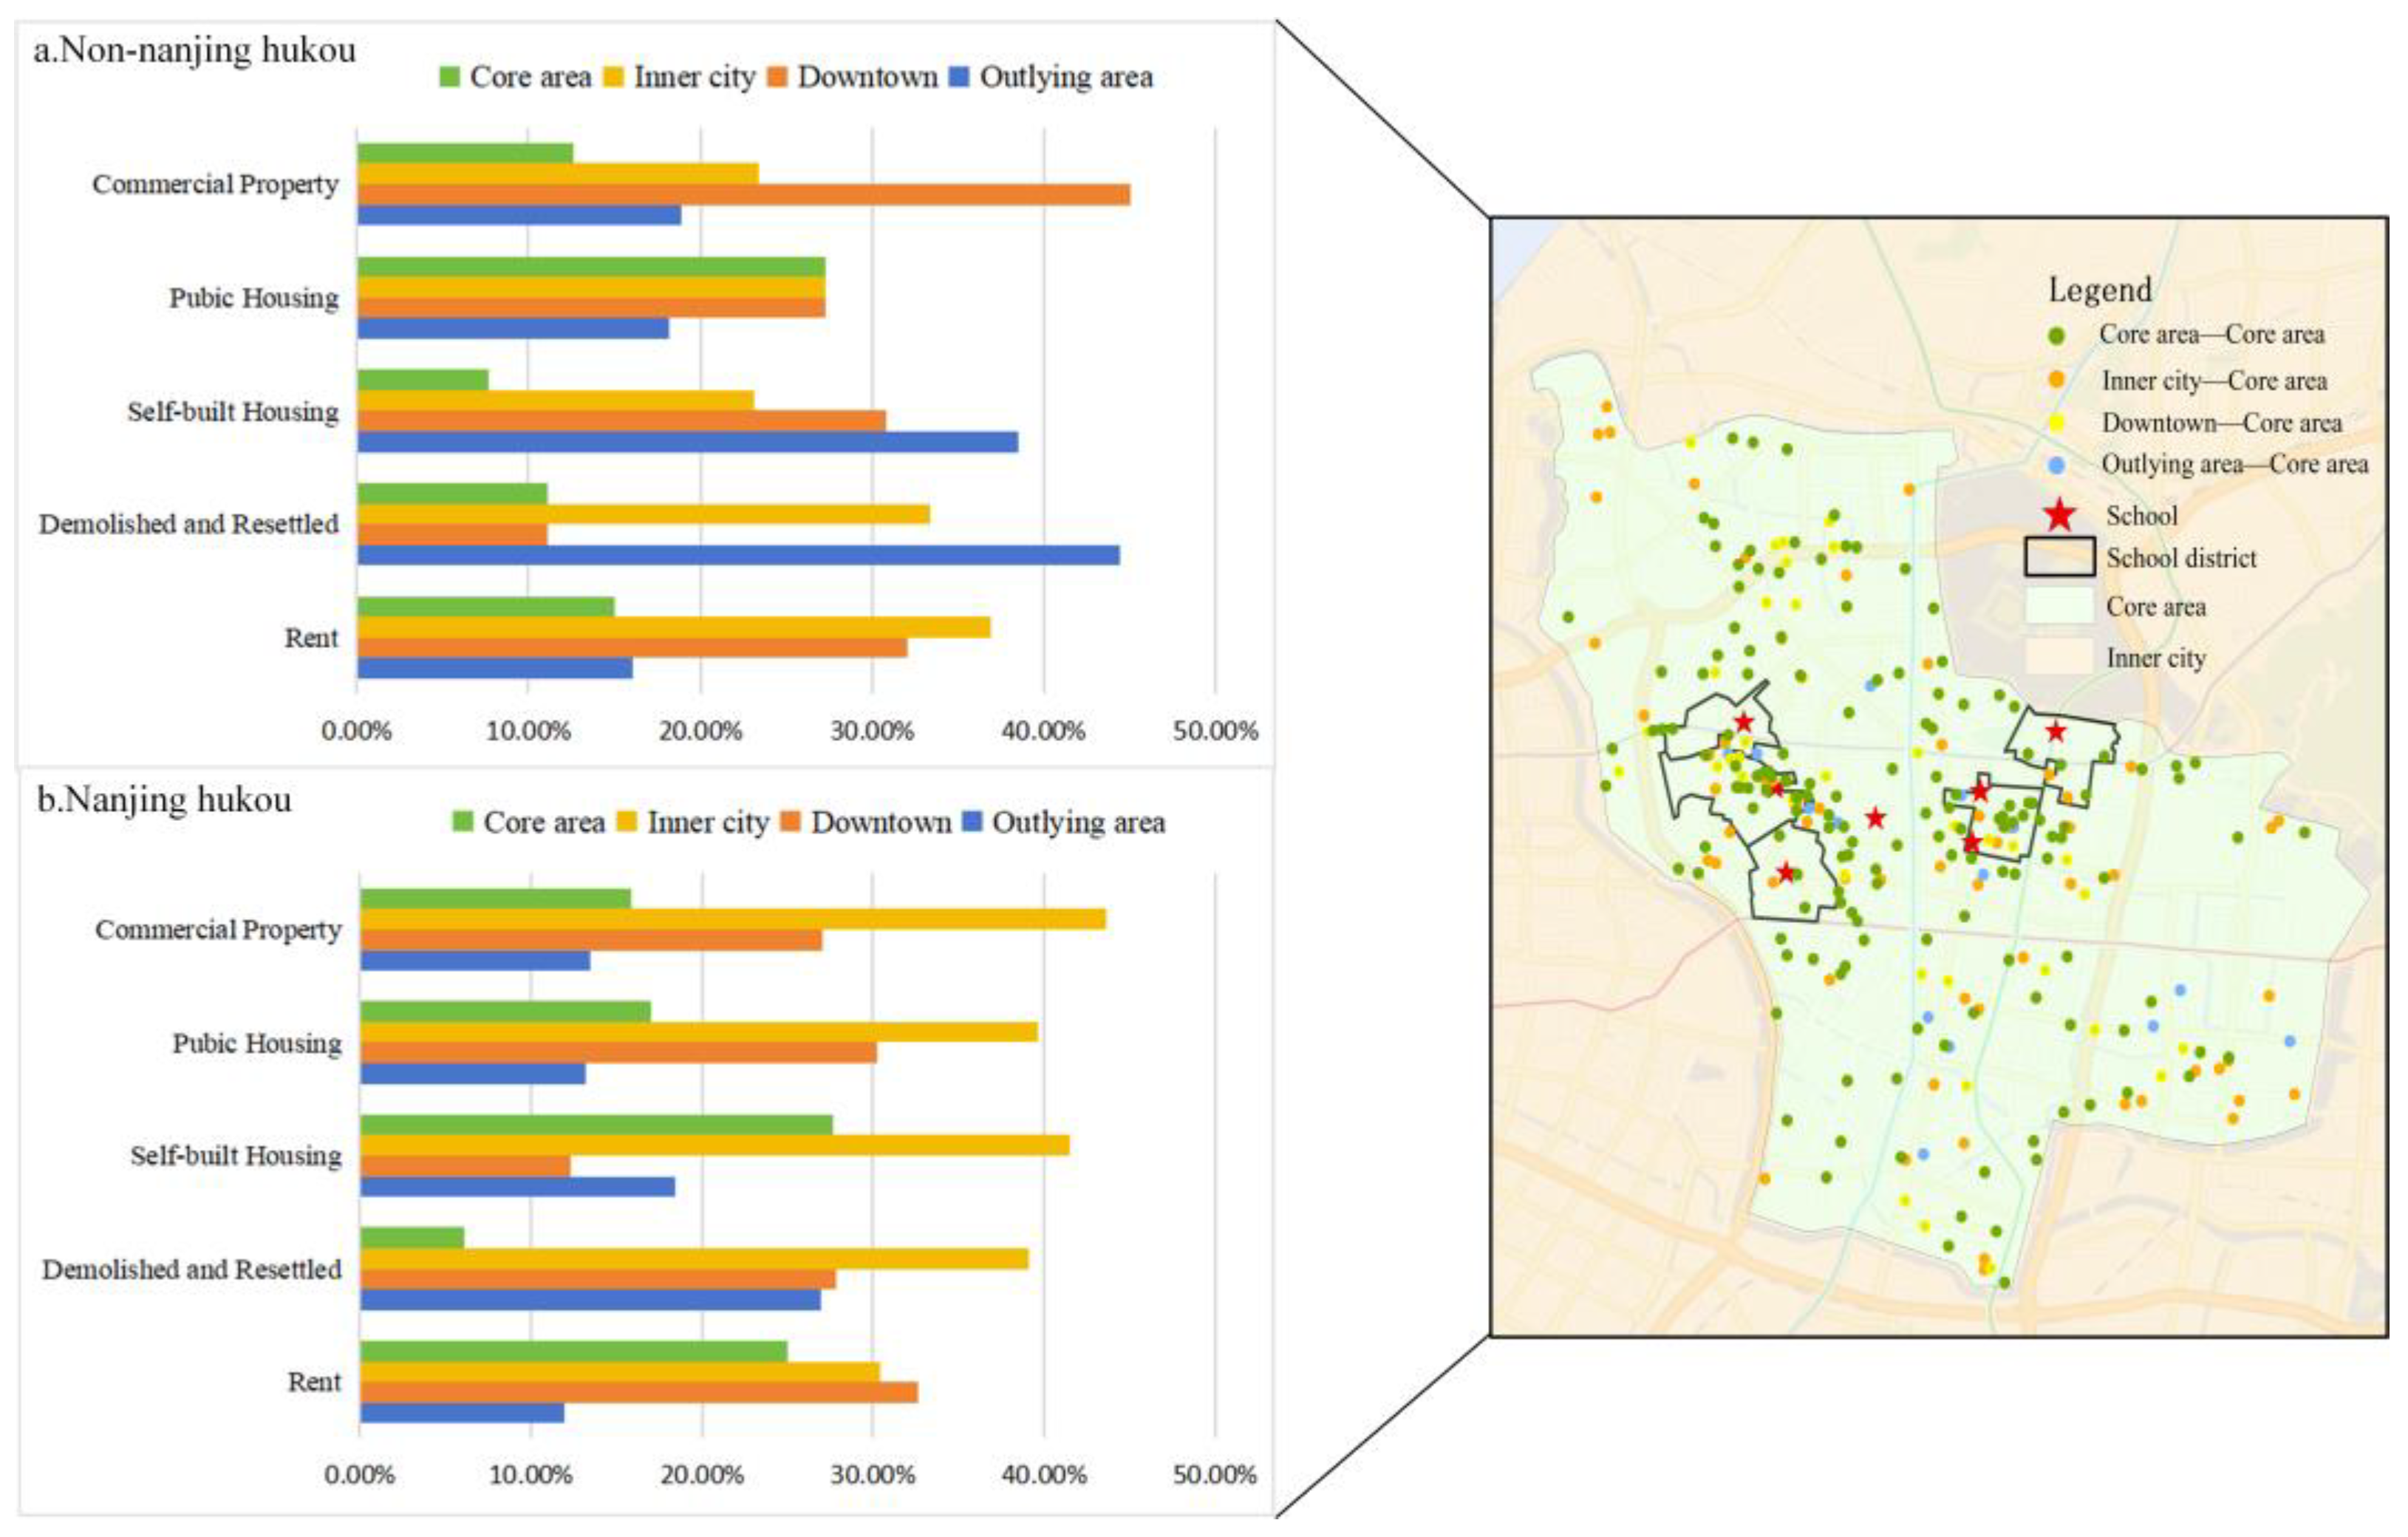
4.1.1. Mobility Rings: Social Differentiation Manifested in Urban Zones
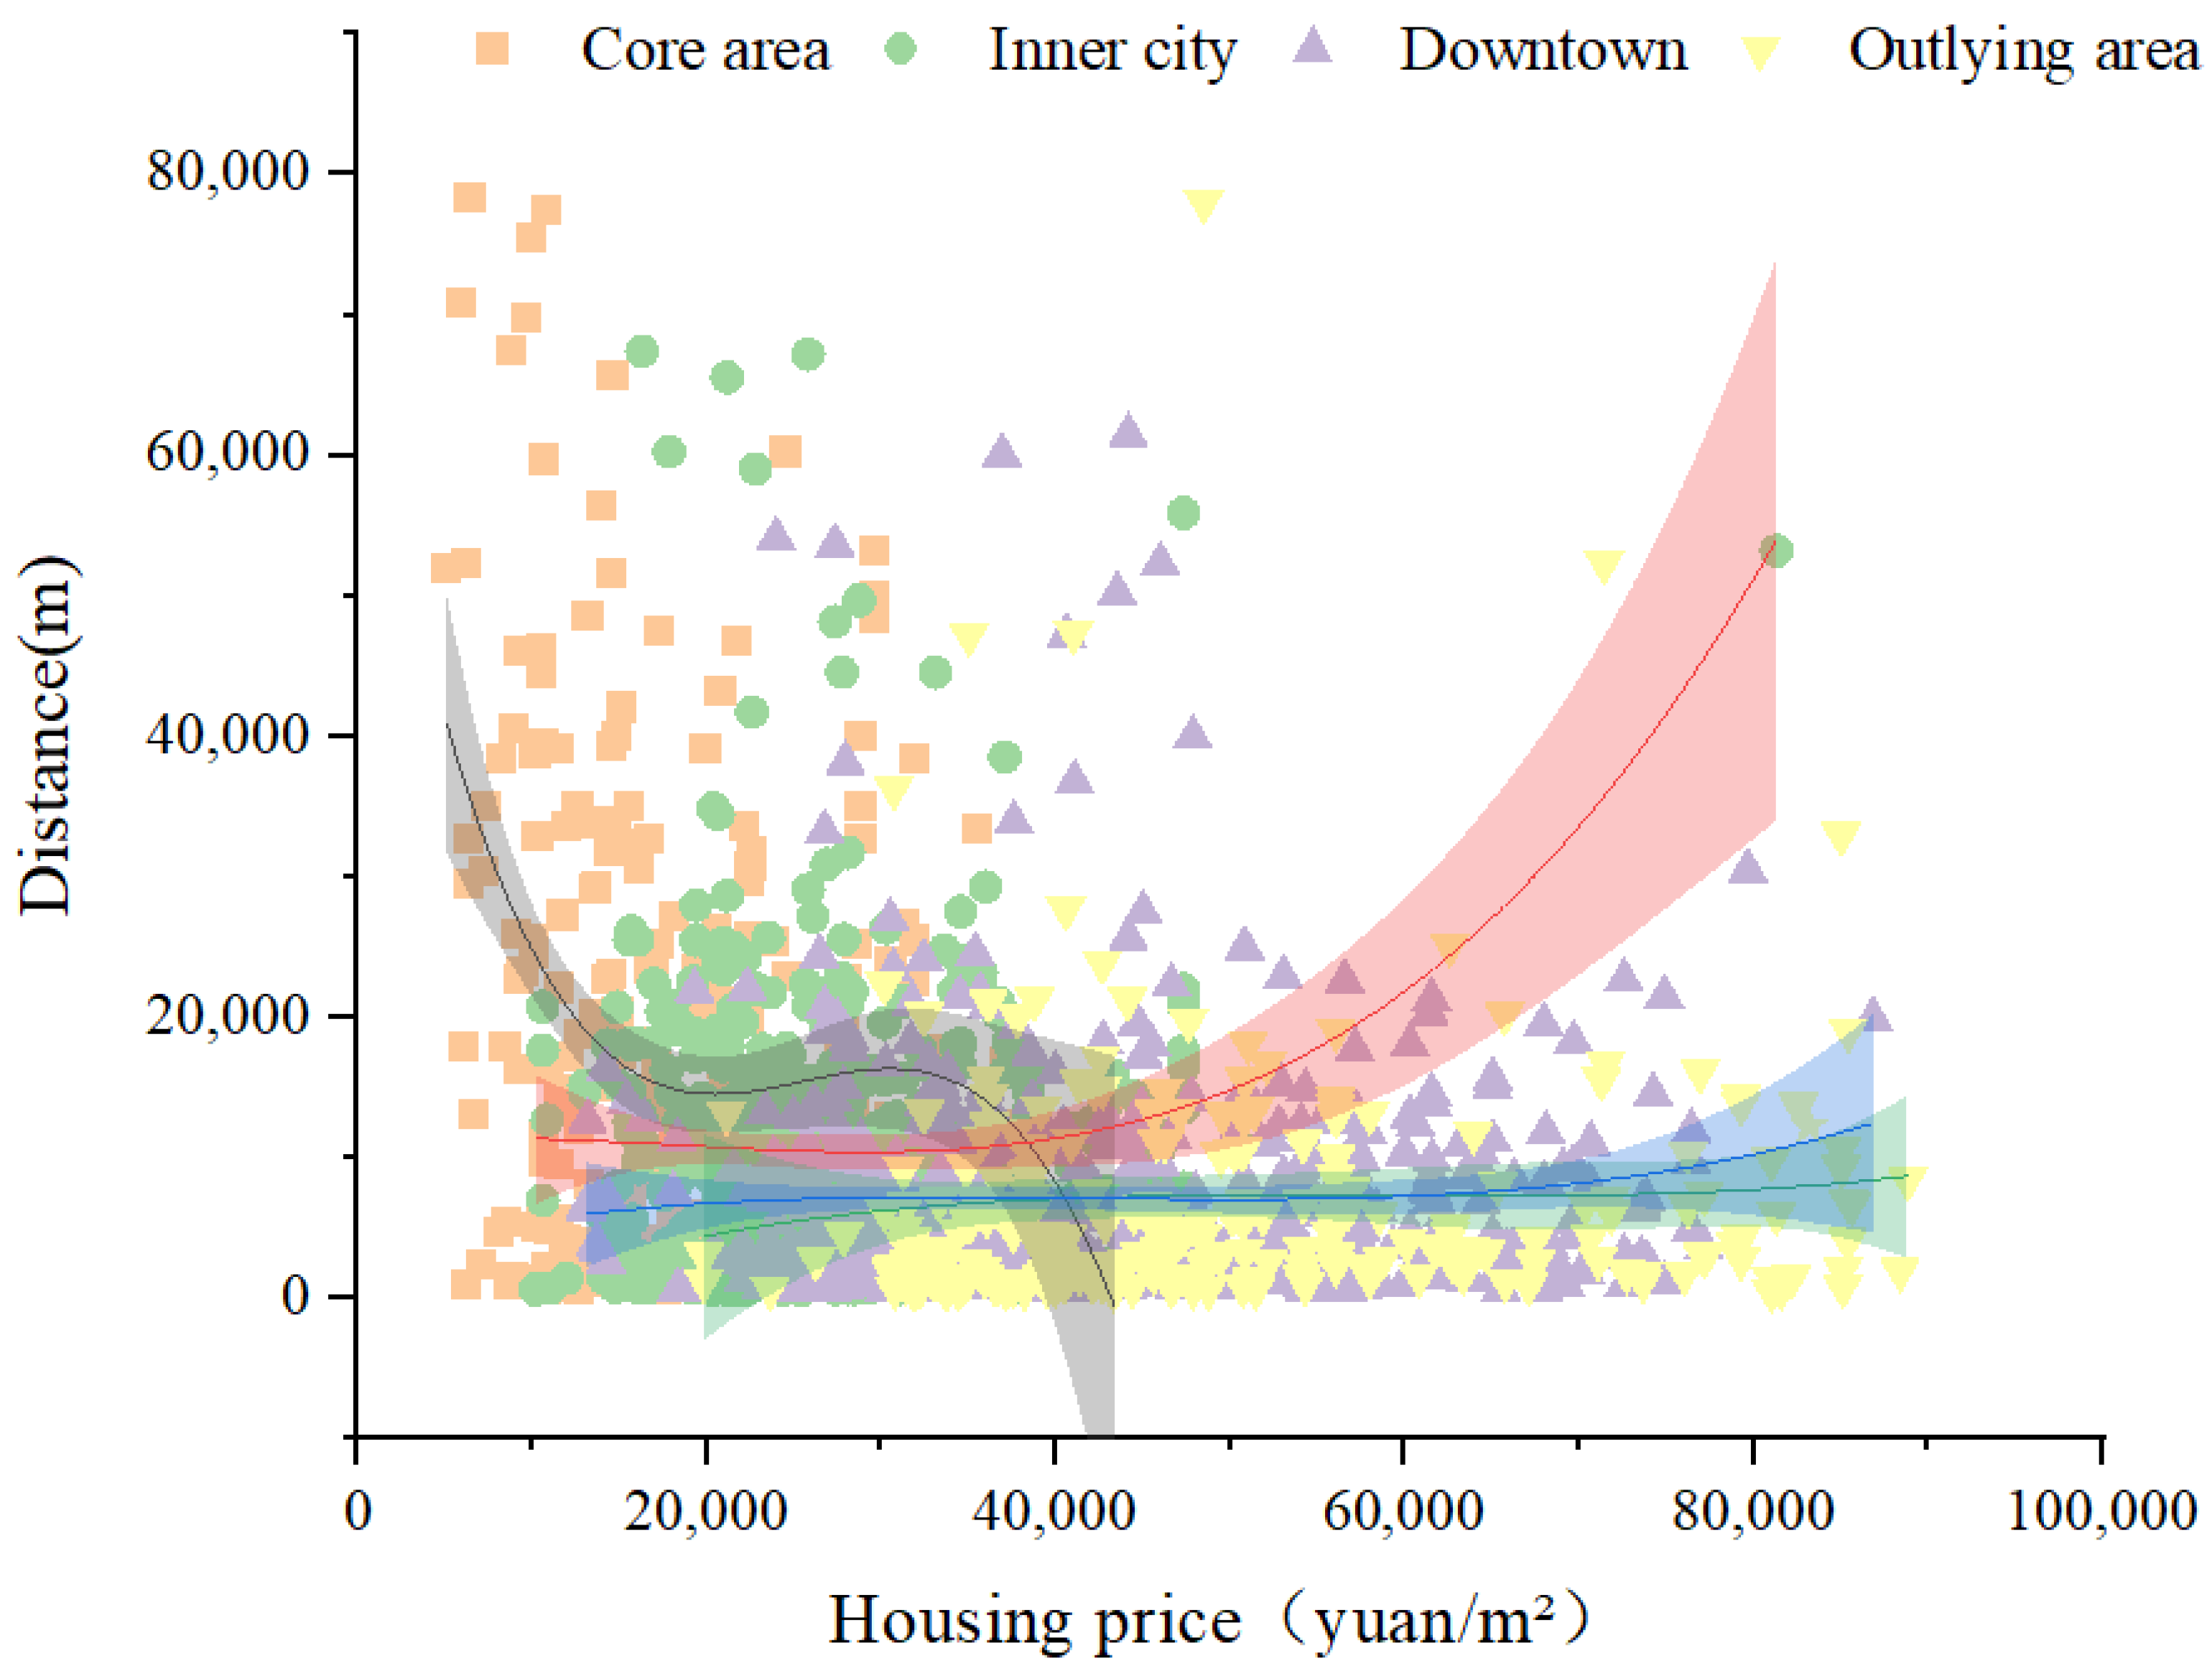
4.1.2. Mobility Distance: Housing Search Driven by House Prices
4.1.3. Mobility Frequency: Dynamics of Housing Careers
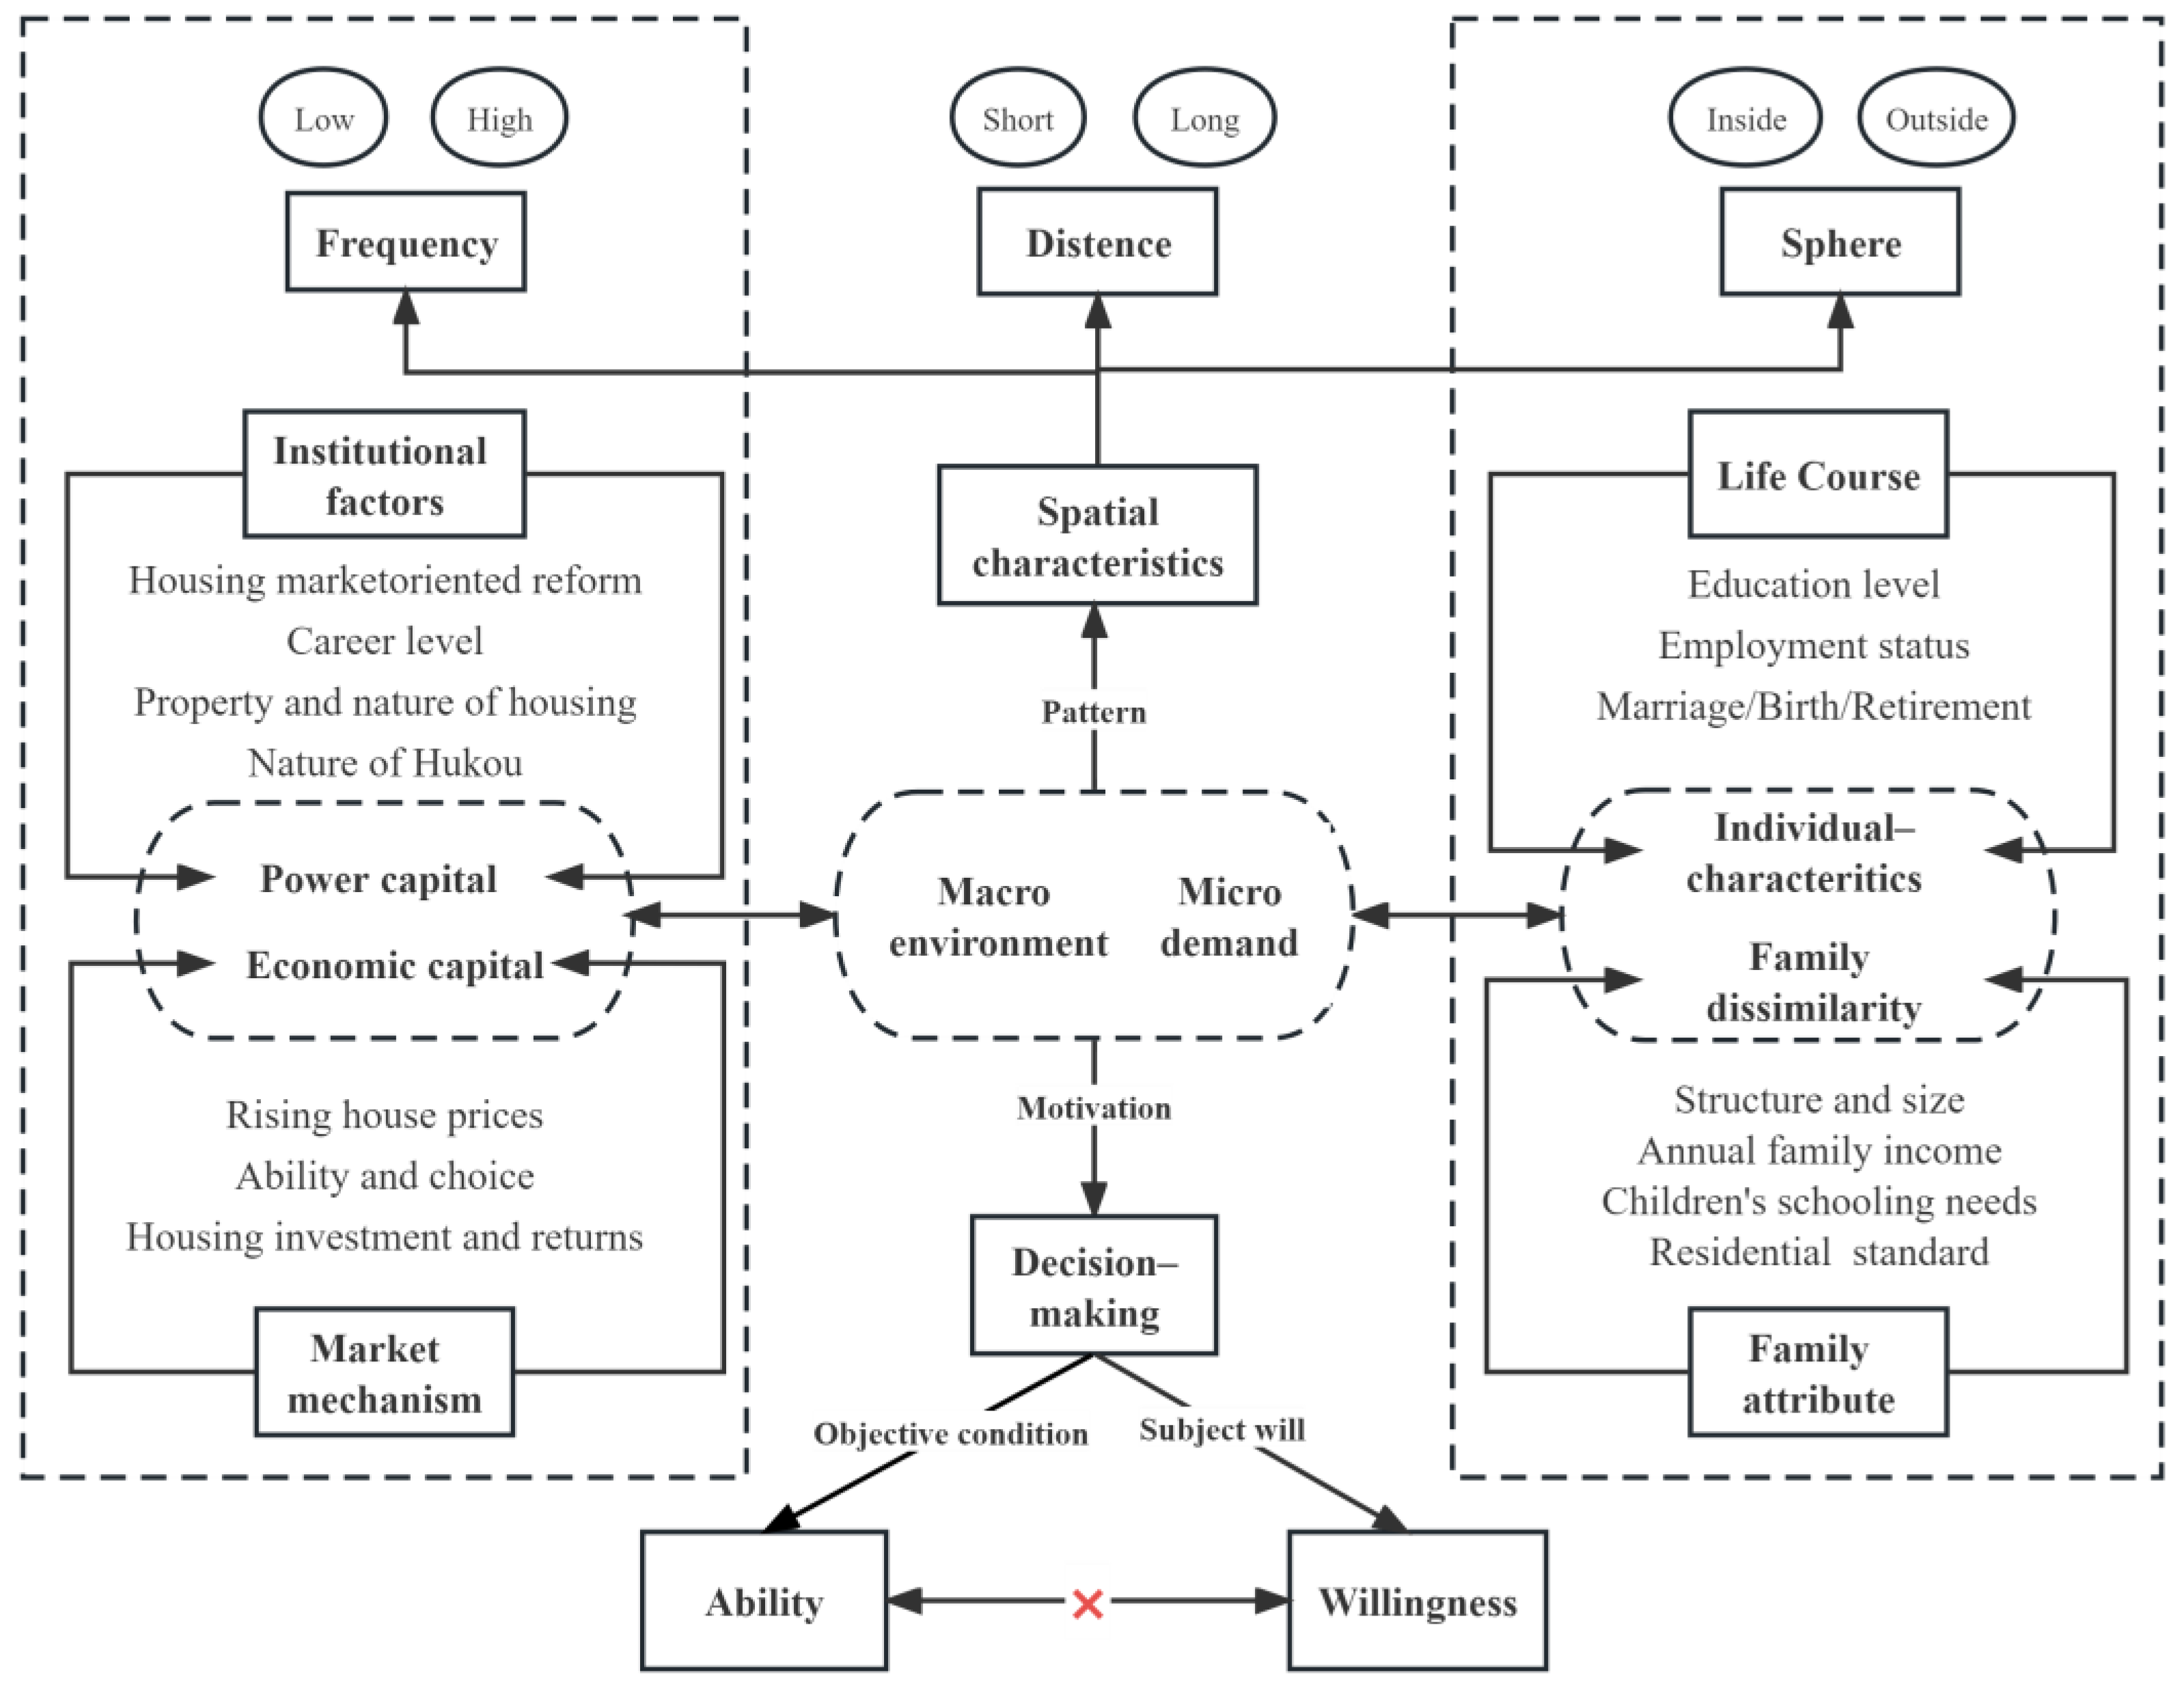
4.2. Mechanisms Driving Mobility
5. Conclusions
Author Contributions
Funding
Data Availability Statement
Conflicts of Interest
References
- Lee, E.S. A theory of migration. Demography 1966, 3, 47–57. [Google Scholar] [CrossRef]
- Coulter, R.; van Ham, M. Following People Through Time: An Analysis of Individual Residential Mobility Biographies. Hous. Stud. 2013, 28, 1037–1055. [Google Scholar] [CrossRef]
- Kim, J.H. Residential and job mobility: Interregional variation and their interplay in US metropolitan areas. Urban Stud. 2014, 51, 2863–2879. [Google Scholar] [CrossRef]
- Li, S.-m.; Mao, S.; Du, H. Residential mobility and neighbourhood attachment in Guangzhou, China. Environ. Plan. A Econ. Space 2018, 51, 761–780. [Google Scholar] [CrossRef]
- Hoekstra, J. Housing and the Welfare State in the Netherlands: An Application of Esping-Andersen’s Typology. Hous. Theory Soc. 2003, 20, 58–71. [Google Scholar] [CrossRef]
- Ronald, R.; Doling, J. Shifting East Asian Approaches to Home Ownership and the Housing Welfare Pillar. Int. J. Hous. Policy 2010, 10, 233–254. [Google Scholar] [CrossRef]
- Wang, Y.P.; Murie, A. The New Affordable and Social Housing Provision System in China: Implications for Comparative Housing Studies. Int. J. Hous. Policy 2011, 11, 237–254. [Google Scholar] [CrossRef]
- Zhou, J.; Ronald, R. Housing and Welfare Regimes: Examining the Changing Role of Public Housing in China. Hous. Theory Soc. 2016, 34, 253–276. [Google Scholar] [CrossRef]
- Chan, K.W.; Liu, T.; Yang, Y. Hukou and non-hukou migrations in China: Comparisons and contrasts. Int. J. Popul. Geogr. 1999, 5, 425–448. [Google Scholar] [CrossRef]
- Lin, S.; Wu, F.; Liang, Q.; Li, Z.; Guo, Y. From hometown to the host city? Migrants’ identity transition in urban China. Cities 2022, 122, 103567. [Google Scholar] [CrossRef]
- Huang, Y. The road to homeownership: A longitudinal analysis of tenure transition in urban China (1949–94). Int. J. Urban Reg. Res. 2004, 28, 774–795. [Google Scholar] [CrossRef]
- Xie, Y.; Jin, Y. Household Wealth in China. Chin. Sociol. Rev. 2015, 47, 203–229. [Google Scholar] [CrossRef] [PubMed]
- Halfacree, K.H.; Boyle, P.J. The challenge facing migration research: The case for a biographical approach. Prog. Hum. Geogr. 1993, 17, 333–348. [Google Scholar] [CrossRef] [PubMed]
- Kendig, H.L. Housing Careers, Life Cycle and Residential Mobility: Implications for the Housing Market. Urban Stud. 2016, 21, 271–283. [Google Scholar] [CrossRef]
- Li, S.-M.; Siu, Y.-M. Residential Mobility and Urban Restructuring under Market Transition: A Study of Guangzhou, China. Prof. Geogr. 2010, 53, 219–229. [Google Scholar] [CrossRef]
- Lin, S.; Wu, F.; Wang, Y.; Li, Z. Migrants’ perceived social integration in different housing tenures in urban China. Geoforum 2023, 139, 103693. [Google Scholar] [CrossRef]
- Richmond, A.H. Book Reviews: John Rex and Robert Moore, Race Community and Conflict: A Study of Spark- brook, published for the Institute of Race Relations, London, by Oxford University Press, 1967, pp. XVI + 304. Int. J. Comp. Sociol. 1967, 8, 265–266. [Google Scholar] [CrossRef]
- Yi, C.; Huang, Y. Housing Consumption and Housing Inequality in Chinese Cities during the First Decade of the Twenty-First Century. Hous. Stud. 2014, 29, 291–311. [Google Scholar] [CrossRef]
- Lantz, H.R.; Rossi, P.H. Why Families Move: A Study in the Social Psychology of Urban Residential Mobility. Marriage Fam. Living 1957, 19, 303–304. [Google Scholar] [CrossRef]
- Matherly, W.J.; Hoyt, H. The Structure and Growth of Residential Neighborhoods in American Cities. South. Econ. J. 1940, 7, 268–269. [Google Scholar] [CrossRef]
- Smith, N. Toward a Theory of Gentrification A Back to the City Movement by Capital, not People. J. Am. Plan. Assoc. 1979, 45, 538–548. [Google Scholar] [CrossRef]
- Wolpert, J. Behavioral Aspects of the Decision To Migrate. Pap. Reg. Sci. 1965, 15, 159–169. [Google Scholar] [CrossRef]
- Wolpert, J. Migration as an Adjustment to Environmental Stress. J. Soc. Issues 1966, 22, 92–102. [Google Scholar] [CrossRef]
- Brown, L.A.; Moore, E.G. The Intra-Urban Migration Process: A Perspective. Geogr. Annaler Ser. B Hum. Geogr. 1970, 52, 1–13. [Google Scholar] [CrossRef]
- Morris, T.; Manley, D.; Sabel, C.E. Residential mobility: Towards progress in mobility health research. Prog. Hum. Geogr. 2018, 42, 112–133. [Google Scholar] [CrossRef] [PubMed]
- Clark, W.; Deurloo, M.; Dieleman, F. Residential Mobility and Neighbourhood Outcomes. Hous. Stud. 2006, 21, 323–342. [Google Scholar] [CrossRef]
- Cui, C. Housing career disparities in urban China: A comparison between skilled migrants and locals in Nanjing. Urban Stud. 2018, 57, 546–562. [Google Scholar] [CrossRef]
- Cui, C.; Geertman, S.; Hooimeijer, P. Access to homeownership in urban China: A comparison between skilled migrants and skilled locals in Nanjing. Cities 2016, 50, 188–196. [Google Scholar] [CrossRef]
- Carp, F.M. Symposium the city: A viable environment for the elderly? Phase I. Life-style and location within the city. Gerontologist 1975, 15, 27–34. [Google Scholar] [CrossRef]
- Stouffer, S.A. Intervening Opportunities: A Theory Relating Mobility and Distance. Am. Sociol. Rev. 1940, 5, 845–867. [Google Scholar] [CrossRef]
- Wilson, A.G. A statistical theory of spatial distribution models. Transp. Res. 1967, 1, 253–269. [Google Scholar] [CrossRef]
- Dieleman, F.M. Modelling residential mobility; a review of recent trends in research. J. Hous. Built Environ. 2001, 16, 249–265. [Google Scholar] [CrossRef]
- Bailey, A.J. Population geography: Lifecourse matters. Prog. Hum. Geogr. 2008, 33, 407–418. [Google Scholar] [CrossRef]
- Dorigo, G.; Tobler, W. Push-Pull Migration Laws. Ann. Assoc. Am. Geogr. 2010, 73, 1–17. [Google Scholar] [CrossRef]
- Alonso, W. A Model of the Urban Land Market: Location and Densities of Dwellings and Businesses; University of Pennsylvania: Philadelphia, PA, USA, 1960. [Google Scholar]
- Brown, L.A.; Chung, S.-Y. Spatial segregation, segregation indices and the geographical perspective. Popul. Space Place 2006, 12, 125–143. [Google Scholar] [CrossRef]
- Jia, X.; Lei, J. Residential Mobility of Locals and Migrants in Northwest Urban China. Sustainability 2019, 11, 3507. [Google Scholar] [CrossRef]
- Knox, J.W.; Matthews, R.B.; Wassmann, R. Using a crop/soil simulation model and GIS techniques to assess methane emissions from rice fields in Asia. III. Databases. In Methane Emissions from Major Rice Ecosystems in Asia; Wassmann, R., Lantin, R.S., Neue, H.-U., Eds.; Springer: Dordrecht, The Netherlands, 2000; pp. 179–199. [Google Scholar]
- Somers, K.M.; Jackson, D.A. Putting the Mantel test back together again. Ecology 2022, 103, e3780. [Google Scholar] [CrossRef]
- Zhang, Z.-F.; Pan, J.; Pan, Y.-P.; Li, M. Biogeography, Assembly Patterns, Driving Factors, and Interactions of Archaeal Community in Mangrove Sediments. mSystems 2021, 6, 10-1128. [Google Scholar] [CrossRef]
- Legendre, P.; Fortin, M.-J.; Borcard, D. Should the Mantel test be used in spatial analysis? Methods Ecol. Evol. 2015, 6, 1239–1247. [Google Scholar] [CrossRef]
- Borana, S.L.; Yadav, S.K. Chapter 10—Urban land-use susceptibility and sustainability—Case study. In Water, Land, and Forest Susceptibility and Sustainability; Chatterjee, U., Pradhan, B., Kumar, S., Saha, S., Zakwan, M., Fath, B.D., Fiscus, D., Eds.; Academic Press: Cambridge, MA, USA, 2023; Volume 2, pp. 261–286. [Google Scholar]
- Leduc, A.; Drapeau, P.; Bergeron, Y.; Legendre, P. Study of spatial components of forest cover using partial Mantel tests and path analysis. J. Veg. Sci. 1992, 3, 69–78. [Google Scholar] [CrossRef]
- Dutilleul, P.; Stockwell, J.D.; Frigon, D.; Legendre, P. The Mantel Test versus Pearson’s Correlation Analysis: Assessment of the Differences for Biological and Environmental Studies. J. Agric. Biol. Environ. Stat. 2000, 5, 131–150. [Google Scholar] [CrossRef]
- Stutz, A.J.; Munro, N.D.; Bar-Oz, G. Increasing the resolution of the Broad Spectrum Revolution in the Southern Levantine Epipaleolithic (19–12 ka). J. Hum. Evol. 2009, 56, 294–306. [Google Scholar] [CrossRef] [PubMed]
- Mantel, N. The Detection of Disease Clustering and a Generalized Regression Approach. Cancer Res. 1967, 27, 209–220. [Google Scholar] [PubMed]
- Hägerstraand, T. What About People in Regional Science? Pap. Reg. Sci. 2005, 24, 7–24. [Google Scholar] [CrossRef]
- Wu, Q.; Zhang, X.; Waley, P. Jiaoyufication: When gentrification goes to school in the Chinese inner city. Urban Stud. 2016, 53, 3510–3526. [Google Scholar] [CrossRef]
- Song, W.; Cao, H.; Tu, T.; Song, Z.; Chen, P.; Liu, C. Jiaoyufication as an education-driven gentrification in urban China: A case study of Nanjing. J. Geogr. Sci. 2023, 33, 1095–1112. [Google Scholar] [CrossRef]
- Geng, B.; Bao, H.; Liang, Y. A study of the effect of a high-speed rail station on spatial variations in housing price based on the hedonic model. Habitat Int. 2015, 49, 333–339. [Google Scholar] [CrossRef]
- Fang, Y.; Zhang, Z. Migrant household homeownership outcomes in large Chinese cities—The sustained impact of hukou. Eurasian Geogr. Econ. 2016, 57, 203–227. [Google Scholar] [CrossRef]
- Bernard, A. Levels and patterns of internal migration in Europe: A cohort perspective. Popul. Stud. 2017, 71, 293–311. [Google Scholar] [CrossRef]
- Clark, W.A.V. Race, Class, and Place: Evaluating Mobility Outcomes for African Americans. Urban Aff. Rev. 2007, 42, 295–314. [Google Scholar] [CrossRef]
- Flowerdew, R.; Al-Hamad, A. The relationship between marriage, divorce and migration in a British data set. J. Ethn. Migr. Stud. 2004, 30, 339–351. [Google Scholar] [CrossRef]
- Huang, X.; Dijst, M.; van Weesep, J. Tenure choice in China’s medium-sized cities after hukou reform: A case study of rural–urban migrants’ housing careers in Yangzhou. J. Hous. Built Environ. 2019, 35, 353–373. [Google Scholar] [CrossRef]
- Talen, E.; Anselin, L. Assessing Spatial Equity: An Evaluation of Measures of Accessibility to Public Playgrounds. Environ. Plan. A Econ. Space 1998, 30, 595–613. [Google Scholar] [CrossRef]
- Lee, H.; Myers, D.; Painter, G.; Thunell, J.; Zissimopoulos, J. The role of parental financial assistance in the transition to homeownership by young adults. J. Hous. Econ. 2020, 47, 101597. [Google Scholar] [CrossRef]
- Öst, C.E. Parental Wealth and First-time Homeownership: A Cohort Study of Family Background and Young Adults’ Housing Situation in Sweden. Urban Stud. 2011, 49, 2137–2152. [Google Scholar] [CrossRef]


| Distributional Characteristics | Full Sample | City (%) 1 | Structural Characteristics | Full Sample | City (%) | ||||
|---|---|---|---|---|---|---|---|---|---|
| Number (Copies) | Rate (%) | Number (Copies) | Rate (%) | ||||||
| Distribution | Xuanwu | 437 | 10.88 | 5.77 | Gender | Male | 2038 | 50.76 | 51.05 |
| Qinhuai | 506 | 12.60 | 7.95 | Female | 1977 | 49.24 | 48.95 | ||
| Jianye | 255 | 6.35 | 5.74 | Age | Within 29 | 1405 | 34.99 | 33.86 | |
| Gulou | 572 | 14.25 | 10.10 | 30–44 | 1927 | 48.00 | 24.49 | ||
| Pukou | 442 | 11.01 | 12.58 | 45–59 | 587 | 14.62 | 22.67 | ||
| Qixai | 446 | 11.11 | 10.61 | 60+ | 96 | 2.39 | 18.98 | ||
| Yuhuatai | 226 | 5.63 | 6.54 | Hukou | Nanjing | 2946 | 73.37 | 74.82 | |
| Jiangning | 734 | 18.28 | 20.68 | Non-Nanjing | 1069 | 26.63 | 25.18 | ||
| Liuhe | 218 | 5.43 | 10.16 | Education | College+ | 2376 | 59.18 | 38.53 | |
| Lishui | 120 | 2.99 | 5.27 | High School/ Junior College | 1367 | 34.05 | 18.81 | ||
| Gaochun | 59 | 1.47 | 4.61 | Junior High School | 272 | 6.77 | 42.66 | ||
| Variable Type | Variable Name | Measurement Indicators |
|---|---|---|
| Indicators of Changes in Mobility | Mobility Rings | Moving to Outlying area = 1; Moving to Downtown = 2; Moving to Inner City = 3; Moving to Core Area = 4 |
| Mobility Distance | Continuous Variable | |
| Mobility Frequency | Continuous Variable | |
| Life-course Indicators | Gender | Male = 1; Female = 2 |
| Education | Within Junior High School = 1; High School/Junior College = 2; College = 3; Graduate Degree = 4 | |
| Occupation | Retired/Unemployed = 1; Agricultural Laborers/Industrial Works = 2; Commercial Service Works/Self-Employed = 3; Governmental Agencies/Business Managers = 4 | |
| Age | 20–29 = 1; 30–44 = 2; 45–59 = 3; 60+ = 4 | |
| Household Characteristic Indicators | Family Size | 1Person = 1; 2Persons = 2; 3Persons = 3; 4Persons = 4; 5+Persons = 5 |
| Inter-Generational Population | 1Generation = 1; 2Generations = 2; 3Generations = 3; 4Generations = 4 | |
| Annual Family Income | Within 100,000 = 1; 100,000-<200,000 = 2; 200,000-<300,000 = 3; 300,000-<400,000 = 4; 400,000-<600,000 = 5; 600,000-<1,000,000 = 6; 1,000,000+ = 7 | |
| Per Capita Housing Area | Continuous Variable | |
| Private Vehicles | 0Vehicle = 1; 1Vehicle = 2; 2Vehicles = 3; 3Vehicles = 4; 4+Vehicles = 5 | |
| Quantity of Housing | 0House = 1; 1House = 2; 2Houses = 3; 3Houses = 4; 4+Houses = 5 | |
| Macro-Institutional Factors | Mobility Era | 1980–1998 = 1; 1999–2008 = 2; 2009–2020 = 3 |
| Household Registration Nature (Hukou) | Non-Nanjing Hukou = 1; Nanjing Hukou = 2 | |
| Housing Market Factors | Housing Price | Continuous Variable (Yuan/m2) |
| Housing Nature | Rent = 1; Demolished and Resettled House = 2; Self-Built House = 3; Ownership of Small House/Public House = 4; Commercial Property = 5 | |
| Era of Housing Construction | Before 1980 = 0; 1980–1989 = 1; 1990–1998 = 2; 1999–2009 = 3; After 2009 = 4 | |
| Housing Ownership | Rent-to-Rent = 1; Rent-to-Buy = 2; Buy-to-Rent = 3; Buy-to-Buy = 4 |
| Variable Type | Variable Name | Measurement Indicators |
|---|---|---|
| Explained Variable | Mobility Frequency | Low = 1; Medium = 2; High = 3 |
| Family Size | 1Person = 1; 2Persons = 2; 3Persons = 3; 4Persons = 4; 5+Persons = 5 | |
| Housing Era | 1980–1998 = 1; 1999–2008 = 2; 2009–2020 = 3 | |
| Household Registration of Nature (Hukou) | Non-Nanjing Hukou = 1; Nanjing Hukou = 2 | |
| Housing Nature | Rent-to-Rent = 1; Rent-to-Buy = 2; Buy-to-Rent = 3; Buy-to-Buy = 4 | |
| Era of Housing Construction | Before1980 = 0; 1980–1989 = 1; 1990–1998 = 2; 1999–2009 = 3; After 2009 = 4 |
| Variables | Main Effects Model | ||||||
|---|---|---|---|---|---|---|---|
| B | S.E | Wald | Significance | Exp (B) | 95% CI | ||
| Lower | Upper | ||||||
| Frequency Medium (Low) | 0.007 | 0.172 | 0.002 | 0.966 | |||
| Housing Era (1980–1998) | −0.074 | 0.334 | 0.049 | 0.824 | 0.928 | 0.483 | 1.786 |
| 1999–2008 | 2.024 | 0.288 | 49.508 | 0 *** | 7.566 | 4.306 | 13.295 |
| 2009–2020 | 0b | ||||||
| Hukou (Non) | 0.017 | 0.141 | 0.015 | 0.904 | 1.017 | 0.772 | 1.341 |
| Nangjing Hukou | 0b | ||||||
| Era of Housing Construction (Before 1980) | 0.059 | 0.242 | 0.06 | 0.806 | 1.061 | 0.66 | 1.707 |
| 1980–1989 | 0.393 | 0.192 | 4.17 | 0.041 * | 1.481 | 1.016 | 2.159 |
| 1990–1998 | 0.421 | 0.163 | 6.7 | 0.01 ** | 1.524 | 1.108 | 2.097 |
| 1999–2009 | 0.286 | 0.148 | 3.735 | 0.053 | 1.331 | 0.996 | 1.779 |
| 2010 and Later | 0b | ||||||
| Housing Nature (Rent–Rent) | 0.082 | 0.147 | 0.316 | 0.574 | 1.086 | 0.815 | 1.448 |
| Rent–Buy | 0.353 | 0.131 | 7.266 | 0.007 ** | 1.423 | 1.101 | 1.84 |
| Buy–Rent | 0.179 | 0.244 | 0.534 | 0.465 | 1.196 | 0.74 | 1.93 |
| Buy–Buy | 0b | ||||||
| Family Size (1Person) | −0.239 | 0.247 | 0.934 | 0.334 | 0.788 | 0.485 | 1.278 |
| 2Persons | −0.251 | 0.185 | 1.844 | 0.175 | 0.778 | 0.541 | 1.118 |
| 3Persons | −0.236 | 0.146 | 2.605 | 0.107 | 0.79 | 0.593 | 1.052 |
| 4Persons | −0.12 | 0.169 | 0.501 | 0.479 | 0.887 | 0.637 | 1.236 |
| 5+Persons | 0b | ||||||
| Frequency High (Low) | −0.739 | 0.193 | 14.615 | 0 *** | |||
| Housing Era (1980–1998) | −0.778 | 0.466 | 2.785 | 0.095 | 0.459 | 0.184 | 1.145 |
| 1999–2008 | 3.76 | 0.283 | 176.754 | 0 *** | 42.955 | 24.676 | 74.776 |
| 2009–2020 | 0b | ||||||
| Hukou (Non) | 0.436 | 0.147 | 8.769 | 0.003 ** | 1.546 | 1.159 | 2.063 |
| Nangjing Hukou | 0b | ||||||
| Era of Housing Construction (Before 1980) | 0.165 | 0.252 | 0.431 | 0.511 | 1.18 | 0.72 | 1.933 |
| 1980–1989 | 0.172 | 0.207 | 0.688 | 0.407 | 1.187 | 0.791 | 1.781 |
| 1990–1998 | −0.031 | 0.179 | 0.03 | 0.862 | 0.969 | 0.682 | 1.377 |
| 1999–2009 | 0.015 | 0.16 | 0.008 | 0.927 | 1.015 | 0.742 | 1.388 |
| 2010 and Later | 0b | ||||||
| Housing Nature (Rent–Rent) | 0.637 | 0.16 | 15.812 | 0 *** | 1.891 | 1.381 | 2.588 |
| Rent–Buy | 0.94 | 0.146 | 41.398 | 0 *** | 2.559 | 1.922 | 3.407 |
| Buy–Rent | 0.485 | 0.274 | 3.131 | 0.077 | 1.625 | 0.949 | 2.781 |
| Buy–Buy | 0b | ||||||
| Family Size (1Person) | 0.523 | 0.241 | 4.698 | 0.03 * | 1.687 | 1.051 | 2.707 |
| 2Persons | −0.189 | 0.203 | 0.874 | 0.35 | 0.827 | 0.556 | 1.231 |
| 3Persons | −0.421 | 0.166 | 6.414 | 0.011 * | 0.656 | 0.474 | 0.909 |
| 4Persons | 0.123 | 0.185 | 0.444 | 0.505 | 1.131 | 0.787 | 1.626 |
| 5+Persons | 0b | ||||||
Disclaimer/Publisher’s Note: The statements, opinions and data contained in all publications are solely those of the individual author(s) and contributor(s) and not of MDPI and/or the editor(s). MDPI and/or the editor(s) disclaim responsibility for any injury to people or property resulting from any ideas, methods, instructions or products referred to in the content. |
© 2024 by the authors. Licensee MDPI, Basel, Switzerland. This article is an open access article distributed under the terms and conditions of the Creative Commons Attribution (CC BY) license (https://creativecommons.org/licenses/by/4.0/).
Share and Cite
Ye, L.; Song, W.; He, M.; Liu, C. The Patterns and Mechanisms of Residential Mobility in Nanjing, China: Insights from the Mantel Test. ISPRS Int. J. Geo-Inf. 2024, 13, 17. https://doi.org/10.3390/ijgi13010017
Ye L, Song W, He M, Liu C. The Patterns and Mechanisms of Residential Mobility in Nanjing, China: Insights from the Mantel Test. ISPRS International Journal of Geo-Information. 2024; 13(1):17. https://doi.org/10.3390/ijgi13010017
Chicago/Turabian StyleYe, Ling, Weixuan Song, Miao He, and Chunhui Liu. 2024. "The Patterns and Mechanisms of Residential Mobility in Nanjing, China: Insights from the Mantel Test" ISPRS International Journal of Geo-Information 13, no. 1: 17. https://doi.org/10.3390/ijgi13010017
APA StyleYe, L., Song, W., He, M., & Liu, C. (2024). The Patterns and Mechanisms of Residential Mobility in Nanjing, China: Insights from the Mantel Test. ISPRS International Journal of Geo-Information, 13(1), 17. https://doi.org/10.3390/ijgi13010017