

Understanding Map Misinterpretation: Factors Influencing Correct Map Reading and Common Errors

Abstract
1. Introduction
- Which of the demographic variables (e.g., age, gender, etc.) are most related to map reading competencies?
- Is the map reading performance related to the test subjects’ language?
- Does screen size affect map-reading performance?
- Are there specific patterns in the error types based on the test results?
Related Studies
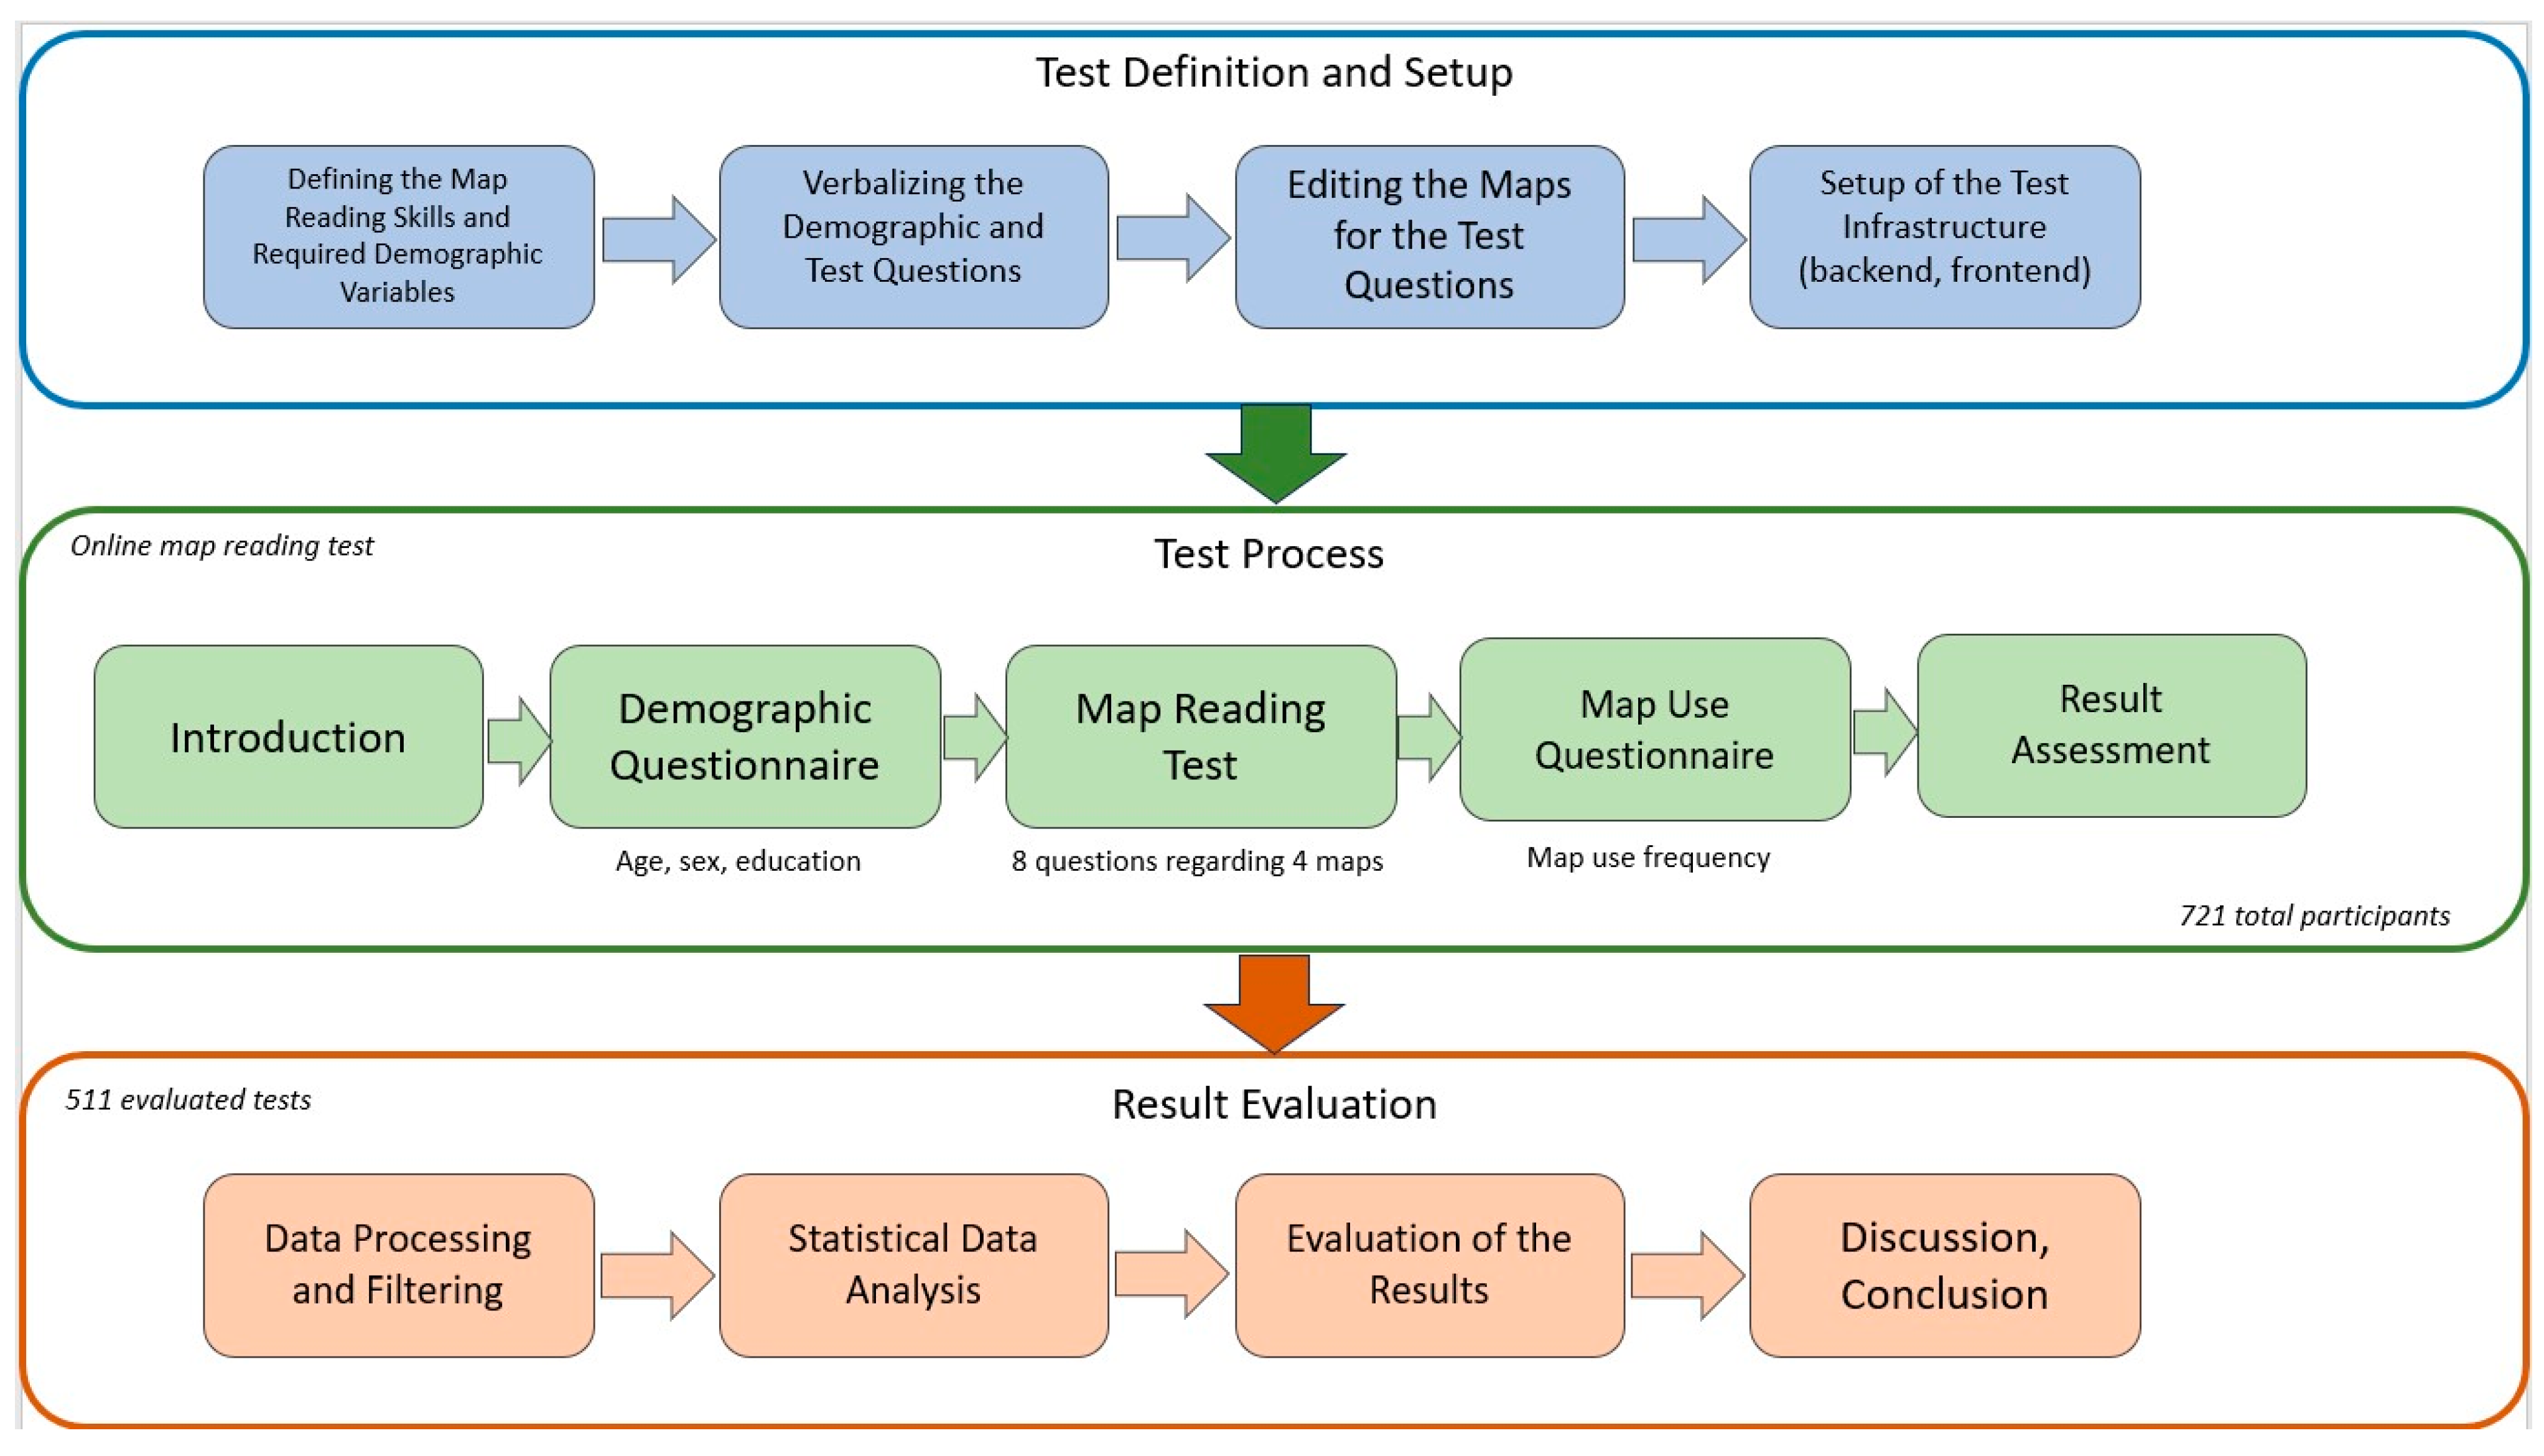
2. Materials and Methods
2.1. Test Settings
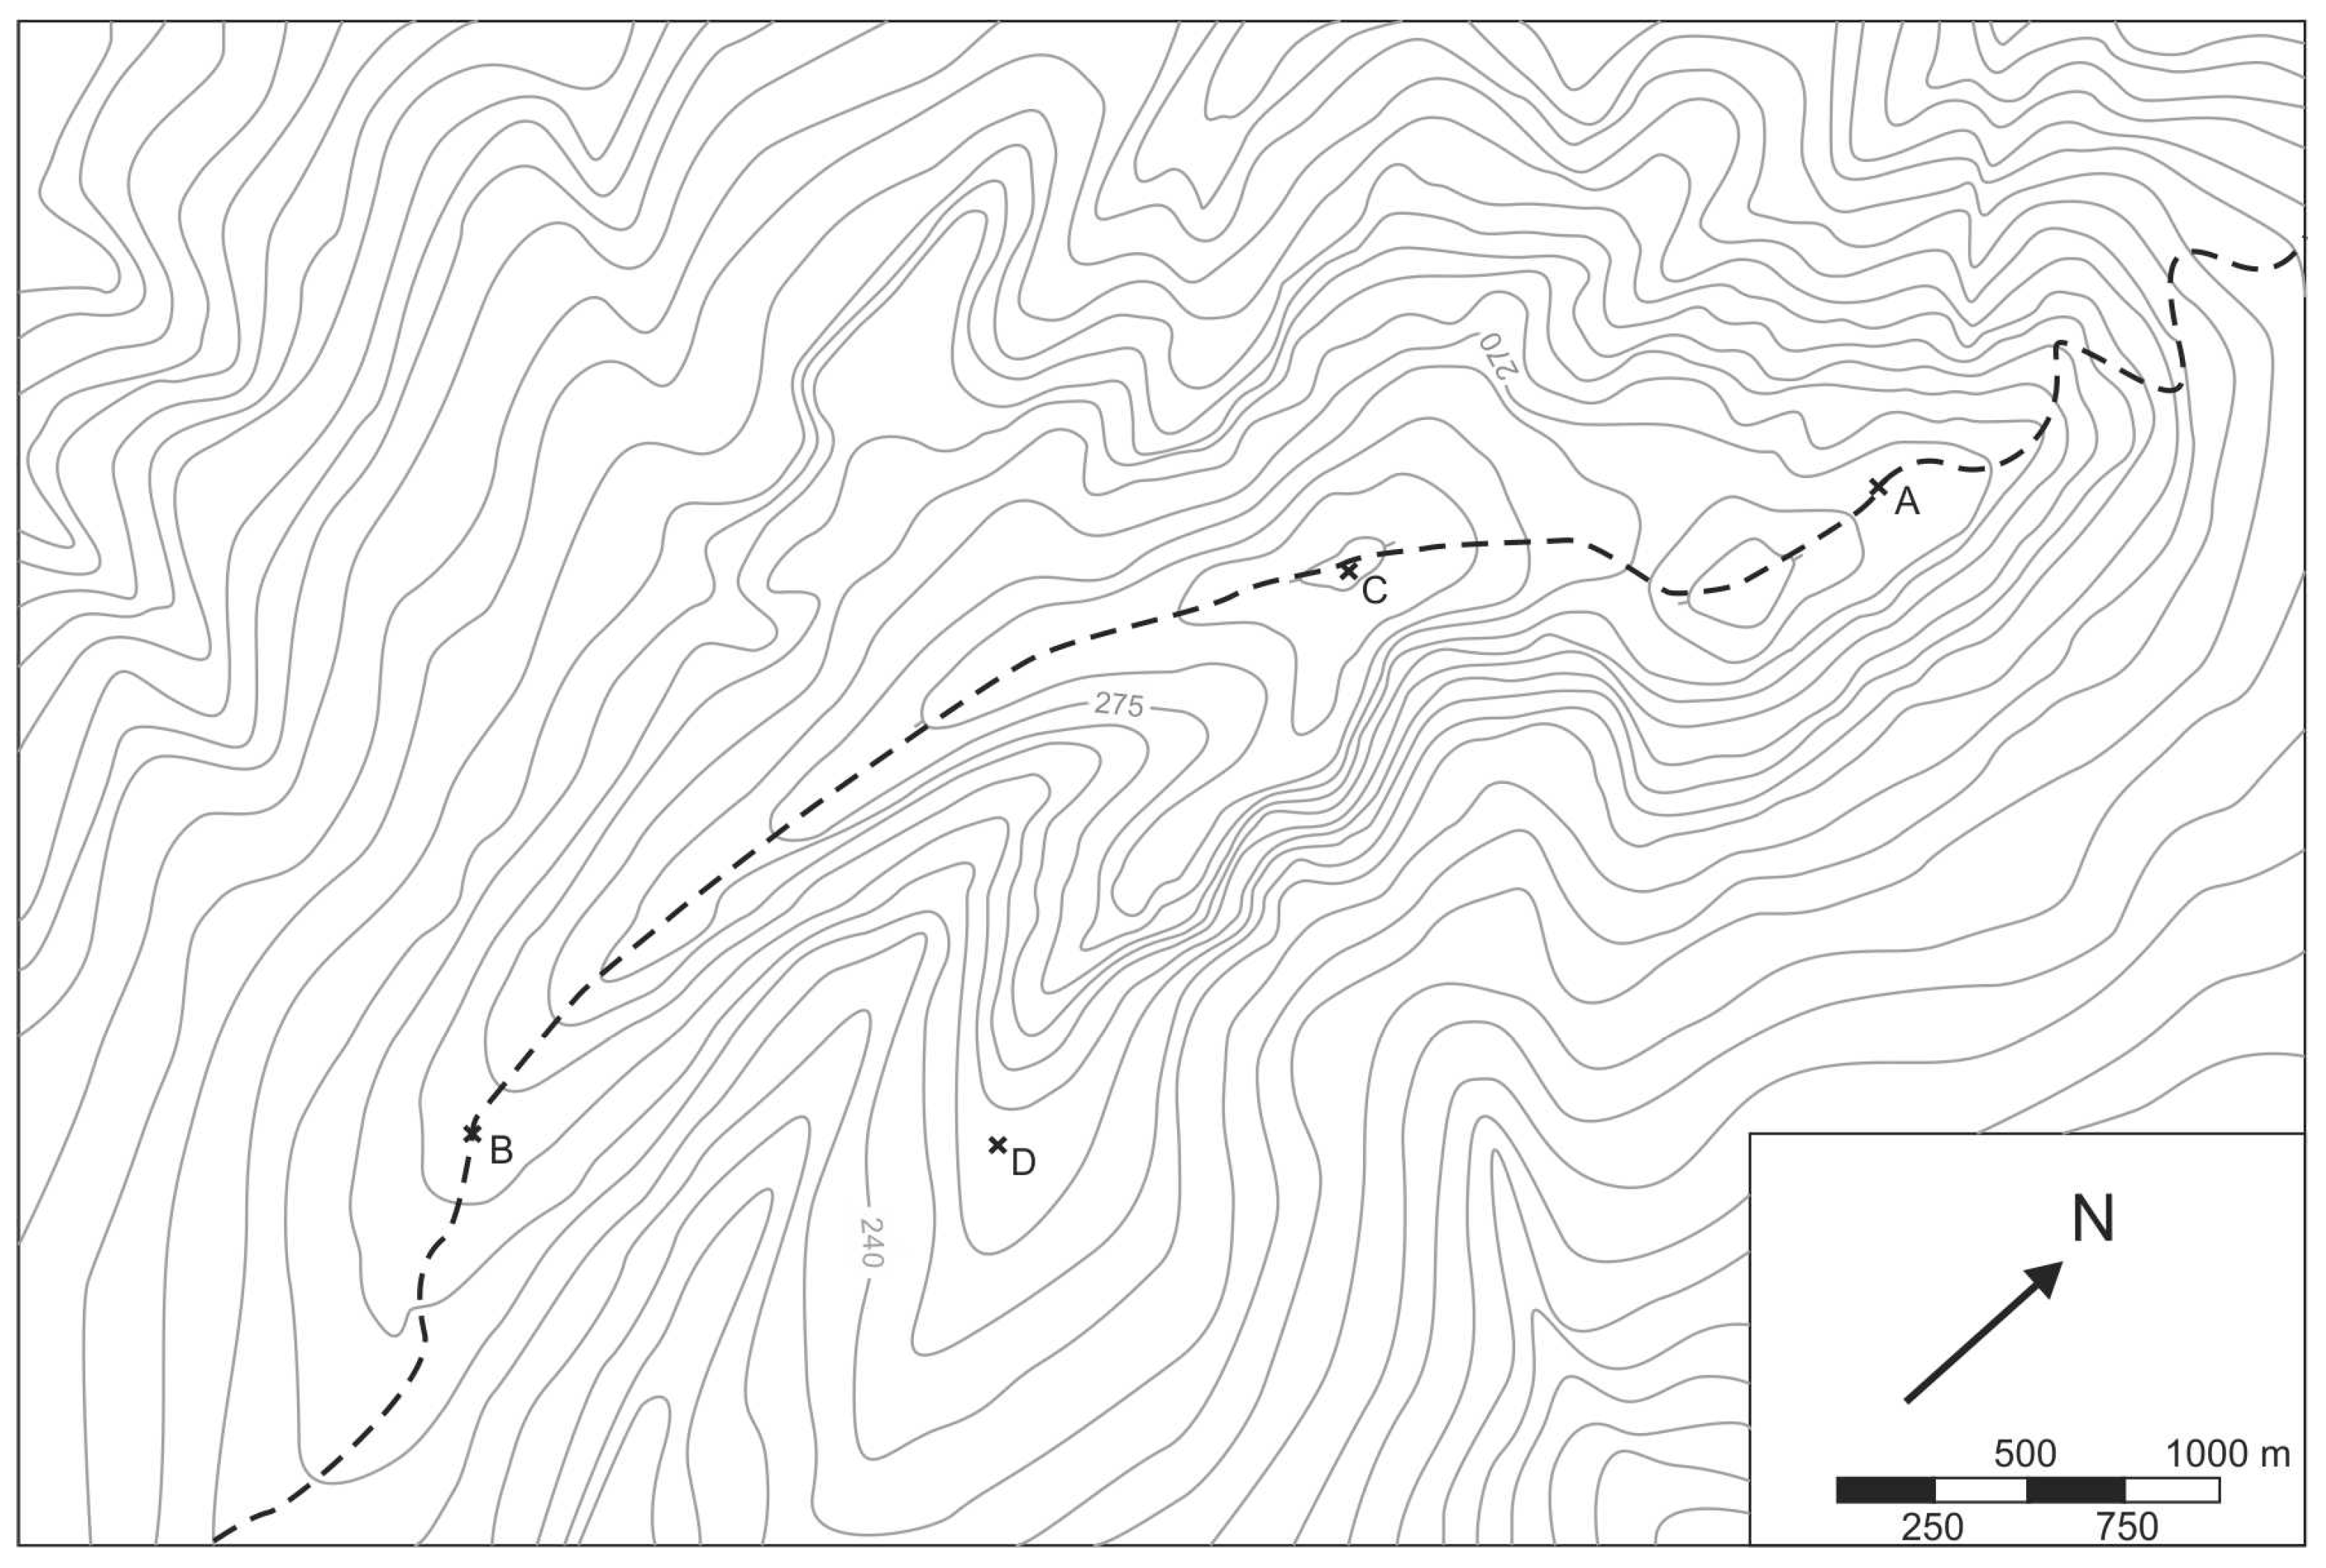
- Which statement is correct?
- (A) Point C is the lowest.
- (B) Point D is lower, than point A.
- (C) Point B and D area the same height.
- (D) Point B is higher, then point A.
- I don’t know.
- In what direction is point D from point B?
- (A) Northwest
- (B) Southwest
- (C) Southeast
- (D) Northeast
- I don’t know.
- How long is the path between point A and B? How long is the travel time on foot?
- (A) 4.5 km, 1 h and 20 min
- (B) 2.6 km, 2 h
- (C) 10 km, 4 h and 30 min
- (D) 3 km, 1 h
- I don’t know.
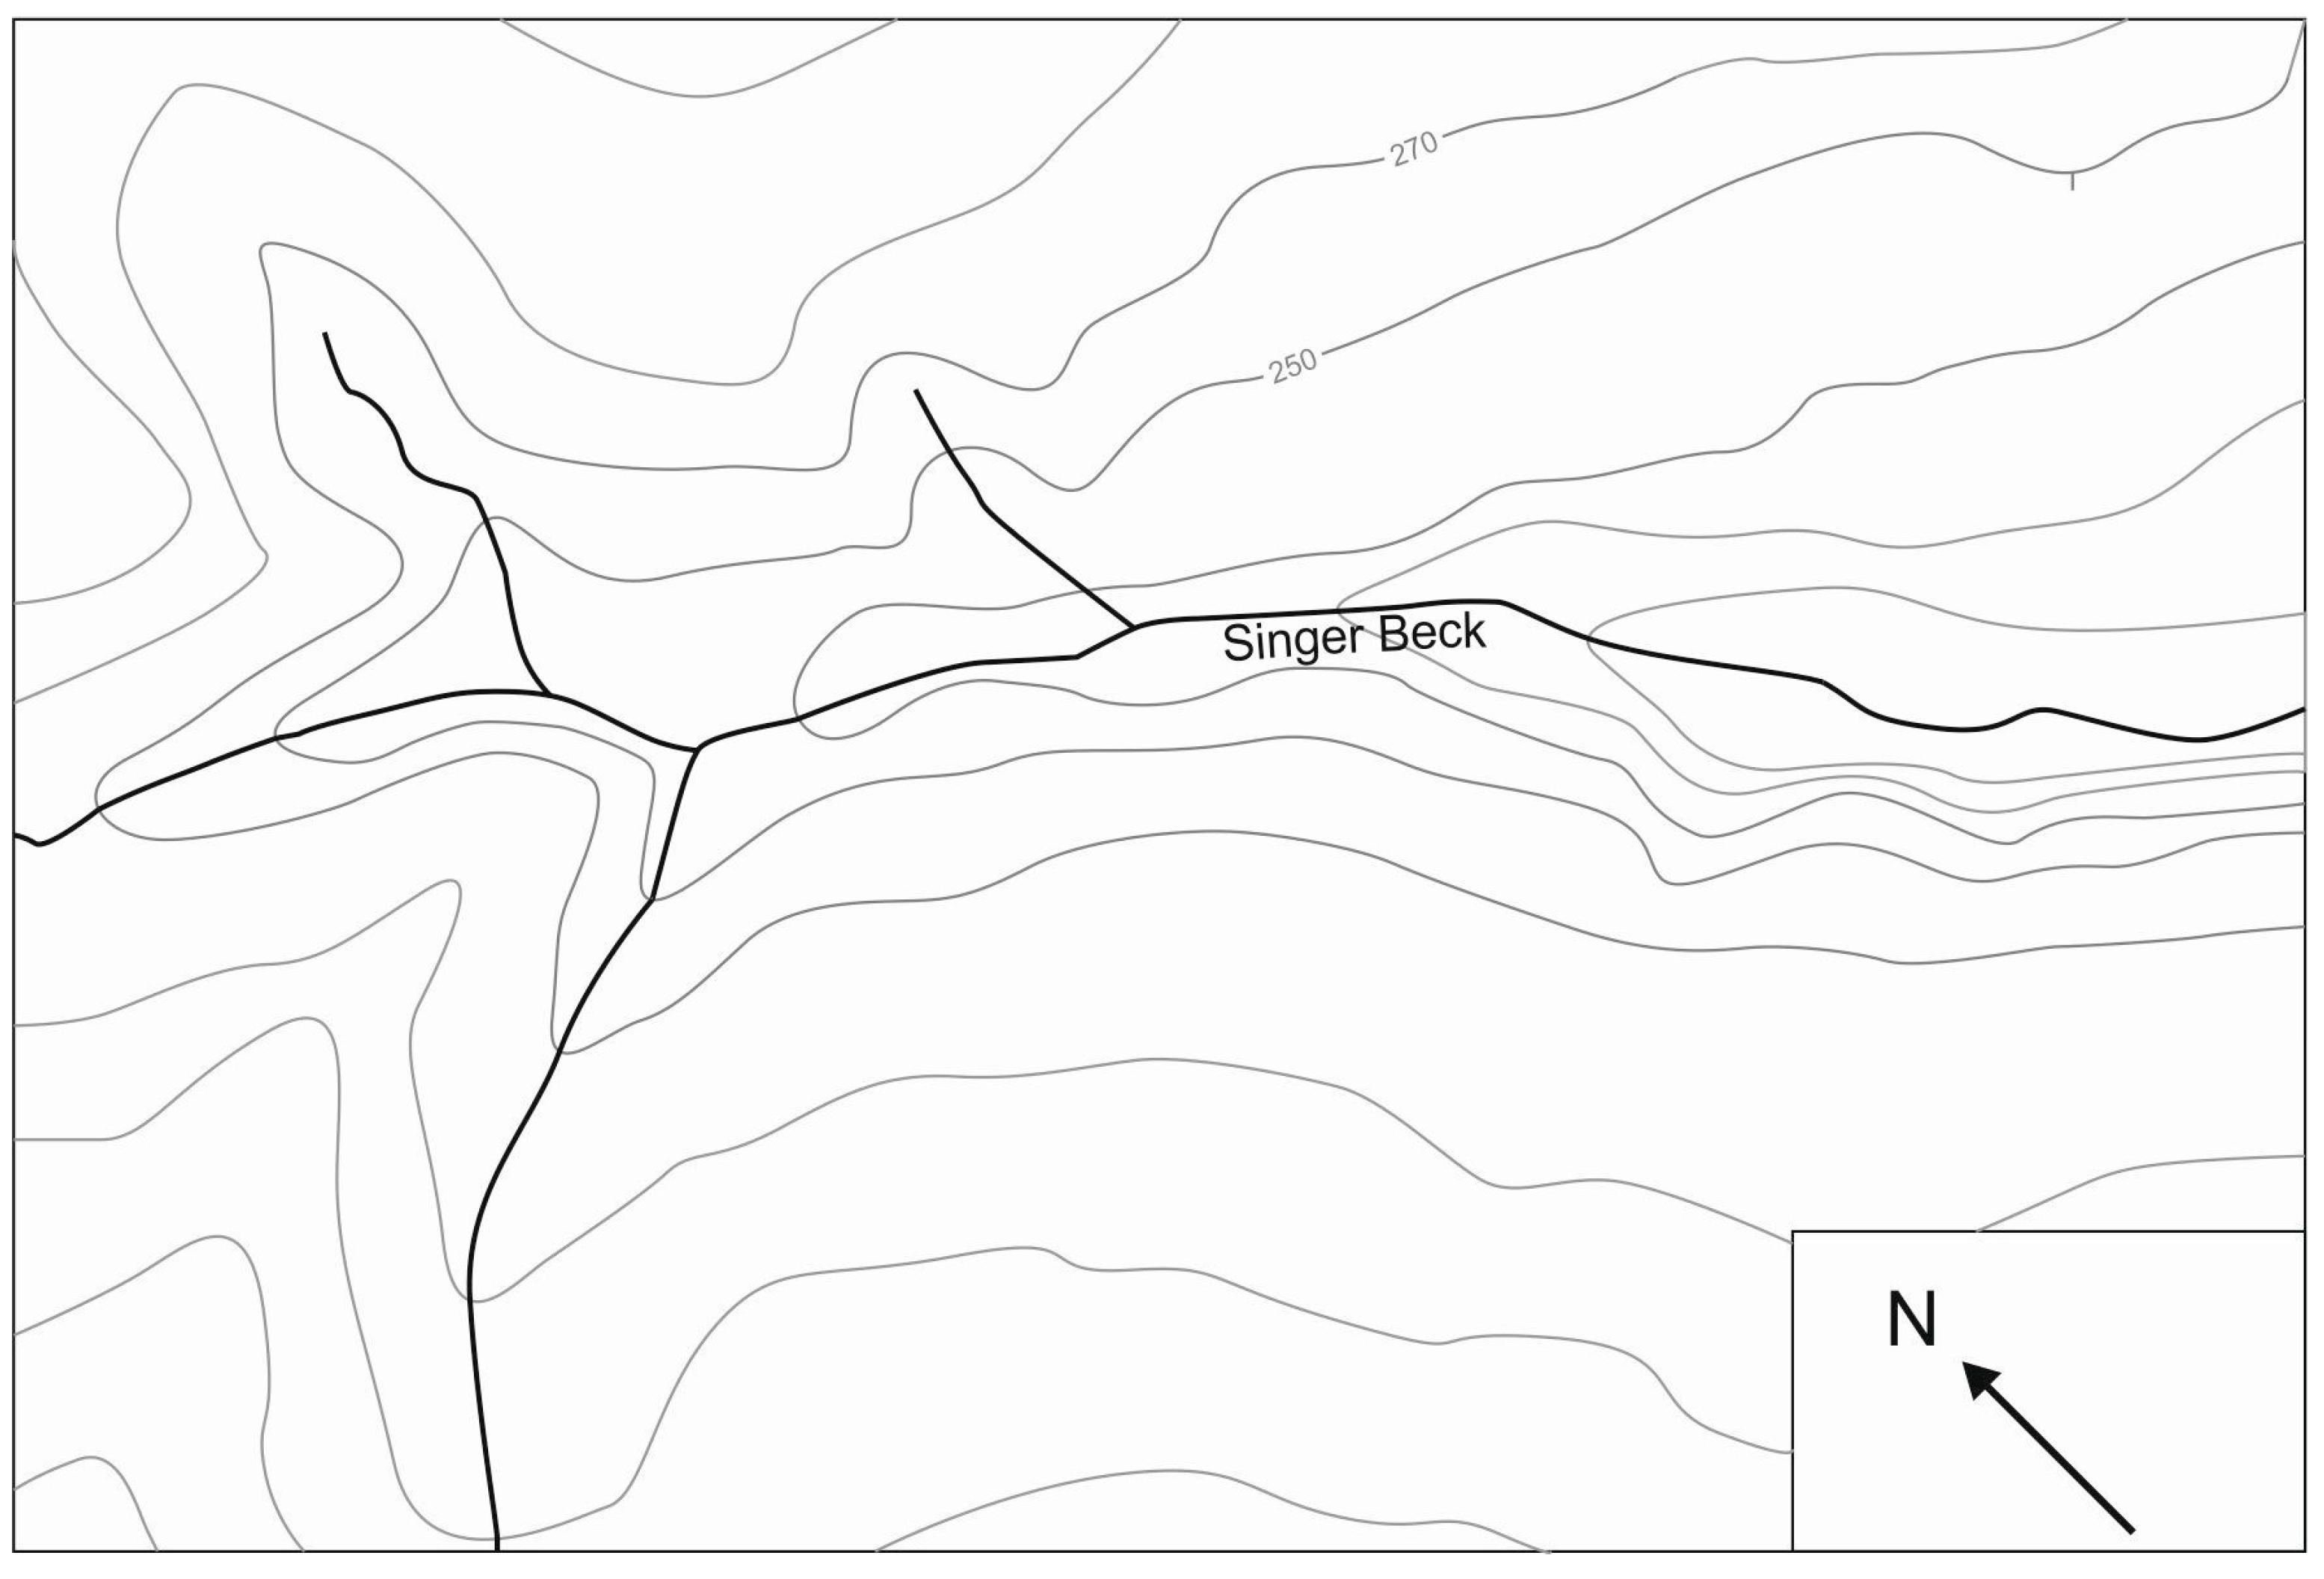
- 4.
- In which direction does the Singer Beck flow?
- (A) Northwest
- (B) Southwest
- (C) Southeast
- (D) Northeast
- I don’t know.
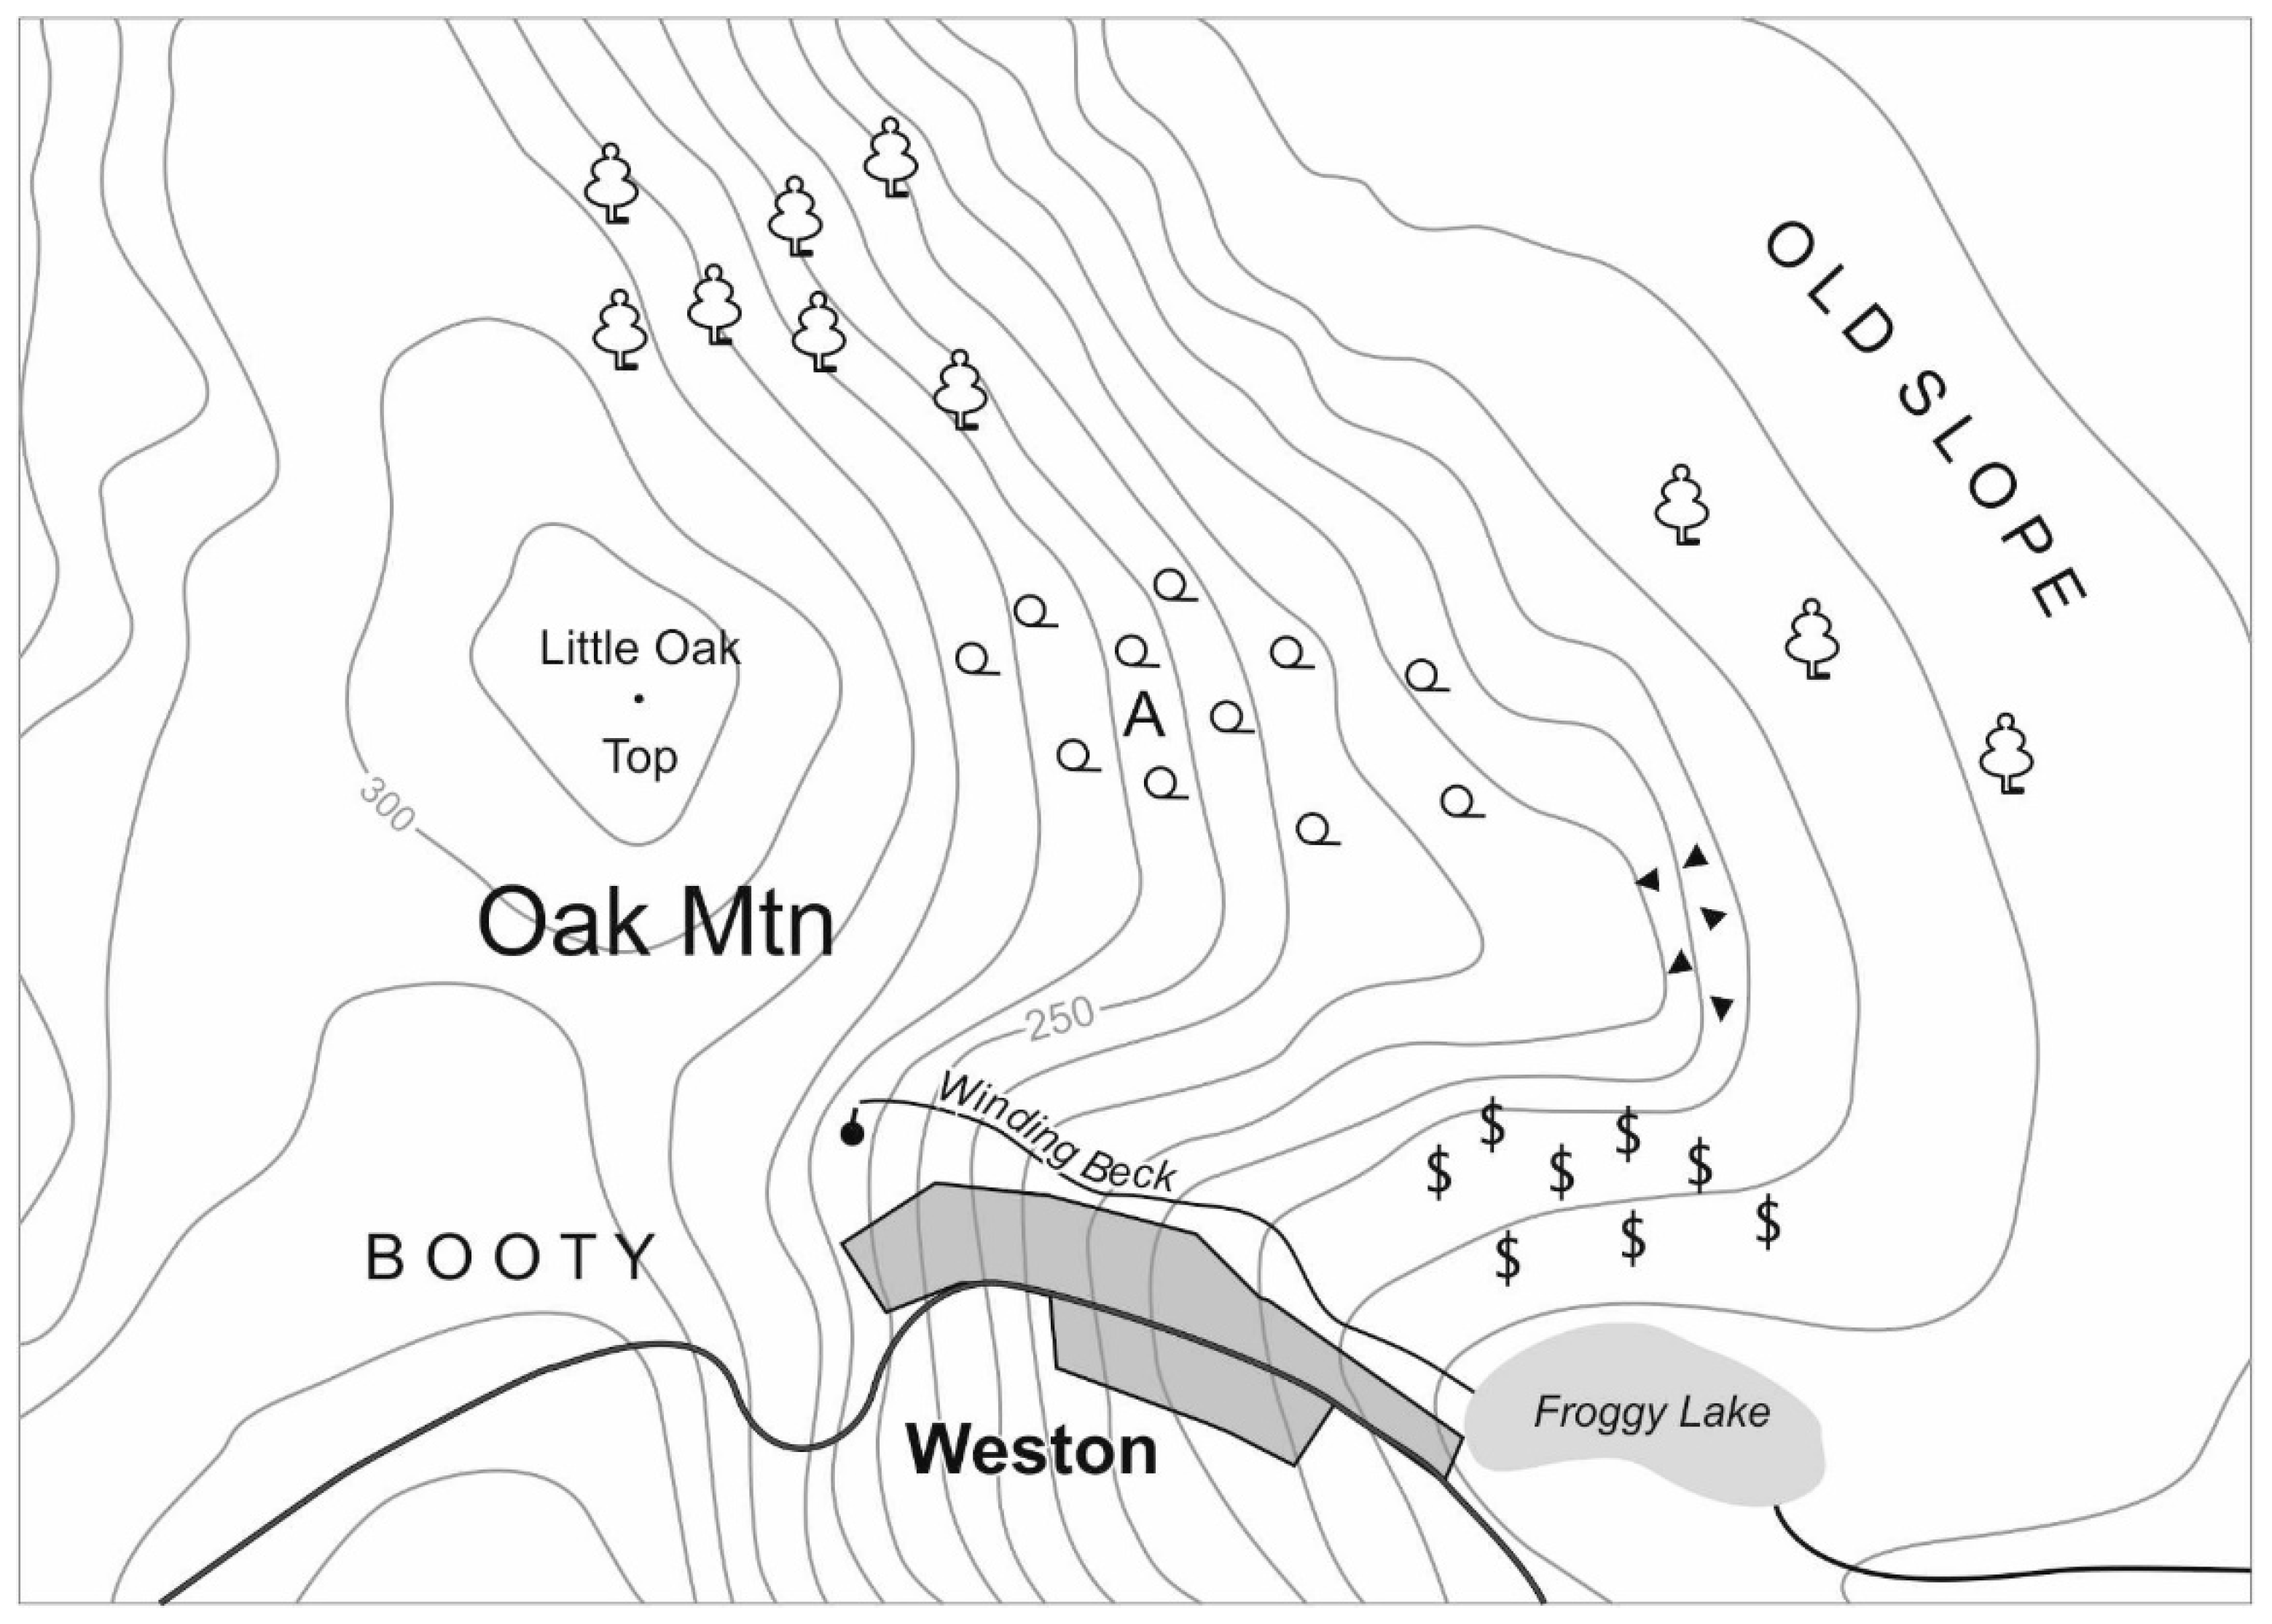
- 5.
- What type of area does mark “A” show?
- (A) Forest
- (B) Rocky
- (C) Vineyard
- (D) Bush
- I don’t know.
- 6.
- What is the name of the town indicated with dark grey color? (open-ended question: the answer should be typed)
- Weston
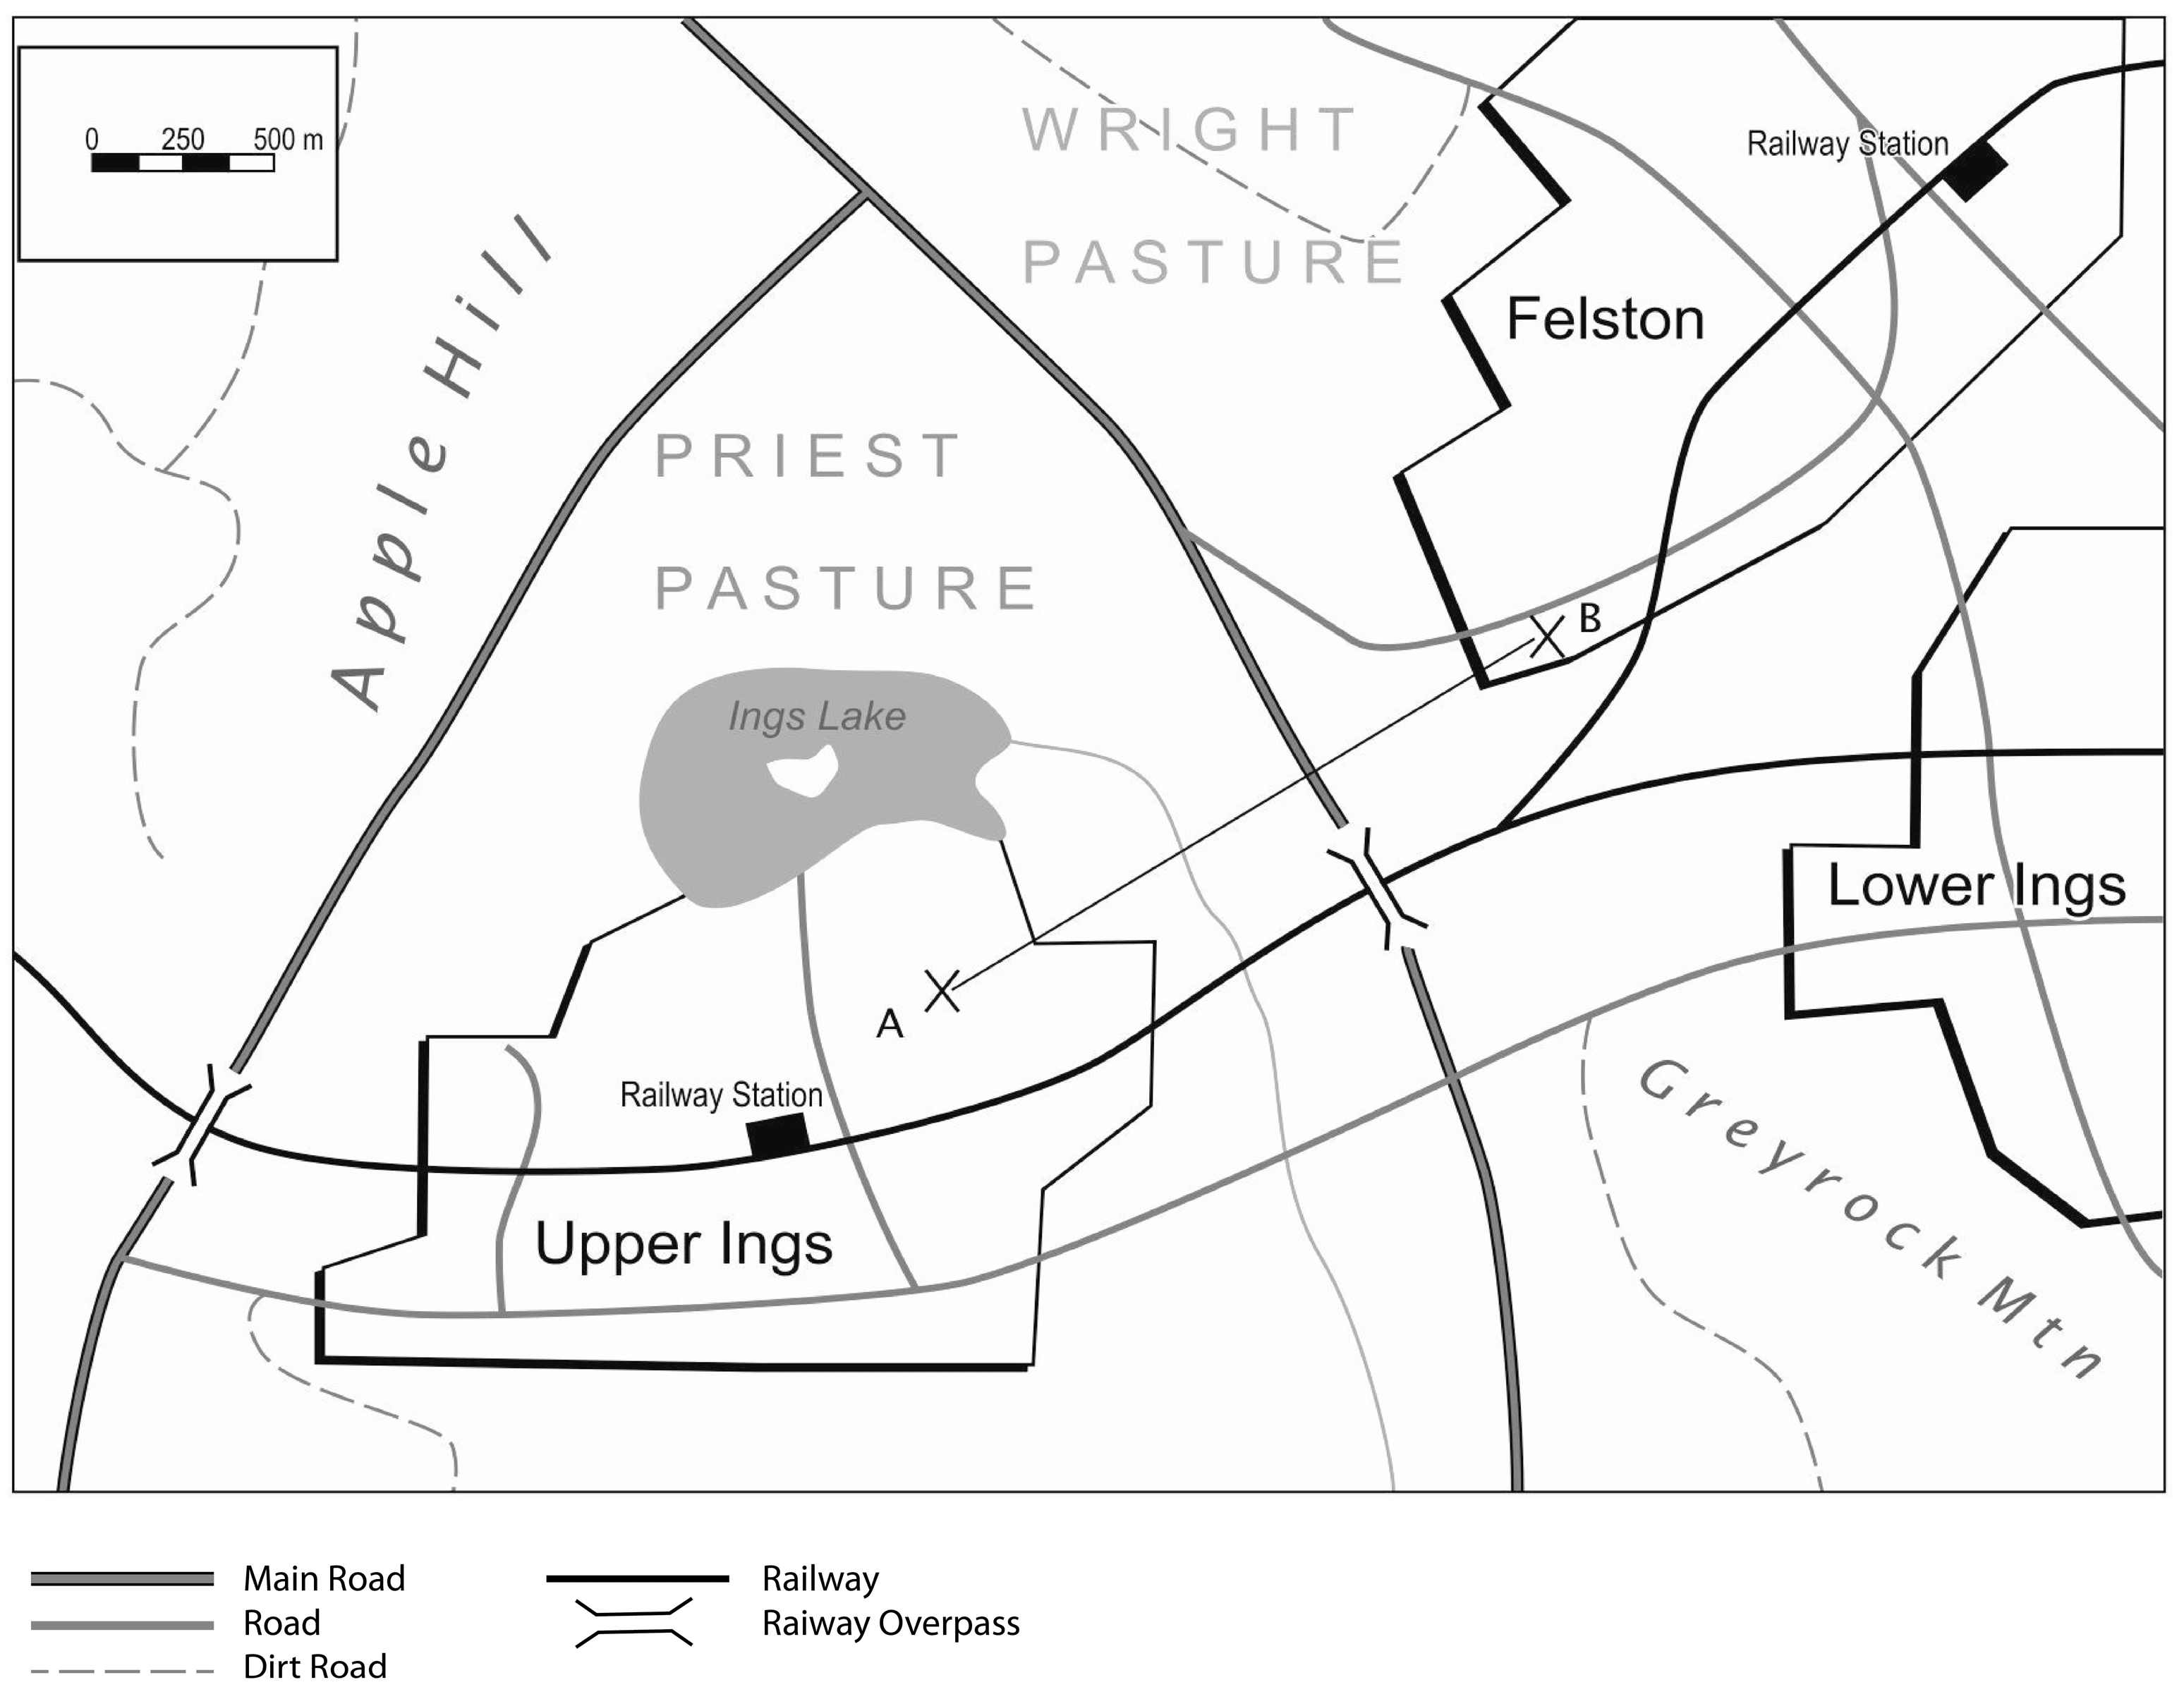
- 7.
- How many railway crossings* can be found between Upper Ings and Felston railway station?
- (A) 6
- (B) 5
- (C) 8
- (D) 1
- I don’t know.
- 8.
- What is the distance between point A and point B?
- (A) 2 km
- (B) 5 km
- (C) 3.5 km
- (D) 6 km
- I don’t know.
2.2. Test Sample
3. Results
3.1. The Results from a General Aspect
3.2. Looking at the Different Circumstances of Fillings
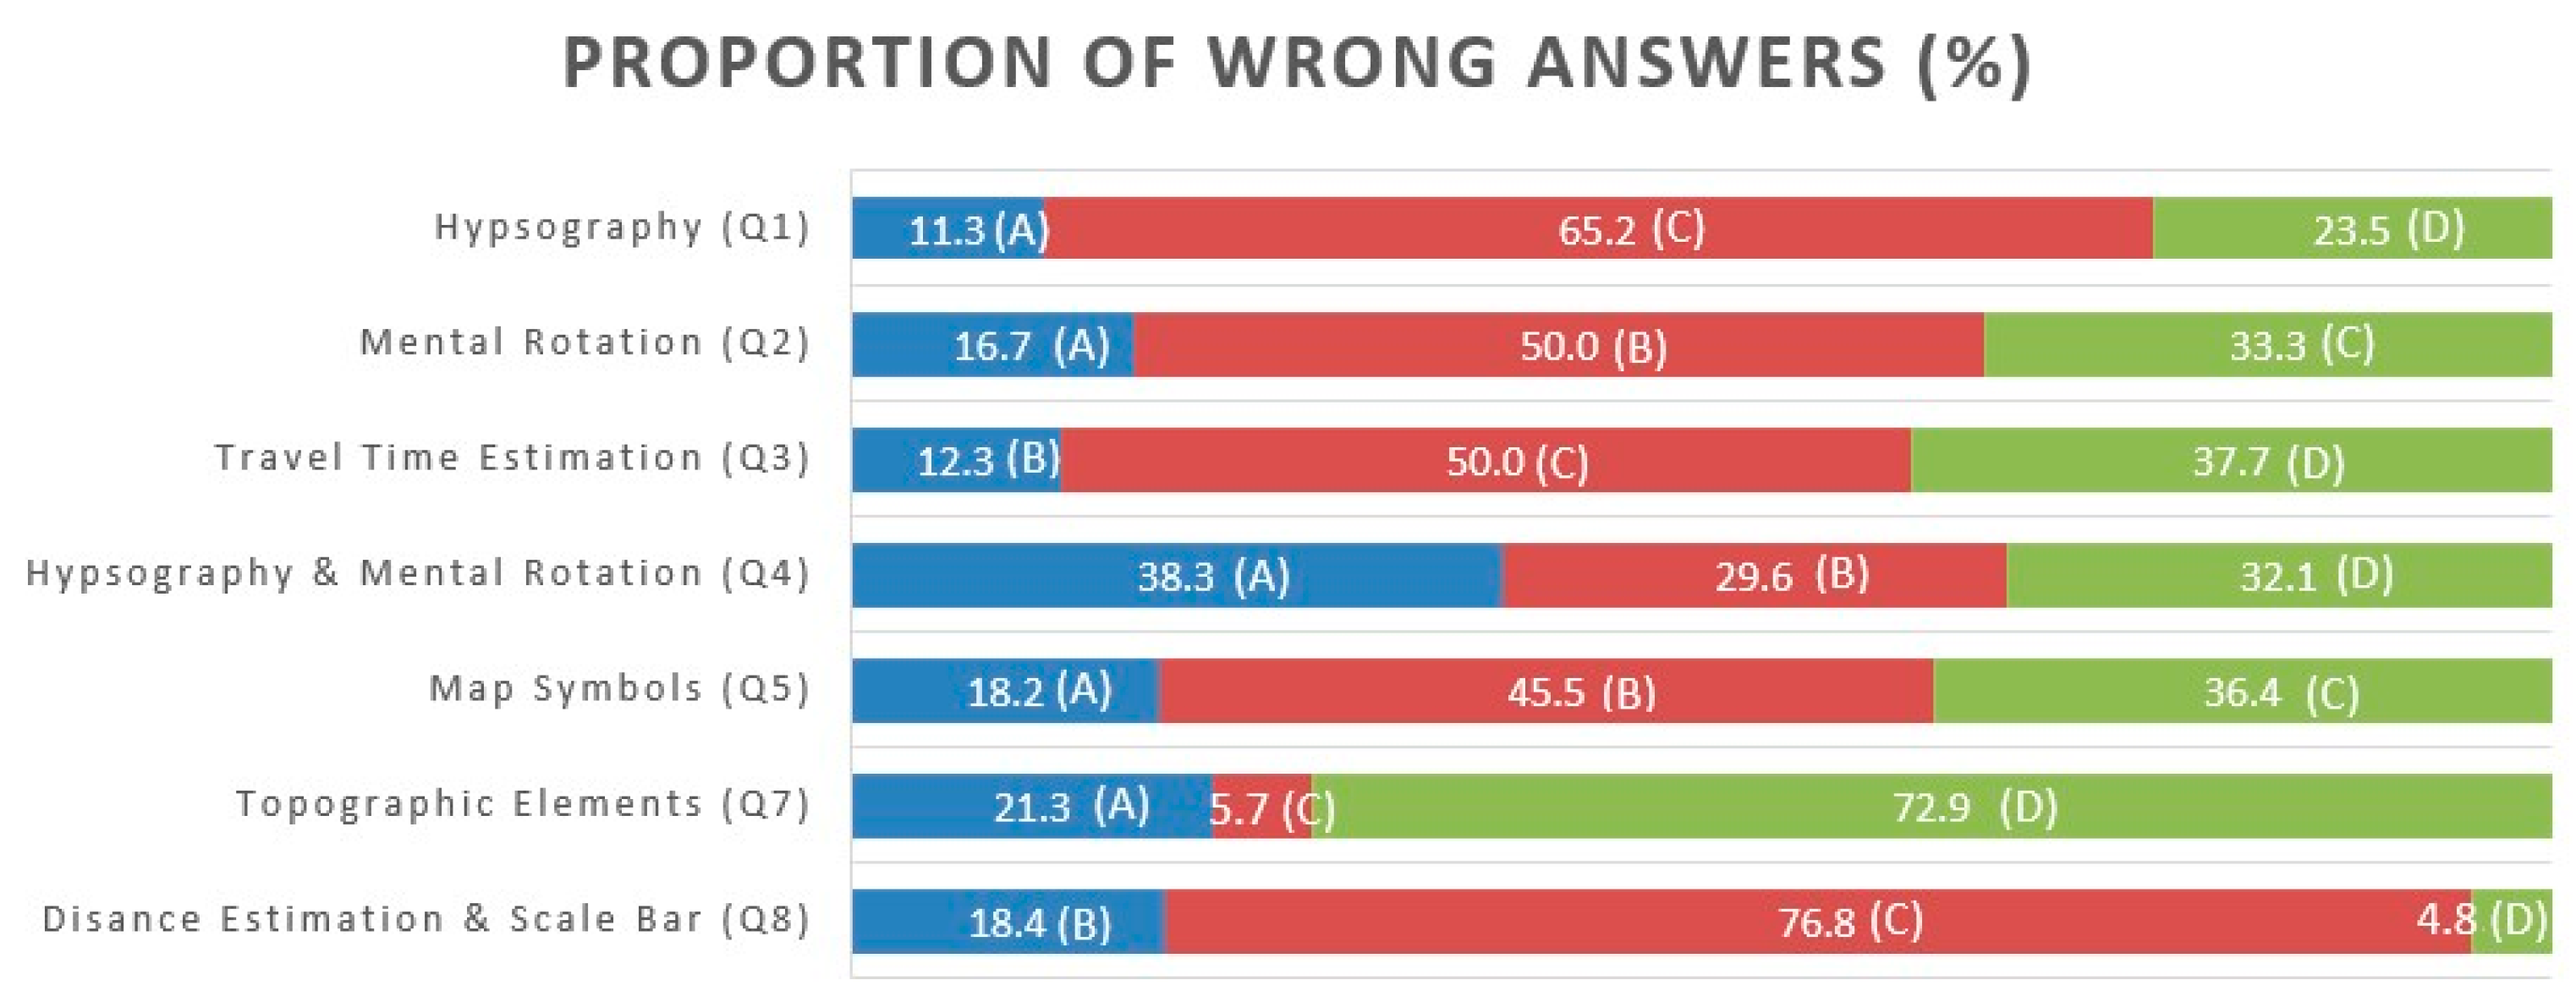
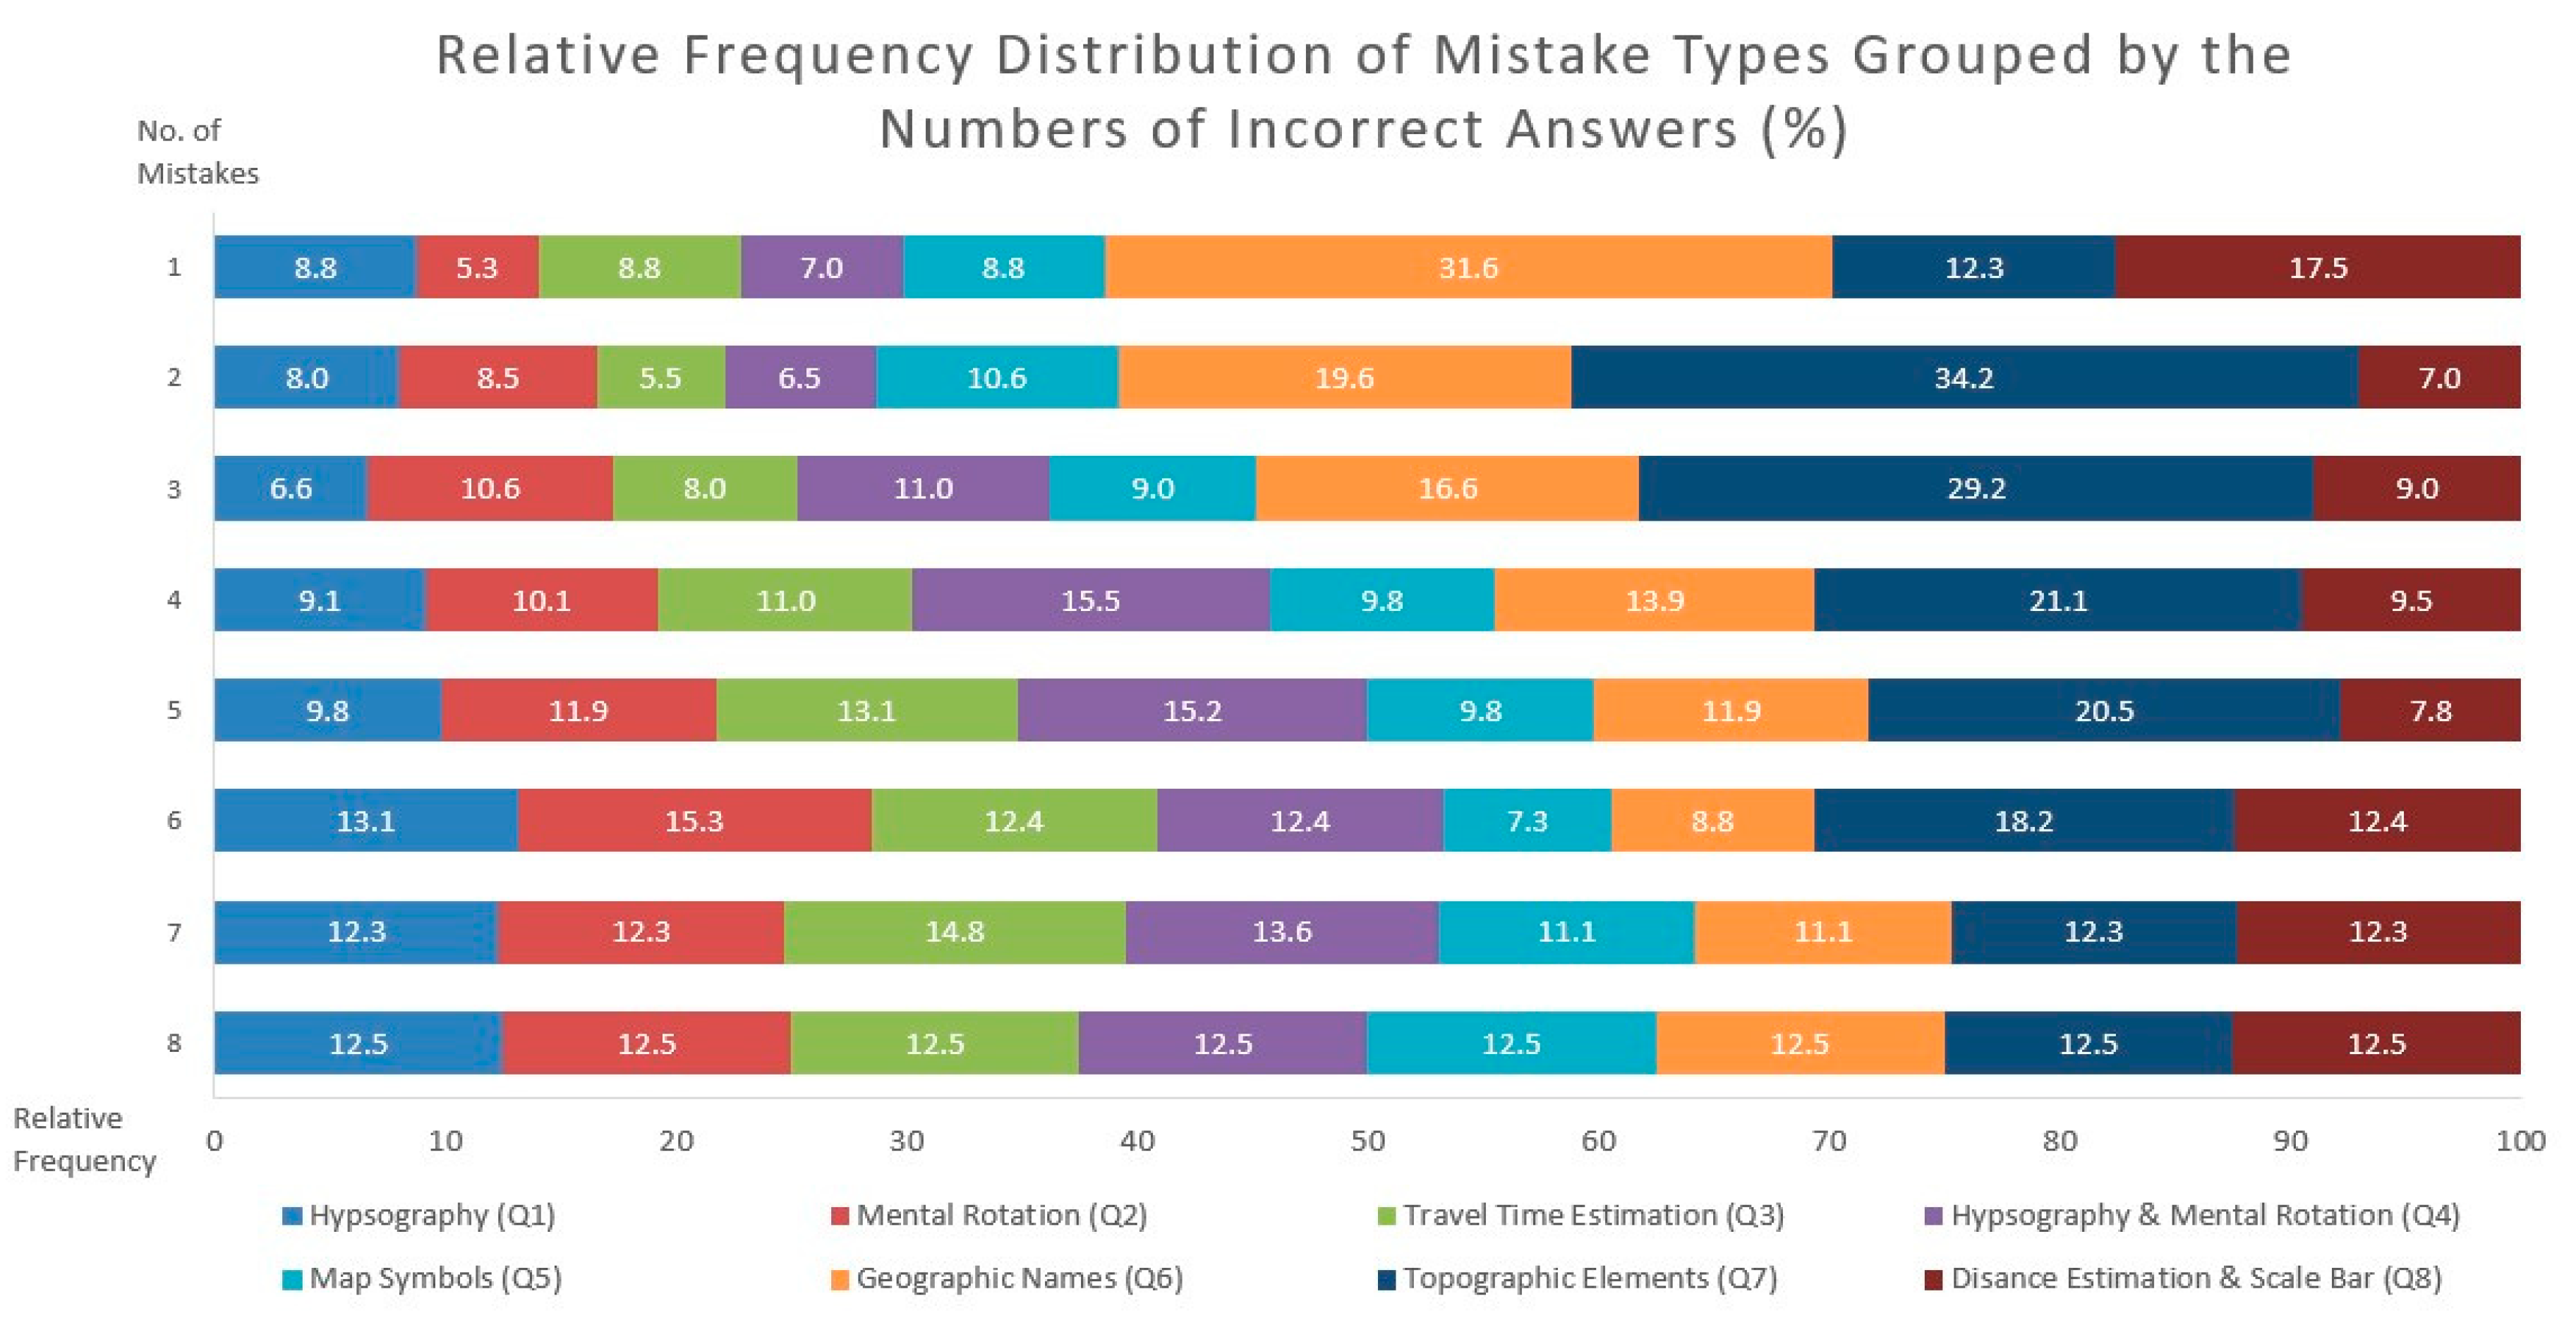
3.3. Focusing on the Errors
4. Discussion
4.1. On the Demographic Variables Most Related to Map Reading Competencies
4.2. On the Map Reading Performance Related to the Test Subjects’ Language
4.3. On Screen Size Affecting the Map-Reading Performance
4.4. On Specific Patterns in the Error Types
4.5. On Primary Map Use Scenarios and Practical Aspects
5. Conclusions
Supplementary Materials
Author Contributions
Funding
Data Availability Statement
Acknowledgments
Conflicts of Interest
References
- Hurst, P.; Clough, P. Will We Be Lost without Paper Maps in the Digital Age? J. Inf. Sci. 2013, 39, 48–60. [Google Scholar] [CrossRef]
- Speake, J. ‘I’ve Got My Sat Nav, It’s Alright’: Users’ Attitudes towards, and Engagements with, Technologies of Navigation. Cartogr. J. 2015, 52, 345–355. [Google Scholar] [CrossRef]
- Golledge, R.G. Human Wayfinding. In Applied Geography; Bailly, A., Gibson, L.J., Eds.; GeoJournal Library; Springer: Dordrecht, The Netherlands, 2004; Volume 77, pp. 233–252. ISBN 978-90-481-6656-5. [Google Scholar]
- Bjerva, T.; Sigurjónsson, T. Wayfinding by Means of Maps in Real-World Settings: A Critical Review. J. Navig. 2017, 70, 263–275. [Google Scholar] [CrossRef]
- Vörös, F.; Tompos, Z.; Kovács, B. Examination of Car Navigation Systems and UX Designs–Suggestion for a New Interface. Proc. Int. Cartogr. Assoc. 2019, 2, 1–7. [Google Scholar] [CrossRef]
- Jalayer, M.; Zhou, H.; Zhang, B. Evaluation of Navigation Performances of GPS Devices near Interchange Area Pertaining to Wrong-Way Driving. J. Traffic Transp. Eng. (Engl. Ed.) 2016, 3, 593–601. [Google Scholar] [CrossRef]
- Bunch, R.L.; Lloyd, R.E. The Cognitive Load of Geographic Information. Prof. Geogr. 2006, 58, 209–220. [Google Scholar] [CrossRef]
- Wiegand, P. Learning and Teaching with Maps; Routledge: London, UK, 2006; ISBN 978-0-203-47779-3. [Google Scholar]
- Lobben, A.K. Tasks, Strategies, and Cognitive Processes Associated With Navigational Map Reading: A Review Perspective. Prof. Geogr. 2004, 56, 270–281. [Google Scholar] [CrossRef]
- Arthurs, L.A.; Baumann, S.P.; Rice, J.M.; Litton, S.D. The Development of Individuals’ Map-Reading Skill: What Research and Theory Tell Us. Int. J. Cartogr. 2023, 9, 3–28. [Google Scholar] [CrossRef]
- Havelková, L.; Hanus, M. Map Skills in Education: A Systematic Review of Terminology, Methodology, and Influencing Factors. Rev. Int. Geogr. Educ. Online 2019. [Google Scholar] [CrossRef]
- Muir, S.P. Understanding and Improving Students’ Map Reading Skills. Elem. Sch. J. 1985, 86, 207–216. [Google Scholar] [CrossRef]
- Allen, G.L.; Miller Cowan, C.R.; Power, H. Acquiring Information from Simple Weather Maps: Influences of Domain-Specific Knowledge and General Visual–Spatial Abilities. Learn. Individ. Differ. 2006, 16, 337–349. [Google Scholar] [CrossRef]
- Kerkovits, K.; Szigeti, C. Relationships between the Distortions in Map Projections and the Usability of Small-Scale Maps. In Proceedings of the 7th International Conference on Cartography and Gis, Sozopol, Bulgaria, 18–23 June 2018; pp. 236–245. [Google Scholar]
- Kessler, F.C.; Battersby, S.E. Cognition and Perception of Map Projections: A Literature Review. Cartogr. Geogr. Inf. Sci. 2023, 1–16. [Google Scholar] [CrossRef]
- Gilhooly, K.J.; Wood, M.; Kinnear, P.R.; Green, C. Skill in Map Reading and Memory for Maps. Q. J. Exp. Psychol. Sect. A 1988, 40, 87–107. [Google Scholar] [CrossRef]
- Montello, D.R.; Lovelace, K.L.; Golledge, R.G.; Self, C.M. Sex-Related Differences and Similarities in Geographic and Environmental Spatial Abilities. Ann. Assoc. Am. Geogr. 1999, 89, 515–534. [Google Scholar] [CrossRef]
- Bein, F.L.; Hayes, J.J.; Jones, T.G. Fifteen Year Follow-Up Geography Skills Test Administered in Indiana, 1987 and 2002. J. Geogr. 2009, 108, 30–36. [Google Scholar] [CrossRef]
- Clarke, D. Are You Functionally Map Literate. In Proceedings of the 21st International Cartographic Conference (ICC), Durban, South Africa, 10–16 August 2003; Volume 10, pp. 713–719. [Google Scholar]
- Albert, G.; Ilyés, V.; Kis, D.; Szigeti, C.; Várkonyi, D. Testing the Map Reading Skills of University Students. In Proceedings of the 6th International Conference on Cartography and GIS, Albena, Bulgaria, 13–17 June 2016; Volume 1, pp. 188–199. [Google Scholar]
- Malinowski, J.C.; Gillespie, W.T. Individual Differences in Performance on a Large-Scale, Real-World Wayfinding Task. J. Environ. Psychol. 2001, 21, 73–82. [Google Scholar] [CrossRef]
- Albert, G. What Does an Archive Map Tell the Contemporary Map Readers. In Proceedings of the 9th International Workshop on Digital Approaches to Cartographic Heritage, Budapest, Hungary, 4–5 September 2014; pp. 1–11. [Google Scholar]
- Leung, L.-F.; Li, Z. Experimental Evaluation of the Effectiveness of Graphic Symbols on Tourist Maps. Cartography 2002, 31, 11–20. [Google Scholar] [CrossRef]
- Chang, K.; Antes, J.R. Sex and Cultural Differences in Map Reading. Am. Cartogr. 1987, 14, 29–42. [Google Scholar] [CrossRef]
- Lim, K.Y.T. Augmenting Spatial Intelligence in the Geography Classroom. Int. Res. Geogr. Environ. Educ. 2005, 14, 187–199. [Google Scholar] [CrossRef]
- Gilmartin, P.P.; Patton, J.C. Comparing the Sexes on Spatial Abilities: Map-Use Skills. Ann. Assoc. Am. Geogr. 1984, 74, 605–619. [Google Scholar] [CrossRef]
- Lloyd, R.E.; Bunch, R.L. Individual Differences in Map Reading Spatial Abilities Using Perceptual and Memory Processes. Cartogr. Geogr. Inf. Sci. 2005, 32, 33–46. [Google Scholar] [CrossRef]
- Bein, F.L. Baseline Geography Competency Test: Administered in Indiana Universities. J. Geogr. 1990, 89, 260–265. [Google Scholar] [CrossRef]
- Hemmer, I.; Hemmer, M.; Kruschel, K.; Neidhardt, E.; Obermaier, G.; Uphues, R. Which Children Can Find a Way through a Strange Town Using a Streetmap?—Results of an Empirical Study on Children’s Orientation Competence. Int. Res. Geogr. Environ. Educ. 2013, 22, 23–40. [Google Scholar] [CrossRef]
- Ooms, K.; De Maeyer, P.; Dupont, L.; Van Der Veken, N.; Van De Weghe, N.; Verplaetse, S. Education in Cartography: What Is the Status of Young People’s Map-Reading Skills? Cartogr. Geogr. Inf. Sci. 2016, 43, 134–153. [Google Scholar] [CrossRef]
- Liebenberg, E.C. Teaching Map Use in a Multicultural Environment. S. Afr. Geogr. J. 1998, 80, 111–117. [Google Scholar] [CrossRef]
- Ito, K.; Sano, Y. Cultural Differences in the Use of Spatial Information in Wayfinding Behavior. In Proceedings of the 25th International Cartographic Conference, Paris, France, 3–8 July 2011. [Google Scholar]
- Dillemuth, J.A. Navigation Tasks with Small-Display Maps: The Sum of the Parts Does Not Equal the Whole. Cartographica 2009, 44, 187–200. [Google Scholar] [CrossRef]
- Albert, G.; Ilyés, V.; Szigeti, C.; Kis, D.; Várkonyi, D. How Hard Is It to Design Maps for Beginners, Intermediates and Experts? In Advances in Cartography and GIScience; Peterson, M.P., Ed.; Lecture Notes in Geoinformation and Cartography; Springer International Publishing: Cham, Switzerland, 2017; pp. 239–253. ISBN 978-3-319-57335-9. [Google Scholar]
- Wei, B.; Schiewe, J. Influence of Viewing Field on Zoom Levels in Pedestrian Orientation Task Using Smartphones. Proc. Int. Cartogr. Assoc. 2019, 2, 1–9. [Google Scholar] [CrossRef][Green Version]
- Ramos, A.P.M.; Decanini, M.M.S.; Pugliesi, E.A.; Tachibana, V.M.; Oliveira, R.F.D.; Soares, J.M.M. Preference for Map Scale of In-Car Route Guidance and Navigation System. Bol. Ciênc. Geod. 2016, 22, 472–491. [Google Scholar] [CrossRef]
- Pugliesi, E.A.; Decanini, M.M.S.; Tachibana, V.M. Evaluation of the Cartographic Communication Performance of a Route Guidance and Navigation System. Cartogr. Geogr. Inf. Sci. 2009, 36, 193–207. [Google Scholar] [CrossRef]
- Imhof, E. Positioning Names on Maps. Am. Cartogr. 1975, 2, 128–144. [Google Scholar] [CrossRef]
- Soviet Topographic Map Symbols TM 30-548; Technical Manual; US Headquarters, Department of the Army: Washington, DC, USA, 1958; p. 102.
- Kent, A.J.; Vujakovic, P. Stylistic Diversity in European State 1: 50 000 Topographic Maps. Cartogr. J. 2009, 46, 179–213. [Google Scholar] [CrossRef]
- Štěrba, Z.; Šašinka, Č.; Stachoň, Z.; Štampach, R.; Morong, K. Selected Issues of Experimental Testing in Cartography; Masaryk University Brno: Brno, Czech Republic, 2015. [Google Scholar]
- Kim, H.-Y. Statistical Notes for Clinical Researchers: Chi-Squared Test and Fisher’s Exact Test. Restor Dent Endod 2017, 42, 152. [Google Scholar] [CrossRef]
- Field, A. Discovering Statistics Using SPSS: And Sex and Drugs and Rock’n’Roll, 3rd ed.; Sage: Los Angeles, CA, USA, 2012; ISBN 978-1-84787-906-6. [Google Scholar]
- Clark, D.; Reynolds, S.; Lemanowski, V.; Stiles, T.; Yasar, S.; Proctor, S.; Lewis, E.; Stromfors, C.; Corkins, J. University Students’ Conceptualization and Interpretation of Topographic Maps. Int. J. Sci. Educ. 2008, 30, 377–408. [Google Scholar] [CrossRef]
- Hund, A.M.; Haney, K.H.; Seanor, B.D. The Role of Recipient Perspective in Giving and Following Wayfinding Directions. Appl. Cogn. Psychol. 2008, 22, 896–916. [Google Scholar] [CrossRef]
- Padgitt, A.J.; Hund, A.M. How Good Are These Directions? Determining Direction Quality and Wayfinding Efficiency. J. Environ. Psychol. 2012, 32, 164–172. [Google Scholar] [CrossRef]
- McCormack, G.R.; Cerin, E.; Leslie, E.; Du Toit, L.; Owen, N. Objective Versus Perceived Walking Distances to Destinations: Correspondence and Predictive Validity. Environ. Behav. 2008, 40, 401–425. [Google Scholar] [CrossRef]
- Sims, D.; Matthews, S.A.; Bopp, M.J.; Rovniak, L.S.; Poole, E. Predicting Discordance between Perceived and Estimated Walk and Bike Times among University Faculty, Staff, and Students. Transp. A Transp. Sci. 2018, 14, 691–705. [Google Scholar] [CrossRef]
- Ralph, K.M.; Smart, M.J.; Noland, R.B.; Wang, S.; Cintron, L. Is It Really Too Far? Overestimating Walk Time and Distance Reduces Walking. Transp. Res. Part F Traffic Psychol. Behav. 2020, 74, 522–535. [Google Scholar] [CrossRef]
- Deeb, R.; Ooms, K.; Vanopbroeke, V.; Maeyer, P.D. Evaluating the Efficiency of Typographic Design: Gender and Expertise Variation. Cartogr. J. 2014, 51, 75–86. [Google Scholar] [CrossRef]
- Rego, M.P.D.; Pugliesi, E.A.; Tachibana, V.M. The Positioning of Street Names on Egocentrically Referenced Maps: Assessment of Reading Time. Bol. Ciênc. Geod. 2020, 26, e2020017. [Google Scholar] [CrossRef]
- Liu, Y. Effect of Advanced Traveler Information System Displays on Younger and Older Drivers’ Performance. Displays 2000, 21, 161–168. [Google Scholar] [CrossRef]
- Szigeti-Pap1; Kis; Albert. Public Database of Multilingual Map Reading Test. Available online: https://zenodo.org/records/8348864 (accessed on 15 September 2023).


| No. of Question | No. of Map | Competence Targeted by Test Question | Primary Scenario of Use | Type of Test Question |
|---|---|---|---|---|
| Q1 | 1. (Figure 1) | Interpretation of Hypsography | Wayfinding | Surveying, Mapping |
| Q2 | 1. (Figure 1) | Orientation Skill and Mental Rotation | Wayfinding | Mapping |
| Q3 | 1. (Figure 1) | Distance and Travel Time Estimation | Wayfinding | Mapping, Completing |
| Q4 | 2. (Figure 2) | Interpretation of Hypsography and Mental Rotation | Wayfinding | Surveying, Mapping |
| Q5 | 3. (Figure 3) | Interpretation of Map Symbols | Navigation & wayfinding | Recognition |
| Q6 | 3. (Figure 3) | Interpretation of Geographic Names | Navigation | Recognition, Mapping |
| Q7 | 4. (Figure 4) | Interpretation of Topographic Objects | Navigation & wayfinding | Recognition, Surveying |
| Q8 | 4. (Figure 4) | Use of a Scale Bar, and Distance Estimation | Navigation & wayfinding | Completing |
| All | Gender | Qualification | Map Reading Skill | Age Category | ||||||||
|---|---|---|---|---|---|---|---|---|---|---|---|---|
| Female (56%) | Male (44%) | Higher (89%) | Secondary (7%) | Primary (4%) | Beginner (26%) | Expert (74%) | 0–20 (15%) | 21–25 (37%) | 26–30 (16%) | 31– (32%) | ||
| A | B | A | B | C | A | B | A | B | C | D | ||
| Q1 | 76.1 | 76.6 | 75.6 | 77.5 | 66.7 | 63.6 | 69.5 | 78.4 a | 69.2 | 82.2 | 77.2 | 71.8 |
| Q2 | 71.8 | 72.4 | 71.1 | 72.4 | 66.7 | 68.2 | 71.0 | 72.1 | 69.2 | 70.2 | 74.7 | 73.6 |
| Q3 | 73.4 | 74.5 | 72.0 | 73.3 | 72.2 | 77.3 | 65.6 | 76.1 a | 66.7 | 71.7 | 81.0 | 74.8 |
| Q4 | 67.9 | 71.0 | 64.0 | 70.0 b,c | 52.8 | 50.0 | 58.0 | 71.3 a | 53.8 | 64.9 | 69.6 | 77.3 a |
| Q5 | 75.1 | 74.1 | 76.4 | 74.6 | 80.6 | 77.3 | 73.3 | 75.8 | 83.3 | 73.8 | 75.9 | 72.4 |
| Q6 | 60.2 | 64.3 | 56.0 | 62.5 c | 55.6 | 31.8 | 53.4 | 63.2 | 46.2 | 51.3 | 62.0 | 77.9 a,b,c |
| Q7 | 38.4 | 33.9 | 44.0 a | 38.2 | 41.7 | 36.4 | 28.2 | 41.8 a | 29.5 | 34.6 | 34.2 | 49.1 a,b |
| Q8 | 75.1 | 76.9 | 72.9 | 76.4 | 63.9 | 68.2 | 69.5 | 77.1 | 67.9 | 77.5 | 78.5 | 74.2 |
| Total | 67.3 | 68.0 | 66.5 | 66.5 | 62.5 | 59.1 | 61.1 | 69.5 | 60.7 | 65.8 | 69.1 | 71.4 |
| Total | Language | ||||||
|---|---|---|---|---|---|---|---|
| Hungarian (54%) | English (8%) | German (5%) | Romanian (19%) | Spanish (8%) | Bulgarian (6%) | ||
| A | B | C | D | E | F | ||
| Q1 | 76.1 | 74.6 | 84.1 | 91.7 | 71.9 | 73.2 | 83.3 |
| Q2 | 71.8 | 75.0 d | 79.5 | 87.5 | 58.3 | 65.9 | 70.0 |
| Q3 | 73.4 | 73.6 | 75.0 | 70.8 | 74.0 | 75.6 | 66.7 |
| Q4 | 67.9 | 66.7 | 75.0 | 70.8 | 74.0 | 53.7 | 66.7 |
| Q5 | 75.1 | 83.0 b,e | 36.4 | 70.8 | 78.1 b | 61.0 | 73.3 b |
| Q6 | 60.2 | 46.0 | 95.5 a,f | 79.2 a | 81.3 a,f | 75.6 a | 43.3 |
| Q7 | 38.4 | 48.2 d,f | 38.6 | 50.0 d,f | 19.8 | 29.3 | 10.0 |
| Q8 | 75.1 | 77.2 | 70.5 | 83.3 | 69.8 | 68.3 | 83.3 |
| 1 Mistake | 2 Mistake | 3 Mistake | 4 Mistake | 5 Mistake | 6 Mistake | 7 Mistake | ||||||||
|---|---|---|---|---|---|---|---|---|---|---|---|---|---|---|
| Prop. | p | Prop. | p | Prop. | p | Prop. | p | Prop. | p | Prop. | p | Prop. | p | |
| Q1 | 8.8 | 0.547 | 8.0 | 0.067 | 6.6 | 0.001 | 9.1 | 0.074 | 9.8 | 0.245 | 13.1 | 0.796 | 12.3 | 1.00 |
| Q2 | 5.3 | 0.110 | 8.5 | 0.107 | 10.6 | 0.383 | 10.1 | 0.234 | 11.9 | 0.847 | 15.3 | 0.302 | 12.3 | 1.00 |
| Q3 | 8.8 | 0.547 | 5.5 | 0.002 | 8.0 | 0.018 | 11.0 | 0.497 | 13.1 | 0.771 | 12.4 | 1.00 | 14.8 | 0.502 |
| Q4 | 7.0 | 0.313 | 6.5 | 0.010 | 11.0 | 0.485 | 15.5 | 0.126 | 15.2 | 0.208 | 12.4 | 1.00 | 13.6 | 0.737 |
| Q5 | 8.8 | 0.547 | 10.6 | 0.454 | 9.0 | 0.067 | 9.8 | 0.149 | 9.8 | 0.245 | 7.3 | 0.070 | 11.1 | 0.867 |
| Q6 | 31.6 | 0.001 | 19.6 | 0.005 | 16.6 | 0.036 | 13.9 | 0.445 | 11.9 | 0.847 | 8.8 | 0.243 | 11.1 | 0.867 |
| Q7 | 12.3 | 1.00 | 34.2 | 0.001 | 29.2 | 0.001 | 21.1 | 0.001 | 20.5 | 0.001 | 18.2 | 0.251 | 12.3 | 1.00 |
| Q8 | 17.5 | 0.232 | 7.0 | 0.018 | 9.0 | 0.067 | 9.5 | 0.107 | 7.8 | 0.025 | 12.4 | 1.00 | 12.3 | 1.00 |
Disclaimer/Publisher’s Note: The statements, opinions and data contained in all publications are solely those of the individual author(s) and contributor(s) and not of MDPI and/or the editor(s). MDPI and/or the editor(s) disclaim responsibility for any injury to people or property resulting from any ideas, methods, instructions or products referred to in the content. |
© 2023 by the authors. Licensee MDPI, Basel, Switzerland. This article is an open access article distributed under the terms and conditions of the Creative Commons Attribution (CC BY) license (https://creativecommons.org/licenses/by/4.0/).
Share and Cite
Szigeti-Pap, C.; Kis, D.; Albert, G. Understanding Map Misinterpretation: Factors Influencing Correct Map Reading and Common Errors. ISPRS Int. J. Geo-Inf. 2023, 12, 479. https://doi.org/10.3390/ijgi12120479
Szigeti-Pap C, Kis D, Albert G. Understanding Map Misinterpretation: Factors Influencing Correct Map Reading and Common Errors. ISPRS International Journal of Geo-Information. 2023; 12(12):479. https://doi.org/10.3390/ijgi12120479
Chicago/Turabian StyleSzigeti-Pap, Csaba, Dávid Kis, and Gáspár Albert. 2023. "Understanding Map Misinterpretation: Factors Influencing Correct Map Reading and Common Errors" ISPRS International Journal of Geo-Information 12, no. 12: 479. https://doi.org/10.3390/ijgi12120479
APA StyleSzigeti-Pap, C., Kis, D., & Albert, G. (2023). Understanding Map Misinterpretation: Factors Influencing Correct Map Reading and Common Errors. ISPRS International Journal of Geo-Information, 12(12), 479. https://doi.org/10.3390/ijgi12120479