Review

Toward 3D Property Valuation—A Review of Urban 3D Modelling Methods for Digital Twin Creation

Faculty of Geo-Information Science and Earth Observation (ITC), University of Twente, 7514 AE Enschede, The Netherlands
*
Author to whom correspondence should be addressed.
ISPRS Int. J. Geo-Inf. 2023, 12(1), 2; https://doi.org/10.3390/ijgi12010002
Submission received: 9 September 2022 / Revised: 29 November 2022 / Accepted: 14 December 2022 / Published: 22 December 2022

Abstract

:
Increasing urbanisation has inevitably led to the continuous construction of buildings. Urban expansion and densification processes reshape cities and, in particular, the third dimension (3D), thus calling for a technical shift from 2D to 3D for property valuation. However, most property valuation studies employ 2D geoinformation in hedonic price models, while the benefits of 3D modelling potentially brought for property valuation and the general context of digital twin (DT) creation are not sufficiently explored. Therefore, this review aims to identify appropriate urban 3D modelling method(s) for city DT, which can be used for 3D property valuation (3DPV) in the future (both short-term and long-term). We focused on 3D modelling studies investigating buildings and urban elements directly linked with residential properties. In total, 180 peer-reviewed journal papers were selected between 2016 and 2020 with a narrative review approach. Analytical criteria for 3D modelling methods were explicitly defined and covered four aspects: metadata, technical characteristics, users’ requirements, and ethical considerations. From this, we derived short-term and long-term prospects for 3DPV. The results provide references for integrating 3D modelling and DT in property valuation and call for interdisciplinary collaboration including researchers and stakeholders in the real estate sector, such as real estate companies, house buyers and local governments.

1. Introduction and Background

1.1. General Introduction

Urbanisation has taken place worldwide at an unprecedented rate since the last century. Currently, 55% of the world’s population, approximately 4.4 billion, live in urban areas [1]. Attracted by flourishing economic activities and public service, the number of urbanites will increase to accommodate about 6.7 billion people by 2050, 68% of the world population [2]. Due to limited land availability, urban areas will become continuously compact with increased numbers of residential high-rise buildings to shelter urban residents [3]. Rising property prices in the residential market can be observed globally, especially in metropolitan areas and fast-developing countries [4,5,6]. Target 11.1 of the Sustainable Development Goals (SDGs)—safe and affordable housing of sustainable cities and communities—encounters grave challenges [2]. Is the property price worth its market transaction value, and what external factors influence it? Such questions need to be addressed by property valuation to determine a fair value based on price-influential factors measured objectively. As a proxy among various stakeholders in the real estate sector (e.g., government, real estate company, and buyer), property valuation plays a critical factor in every country’s economy with various functions, such as maintaining a healthy property market and ensuring affordable housing [7].
Undoubtedly, the continuous high-rise residential building construction has increased the spatial complexity in the third dimension (3D) (e.g., changing the city skyline). It also adds uncertainties to residents living therein concerning living quality issues (e.g., whether the apartment has satisfying sunlight conditions). Figure 1 simulates a 3D environmental scenario with different external 3D factors. Sunlight conditions may vary significantly from the 1st to the 30th floor due to blocks from adjacent buildings and trees. In addition, the properties close to the road may have worse air quality and louder noise than those remote from the road due to traffic influx [8]. Nevertheless, as evidenced by the literature, most valuation studies apply 2D geoinformation to generate 2D factors in the hedonic price model (HPM), a model that has been widely adopted for estimating property prices by setting a variety of attributes [9,10,11,12]. Environmental, locational, and physical attributes are commonly included in HPM, whereas 3D attributes cannot be reflected if 3D is not considered. Models lacking 3D geoinformation lower the reliability of the valuation results and are less informative and comprehensive in complex urban areas with large amounts of high-rise buildings.
Nevertheless, the lack of 3D geoinformation can be compensated by creating a digital twin (DT) to bridge the physical and virtual worlds. A DT refers to a digital replica of physical objects and systems, in which they can integrate sensors and internet of things (IoT) data and apply artificial intelligence (AI) and data analytics for 3D model creation, performance optimisation of real-time representations, and dynamic simulations [13,14]. It has been extensively applied to fields such as manufacturing and industry design [15], and the current research on buildings and cities is a hot issue worth exploring [16]. To create city DT models, on one hand, various 3D modelling methods, which we will reflect on later for more details, have been used [17]. On the other hand, the increasing availability of 3D data and software provides opportunities to understand the complexity of urban areas from a 3D perspective. Researchers have attempted to analyse and visualise urban elements varying in 3D, such as air quality [18], noise [19], and solar potential [20], but less attention is paid to property valuation. Studies on building frameworks for 3D property valuation (3DPV) within different country contexts [21,22,23] dive into legal and theoretical aspects. The empirical literature is fragmented, with different foci, methods, and data. Thus, research transferability is questioned [4,21].
Currently, 3D models for DT creation in urban areas are observed at various scales, from a single building to a continent-scale, for different research purposes. Several reviews already report state-of-the-art progress, including subjects such as 3D city modelling, building information models (BIM) and geographical information systems (GIS). Biljecki, Stoter [22] focused on 3D city modelling and DT applications, and later, Biljecki, Kumar [23] focused on the developments of the City Geography Markup Language Application Domain Extension (CityGML ADE). Trubka, Glackin [24] reviewed different platforms/software capable of 3D visualisation. Liu, Wang [25] and Wang, Pan [26] reported BIM and GIS integration progress. Kalogianni, van Oosterom [27] studied the current status of 3D land administration. However, a research gap exists in identifying suitable urban 3D modelling methods and creating city DTs specifically for 3DPV [22,28,29], and this review endeavours to fill this gap. Relevant research is still in its embryonic state. 3DPV requires a tailor-made solution to support different stakeholders in the real estate sector and provide robust socio-economic explanations of property values. These facts make 3DPV distinguishable from purely technical fields, which may be relatively isolated and thus lack operationalisation in practice.
To be concise, the research objective of this themed review is to identify appropriate urban 3D modelling method(s) for city DTs, which can be used for 3DPV. The main contributions include (1) providing the background of 3DPV with relevant research and identifying its essential features, (2) creating a literature inventory of urban 3D modelling methods for 3DPV, (3) constructing a detailed analysis based on self-defined analytical criteria, and (4) proposing prospects for 3DPV. Our analysis may provide references when researchers attempt to apply 3D modelling and DTs for 3DPV. We would like to highlight the following key points:
  • We focus on the residential properties of high-rise buildings in urban areas.
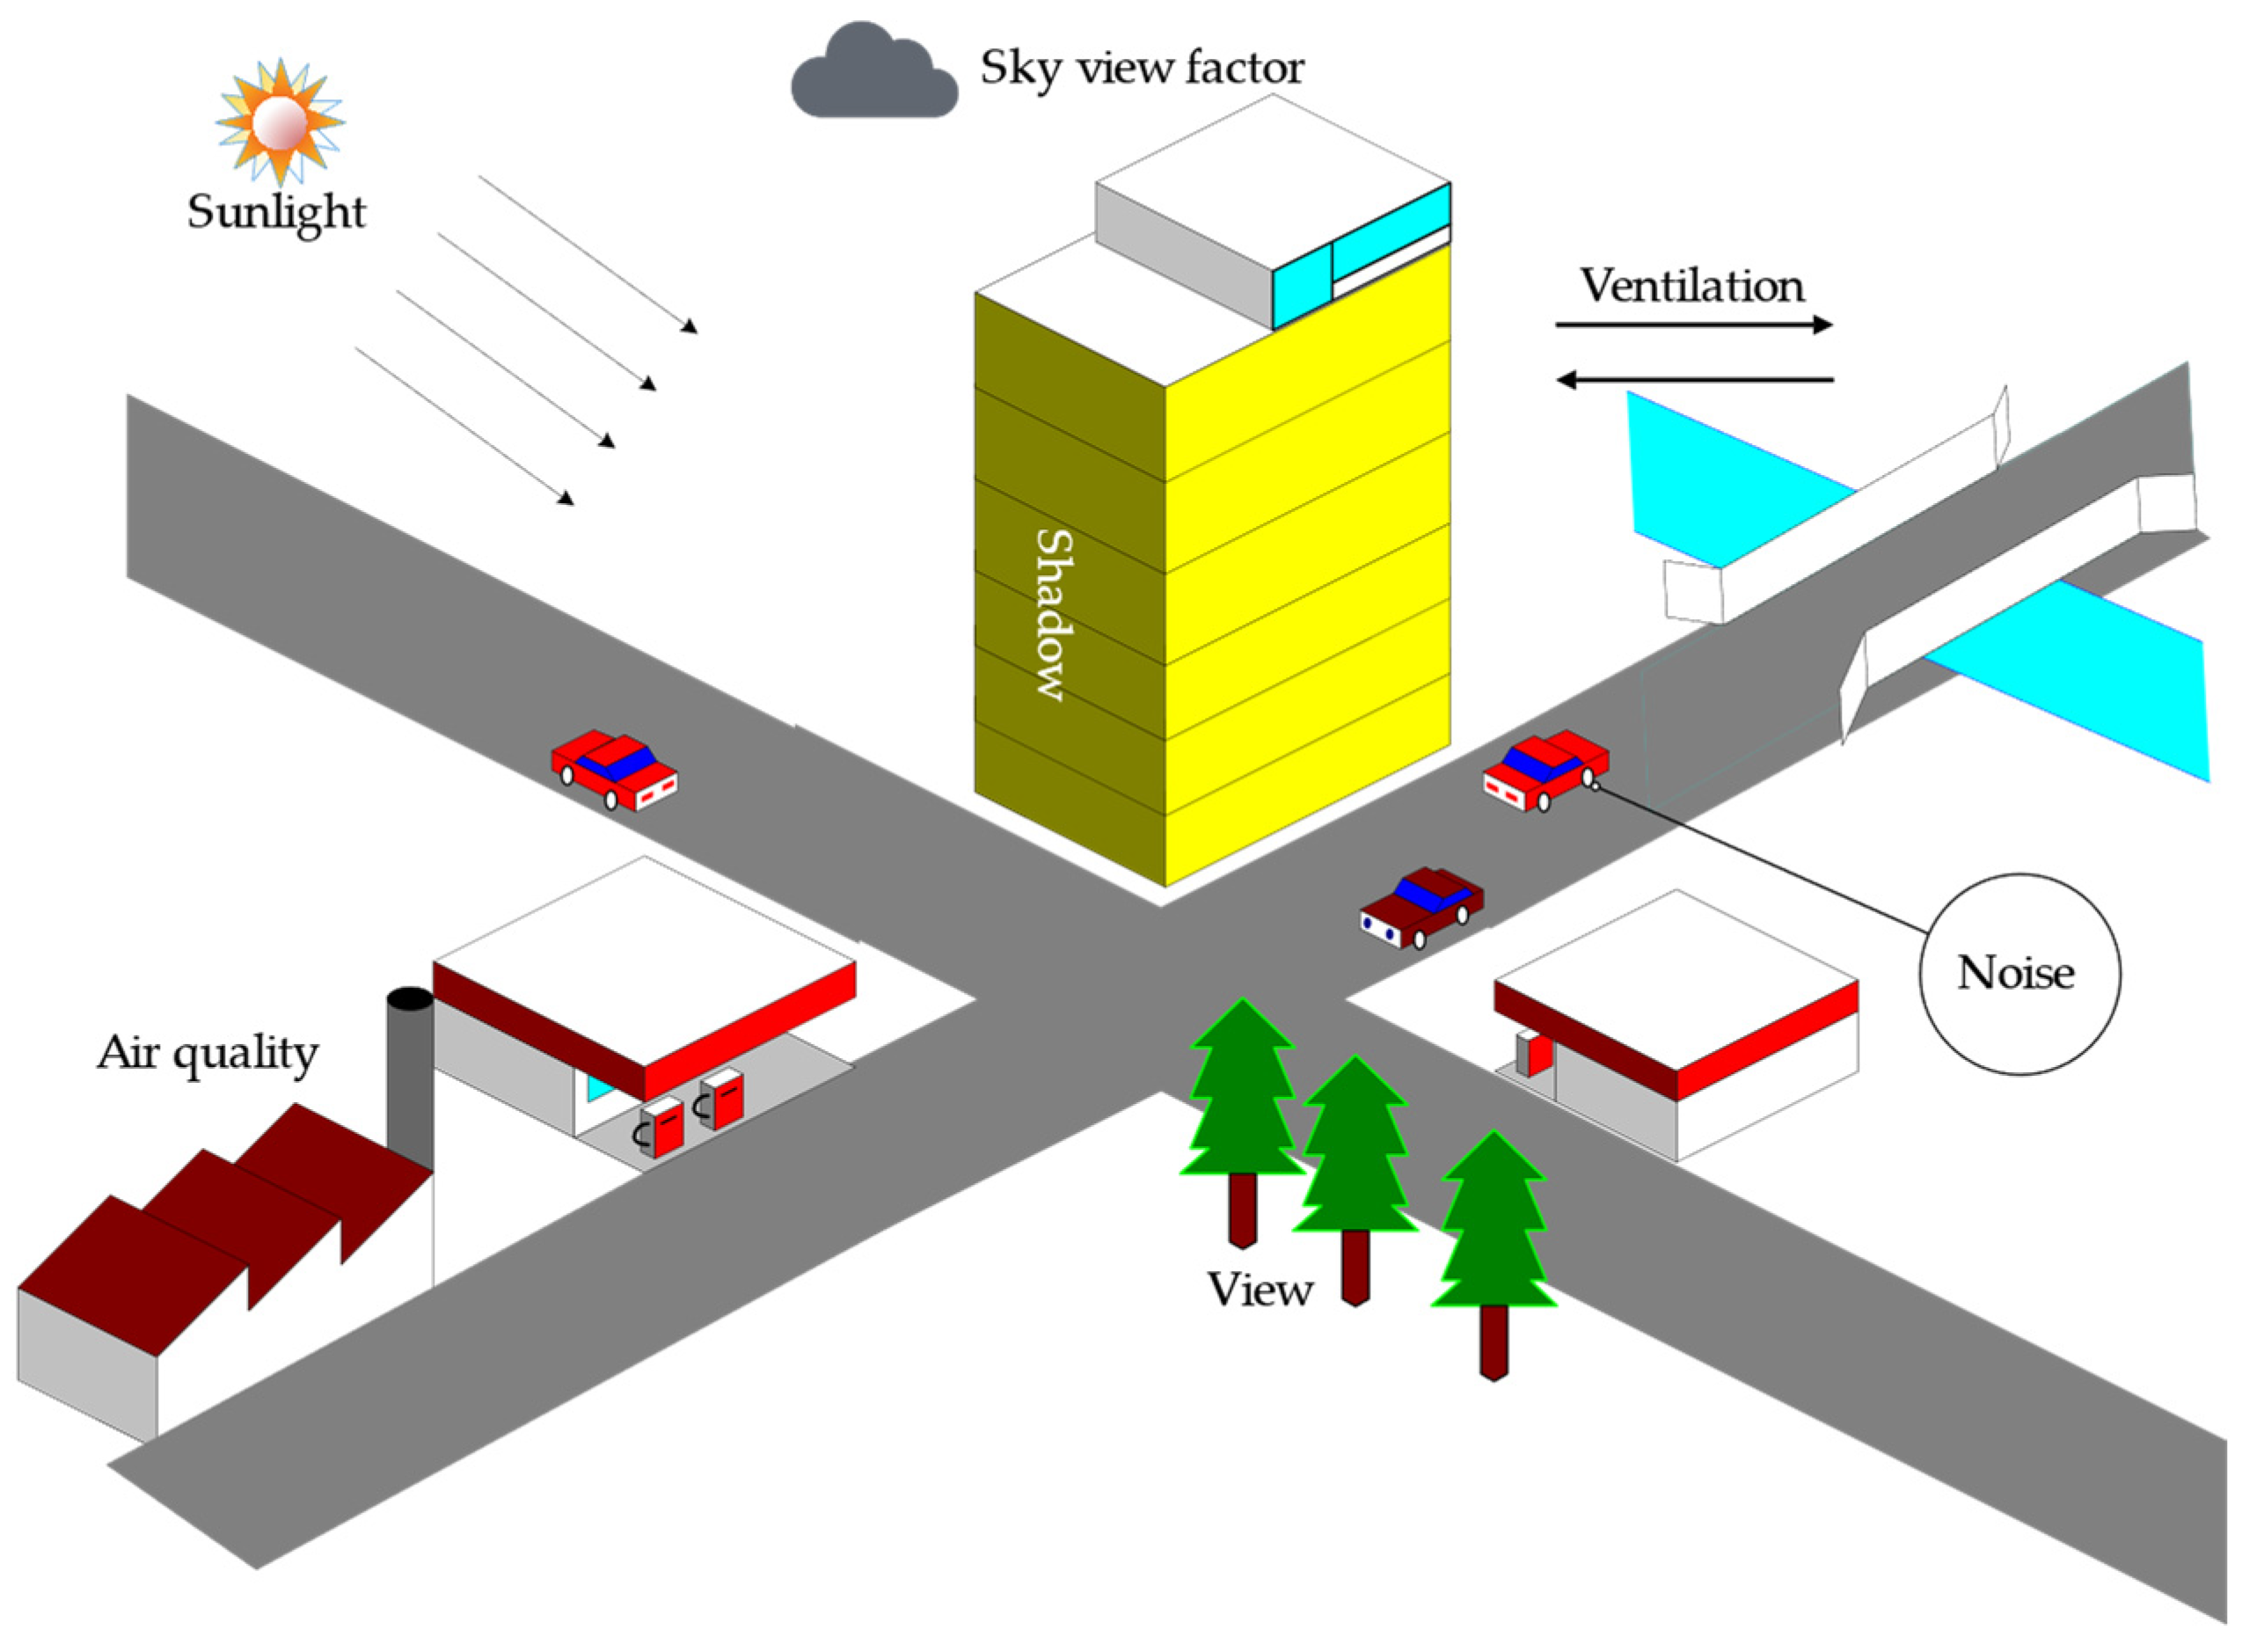
  • 3D factors refer to those changing with the building height in the vertical dimension (e.g., daylight and viewshed). They can be quantified by 3D modelling and be a proxy in HPM for property valuation.
  • The terminology is slightly different in the literature, in which “property value”, “property price”, and “housing price” are considered the same.
The remainder of this paper proceeds as follows. Section 1.2. provides a background of 3DPV with relevant research and its features. Section 2 outlines the methodology with a detailed search strategy and self-defined analytical criteria. A detailed analysis of 3D modelling methods is in Section 3. Based on Section 3, we propose prospects for 3DPV to deal with challenges in various stages as knowledge advances by steps, not by leaps (Section 4.1 and Section 4.2). They are organised according to the analytical criteria (Section 2.4) to provide an overview of which requirements they may satisfy. We also deliver the comparison between the two prospects in Section 4.3. Section 4 scratches ideas of how 3DPV can be conducted and developed in the future, considering no mature paradigm or guideline has been put forward in this field. This review finishes with a conclusion in Section 5.

1.2. The Background of Property Valuation and Its Development toward 3D

1.2.1. What Is Property Valuation?

Property valuation has a long research history since people started to study how to measure the actual value of properties. It is a professional activity of considering a variety of factors and estimating the property value at a given time by qualified valuers [30]. Therefore, it requires interdisciplinary knowledge of legal, technical, and economic aspects. Currently, there are three widely-used valuation methods [28]: the comparative approach, the income approach, and the cost approach. Valuers widely adopt them in practice, yet they are more suitable for the valuation of single cases. When a large number of valuation results are needed in a relatively short time, mass property valuation aiming for solid modelling and automation is preferred to reduce the cost and human resources [31]. Thus, methods with greater statistical capabilities and computational efficiency should be adopted to handle the spatial heterogeneity among the properties. As introduced earlier, HPM is currently the most frequently used for mass property valuation [32,33].
Based on the theories proposed by Lancaster [12] and Rosen [11], HPM has been widely recognised as a consistent and general theoretical basis for estimating the property value by deconstructing the property characteristics in different attributes (e.g., structural, locational, and environmental attributes) [34]. There are several factors under each attribute. The property value includes a variety of factors, and each of them contributes to the total value. In this way, in the valuation process, an economic value to the non-market components such as environmental amenities can be added [35]. The structural attributes consist of physical characteristics of the property, such as the floor area and the number of rooms. The locational attributes include access and distance to public goods and specified facilities (e.g., park and hospital). The environmental attributes include the characteristics of the property’s surroundings (e.g., noise and air quality). The above-mentioned attributes have extensively been explored in 2D [36,37,38]; however, the third/vertical dimension receives less attention. Without including 3D factors, the influence of vertical spatial heterogeneity on property value is ignored, especially in dynamic, developing urban areas with generous amounts of high-rise buildings. Moreover, with the technological revolution, it becomes more possible to extract 3D factors. In this way, 3DPV brings new perspectives and therefore improves the credibility of the valuation results. Thus, we proceed with a brief review of the relevant research on 3DPV in the following section.

1.2.2. The Relevant Research of 3DPV

In general, only a few studies have paid attention to this topic [39]. The existing papers can be classified into three types: empirical case studies, overarching conceptual design, and 3D visualization of property prices (Figure 2).
(1)
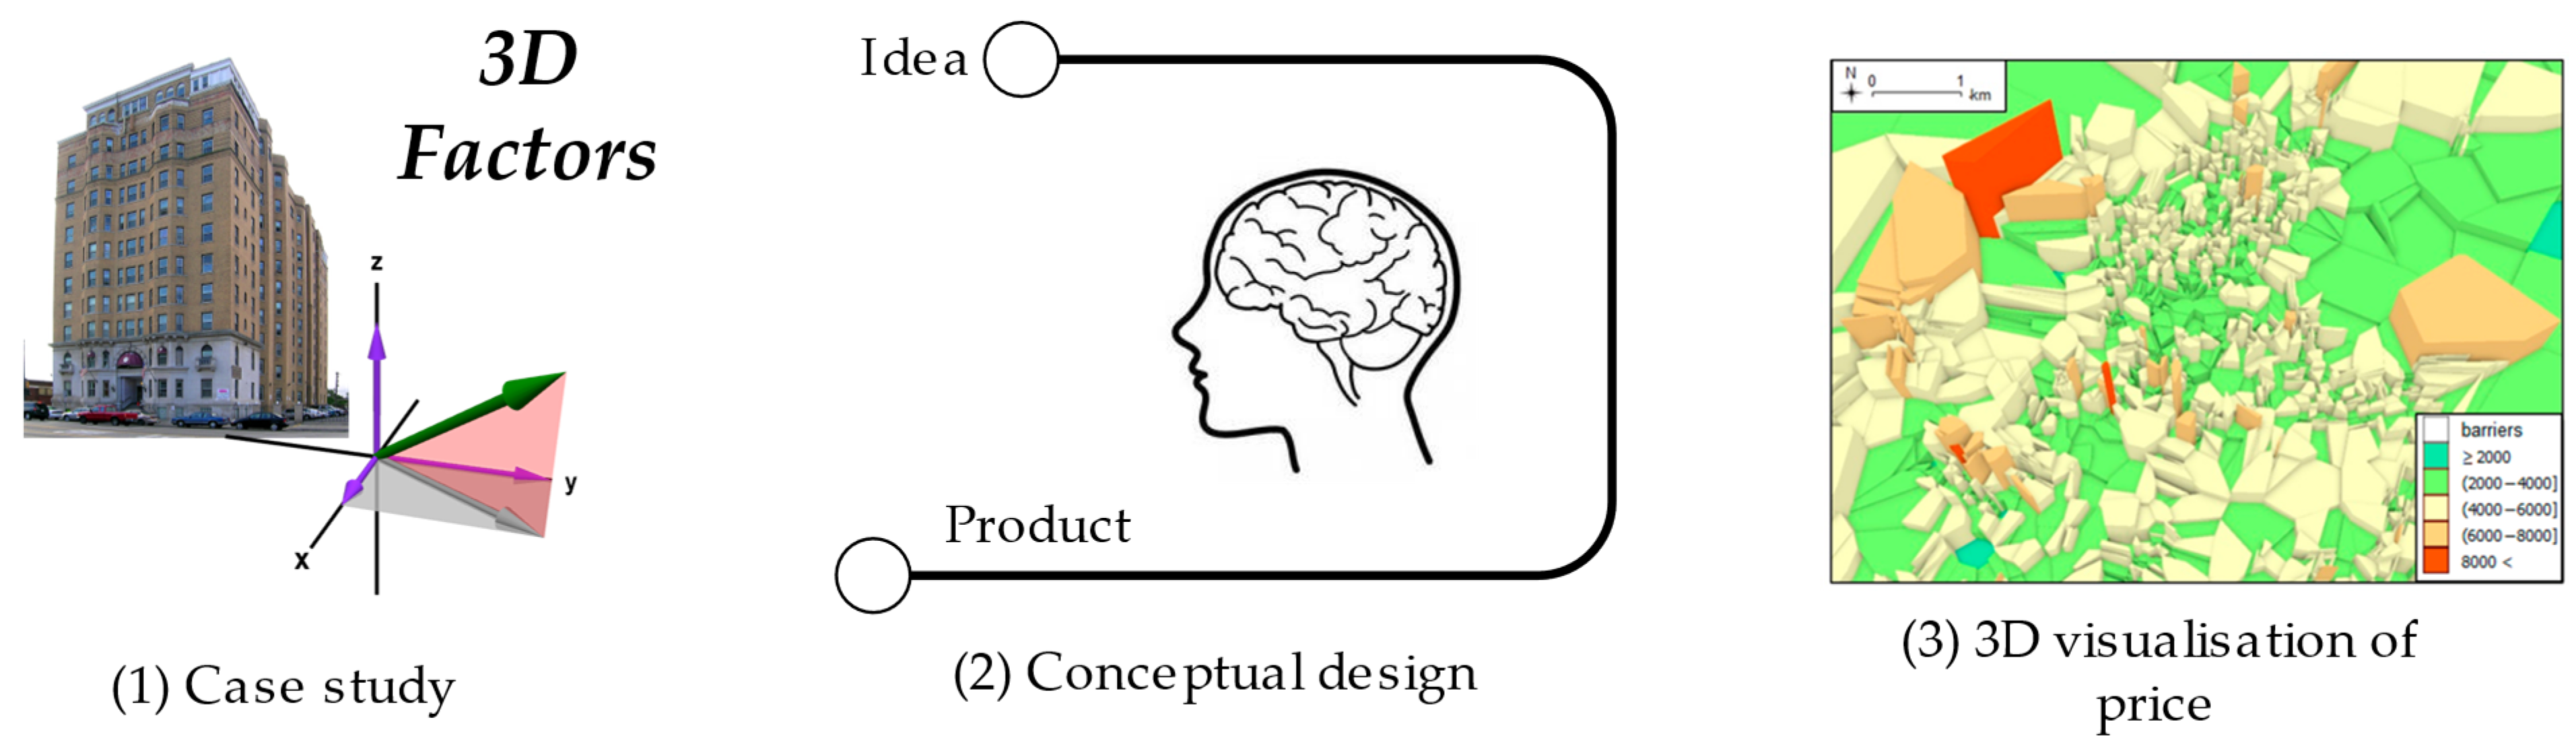
Case studies. In these studies, different 3D factors were quantified in software and added to HPM. View in different forms is the most frequently-used factor among them and shows high efficiency in HPM [41]. Yu, Han [21] proved that the sea view promoted the property price by an average of 15%. Yin and Hastings [42] confirmed the positive economic impact of Niagara Falls’ views on hotel revenues, in which view corridors, shadow effects, and view potentials were analysed. Based on their findings, the ease of building height regulations to allow high-rise hotels were suggested. Chen, Liu [43] explored the potential of geo-tagged user-generated images in housing price estimation and considered if can be used as a supplementary data source. Lee, Lee [44] proposed a visual perception model to analyse natural landscape views on the housing prices of apartments in Seoul. They proved that natural landscape views influenced the prices positively with unequal marginal impacts (e.g., the higher-priced apartments had higher price appreciation). In addition to this, Ying, Koeva [4] used four 3D factors in HPM: viewshed, SVF, building orientation, and daylight. Their comparison of 2D and 3D models reflected that the 3D one estimated property values more accurately. On a more refined scale, Celik Simsek and Uzun [45] built a 3D virtual BIM with condominium units and obtained 3D-quantified factors that affected the value of each condominium, such as sunlight, wind status, and openness of view. Their findings proved the feasibility of constructing a 3D spatial analysis on a condominium-scale. Overall, we observe an extensive utilisation of ready-to-go software while the unique methods and lack of follow-up research hinder generalisation and transferability to other areas.
(2)
Overarching conceptual design. These studies focus on conceptual design rather than solving real-world problems. 3D Cadastre may be the best-known among published attempts, and progress has been greatly achieved in countries such as the Netherlands [39], Turkey [29], and Slovenia [46]. 3DPV and 3D cadastre can be mutual-beneficial. On one hand, 3DPV use accurate legal documentation from 3D cadastre to generate more accurate estimates of values; on the other hand, the values can serve as a 3D legal attribute for cadastre. A 3D cadastre is a reliable and verified data source to provide structural, locational, and environmental attributes of properties. In addition, Kara, van Oosterom [47] proved that 3D data support property valuation within the land administration domain model (LADM), one of the main topics in 3D cadastre, in which visibility and viewshed analysis were the research foci. El Yamani, Hajji [28] investigated the 3D factors that may pose a significant influence on property value and proposed the corresponding 3D technical requirements, which can be referred to for further studies.
Nevertheless, only having a 3D cadastre at the legal aspect is not enough if spatial analysis, visualisation, and other dynamic interactive functions are not realised. Han, Zhang [48] presented a conceptualised monitoring platform of the house price index based on 3D GIS in Shenzhen, China. It adopted a browser/server (B/S) and three-layer structure with a database, a data interface, and a function framework to provide the latest and accurate property price-related information for stakeholders in the real estate sector. Similarly, Emekli and Guney [49] proposed a 3D web-based framework for property selection decision-making, which consists of basic structured query language (SQL) spatial queries, geometric and semantic information storage, and different visualisation modes. The two studies were user-oriented to provide an optimal structure for property-related data storage and services to different stakeholders. These frameworks/platforms were designed theoretically or experimented with small datasets. More experiments in both technical and theoretical fields are essential before putting into practice.
(3)
3D visualisation of property prices. Zhang, Lu [50] visualised the spatial morphology of housing prices in 3D by digital elevation model (DEM)-based analysis in Wuhan, China, which enhanced the spatial interpretation of the complex spatial pattern of housing prices. Agarwal, Fan [51] created 3D heat maps to represent the value dynamics from 1995 to 2017 in Singapore, and they managed to capture spatio-temporal changes in price appreciation. Belej and Figurska [40] revealed spatial discontinuities of property values in Olsztyn, Poland. These works visualised either spatial or temporal heterogeneity of property prices in 3D, which intuitively reflected the peak and bottom in the property market and thus helped with decision-making and policy-framing.
Another cutting-edge technique in 3D visualisation is virtual reality (VR), which has received considerable attention in architecture- and engineering-related industries [52]. In the past decade, it has been introduced into the real estate industry as a visualisation tool (e.g., virtual home and virtual environment), mainly used by real estate companies. VR aims to create immersive environments for buyers and facilitate their understanding of the indoor and outdoor environments of the properties [53]. Current works have, on one hand, suggested VR plays an important role in housing purchase decision-making [54,55]; on the other hand, its usefulness in a flourishing housing market, the credibility to reflect reality, and the high cost were questioned as well [8]. The potential of VR rather than visualisation only deserves to be further explored.
In summation, the relevant research of 3DPV is still in the embryonic stage. Pilot case studies lack follow-up investigations, and conceptual frameworks need practical applications for improvement. There is still plenty of room for both theoretical and technical development.

1.2.3. The Features of 3DPV

Based on the relevant research of 3DPV [56,57], its essential features are distinguished as follows (Figure 3).
Interdisciplinary and user-centred design. 3DPV is highly interdisciplinary and involves diverse stakeholders with their expertise and interests. We need property valuers for their valuation knowledge, academic researchers for their knowledge, real estate developers for their pricing policy, buyers for their housing preferences, local government for their housing policy and census data, geospatial companies for their remote sensing data, and business companies for their technical support. Obtaining stakeholders’ opinions let researchers know whether the valuation model satisfies users’ requirements in different dimensions, then what is of utmost importance can be understood.
The balance between socio-economic and technical aspects. Commonly, property valuation studies apply HPM to build connections between factors from different attributes (e.g., physical, environmental, and locational attributes) and property value. The 2D factors concerning socio-economic aspects have been extensively studied to investigate their economic influence on property value, such as education resources [58], park proximity [59], and shopping malls [60]. Conversely, 3D modelling for city DT creation is dedicated to quantitative spatial analysis and visualisation, often highly computational. Therefore, it may be applicable for a limited number of buildings [61,62,63], but not feasible for a city with thousands of buildings. The balance, i.e., trade-off, between the socio-economic aspect (property valuation) and the technical aspect (DT) should be acknowledged.
Fit-for-purpose (flexibility, scalability, functionality). Fit-for-purpose (flexibility, scalability, and functionality) should also be prioritised. Regarding flexibility, spaces should be reserved for future extensions, as missing data may be identified and analytical techniques may be improved. For example, it should not interfere with the existing datasets or generate significant errors in methodology when putting in a new factor. Second, the most relevant factors influencing property value can vary by location (e.g., Paris VS Shanghai), time series (e.g., five decades ago vs. the past five years), and scales (e.g., district-scale vs. city-scale); therefore, 3DPV shall be flexible to be tailored to local contexts. Scalability is another crucial issue for both visualisation and spatial analysis. Similar to the level of detail (LoD) in CityGML, which has five levels from coarse to detailed, 3DPV shall also work in scalable scenarios. For example, in city-scale analysis, the 3D factors can be aggregated as regional building height and building density to get an overview of the whole city. In the district- or community-scale analysis, single building height, SVF, and view area may be more optimal to evaluate individual properties. Last, functionality means satisfying users’ requirements and being useful. For instance, AI algorithms may promote modelling efficiency and accuracy; a user-friendly methodology may improve the practicability for diverse stakeholders as they may have different understandings of one issue.
Data usability. Property valuation deals with data from various sources—census data, vector shapefiles, remote sensing images, socio-economic index. Alternative data as a backup is important if specific data is not available [64]. Here, the data usability focuses on quality, reuse, and open-source. First, high-quality data are necessary to provide accurate estimations of property values, an important indicator for the macroeconomy [65]. The quality includes, but is not limited to, its resolution, scale, and timeliness. Second, reusing data from existing studies with other research purposes is not only cost-effective, but also reduces redundancy caused by repetitive data collection. Third, the open-source choice encourages cooperation and flexibility particularly meaningful for developing countries. It is noted that currently, 3D data openness is a complex issue in most countries, but open-source is the way forward.

2. Materials and Methods

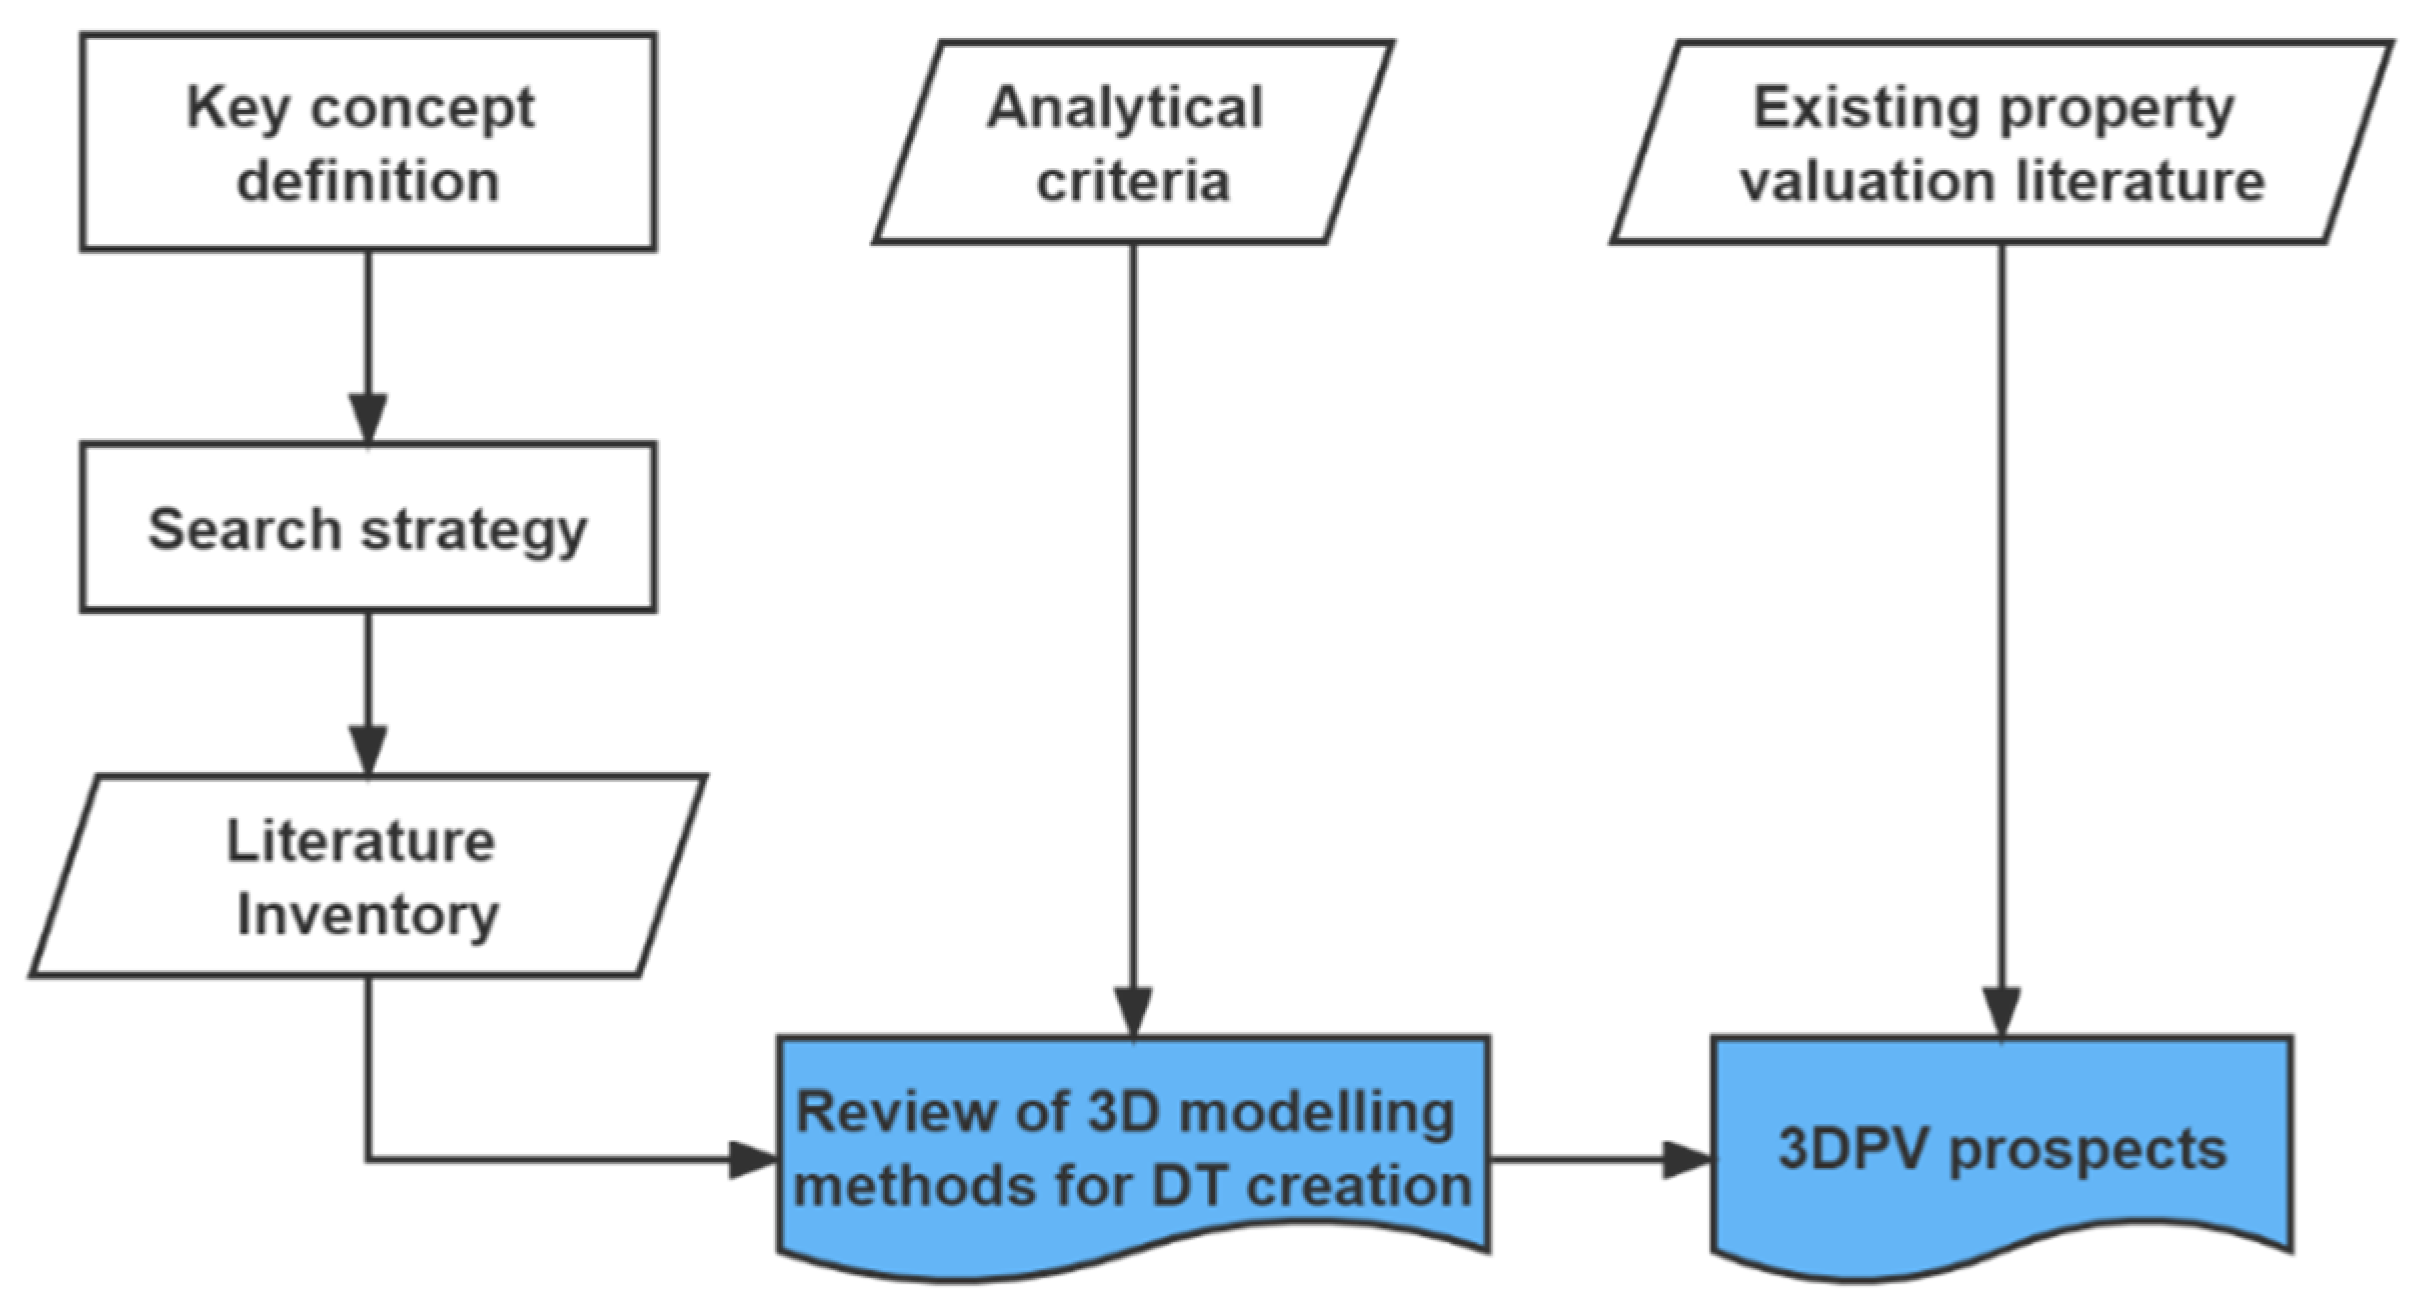
2.1. Overarching Review Design

We adopted a narrative review approach, which does not follow specific protocols and can be tailored for different purposes [66]. Figure 4 shows the overarching methodology, which finally has two deliverables, (1) a 3D modelling review and (2) 3DPV prospects. In parallel, based on the property valuation background (Section 1.2.1) and relevant 3DPV literature (Section 1.2.2), we identified the features of 3DPV (Section 1.2.3). For the 3D modelling review component, on one hand, we decided on the key concepts in this themed review to set up the keywords in the literature search (Section 2.2) and developed a search strategy to form the literature inventory to be reviewed (Section 2.3). In addition, we self-defined a set of analytical criteria (Section 2.4) to review 3D modelling methods and to analyse their appropriateness for 3DPV in different aspects (Section 3). After that, we proposed 3DPV prospects in the short-term and long-term (Section 4).

2.2. Key Concepts

  • Which methods do we focus on?
3D modelling for DTs is applied in diverse fields, thus we may be easily lost if the review scope is not clearly defined. With understanding of the contexts of 3DPV, this review focuses on the urban 3D modelling methods for city DTs that are suitable to support 3DPV through the procedures and techniques to create a virtual built environment rather than a legal or theoretical framework.
2.
Where do we focus on?
We focus on urban areas, not areas mainly covered with natural landscapes (e.g., forest, grass, rock, bare land, desert, and agricultural areas). The underground area is excluded.
3.
What are the research objects?
Buildings are the main research objects, as we focus on properties in high-rise residential buildings. Apart from the static blocks, there are a large number of dynamic interactions that exist between human activities and the built environment in the vertical dimension. They form unique 3D spatial characteristics to be proxied as 3D factors in HPM for property valuation. It is reasonable to assume their impact on the property prices of high-rise buildings because existing literature has proven the spatial heterogeneity of specific 3D factors. In Zhao, Liu [20], noise distribution had a clear impact: the closer the proximity to the road, the higher the concentration; the higher the storey level, the lower the concentration. Ying, Koeva [8] confirmed that people had diverse 3D housing preferences, e.g., more people preferred to live at a high-storey level in a high-rise residential building. In analogy, air quality also partially depended on the 3D building configuration [67].

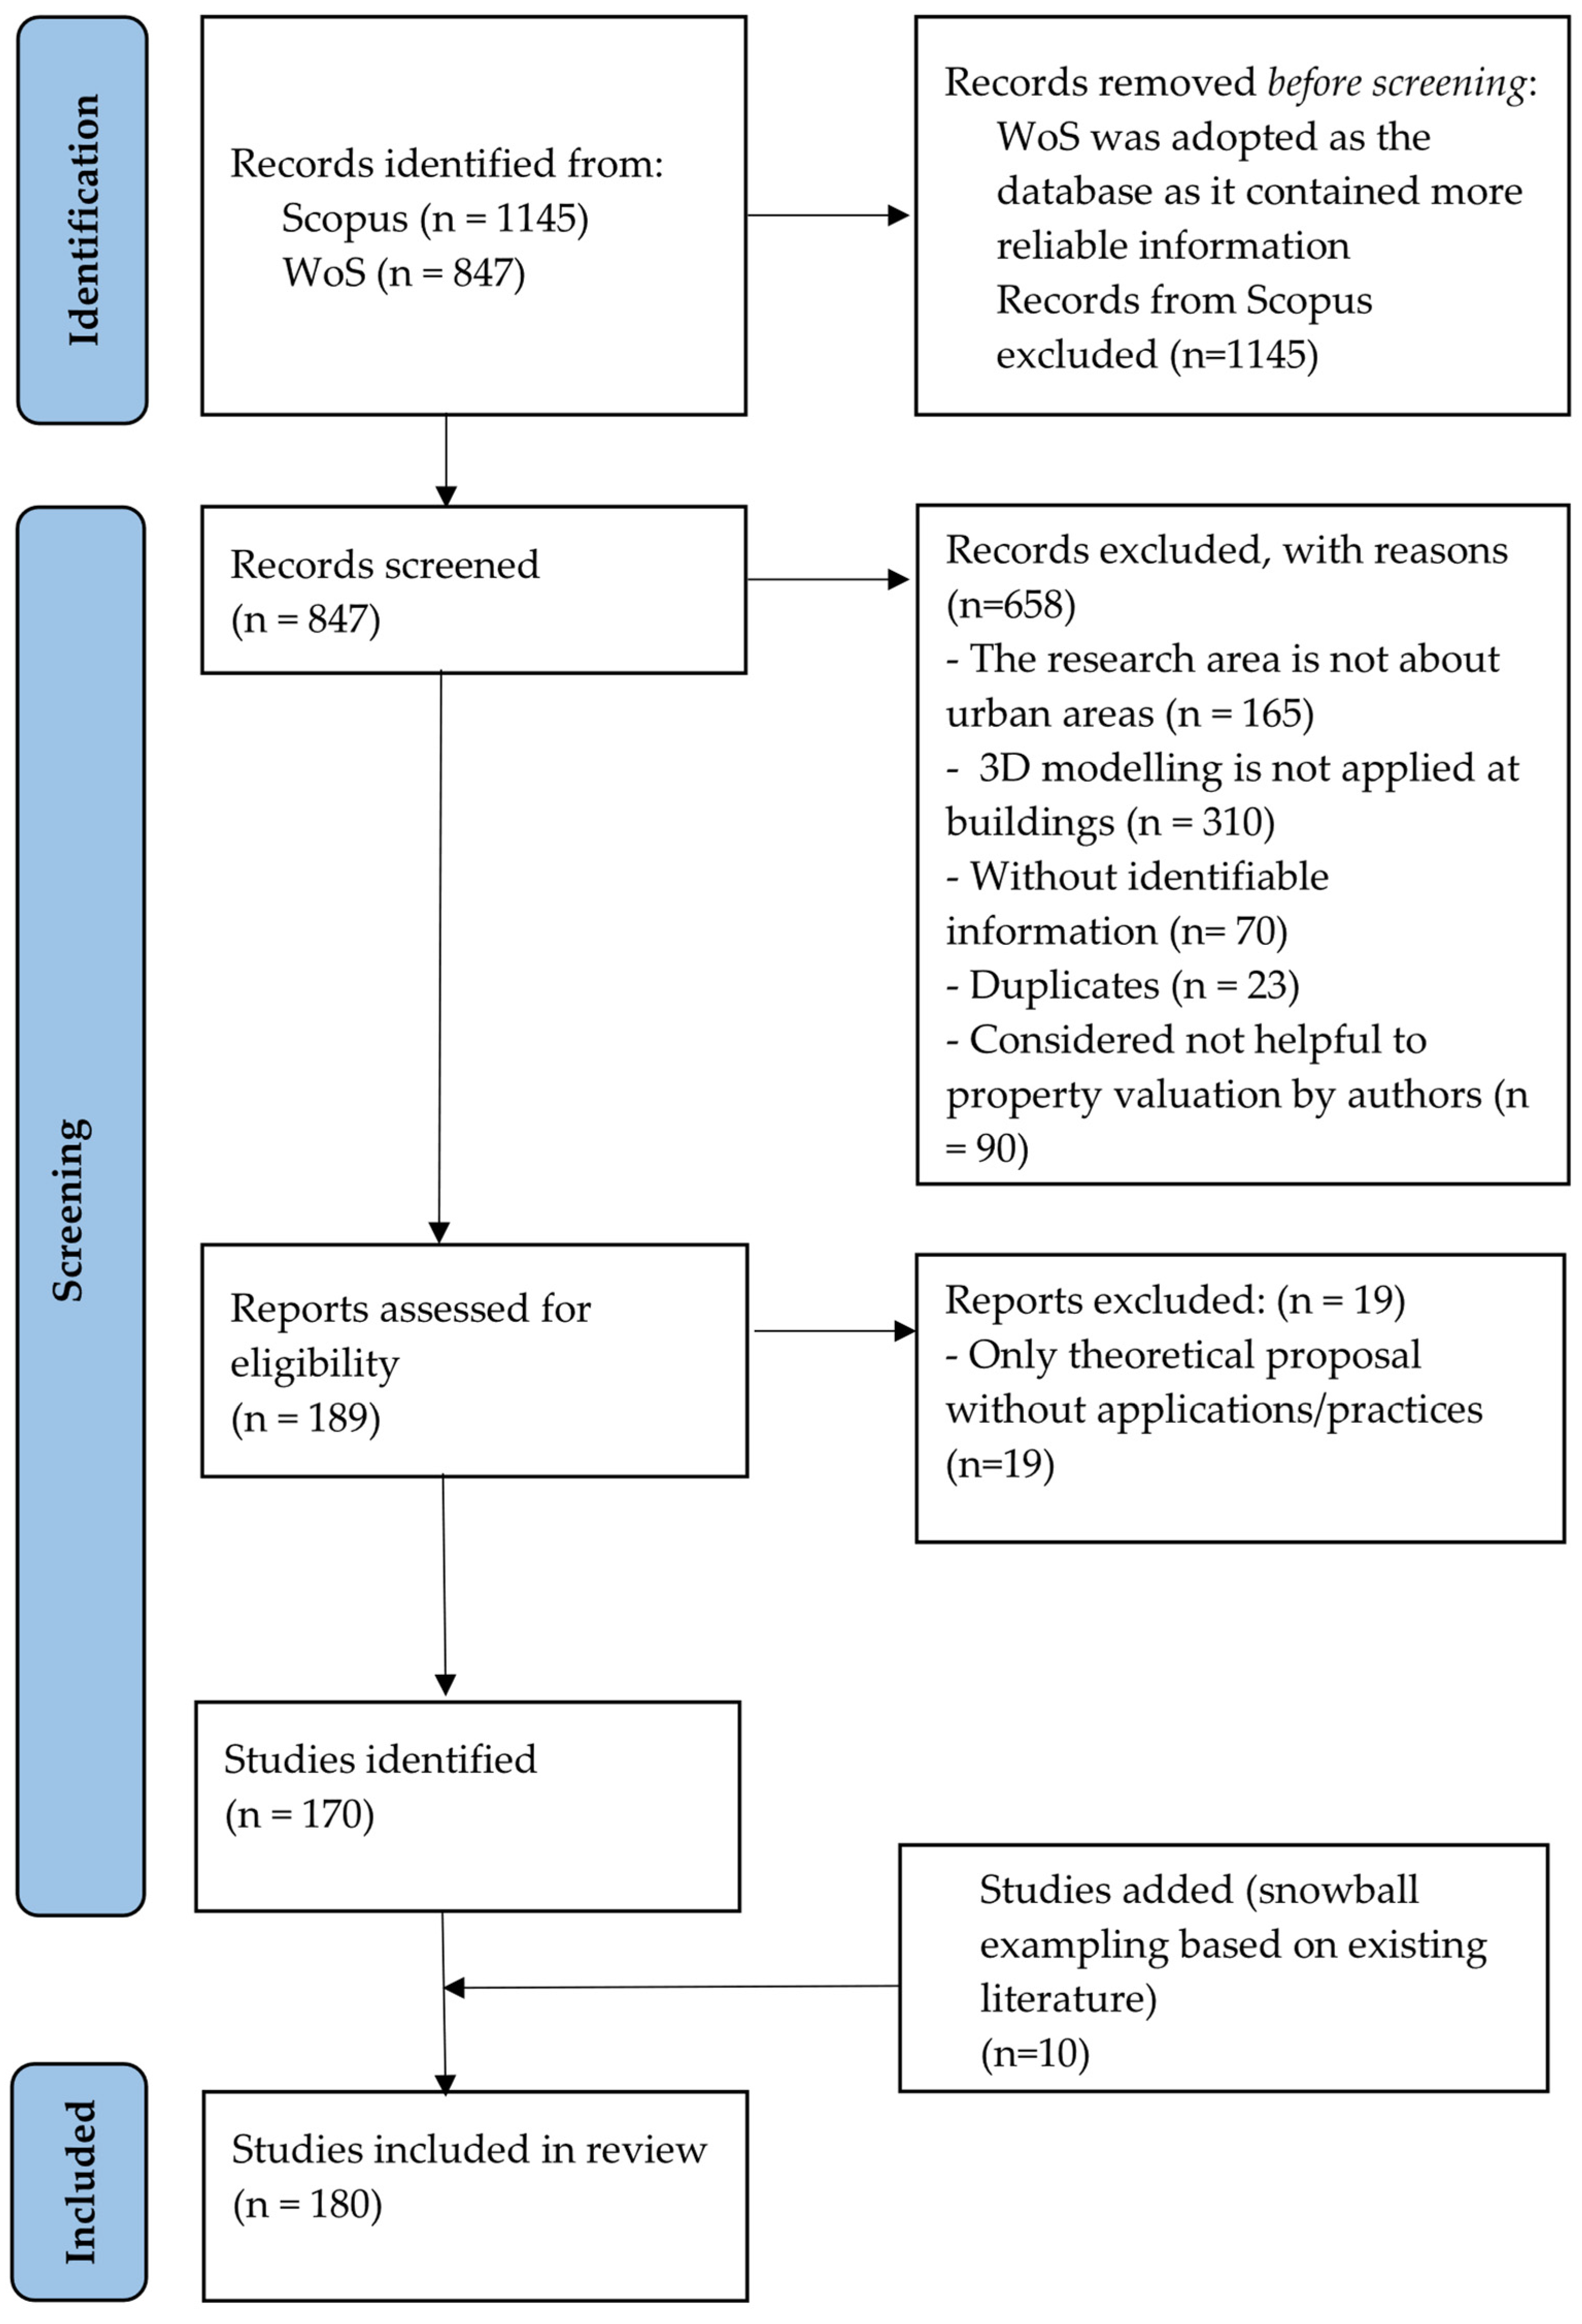
2.3. Search Strategy

The keywords were defined at first based on the key concepts (Section 3.2) before the formal literature search. Table 1 provides an overview of the keywords. In the table, the relation of the keywords within the same row is OR, and the relation between different rows is AND. Therefore, we created the statement “method” AND “where” AND “research objects” to search for concrete and field-specific studies supporting 3DPV and to avoid being generic. We did not directly search for 3DPV literature because of the limited number returned in the keyword search. The full statement can be seen in the later stage of this section.
Figure 5 shows the flow of literature identification and selection. Google Scholar was first excluded due to the difficulty of using advanced search and varying literature quality. We adopted Web of Science (WoS) and Scopus as two main online academic databases [68] for trial searches. They both have extensive and authoritative literature coverages built at similar scales and breadth, but they may behave slightly differently in individual scientific fields. We performed trial searches with identical keyword combinations and randomly picked 200 papers from each for preliminary filtering. We noticed Scopus returned with broader coverage than WoS (1145 vs. 847) but had more noises, e.g., inconsistent digital object identifiers (DOIs) and journals with hard-to-verify reputation. Eventually, WoS was adopted as the online academic database for the literature search.
The literature search settings were as follows. First, we set a time frame of 2016–2020 to focus on 3D modelling progress for city DT creation within the five-year frame. Second, only “article” journal papers were selected for representativeness of original research. Conference proceedings were excluded because lack of information and duplication were observed in the trial searches. Third, the language was restricted to English for authors’ understandability. After identification, it resulted in 847 articles.
The first phase of screening excluded 570 records for the following reasons: 165 were not studied in urban areas, 310 did not take properties/buildings as the main objects for 3D modelling, 70 were without identifiable information (e.g., authors, affiliations, or DOIs) or not in full-length, 23 were duplicates, and 90 were considered not helpful to property valuation by authors (e.g., chemistry, physics, and mathematical modelling and geological modelling). This process left 189 records to assess for eligibility by screening the full-text articles. The second phase of screening excluded 19 articles because they were purely theoretical proposals without applications or practices. Based on the remaining 170 papers, we further adopted a snowball sampling strategy to pick up the highly-cited ones to maximise literature inclusiveness. In total, 180 articles were included in the final reviewing process. The complete search statements in WoS are illustrated below:
  • Setting: the keywords/synonyms are combined using Boolean operators (AND, OR) to search in the topic, a field compromising of title, keyword, and abstract. The search statement is: (“3D” OR “3D model*” OR “3D GIS” OR “Digital Twin”) AND (urban OR city OR cities OR “built environment”) AND (building* OR human OR “urban morpholog*”)
  • Time: 01-01-2016–31-12-2020.
  • Document type: “Article” from the Science Citation Index Expanded (SCI-EXPANDED) and Social Sciences Citation Index (SSCI).
  • Language: English.

2.4. Analytical Criteria

The analytical criteria were designed to answer research questions framed from the targeted audiences’ angles, i.e., researchers interested in applying 3D modelling for city DTs and stakeholders in the real estate sector (e.g., government, real estate company, buyer). Therefore, we conducted online expert interviews with researchers and industry professionals. The interview aimed to obtain their opinions on how DTs and 3D modelling can support 3DPV from a technical perspective. The experts were selected based on our network (and snowballing). An overview of the experts is listed in Table 2. We used their suggestions as the basis to form our analytical criteria and continuously received feedback from experts during writing to improve our analysis according to the most advanced research (Section 3), and they inspired how we proposed 3DPV prospects (Section 4). The key questions in the interviews were as follows:
  • Which urban 3D modelling method/combination of methods/data are suitable for residential building modelling and property valuation?
  • What is the spatial analytical capability of these methods? What are the effects/outcomes, and how can they be measured?
  • What is the scalability, applicability, and flexibility of the method if it shall be adjusted for property valuation?
Table 3 lists the analytical criteria with four main attributes and their respective factors. (1) Metadata refers to the data features used by that method, covering resolution, source, volume, composition complexity, interoperability, lifecycle, and data management. The first three factors describe the data itself, and the latter four factors address how they interacts with the external environment. (2) Technical characteristics consist of the essential technical factors of the respective method, namely scalability, complexity, analytical capability, validation, and extension. (3) Users’ requirements cover the demand from those who mainly develop that method and use the final product (e.g., government bodies, buyers, and real estate companies). The factors are software, cost, visualisation, understandability, applicability, and transferability (local edit possibility). (4) Ethical considerations refer to possible ethical issues regarding personal privacy and data sensitivity. Last, a score was given according to each attribute in the analytical criteria. We selected the Likert scale [4], ranging from 0 to 5, to quantitatively represent its suitability for 3DPV. For example, a lower score means the metadata are easier to access, technical characteristics are less intensive, the users’ requirements are easier to satisfy, and there is no concern about ethical issues. In contrast, a higher one means it proposes higher requirements on metadata and techniques, and the users’ requirements become more advanced with more ethical issues. It is worth highlighting that the scores here are for reference only.

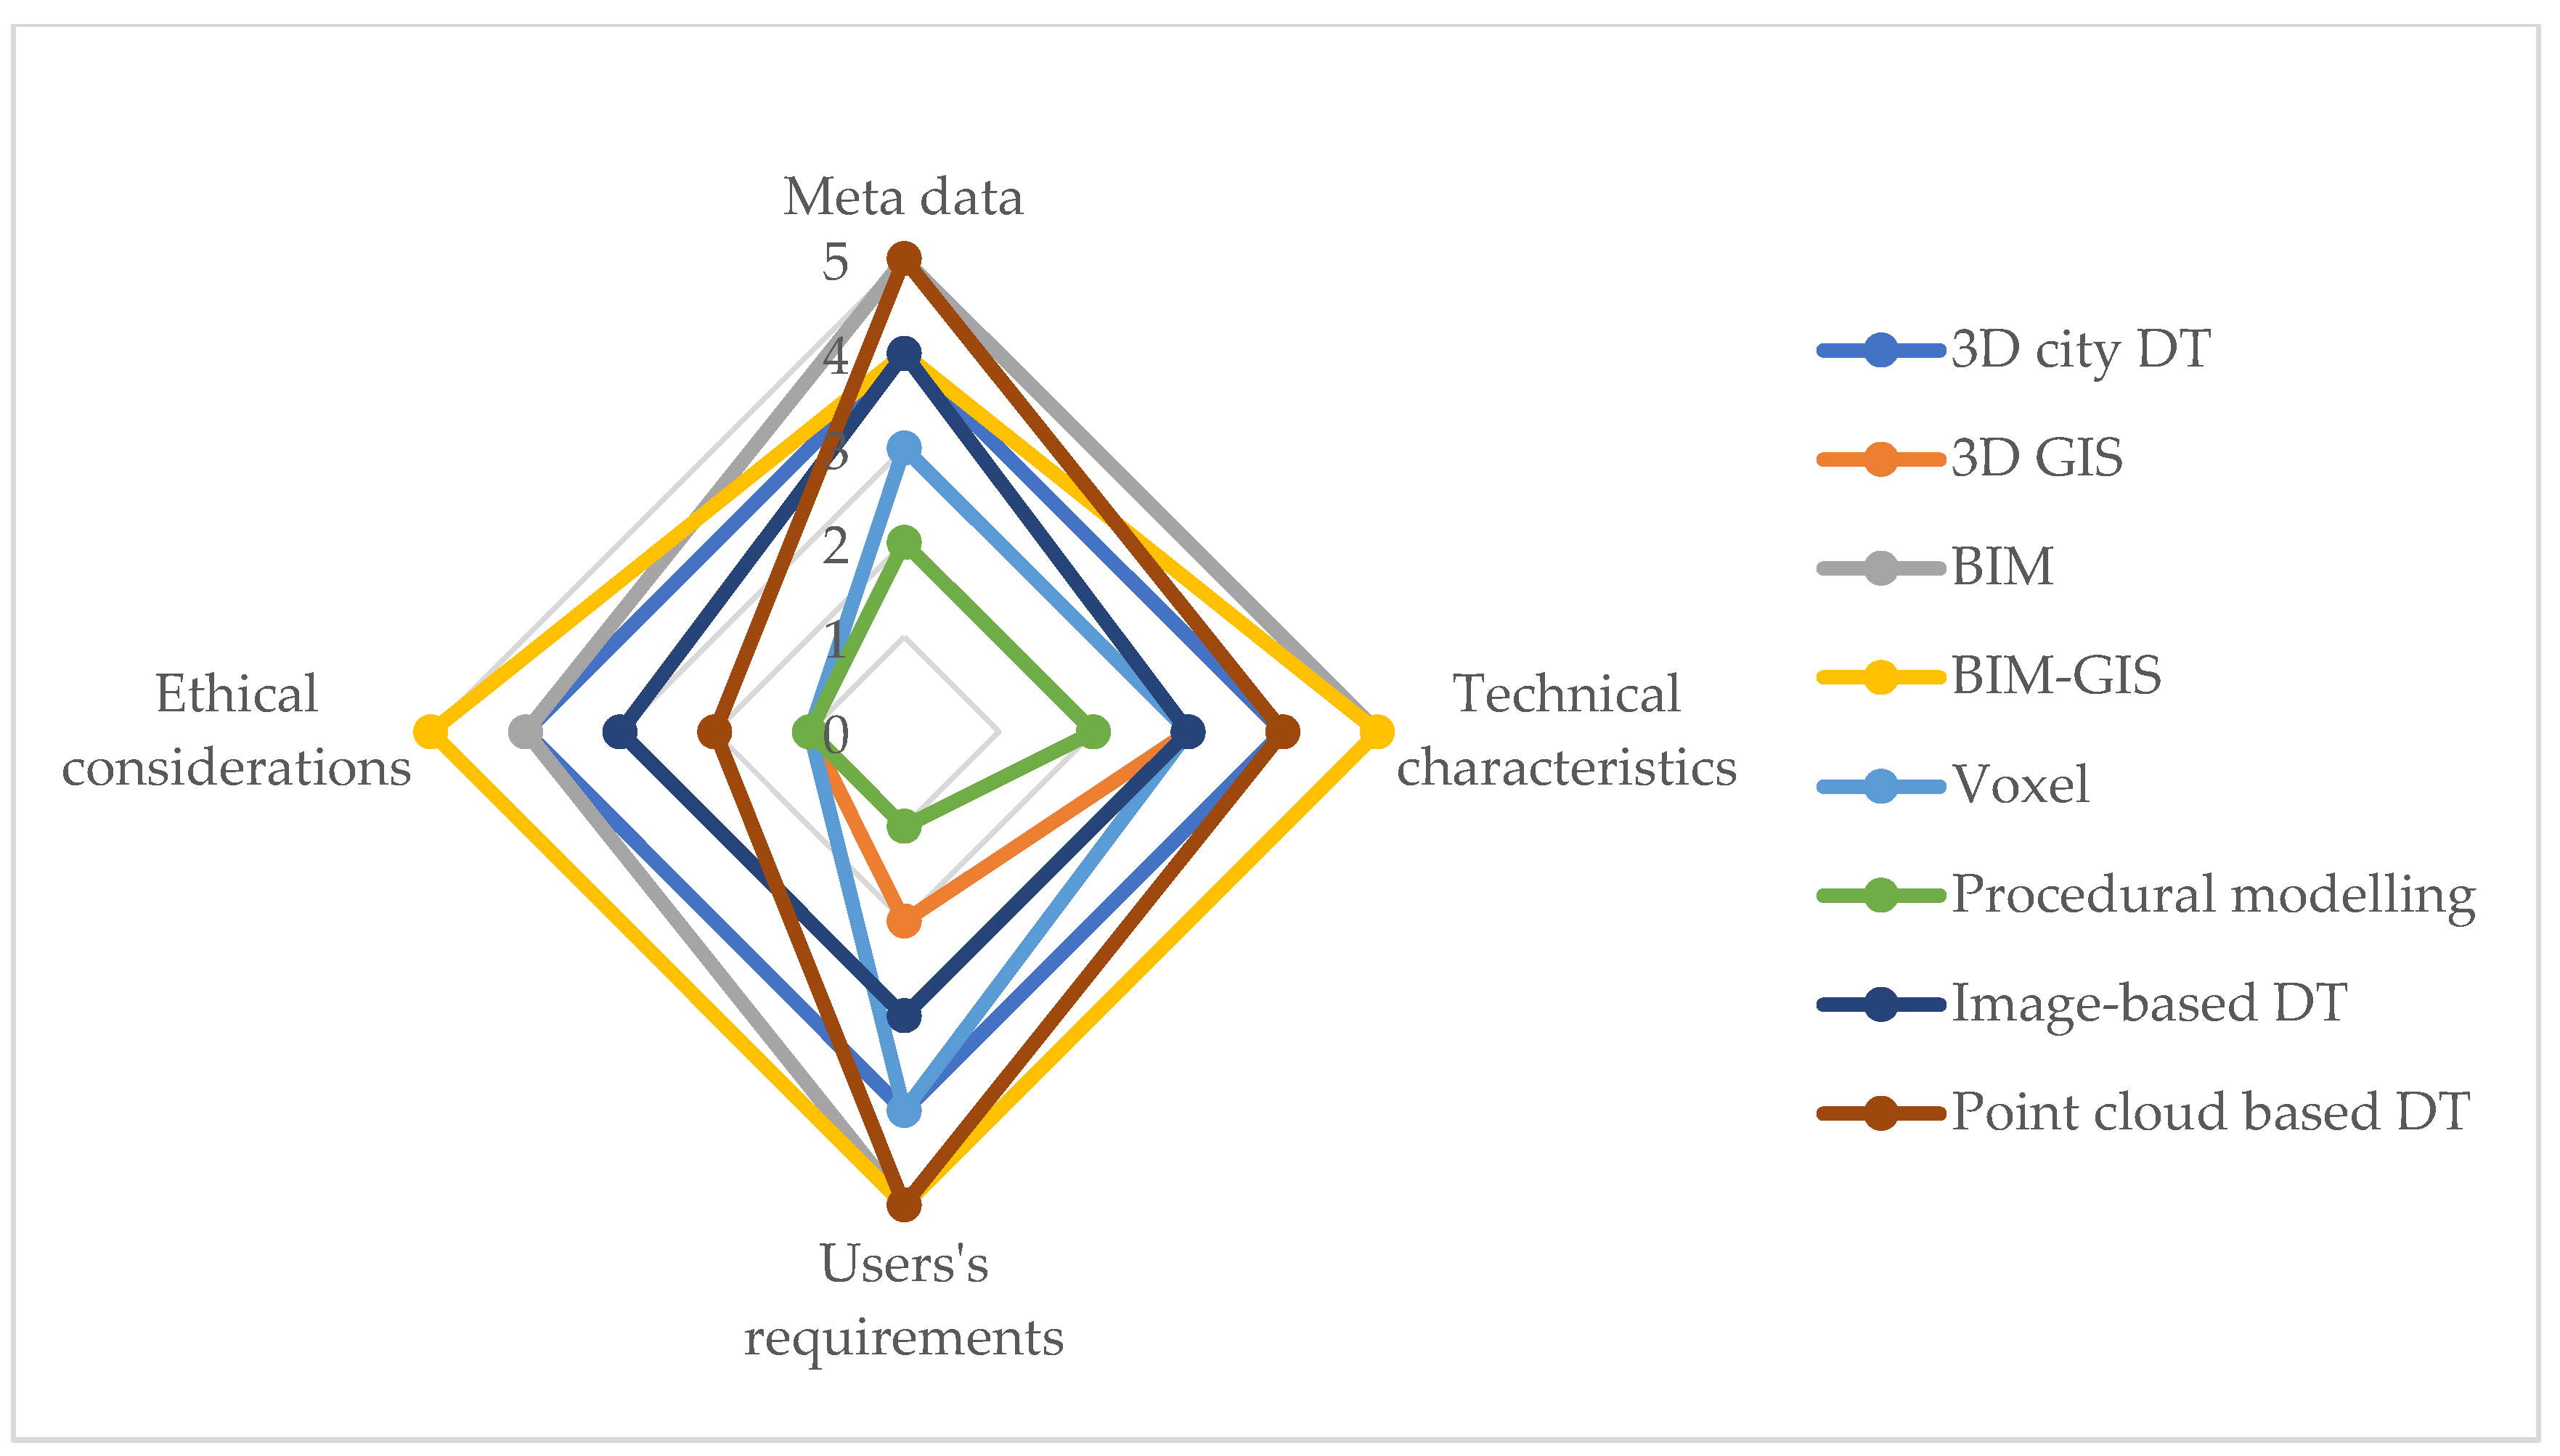
3. Discussion of Distinct Categories of 3D Modelling Methods for City DT Creation

We categorized the 3D modelling methods, which serve as a base for DT creation according to the initially used input data. The sections are organized as follows: image-based 3D modelling methods (Section 3.1), point cloud-based 3D modelling methods (Section 3.2), and hybrid 3D modelling methods (Section 3.3) (here the hybrid means the method has multiple data source inputs (e.g., vector, raster, and point)). The full list of publications used is in Table 4. We have to note that some papers were put under more than one category. For example, Sun, Olsson [69] discussed integrating BIM data into 3D city DTs, so it was put under both “3D city DT” and “BIM”.

3.1. Image-Based DT

In this category, the studies mainly serve three purposes. (1) Visualisation based on a large number of photos [70,71,72]. Due to relatively coarse granularity, spatial analytical functions and data updates are restricted. (2) Simple DT building reconstruction without surrounding environment [73,76,78,80,85]. (3) Urban analysis in diverse scales (e.g., neighbourhood- and city-scale) and for different purposes (e.g., solar potential [75], population estimation [74], and shadow recognition [77]). Data volume is moderate since normally only several images are involved, but they can also be computational-intensive. For example, façade separation only requires a single image input, but the needed number of images used for algorithm training is significant [71,78].
Among the image sources, satellite images are one of the most used for DT creation, and the majority of the studies use 3D reconstruction based on stereo images [93]. This approach can provide abundant geoinformation with broad coverage. However, spatial and temporal resolution vary in public and private domains. Presently, open-source images (e.g., Landsat and Sentinel) have become increasingly available and provide low-cost solutions, especially for developing countries [79]. Peeters [77] demonstrated the feasibility of automatic shadow recognition using a QuickBird satellite image. In addition, ground-level view images, which take a different angle from satellite images, have also become increasingly popular as they capture the building façade textures and thus improve image quality. One typical example is the publicly available Google street view (GSV). Wolberg and Zokai [70] used GSV to reduce visualisation errors of the objects close to the ground. The extensive collection of images with fixed-height camera, captured over one city, provides a rich image library for creating DTs [72]. In general, image-based 3D modelling is user-friendly when there are clear technical requirements in place. In recent years, AI-developed algorithms have extensively been used for image-based modelling. However, one of the most important challenges in that respect remains the need of a rich image data source for training and testing processes [71,78].
Our literature review shows the limited usages of image-based modelling methods applied for 3DPV. Among the few examples, researchers have outlined the use of satellite, aerial, and street view images as valuable input data that have been researched. A variety of ML algorithms have been combined and explored by experts in the field to extract qualitative and quantitative information for valuation purposes. Examples include the use of DL approaches to assess the relationship between street visual features and property values, and the comparison of the classic HPM with the ML model [241]. Results proved the benefits of including factors such as vegetation (tree features, varying in 3D) in addition to the traditional attributes such as structure, location, and neighbourhood environment characteristics (2D). In addition, the researchers proved that the combination of aerial and terrestrial images improved the geometrical accuracy [63]. In addition, studies have been focused on 3D rooftop parameters and building footprints extracted from different types of images [75,83]. The above-mentioned 3D geoinformation can be utilised in 3DPV. The technical challenges lie in the validation, transferability, and scalability. Researchers validated their classification accuracy by pre-acquired reference datasets [63,73,79,84], but the availability is limited; thus, the robustness is hard to verify, which makes transferability harder [77,78]. Ethical issues may arise as well from people who do not want their properties to be visible and identified in very high resolution (VHR) images or GSV.

3.2. Point Cloud-Based DT

Most point cloud-based DT studies focus on building reconstruction in boundary representation (b-rep) form (e.g., façade segmentation and building outline extraction) [62,123,210] and share similar methodologies: (1) they assign point data with semantical labels (e.g., window, door, and roof) and (2) use AI to deal with the large data volume and increase classification accuracy [62,105,111,129,131,132]. Other studies focus on topics such as visibility analysis [61,126], smart city [170], and indoor pathing [125].
Point cloud data are mainly obtained by light detection and ranging (LIDAR), a method that can accurately collect high-resolution 3D information of ground features in large-scale urban scenes [61,98,139]. Point cloud data represent raw data or geospatial objects in a consistent and well-defined form [131]. Different LIDAR platforms were employed such as ALS [111,113,123], terrestrial laser scanning (TLS) [120,129], and mobile laser scanning (MLS) [101,126,127]. Specific platforms, sensors, and proprietary software propose high technical requirements on data utilisation [107]; parallel computing is one of the solutions to ease heavy computation [96,97]. Cao, Zhang [96] further showed the importance of a spatial database to organise data. Geometric accuracy and visualisation quality are two aspects of validation [129]. The former applies official benchmark datasets such as ISPRS datasets [62,97,103,119,122] and Dutch BAG (Basisregistratie Adressen en Gebouwen) [100,127] or manually-created reference data [108]. Visual quality control is frequently used for validation. Wang, Yan [102] compared the wireframe model and point cloud data to assess the modelling accuracy. Heo, Lee [120] used the fish-eye images captured at the same viewpoint to verify sky view factor (SVF) estimation.
Naturally, point cloud data are characterised by high point density and large volume [101]. However, they is prone to inaccuracies such as occlusion from trees [115], noise corruption [106], and loss of small-size objects [119]. Whether this type of errors have significant influence on 3DPV depends on the scalability. For a city-scale valuation study, the errors may be tolerated, but for a building- or property-level study, it is possible to generate bias. The open-source solution is limited, as Nys, Poux [113] was found to be the only study showing the possibility of not using any proprietary solutions. Open-source data are criticised for not being advanced enough to capture detailed features [78].
To sum up, solely using point cloud data for 3DPV is still challenging [95,116]. Point cloud provides abundant 3D data and visualises the vertical dimension straightforwardly, e.g., building and surface heights and the occlusion from trees and other buildings. However, the data processing requires a central processing unit (CPU) and is memory intensive, but is necessary for running AI algorithms. It means raw point cloud data should be cleaned and processed before they become a ready-to use product. Consequently, it increases the learning cost for both developers and end-users, which does not avail for a topic that is still in an embryonic state. Second, most studies covered a small study area (e.g., several buildings or one street block) due to large data volume and expensive collection costs, which is considered relatively limited in valuation studies. Third, transferability remains an issue (e.g., algorithms for MLS data processing have to be developed separately from ALS/TLS) [100,242]. Despite various challenges, the potential of point cloud data remains huge. They provide height information and depict the building outline accurately, and this kind of advanced visualisation of elements, such as roofs and facades, adds significant value to DT visualisation and semantic information input for 3DPV. Gevaert, Persello [214] classified informal settlement by height variation of the point cloud, which can be referred to as 3DPV when distinguishing different housing qualities by the building height. TLS and MLS may be supplementary for small-area data collection if certain data are missing or the aim is to model the environment precisely (e.g., for a pilot project). AI algorithms can also be supportive in data collection and processing, as well as in extracting domain-specific semantics [131,132]. For example, Pan, Guan [135] used a convolutional neural network (CNN) for land use classification based on ALS data, and their model was superior in computational performance and classification accuracies. Moreover, as point cloud does not collect personally-identifying information, it may not lead to ethical issues.

3.3. Hybrid DT

This section involves studies using hybrid data sources, including 3D city DT (Section 3.3.1), 3D GIS (Section 3.3.2), BIM (Section 3.3.3), BIM-GIS (Section 3.3.4), voxel (Section 3.3.5), and procedural modelling (Section 3.3.6).

3.3.1. 3D City DT

3D city DT is the most widely used method based on the literature inventory. The terminology, i.e., what is exactly a 3D city DT, remains a considerable ambiguity [22]. In general, it is a digital representation of urban areas describing the geometry, structure, and covering data of buildings, infrastructure, vegetation, terrain, and various morphological elements [191]. The research purposes range from noise mapping [20] and urban spatio-temporal change detection [136] to energy applications [137]. They fulfilled more complex spatial analytical tasks than those for classification purposes only.
There are various approaches for 3D city DT creation, and they are generally costly and time-consuming [106,180,181]. Therefore, researchers have been making efforts towards automation and standardisation. First, the data are stored in a relational database management system (DBMS), such as PostGIS, whose structured data schemas ease the pressure of a mass of data management. The databases are linked with specific-developed 3D city DT tools, such as 3DcityDB [151] and DB4Geo [161]. Lu, Parlikad [13] showed a complicated but systematic example of creating a DT for their campus, involving five critical stakeholders, heterogeneous data sources, and different model layers. Second, 3D city DT adopts a structured data schema for transferability to other study areas (e.g., CityJSON [113]), in which CityGML is the most widely supported data schema [243]. It is an open geospatial consortium (OGC) standard for multi-hierarchical geographical, topological, and semantic representation [244]. It has been supported by a wide array of proprietary and open-source software. In total, five LoD (LoD 0 to LoD 4), from coarse to detailed, are embedded in CityGML [184], i.e., there are a number of visualisation alternatives. Third, extensions are developed to serve field-specific purposes, such as SimStadt from TU Stuttgart for energy simulation [151,156]. Agugiaro, Benner [245] provided a list of Energy ADE in CityGML.
Nevertheless, several limitations of 3D city DT should be noted when employing for 3DPV. Julin, Jaalama [191] reported the difficulty of being scalable and modified and the limited number of research purposes. More work should be dedicated to validating the geometrical relationships of 3D buildings and accurate measurements [26], as validation is now accomplished by manually comparing modelling results with true datasets [162]. Lehner and Dorffner [192] mentioned the temporal incoherence existing in heterogenous data sources in 3D city DT, which should be paid attention. Property value is sensitive to the changes of the surrounding environment, while the temporal gap may fail to capture the changes, which may cause a significant bias. Lastly, the availability of 3D city DT is still limited, and the current data schema is not designed to support property valuation [166].
We consider 3D city DT a powerful solution for 3DPV. First, the dynamic LoD visualisation helps with the fit-for-purpose feature. For example, low LoD focuses on large-scale building information extraction (e.g., volume, height, density), while high LoD investigates nuanced 3D influence, which may be neglected due to coarse data resolution (e.g., trees may put shadows on properties on low-storey levels). Second, the 3D visualisation overcomes the 2D limit, thus benefiting different stakeholders in the real estate sector [179]. Buyers recognise the property in a 3D helicopter view to compensate for information asymmetry. Urban planners can optimise the regional planning policy with more 3D inclusiveness. Third, it can also visualise property values in past, current, and future. The temporal analysis of property can be simulated in a dynamic way for predictions in support of government, buyers, and real estate companies. However, a 3D city DT with all data may mean data redundancy and a lack of specific analytical techniques for 3DPV. For example, the systematic architecture of creating a DT may be overwhelming regarding data and cost [13]. Due to its inherent complex schema with hundreds of tables in the database, most applications only use a small part (e.g., energy applications use only energy-relevant data) [161]. Instead, an extension specifically for 3DPV could be the possible solution: it provides information that 3DPV specifically needs according to users’ requirements and still can call out other types of data on demand. It improves data use efficiency, conducive to future data updates. In addition, the requirements of the citizens are also dynamic, therefore the factors included in 3DPV should be updatable. The chosen approach for DT should provide technical possibilities for easy and continuous data updating.

3.3.2. 3D GIS

Current property valuation studies have extensively used GIS to study the locational and environmental characteristics of the properties in 2D and analyse the impact on the property values using HPM, while information from 3D is somehow neglected [246,247,248]. 3D GIS connects diverse topological relationships from different data sources and adds a 3D perspective on a 2D basis. Extensive spatial analytical tasks are carried out by 3D GIS, such as sky view factor and visibility analysis [84,86,202,215].
The technical requirements are eased compared to other emerging 3D modelling methods for DT creation. A ready-to-go software list from proprietary and open-source sectors, together with the automation of iterative and procedural analysis, guarantee the performance of tasks on a large scale [199,204,208], such as reconstructing large numbers of buildings with high levels of repetition and symmetry. The software is compatible with diverse data formats, ranging from raster images [144], LIDAR point cloud [212], and vector files (e.g., building footprints) [179]. Extensions are also available. For example, a connection with Web-GIS can provide interactive functions to different stakeholders with its immerse experience of surroundings and reduced size of digital contents (e.g., VR and Google Earth) [179,216]. DBMS, such as PostgreSQL with PostGIS [84], are widely used for data management [77,141,212].
3DPV would benefit much from 3D GIS regarding its users’ friendliness and mature applications, which significantly ease the learning cost and increase the understandability of different involved stakeholders at the same time. With the DBMS extension, data safety and storage are guaranteed, and it is possible to reuse the data to update the temporal analysis of values when the surrounding environment receives significant changes (e.g., a shadow is casted by a newly-built adjacent building). 3D GIS provides satisfying 3D visualisation and is cost-effective for 3DPV at a city-scale considering the spatial analytical capability. The limitation mainly exists in accuracy when the research goes to property- or building-scale because nuanced differences are hard to be captured under the complexity of the urban environment. Trees are sources of errors; they cause shadows, and affect the daylight hours and ventilation in properties of low-storey levels [120]. However, shadows may be neglected in GIS files, which is likely to cause an estimation bias depending on the application and research scales. Moreover, the flexibility for developing functions excluded from the software scope is restricted, i.e., it would be hard to design new spatial analytical processes.

3.3.3. BIM

BIM covers geometry, spatial relationships, geographic information systems, and various building components (e.g., supplier details and physical infrastructure). It creates a digital 3D environment to manage the full lifecycle of an entire building, from preliminary design to the final dismantling, with rich semantic and geometric information [220]. BIM is a powerful solution targeting individual building(s), such as cultural heritage management [219] and indoor path navigation [220].
Naturally, BIM has a large data volume with great informative richness because it contains building information from different physical and functional categories. Thus, it puts forward high technical data storage and maintenance requirements and demands substantial investment in software and labour [218]. The proprietary data formats and software are still the majority in the BIM field, and different platforms use their data formats and workflows [221]. If the data are transferred between different platforms, it may lead to potential conflicts. The most popular data schema is Industry Foundation Classes (IFC), which is well supported by most BIM software [67]. All the building components can be modelled, stored, and represented in IFC schema [223]. A recognised industry standard of IFC promotes the transferability and reproducibility of the building models. Despite the strict technical requirements, BIM has been widely used by a wide range of stakeholders, such as industry, academia, and individuals, making it a promising 3D modelling technique.
BIM is intrinsically associated with aspects of building construction, such as cost, maintenance, and construction time [67]; however, information in these dimensions may be redundant for 3DPV and thus may increase pressure on data storage. Data management becomes inapplicable with a large number of buildings on a city-scale [218], and researchers have attempted to reduce the intensive computation. In Lu, Gu [229], a study consisting of over 600 buildings from GIS data, only several important buildings were constructed in BIM, which can be regarded as a trade-off between efficiency and cost. Amirebrahimi, Rajabifard [225] replaced redundant attributes such as cost and materials with references to their definitions to avoid redundancy [67]. Second, BIM data collection and modelling are costly, an unaffordable solution for a city-scale 3DPV. Third, BIM often stands alone and is not georeferenced, i.e., the spatial influence from the surroundings remains unknown. It is a severe deficiency as property valuation must take the locational and environmental characteristics as essential indicators for the property value. Lastly, we should also consider the legal issues, because BIM integrates information of indoor structure which comes from different infrastructure providers [177].
BIM can still provide references to 3DPV as follows. First, it can serve as high-quality complementary data. For example, when specific valuation data are out of date (e.g., building construction material, energy consumption) [69], adding BIM data can reduce information asymmetry in the property market. Second, it is considered a feasible approach for accurately managing land and property administration data, especially for high-rise buildings (e.g., precise representation of legal boundaries and property floor plans) [217]. So far, there is no capacity for documenting ownership and legal information [129,217]. Therefore, a schema extension adds great value to its applicability and transferability. In addition to this, on a theoretical level, the information richness that BIM holds may bring new insights into how property value can be decomposed and which indicators have significant influences on the value. In general, although the topic of 3D modelling and DT have been emerging in the past decades, the actual collaboration between different sectors and actors are still weak [224]; therefore, using BIM data for 3DPV needs support from the world outside the BIM community.

3.3.4. BIM-GIS

Precise individual building models can be related to the real-world environment by fully utilising the respective advantages of BIM and GIS. The rich information in high LoD of individual models (BIM) and relative geographical surroundings (GIS) extend the applicability.
Compared to using either BIM or GIS alone, BIM-GIS is more demanding in technical requirements and user skills (e.g., data volume is larger, users’ learning cost is rising, and ethical issues are concerned) [69,228]. To sum up, the difficulties are doubled. Data format harmonisation becomes the top priority because of the different data structures. There are a large number of attempts focusing on the bidirectional conversion of IFC and CityGML, the two most popular data schemas at building-scale and city-scale [175]. However, the conversion can still be challenging, especially for higher LoD [110]; on a best-effort basis, the extendibility is still under exploration from the authors’ knowledge. Moreover, GIS and BIM data are processed by different software, which increases the data processing complexity and the operational requirements of the professionals [228].
Despite the difficulties, the combination also brings opportunities. First, the spatial analysis can be performed on a finer scale based on 3D GIS, such as seismic vulnerability assessment [226,227]. Zhang, Cheng [195] combined GIS and BIM to build a platform for 3D visualisation, accurate urban management, and dynamic interactions with users. In Deng, Cheng [228], indoor and outdoor features can be mutually reflected immediately for 3D noise mapping. BIM is no longer an island without surroundings’ information, and GIS is enriched by semantics and 3D geoinformation. Currently, the problem of coordinate system transformation has been well studied, such as in Deng, Cheng [230], Zhang, Hou [231]. Second, it is flexible to meet different demands [229]. For example, Amirebrahimi, Rajabifard [226] built a micro-scale framework for flood damage assessment, in which the elevation model was from GIS and the building information was from BIM. This scenario is ideal for the property market, where diverse stakeholders come with different purposes (e.g., urban planners may focus on the large-scale development while buyers look at the environment of their residences within a small region, such as accessibility to shopping malls and schools). In this way, cost-effectiveness and efficiency are improved. For more information, the review by Zhu and Wu [249] concerning BIM-GIS data integration is highly recommended.
The main challenge of BIM-GIS lies in the data. As mentioned earlier, data format harmonisation and compatibility among different software should be tackled first for 3DPV. More efforts in data collection are necessary because the study areas where BIM and 3D GIS data are simultaneously available can be highly restricted.

3.3.5. Voxel

Voxels are used to aggregate sparse point data in predefined spacing (e.g., 1.5 m by 1.5 m by 0.5 m) [167]. In analogy, voxels are similar to a 2D pixel extended at 3D, carrying both horizontal and vertical information. Voxels for city DT creation have been used for topics such as visibility analysis [236], land surface extraction [233], and landscape measurement [121]. Most studies were conducted within a small area (e.g., one street with several buildings) [238], which partially explained the high data collection and processing cost (e.g., the data collected by vehicles is restricted to specific areas and needs arrangements for professionals and instruments). Voxel size is a significant factor affecting precision and accuracy [61,120,128]. In general, a smaller voxel size can capture more details with higher computational demands [61]. Sometimes down-sampling is used to reduce the calculation amount [118]. A bigger voxel size may miss information but ease the computation pressure. From the users’ perspective, voxel is relatively user-friendly. There are both proprietary (e.g., AutoCAD) and open-source (e.g., SketchUp, QGIS, and Minecraft) software. The voxel visualisation has distinct boundaries, i.e., stacking cubes, the modelling logic is clear, and the construction has easy-to-follow pipelines [201]. No ethical issues are mentioned in the existing attempts. The above-mentioned features are beneficial for users’ understanding and applicability.
With the intrinsic characteristics of the voxel as a cube, dealing with buildings in irregular outlines is challenging [101]. In the case of 3DPV, residential high-rise buildings can be less influenced, as they always have regular building outlines. Nevertheless, semantic information loss needs attention. Liang and Gong [167] reported the loss of semantic information and spatial relationships after voxelisation in an octree-based model for solar radiation.
In 3DPV, it is important to consider the balance of computing efficiency and the final product quality. The voxel size should differentiate according to research scale, city-scale, or per property, while it brings out another concern: assigning each voxel with semantic labels per property is problematic [167], which is prone to error and labour-intensive. Building façade segmentation is one of the main research directions in voxel modelling [94,128]; however, the 3D visualisation enhancement helps little with the spatial analysis of 3DPV, though it does increase the computational intensity. Voxel may not have much additional value as the primary modelling technique; nevertheless, existing studies reveal what we may add in 3DPV. Anderson, Hancock [232] shows the necessity to treat urban vegetation as a 3D volume rather than a 2D-based attribute. Casalegno, Anderson [234] also pointed out that images cannot capture the sub-canopy structure. As mentioned earlier, objects close to the ground are easily ignored in DT creation, which can cause a significant bias. The tree is a typical example, vital to living quality and thus becomes an important factor for property valuation. Several urban indexes, such as building mass, volume, and compactness, may help understand urban morphology in the built environment [233].

3.3.6. Procedural Modelling

Procedural modelling creates 3D objects for city DTs based on existing geometric vector files (e.g., GIS vector shapefiles, land use, or cadastral plots) using programmed grammar [168,206]. It is cost- and time-effective to create numerous buildings; thus, it has been widely adopted for large-scale urban studies, such as 3D visualisation [160], urban ventilation analysis [163], solar estimation [160,204], and visibility analysis [166]. The commonalities are: (1) buildings are in mass quantities and (2) the study does not focus on individual buildings. Procedural modelling is a user-friendly rule-based technique: it is a collection of semi-automatic processes that is easy to learn for end-users; the data basis—2D footprint files—is accessible at a low cost, and the data volume is expected to be moderate; it generates 3D contents and executes multiple simulations in a simple manner with a wide range of software such as SpeedTree, Random3DCity, ArcGIS, and CityEngine [202,240]. For example, CityEngine is a 3D modelling software that takes 2D GIS files to construct a city DT with exclusive computer-generated architecture (CGA) shape grammar rules [187,206,227,239]. 3D objects are generated by assigning different CGA rules on existing geometric files, and 3D geosimulation can be implemented, including SVF, visibility analysis, and sunlight simulation. The 3D visualisations can be shared online via web scenes [187], in which users can navigate the models and search for information. End-users can develop the CGA rule library to generate a city DT quickly with low learning costs and enjoy high flexibility in writing their CGA scripts. In analogy, procedural modelling scripts are reusable and sharable, significantly increasing their transferability to other study areas. However, it is worth highlighting that creating a script to generate ideal output is difficult and time-consuming, even for experts [78].
The simplification of procedural modelling brings standardisation and ignores noise. Munoz, Besuievsky [160] standardised the building sizes and retained their approximate volumes and positions but did not consider the peculiarities of individual buildings. For example, complex rooftops may be reconstructed as plain ones to ease calculation, which may somehow influence analytical outputs (e.g., shadow simulation).
We consider procedural modelling a handy solution for 3DPV, especially at the city-scale, which requires generating large amounts of buildings in a short time and executing spatial analysis across large areas. It has been proven efficient at city-scale in different urban analytical tasks [4,227]. The key 3D analytical functions and scripts in software can now be well utilised in 3DPV to identify significant 3D factors influencing property prices (e.g., daylight hours, visibility, and shadow) and optimise 3D visualisation of city DTs (e.g., using texture mapping on the building façades with street view images). The future works shall tackle the following concerns. Firstly, higher LoD capabilities should be exploited to supplement the lack of semantics in procedural modelling [206]. Secondly, direction towards AI combination shall be emphasised so that modelling buildings with irregular footprints and rooftops become more applicable. Nishida, Garcia-Dorado [71], Nishida, Bousseau [78] revealed a promising future to create city DTs in procedural modelling scripts even more quickly and accurately.

3.4. Summary

To summarise, the analysed methods for DT creation are shown in Figure 6, and a detailed breakdown of the scores has been visualised. The score is calculated based on the 0–5 Likert scale in each attribute, as proposed in Section 2.4. From the analysis, all the above-mentioned 3D modelling methods should be applied in righteous scenarios to fully utilise their advantages; therefore, there is no best or worst. Procedural modelling and voxel may have the utmost user-friendliness and most minor technical demands, while information richness (e.g., semantics) may be insufficient if applied on the building-scale or property-scale. They are more suitable for 3DPV at a large scale to create city DTs within a reasonable time and manage to deliver simple visualisation and large-scale 3D factors (e.g., building height and building density). Using either image data or point cloud data eases the pressure of primary data collection, and there are a variety of methods and software that can be used for 3D analysis. 3D GIS is efficient at a large scale, and the relevant software and workflows have been maturely developed. In contrast, BIM aggregates abundant data, while it also means working on only few numbers of buildings. BIM-GIS can fully utilise the advantages of corresponding methods, but sometimes integration is not straightforward. Existing attempts are referred to in Zhu and Wu [249]. 3D city DTs include large data volumes, longer data processing time, incorporate real-time sensor data, and thus are capable of diverse types of urban analytical tasks (e.g., wind velocity, air quality, noise propagation) on a refined scale. Combining such application and analysis with 3DPV brings added value to explain how 3D factors change in the vertical dimension and influence property values. Image-based modelling has been proven to provide abundant semantic data, which is essential in monitoring the changes in the surrounding environment and the building façades, which can significantly influence property values. It may bring a perspective of urban mobility and sustainability into property valuation. For example, green façade is proven to be an appropriate alternative to reduce building energy consumption [250]. Buildings with such façades have better sustainability and thus can be associated with higher economic values, which should be monitored in time.
The following aspects should be considered when applying 3D modelling methods for 3DPV: (1) Validation. The lack of reference datasets significantly influences the robustness of 3D models for city DT creation. Among those who do not have references, some used self-collected data in a small region, and some did not validate at all, which highly restricted the transferability of 3D models for city DTs and the reuse of modelling algorithms/workflows. More research toward cost-effectively generating validation datasets is one of the main suggested paths for future work. (2) Computational resource. A large number of empirical studies have proven that it took a long time and intensive computation to create their 3D models. It is foreseeable that AI is helpful to minimise manual efforts and provide opportunities for fast and easy data updates. As mentioned before, the balance between socio-economic and technical aspects should be reached for 3DPV.

4. The Prospects for 3DPV

To couple with requirements and expectations in different stages of 3DPV, we propose two prospects, from short-term in large-scale (city-scale) to long-term in fine-scale (building- or unit-scale), in Section 4.1 and Section 4.2. They are organised according to the set of analytical criteria (Section 2.4). Similarities and differences are summarised in Section 4.3. This Section is written based on: (1) the analysis of the 3D modelling methods and (2) the outcomes of online expert interviews. We regard the 2D aspects as indispensable and 3D as an extension to property valuation. The standard methodology/data for 2D property valuation is not discussed here (see Coleman, Crosby [251], Wyatt [252]).

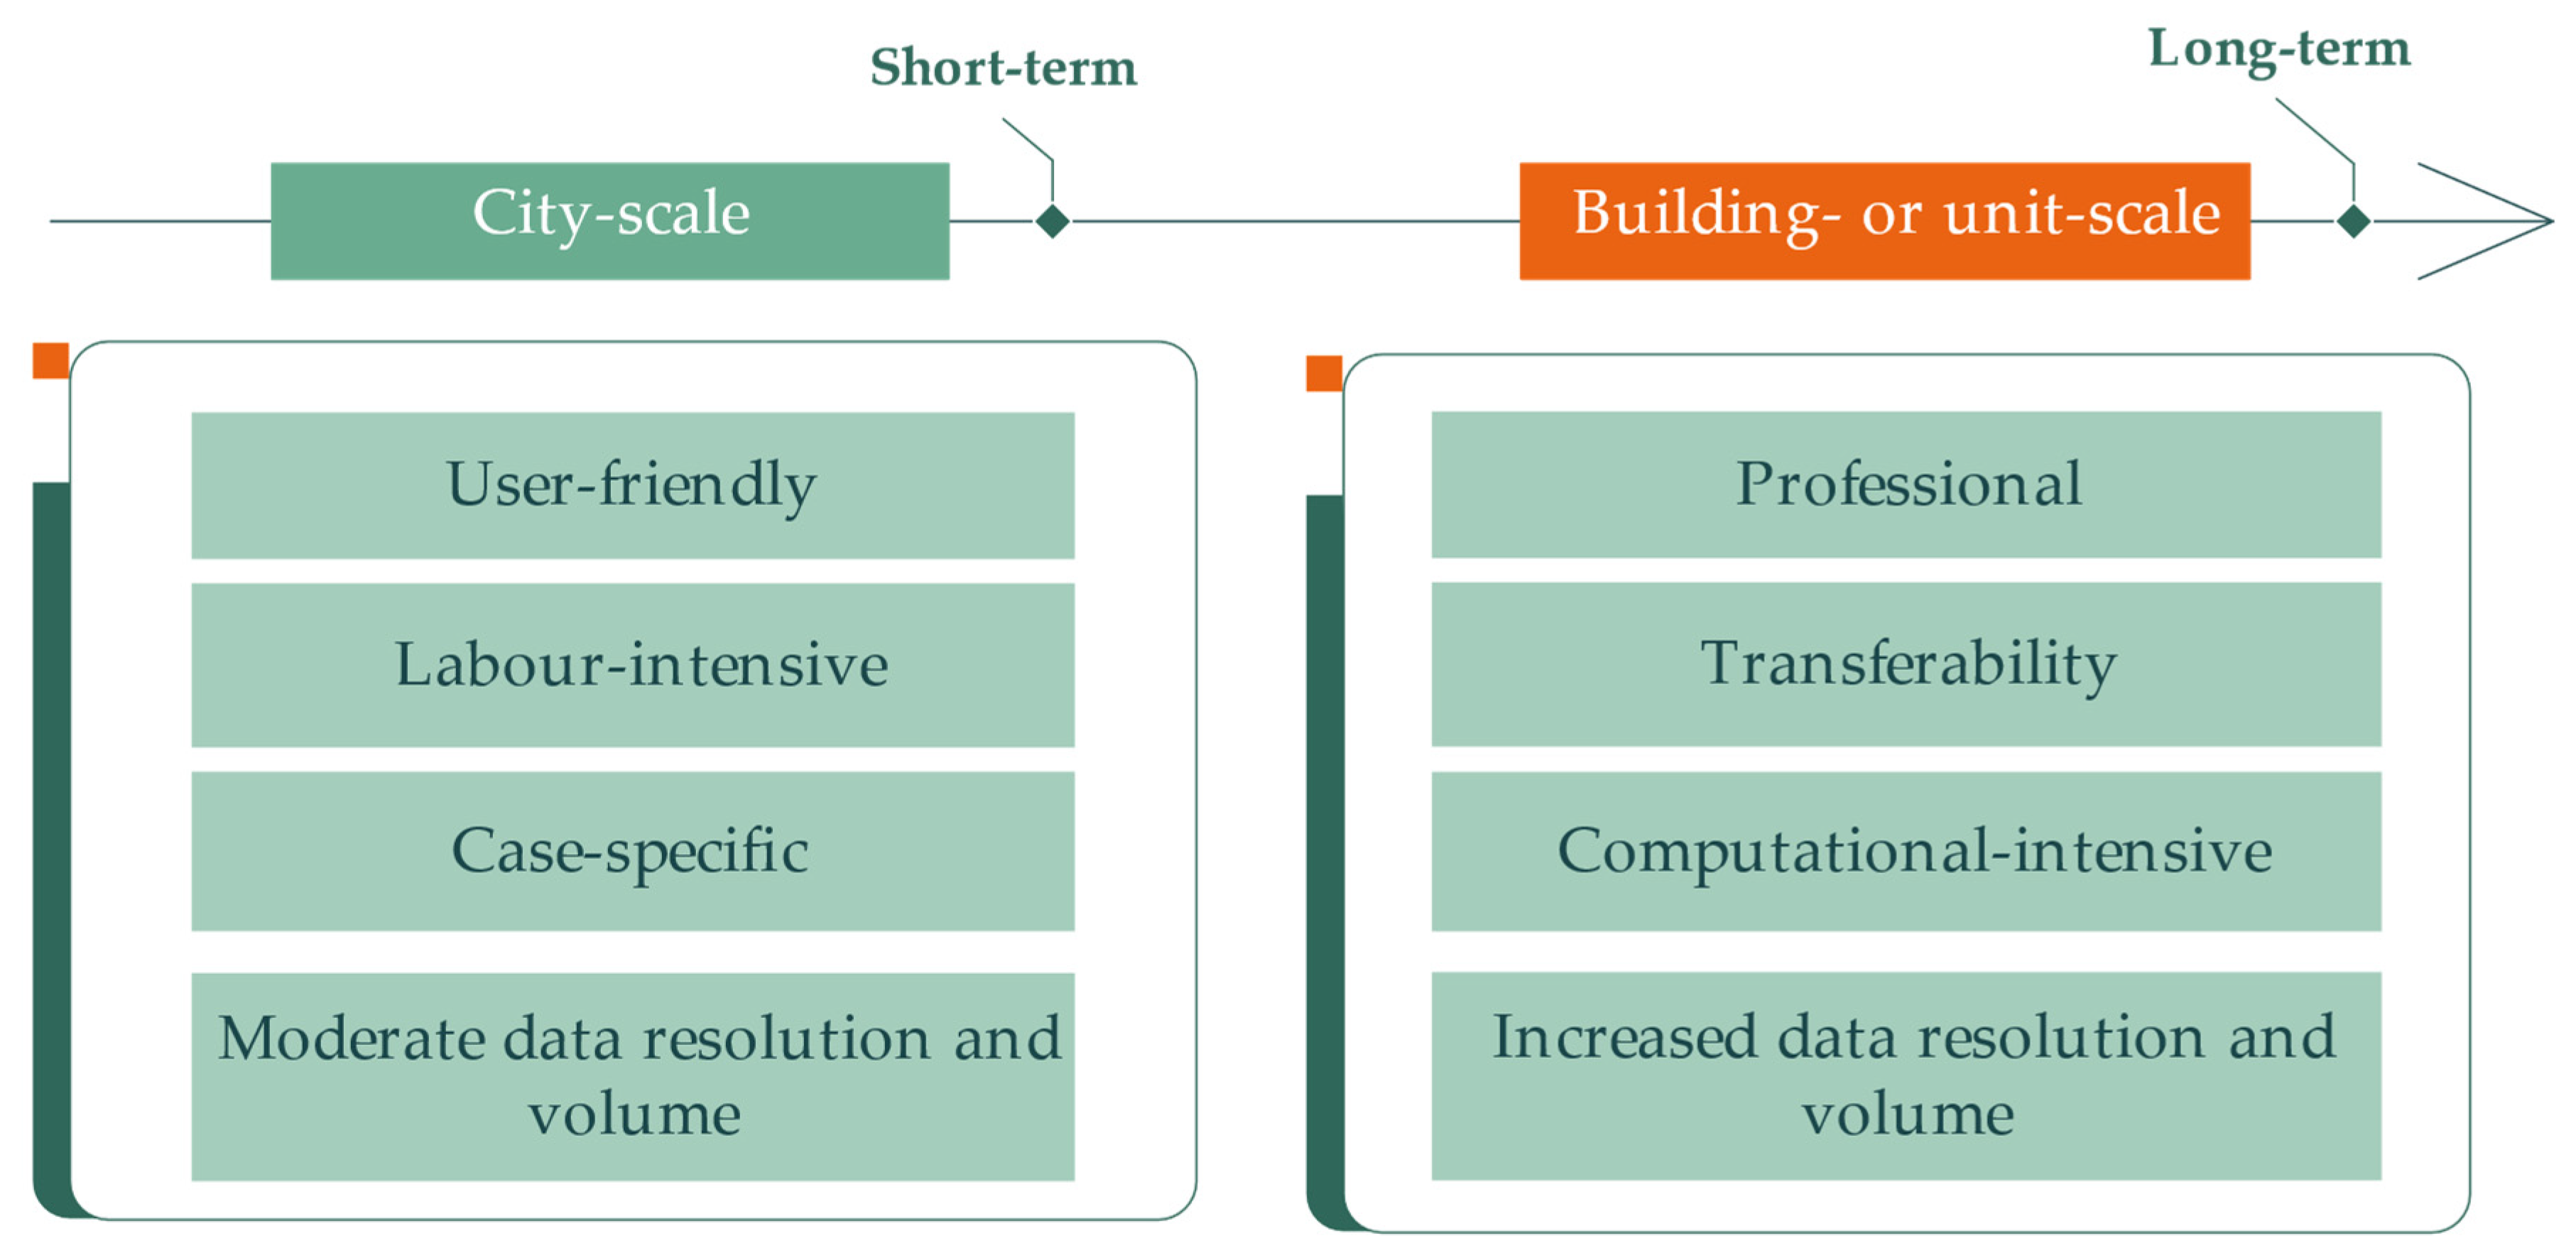
4.1. Short-Term and in Large-Scale (City-Scale)

In this initial stage, the overarching objectives include (1) setting up the fundamental 3D factors and spatial analytical functions and (2) preparing for future extensions. In summation, the localisation is prioritised, transferability is waived, involved stakeholders are limited (possible researchers only), modelling is data-driven with moderate computational intensity, and there is high flexibility regarding data collection, modelling, and storage.
Hybrid, open-source, and existing data are recommended because it is hard for a single data source to provide all the information, and 3D data collection is costly. Open-source data such as GSV and Sentinel-series satellite images are considered low-cost alternatives for 3D feature extraction; apparently, there is a trade-off between the cost and the data quality (e.g., resolution, timeliness, and coverage). In general, data processing at this stage is primitive, e.g., no proper database management and a high level of manual involvement. For example, the building height can be replaced by the number of total floors multiplied by an assumed floor height (generally 3 metres), which is a common practice [4,253].
For the technical specifications, laptop workstations or small servers are enough with manual modelling and semi-automation, so we suggest procedural modelling as the primary method. While it may have trouble dealing with irregular shapes [71], it is acceptable at this stage because (1) the research scale is at city-scale and (2) high-rise residential buildings often have regular footprints. Furthermore, software with built-in functions is preferential (e.g., CityEngine and 3D analyst module in ArcGIS). Spatial regression models are recommended for property value modelling due to their robustness and transparency, as reported in the existing literature and by valuation professionals in our expert interviews.
Regarding users, it may be kept within the researchers. They are responsible for developing the whole workflow from scratch to build a DT for 3DPV, i.e., deciding on input data, use of software, type of analysis, and output 3D factors. We do not expect ethical issues because only anonymised data are collected.

4.2. Long-Term and in Fine-Scale (Building- or Unit-Scale)

In this stage, the overarching objectives are more advanced, aiming for (1) improved functionality (e.g., complex yet more accurate 3D spatial analyses), (2) category-specific 3D data, and (3) generalisation (transferability). To summarise, it is model-driven with a workflow designed for 3DPV.
We still recommend hybrid data to fully utilise the advantages of the respective data. When integrating a multi-source point cloud, as an example, ALS and TLS capture data from the top or side view, with the former optimal for building outline extraction and the latter for façade and ground object construction (e.g., street lamp and tree) [254]. The combination of MLS and TLS can capture green coverage in urban areas, which can be important to explore whether it has different impacts on properties on low-storey and high-storey levels [133]. It is necessary to increase the accuracy of visibility analysis, as the view of properties in a low-storey level may be blocked by various objects. Moreover, several improvements are as follows. First, independent 3D data collection becomes feasible because the existing datasets may not fully satisfy the requirements (e.g., timeliness, coverage, and resolution). Second, more category-specific data are included to enhance the explanatory power. For instance, sunlight and shadow conditions influence energy consumption, and the façade materials impact noise absorption. They both may influence the living quality and property values but remain to be investigated in property valuation studies [255]. Third, data validation becomes essential to avoid error propagation and guarantee modelling accuracy. Lastly, a mature and open 3D data format is preferential, as it avails transferability and extensions.
Similarly, the technical specifications should match the new requirements arising from increased data volume and composition complexity. First, data storage and security should be treated seriously when dealing with multi-source 2D and 3D data, so DBMS (e.g., Oracle and PostgreSQL) is suggested due to its functionality, such as data analysis and interpretation and different levels of access authorities. The 3DcityDB is a typical example developed based on a PostgreSQL extended with PostGIS [151]. Second, software capable of feature manipulation, visualisation, and spatial analysis should be used. Here a better visualisation is applicable by texture mapping concerning the roof and the façade. Third, developing tailor-made software/platforms and cloud computing can be considered due to increased computational intensity [256], but they are also costly [257]. AI algorithms (e.g., ML and DL) have been widely used for multi-tasks (e.g., image orientation or semantic segmentation and estimating housing prices) to improve efficiency and accuracy [41,194], but we should be aware of the potential risks. First, the training and testing for image segmentation and classification asks for high-quality images input. Otherwise, as Liu, Wang [193] mentioned, the occlusions and distortions would lead to a failure, making the whole learning process meaningless. Second, the black box issue is highlighted, and algorithms help us to identify where it focuses on, whereas property valuation needs robust explanations of the influence of different factors.
We expect to satisfy users’ requirements from different stakeholders in the long term, so the whole workflow should be assigned to specialists to fulfil tasks separately. Ethical issues may arise due to personal information collection, especially in individual properties (e.g., the specific locational data, the owner’s personal information and transaction records). Therefore, data collection, storage, and sharing should strictly comply with local data regulations, such as the general data protection regulation (GDPR) in the European Union (EU) and the European Economic Area (EEA).

4.3. Summary: Similarities and Differences

It would be too early to provide paradigms for 3DPV, as it is only a research topic in the embryotic state and needs exploration by different stakeholders. The features of short-term and long-term prospects are highlighted in Table 5 as an answer to Table 3. Figure 7 provides a bullet point overview of 3DPV development.

5. Conclusions

3D modelling for city DT creation has been a key way to visualise multiple high-rise buildings in urban areas and implement urban analysis. Despite its popularity, 3D modelling for city DT creation and property valuation are not well integrated; 2D-based data currently dominate the latter, and literature of 3DPV is limited; however, there is an urgent need for a shift from 2D to 3D due to fast urbanisation worldwide. The overarching objective of this review was to find appropriate urban 3D modelling method(s) that can be used for 3DPV. It is achieved in the following steps. Our analysis reveals a strong indication for interdisciplinary collaboration because of the varying data sources, different software, and respective professional knowledge. Property valuation requires data not only from 2D-based geographical aspects but also from semantic and legal aspects; therefore, there are no perfect or one-size-fits-all 3D modelling methods for city DT creation for 3DPV at the moment. A model with information from different categories will make remarkable contributions to scalability, flexibility, and transferability. We also notice that the use of AI has the potential to avail 3DPV significantly and has been involved in almost each stage of city DTs for data collection, processing, and visualisation. Despite its many advantages, we should still treat it carefully with property valuation due to the black box issue: the transparency would be challenged without valid explanations of how certain factors impact property values.
We highlight the importance of localisation in property valuation; thus, the factors included in the valuation model should be flexible and updatable due to differences of local people’s preferences, 3D data availability and resolution, and timing. For example, it is likely that urbanites value the view of greenery more and people now value air quality more than 20 years ago. Developing alternative proxies to explain property values from a 3D perspective has large potentials, i.e., unobserved links can be constructed between property values and specific factors, which will add stringency to 3DPV. For example, BIM for high-rise building administration brings more opportunities to visualise legal connections of different land rights [217]. In addition, this review was written during the COVID-19 pandemic, and we are aware of how people’s mental and physical conditions can be influenced by a long time staying at home, especially in urban areas where the majority live in apartments in high-rise buildings. People’s mobility is restricted, and the importance of 3D stands out. For example, people now have to stand the noise and bad air quality from streets and roads all day if they live in a low storey level, and a property that enjoys more sunlight hours will have more value than before. Such kinds of impacts can be quantified and visualised straightforwardly by different 3D modelling methods, which have been proven applicable by empirical studies [204,228]. Moreover, high-rise housing was already claimed to be less satisfactory than other housing options [258], and it may become even worse in a pandemic situation as it increases the risks of exposure for residents [259].
We would like to note there are still challenges ahead. Based on the literature, due to the high collection cost and closed sources, 3D data availability (more importantly, the data format harmonisation) is an important issue to be solved. This includes limited access and coverage, and coarse resolution restrict DT creation; moreover, 3D modelling also inherently proposes high technical requirements, which thus have pressure on mass property valuation regarding the cost, thus developing a cost-efficient and affordable method for city-scale modelling is a must-do. More importantly, behind the technical gap is the conceptual gap, i.e., people may not have yet recognised the importance of understanding 3D factors on the impact of urban lives with increasing amounts of high-rise buildings; thus, it is challenging to realise the shift from 2D to 3D in property valuation. The shift is the first step, after which we should be aware of how to update. The urban environment changes over time, which highlights the temporal characteristics of value. How to update 3D factors and quantify their influence on values in time is another challenge. We consider people’s understanding of 3D for city DTs necessary to accelerate the shift, in which interdisciplinary collaboration and openness would be the keys to success. Because more information is included in the valuation process, less bias is the valuation result. This review can provide references for different stakeholders in the real estate sector. Researchers may use it as technical references to select the optimal one for their research purposes, i.e., beyond only property valuation. It may also improve the recognition of local government concerning the economic and aesthetic value brought by 3D in complex urban areas, so the future housing policy may help create a city with equal access to 3D surroundings, which leaves no one behind. Engineers can identify challenges and opportunities in 3DPV so that they can target more applicable 3D modelling methods for valuation.
Lastly, it is important to acknowledge certain limitations of this review. First, the perspectives of existing studies naturally restricted it, and non-English written literature was not included due to authors’ readability. Nevertheless, we aimed to maximise literature inclusiveness by applying expert interviews and the snowball sampling strategy. Second, this review focuses on the literature published from 2016–2020, when few 3DPV case studies were identified. It may impact the inferences of 3DPV prospects. Another review for the next five-year period would be helpful to update the progress.

Author Contributions

Conceptualisation, Yue Ying, Mila Koeva, Monika Kuffer and Jaap Zevenbergen; methodology, Yue Ying; software, Yue Ying; validation, Yue Ying; formal analysis, Yue Ying; funding acquisition, Yue Ying and Jaap Zevenbergen; visualization, Yue Ying; writing—original draft, Yue Ying; review and editing, Yue Ying, Mila Koeva, Monika Kuffer and Jaap Zevenbergen; supervision, Mila Koeva, Monika Kuffer and Jaap Zevenbergen. All authors have read and agreed to the published version of the manuscript.

Funding

Y.Y. was funded by the China Scholarship Council (CSC) under the grant number [201906560015]. The APC was funded by the Faculty of Geo-Information Science and Earth Observation (ITC), University of Twente.

Informed Consent Statement

Informed consent was obtained from all subjects involved in the study.

Data Availability Statement

The data presented in this study are available on request from the corresponding author.

Acknowledgments

We would like to thank Panpan Tian for helping with the review strategy and all the experts who participated in online interviews for their valuable comments.

Conflicts of Interest

The authors declare no conflict of interest.

References

  1. United Nations Human Settlements Programme. World Cities Report 2020: The Value of Sustainable Urbanization; The United Nations Human Settlements Programme (UN-Habitat): Nairobi, Kenya, 2020; p. 418. [Google Scholar]
  2. United Nations. Sustainable Development Goals (SDGs). Available online: https://www.un.org/sustainabledevelopment/sustainable-development-goals/ (accessed on 1 December 2022).
  3. Chen, H.; Jia, B.; Lau, S.S.Y. Sustainable urban form for Chinese compact cities: Challenges of a rapid urbanized economy. Habitat Int. 2008, 32, 28–40. [Google Scholar] [CrossRef]
  4. Ying, Y.; Koeva, M.; Kuffer, M.; Asiama, K.O.; Li, X.; Zevenbergen, J. Making the Third Dimension (3D) Explicit in Hedonic Price Modelling: A Case Study of Xi’an, China. Land 2021, 10, 24. [Google Scholar] [CrossRef]
  5. He, S.Y. Regional impact of rail network accessibility on residential property price: Modelling spatial heterogeneous capitalisation effects in Hong Kong. Transp. Res. A-Policy Pract. 2020, 135, 244–263. [Google Scholar] [CrossRef]
  6. Peachey, K.; Palumbo, D. Why house prices are rising so fast in a pandemic. BBC News, 2 June 2021. [Google Scholar]
  7. Horvath, S.; Soot, M.; Zaddach, S.; Neuner, H.; Weitkamp, A. Deriving adequate sample sizes for ANN-based modelling of real estate valuation tasks by complexity analysis. Land Use Policy 2021, 107, 105475. [Google Scholar] [CrossRef]
  8. Ying, Y.; Koeva, M.; Kuffer, M.; Asiama, K.O.; Li, X.; Zevenbergen, J. The Perception of the Vertical Dimension (3D) through the Lens of Different Stakeholders in the Property Market of China. Land 2022, 11, 312. [Google Scholar] [CrossRef]
  9. Rajapaksa, D.; Gono, M.; Wilson, C.; Managi, S.; Lee, B.; Hoang, V.N. The demand for education: The impacts of good schools on property values in Brisbane, Australia. Land Use Policy 2020, 97, 104748. [Google Scholar] [CrossRef]
  10. Wu, Y.Y.; Wei, Y.H.D.; Li, H. Analyzing Spatial Heterogeneity of Housing Prices Using Large Datasets. Appl. Spat. Anal. Policy 2020, 13, 223–256. [Google Scholar] [CrossRef]
  11. Rosen, S. Hedonic prices and implicit markets: Product differentiation in pure competition. J. Political Econ. 1974, 82, 34–55. [Google Scholar] [CrossRef]
  12. Lancaster, K.J. A new approach to consumer theory. J. Political Econ. 1966, 74, 132–157. [Google Scholar] [CrossRef]
  13. Lu, Q.; Parlikad, A.K.; Woodall, P.; Don Ranasinghe, G.; Xie, X.; Liang, Z.; Konstantinou, E.; Heaton, J.; Schooling, J. Developing a Digital Twin at Building and City Levels: Case Study of West Cambridge Campus. J. Manag. Eng. 2020, 36, 05020004. [Google Scholar] [CrossRef]
  14. Lehtola, V.V.; Koeva, M.; Elberink, S.O.; Raposo, P.; Virtanen, J.-P.; Vahdatikhaki, F.; Borsci, S. Digital twin of a city: Review of technology serving city needs. Int. J. Appl. Earth Obs. Geoinf. 2022, 114, 102915. [Google Scholar] [CrossRef]
  15. Schleich, B.; Anwer, N.; Mathieu, L.; Wartzack, S. Shaping the digital twin for design and production engineering. CIRP Ann. 2017, 66, 141–144. [Google Scholar] [CrossRef] [Green Version]
  16. Shahat, E.; Hyun, C.T.; Yeom, C. City Digital Twin Potentials: A Review and Research Agenda. Sustainability 2021, 13, 3386. [Google Scholar] [CrossRef]
  17. Fan, C.; Zhang, C.; Yahja, A.; Mostafavi, A. Disaster City Digital Twin: A vision for integrating artificial and human intelligence for disaster management. Int. J. Inf. Manag. 2021, 56, 102049. [Google Scholar] [CrossRef]
  18. Zahran, E.S.M.; Smith, M.J.; Bennett, L.D. 3D Visualization of Traffic-Induced Air Pollution Impacts of Urban Transport Schemes. J. Comput. Civ. Eng. 2013, 27, 452–465. [Google Scholar] [CrossRef]
  19. Wang, H.B.; Chen, H.J.; Cai, M. Evaluation of an urban traffic Noise-Exposed population based on points of interest and noise maps: The case of Guangzhou. Environ. Pollut. 2018, 239, 741–750. [Google Scholar] [CrossRef]
  20. Zhao, J.; Liu, E.X.; Poh, H.J.; Wang, B.F.; Gao, S.P.; Png, C.E.; Li, K.W.H.; Chong, S.H. 3D traffic noise mapping using unstructured surface mesh representation of buildings and roads. Appl. Acoust. 2017, 127, 297–304. [Google Scholar] [CrossRef]
  21. Yu, S.M.; Han, S.S.; Chai, C.H. Modeling the value of view in high-rise apartments: A 3D GIS approach. Environ. Plann B 2007, 34, 139–153. [Google Scholar] [CrossRef]
  22. Biljecki, F.; Stoter, J.; Ledoux, H.; Zlatanova, S.; Çöltekin, A. Applications of 3D City Models: State of the Art Review. ISPRS Int. J. Geo-Inf. 2015, 4, 2842–2889. [Google Scholar] [CrossRef] [Green Version]
  23. Biljecki, F.; Kumar, K.; Nagel, C. CityGML Application Domain Extension (ADE): Overview of developments. Open Geospat. Data Softw. Stand. 2018, 3. [Google Scholar] [CrossRef]
  24. Trubka, R.; Glackin, S.; Lade, O.; Pettit, C. A web-based 3D visualisation and assessment system for urban precinct scenario modelling. ISPRS J. Photogramm. Remote Sens. 2016, 117, 175–186. [Google Scholar] [CrossRef]
  25. Liu, X.; Wang, X.Y.; Wright, G.; Cheng, J.C.P.; Li, X.; Liu, R. A State-of-the-Art Review on the Integration of Building Information Modeling (BIM) and Geographic Information System (GIS). ISPRS Int. J. Geo-Inf. 2017, 6, 53. [Google Scholar] [CrossRef] [Green Version]
  26. Wang, H.; Pan, Y.; Luo, X.C. Integration of BIM and GIS in sustainable built environment: A review and bibliometric analysis. Autom. Constr. 2019, 103, 41–52. [Google Scholar] [CrossRef]
  27. Kalogianni, E.; van Oosterom, P.; Dimopoulou, E.; Lemmen, C. 3D Land Administration: A Review and a Future Vision in the Context of the Spatial Development Lifecycle. ISPRS Int. J. Geo-Inf. 2020, 9, 107. [Google Scholar] [CrossRef] [Green Version]
  28. El Yamani, S.; Hajji, R.; Nys, G.-A.; Ettarid, M.; Billen, R. 3D Variables Requirements for Property Valuation Modeling Based on the Integration of BIM and CIM. Sustainability 2021, 13, 2814. [Google Scholar] [CrossRef]
  29. Doner, F.; Sirin, S. 3D Digital Representation of Cadastral Data in Turkey-Apartments Case. Land 2020, 9, 179. [Google Scholar] [CrossRef]
  30. Grover, R.; Walacik, M. Property Valuation and Taxation for Fiscal Sustainability—Lessons for Poland. Real Estate Manag. Valuat. 2019, 27, 35–48. [Google Scholar] [CrossRef] [Green Version]
  31. Grover, R. Mass valuations. J. Prop. Invest. Financ. 2016, 34, 191–204. [Google Scholar] [CrossRef]
  32. Votsis, A. Planning for green infrastructure: The spatial effects of parks, forests, and fields on Helsinki’s apartment prices. Ecol. Econ. 2017, 132, 279–289. [Google Scholar] [CrossRef] [Green Version]
  33. Lieske, S.N.; van den Nouwelant, R.; Han, J.H.; Pettit, C. A novel hedonic price modelling approach for estimating the impact of transportation infrastructure on property prices. Urban Stud. 2019, 58, 182–202. [Google Scholar] [CrossRef]
  34. Czembrowski, P.; Kronenberg, J. Hedonic pricing and different urban green space types and sizes: Insights into the discussion on valuing ecosystem services. Landsc. Urban Plan. 2016, 146, 11–19. [Google Scholar] [CrossRef]
  35. Schläpfer, F.; Waltert, F.; Segura, L.; Kienast, F. Valuation of landscape amenities: A hedonic pricing analysis of housing rents in urban, suburban and periurban Switzerland. Landsc. Urban Plan. 2015, 141, 24–40. [Google Scholar] [CrossRef]
  36. Bottero, M.; Caprioli, C.; Foth, M.; Mitchell, P.; Rittenbruch, M.; Santangelo, M. Urban parks, value uplift and green gentrification: An application of the spatial hedonic model in the city of Brisbane. Urban For. Urban Green. 2022, 74, 127618. [Google Scholar] [CrossRef]
  37. Łaszkiewicz, E.; Czembrowski, P.; Kronenberg, J. Can proximity to urban green spaces be considered a luxury? Classifying a non-tradable good with the use of hedonic pricing method. Ecol. Econ. 2019, 161, 237–247. [Google Scholar] [CrossRef]
  38. Łaszkiewicz, E.; Heyman, A.; Chen, X.; Cimburova, Z.; Nowell, M.; Barton, D.N. Valuing access to urban greenspace using non-linear distance decay in hedonic property pricing. Ecosyst. Serv. 2022, 53, 101394. [Google Scholar] [CrossRef]
  39. Paasch, J.M.; Paulsson, J. 3D Property Research from a Legal Perspective Revisited. Land 2021, 10, 494. [Google Scholar] [CrossRef]
  40. Belej, M.; Figurska, M. 3D Modeling of Discontinuity in the Spatial Distribution of Apartment Prices Using Voronoi Diagrams. Remote Sens. 2020, 12, 229. [Google Scholar] [CrossRef] [Green Version]
  41. Kang, Y.H.; Zhang, F.; Peng, W.Z.; Gao, S.; Rao, J.M.; Duarte, F.; Ratti, C. Understanding house price appreciation using multi-source big geo-data and machine learning. Land Use Policy 2021, 111, 104919. [Google Scholar] [CrossRef]
  42. Yin, L.; Hastings, J. Capitalizing on views: Assessing visibility by using 3D visualization and GIS technologies for hotel development in the city of Niagara falls, New York. J. Urban Technol. 2007, 14, 59–82. [Google Scholar] [CrossRef]
  43. Chen, M.X.; Liu, Y.Z.; Arribas-Bel, D.; Singleton, A. Assessing the value of user-generated images of urban surroundings for house price estimation. Landsc. Urban Plan. 2022, 226, 104486. [Google Scholar] [CrossRef]
  44. Lee, H.; Lee, B.; Lee, S. The Unequal Impact of Natural Landscape Views on Housing Prices: Applying Visual Perception Model and Quantile Regression to Apartments in Seoul. Sustainability 2020, 12, 8275. [Google Scholar] [CrossRef]
  45. Celik Simsek, N.; Uzun, B. Building Information Modelling (BIM) for property valuation: A new approach for Turkish Condominium Ownership. Surv. Rev. 2021, 54, 187–208. [Google Scholar] [CrossRef]
  46. Drobez, P.; Fras, M.K.; Ferlan, M.; Lisec, A. Transition from 2D to 3D real property cadastre: The case of the Slovenian cadastre. Comput. Environ. Urban Syst. 2017, 62, 125–135. [Google Scholar] [CrossRef]
  47. Kara, A.; van Oosterom, P.; Cagdas, V.; Isikdag, U.; Lemmen, C. 3 Dimensional data research for property valuation in the context of the LADM Valuation Information Model. Land Use Policy 2020, 98, 104179. [Google Scholar] [CrossRef]
  48. Han, N.L.; Zhang, W.; Liang, K. The Design and Implementation of Shenzhen House Price Indexes System Based on 3D-GIS. In Proceedings of the 2015 23rd International Conference on Geoinformatics, Wuhan, China, 19–21 June 2015. [Google Scholar]
  49. Emekli, H.; Guney, C. Toward building a 3D Web-based spatial decision framework for apartment selection. J. Hous. Built. Environ. 2019, 34, 769–789. [Google Scholar] [CrossRef]
  50. Zhang, Z.; Lu, X.H.; Zhou, M.; Song, Y.; Luo, X.; Kuang, B. Complex Spatial Morphology of Urban Housing Price Based on Digital Elevation Model: A Case Study of Wuhan City, China. Sustainability 2019, 11, 348. [Google Scholar] [CrossRef] [Green Version]
  51. Agarwal, S.; Fan, Y.; McMillen, D.P.; Sing, T.F. Tracking the pulse of a city-3D real estate price heat maps. J Reg. Sci. 2021, 61, 543–569. [Google Scholar] [CrossRef]
  52. Mokas, I.; Lizin, S.; Brijs, T.; Witters, N.; Malina, R. Can immersive virtual reality increase respondents’ certainty in discrete choice experiments? A comparison with traditional presentation formats. J. Environ. Econ. Manag. 2021, 109, 102509. [Google Scholar] [CrossRef]
  53. Juan, Y.-K.; Chen, H.-H.; Chi, H.-Y. Developing and Evaluating a Virtual Reality-Based Navigation System for Pre-Sale Housing Sales. Appl. Sci. 2018, 8, 952. [Google Scholar] [CrossRef] [Green Version]
  54. Xiong, C.; Cheung, K.S.; Levy, D.S.; Allen, M. The effect of virtual reality on the marketing of residential property. Hous. Stud. 2022, 1–24. [Google Scholar] [CrossRef]
  55. Ramdani, C.M.S.; Anshary, M.A.K.; Rachman, A.N.; Munggary, L.N. Implementation of Kampoeng Hijrah Residence Housing Catalog Based on Virtual Reality. In Proceedings of the 2nd International Conference of Computer and Informatics Engineering (IC2IE), Banyuwangi, Indonesia, 10–11 September 2019. [Google Scholar]
  56. McAllister, P.; Shepherd, E.; Wyatt, P. Policy shifts, developer contributions and land value capture in London 2005–2017. Land Use Policy 2018, 78, 316–326. [Google Scholar] [CrossRef]
  57. Lin, R.F.-Y.; Ou, C.; Tseng, K.-K.; Bowen, D.; Yung, K.L.; Ip, W.H. The Spatial neural network model with disruptive technology for property appraisal in real estate industry. Technol. Forecast. Soc. Change 2021, 173, 121067. [Google Scholar] [CrossRef]
  58. Wen, H.Z.; Xiao, Y.; Hui, E.C.M.; Zhang, L. Education quality, accessibility, and housing price: Does spatial heterogeneity exist in education capitalization? Habitat. Int. 2018, 78, 68–82. [Google Scholar] [CrossRef]
  59. Troy, A.; Grove, J.M. Property values, parks, and crime: A hedonic analysis in Baltimore, MD. Landsc. Urban Plan. 2008, 87, 233–245. [Google Scholar] [CrossRef]
  60. Zhang, L.; Zhou, J.T.; Hui, E.C.M.; Wen, H.Z. The Effects of a Shopping Mall on Housing Prices: A Case Study in Hangzhou. Int. J. Strateg. Prop. Manag. 2019, 23, 65–80. [Google Scholar] [CrossRef] [Green Version]
  61. Zhao, Y.; Wu, B.; Wu, J.P.; Shu, S.; Liang, H.D.; Liu, M.; Badenko, V.; Fedotov, A.; Yao, S.J.; Yu, B.L. Mapping 3D visibility in an urban street environment from mobile LiDAR point clouds. Giscience Remote Sens. 2020, 57, 797–812. [Google Scholar] [CrossRef]
  62. Albano, R. Investigation on Roof Segmentation for 3D Building Reconstruction from Aerial LIDAR Point Clouds. Appl. Sci. 2019, 9, 4674. [Google Scholar] [CrossRef] [Green Version]
  63. Wu, B.; Xie, L.F.; Hu, H.; Zhu, Q.; Yau, E. Integration of aerial oblique imagery and terrestrial imagery for optimized 3D modeling in urban areas. ISPRS J. Photogramm. Remote Sens. 2018, 139, 119–132. [Google Scholar] [CrossRef]
  64. Helbich, M.; Jochem, A.; Mucke, W.; Hofle, B. Boosting the predictive accuracy of urban hedonic house price models through airborne laser scanning. Comput. Environ. Urban Syst. 2013, 39, 81–92. [Google Scholar] [CrossRef] [Green Version]
  65. Nneji, O.; Brooks, C.; Ward, C.W.R. House price dynamics and their reaction to macroeconomic changes. Econ. Model. 2013, 32, 172–178. [Google Scholar] [CrossRef]
  66. Snyder, H. Literature review as a research methodology: An overview and guidelines. J. Bus. Res. 2019, 104, 333–339. [Google Scholar] [CrossRef]
  67. Fernandez-Rodriguez, S.; Cortes-Perez, J.P.; Muriel, P.P.; Tormo-Molina, R.; Maya-Manzano, J.M. Environmental impact assessment of Pinaceae airborne pollen and green infrastructure using BIM. Autom. Constr. 2018, 96, 494–507. [Google Scholar] [CrossRef]
  68. Singh, V.K.; Singh, P.; Karmakar, M.; Leta, J.; Mayr, P. The journal coverage of Web of Science, Scopus and Dimensions: A comparative analysis. Scientometrics 2021, 126, 5113–5142. [Google Scholar] [CrossRef]
  69. Sun, J.; Olsson, P.; Eriksson, H.; Harrie, L. Evaluating the geometric aspects of integrating BIM data into city models. J. Spat. Sci. 2020, 65, 235–255. [Google Scholar] [CrossRef] [Green Version]
  70. Wolberg, G.; Zokai, S. PhotoSketch: A photocentric urban 3D modeling system. Vis. Comput 2018, 34, 605–616. [Google Scholar] [CrossRef]
  71. Nishida, G.; Garcia-Dorado, I.; Aliaga, D.G.; Benes, B.; Bousseau, A. Interactive Sketching of Urban Procedural Models. ACM Trans Graph. 2016, 35, 1–11. [Google Scholar] [CrossRef] [Green Version]
  72. Ribelles, J.; Gutierrez, D.; Efros, A. BUILDUP: Interactive creation of urban scenes from large photo collections. Multimed. Tools Appl. 2017, 76, 12757–12774. [Google Scholar] [CrossRef]
  73. Bittner, K.; Korner, M.; Fraundorfer, F.; Reinartz, P. Multi-Task cGAN for Simultaneous Spaceborne DSM Refinement and Roof-Type Classification. Remote Sens. 2019, 11, 1262. [Google Scholar] [CrossRef] [Green Version]
  74. Wang, S.X.; Tian, Y.; Zhou, Y.; Liu, W.L.; Lin, C.X. Fine-Scale Population Estimation by 3D Reconstruction of Urban Residential Buildings. Sensors 2016, 16, 1755. [Google Scholar] [CrossRef] [Green Version]
  75. Song, X.Y.; Huang, Y.H.; Zhao, C.P.; Liu, Y.X.; Lu, Y.G.; Chang, Y.G.; Yang, J. An Approach for Estimating Solar Photovoltaic Potential Based on Rooftop Retrieval from Remote Sensing Images. Energies 2018, 11, 3172. [Google Scholar] [CrossRef]
  76. Sharma, S.A.; Agrawal, R.; Jayaprasad, P. Development of ‘3D City Models’ using IRS Satellite Data. J. Ind. Soc. Remote Sens. 2016, 44, 187–196. [Google Scholar] [CrossRef]
  77. Peeters, A. A GIS-based method for modeling urban-climate parameters using automated recognition of shadows cast by buildings. Comput. Environ. Urban Syst. 2016, 59, 107–115. [Google Scholar] [CrossRef]
  78. Nishida, G.; Bousseau, A.; Aliaga, D.G. Procedural Modeling of a Building from a Single Image. Comput. Graph. Forum. 2018, 37, 415–429. [Google Scholar] [CrossRef] [Green Version]
  79. Misra, P.; Avtar, R.; Takeuchi, W. Comparison of Digital Building Height Models Extracted from AW3D, TanDEM-X, ASTER, and SRTM Digital Surface Models over Yangon City. Remote Sens. 2018, 10, 2008. [Google Scholar] [CrossRef] [Green Version]
  80. Ma, D.L.; Li, G.Y.; Wang, L. Rapid Reconstruction of a Three-Dimensional Mesh Model Based on Oblique Images in the Internet of Thins. IEEE Access 2018, 6, 61686–61699. [Google Scholar] [CrossRef]
  81. Liu, C.J.; Krylov, V.A.; Kane, P.; Kavanagh, G.; Dahyot, R. IM2ELEVATION: Building Height Estimation from Single-View Aerial Imagery. Remote Sens. 2020, 12, 2719. [Google Scholar] [CrossRef]
  82. Lee, J.; Yang, B.Y. Developing an optimized texture mapping for photorealistic 3D buildings. Trans. GIS 2019, 23, 1–21. [Google Scholar] [CrossRef]
  83. Jiao, S.; Yu, J.; Milas, A.S.; Li, X.J.; Liu, L.M. Assessing the Impact of Building Volume on Land Subsidence in the Central Business District of Beijing with SAR Tomography. Can. J. Remote Sens. 2017, 43, 177–193. [Google Scholar] [CrossRef]
  84. Jhaldiyal, A.; Gupta, K.; Gupta, P.K.; Thakur, P.; Kumar, P. Urban Morphology Extractor: A spatial tool for characterizing urban morphology. Urban Clim. 2018, 24, 237–246. [Google Scholar] [CrossRef]
  85. Guo, R.; Wang, F.; Zang, B.; Jing, G.B.; Xing, M.D. High-Rise Building 3D Reconstruction with the Wrapped Interferometric Phase. Sensors 2019, 19, 1439. [Google Scholar] [CrossRef]
  86. Gong, F.Y.; Zeng, Z.C.; Zhang, F.; Li, X.J.; Ng, E.; Norford, L.K. Mapping sky, tree, and building view factors of street canyons in a high-density urban environment. Build. Environ. 2018, 134, 155–167. [Google Scholar] [CrossRef]
  87. Costanzo, V.; Yao, R.M.; Li, X.Y.; Liu, M.; Li, B.Z. A multi-layer approach for estimating the energy use intensity on an urban scale. Cities 2019, 95, 102467. [Google Scholar] [CrossRef]
  88. Campanaro, D.M.; Landeschi, G.; Dell’Unto, N.; Touati, A.M.L. 3D GIS for cultural heritage restoration: A ‘white box’ workflow. J. Cult. Herit. 2016, 18, 321–332. [Google Scholar] [CrossRef]
  89. Bulatov, D.; Burkard, E.; Ilehag, R.; Kottler, B.; Helmholz, P. From multi-sensor aerial data to thermal and infrared simulation of semantic 3D models: Towards identification of urban heat islands. Infrared Phys. Technol. 2020, 105, 103233. [Google Scholar] [CrossRef]
  90. Bittner, K.; d’Angelo, P.; Korner, M.; Reinartz, P. DSM-to-LoD2: Spaceborne Stereo Digital Surface Model Refinement. Remote Sens. 2018, 10, 1926. [Google Scholar] [CrossRef] [Green Version]
  91. Alavipanah, S.; Schreyer, J.; Haase, D.; Lakes, T.; Qureshi, S. The effect of multi-dimensional indicators on urban thermal conditions. J. Clean. Prod. 2018, 177, 115–123. [Google Scholar] [CrossRef]
  92. Ahmed, E.; Tarig, A.; James, B. Delineating planner surfaces from correlation-based DEMS. Earth Sci. Inform. 2020, 13, 835–846. [Google Scholar] [CrossRef]
  93. Rothermel, M.; Gong, K.; Fritsch, D.; Schindler, K.; Haala, N. Photometric multi-view mesh refinement for high-resolution satellite images. ISPRS J. Photogramm. Remote Sens. 2020, 166, 52–62. [Google Scholar] [CrossRef]
  94. Babahajiani, P.; Fan, L.X.; Kamarainen, J.K.; Gabbouj, M. Urban 3D segmentation and modelling from street view images and LiDAR point clouds. Mach. Vis. Appl. 2017, 28, 679–694. [Google Scholar] [CrossRef]
  95. Ni, H.; Lin, X.G.; Ning, X.G.; Zhang, J.X. Edge Detection and Feature Line Tracing in 3D-Point Clouds by Analyzing Geometric Properties of Neighborhoods. Remote Sens. 2016, 8, 710. [Google Scholar] [CrossRef]
  96. Cao, R.J.; Zhang, Y.J.; Liu, X.Y.; Zhao, Z.Z. 3D building roof reconstruction from airborne LiDAR point clouds: A framework based on a spatial database. Int. J. Geogr. Inf. Sci. 2017, 31, 1359–1380. [Google Scholar] [CrossRef]
  97. Zhang, L.Q.; Li, Z.Q.; Li, A.J.; Liu, F.Y. Large-scale urban point cloud labeling and reconstruction. ISPRS J. Photogramm. Remote Sens. 2018, 138, 86–100. [Google Scholar] [CrossRef]
  98. Yi, C.; Zhang, Y.; Wu, Q.Y.; Xu, Y.B.; Remil, O.; Wei, M.Q.; Wang, J. Urban building reconstruction from raw LiDAR point data. Comput.-Aided Des. 2017, 93, 1–14. [Google Scholar] [CrossRef]
  99. Ye, L.; Wu, B. Integrated Image Matching and Segmentation for 3D Surface Reconstruction in Urban Areas. Photogramm. Eng. Remote Sens. 2018, 84, 135–148. [Google Scholar] [CrossRef]
  100. Widyaningrum, E.; Peters, R.Y.; Lindenbergh, R.C. Building outline extraction from ALS point clouds using medial axis transform descriptors. Pattern Recognit. 2020, 106, 107447. [Google Scholar] [CrossRef]
  101. Wang, Y.; Cheng, L.; Chen, Y.M.; Wu, Y.; Li, M.C. Building Point Detection from Vehicle-Borne LiDAR Data Based on Voxel Group and Horizontal Hollow Analysis. Remote Sens. 2016, 8, 419. [Google Scholar] [CrossRef] [Green Version]
  102. Wang, Q.D.; Yan, L.; Zhang, L.; Ai, H.B.; Lin, X.G. A Semantic Modelling Framework-Based Method for Building Reconstruction from Point Clouds. Remote Sens. 2016, 8, 737. [Google Scholar] [CrossRef] [Green Version]
  103. Wang, L.Y.; Xu, Y.; Li, Y. A Voxel-Based 3D Building Detection Algorithm for Airborne LIDAR Point Clouds. J. Ind. Soc. Remote Sens. 2019, 47, 349–358. [Google Scholar] [CrossRef]
  104. Wang, J.L.; Lu, Y.H.; Liu, J.B.; Quan, L. A robust three-stage approach to large-scale urban scene recognition. Sci. China-Inf. Sci. 2017, 60, 1–13. [Google Scholar] [CrossRef]
  105. Wang, J.; Xu, Y.; Remil, O.; Xie, X.; Ye, N.; Yi, C.; Wei, M. Automatic Modeling of Urban Facades from Raw LiDAR Point Data. Comput. Graph. Forum. 2016, 35, 269–278. [Google Scholar] [CrossRef]
  106. Wang, J.; Xu, K. Shape Detection from Raw LiDAR Data with Subspace Modeling. IEEE Trans. Vis. Comput. Graph. 2017, 23, 2137–2150. [Google Scholar] [CrossRef] [PubMed]
  107. Templin, T.; Popielarczyk, D. The Use of Low-Cost Unmanned Aerial Vehicles in the Process of Building Models for Cultural Tourism, 3D Web and Augmented/Mixed Reality Applications. Sensors 2020, 20, 5457. [Google Scholar] [CrossRef] [PubMed]
  108. Sun, X.F.; Shen, S.H.; Cui, H.N.; Hu, L.H.; Hu, Z.Y. Geographic, Geometrical and Semantic Reconstruction of Urban Scene from High Resolution Oblique Aerial Images. Ieee-Caa J. Autom. Sin. 2019, 6, 118–130. [Google Scholar] [CrossRef]
  109. Soilian, M.; Riveiro, B.; Linares, P.; Padin-Beltran, M. Automatic Parametrization and Shadow Analysis of Roofs in Urban Areas from ALS Point Clouds with Solar Energy Purposes. ISPRS Int. J. Geo-Inf. 2018, 7, 301. [Google Scholar] [CrossRef] [Green Version]
  110. Shirowzhan, S.; Sepasgozar, S.M.E. Spatial Analysis Using Temporal Point Clouds in Advanced GIS: Methods for Ground Elevation Extraction in Slant Areas and Building Classifications. ISPRS Int. J. Geo-Inf. 2019, 8, 120. [Google Scholar] [CrossRef] [Green Version]
  111. Pirasteh, S.; Rashidi, P.; Rastiveis, H.; Huang, S.Z.; Zhu, Q.; Liu, G.X.; Li, Y.; Li, J.; Seydipour, E. Developing an Algorithm for Buildings Extraction and Determining Changes from Airborne LiDAR, and Comparing with R-CNN Method from Drone Images. Remote Sens. 2019, 11, 1272. [Google Scholar] [CrossRef] [Green Version]
  112. Park, S.Y.; Lee, D.G.; Yoo, E.J.; Lee, D.C. Segmentation of LiDAR Data Using Multilevel Cube Code. J. Sens. 2019, 2019, 4098413. [Google Scholar] [CrossRef]
  113. Nys, G.A.; Poux, F.; Billen, R. CityJSON Building Generation from Airborne LiDAR 3D Point Clouds. ISPRS Int. J. Geo-Inf. 2020, 9, 521. [Google Scholar] [CrossRef]
  114. Hao, W.; Wang, Y.H.; Liang, W. Slice-based building facade reconstruction from 3D point clouds. Int. J. Remote Sens. 2018, 39, 6587–6606. [Google Scholar] [CrossRef]
  115. Li, Z.Q.; Zhang, L.Q.; Mathiopoulos, P.T.; Liu, F.Y.; Zhang, L.; Li, S.P.; Liu, H. A hierarchical methodology for urban facade parsing from TLS point clouds. ISPRS J. Photogramm. Remote Sens. 2017, 123, 75–93. [Google Scholar] [CrossRef]
  116. Li, Y.; Hu, Q.W.; Wu, M.; Liu, J.M.; Wu, X. Extraction and Simplification of Building Facade Pieces from Mobile Laser Scanner Point Clouds for 3D Street View Services. ISPRS Int. J. Geo-Inf. 2016, 5, 231. [Google Scholar] [CrossRef] [Green Version]
  117. Li, Y.; Chen, D.; Du, X.C.; Xia, S.B.; Wang, Y.L.; Xu, S.; Yang, Q. Higher-Order Conditional Random Fields-Based 3D Semantic Labeling of Airborne Laser-Scanning Point Clouds. Remote Sens. 2019, 11, 1248. [Google Scholar] [CrossRef] [Green Version]
  118. Lai, X.D.; Yang, J.R.; Li, Y.X.; Wang, M.W. A Building Extraction Approach Based on the Fusion of LiDAR Point Cloud and Elevation Map Texture Features. Remote Sens. 2019, 11, 1636. [Google Scholar] [CrossRef] [Green Version]
  119. Jung, J.; Jwa, Y.; Sohn, G. Implicit Regularization for Reconstructing 3D Building Rooftop Models Using Airborne LiDAR Data. Sensors 2017, 17, 621. [Google Scholar] [CrossRef] [PubMed] [Green Version]
  120. Heo, H.K.; Lee, D.K.; Park, C.Y.; Kim, H.G. Sky view factor calculation in complex urban geometry with terrestrial LiDAR. Phys. Geogr. 2020, 42, 374–394. [Google Scholar] [CrossRef]
  121. Golombek, Y.; Marshall, W.E. Measuring Streetscape Features with High-Density Aerial Light Detection and Ranging. Transp. Res. Rec. 2020, 2674, 192–206. [Google Scholar] [CrossRef]
  122. Du, S.J.; Zhang, Y.S.; Zou, Z.R.; Xu, S.H.; He, X.; Chen, S.Y. Automatic building extraction from LiDAR data fusion of point and grid-based features. ISPRS J. Photogramm. Remote Sens. 2017, 130, 294–307. [Google Scholar] [CrossRef]
  123. dos Santos, R.C.; Galo, M.; Habib, A.F. Regularization of Building Roof Boundaries from Airborne LiDAR Data Using an Iterative CD-Spline. Remote Sens. 2020, 12, 1904. [Google Scholar] [CrossRef]
  124. Ding, Z.K.; Liu, S.; Liao, L.H.; Zhang, L. A digital construction framework integrating building information modeling and reverse engineering technologies for renovation projects. Autom. Constr. 2019, 102, 45–58. [Google Scholar] [CrossRef]
  125. Diaz-Vilarino, L.; Boguslawski, P.; Khoshelham, K.; Lorenzo, H. Obstacle-Aware Indoor Pathfinding Using Point Clouds. ISPRS Int. J. Geo-Inf. 2019, 8, 233. [Google Scholar] [CrossRef]
  126. Chen, Y.W.; Zhu, L.L.; Tang, J.; Pei, L.; Kukko, A.; Wang, Y.W.; Hyyppa, J.; Hyyppa, H. Feasibility Study of Using Mobile Laser Scanning Point Cloud Data for GNSS Line of Sight Analysis. Mob. Inf. Syst. 2017, 2017, 5407605. [Google Scholar] [CrossRef] [Green Version]
  127. Chen, Y.M.; Liu, X.Q.; Yao, M.R.; Deng, S.L.; Li, F.X.; Cheng, L.; Li, M.C. Repeated Structure Detection for 3D Reconstruction of Building Facade from Mobile Lidar Data. Photogramm. Eng. Remote Sens. 2019, 85, 93–108. [Google Scholar] [CrossRef]
  128. Chen, J.D.; Yi, J.S.K.; Kahoush, M.; Cho, E.S.; Cho, Y.K. Point Cloud Scene Completion of Obstructed Building Facades with Generative Adversarial Inpainting. Sensors 2020, 20, 5029. [Google Scholar] [CrossRef] [PubMed]
  129. Bartonek, D.; Buday, M. Problems of Creation and Usage of 3D Model of Structures and Theirs Possible Solution. Symmetry 2020, 12, 181. [Google Scholar] [CrossRef] [Green Version]
  130. Balado, J.; Diaz-Vilarino, L.; Arias, P.; Soilan, M. Automatic building accessibility diagnosis from point clouds. Autom. Constr. 2017, 82, 103–111. [Google Scholar] [CrossRef] [Green Version]
  131. Dollner, J. Geospatial Artificial Intelligence: Potentials of Machine Learning for 3D Point Clouds and Geospatial Digital Twins. Pfg-J. Photogramm. Remote Sens. Geoinf. Sci. 2020, 88, 15–24. [Google Scholar] [CrossRef] [Green Version]
  132. Austin, M.; Delgoshaei, P.; Coelho, M.; Heidarinejad, M. Architecting Smart City Digital Twins: Combined Semantic Model and Machine Learning Approach. J. Manag. Eng. 2020, 36, 14. [Google Scholar] [CrossRef]
  133. Bienert, A.; Georgi, L.; Kunz, M.; Maas, H.G.; von Oheimb, G. Comparison and Combination of Mobile and Terrestrial Laser Scanning for Natural Forest Inventories. Forests 2018, 9, 395. [Google Scholar] [CrossRef] [Green Version]
  134. Cavegn, S.; Haala, N. Image-Based Mobile Mapping for 3D Urban Data Capture. Photogramm. Eng. Remote Sens. 2016, 82, 925–933. [Google Scholar] [CrossRef]
  135. Pan, S.Y.; Guan, H.Y.; Chen, Y.T.; Yu, Y.T.; Goncalves, W.N.; Marcato, J.; Li, J. Land-cover classification of multispectral LiDAR data using CNN with optimized hyper-parameters. ISPRS J. Photogramm. Remote Sens. 2020, 166, 241–254. [Google Scholar] [CrossRef]
  136. Zieba-Kulawik, K.; Skoczylas, K.; Mustafa, A.; Wezyk, P.; Gerber, P.; Teller, J.; Omrani, H. Spatiotemporal Changes in 3D Building Density with LiDAR and GEOBIA: A City-Level Analysis. Remote Sens. 2020, 12, 3668. [Google Scholar] [CrossRef]
  137. Zirak, M.; Weiler, V.; Hein, M.; Eicker, U. Urban models enrichment for energy applications: Challenges in energy simulation using different data sources for building age information. Energy 2020, 190, 116292. [Google Scholar] [CrossRef]
  138. Zhi, G.Z.; Liao, Z.L.; Tian, W.C.; Wu, J. Urban flood risk assessment and analysis with a 3D visualization method coupling the PP-PSO algorithm and building data. J. Environ. Manage. 2020, 268, 110521. [Google Scholar] [CrossRef] [PubMed]
  139. Zheng, Y.F.; Weng, Q.H.; Zheng, Y.X. A Hybrid Approach for Three-Dimensional Building Reconstruction in Indianapolis from LiDAR Data. Remote Sens. 2017, 9, 310. [Google Scholar] [CrossRef] [Green Version]
  140. Xie, J.H.; Feng, C.C. An Integrated Simplification Approach for 3D Buildings with Sloped and Flat Roofs. ISPRS Int. J. Geo-Inf. 2016, 5, 128. [Google Scholar] [CrossRef] [Green Version]
  141. Yang, B.; Lee, J. Improving accuracy of automated 3-D building models for smart cities. Int. J. Digit. Earth 2019, 12, 209–227. [Google Scholar] [CrossRef]
  142. Wang, C.K.; Tindemans, S.; Miller, C.; Agugiaro, G.; Stoter, J. Bayesian calibration at the urban scale: A case study on a large residential heating demand application in Amsterdam. J. Build. Perform. Simul. 2020, 13, 347–361. [Google Scholar] [CrossRef]
  143. Viana-Fons, J.D.; Gonzalvez-Macia, J.; Paya, J. Development and validation in a 2D-GIS environment of a 3D shadow cast vector-based model on arbitrarily orientated and tilted surfaces. Energy Build. 2020, 224, 110258. [Google Scholar] [CrossRef]
  144. Varol, B.; Yilmaz, E.O.; Maktav, D.; Bayburt, S.; Gurdal, S. Detection of illegal constructions in urban cities: Comparing LIDAR data and stereo KOMPSAT-3 images with development plans. Eur. J. Remote Sens. 2019, 52, 335–344. [Google Scholar] [CrossRef] [Green Version]
  145. Torabi Moghadam, S.; Coccolo, S.; Mutani, G.; Lombardi, P.; Scartezzini, J.L.; Mauree, D. A new clustering and visualization method to evaluate urban heat energy planning scenarios. Cities 2019, 88, 19–36. [Google Scholar] [CrossRef]
  146. Taubenbock, H.; Kraff, N.J.; Wurm, M. The morphology of the Arrival City—A global categorization based on literature surveys and remotely sensed data. Appl. Geogr. 2018, 92, 150–167. [Google Scholar] [CrossRef]
  147. Schrotter, G.; Hurzeler, C. The Digital Twin of the City of Zurich for Urban Planning. Pfg-J. Photogramm. Remote Sens. Geoinf. Sci. 2020, 88, 99–112. [Google Scholar] [CrossRef] [Green Version]
  148. Tutzauer, P.; Becker, S.; Fritsch, D.; Niese, T.; Deussen, O. A Study of the Human Comprehension of Building Categories Based on Different 3D Building Representations. Photogramm. Fernerkund. Geoinf. 2016, 2016, 319–333. [Google Scholar] [CrossRef]
  149. Saretta, E.; Bonomo, P.; Frontini, F. A calculation method for the BIPV potential of Swiss facades at LOD2.5 in urban areas: A case from Ticino region. Sol. Energy 2020, 195, 150–165. [Google Scholar] [CrossRef]
  150. Saeidi, S.; Mirkarimi, S.H.; Mohammadzadeh, M.; Salmanmahiny, A.; Arrowsmith, C. Assessing the visual impacts of new urban features: Coupling visibility analysis with 3D city modelling. Geocarto Int. 2019, 34, 1315–1331. [Google Scholar] [CrossRef]
  151. Rossknecht, M.; Airaksinen, E. Concept and Evaluation of Heating Demand Prediction Based on 3D City Models and the CityGML Energy ADE-Case Study Helsinki. ISPRS Int. J. Geo-Inf. 2020, 9, 602. [Google Scholar] [CrossRef]
  152. Rodriguez, L.R.; Duminil, E.; Ramos, J.S.; Eicker, U. Assessment of the photovoltaic potential at urban level based on 3D city models: A case study and new methodological approach. Sol. Energy 2017, 146, 264–275. [Google Scholar] [CrossRef]
  153. Redweik, P.; Teves-Costa, P.; Vilas-Boas, I.; Santos, T. 3D City Models as a Visual Support Tool for the Analysis of Buildings Seismic Vulnerability: The Case of Lisbon. Int. J. Disaster Risk Sci. 2017, 8, 308–325. [Google Scholar] [CrossRef] [Green Version]
  154. Peronato, G.; Rey, E.; Andersen, M. 3D model discretization in assessing urban solar potential: The effect of grid spacing on predicted solar irradiation. Sol. Energy 2018, 176, 334–349. [Google Scholar] [CrossRef]
  155. Park, Y.; Guldmann, J.M. Creating 3D city models with building footprints and LIDAR point cloud classification: A machine learning approach. Comput. Environ. Urban Syst. 2019, 75, 76–89. [Google Scholar] [CrossRef]
  156. Nouvel, R.; Zirak, M.; Coors, V.; Eicker, U. The influence of data quality on urban heating demand modeling using 3D city models. Comput. Environ. Urban Syst. 2017, 64, 68–80. [Google Scholar] [CrossRef]
  157. Noor, N.M.; Ibrahim, I.; Abdullah, A.; Abdullah, A.A.A. Information Fusion for Cultural Heritage Three-Dimensional Modeling of Malay Cities. ISPRS Int. J. Geo-Inf. 2020, 9, 177. [Google Scholar] [CrossRef] [Green Version]
  158. Murshed, S.M.; Picard, S.; Koch, A. Modelling, Validation and Quantification of Climate and Other Sensitivities of Building Energy Model on 3D City Models. ISPRS Int. J. Geo-Inf. 2018, 7, 447. [Google Scholar] [CrossRef] [Green Version]
  159. Murshed, S.M.; Al-Hyari, A.M.; Wendel, J.; Ansart, L. Design and Implementation of a 4D Web Application for Analytical Visualization of Smart City Applications. ISPRS Int. J. Geo-Inf. 2018, 7, 276. [Google Scholar] [CrossRef] [Green Version]
  160. Munoz, D.; Besuievsky, G.; Patow, G. A procedural technique for thermal simulation and visualization in urban environments. Build. Simul. 2019, 12, 1013–1031. [Google Scholar] [CrossRef]
  161. Mao, B.; Harrie, L. Methodology for the Efficient Progressive Distribution and Visualization of 3D Building Objects. ISPRS Int. J. Geo-Inf. 2016, 5, 185. [Google Scholar] [CrossRef] [Green Version]
  162. Ma, R.; Geng, C.Z.; Yu, Z.; Chen, J.Y.; Luo, X.W. Modeling city-scale building energy dynamics through inter-connected distributed adjacency blocks. Energy Build. 2019, 202, 109391. [Google Scholar] [CrossRef]
  163. Luo, Y.W.; He, J.; Ni, Y.L. Analysis of urban ventilation potential using rule-based modeling. Comput. Environ. Urban Syst. 2017, 66, 13–22. [Google Scholar] [CrossRef]
  164. Liu, J.; Gong, J.H.; Liang, J.M.; Li, Y.; Kang, L.C.; Song, L.L.; Shi, S.X. A quantitative method for storm surge vulnerability assessment—A case study of Weihai city. Int. J. Digit. Earth 2017, 10, 539–559. [Google Scholar] [CrossRef]
  165. Liang, J.M.; Shen, S.; Gong, J.H.; Liu, J.; Zhang, J.M. Embedding user-generated content into oblique airborne photogrammetry-based 3D city model. Int. J. Geogr. Inf. Sci. 2017, 31, 1180389. [Google Scholar] [CrossRef]
  166. Liang, J.M.; Gong, J.H.; Sun, J.; Liu, J. A customizable framework for computing sky view factor from large-scale 3D city models. Energy Build. 2017, 149, 38–44. [Google Scholar] [CrossRef]
  167. Liang, J.M.; Gong, J.H. A Sparse Voxel Octree-Based Framework for Computing Solar Radiation Using 3D City Models. ISPRS Int. J. Geo-Inf. 2017, 6, 106. [Google Scholar] [CrossRef] [Green Version]
  168. Kim, S.; Kim, D.; Choi, S. CityCraft: 3D virtual city creation from a single image. Vis. Comput 2020, 36, 911–924. [Google Scholar] [CrossRef]
  169. Kaynak, S.; Kaynak, B.; Ozmen, A. A software tool development study for solar energy potential analysis. Energy Build. 2018, 162, 134–143. [Google Scholar] [CrossRef]
  170. Jovanovic, D.; Milovanov, S.; Ruskovski, I.; Govedarica, M.; Sladic, D.; Radulovic, A.; Pajic, V. Building Virtual 3D City Model for Smart Cities Applications: A Case Study on Campus Area of the University of Novi Sad. ISPRS Int. J. Geo-Inf. 2020, 9, 476. [Google Scholar] [CrossRef]
  171. Hu, Y.F.; Dai, Z.X.; Guldmann, J.M. Modeling the impact of 2D/3D urban indicators on the urban heat island over different seasons: A boosted regression tree approach. J. Environ. Manag. 2020, 266, 110424. [Google Scholar] [CrossRef]
  172. Hsu, L.T. Analysis and modeling GPS NLOS effect in highly urbanized area. GPS Solut. 2017, 22, 1–12. [Google Scholar] [CrossRef] [Green Version]
  173. Hecht, R.; Herold, H.; Behnisch, M.; Jehling, M. Mapping Long-Term Dynamics of Population and Dwellings Based on a Multi-Temporal Analysis of Urban Morphologies. ISPRS Int. J. Geo-Inf. 2019, 8, 2. [Google Scholar] [CrossRef] [Green Version]
  174. Ham, Y.; Kim, J. Participatory Sensing and Digital Twin City: Updating Virtual City Models for Enhanced Risk-Informed Decision-Making. J. Manag. Eng. 2020, 36, 04020005. [Google Scholar] [CrossRef]
  175. Eriksson, H.; Johansson, T.; Olsson, P.O.; Andersson, M.; Engvall, J.; Hast, I.; Harrie, L. Requirements, Development, and Evaluation of A National Building Standard-A Swedish Case Study. ISPRS Int. J. Geo-Inf. 2020, 9, 78. [Google Scholar] [CrossRef]
  176. Eicker, U.; Zirak, M.; Bartke, N.; Rodriguez, L.R.; Coors, V. New 3D model based urban energy simulation for climate protection concepts. Energy Build. 2018, 163, 79–91. [Google Scholar] [CrossRef]
  177. Dembski, F.; Wossner, U.; Letzgus, M.; Ruddat, M.; Yamu, C. Urban Digital Twins for Smart Cities and Citizens: The Case Study of Herrenberg, Germany. Sustainability 2020, 12, 2307. [Google Scholar] [CrossRef] [Green Version]
  178. Dutta, A.; Saran, S.; Kumar, A.S. Development of CityGML Application Domain Extension for Indoor Routing and Positioning. J. Ind. Soc. Remote Sens. 2017, 45, 993–1004. [Google Scholar] [CrossRef]
  179. Cerreta, M.; Mele, R.; Poli, G. Urban Ecosystem Services (UES) Assessment within a 3D Virtual Environment: A Methodological Approach for the Larger Urban Zones (LUZ) of Naples, Italy. Appl. Sci. 2020, 10, 6205. [Google Scholar] [CrossRef]
  180. Buyukdemircioglu, M.; Kocaman, S.; Isikdag, U. Semi-Automatic 3D City Model Generation from Large-Format Aerial Images. ISPRS Int. J. Geo-Inf. 2018, 7, 339. [Google Scholar] [CrossRef] [Green Version]
  181. Bshouty, E.; Shafir, A.; Dalyot, S. Towards the generation of 3D OpenStreetMap building models from single contributed photographs. Comput. Environ. Urban Syst. 2020, 79, 101421. [Google Scholar] [CrossRef]
  182. Bodis-Szomoru, A.; Riemenschneider, H.; Van Gool, L. Efficient edge-aware surface mesh reconstruction for urban scenes. Comput Vis. Image Underst. 2017, 157, 3–24. [Google Scholar] [CrossRef]
  183. Biljecki, F.; Ohori, K.A.; Ledoux, H.; Peters, R.; Stoter, J. Population Estimation Using a 3D City Model: A Multi-Scale Country-Wide Study in the Netherlands. PLoS ONE 2016, 11, e0156808. [Google Scholar] [CrossRef] [Green Version]
  184. Biljecki, F.; Ledoux, H.; Stoter, J. Generating 3D city models without elevation data. Comput. Environ. Urban Syst. 2017, 64, 1–18. [Google Scholar] [CrossRef] [Green Version]
  185. Ayadi, M.; Scuturici, M.; Ben Amar, C.; Miguet, S. A skyline-based approach for mobile augmented reality. Vis. Comput 2020, 37, 789–804. [Google Scholar] [CrossRef]
  186. Adjrad, M.; Groves, P.D. Enhancing Least Squares GNSS Positioning with 3D Mapping without Accurate Prior Knowledge. Navig.-J. Inst. Navig. 2017, 64, 75–91. [Google Scholar] [CrossRef]
  187. Agius, T.; Sabri, S.; Kalantari, M. Three-Dimensional Rule-Based City Modelling to Support Urban Redevelopment Process. ISPRS Int. J. Geo-Inf. 2018, 7, 413. [Google Scholar] [CrossRef] [Green Version]
  188. Adjrad, M.; Groves, P.D.; Quick, J.C.; Ellul, C. Performance assessment of 3D-mapping-aided GNSS part 2: Environment and mapping. Navig.-J. Inst. Navig. 2019, 66, 363–383. [Google Scholar] [CrossRef] [Green Version]
  189. Adjrad, M.; Groves, P.D. Intelligent Urban Positioning: Integration of Shadow Matching with 3D-Mapping-Aided GNSS Ranging. J. Navig. 2018, 71, 1–20. [Google Scholar] [CrossRef] [Green Version]
  190. Peronato, G.; Rastogi, P.; Rey, E.; Andersen, M. A toolkit for multi-scale mapping of the solar energy-generation potential of buildings in urban environments under uncertainty. Sol. Energy 2018, 173, 861–874. [Google Scholar] [CrossRef] [Green Version]
  191. Julin, A.; Jaalama, K.; Virtanen, J.P.; Pouke, M.; Ylipulli, J.; Vaaja, M.; Hyyppa, J.; Hyyppa, H. Characterizing 3D City Modeling Projects: Towards a Harmonized Interoperable System. ISPRS Int. J. Geo-Inf. 2018, 7, 55. [Google Scholar] [CrossRef] [Green Version]
  192. Lehner, H.; Dorffner, L. Digital geoTwin Vienna: Towards a Digital Twin City as Geodata Hub. Pfg-J. Photogramm. Remote Sens. Geoinf. Sci. 2020, 88, 63–75. [Google Scholar] [CrossRef]
  193. Liu, W.Q.; Wang, C.; Bian, X.S.; Chen, S.T.; Li, W.; Lin, X.H.; Li, Y.C.; Weng, D.D.; Lai, S.H.; Li, J. AE-GAN-Net: Learning Invariant Feature Descriptor to Match Ground Camera Images and a Large-Scale 3D Image-Based Point Cloud for Outdoor Augmented Reality. Remote Sens. 2019, 11, 2243. [Google Scholar] [CrossRef] [Green Version]
  194. Farella, E.M.; Torresani, A.; Remondino, F. Refining the Joint 3D Processing of Terrestrial and UAV Images Using Quality Measures. Remote Sens. 2020, 12, 2873. [Google Scholar] [CrossRef]
  195. Zhang, H.C.; Cheng, C.Q.; Miao, S.X. A Precise Urban Component Management Method Based on the GeoSOT Grid Code and BIM. ISPRS Int. J. Geo-Inf. 2019, 8, 159. [Google Scholar] [CrossRef]
  196. Yeo, I.A.; Yee, J.J. Development of an automated modeler of environment and energy geographic information (E-GIS) for ecofriendly city planning. Autom. Constr. 2016, 71, 398–413. [Google Scholar] [CrossRef]
  197. Torabi Moghadam, S.; Toniolo, J.; Mutani, G.; Lombardi, P. A GIS-statistical approach for assessing built environment energy use at urban scale. Sustain. Cities Soc. 2018, 37, 70–84. [Google Scholar] [CrossRef]
  198. Saretta, E.; Caputo, P.; Frontini, F. An integrated 3D GIS-based method for estimating the urban potential of BIPV retrofit of facades. Sustain. Cities Soc. 2020, 62, 102410. [Google Scholar] [CrossRef]
  199. Trubka, R.; Glackin, S. Modelling housing typologies for urban redevelopment scenario planning. Comput. Environ. Urban Syst. 2016, 57, 199–211. [Google Scholar] [CrossRef]
  200. Taleai, M.; Amiri, E.T. Spatial multi-criteria and multi- scale evaluation of walkability potential at street segment level: A case study of tehranMohammad. Sustain. Cities Soc. 2017, 31, 37–50. [Google Scholar] [CrossRef]
  201. Saran, S.; Oberai, K.; Wate, P.; Konde, A.; Dutta, A.; Kumar, K.; Kumar, A.S. Utilities of Virtual 3D City Models Based on CityGML: Various Use Cases. J. Ind. Soc. Remote Sens. 2018, 46, 957–972. [Google Scholar] [CrossRef]
  202. Richards-Rissetto, H. An iterative 3D GIS analysis of the role of visibility in ancient Maya landscapes: A case study from Copan, Honduras. Dig. Scholarsh. Humanit. 2017, 32, 195–212. [Google Scholar] [CrossRef] [Green Version]
  203. Rafiee, A.; Dias, E.; Koomen, E. Analysing the impact of spatial context on the heat consumption of individual households. Renew. Sustain. Energy Rev. 2019, 112, 461–470. [Google Scholar] [CrossRef]
  204. Machete, R.; Falcao, A.P.; Gomes, M.G.; Rodrigues, A.M. The use of 3D GIS to analyse the influence of urban context on buildings’ solar energy potential. Energy Build. 2018, 177, 290–302. [Google Scholar] [CrossRef]
  205. Landeschi, G.; Lindgren, S.; Gerding, H.; Papadimitriou, A.; Wallensten, J. Ancient Hermione revealed: The contribution of high-performance computing and digital methods to the analysis of a hidden cityscape. Archaeol. Prospect. 2020, 27, 315–328. [Google Scholar] [CrossRef]
  206. Koziatek, O.; Dragicevic, S. iCity 3D: A geosimualtion method and tool for three-dimensional modeling of vertical urban development. Landsc. Urban Plan. 2017, 167, 356–367. [Google Scholar] [CrossRef]
  207. Kelly, T.; Femiani, J.; Wonka, P.; Mitra, N.J. BigSUR: Large-scale Structured Urban Reconstruction. ACM Trans. Graph. 2017, 36, 1–16. [Google Scholar] [CrossRef] [Green Version]
  208. Guo, J.; Sun, B.X.; Qin, Z.; Wong, S.W.; Wong, M.S.; Yeung, C.W.; Shen, Q.P. A study of plot ratio/building height restrictions in high density cities using 3D spatial analysis technology: A case in Hong Kong. Habitat Int. 2017, 65, 13–31. [Google Scholar] [CrossRef] [Green Version]
  209. Guo, J.; Sun, B.X.; Qin, Z.; Wong, M.S.; Wong, S.W.; Yeung, C.W.; Wang, H.; Abba, S.; Shen, G.Q. Analysing the effects for different scenarios on surrounding environment in a high-density city. Cities 2020, 99, 102585. [Google Scholar] [CrossRef]
  210. Erener, A.; Sarp, G.; Karaca, M.I. An approach to urban building height and floor estimation by using LiDAR data. Arab. J. Geosci. 2020, 13, 1–9. [Google Scholar] [CrossRef]
  211. Eicker, U.; Weiler, V.; Schumacher, J.; Braun, R. On the design of an urban data and modeling platform and its application to urban district analyses. Energy Build. 2020, 217, 109954. [Google Scholar] [CrossRef]
  212. Dell’Unto, N.; Landeschi, G.; Touati, A.M.L.; Dellepiane, M.; Callieri, M.; Ferdani, D. Experiencing Ancient Buildings from a 3D GIS Perspective: A Case Drawn from the Swedish Pompeii Project. J. Archaeol. Method Theory 2016, 23, 73–94. [Google Scholar] [CrossRef]
  213. Xiong, Q.; Zhu, Q.; Du, Z.Q.; Zhu, X.Y.; Zhang, Y.T.; Niu, L.; Li, Y.; Zhou, Y. A Dynamic Indoor Field Model for Emergency Evacuation Simulation. ISPRS Int. J. Geo-Inf. 2017, 6, 104. [Google Scholar] [CrossRef]
  214. Gevaert, C.M.; Persello, C.; Sliuzas, R.; Vosselman, G. Informal settlement classification using point-cloud and image-based features from UAV data. ISPRS J. Photogramm. Remote Sens. 2017, 125, 225–236. [Google Scholar] [CrossRef]
  215. Biljecki, F.; Ledoux, H.; Stoter, J.; Vosselman, G. The variants of an LOD of a 3D building model and their influence on spatial analyses. ISPRS J. Photogramm. Remote Sens. 2016, 116, 42–54. [Google Scholar] [CrossRef]
  216. Fernandez-Palacios, B.J.; Morabito, D.; Remondino, F. Access to complex reality-based 3D models using virtual reality solutions. J. Cult. Herit. 2017, 23, 40–48. [Google Scholar] [CrossRef]
  217. Atazadeh, B.; Kalantari, M.; Rajabifard, A.; Ho, S.; Ngo, T. Building Information Modelling for High-rise Land Administration. Trans. GIS 2017, 21, 91–113. [Google Scholar] [CrossRef]
  218. Chen, K.; Lu, W.S.; Xue, F.; Tang, P.B.; Li, L.H. Automatic building building information model reconstruction in high-density urban areas: Augmenting multi-source data with architectural knowledge. Autom. Constr. 2018, 93, 22–34. [Google Scholar] [CrossRef]
  219. Fadli, F.; AlSaeed, M. Digitizing Vanishing Architectural Heritage; The Design and Development of Qatar Historic Buildings Information Modeling Q-HBIM Platform. Sustainability 2019, 11, 2501. [Google Scholar] [CrossRef] [Green Version]
  220. Hamieh, A.; Ben Makhlouf, A.; Louhichi, B.; Deneux, D. A BIM-based method to plan indoor paths. Autom. Constr. 2020, 113, 103120. [Google Scholar] [CrossRef]
  221. Olfat, H.; Atazadeh, B.; Shojaei, D.; Rajabifard, A. The Feasibility of a BIM-Driven Approach to Support Building Subdivision Workflows-Case Study of Victoria, Australia. ISPRS Int. J. Geo-Inf. 2019, 8, 499. [Google Scholar] [CrossRef] [Green Version]
  222. Shojaei, D.; Olfat, H.; Rajabifard, A.; Darvill, A.; Briffa, M. Assessment of the Australian digital cadastre protocol (ePlan) in terms of supporting 3D building subdivisions. Land Use Policy 2016, 56, 112–124. [Google Scholar] [CrossRef]
  223. Sun, J.; Mi, S.Y.; Olsson, P.O.; Paulsson, J.; Harrie, L. Utilizing BIM and GIS for Representation and Visualization of 3D Cadastre. ISPRS Int. J. Geo-Inf. 2019, 8, 503. [Google Scholar] [CrossRef] [Green Version]
  224. Boje, C.; Guerriero, A.; Kubicki, S.; Rezgui, Y. Towards a semantic Construction Digital Twin: Directions for future research. Autom. Constr. 2020, 114, 16. [Google Scholar] [CrossRef]
  225. Amirebrahimi, S.; Rajabifard, A.; Mendis, P.; Ngo, T. A BIM-GIS integration method in support of the assessment and 3D visualisation of flood damage to a building. J. Spat. Sci. 2016, 61, 317–350. [Google Scholar] [CrossRef]
  226. Amirebrahimi, S.; Rajabifard, A.; Mendis, P.; Ngo, T. A framework for a microscale flood damage assessment and visualization for a building using BIM-GIS integration. Int. J. Digit. Earth 2016, 9, 363–386. [Google Scholar] [CrossRef]
  227. Catulo, R.; Falcao, A.P.; Bento, R.; Ildefonso, S. Simplified evaluation of seismic vulnerability of Lisbon Heritage City Centre based on a 3DGIS-based methodology. J. Cult. Herit. 2018, 32, 108–116. [Google Scholar] [CrossRef]
  228. Deng, Y.C.; Cheng, J.C.P.; Anumba, C. A framework for 3D traffic noise mapping using data from BIM and GIS integration. Struct. Infrastruct. Eng. 2016, 12, 1267–1280. [Google Scholar] [CrossRef]
  229. Lu, X.Z.; Gu, D.L.; Xu, Z.; Xiong, C.; Tian, Y. CIM-Powered Multi-Hazard Simulation Framework Covering both Individual Buildings and Urban Areas. Sustainability 2020, 12, 5059. [Google Scholar] [CrossRef]
  230. Deng, Y.; Cheng, J.C.P.; Anumba, C. Mapping between BIM and 3D GIS in different levels of detail using schema mediation and instance comparison. Autom. Constr. 2016, 67, 1–21. [Google Scholar] [CrossRef]
  231. Zhang, S.; Hou, D.; Wang, C.; Pan, F.; Yan, L. Integrating and managing BIM in 3D web-based GIS for hydraulic and hydropower engineering projects. Autom. Constr. 2020, 112, 103114. [Google Scholar] [CrossRef]
  232. Anderson, K.; Hancock, S.; Casalegno, S.; Griffiths, A.; Griffiths, D.; Sargent, F.; McCallum, J.; Cox, D.T.C.; Gaston, K.J. Visualising the urban green volume: Exploring LiDAR voxels with tangible technologies and virtual models. Landsc. Urban Plan. 2018, 178, 248–260. [Google Scholar] [CrossRef]
  233. Bonczak, B.; Kontokosta, C.E. Large-scale parameterization of 3D building morphology in complex urban landscapes using aerial LiDAR and city administrative data. Comput. Environ. Urban Syst. 2019, 73, 126–142. [Google Scholar] [CrossRef]
  234. Casalegno, S.; Anderson, K.; Hancock, S.; Gaston, K.J. Improving models of urban greenspace: From vegetation surface cover to volumetric survey, using waveform laser scanning. Methods Ecol. Evol. 2017, 8, 1443–1452. [Google Scholar] [CrossRef] [Green Version]
  235. Chen, M.D.; Feng, A.; McAlinden, R.; Soibelman, L. Photogrammetric Point Cloud Segmentation and Object Information Extraction for Creating Virtual Environments and Simulations. J. Manag. Eng. 2020, 36, 04019046. [Google Scholar] [CrossRef]
  236. Golub, D.; Doytsher, Y.; Fisher-Gewirtzman, D. 3D visibility analysis indicating quantitative and qualitative aspects of the visible space. Surv. Rev. 2018, 50, 134–146. [Google Scholar] [CrossRef]
  237. Hu, X.Y.; Yan, H.; Wang, D.; Zhao, Z.Q.; Zhang, G.Q.; Lin, T.; Ye, H. A Promotional Construction Approach for an Urban Three-Dimensional Compactness Model-Law-of-Gravitation-Based. Sustainability 2020, 12, 6777. [Google Scholar] [CrossRef]
  238. Lin, Y.B.; Wang, C.; Zhai, D.W.; Li, W.; Li, J. Toward better boundary preserved supervoxel segmentation for 3D point clouds. ISPRS J. Photogramm. Remote Sens. 2018, 143, 39–47. [Google Scholar] [CrossRef]
  239. Oskouie, P.; Becerik-Gerber, B.; Soibelman, L. Automated Recognition of Building Facades for Creation of As-Is Mock-Up 3D Models. J. Comput. Civ. Eng. 2017, 31, 04017059. [Google Scholar] [CrossRef]
  240. Tekavec, J.; Lisec, A.; Rodrigues, E. Simulating Large-Scale 3D Cadastral Dataset Using Procedural Modelling. ISPRS Int. J. Geo-Inf. 2020, 9, 598. [Google Scholar] [CrossRef]
  241. Li, W. The Relationship between Street Visual Features and Property Value Using Deep Learning. Master’s Thesis, University of Twente, Enschede, The Netherlands, 2020. [Google Scholar]
  242. Holopainen, M.; Vastaranta, M.; Kankare, V.; Hyyppä, H.; Vaaja, M.; Hyyppä, J.; Liang, X.; Litkey, P.; Yu, X.; Kaartinen, H.; et al. The use of ALS, TLS and VLS measurements in mapping and monitoring urban trees. In Proceedings of the 2011 Joint Urban Remote Sensing Event, Munich, Germany, 11–13 April 2011; pp. 29–32. [Google Scholar]
  243. Chen, S.S.; Zhang, W.; Wong, N.H.; Ignatius, M. Combining CityGML files and data-driven models for microclimate simulations in a tropical city. Build. Environ. 2020, 185, 107314. [Google Scholar] [CrossRef]
  244. Brasebin, M.; Perret, J.; Mustiere, S.; Weber, C. 3D urban data to assess local urban regulation influence. Comput. Environ. Urban Syst. 2018, 68, 37–52. [Google Scholar] [CrossRef]
  245. Agugiaro, G.; Benner, J.; Cipriano, P.; Nouvel, R. The Energy Application Domain Extension for CityGML: Enhancing interoperability for urban energy simulations. Open Geospat. Data Softw. Stand. 2018, 3, 2. [Google Scholar] [CrossRef]
  246. Gu, J.P.; Wang, X.Z.; Liu, G.W. Rediscovering the amenity value of urban landscapes in the mountainous areas with high-rise buildings from the perspective of 3D vertical urban systems. Urban For. Urban Green. 2021, 60, 127018. [Google Scholar] [CrossRef]
  247. Sia, M.K.; Yew, V.W.C.; Siew, C.L. Influence of Feng Shui factors on house buying intention of Malaysian Chinese. Arch. Eng. Des. Manag. 2018, 14, 427–439. [Google Scholar]
  248. Zhang, L.; Zhou, J.; Hui, E.C.m. Which types of shopping malls affect housing prices? From the perspective of spatial accessibility. Habitat Int. 2020, 96, 102118. [Google Scholar] [CrossRef]
  249. Zhu, J.; Wu, P. BIM/GIS data integration from the perspective of information flow. Autom. Constr. 2022, 136, 104166. [Google Scholar] [CrossRef]
  250. Bakhshoodeh, R.; Ocampo, C.; Oldham, C. Thermal performance of green façades: Review and analysis of published data. Renew. Sustain. Energy Rev. 2022, 155, 111744. [Google Scholar] [CrossRef]
  251. Coleman, C.; Crosby, N.; McAllister, P.; Wyatt, P. Development appraisal in practice: Some evidence from the planning system. J. Prop. Res. 2013, 30, 144–165. [Google Scholar] [CrossRef]
  252. Wyatt, P.J. The development of a GIS-based property information system for real estate valuation. Int. J. Geogr. Inf. Sci. 1997, 11, 435–450. [Google Scholar] [CrossRef]
  253. Li, X.; Chen, W.Y.; Cho, F.H.T. 3-D spatial hedonic modelling: Environmental impacts of polluted urban river in a high-rise apartment market. Landsc. Urban Plan. 2020, 203, 103883. [Google Scholar] [CrossRef]
  254. Cheng, X.L.; Cheng, X.J.; Li, Q.; Ma, L.W. Automatic Registration of Terrestrial and Airborne Point Clouds Using Building Outline Features. IEEE J. Sel. Top. Appl. Earth Obs. Remote Sens. 2018, 11, 628–638. [Google Scholar] [CrossRef]
  255. Ishizuka, T.; Fujiwara, K. Traffic noise reduction at balconies on a high-rise building facade. J. Acoust. Soc. Am. 2012, 131, 2110–2117. [Google Scholar] [CrossRef]
  256. Amoore, L. Cloud geographies: Computing, data, sovereignty. Prog. Hum. Geogr. 2018, 42, 4–24. [Google Scholar] [CrossRef] [Green Version]
  257. Agrawal, D.; El Abbadi, A.; Das, S.; Elmore, A.J. Database Scalability, Elasticity, and Autonomy in the Cloud; Springer: Berlin/Heidelberg, Germany, 2011; pp. 2–15. [Google Scholar]
  258. Gifford, R. The consequences of living in high-rise buildings. Arch. Sci. Rev. 2007, 50, 2–17. [Google Scholar] [CrossRef]
  259. CDC. Considerations for Owners and Operators of Multifamily Housing Including Populations at Increased Risk for Complications from COVID-19. Available online: https://www.cdc.gov/coronavirus/2019-ncov/community/multifamily-housing.html (accessed on 1 December 2022).
Figure 1. 3D environmental scenario.
Ijgi 12 00002 g001
Figure 2. Different research types in 3DPV [40].
Ijgi 12 00002 g002
Figure 3. The essential features of 3DPV.
Ijgi 12 00002 g003
Figure 4. Overarching methodology.
Ijgi 12 00002 g004
Figure 5. PRISMA 1 flow diagram of literature search.
Ijgi 12 00002 g005
Figure 6. The spider diagrams of different 3D modelling methods. The score is calculated based on a 0–5 Likert scale for each attribute.
Ijgi 12 00002 g006
Figure 7. The overview of 3DPV development.
Ijgi 12 00002 g007
Table 1. The overview of the keywords.
KeywordNote
3D, “Digital Twin”, “3D model * ”, “3D GIS” 1The methods
Urban, city, cities, “built environment”The geographical coverage we focus on
Building, human, “urban morpholog *”The research objects
1 Asterisk (*) represents any character to extend search range and simplify keyword combinations in WoS. For example, 3D model * includes but is not limited to 3D model, 3D modelling, and 3D models.
Table 2. The overview of the experts.
Position, NumberCountrySpecialisation
Academic researcher, 1United KingdomProperty valuation
Academic researcher, 2FinlandReal estate economics/3D model
Academic researcher, 1The NetherlandsReal estate economics
Urban planner, 1United States of AmericaUrban planning
Business consultant, 2The NetherlandsProperty valuation
Table 3. The overview of analytical criteria.
AttributeFactorQuestion Examples
MetadataResolutionWhat is the data resolution requirement?
SourceWhat kind of data format is used? Is it open-source or proprietary?
VolumeIs the data volume large/moderate/small?
Composition complexityIs the data source single or hybrid?
InteroperabilityIs it compatible with different software?
LifecycleCan the data be reused/updated in the future?
Database managementIs the data organised in a database?
Technical characteristicsScalabilityIs it possible to apply in different scales (e.g., building- and city-scale)?
ComplexityIs the workflow (e.g., building reconstruction) complex?
Analytical capabilityWhat kind of spatial analytical tasks can it fulfil? (e.g., spatial query)?
ValidationAre visualisation and spatial analysis results validated?
ExtensionIs an extension possible? Are there rich alternatives?
Users’ requirementsSoftwareIs the software open-source or proprietary?
CostIs it cost-effective in different stages (e.g., data collection, computation, labour)?
VisualisationIs the visualisation generic or detailed?
UnderstandabilityIs it easy for users to understand the modelling technique and visualisation?
ApplicabilityIs it feasible to be applied in practice currently or in the future?
Transferability (local edit possibility)Can the method be adapted to transfer to another study area or for another research purpose? Is it possible to edit according to local conditions?
Ethical considerationsPersonal privacyDo any issues regarding personal privacy arise?
Data sensitivityDoes the concerned data have high confidentiality?
Table 4. Full list of (n = 180) publications categorized by initially used input data.
CategoryCitations
Imaged-based DTWu, Xie [63], Wolberg and Zokai [70], Nishida, Garcia-Dorado [71], Ribelles, Gutierrez [72], Bittner, Korner [73], Wang, Tian [74], Song, Huang [75], Sharma, Agrawal [76], Peeters [77], Nishida, Bousseau [78], Misra, Avtar [79], Ma, Li [80], Liu, Krylov [81], Lee and Yang [82], Jiao, Yu [83], Jhaldiyal, Gupta [84], Guo, Wang [85], Gong, Zeng [86], Costanzo, Yao [87], Campanaro, Landeschi [88], Bulatov, Burkard [89], Bittner, d’Angelo [90], Alavipanah, Schreyer [91], Ahmed, Tarig [92], Rothermel, Gong [93]
Point cloud-based DTZhao, Wu [61], Albano [62], Babahajiani, Fan [94], Ni, Lin [95], Cao, Zhang [96], Zhang, Li [97], Yi, Zhang [98], Ye and Wu [99], Widyaningrum, Peters [100], Wang, Cheng [101], Wang, Yan [102], Wang, Xu [103], Wang, Lu [104], Wang, Xu [105], Wang and Xu [106], Templin and Popielarczyk [107], Sun, Shen [108], Soilian, Riveiro [109], Shirowzhan and Sepasgozar [110], Pirasteh, Rashidi [111], Park, Lee [112], Nys, Poux [113], Hao, Wang [114], Li, Zhang [115], Li, Hu [116], Li, Chen [117], Lai, Yang [118], Jung, Jwa [119], Heo, Lee [120], Golombek and Marshall [121], Du, Zhang [122], dos Santos, Galo [123], Ding, Liu [124], Diaz-Vilarino, Boguslawski [125], Chen, Zhu [126], Chen, Liu [127], Chen, Yi [128], Bartonek and Buday [129], Balado, Diaz-Vilarino [130], Dollner [131], Austin, Delgoshaei [132], Bienert, Georgi [133], Cavegn and Haala [134], Pan, Guan [135]
3D city DTLu, Parlikad [13], Zhao, Liu [20], Doner and Sirin [29], Kara, van Oosterom [47], Sun, Olsson [69], Dollner [131], Zieba-Kulawik, Skoczylas [136], Zirak, Weiler [137], Zhi, Liao [138], Zheng, Weng [139], Xie and Feng [140], Yang and Lee [141], Wang, Tindemans [142], Viana-Fons, Gonzalvez-Macia [143], Varol, Yilmaz [144], Torabi Moghadam, Coccolo [145], Taubenbock, Kraff [146], Schrotter and Hurzeler [147], Tutzauer, Becker [148], Saretta, Bonomo [149], Saeidi, Mirkarimi [150], Rossknecht and Airaksinen [151], Rodriguez, Duminil [152], Redweik, Teves-Costa [153], Peronato, Rey [154], Park and Guldmann [155], Nouvel, Zirak [156], Noor, Ibrahim [157], Murshed, Picard [158], Murshed, Al-Hyari [159], Munoz, Besuievsky [160], Mao and Harrie [161], Ma, Geng [162], Luo, He [163], Liu, Gong [164], Liang, Shen [165], Liang, Gong [166], Liang and Gong [167], Kim, Kim [168], Kaynak, Kaynak [169], Jovanovic, Milovanov [170], Hu, Dai [171], Hsu [172], Hecht, Herold [173], Ham and Kim [174], Eriksson, Johansson [175], Eicker, Zirak [176], Dembski, Wossner [177], Dutta, Saran [178], Cerreta, Mele [179], Buyukdemircioglu, Kocaman [180], Bshouty, Shafir [181], Bodis-Szomoru, Riemenschneider [182], Biljecki, Ohori [183], Biljecki, Ledoux [184], Ayadi, Scuturici [185], Adjrad and Groves [186], Agius, Sabri [187], Adjrad, Groves [188], Adjrad and Groves [189], Peronato, Rastogi [190], Julin, Jaalama [191], Lehner and Dorffner [192], Liu, Wang [193], Farella, Torresani [194]
3D GISJulin, Jaalama [191], Zhang, Cheng [195], Yeo and Yee [196], Torabi Moghadam, Toniolo [197], Saretta, Caputo [198], Trubka and Glackin [199], Taleai and Amiri [200], Saran, Oberai [201], Richards-Rissetto [202], Rafiee, Dias [203], Machete, Falcao [204], Landeschi, Lindgren [205], Koziatek and Dragicevic [206], Kelly, Femiani [207], Guo, Sun [208], Guo, Sun [209], Erener, Sarp [210], Eicker, Weiler [211], Dell’Unto, Landeschi [212], Xiong, Zhu [213], Gevaert, Persello [214], Biljecki, Ledoux [215], Fernandez-Palacios, Morabito [216]
BIMFernandez-Rodriguez, Cortes-Perez [67], Eriksson, Johansson [175], Dembski, Wossner [177], Atazadeh, Kalantari [217], Chen, Lu [218], Fadli and AlSaeed [219], Hamieh, Ben Makhlouf [220], Olfat, Atazadeh [221], Shojaei, Olfat [222], Sun, Mi [223], Boje, Guerriero [224]
BIM-GISSun, Olsson [69], Zhang, Cheng [195], Amirebrahimi, Rajabifard [225], Amirebrahimi, Rajabifard [226], Catulo, Falcao [227], Deng, Cheng [228], Lu, Gu [229] Deng, Cheng [230], Zhang, Hou [231]
VoxelZhao, Wu [61], Liang and Gong [167], Saran, Oberai [201], Anderson, Hancock [232], Bonczak and Kontokosta [233], Casalegno, Anderson [234], Chen, Feng [235], Golub, Doytsher [236], Hu, Yan [237], Lin, Wang [238]
Procedural modellingMunoz, Besuievsky [160], Luo, He [163], Liang, Gong [166], Kim, Kim [168], Agius, Sabri [187], Richards-Rissetto [202], Machete, Falcao [204], Landeschi, Lindgren [205], Koziatek and Dragicevic [206], Catulo, Falcao [227], Oskouie, Becerik-Gerber [239], Tekavec, Lisec [240]
Table 5. The highlights of short-term and long-term prospects.
AttributeShort-TermLong-Term
Overall aimFundamental 3D spatial analyses and extension spaces for future development.A formal workflow with advanced 3D spatial analyses.
MetadataHybrid data sources with existing and open datasets.
Moderate resolution and volume.
Affordable details.
Separate and local storage.
A limited number of 3D factors at city scale.
Self-collected datasets.
Improved resolution and volume.
Enhanced accuracy.
DBMS/ cloud server.
The increasing number of 3D factors at fine scale.
Technical characteristicsUser-friendly workflow.
Laptop workstations.
Manual or semi-automation.
More labour-intensive yet less computational-intensive.
3D spatial analysis at large scale with limited purposes.
Spatial regression models.
Tailor-made workflow.
Cloud computing.
Semi-automation.
Less labour-intensive yet more computational-intensive.
Advanced 3D spatial analysis at fine scale.
AI possibility.
Users’ requirementsA limited number of stakeholders (possibly researchers only).
Simple 3D visualisation in blocks.
Scalability and extensions are not expected.
Suitable for a single study (no transferability).
Different stakeholders with distinguished access authorities.
3D visualisation with improved resolution and semantic information.
Scalable in different scenarios and with extended functionality.
Transferability to other study areas, suitable for different cities.
Ethical considerationsMinimal concerns (e.g., copyright of images).Personal-identifying information collection.
Disclaimer/Publisher’s Note: The statements, opinions and data contained in all publications are solely those of the individual author(s) and contributor(s) and not of MDPI and/or the editor(s). MDPI and/or the editor(s) disclaim responsibility for any injury to people or property resulting from any ideas, methods, instructions or products referred to in the content.

