Article

Sensing Tourist Distributions and Their Sentiment Variations Using Social Media: Evidence from 5A Scenic Areas in China

1
School of Geography and Environment, Jiangxi Normal University, Nanchang 330022, China
2
Key Laboratory of Poyang Lake Wetland and Watershed Research, Ministry of Education, Jiangxi Normal University, Nanchang 330022, China
*
Author to whom correspondence should be addressed.
ISPRS Int. J. Geo-Inf. 2022, 11(9), 492; https://doi.org/10.3390/ijgi11090492
Submission received: 24 July 2022 / Revised: 1 September 2022 / Accepted: 14 September 2022 / Published: 17 September 2022

Abstract

:
The distribution and sentiment characteristics of tourists directly reflect the state of tourism development, and are an important reference for tourists to choose scenic areas. Sensing the tourist distributions and their sentiment variations can provide decision support for the development planning of scenic areas. In this study, we crawled tourist social media data to explore tourist distribution characteristics and the patterns of tourist sentiment variations. First, we used web crawlers to obtain social media data (tourist comment data) and the location data of China’s 5A scenic areas from the Ctrip tourism platform. Second, SnowNLP (Simplified Chinese Text Processing) was optimized and used to classify the sentiment of tourists’ comments and calculate the sentiment value. Finally, we mined the distribution characteristics of tourists in 5A scenic areas and the spatio-temporal variations in tourists’ sentiments. The results show that: (1) There is a negative correlation between the number of tourists to China’s 5A scenic areas and tourist sentiment: the number of tourists is highest in October and lowest in March, while tourist sentiment is highest in March and lowest in October. (2) The spatio-temporal distribution of tourists has obvious aggregation: temporally mainly in July, August and October, spatially mainly in the Yangtze River Delta city cluster, Beijing-Tianjin-Hebei city cluster, and Guanzhong Plain city cluster. (3) Tourist sentiment cold/hot spots vary significantly by city clusters: the Yangtze River Delta city cluster is always a sentiment hot spot; the northern city cluster has more sentiment cold spots; the central city cluster varies significantly during the year; the southwestern city cluster has more sentiment hot spots.

1. Introduction

As a strategic and pillar industry in China’s economic system, it has become an important mission for the tourism sector to vigorously promote the high-quality development of tourism [1,2]. Hence, the focus of current research is on how to improve the quality of tourism development. The sentiment evaluation of tourists, as well as the number of tourists, is an important measure of the development quality of scenic areas, and mastering their distribution characteristics and variations can provide decision support for the development of scenic areas and enhance their service quality and management level [3]. Accordingly, how to capture tourists’ sentiment and tourist distribution has become a difficult point of research at present.
The traditional methods to obtain comments on tourism mainly include questionnaires and interviews. The information collected by traditional methods is relatively accurate, but the richness and quantity of information are limited [4]. Specifically, due to the question of personal privacy, the answers of investigators are often reserved, which implies some limitations for the credibility of the collected information [5].
With the development of social media, more and more people are posting their comments on travel platforms, which provides an opportunity to perceive the sentiments and behavior of tourists [6,7,8]. Tourists generally cannot judge the scenery and service level of scenic areas in advance before they visit them, while the comments made by other tourists online are a more independent and trustworthy source of information than traditional questionnaires and other information [9,10]. Furthermore, tourists can select scenic areas and make itinerary arrangements through online comments [11,12]. Tourism platforms contain huge amounts of spatio-temporal data and unstructured text data. This provides a data basis for collecting temporal and spatial information about tourists, quantitatively analyzing their sentiments and thus summarizing overall patterns. Hence, sensing tourists’ sentiments and distributions from this huge quantity of data has become a hot topic of research.
Currently, there is an increasing number of studies that mine tourist comments for sentiment analysis, which in turn provides decision support for tourism development [13,14]. Cong and He studied the sentimental features of tourists to wildlife-tourism and scenic areas to inform the management and marketing of scenic areas [15]. Dang et al. investigated the elements that influence tourists’ pro-environmental behavior to promote the sustainable development of the destination by analyzing the sentimental interaction and sentimental association between tourists and the destination [16]. Bruno et al. examined the characteristics of tourism development in Baribamako by analyzing social media comments [17]. Taecharungroj and Mathayomchan evaluated comments on tourist attractions in Koh Phrae, Thailand, to assist administrators of scenic areas in enhancing their allure [18]. Baniya et al. examined tourists’ visits to Angkor Wat in Cambodia to assist managers in developing diverse marketing and management actions [19].
The above studies focus on the sentimental analysis of tourists’ comments, but limited studies explore tourists’ sentiments and distributions at a spatio-temporal level. At the same time, most of the sentiment analysis focuses on individual scenic areas or regional scenic areas’ tourist comments, with relatively little research on tourist sentiment at the national level. More specially, focusing on a small-scale scope generally, there is a lack of research related to all-region tourism. City clusters are an important initiative to promote the coordinated development of regional tourism [20,21]. Analyzing the characteristics of the tourism industry at the level of city clusters and outlining the blueprint for tourism development from a regional perspective may be a new way to achieve integrated regional tourism management and high-quality development of tourism in the whole region [22].
Thus, under the background of all-region tourism: What will be the spatio-temporal characteristics of tourists? How will variations in tourists’ sentiments occur in terms of spatio-temporal patterns? Taking the tourists of China’s 5A scenic areas as an example, we explored the distribution characteristics of tourists and the variation patterns of tourists’ sentiment, in order to provide references and suggestions for regional tourism development to promote the high-quality development of China’s all-area tourism.
The main contributions of this study are as follows: To classify the sentiment of tourists’ comments. We optimized the SnowNLP sentiment classification method to improve the classification accuracy. Secondly, we used web crawlers to obtain more than 560,000 pieces of tourist information on China’s 5A scenic areas on the Ctrip travel platform from 2007–2021. This includes information such as tourist comments, scenic POI, and tourist comment time, which provides a rich database for this study and subsequent studies. Finally, the spatio-temporal characteristics of tourists’ sentiments in China’s 5A scenic areas are mined at a macroscopic scale, which can reflect the changing characteristics of tourists’ sentiments on a macroscopic scale.

2. Related Work

2.1. Research Related to Scenic Areas

Numerous studies in China have focused on the spatial analysis of the distribution of scenic areas at the provincial or national level using GIS methods; Qiu, Yuanhong, et al. examined the spatial and temporal dynamics of the distribution of A-class scenic areas in Guizhou Province, China, to develop a regulatory mechanism for tourism development, thereby promoting the high-quality development of the tourism industry [23]. Liu Min et al. investigated the spatial distribution of A-class scenic areas and their influencing elements in Shanxi Province, China, to promote the healthy and stable growth of tourism in Shanxi Province [24]. Zhang Hong et al. investigated the geographic structural characteristics and influencing factors of 5A scenic areas in China [25], whereas Yuan Cheng et al. investigated the spatial distribution of 5A scenic areas in China and their economic consequences [26]. These studies investigate the spatial and temporal organization of scenic areas to inform the high-quality development of scenic areas and tourism. The growth of a landscape is inextricably linked to its tourist resources and its managers’ planning strategies. Compared to studies on the distribution of tourism resources, examining the emotional features of tourists is a more efficient strategy to inform managers’ decisions when promoting the growth of scenic areas.
García-Palomares et al. investigated the distribution patterns of tourism in key European cities, noting the high concentration of tourism in each city in other countries [27]. Gaładyk et al. studied the association between campgrounds and tourism attractiveness in Western Australia [28]. It is stated that the majority of camping tourism occurs in heavily crowded urban areas, but that the Kimberley Highlands, with its exceptional natural environment, has the greatest tourism appeal. Moreover, a substantial number of studies have examined the mood of single-site comments to drive site development [18,19].

2.2. Research Related to Tourism Social Media

With the rapid development of the ‘tourism internet,’ a large quantity of tourist comments and information related to tourist scenic areas provides strong data support for tourism development research. Many potential tours will develop travel itineraries based on these comments before traveling to assist in travel decision making [29,30]. Usually, most of these data appear in the form of text and images on major social media platforms. This information usually expresses tourists’ opinions, suggestions and satisfaction with the scenic areas concerned, thus providing an effective reference for further improvement of the quality and services of the scenic areas [9]. At present, several scholars have conducted relevant studies on social media messages in scenic areas and explored their applications from different aspects. Xiao et al. used photo big data as a driver for a quantitative destination image-analysis strategy, differentiated marketing frameworks and used photo visual content to analyze the perception of a destination [31]. Liang et al. studied the development of vernacular tourism based on the perspective of consumer satisfaction [32]. Hsieh et al. used check-in record data to make travel-route recommendations [33].

2.3. Research Related to Sentiment Analysis

Attitude categorization is the process of analyzing a text to determine if the opinion is “agreeable” or “disagreeable,” or whether the sentiment is “positive” or “negative” [34]. In recent years, researchers have employed three primary analytical methods to analyze the sentiment tendency of visitors’ commentary texts: sentiment-lexicon-based methods, machine-learning-based methods, and deep-learning-based methods [35,36]. Sentiment lexicon techniques are simple to comprehend, utilize enormous amounts of data and can produce outstanding results, but they always have a lexical “border,” are not very portable and timely, and can be laborious [37]. The machine learning approach does not rely on manual building, saves labor, and permits the rapid use of databases to update vocabulary, but machine learning relies on manual sequence annotation, which does not make full use of context and decreases accuracy [38,39]. Deep learning may make full use of contextual information, retaining the previous and following sequence of utterances to achieve sentiment classification and various meanings of words, using multi-layer neural networks, extracting data features, and displaying superior learning performance; nevertheless, it requires vast amounts of data to support, and the method takes a long time to train and develop, and the deeper the depth, the longer it takes [40,41]. Currently, the majority of studies on the sentiment analysis of tourist comments in Chinese scenic areas employ SnowNLP [42].

3. Research Area, Data Sources, and Research Framework

3.1. Research Area

As a leading tourist destination, China’s tourism industry has become a foundation of the national economy [43]. With the transition of China’s economy from rapid to quality development, the growing demand for quality life, the annual increase in disposable money and the gradual improvement of the vacation system, an increasing number of residents are opting to travel to enhance their quality of life [1]. Moreover, 5A is the highest level of scenic areas in China, as well as the business card of regional tourist development, indicating the degree of regional tourism growth and being representative and typical [44,45]. Hence, we examined the tourists’ sentiments using the example of 5A scenic areas in China.
There were 306 5A scenic areas by the end of 2021 in China (Figure 1), distributed over 201 cities on the Chinese mainland. The Yangtze River Delta city cluster contains the most scenic areas (60), followed by the Middle Yangtze River city cluster (28), Beijing-Tianjin-Hebei city cluster (23), and Chengdu-Chongqing city cluster (18), among others. Supporting regional tourism from the perspective of city clusters can assist in redressing the regional tourism development imbalance, thereby promoting the high-quality growth of tourism in all regions. Therefore, we examined and analyzed the big city clusters that feature an abundance of scenic areas.

3.2. Data Sources

The list of scenic areas was compiled by the Ministry of Culture and Tourism of the People’s Republic of China, and the tourist comment data were gathered via the Ctrip tourism platform. The National Standard for the Classification and Evaluation of Quality Grades of Scenic Areas (GB/T17775-2003) categorizes the quality grades of scenic areas into five categories: 5A, 4A, 3A, 2A and 1A. Our research sample included 5A scenic areas in China from 2007 to 2021. We chose the number of 5A scenic areas listed on the official website of the Ministry of Culture and Tourism of the People’s Republic of China in 2021 as the benchmark, given that several scenic areas were rejected from the 5A classification during the development process (306 5A scenic areas). The Ctrip travel platform is the industry standard in China’s travel-booking sector, constantly ranking first in terms of commercial value in the online travel-booking market [46]. It has a huge user base, positive online ratings from tourists and online information that matches the basic situation of tourists.
We crawled the tourist comments under each 5A scenic area on the Ctrip platform through a web crawler, and the acquired tourist comments were stored according to the classification of scenic areas. Firstly, during the process of gathering ratings for scenic areas, some of the scenic areas contained numerous attractions, and the comments on the Ctrip platform were separated by attractions. Thus, we put together comments on attractions in the same scenic area. Secondly, because the number of ratings for some attractions is low, they cannot accurately reflect the actual state of the attractions. Thus, we eliminated the scenic areas with fewer than 50 comments. As the subject of this study is Chinese comments, a few foreign language comments were filtered out to confirm the correctness of the sentiment categorization, and Chinese was used exclusively for the study. Finally, we collected around 570,000 legitimate comments from 296 scenic areas with tourist comments. Each data point consists of a scenic ID, comment text, scenic coordinates and comment time (Table 1).

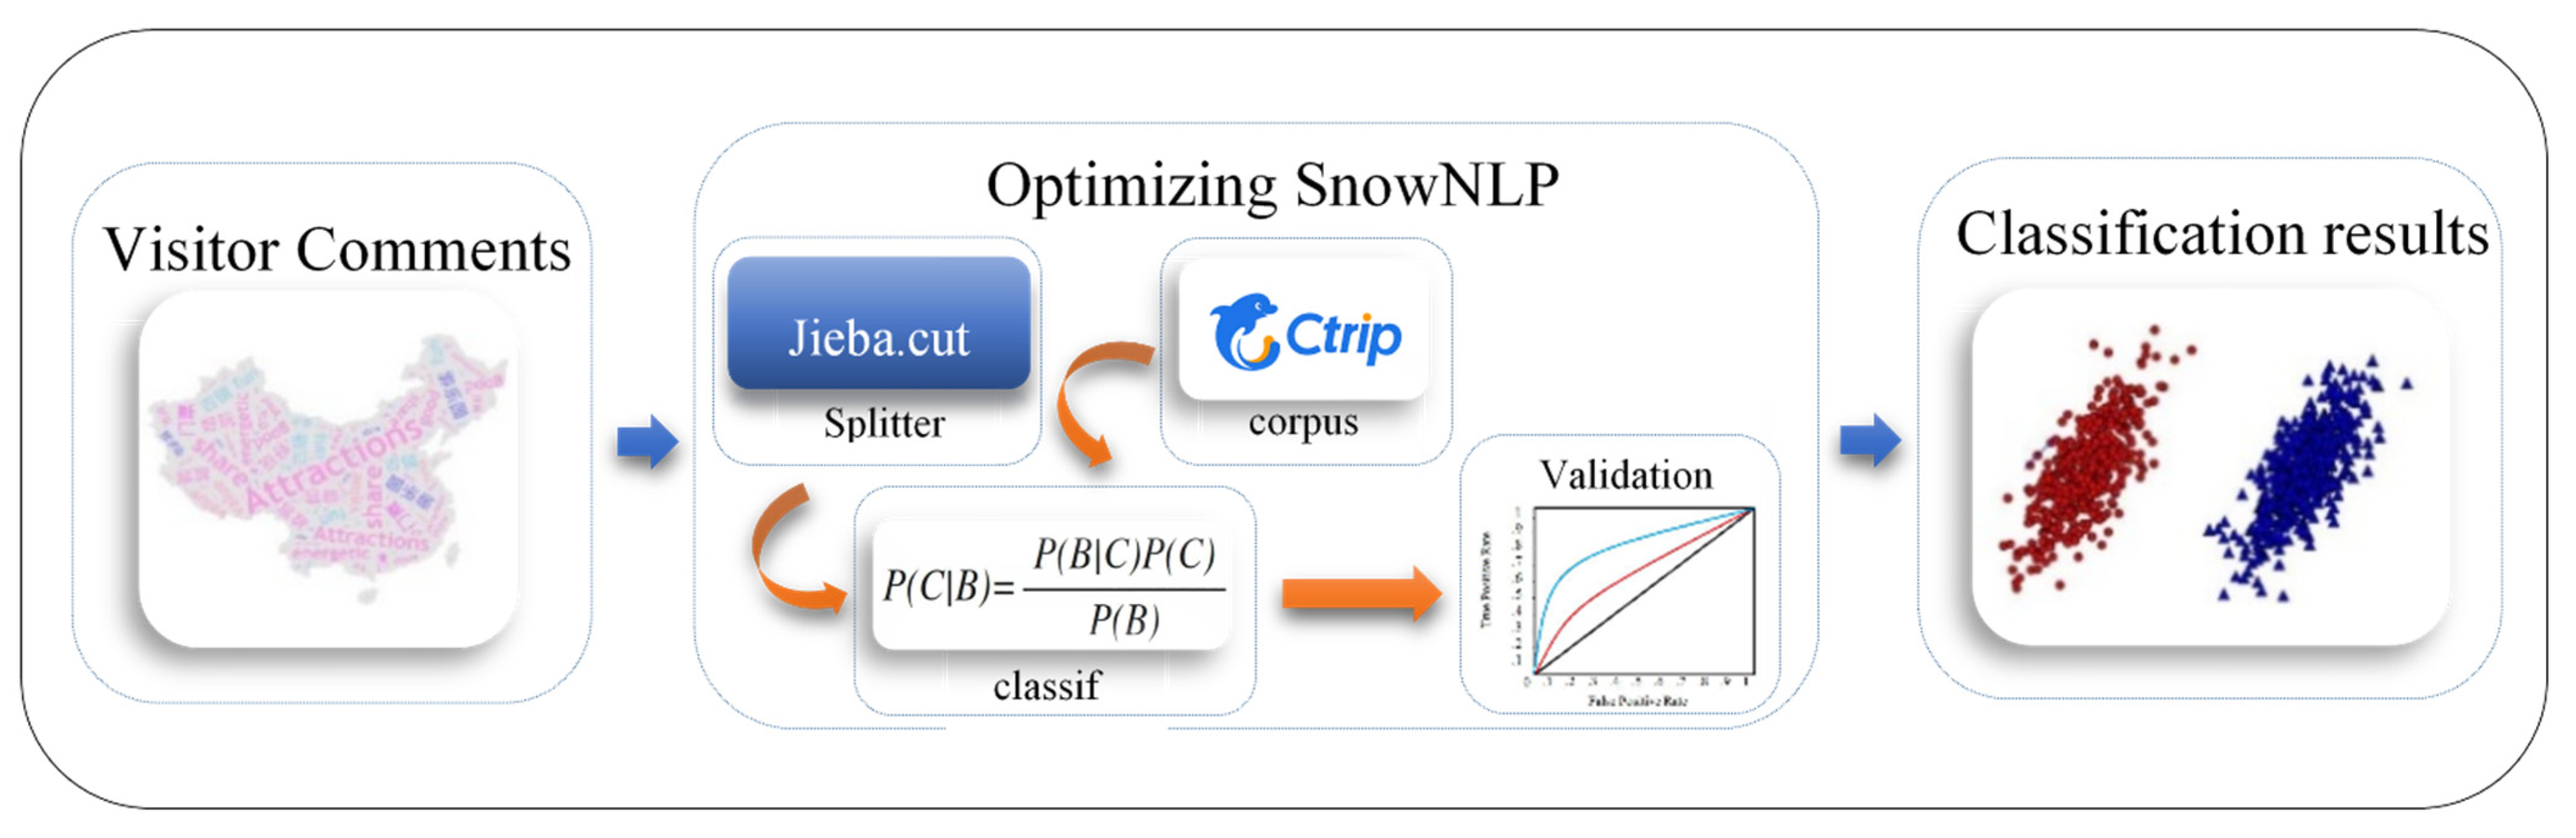
3.3. Research Framework

We collected the list of China’s 5A scenic areas from 2007 to 2021 from the Ministry of Culture and Tourism of the People’s Republic of China’s website. We then utilized a web crawler to obtain the relevant information on China’s 5A scenic areas on the Ctrip travel platform, including the spatial coordinates of each area and the information from tourists’ comments. Third, the word-splitter of SnowNLP and the corpus were adjusted to enhance the sentiment classification effect of SnowNLP, and the optimized SnowNLP was utilized to categorize the sentiment of tourist comments. Fourth, we analyzed two aspects: tourists’ spatio-temporal distribution and tourists’ sentiment variations. Finally, the results of the investigation are used to make development recommendations for scenic areas (Figure 2).

4. Methods

4.1. Sentiment Classification Based on SnowNLP

SnowNLP is a Chinese natural-language-processing tool based on a Bayesian model, which allows sentiment analysis of text based on its processing capabilities for Chinese text [42,47]. The plain Bayesian approach is based on the joint probability between words and categories, and the classification is based on known prior and conditional probabilities to calculate the posterior probabilities. The formula is as follows.
P ( C i | W 1 , W 2 , W 3 , W n ) = P ( W 1 , W 2 , W 3 , W n | C i ) × P ( C i ) P ( W 1 , W 2 , W 3 , W n ) , i = 0 , 1
where the random event C i denotes the probability that the sample is sentiment positive or negative for class C, and W n denotes the probability that a particular feature word W occurs in the test sample. In defining the sentiment as positive and negative for each utterance, the sentiment probability value is obtained by multiplying the calculated prior probability P ( C i ) by the conditional probability of each of its attribute feature words, respectively.
The corpus of the original SnowNLP sentiment classification module is not classified for tourist attraction reviews. At the same time, the poor effectiveness of the word splitter within it in the process of word splitting leads to a decrease in the accuracy of the final sentiment classification [42]. Jieba is a good Chinese word splitter at present, supporting simplified Chinese and traditional Chinese word splitting, as well as a custom lexicon. Hence, we trained the corpus of tourist comments on SnowNLP’s Bayesian model to obtain a tourist-specific corpus and combined the Jieba split with the SnowNLP sentiment analysis model to classify the sentiment of tourist comments (Figure 3).
Finally, we used the improved SnowNLP sentiment classification model to classify the sentiment of visitor-review texts, and the probability values [0, 1] output from the model were used as the sentiment score, where the closer the value is to 1, the more positive the comment sentiment is, and the closer it is to 0, the more negative the comment sentiment is [48]. The sentiment values of tourists’ comments are used as the database for subsequent quantitative analysis of tourists’ sentiment.

4.2. Spatial Analysis Methods

To investigate the spatial distribution characteristics of tourists’ trips to 5A scenic areas in China, we used kernel density as well as standard deviation ellipse analysis to conduct the study.
(1) Kernel density analysis method. Kernel density reflects the number of distribution of point elements in a certain area, the overall distribution and the area of aggregated distribution. In this study, China’s 5A scenic areas are used as point data, and the distribution characteristics of scenic areas that tourists tend to visit are analyzed by analyzing the distribution of scenic areas and the nuclear density of popular scenic areas. The theoretical formula of nuclear density is as follows:
f n ( x ) = 1 nh i = 1 n k ( x - X 1 h )
where: k (   ) is called the kernel function; h   > 0, the bandwidth; and ( x - X 1 ) denotes the distance from scenic area x to event X 1 .
(2) Standard deviation ellipse (SDE). The standard deviation ellipse (SDE) can reflect the spatial distribution characteristics of the study elements and the variations in the spatial distribution and patterns of the study elements from multiple perspectives [17]. By using the method of standard deviation ellipse, the specific parameters of the standard deviation ellipse of the distribution of 5A scenic areas and the spatial distribution of tourists in China are measured, and the spatial distribution characteristics of tourists in 5A scenic areas in China are further derived.

4.3. Cold Hot Pattern Mining

A spatio-temporal cube model expresses spatial location with two-dimensional planes and uses three-dimensional graphics to display the evolution pattern of geographic phenomena or scalars with location attributes over time, which has the advantage of intuitively expressing complex geographic phenomena, and the corresponding cross-sectional states can be obtained given a time node and have been applied in fields such as hand, foot and mouth disease and traffic congestion [49].
We combine the spatio-temporal cube model and the spatio-temporal hot spot analysis method, which can not only visually analyze the spatial trends of tourists’ hot spots and cold spots in a geographic space, but also discover the temporal changes of tourists’ sentiments, so as to detect the spatio-temporal distribution characteristics of cases and their evolutionary laws by using visual analysis methods.
To better detect the changing patterns of tourists’ sentiment in the spatio-temporal domain, we first aggregated tourist sentiment data from 5A scenic areas in China to construct a spatio-temporal cube. Second, spatio-temporal hot spot analysis was performed to uncover hot- and cold-spot patterns and geographically localized; statistically significant anomalies that emerged over time. The final step involved mining the spatio-temporal hot spot patterns of monthly variations in tourist sentiment [50,51].
(1) Space-time cube. A time-step-dependent hexagonal grid is used to generate spatial-temporal cubes. Each cube cell has a fixed position, and the sentiment value of each cube is calculated by averaging the sentiment values of all tourists within its spatio-temporal range [52]. Some grids may have a count of zero data points across all time steps, and the spatio-temporal bars of these grids will not be included in the spatio-temporal pattern analysis.
(2) Spatio-temporal hot spot detection. The principle is to measure the intensity of clustering of high or low values of local sentiment attributes with the help of the Getis-Ord G i spatio-temporal statistic [53]. It is calculated as follows:
G i * = j = 1 n w ij x j x ¯ j = 1 n w ij s n j = 1 n w ij 2 ( j = 1 n w ij ) 2 n 1
where: x ¯ = j = 1 n x j n ; S = j = 1 n x j 2 n x ¯ 2 ; x j is the attribute value of the spatio-temporal neighboring element j ; w ij is the spatio-temporal weight between element i and j ; and n is the total value of neighboring elements. When the statistical result of G i * is positive and significant, its higher value indicates a tighter clustering of high sentiment values (hot spots); when the result of G i * is negative and significant, its lower value indicates a tighter clustering of low sentiment values (cold spots).
(3) Local outlier analysis. Local outlier analysis identifies significant clusters and outliers in the data. Statistically significant clusters and outliers in the spatio-temporal environment are calculated by finding locations within the study area that are statistically different from their neighbors in time and space and are the spatio-temporal manifestation of the local Anselin local Moran’s I statistic [54]. Spatio-temporal pattern mining uses the neighborhood distance and neighborhood time-step parameters to estimate the spatio-temporal implementation of Anselin local Moran’s I statistic for each cubic bar, containing six detection results of no significance, high-high clustering, high-low clustering, low-high clustering, low-low clustering, and multiple types [55].
(4) Spatial-temporal pattern mining of hot spots. Using the spatio-temporal pattern variation trend of tourist sentiment in cold/hot spots and the Mann–Kendall statistical approach, the spatio-temporal variation trend of cold/hot spots in scenic areas is presented graphically on a map. Using spatio-temporal hot spot analysis not only identifies hot- and cold-spot clusters at various spatio-temporal scenic areas, but also captures the variation patterns of these clusters over time, including a total of eight categories of hot- or cold-spot-variation patterns, such as consecutive, intensifying, persistent, diminishing, sporadic, new, oscillating and historical [50].
We utilized the geographical coordinates of the scenic areas as the base of the spatio-temporal cube and time as the vertical coordinate to represent the variations in the sentiment of scenic area tourists over time in that area. To investigate the intra-year spatio-temporal fluctuations in tourist sentiment at 5A scenic areas in China, a spatio-temporal cube for tourist sentiment by month was created. Simultaneously, a spatio-temporal hot-spot analysis tool was utilized to study spatio-temporal hot spot patterns of tourist sentiment in various months. Since our tourist comment data are point data based on the location of scenic areas, we create spatio-temporal cubes by aggregating points. We take into account the differences in the number of scenic areas in different regions and the changes in tourist sentiment explored by month. We selected a k-nearest neighbor spatial relationship with a spatial neighborhood of 8 scenic areas as the spatial unit of spatio-temporal hot spots, and in time, we chose a 7-day tourism cycle as the time unit to probe the spatio-temporal hot- and cold-spot patterns of monthly tourist sentiment.

5. Results

5.1. SnowNLP Sentiment Classification Check

To examine the accuracy of the model’s sentiment classification, SnowNLP and SnowNLP supplemented with Jieba were exposed to sentiment classification tests. The categorization samples utilized the same corpus of 500 positive and 500 negative tourist comments that had been manually tagged. Four metrics, including accuracy, precision, recall and F1, were also utilized to evaluate the classification efficacy of the model (Table 2). Precision reflects the proportion of samples with a true positive (negative) sentiment tendency among those determined by the classifier as a positive (negative) sentiment tendency; recall reflects the proportion of correctly determined positive (negative) sentiment tendency samples to the total positive (negative) sentiment tendency samples, and accurately reflects the classifier’s ability to determine the entire sample. The accuracy rate and precision of SnowNLP paired with Jieba subscripts are both higher than those of SnowNLP in terms of the final classification findings. The optimized SnowNLP classification result reaches 89%, which can basically discriminate the sentiment polarity of tourists’ comments correctly and can classify the sentiment of the comment corpus for this study.

5.2. Tourist Distribution Characteristics and Sentiment Variations

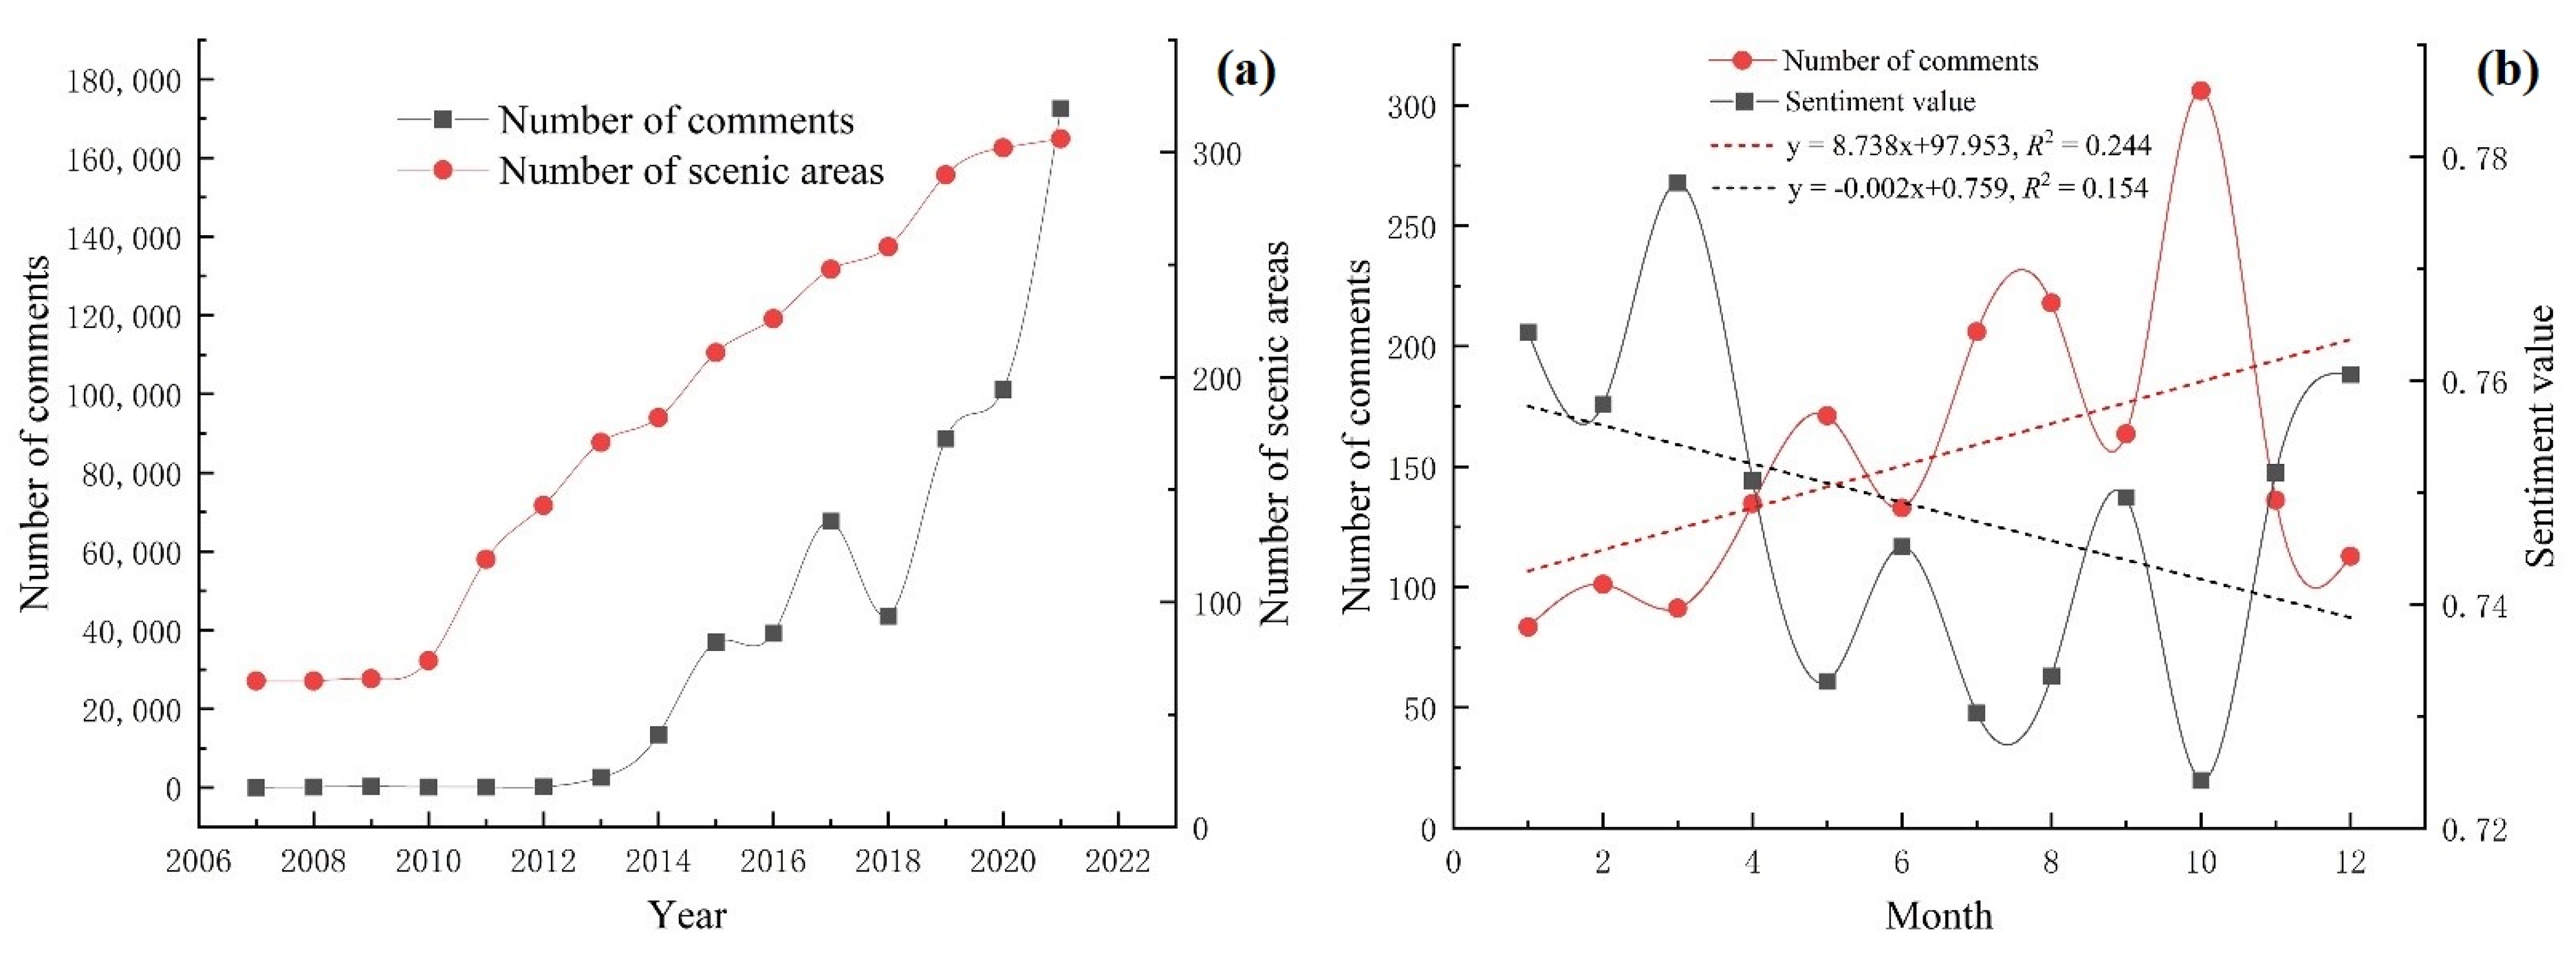
5.2.1. Timing Analysis

The number of tourist comments and the sentimental polarity can indicate the popularity and trendiness of scenic areas. Figure 4a depicts the variations in the number of 5A scenic areas in China from 2007 to 2021, as well as the associated remarks regarding 5A scenic areas on the Ctrip travel platform. The number of 5A scenic areas stayed steady between 2007 and 2010, and after 2010, the number of 5A scenic areas increased annually in China. In comparison to the number of scenic areas, the number of tourist comments was low before 2013 and has since climbed dramatically.
To examine monthly variations in the popularity and tourist sentiment of China’s 5A scenic areas, we tracked the number of comments and sentiment values of China’s 5A scenic areas each month (Figure 4b). January had the lowest number of tourists’ comments, accounting for 4.49 percent, while October had the largest number, accounting for 16.52 percent, indicating an overall tendency of progressive growth within the month. The highest tourist sentiment rating was recorded in March, at 0.81, and the lowest was recorded in October, at 0.76, indicating a declining monthly trend. The correlation coefficient between the number of comments and sentiment value for each month was −0.885, with a p-value (i.e., significance) of less than 0.01, indicating that the number of comments was negatively correlated with sentiment value, which decreased as the number of tourists increased.
July, August and October were the months with the greatest amount of comments. The p-value (i.e., significance) for comparing the number of comments in July, August and October to the other months was 0.01 < 0.05, suggesting that the number of comments in these three months was substantially higher than in the other months. In contrast, January, March and December were the months with the greatest sentiment values. The p-value (i.e., significance) for comparing the sentiment values of January, March and December to those of the other months was 0.06 > 0.05, showing that these three months’ sentiment values were not substantially different from those of the other months.
In summary, the number of tourists to the scenic areas is negatively correlated with tourist sentiment, with tourist sentiment values decreasing as the number of tourists increases; concurrently, July, August and October are the most popular months for tourists to the scenic area, whereas January, March and December have the highest tourist sentiment values.

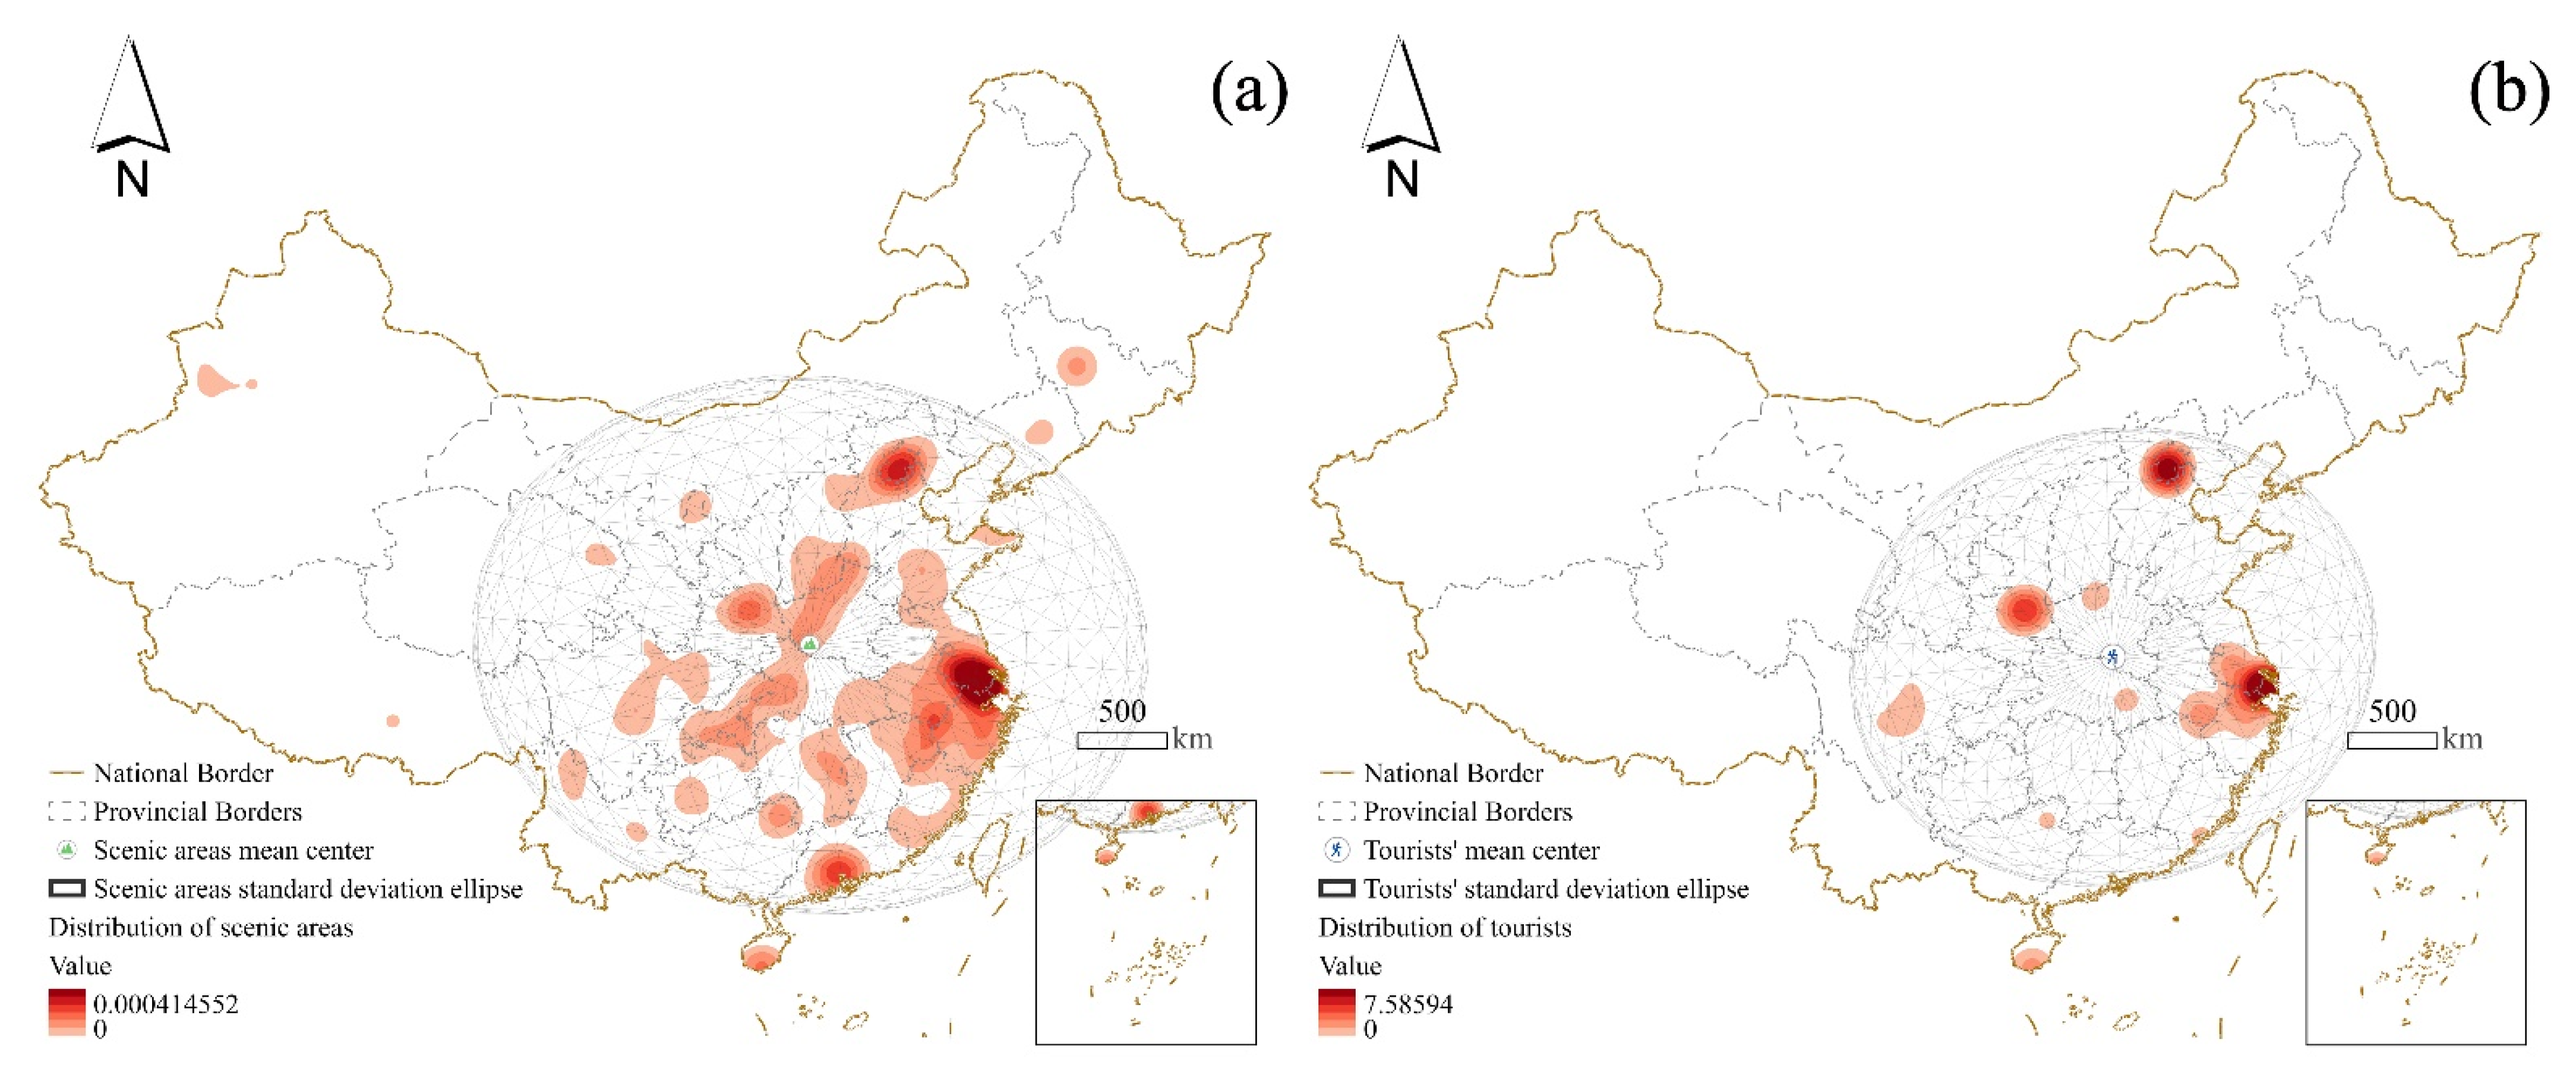
5.2.2. Spatial Analysis

We did a comparative analysis of the distribution of 5A scenic areas and the nuclear density of tourist evaluations to determine the spatial tourism hot spots (Figure 5a). The majority of China’s 5A scenic areas are located in the Yangtze River Delta, Beijing-Tianjin-Hebei, and Pearl River Delta metropolitan clusters, according to the report. The Yangtze River Delta city cluster is the high-density core area, whereas the Beijing-Tianjin-Hebei and Pearl River Delta city clusters are sub-density core areas. The tourist passion varies among the scenic areas, with those with more comments having a greater zeal. The five tourist areas with the most comments are the Palace Museum in Beijing (144,000), the Oriental Pearl Radio and TV Tower in Shanghai (132,000), the Shanghai Safari Park (92,000) and the Terracotta Warriors and Horses Museum in Xi’an (90,000). (86,000). For nuclear density analysis, we weighted the number of tourist evaluations of China’s 5A scenic areas (Figure 5b): the popular scenic areas are primarily situated in the Yangtze River Delta city cluster, the Beijing-Tianjin-Hebei city cluster and the Guanzhong Plain city cluster. The Yangtze River Delta and Beijing-Tianjin-Hebei city clusters are the high-density core areas, whereas the Guanzhong Plain city cluster is the low-density core area.
To further investigate the distinctive characteristics of tourist distribution, we performed a standard deviation ellipse analysis on scenic-area and tourist distributions (Figure 5) and determined the important parameters of the standard deviation ellipse (Table 3). It was discovered that the standard deviation ellipse of scenic distribution and the standard deviation ellipse of tourists differed significantly in shape and area: the center of the scenic distribution ellipse was located near Zhenping County in Henan Province, while the center of the tourists’ ellipse was located near Suixian County in Hubei Province, with a straight-line distance of 196.18 km between the two places. The difference between the long semi-axis value and the distinction between the scenic distribution ellipse and the tourist distribution ellipse is clear: the scenic distribution ellipse stretches in the northwest–southeast direction, whereas the tourist distribution ellipse extends in the northeast–southwest direction.
Compared to the distribution of scenic areas, the geographical distribution of tourists is tilted toward the east and grouped to a lesser extent, mostly in the Yangtze River Delta city cluster, the Beijing-Tianjin-Hebei city cluster and the Guanzhong Plain city cluster.

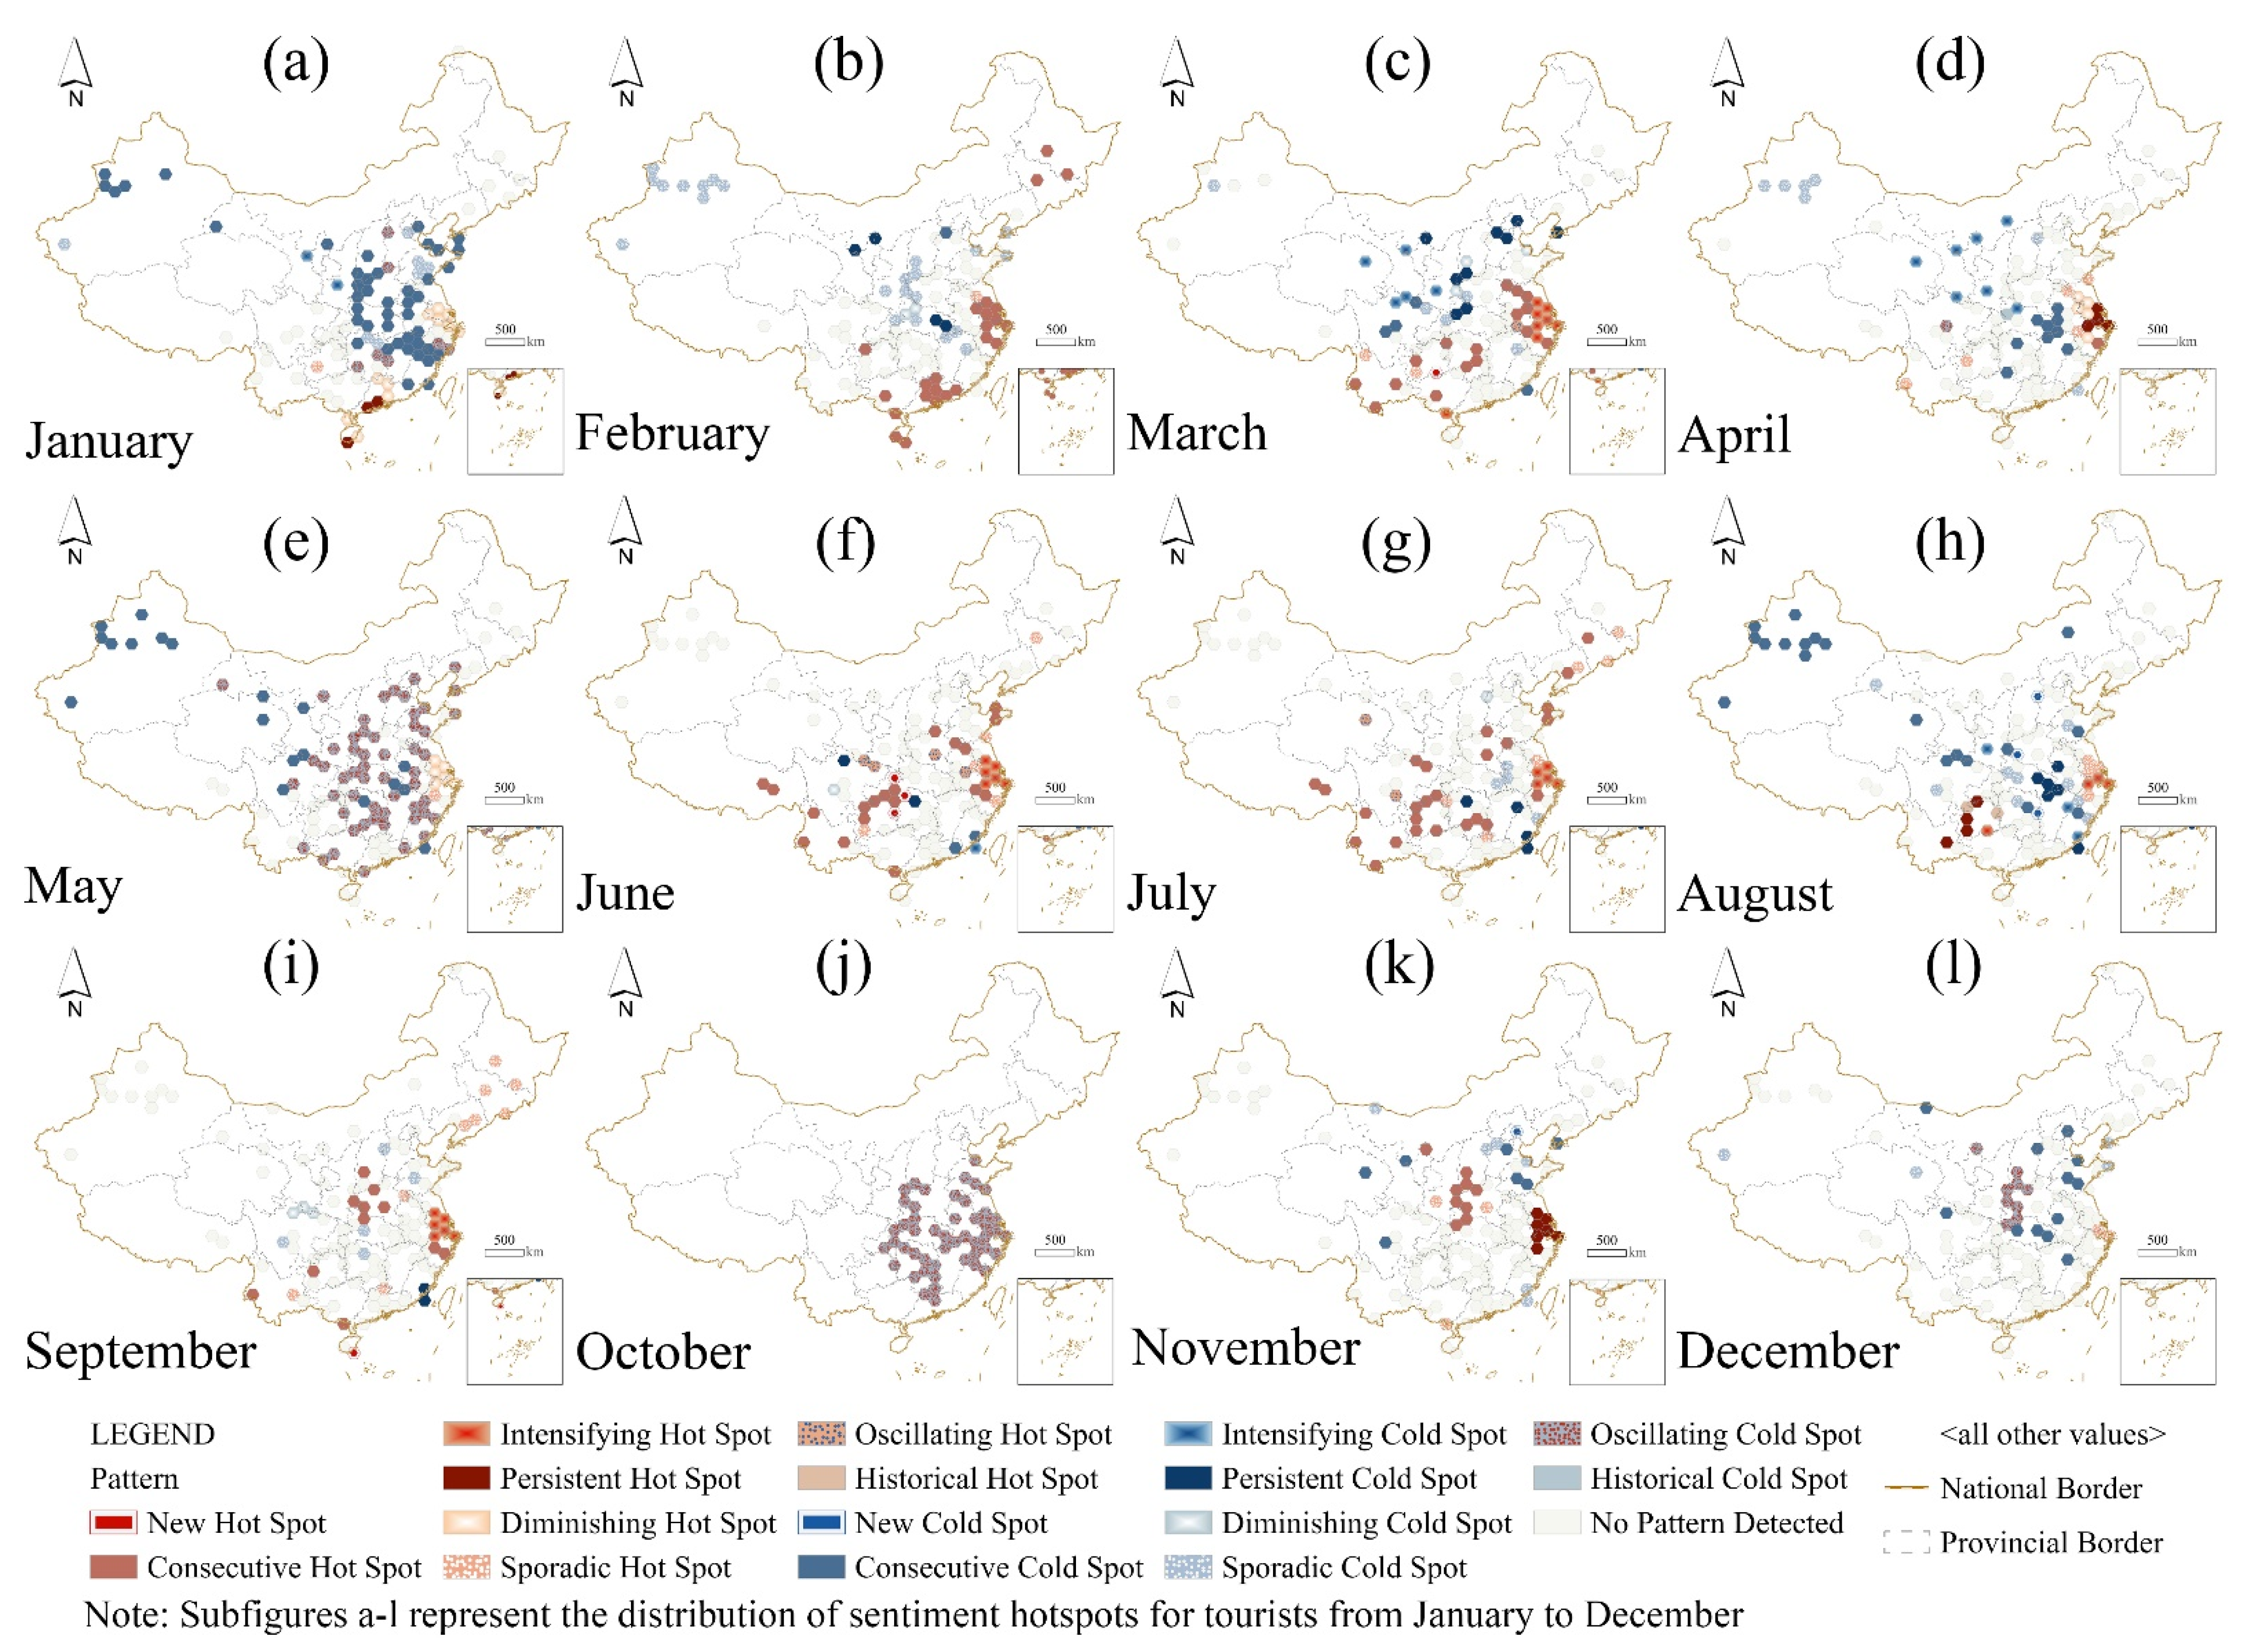
5.2.3. Sentiment Cold and Hot Variations

To investigate the distribution pattern of tourist sentiment hot spots in China’s 5A scenic areas. Firstly, we conducted a hot spot trend analysis using a spatio-temporal cube of China’s 5A scenic areas’ comment sentiment values from 2007 to 2021 (Figure 6a). As depicted in the graph, the tourist sentiment of China’s 5A scenic areas revealed an overall upward trend of hot spots, with varying upward trends for each city cluster. The Beijing-Tianjin-Hebei city cluster, Yangtze River Delta city cluster, Guanzhong Plain city cluster, Chengdu-Chongqing city cluster and Pearl River Delta city cluster have a confidence level of 99 percent; the Tianshan North Slope city cluster, Central Plains city cluster and Yangtze River Middle Reaches city cluster have a confidence level of 95 percent.
Secondly, we performed a local outlier analysis of tourist sentiment values (Figure 6b). The high-high tourist sentiment clusters were primarily centered in the Yangtze River Delta city cluster as well as in Yunnan and Guizhou. The clusters of low-low tourism feeling are most prevalent in the middle reaches of the Yangtze River, the northern slopes of the Tianshan Mountains, and the west coast of the Strait. The low-high agglomeration of tourism sentiment is primarily situated in the city cluster of the Pearl River Delta.
Finally, to investigate further the monthly variations in spatial-temporal tourist sentiment patterns, we categorized the tourist sentiment data by month. To produce a spatio-temporal cube of tourist sentiment, a time step of 1 day and a distance interval of 150 km was set for each month’s spatio-temporal cube based on the period and area of the study. In addition, emergent spatio-temporal hot spots were monitored monthly for tourist sentiment (Figure 7).
The data indicate that the monthly variance in tourist sentiment hot and cold spots varies considerably by city cluster. The Yangtze River Delta city cluster is characterized by hot-spot distributions of tourist sentiment throughout the year: intensifying hot spot, diminishing hot spot, and persistent hot spot distributions predominate, except in October, which has an oscillating cold spot distribution.
Cold-spot distribution predominates in the Beijing-Tianjin-Hebei city cluster, the Tianshan North Slope city cluster, the Liaoning-Zhongnan city cluster, and the West Coast city cluster. In January, February, March and December, the Beijing-Tianjin-Hebei city cluster is dominated by persistent cold spots and consecutive cold spots, in May by oscillating cold spots, and in November by sporadic cold spots and a new cold spot. The city cluster on the north slope of the Tianshan Mountains and the adjacent scenic areas surroundings are predominantly persistent cold spots during January, May and August, and historical cold spots during February, March and April. The persistent cold spot is most prevalent on the northern slopes of the Tianshan Mountains in January, May and August.
The distribution of cold/hot spots throughout the year varies significantly between the Guanzhong city cluster, the Middle Yangtze River city cluster, the Chengdu-Chongqing city cluster, the Central Plains city cluster, and the Shandong Peninsula city cluster. The Guanzhong city cluster is predominantly a cold spot in January, February, March, May, September and December, with the predominant patterns being consecutive cold spots and oscillating cold spots, and a hot spot in September and November, with the predominant pattern being consecutive hot spots. January, February, March, April, August and December have consecutive cold spots and persistent cold spots, while March, May and October have consecutive hot spots and oscillating cold spots. June, July and August were dominated by hot spot distribution, with consecutive hot spot and persistent hot spots being the predominant patterns. January, May, August, October and December have oscillating cold spots, whereas June and July have consecutive cold spots.
Hot-spot distribution dominates the Pearl River Delta city cluster, Beibu Gulf city cluster, Qianzhong city cluster, Dizhong city cluster and nearby scenic areas. The sentiment patterns of the Pearl River Delta city cluster in January and February are a persistent hot spot and a consecutive hot spot, respectively. In January, February, June and September, the predominant sentiment pattern in the cluster of Beibu Gulf cities is consecutive hot spot. In March, June, July, August and September, the sentiment pattern of the Qianzhong and Dianzhong city clusters and the adjacent scenic areas is primarily consecutive hot spot.
In summary, the overall trend of tourist sentimental hot spots in China’s 5A scenic areas was on the rise from 2007 to 2021, with considerable local differences among city clusters; the monthly fluctuations in tourist sentimental cold spots vary significantly among city clusters. The Yangtze River Delta city cluster has predominantly sentimental hot spots throughout the year; the northern China city cluster has predominantly sentimental cold spots during the first half of the year; the central China city cluster experiences significant intra-year variations in tourist sentimental distribution; and the southwestern China city cluster is predominantly sentimental hot spots in June, July and August.

6. Discussions and Recommendations

6.1. Discussions

This study employs spatial analysis and sentiment analysis to examine the spatio-temporal characteristics of tourists and tourists’ sentiments in China’s 5A scenic areas. The primary findings are as listed below.
(1) There is a negative correlation between tourist numbers and tourist sentiment to some extent. The Chinese National Day, known as the Golden Week of Tourism, is right in October, and it is the most visited, but with more negative tourist sentiment. This could be attributed to congested scenic areas affecting tourists’ experience. The problem of overcrowding or even overloading of scenic areas can hurt tourists’ feelings, resulting in the failure to return and loss of potential tourists, which in turn hinders the sustainable development of high-level scenic areas as well [56,57].
(2) The spatio-temporal distribution of tourists has obvious aggregation: temporally mainly in July, August and October, spatially mainly in the Yangtze River Delta city cluster, Beijing-Tianjin-Hebei city cluster and Guanzhong Plain city cluster [58]. In terms of time, July and August are the summer vacation period and October is the Golden Week of Tourism, leading to these three months being the hot spots of tourism throughout the year. Spatially, there are relatively more 5A scenic areas in these areas, and they were created earlier and have a certain degree of popularity. Li et al. examined the spatial structure of the network attention of 5A scenic areas in China [59]. The network’s attention to scenic areas might, to some extent, reflect the tourist hot spots. This study is comparable to the spatial distribution characteristics of tourist hot spots, which are primarily spread in the Yangtze River Delta, the ring of Tianjin and Beijing and the northern border of Sichuan, Xi’an, and the Taihang Mountains. This suggests that the scenic areas picked by tourists visiting China’s 5A scenic areas are more concentrated and spread predominantly in these regions.
(3) In terms of the spatio-temporal variations in tourists’ sentiment, we discovered that: (a) the Yangtze River Delta city cluster has more sentimental hot spots throughout the year, which may be related to its superior economic strength. The greater economic level allows for the provision of quality scenic services, thus boosting the experience of tourists. Gaładyk and Podhorodecka researched the association between tourist campsites and tourism appeal in Western Australia and discovered that camping tourism is predominantly situated in large, densely populated towns [28]. Moreover, variations in tourists’ attitudes may be correlated with the strength of their association with area tourism structures. C. Zhang et al. analyzed the characteristics of the spatial distribution of scenic areas in the three major city clusters of China, Beijing-Tianjin-Hebei, the Yangtze River Delta and the Pearl River Delta, and found that the Yangtze River Delta city cluster and the Pearl River Delta city cluster had superior tourism structures and associations to the Beijing-Tianjin-Hebei city cluster [60]. This is comparable to the findings of this study about the sentimental distribution of tourists: the Yangtze River Delta and Pearl River Delta city clusters have more sentimental hot spots, whereas the Beijing-Tianjin-Hebei city cluster has more sentimental cold spots. (b) Those in northern China have a cold spot distribution of tourist sentiment, whereas cities in the southwest have a hot spot distribution. This may be due to regional characteristics such as temperature and climate, with northern China having cooler temperatures and less favorable weather than the south. Ettema et al. studied the effect of weather on travel pleasure and found that warmer temperatures are associated with higher happiness feelings and that weather (temperature and precipitation) is the most influential influence on tourists’ sentiments [61]. (c) Within central China, the Guanzhong city cluster, the Middle Yangtze River city cluster, the Chengdu-Chongqing city cluster and the Shandong Peninsula city cluster exhibit significant intra-year variance in tourist attitude. This may be a result of the region’s seasonality; some city clusters have more distinct seasons, and different seasons have varied sentimental effects on tourists. Seasonal influences play a substantial role in slow-mode tourism satisfaction, as demonstrated by St-Louis et al.’s findings [62]. Padilla et al.’s study on tourists’ attitudes in Chicago revealed that the season and time of year have a substantial effect on tourist sentiment [63].
Although we have disclosed the spatio-temporal characteristics of tourists to China’s 5A scenic areas as well as the patterns of monthly variations in tourist sentiment across urban clusters, additional research is necessary. For instance, we have not yet investigated the primary components that affect tourist attitude, nor have we undertaken a comprehensive analysis of tourist comments. Exploring the elements influencing tourist mood and topic mining of tourist comments are therefore crucial research directions for advancing the development of high-quality regional tourism.
Traditional studies of tourists’ emotions using questionnaire data have mostly focused on specific questions or emotional perceptions of a particularly scenic area. Chen et al. explored rural sound-environment management using Chinese rural tourism sentiment as an example [64]. Cheng et al. used Jiuzhaigou as an example to study the competitiveness of scenic areas from tourists’ perspectives [65]. Unlike our study, most of these studies explored tourists’ emotional perceptions of specific issues, and the findings were more specific. At present, social media data have become a hot spot for current research with its advantages of rich data volume and low acquisition cost. However, social media data do not replace questionnaire data [66]. Social media data are often biased and not representative of all tourists. Since personal information, such as location and age, is kept confidential on social media, our data do not include information about the location, age, and gender of visitors, so it is not possible to distinguish the distribution ratio of tourist groups. Therefore, to address this issue, we will supplement the social media data in our subsequent study to increase the completeness of the data as much as possible.

6.2. Suggestions

The consequences of this study’s findings for regional tourism development and tourist travel are as follows: (1) Create a dynamic plan for the management and development of regional scenic areas. Due to the large spatio-temporal disparities in tourists’ sentiments, tourism development plans for off-season and peak-season scenic areas are prepared independently for scenic areas with significant seasonality to rationalize tourism resources. (2) Reasonably expand the capacity of tourist areas in scenic areas to lessen the experience of overcrowding, particularly during holidays, diverting tourists and reasonably arranging tourism resources. (3) Dig deeper into the reasons for the lower tourist sentiment in city clusters in the north and enhance investment and development of their tourism resources. For instance, enhancing scenic areas and promoting regional features to attract tourists, and enhancing transportation, services and other factors to improve tourists’ experience. (4) Tourist journeys can be arranged based on the study’s findings regarding the spatio-temporal aspects of tourist sentiment. During the summer, they may travel to southwest China, such as Yunnan and Guizhou, to escape the heat, and to the eastern coast to play during the winter.

7. Conclusions

This study examined the spatio-temporal distribution of tourists in 5A scenic areas in China from 2007–2021 and digs into the spatio-temporal cold and hot variations in tourists’ sentiments while providing certain suggestions for the whole region’s tourism development. The following main conclusions were reached: (1) The spatio-temporal distribution of tourists has obvious aggregation; reasonable adjustment of the development focus of tourism in each region and balanced distribution of tourists is an effective method for the development of high-quality tourism in the whole region. (2) The number of tourists in scenic areas has an important impact on tourists’ experience, and it is imperative to reasonably control the capacity of scenic areas. (3) The monthly variation in tourists’ sentiment varies significantly from region to region, and formulating regional tourism management measures according to different months is an important way to improve tourism quality. However, neither the determining variables of tourist attitude nor the specifics of tourists’ ratings are explored in this study. Exploring the factors that influence tourist mood and the theme mining of tourist comments are, therefore, the primary directions of future research.

Author Contributions

All authors contributed to the study’s conception and design. Material preparation, data collection and analysis were performed by Jingbo Wang, Yu Xia and Yuting Wu. The first draft of the manuscript was written by Jingbo Wang and all authors commented on previous versions of the manuscript. All authors have read and agreed to the published version of the manuscript.

Funding

This research is partially funded by the Science and Technology Research Project of Jiangxi Provincial Department of Education, No. GJJ170211.

Data Availability Statement

Not applicable.

Acknowledgments

The authors thank Wang Peixiao of Wuhan University and Li Qiyue of Jiangxi Normal University for their constructive advice on the article, which has greatly improved its quality.

Conflicts of Interest

The authors declare no conflict of interest.

References

  1. Geng, S.; Zhang, H. High-Quality Development of China’s Tourism Industry: Strategic Mission, Power Factors and Promotion Path. Macroeconomics 2022, 01, 91–101. [Google Scholar] [CrossRef]
  2. Ming, Q.; Zheng, B. Research on the Construction of Driving System and Development Level Measurement of Tourism High-Quality Development in Mountain Scenic Area. J. Cent. China Norm. Univ. 2022, 56, 91–104. [Google Scholar] [CrossRef]
  3. Yu, Y.; Lang, M.; Zhao, Y.; Liu, W.; Hu, B. Tourist Perceived Value, Tourist Satisfaction, and Life Satisfaction: Evidence From Chinese Buddhist Temple Tours. J. Hosp. Tour. Res. 2021, 109634802110153. [Google Scholar] [CrossRef]
  4. Pietilä, M.; Fagerholm, N. Visitors’ Place-Based Evaluations of Unacceptable Tourism Impacts in Oulanka National Park, Finland. Tour. Geogr. 2016, 18, 258–279. [Google Scholar] [CrossRef]
  5. Liu, Y.; Bao, J.; Zhu, Y. Exploring emotion methods of tourism destination evaluation: A big-data approach. Geogr. Res. 2017, 36, 1091–1105. [Google Scholar]
  6. Marin, J.; Grijalvo, M.; Mundet, L. Can a Mature Sun & Beach Tourist DestinationChange Its Image Among Tourists?: The Case Study of Lloret de Mar. Tourism 2021, 69, 527–542. [Google Scholar] [CrossRef]
  7. Wang, P.; Hu, T.; Gao, F.; Wu, R.; Guo, W.; Zhu, X. A Hybrid Data-Driven Framework for Spatiotemporal Traffic Flow Data Imputation. IEEE Internet Things J. 2022, 1. [Google Scholar] [CrossRef]
  8. Zhang, Y.; Zhang, F.; Chen, N. Migratable Urban Street Scene Sensing Method Based on Vision Language Pre-Trained Model. Int. J. Appl. Earth Obs. Geoinf. 2022, 113, 102989. [Google Scholar] [CrossRef]
  9. Song, S.; Kawamura, H.; Uchida, J.; Saito, H. Determining Tourist Satisfaction from Travel Reviews. Inf. Technol. Tour. 2019, 21, 337–367. [Google Scholar] [CrossRef]
  10. Zhang, Y.; Zheng, X.; Helbich, M.; Chen, N.; Chen, Z. City2vec: Urban Knowledge Discovery Based on Population Mobile Network. Sustain. Cities Soc. 2022, 85, 104000. [Google Scholar] [CrossRef]
  11. Fazzolari, M.; Petrocchi, M. A Study on Online Travel Reviews through Intelligent Data Analysis. Inf. Technol. Tour. 2018, 20, 37–58. [Google Scholar] [CrossRef]
  12. Hu, X.; Yang, Y. What Makes Online Reviews Helpful in Tourism and Hospitality? A Bare-Bones Meta-Analysis. J. Hosp. Mark. Manag. 2021, 30, 139–158. [Google Scholar] [CrossRef]
  13. Su, L.; Yang, Q.; Swanson, S.R.; Chen, N.C. The Impact of Online Reviews on Destination Trust and Travel Intention: The Moderating Role of Online Review Trustworthiness. J. Vacat. Mark. 2021, 135676672110632. [Google Scholar] [CrossRef]
  14. Chen, W.; Xu, Z.; Zheng, X.; Yu, Q.; Luo, Y. Research on Sentiment Classification of Online Travel Review Text. Appl. Sci. 2020, 10, 5275. [Google Scholar] [CrossRef]
  15. Cong, L.; He, J. An Emotional Analysis of Tourists in Wildlife Tourism Scenic Spots——A Case Study in Chimelong Safari Park. Tour. Trib. 2020, 35, 12. [Google Scholar]
  16. Dang, N.; Xiao, H.; Li, W. Empirical research on the influencing factors of tourists’pro-environment behavior:based on the dual perspectives of emotion and cognition. Hum. Geogr. 2021, 36, 185–192. [Google Scholar] [CrossRef]
  17. Bruno, S.; Yang, C.; Tian, W.; Xie, Z.; Shao, Y. Exploring the Characteristics of Tourism Industry by Analyzing Consumer Review Contents from Social Media: A Case Study of Bamako, Mali. Geo-Spat. Inf. Sci. 2019, 22, 214–222. [Google Scholar] [CrossRef]
  18. Taecharungroj, V.; Mathayomchan, B. Analysing TripAdvisor Reviews of Tourist Attractions in Phuket, Thailand. Tour. Manag. 2019, 75, 550–568. [Google Scholar] [CrossRef]
  19. Baniya, R.; Dogru-Dastan, H.; Thapa, B. Visitors’ Experience at Angkor Wat, Cambodia: Evidence from Sentiment and Topic Analysis. J. Herit. Tour. 2020, 1–14. [Google Scholar] [CrossRef]
  20. Fang, C.; Zhang, G.; Xue, D. High-quality development of urban agglomerations in China and construction of science and technology collaborative innovation community. Acta Geogr. Sin. 2021, 76, 2898–2908. [Google Scholar]
  21. Zhang, G.; Wang, Y.; Wang, Y.; Cao, Y.; Zhou, C. The Spatio-temporal Evolution and Mechanism of the Coordination Between Quality and Quantity of Economic Growth in Chinese Urban Agglomerations. Sci. Geogr. Sin. 2021, 41, 2075–2086. [Google Scholar] [CrossRef]
  22. Zhou, J. Region-wide Tourism under the Strategy of Regional Coordinated Development:An Exploration of the Paradigm of Interaction of Eastern Guangdong Urban Agglomeration. Soc. Sci. 2021, 36, 50–55. [Google Scholar]
  23. Qiu, Y.; Yin, J.; Zhang, T.; Du, Y.; Zhang, B. Spatiotemporal Dynamic Analysis of A-Level Scenic Spots in Guizhou Province, China. ISPRS Int. J. Geo-Inf. 2021. [Google Scholar] [CrossRef]
  24. Liu, M.; Hao, W. The Spatial Distribution and Influence Factors of A-Level Scenic Spots in Shanxi Province. Econ. Geogr. 2020, 40, 10. [Google Scholar]
  25. Zhang, H.; Shi, T.; Bao, H. The Spatial Structure Characteristics of China’s 5A-Level Tourist Attractions. J. Huaqiao Univ. Soc. Sci. 2019, 80–90. [Google Scholar] [CrossRef]
  26. Cheng, Y.; Hou, Z.; Chen, J.; Economics, S.O.; University, P.; School, H.B.; University, P.; School, B.; Technology, U.O. Sydney Distribution Features and Economic Effect of National 5A Tourist Attractions in China. Areal Res. Dev. 2015. [Google Scholar]
  27. García-Palomares, J.C.; Gutiérrez, J.; Mínguez, C. Identification of Tourist Hot Spots Based on Social Networks: A Comparative Analysis of European Metropolises Using Photo-Sharing Services and GIS. Appl. Geogr. 2015, 63, 408–417. [Google Scholar] [CrossRef]
  28. Gaładyk, P.; Podhorodecka, K. Tourist Attractions and the Location of Campsites in Western Australia. Curr. Issues Tour. 2021, 24, 2144–2166. [Google Scholar] [CrossRef]
  29. Wang, P.; Zhang, T.; Zheng, Y.; Hu, T. A Multi-View Bidirectional Spatiotemporal Graph Network for Urban Traffic Flow Imputation. Int. J. Geogr. Inf. Sci. 2022, 36, 1231–1257. [Google Scholar] [CrossRef]
  30. Fang, B.; Ye, Q.; Kucukusta, D.; Law, R. Analysis of the Perceived Value of Online Tourism Reviews: Influence of Readability and Reviewer Characteristics. Tour. Manag. 2016, 52, 498–506. [Google Scholar] [CrossRef]
  31. Xiao, X.; Fang, C.; Lin, H.; Chen, J. A Framework for Quantitative Analysis and Differentiated Marketing of Tourism Destination Image Based on Visual Content of Photos. Tour. Manag. 2022, 93, 104585. [Google Scholar] [CrossRef]
  32. Liang, B. Development of Rural Community-Based Tourism with Local Customs from the View of Consumer Satisfaction. Ann. Oper. Res. 2021, 1–17. [Google Scholar] [CrossRef]
  33. Hsieh, H.-P.; Li, C.-T. Composing Traveling Paths from Location-Based Services. Proc. Int. AAAI Conf. Web Soc. Media 2012, 6, 618–619. Available online: https://ojs.aaai.org/index.php/ICWSM/article/view/14228 (accessed on 1 August 2022).
  34. Yan, R.; Xia, Z.; Xie, Y.; Wang, X.; Song, Z. Research on Sentiment Classification Algorithms on Online Review. Complexity 2020, 2020. [Google Scholar] [CrossRef]
  35. Baziotis, C.; Pelekis, N.; Doulkeridis, C. Datastories at Semeval-2017 Task 4: Deep Lstm with Attention for Message-Level and Topic-Based Sentiment Analysis. In Proceedings of the 11th International Workshop on Semantic Evaluation (SemEval-2017), Vancouver, BC, Canada, 3–4 August 2017; pp. 747–754. Available online: https://aclanthology.org/S17-2126/ (accessed on 1 August 2022).
  36. Wang, H.W.; Zheng, L.J.; Yin, P.; He, S.Y. Classification of Sentimental Polarity for Chinese Online Reviews Based on Sentence Level Sentiment. J. Manag. Sci. China 2013, 16, 64–74. [Google Scholar]
  37. Bravo-Marquez, F.; Khanchandani, A.; Pfahringer, B. Incremental Word Vectors for Time-Evolving Sentiment Lexicon Induction. Cogn. Comput. 2022, 14, 425–441. [Google Scholar] [CrossRef]
  38. Ahmad, M.; Aftab, S.; Bashir, M.S.; Hameed, N.; Ali, I.; Nawaz, Z. SVM Optimization for Sentiment Analysis. Int. J. Adv. Comput. Sci. Appl. 2018, 9. [Google Scholar] [CrossRef]
  39. Mathapati, S.; Nafeesa, A.; Manjula, S.H.; Venugopal, K.R. OTAWE-Optimized Topic-Adaptive Word Expansion for Cross Domain Sentiment Classification on Tweets. In Advances in Machine Learning and Data Science; Springer: Berlin/Heidelberg, Germany, 2018; pp. 213–224. [Google Scholar]
  40. Yin, D.; Meng, T.; Chang, K.-W. Sentibert: A Transferable Transformer-Based Architecture for Compositional Sentiment Semantics. arXiv 2020, arXiv:2005.04114. [Google Scholar]
  41. Dwivedi, R.K.; Aggarwal, M.; Keshari, S.K.; Kumar, A. Sentiment Analysis and Feature Extraction Using Rule-Based Model (RBM). In Proceedings of the International Conference on Innovative Computing and Communications, New Delhi, India, 5–6 May 2018; pp. 57–63. [Google Scholar]
  42. Zhang, B.; Xiao, P.; Yu, X. The Influence of Prosocial and Antisocial Emotions on the Spread of Weibo Posts: A Study of the COVID-19 Pandemic. Discrete Dyn. Nat. Soc. 2021, 2021. [Google Scholar] [CrossRef]
  43. Liu, C.; Chen, Y.; Jian, Y.; Dong, R. Measurement of the driving capacity of tourism industry on indirect employment and its spatio-temporal differences in China. Acta Geogr. Sin. 2022, 77, 918–935. [Google Scholar]
  44. Lin, Y.X.; Lin, B.S.; Chen, M.H.; Su, C.H.J. 5A Tourist Attractions and China’s Regional Tourism Growth. Asia Pac. J. Tour. Res. 2020, 25, 524–540. [Google Scholar] [CrossRef]
  45. Tian, L.; Pu, W.; Su, C.-H.; Chen, M.-H.; Lin, Y.-X. Asymmetric Effects of China’s Tourism on the Economy at the City Level: A Moderating Role of Spatial Disparities in Top Level Tourist Attractions. Curr. Issues Tour. 2021, 1–17. [Google Scholar] [CrossRef]
  46. Chi, M.; Pan, M.; Wang, W. A Cross-Platform Comparative Study of Reviews on Sharing Accommodation and Hotels Reservation Platform: Combined with LDA-SNA and Sentiment Analysis. Libr. Inf. Serv. 2021, 65, 107. [Google Scholar]
  47. Zhang, J.; Zheng, Z.; Zhang, L.; Qin, Y.; Duan, J.; Zhang, A. Influencing Factors of Environmental Risk Perception during the COVID-19 Epidemic in China. Int. J. Environ. Res. Public Health 2021, 18, 9375. [Google Scholar] [CrossRef] [PubMed]
  48. Zhang, C.; Ma, X.; Zhou, Y.; Gao, R. Analysis of Public Opinion Evolution in COVID-19 Pandemic from a Perspective of Sentiment Variation. J. Geo-Inf. Sci. 2021, 23, 341–350. [Google Scholar]
  49. Zhu, Y.; Jing, C.; Fu, J.; Du, M.; Zhou, L. Analysis of Space-Time Pattern of Robbery Crime Based on Space-Time Cube. Sci. Surv. Mapp. 2019, 9, 132–138. [Google Scholar]
  50. Park, Y.M.; Kearney, G.D.; Wall, B.; Jones, K.; Howard, R.J.; Hylock, R.H. COVID-19 Deaths in the United States: Shifts in Hot Spots over the Three Phases of the Pandemic and the Spatiotemporally Varying Impact of Pandemic Vulnerability. Int. J. Environ. Res. Public. Health 2021, 18, 8987. [Google Scholar] [CrossRef]
  51. Purwanto, P.; Utaya, S.; Handoyo, B.; Bachri, S.; Astuti, I.S.; Utomo, K.S.B.; Aldianto, Y.E. Spatiotemporal Analysis of COVID-19 Spread with Emerging Hotspot Analysis and Space–Time Cube Models in East Java, Indonesia. ISPRS Int. J. Geo-Inf. 2021, 10, 133. [Google Scholar] [CrossRef]
  52. Allen, M.J.; Allen, T.R.; Davis, C.; McLeod, G. Exploring Spatial Patterns of Virginia Tornadoes Using Kernel Density and Space-Time Cube Analysis (1960–2019). ISPRS Int. J. Geo-Inf. 2021, 10, 310. [Google Scholar] [CrossRef]
  53. Böhm, J.; Möller, G.; Schindelegger, M.; Pain, G.; Weber, R. Development of an Improved Empirical Model for Slant Delays in the Troposphere (GPT2w). GPS Solut. 2015, 19, 433–441. [Google Scholar] [CrossRef]
  54. Cheng, S.; Zhang, B.; Peng, P.; Yang, Z.; Lu, F. Spatiotemporal Evolution Pattern Detection for Heavy-Duty Diesel Truck Emissions Using Trajectory Mining: A Case Study of Tianjin, China. J. Clean. Prod. 2020, 244, 118654. [Google Scholar] [CrossRef]
  55. Qi, Z.; Dehe, X.; Yan, D. Spatio-Temporal Pattern Mining of the Last 40 Years of Drought in China Based on SPEI Index and Spatio-Temporal Cube. Agric. Res. Arid Areas 2021, 39, 8. [Google Scholar]
  56. Ji, X.; Li, Y.; Cao, G. Time-space Pattern Evolution and Optimal Regulation of Scenic Crowding. Areal Res. Dev. 2021, 40, 95–100. [Google Scholar]
  57. Tarver, R.; Cohen, K.; Klyve, D.; Liseki, S. Sustainable Safari Practices: Proximity to Wildlife, Educational Intervention, and the Quality of Experience. J. Outdoor Recreat. Tour. 2019, 25, 76–83. [Google Scholar] [CrossRef]
  58. Yuan, L.; Yang, Y.; Wang, J. A Study on the development characteristics of the national 5A tourist attractions in China. J. Huazhong Norm. Univ. Sci. 2014, 48, 301–306. [Google Scholar] [CrossRef]
  59. Li, H.; Li, D.; Dong, X.; Xu, N. Spatial Patterns of 5A-Level Tourist Attractions and Their Nework Attention Degrees in China. J. Arid Land Resour. Environ. 2019, 10. [Google Scholar]
  60. Zhang, C.; Zhang, Z. Research on Spatial Distribution and Influencing Factors of Tourist Attractions in China’s Three Major Urban Agglomerations. China Anc. City 2021, 35, 15–22. [Google Scholar] [CrossRef]
  61. Ettema, D.; Friman, M.; Olsson, L.E.; Gärling, T. Season and Weather Effects on Travel-Related Mood and Travel Satisfaction. Front. Psychol. 2017, 8. [Google Scholar] [CrossRef]
  62. St-Louis, E.; Manaugh, K.; van Lierop, D.; El-Geneidy, A. The Happy Commuter: A Comparison of Commuter Satisfaction across Modes. Transp. Res. Part F: Traffic Psychol. Behav. 2014, 26, 160–170. [Google Scholar] [CrossRef]
  63. Padilla, J.J.; Kavak, H.; Lynch, C.J.; Gore, R.J.; Diallo, S.Y. Temporal and Spatiotemporal Investigation of Tourist Attraction Visit Sentiment on Twitter. PLoS ONE 2018, 13, e0198857. [Google Scholar] [CrossRef]
  64. Chen, M.M.; Yu, P.; Zhang, Y.; Wu, K.; Yang, Y. Acoustic Environment Management in the Countryside: A Case Study of Tourist Sentiment for Rural Soundscapes in China. J. Environ. Plan. Manag. 2021, 1–23. [Google Scholar] [CrossRef]
  65. Cheng, Z.; Jin, M.; Jiang, Q. Research into the Competitiveness of Scenic Areas from the Perspective of Tourists: A Case Study of the Jiuzhai Valley. Emerg. Mark. Financ. Trade 2019, 1–9. [Google Scholar] [CrossRef]
  66. Huang, J.; Obracht-Prondzynska, H.; Kamrowska-Zaluska, D.; Sun, Y.; Li, L. The Image of the City on Social Media: A Comparative Study Using “Big Data” and “Small Data” Methods in the Tri-City Region in Poland. Landsc. Urban Plan. 2021, 206, 103977. [Google Scholar] [CrossRef]
Figure 1. Distribution of 5A scenic areas in China.
Ijgi 11 00492 g001
Figure 2. Research framework.
Ijgi 11 00492 g002
Figure 3. Sentiment classification process.
Ijgi 11 00492 g003
Figure 4. Monthly variation in the number of tourist comments (a) and sentiment values (b).
Ijgi 11 00492 g004
Figure 5. Spatial information on the distribution of scenic areas (a) and tourists (b) (kernel density and standard deviation ellipse).
Ijgi 11 00492 g005
Figure 6. Distribution of trends in tourist sentiment (a) and local abnormalities in sentiment (b).
Ijgi 11 00492 g006
Figure 7. Distribution of monthly variations in tourists’ sentimental cold spots and hot spots.
Ijgi 11 00492 g007
Table 1. Example of study sample data.
Comment TextName of the Scenic AreaScenic POITime
“The view was so beautiful that I didn’t expect it to rain on the mountain…”Black Valley115.817318, 28.66066414 August 2021
“Well worth going, picturesque, natural oxygen bar…”Yinxu116.003495, 28.70397821 July 2021
“Now, in fact, the admission fee is still quite expensive…”Mount Huangshan115.979817, 28.68714423 March 2020
Table 2. Accuracy of sentiment classification.
Classification MethodAccuracyCategoryPrecisionRecallF1
SnowNLP0.83Negative0.740.900.81
Positive0.920.780.84
Optimized SnowNLP0.89Negative0.850.920.88
Positive0.930.860.89
Table 3. Landscape distribution and tourist distribution standard deviation ellipse parameters.
Directional DistributionCenterXCenterYXstdDistYstdDistArea (Polyhedron)
scenic areas
Number of comments
124.89738.7991834.2481499.62917,195,492.797
126.53838.1851482.0341268.15511,749,068.049
Publisher’s Note: MDPI stays neutral with regard to jurisdictional claims in published maps and institutional affiliations.

