

Early Detection of Suspicious Behaviors for Safe Residence from Movement Trajectory Data

Abstract
:1. Introduction
- (1)
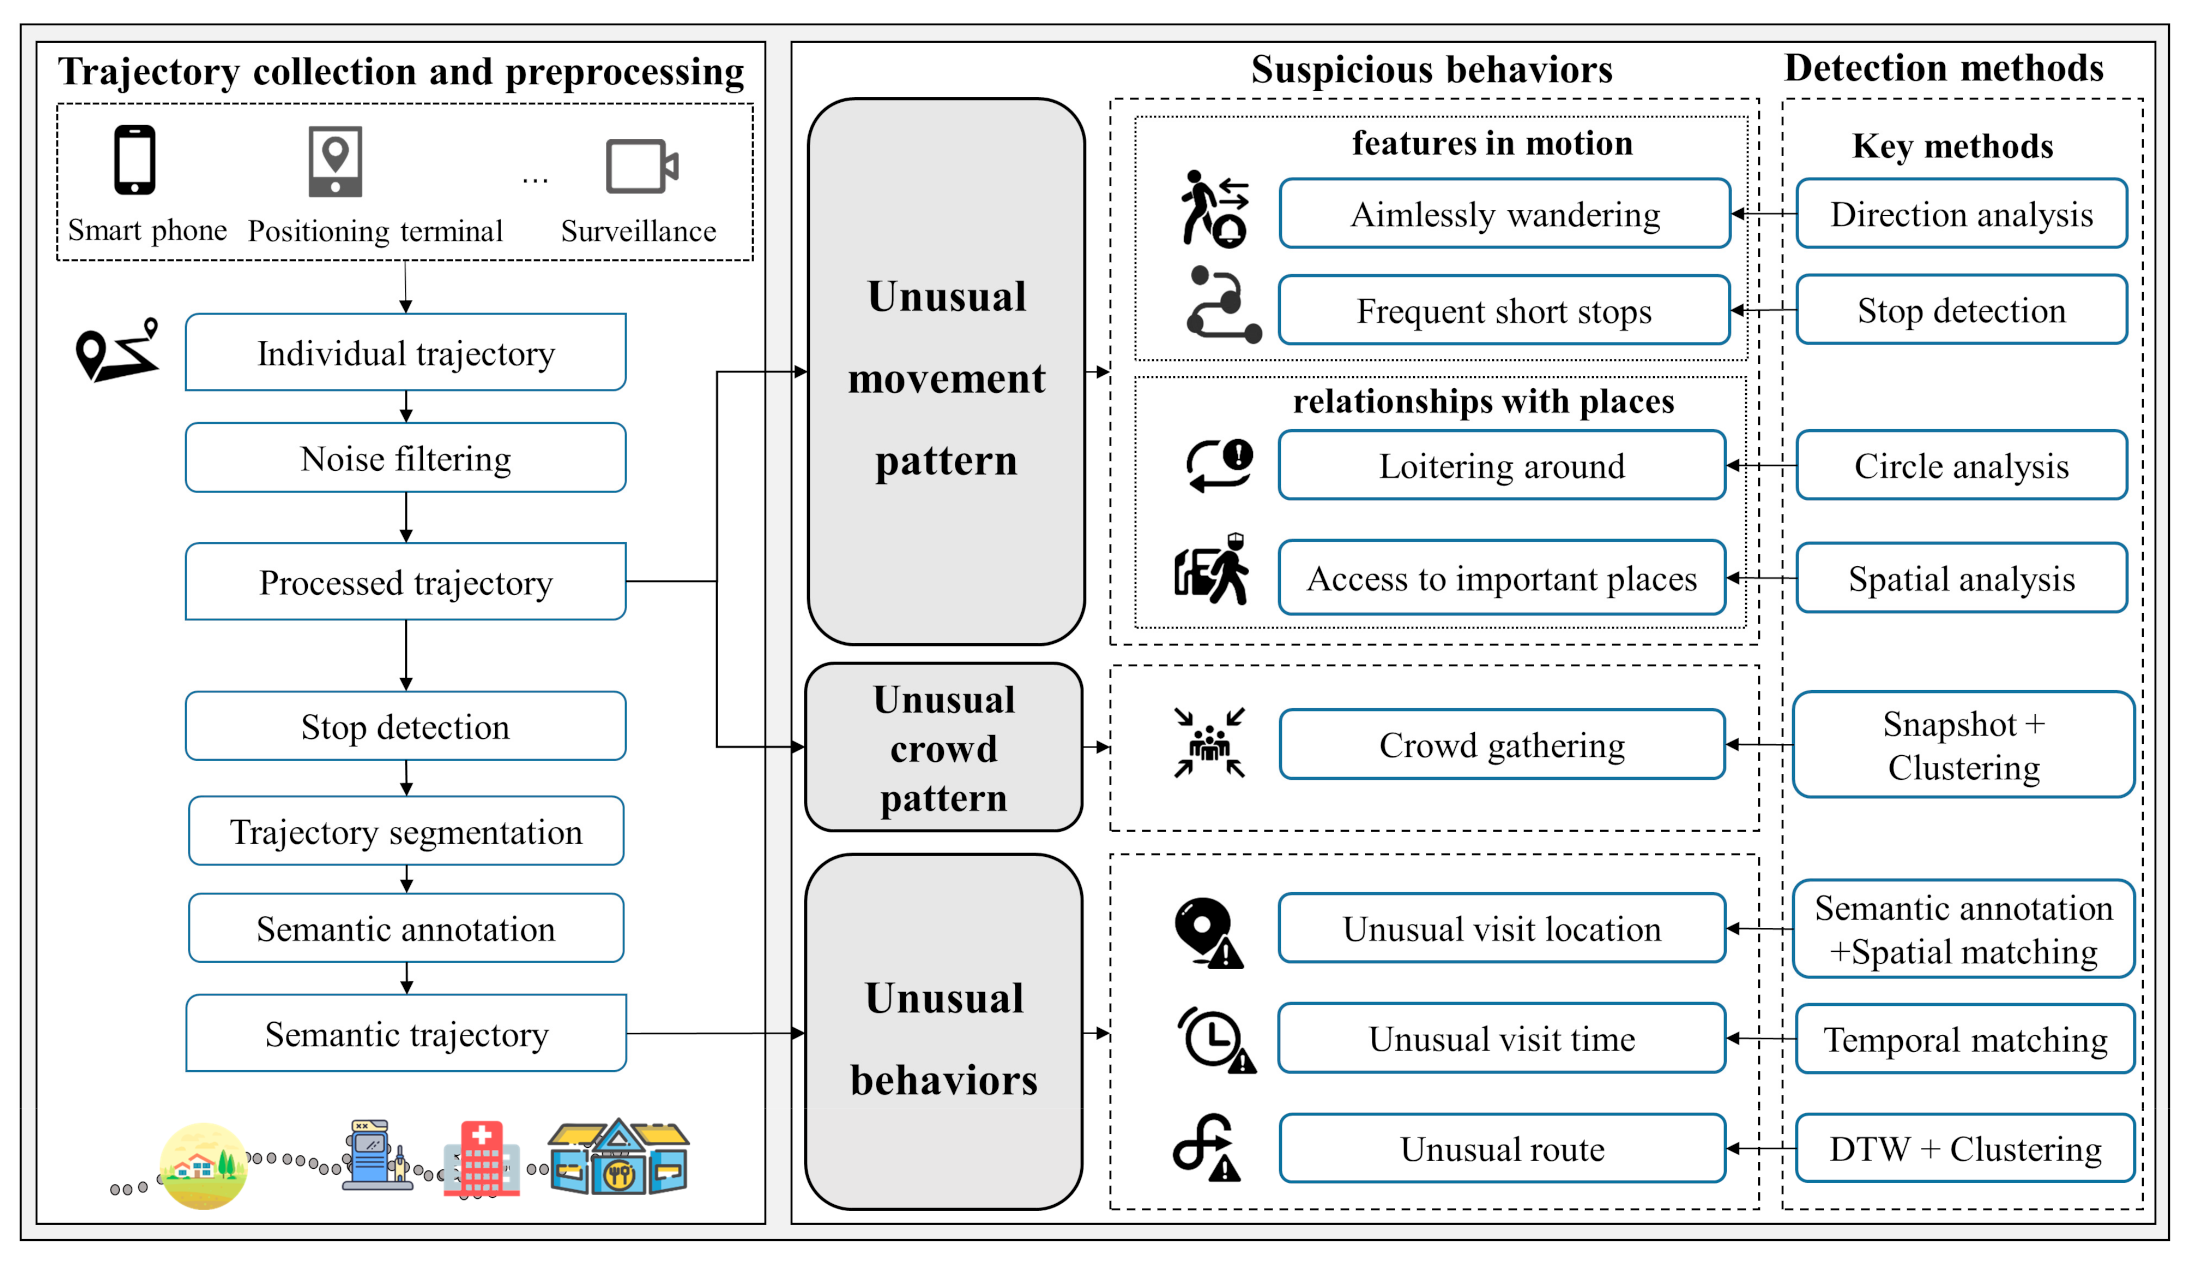
- From the perspective of unusual movement patterns, unusual behaviors, and unusual gatherings, we introduce and characterize eight suspicious behaviors that could be reflected in the individual trajectory. This information is crucial for developing an urban safety-oriented early warning system and helping police make the community safer.
- (2)
- Through analyzing the features of different suspicious behaviors, we propose and implement the corresponding detection algorithms with strong robustness for the complexity of real scenes. Specifically, the semantic information that is hidden in the trajectory is mined to recognize the suspicious behaviors based on spatiotemporal clustering, semantic annotation, trajectory pattern mining, outlier detection, and other methods.
- (3)
- A real trajectory set containing more than 1000 simulated suspicious behaviors was collected and used to verify the proposed methods quantitatively.
2. Related Work
2.1. Detection of Abnormal Trajectories Based on Outlier Detection
2.2. Abnormal Behavior Detection Based on Trajectory Analysis
3. Methodology
3.1. Algorithms for Detecting Unusual Movement Patterns
3.1.1. Detection Based on Movement Features
- (1)
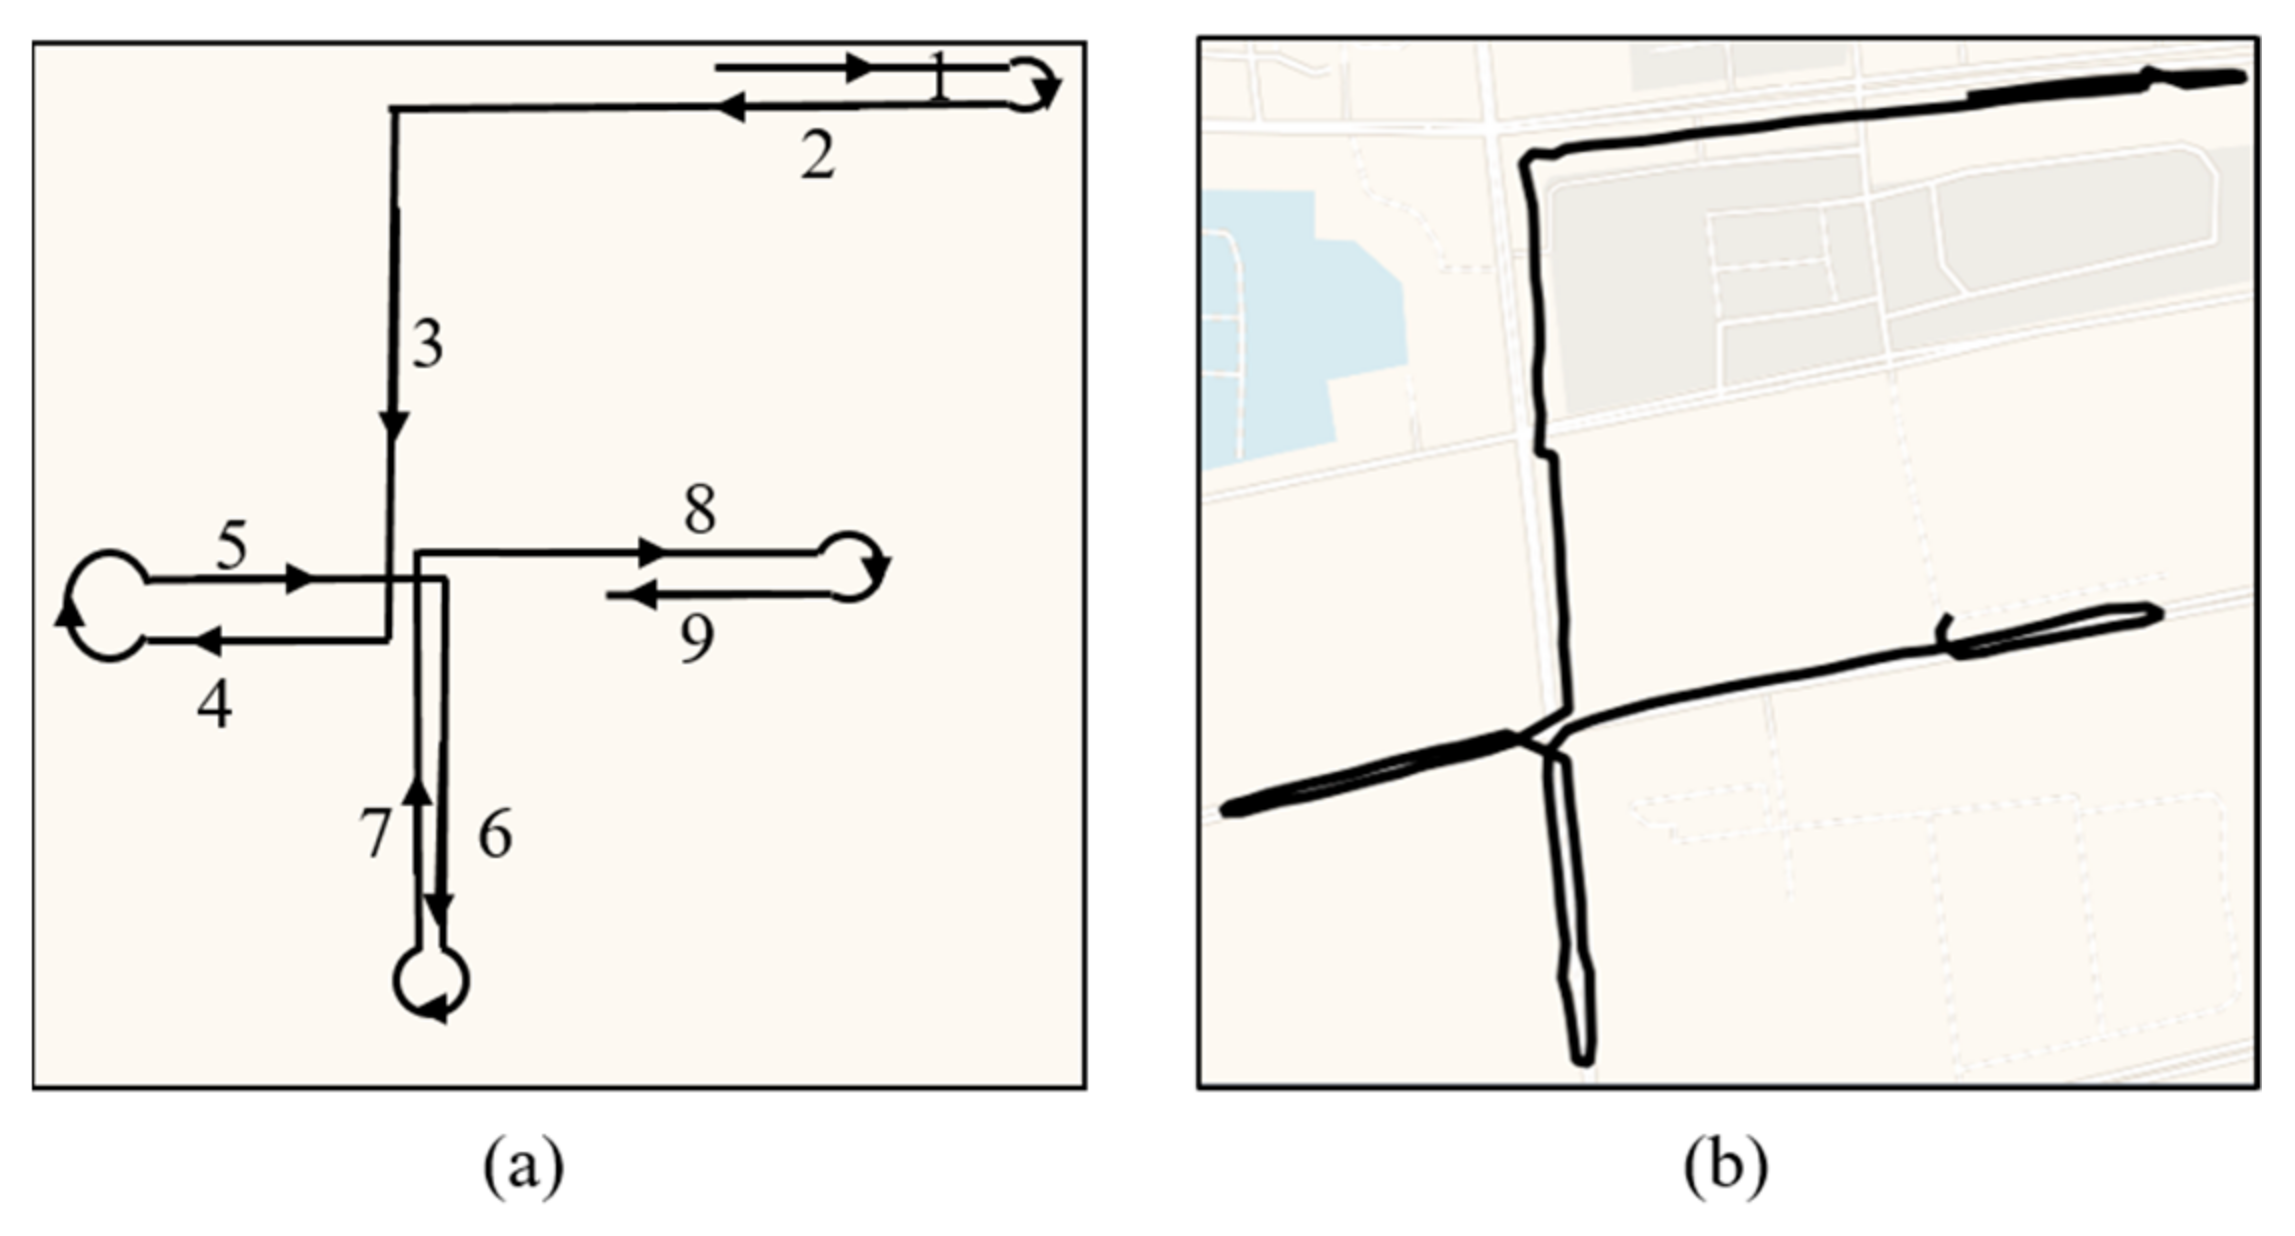
- Aimlessly wandering
- (1)
- Does not belong to a stop: ;
- (2)
- Complete a large-angle change: , is the threshold of the turning angle.
- (3)
- End of turning:
- (4)
- The person is moving: , is the minimum speed threshold.
- (5)
- Drift not caused by noise: (, is the mean angle difference threshold.
- (6)
- Continue to travel a certain distance in the current direction after completing a large-angle turn.
- (2)
- Frequent short stops
3.1.2. Detection Based on the Relationship between Individuals and Places
- (1)
- Loitering around a public place
| Algorithm 1: The pseudocode of loitering detection |
 |
- (2)
- Access to important areas
3.2. Algorithms for Detecting Unusual Behaviors
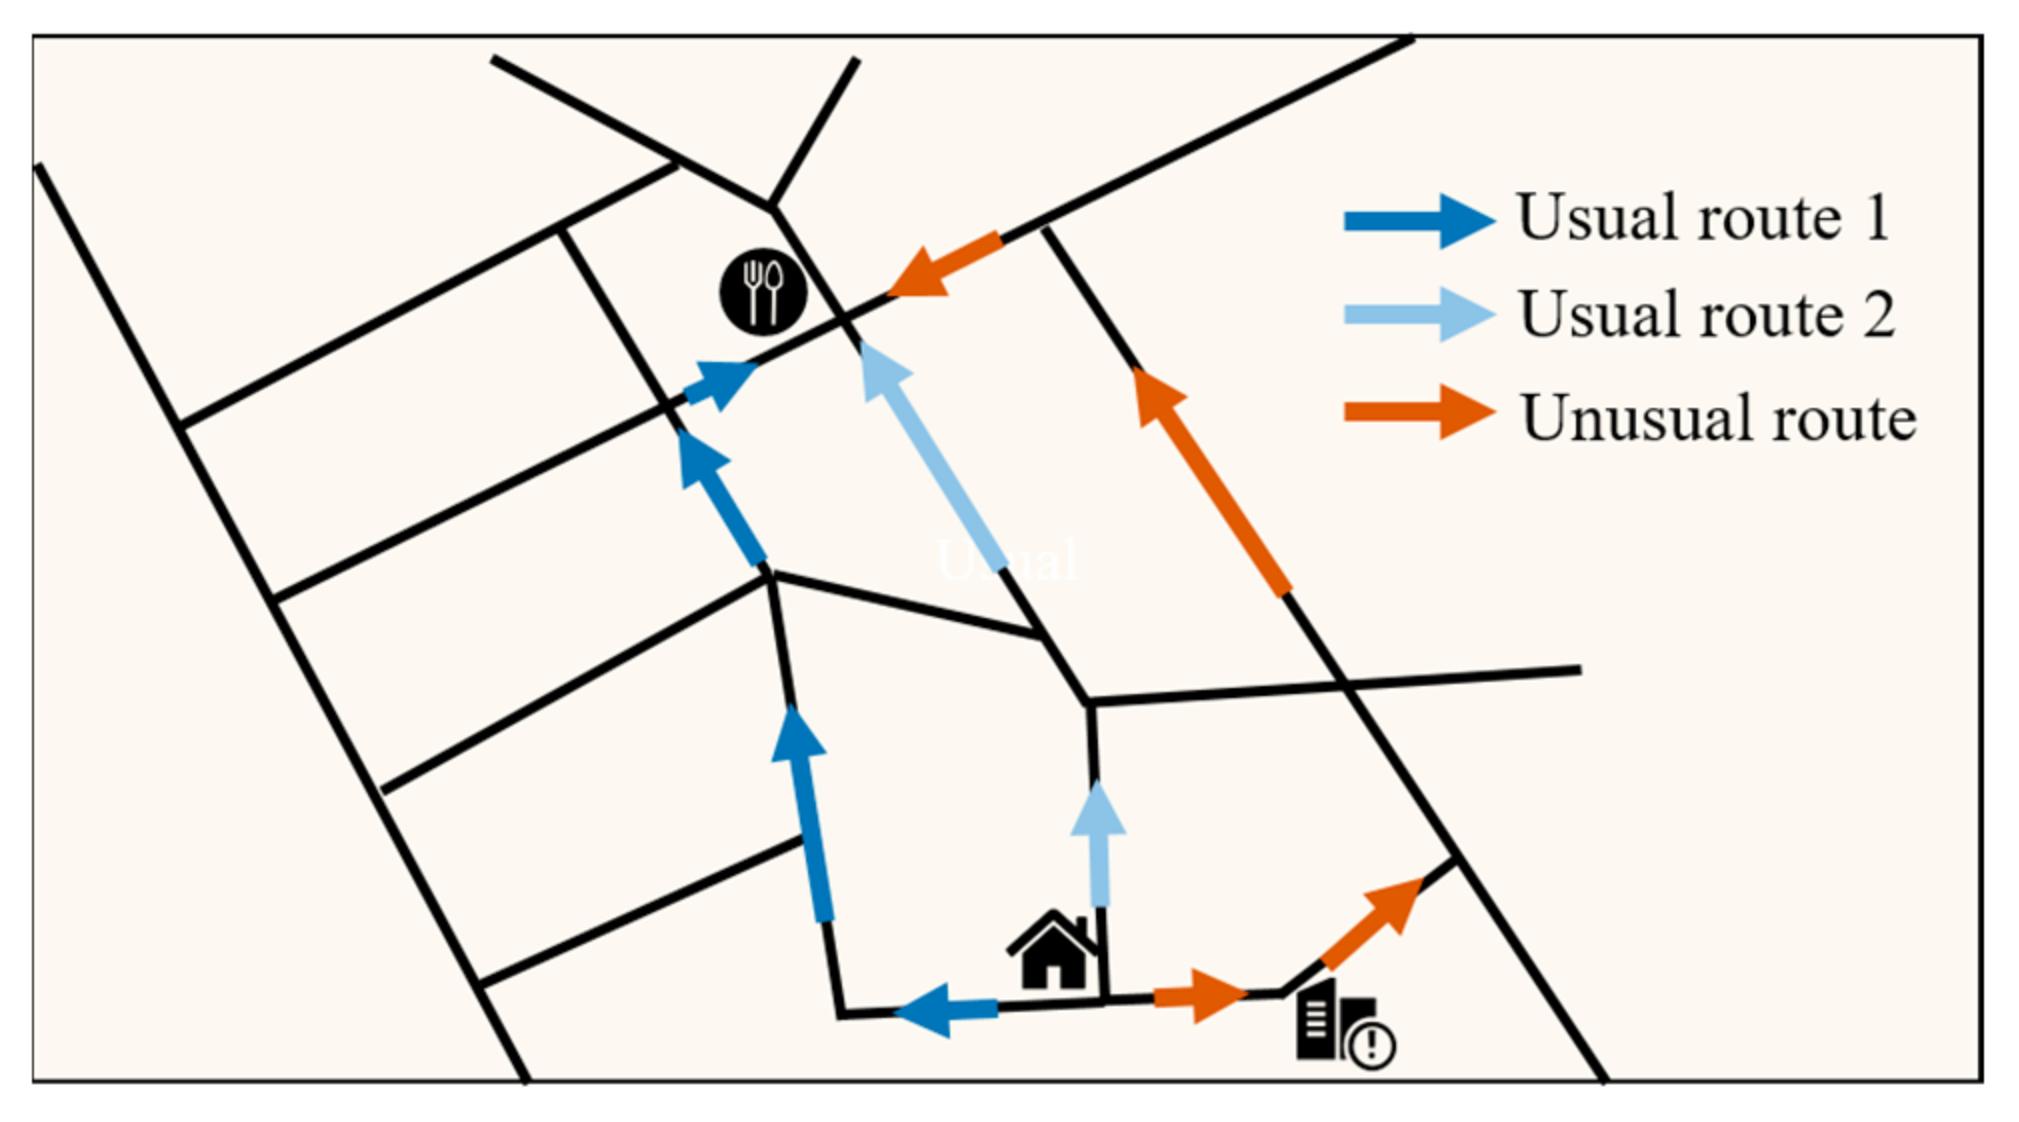
3.2.1. Unusual Route Detection
| Algorithm 2: The pseudocode of unusual route detection |
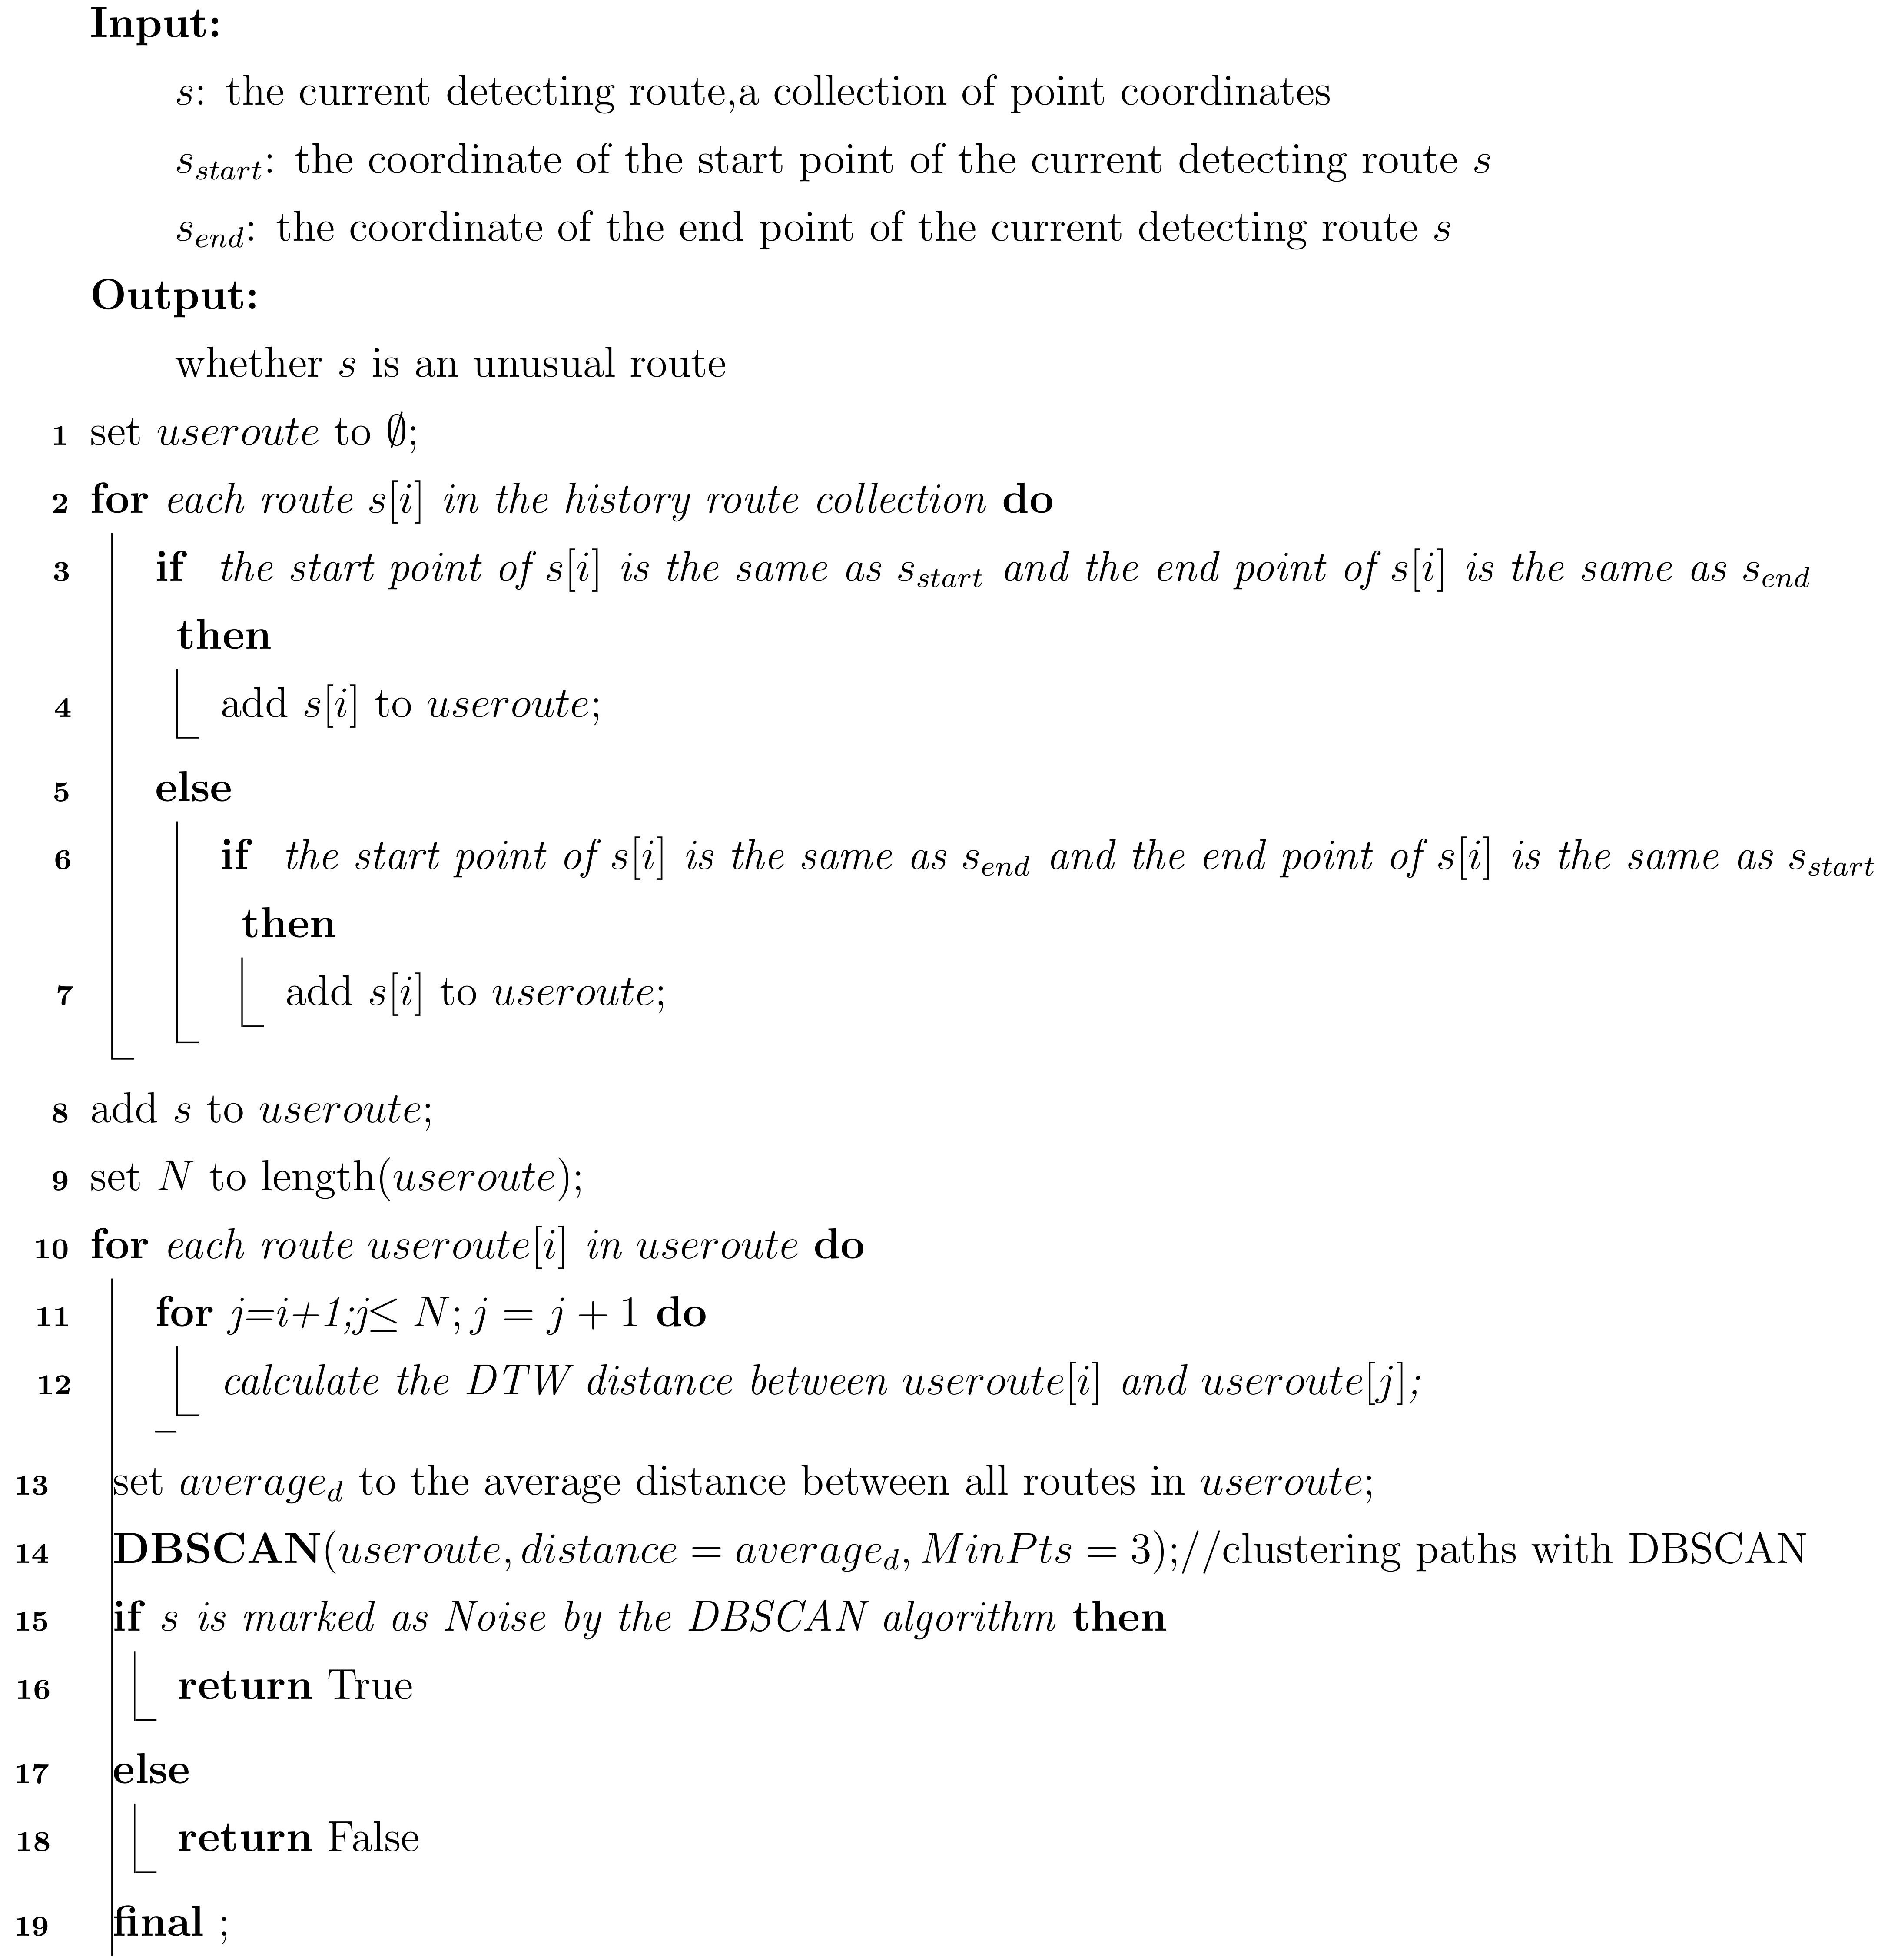 |
3.2.2. Algorithm for Detecting Unusual Visit Locations
3.2.3. Algorithm for Detecting Unusual Visit Time
3.3. Detection Algorithm for Crowd Gathering
4. Experiments and Results
4.1. Trajectory Dataset with Suspicious Behaviors
4.2. Experiments for Suspicious Behavior Detection
4.2.1. Evaluation Indices
4.2.2. Parameter Setting
- (1)
- Rule sensitivity parameters
- (2)
- Algorithm parameters
4.2.3. Compared Methods
4.3. Results and Accuracy Assessment
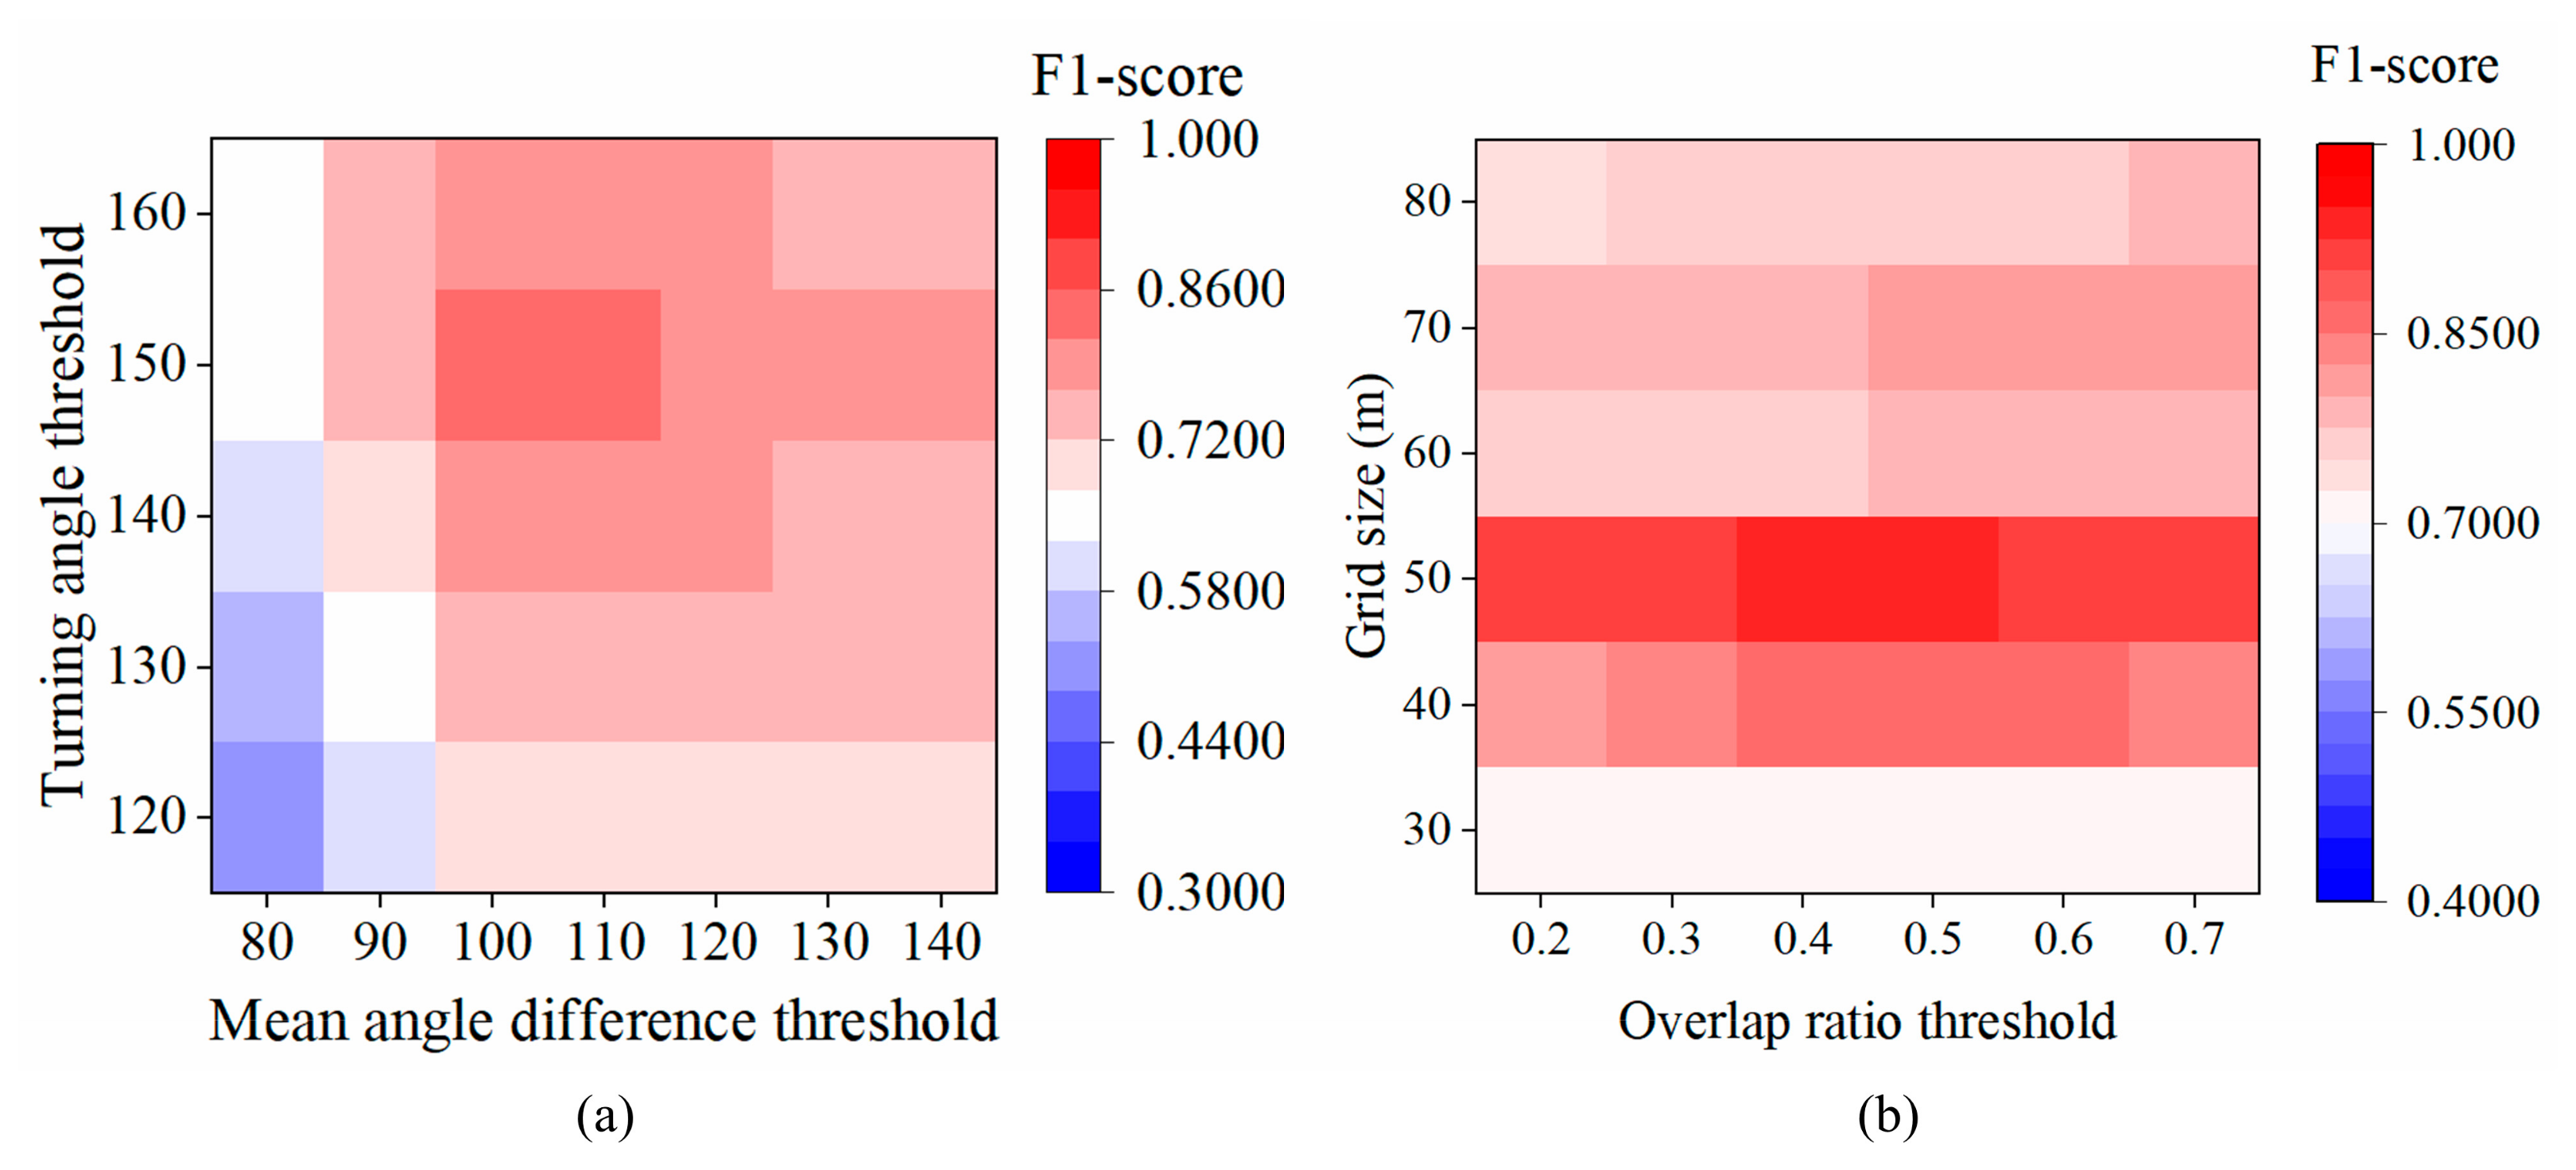
4.4. Sensitivity Analysis of the Algorithm Parameters
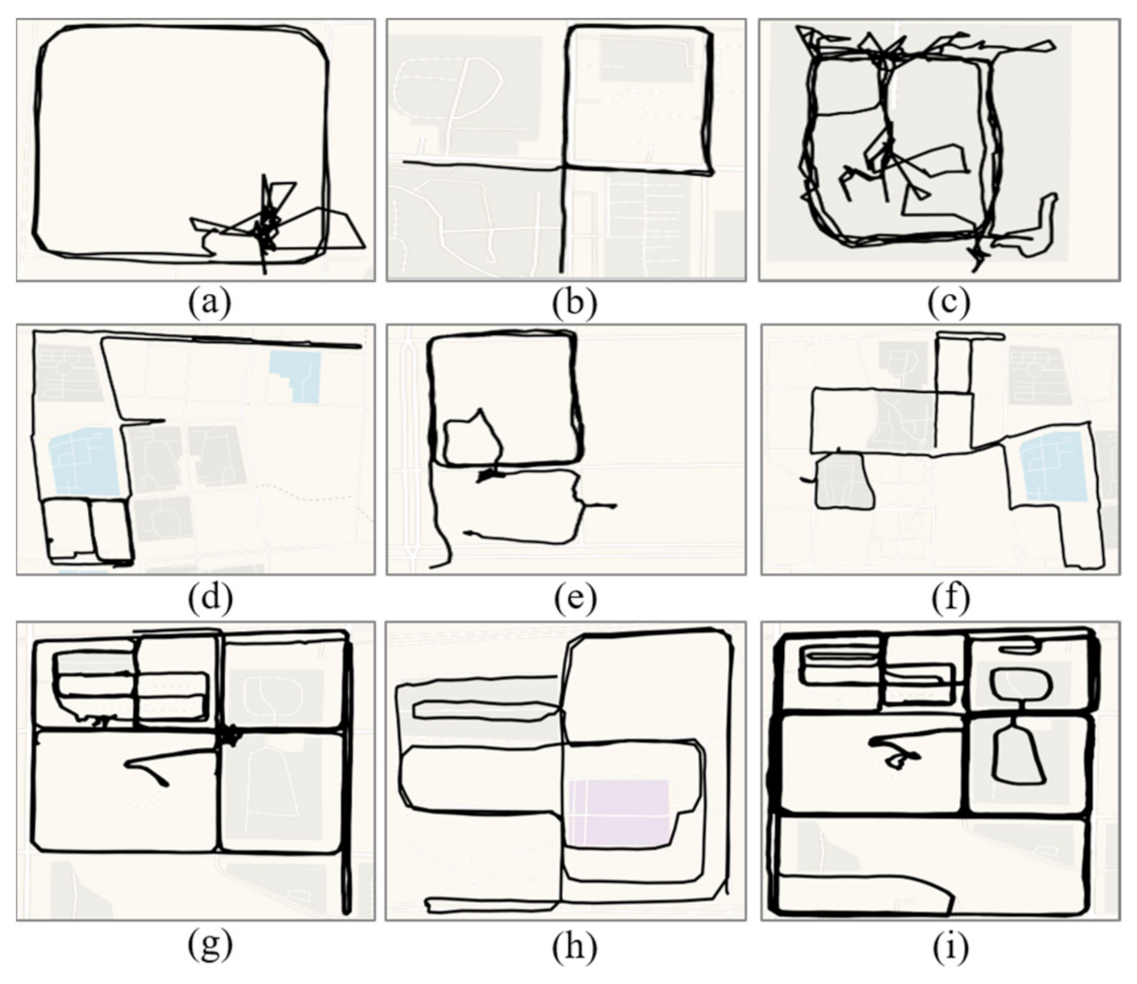
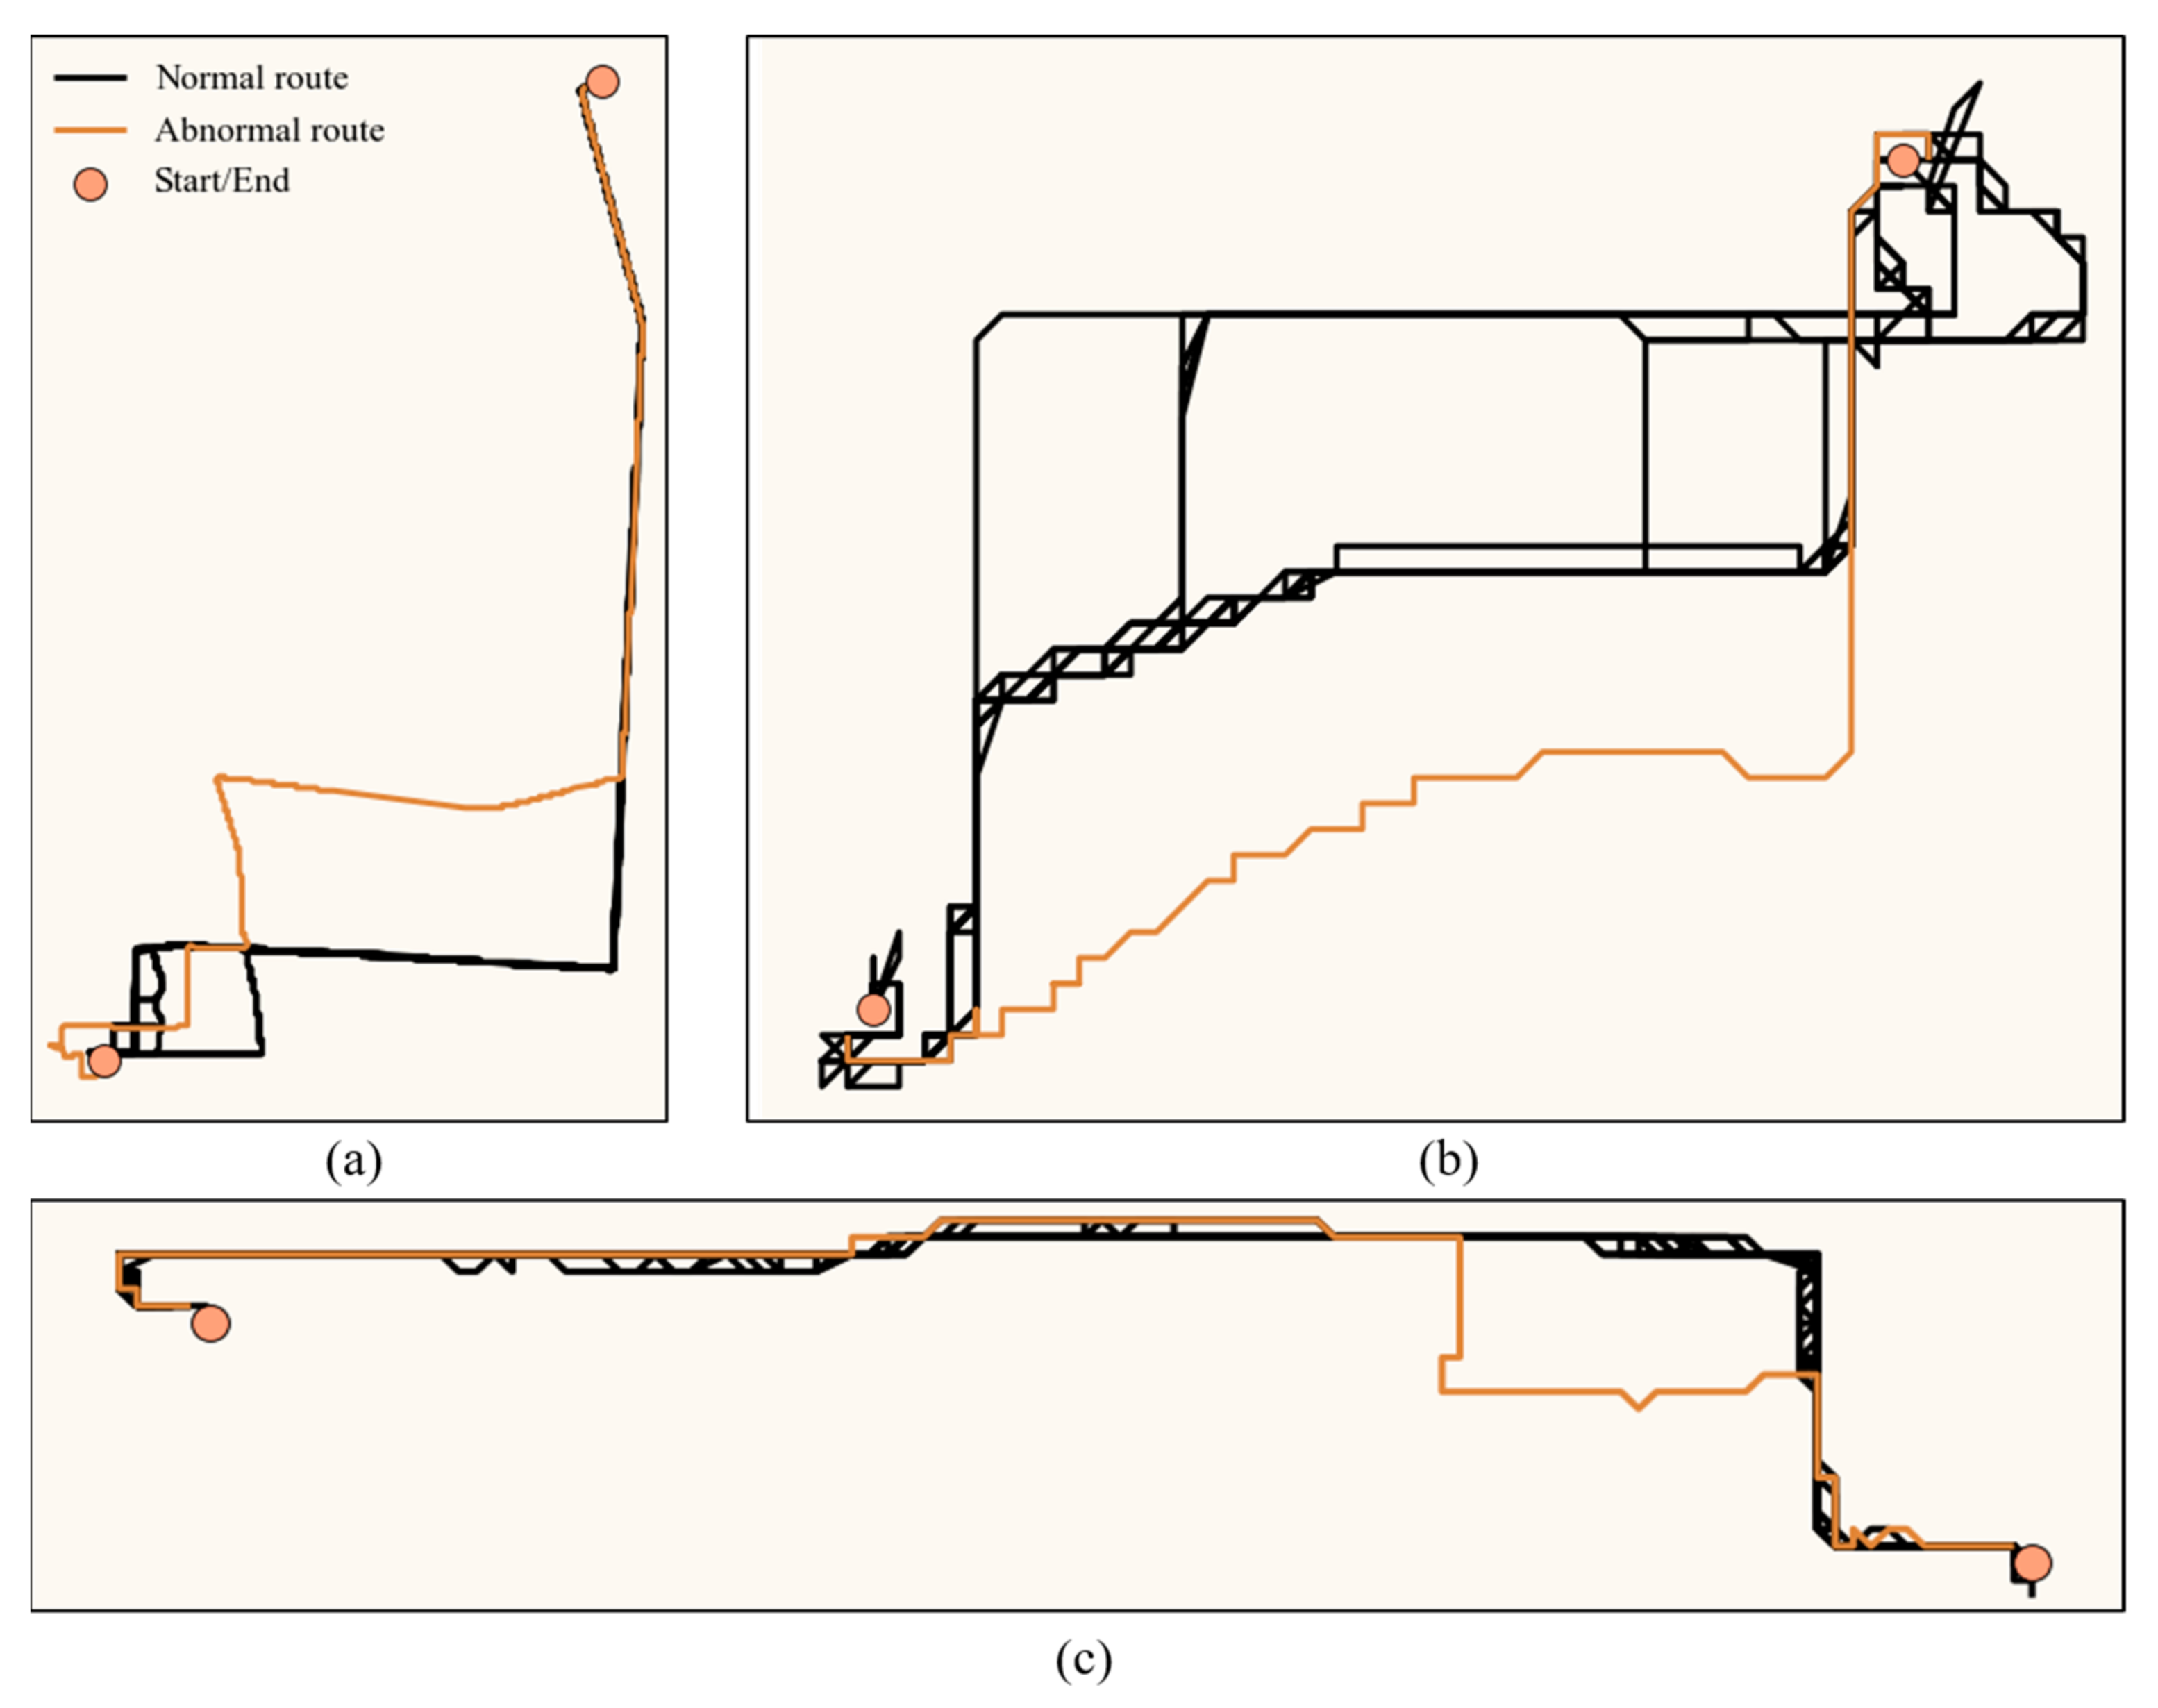
4.5. Typical Cases of the Suspicious Behaviors
5. Discussion
5.1. Practical Applications
5.2. Limitations
6. Conclusions
Author Contributions
Funding
Institutional Review Board Statement
Informed Consent Statement
Data Availability Statement
Acknowledgments
Conflicts of Interest
References
- Kalaiselvi Geetha, M.; Arunnehru, J.; Geetha, A. Early recognition of suspicious activity for crime prevention. In Computer Vision: Concepts, Methodologies, Tools, and Applications; IGI Global: Hershey, PA, USA, 2018; pp. 2139–2165. [Google Scholar]
- Bartoli, G.; Fantacci, R.; Gei, F.; Marabissi, D.; Micciullo, L. A novel emergency management platform for smart public safety: A Novel Emergency Management Platform. Int. J. Commun. Syst. 2015, 28, 928–943. [Google Scholar] [CrossRef]
- Meijer, A.; Wessels, M. Predictive Policing: Review of Benefits and Drawbacks. Int. J. Public Adm. 2019, 42, 1031–1039. [Google Scholar] [CrossRef]
- GNR Safe Residence Program. Available online: https://www.safecommunitiesportugal.com/regional/algarve/gnr-safe-residence-program/ (accessed on 4 July 2022).
- Capital Watch: What Is Suspicious Behavior? Available online: https://mpdc.dc.gov/whatssuspicious (accessed on 4 July 2022).
- Pareek, P.; Thakkar, A. A survey on video-based Human Action Recognition: Recent updates, datasets, challenges, and applications. Artif. Intell. Rev. 2020, 54, 2259–2322. [Google Scholar] [CrossRef]
- Chen, Z.; Cai, H.; Zhang, Y.; Wu, C.; Mu, M.; Li, Z.; Sotelo, M.A. A novel sparse representation model for pedestrian abnormal trajectory understanding. Expert Syst. Appl. 2019, 138, 112753. [Google Scholar] [CrossRef]
- Clarke, R.V.; Cornish, D.B. Modeling Offenders’ Decisions: A Framework for Research and Policy. Crime Justice 1985, 6, 147–185. [Google Scholar] [CrossRef]
- Cohen, L.E.; Felson, M. Social Change and Crime Rate Trends: A Routine Activity Approach. Am. Sociol. Rev. 1979, 44, 588–608. [Google Scholar] [CrossRef]
- Wortley, R. Situational precipitators of crime. In Environmental Criminology and Crime Analysis; Routledge: London, UK, 2016; pp. 81–105. [Google Scholar]
- Vandeviver, C.; Neirynck, E.; Bernasco, W. The foraging perspective in criminology: A review of research literature. Eur. J. Criminol 2021, 1–27. [Google Scholar] [CrossRef]
- Bernasco, W.; Johnson, S.D.; Ruiter, S. Learning where to offend: Effects of past on future burglary locations. Appl. Geogr. 2015, 60, 120–129. [Google Scholar] [CrossRef]
- McCue, C. Data Mining and Predictive Analysis: Intelligence Gathering and Crime Analysis, 2nd ed.; Butterworth-Heinemann: Oxford, UK, 2015. [Google Scholar]
- Yan, Z.; Chakraborty, D.; Parent, C.; Spaccapietra, S.; Aberer, K. Semantic trajectories: Mobility data computation and annotation. ACM Trans. Intell. Syst. Technol. (TIST) 2013, 4, 49. [Google Scholar] [CrossRef]
- Mazimpaka, J.D.; Timpf, S. Trajectory data mining: A review of methods and applications. J. Spat. Inf. Sci. 2016, 13, 61–99. [Google Scholar] [CrossRef]
- Shen, M.; Liu, D.-R.; Shann, S.-H. Outlier detection from vehicle trajectories to discover roaming events. Inf. Sci. 2015, 294, 242–254. [Google Scholar] [CrossRef]
- Wu, H.; Tang, X.; Wang, Z.; Wang, N. Uncovering abnormal behavior patterns from mobility trajectories. Sensors 2021, 21, 3520. [Google Scholar] [CrossRef]
- Meng, F.; Yuan, G.; Lv, S.; Wang, Z.; Xia, S. An overview on trajectory outlier detection. Artif. Intell. Rev. 2018, 52, 2437–2456. [Google Scholar] [CrossRef]
- Belhadi, A.; Djenouri, Y.; Lin, J.C.-W. Comparative Study on Trajectory Outlier Detection Algorithms. In Proceedings of the 2019 International Conference on Data Mining Workshops (ICDMW), Beijing, China, 8–11 November 2019; pp. 415–423. [Google Scholar]
- Yao, D.; Zhang, C.; Zhu, Z.; Huang, J.; Bi, J. Trajectory clustering via deep representation learning. In Proceedings of the 2017 International Joint Conference on Neural Networks (IJCNN), Anchorage, AK, USA, 14–19 May 2017; pp. 3880–3887. [Google Scholar]
- Wang, Y.; Qin, K.; Chen, Y.; Zhao, P. Detecting anomalous trajectories and behavior patterns using hierarchical clustering from Taxi GPS Data. ISPRS Int. J. Geo-Inf. 2018, 7, 25. [Google Scholar] [CrossRef]
- Shaikh, S.A.; Kitagawa, H. Efficient distance-based outlier detection on uncertain datasets of Gaussian distribution. World Wide Web 2013, 17, 511–538. [Google Scholar] [CrossRef]
- Shi, H.; Xu, X.; Fan, Y.; Zhang, C.; Peng, Y. An Auto Encoder Network Based Method for Abnormal behavior detection. In Proceedings of the ACM International Conference Proceeding Series, Yokohama, Japan, 16–18 January 2021; pp. 243–251. [Google Scholar]
- Ahmed, U.; Srivastava, G.; Djenouri, Y.; Lin, J.C.-W. Knowledge graph based trajectory outlier detection in sustainable smart cities. Sustain. Cities Soc. 2022, 78, 103580. [Google Scholar] [CrossRef]
- Pang, G.; Shen, C.; Cao, L.; Hengel, A.V.D. Deep Learning for Anomaly Detection: A Review. ACM Comput. Surv. 2021, 54, 38. [Google Scholar] [CrossRef]
- Shih, D.-H.; Shih, M.-H.; Yen, D.C.; Hsu, J.-H. Personal mobility pattern mining and anomaly detection in the GPS era. Cartogr. Geogr. Inf. Sci. 2016, 43, 55–67. [Google Scholar] [CrossRef]
- Vuong, N.K.; Chan, S.; Lau, C.T. Automated detection of wandering patterns in people with dementia. Gerontechnology 2014, 12, 127–147. [Google Scholar] [CrossRef]
- Long, Y.; Liu, X.; Zhou, J.; Chai, Y. Early birds, night owls, and tireless/recurring itinerants: An exploratory analysis of extreme transit behaviors in Beijing, China. Habitat Int. 2016, 57, 223–232. [Google Scholar] [CrossRef] [Green Version]
- Carboni, E.M.; Bogorny, V. Inferring Drivers Behavior through Trajectory Analysis. In Intelligent Systems’2014; Springer International Publishing: Cham, Switzerland, 2015; Volume 322, pp. 837–848. [Google Scholar]
- Lei, P.-R. A framework for anomaly detection in maritime trajectory behavior. Knowl. Inf. Syst. 2015, 47, 189–214. [Google Scholar] [CrossRef]
- Rong, H.; Teixeira, A.P.; Guedes Soares, C. Data mining approach to shipping route characterization and anomaly detection based on AIS data. Ocean Eng. 2020, 198, 106936. [Google Scholar] [CrossRef]
- Algase, D.L.; Moore, D.H.; Vandeweerd, C.; Gavin-Dreschnack, D.J. Mapping the maze of terms and definitions in dementia-related wandering. Aging Ment. Health 2007, 11, 686–698. [Google Scholar] [CrossRef] [PubMed]
- Qianyin, J.; Guoming, L.; Jinwei, Y.; Xiying, L. A model based method of pedestrian abnormal behavior detection in traffic scene. In Proceedings of the 2015 IEEE First International Smart Cities Conference (ISC2), Guadalajara, Mexico, 25–28 October 2015; pp. 1–6. [Google Scholar]
- Barragana, M.; Alvares, L.O.; Bogorny, V. Unusual behavior detection and object ranking from movement trajectories in target regions. Int. J. Geogr. Inf. Sci. 2017, 31, 364–386. [Google Scholar] [CrossRef]
- Report Suspicious Activity|Safe Communities Portugal. Available online: https://www.safecommunitiesportugal.com/report-suspicious-activity/# (accessed on 8 August 2022).
- What Is Suspicious Activity? Available online: https://www.cityofsanmateo.org/4361/What-is-Suspicious-Activity (accessed on 8 August 2022).
- Reporting Suspicious Behaviour. Available online: https://www.suffolk.police.uk/sites/suffolk/files/reporting_suspicious_behaviour.pdf (accessed on 8 August 2022).
- Brantingham, P.L.; Brantingham, P.J. situational crime-prevention in practice. Can. J. Criminol. 1990, 32, 17–40. [Google Scholar] [CrossRef]
- Cornish, D.B.; Clarke, R.V. The Reasoning Criminal: Rational Choice Perspectives on Offending; Springer: Berlin, Germany; p. 1986.
- Sander, J.; Ester, M.; Kriegel, H.-P.; Xu, X. Density-based clustering in spatial databases: The algorithm gdbscan and its applications. Data Min. knowl. Discov. 1998, 2, 169–194. [Google Scholar] [CrossRef]
- Kinney, J.B.; Brantingham, P.L.; Wuschke, K.; Kirk, M.G.; Brantingham, P.J. Crime Attractors, Generators and Detractors: Land Use and Urban Crime Opportunities. Built Environ. 2008, 34, 62–74. [Google Scholar] [CrossRef]
- Felson, M.; Clarke, R.V. Opportunity Makes the Thief: Practical Theory for Crime Prevention; Police Research Series; Research, Development and Statistics Directorate: London, UK, 1998. [Google Scholar]
- Waterman, M.S. Time warps, string edits, and macromolecules: The theory and practice of sequence comparison. Math. Biosci. 1985, 76, 243–244. [Google Scholar] [CrossRef]
- Brantingham, P.L.; Brantingham, P.J. Notes on the geometry of crime. In Environmental Criminology; Sage Publications: Beverly Hills, CA, USA, 1982; pp. 27–54. [Google Scholar]
- Cheng, J.; Zhang, X.; Luo, P.; Huang, J.; Huang, J. An unsupervised approach for semantic place annotation of trajectories based on the prior probability. Inf. Sci. 2022, 607, 1311–1327. [Google Scholar] [CrossRef]
- Zheng, K.; Zheng, Y.; Yuan, N.J.; Shang, S.; Zhou, X. Online Discovery of Gathering Patterns over Trajectories. IEEE Trans. Knowl. Data Eng. 2014, 26, 1974–1988. [Google Scholar] [CrossRef]
- Lin, Q.; Zhang, D.; Huang, X.; Ni, H.; Zhou, X. Detecting wandering behavior based on GPS traces for elders with dementia. In Proceedings of the 12th International Conference on Control Automation Robotics & Vision (ICARCV), Guangzhou, China, 5–7 December 2012; pp. 672–677. [Google Scholar]
- Breuniq, M.M.; Kriegel, H.-P.; Ng, R.T.; Sander, J. LOF: Identifying density-based local outliers. SIGMOD Rec. 2000, 29, 93–104. [Google Scholar] [CrossRef]
- Jansen, F. Data driven policing in the context of Europe. Data Justice Lab. 2018. Available online: https://datajusticeproject.net/wp-content/uploads/sites/30/2019/05/Report-Data-Driven-Policing-EU.pdf (accessed on 8 August 2022).
- Kutnowski, M. The ethical dangers and merits of predictive policing. J. Commun. Saf. Well-Being 2017, 2, 13. [Google Scholar] [CrossRef]
- Shapiro, A. Reform predictive policing. Nature 2017, 541, 458–460. [Google Scholar] [CrossRef] [Green Version]


| Type of Suspicious Behaviors | Number of Logged Behaviors | Number of Detected Behaviors | Number of Correctly Detected Behaviors | Recall | Precision | F1-Score |
|---|---|---|---|---|---|---|
| Access to important areas | 215 | 215 | 205 | 0.953 | 0.953 | 0.953 |
| Loitering | 123 | 130 | 118 | 0.959 | 0.908 | 0.933 |
| Aimlessly wandering | 120 | 136 | 106 | 0.883 | 0.779 | 0.828 |
| Frequent short stops | 93 | 104 | 86 | 0.925 | 0.827 | 0.873 |
| Unusual route | - | 229 | 198 | - | 0.865 | - |
| Crowd gathering | 1 | 1 | 1 | 1.000 | 1.000 | 1.000 |
| Total | - | 815 | 714 | 0.935 | 0.876 | 0.905 |
Publisher’s Note: MDPI stays neutral with regard to jurisdictional claims in published maps and institutional affiliations. |
© 2022 by the authors. Licensee MDPI, Basel, Switzerland. This article is an open access article distributed under the terms and conditions of the Creative Commons Attribution (CC BY) license (https://creativecommons.org/licenses/by/4.0/).
Share and Cite
Cheng, J.; Zhang, X.; Chen, X.; Ren, M.; Huang, J.; Luo, P. Early Detection of Suspicious Behaviors for Safe Residence from Movement Trajectory Data. ISPRS Int. J. Geo-Inf. 2022, 11, 478. https://doi.org/10.3390/ijgi11090478
Cheng J, Zhang X, Chen X, Ren M, Huang J, Luo P. Early Detection of Suspicious Behaviors for Safe Residence from Movement Trajectory Data. ISPRS International Journal of Geo-Information. 2022; 11(9):478. https://doi.org/10.3390/ijgi11090478
Chicago/Turabian StyleCheng, Junyi, Xianfeng Zhang, Xiao Chen, Miao Ren, Jie Huang, and Peng Luo. 2022. "Early Detection of Suspicious Behaviors for Safe Residence from Movement Trajectory Data" ISPRS International Journal of Geo-Information 11, no. 9: 478. https://doi.org/10.3390/ijgi11090478
APA StyleCheng, J., Zhang, X., Chen, X., Ren, M., Huang, J., & Luo, P. (2022). Early Detection of Suspicious Behaviors for Safe Residence from Movement Trajectory Data. ISPRS International Journal of Geo-Information, 11(9), 478. https://doi.org/10.3390/ijgi11090478