
OSO-YOLOv5: Automatic Extraction Method of Store Signboards in Street View Images Based on Multi-Dimensional Analysis


Abstract
:1. Introduction
2. Methods
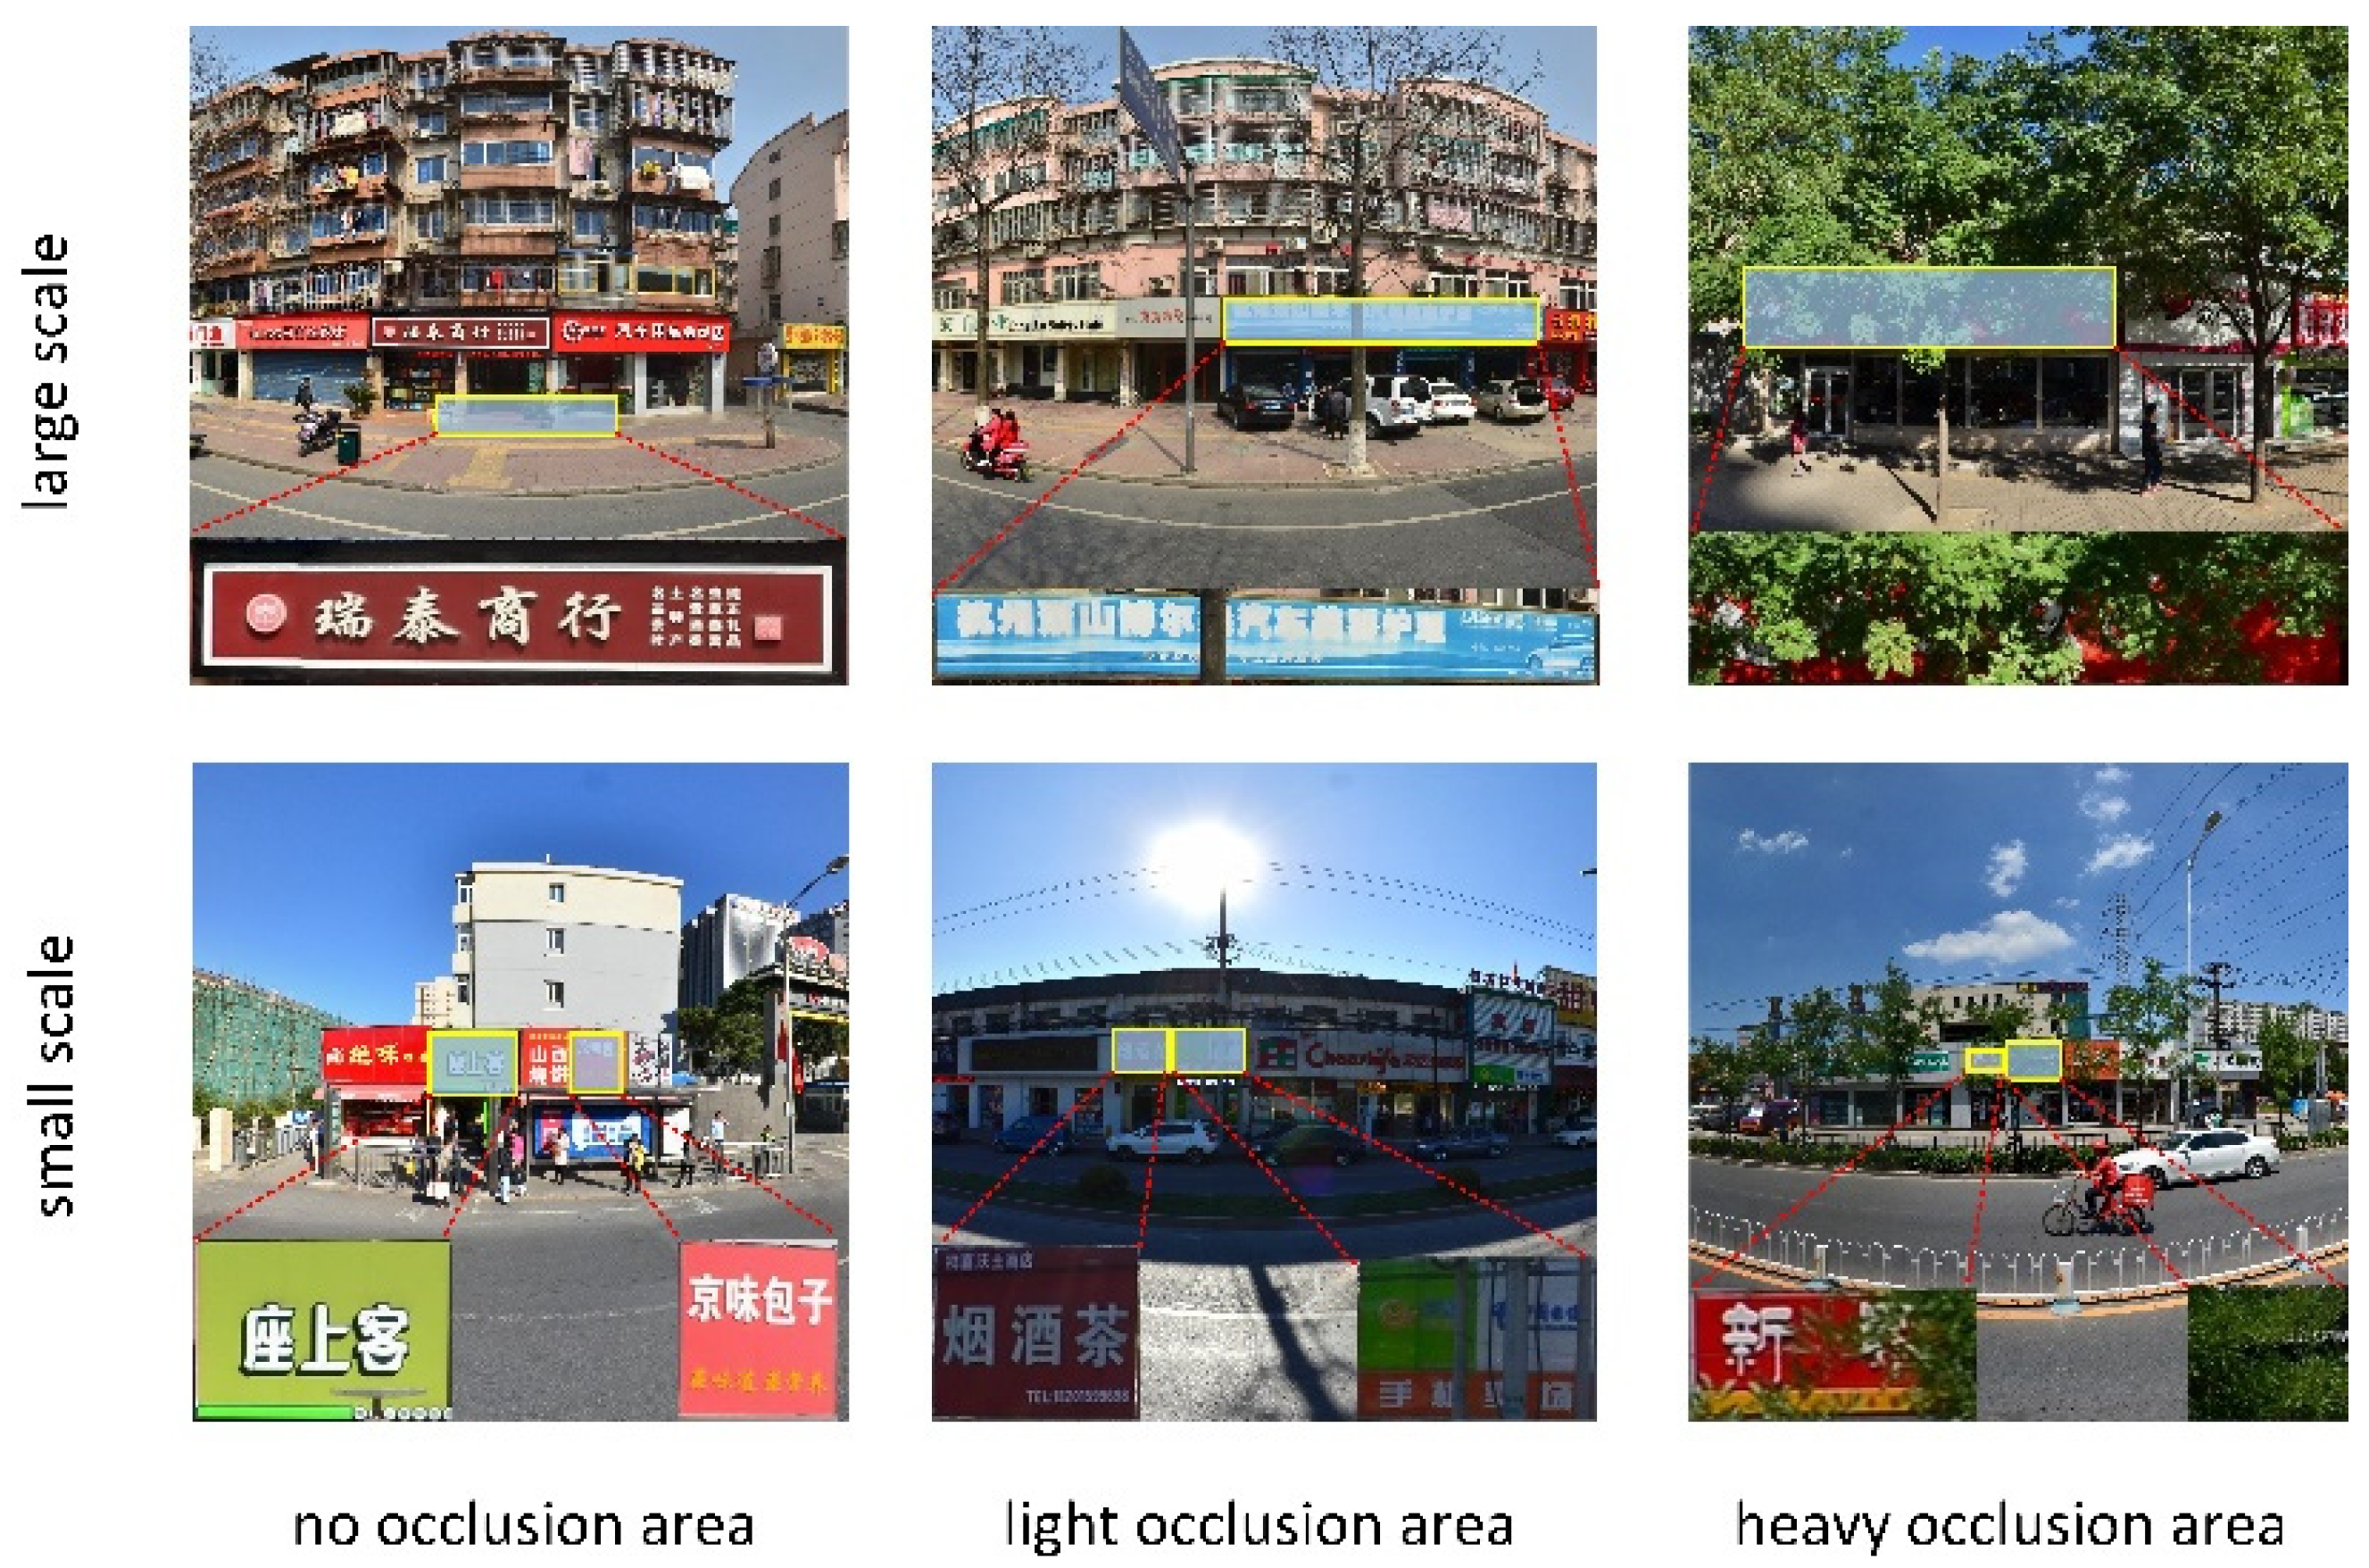
2.1. Visual Feature Analysis
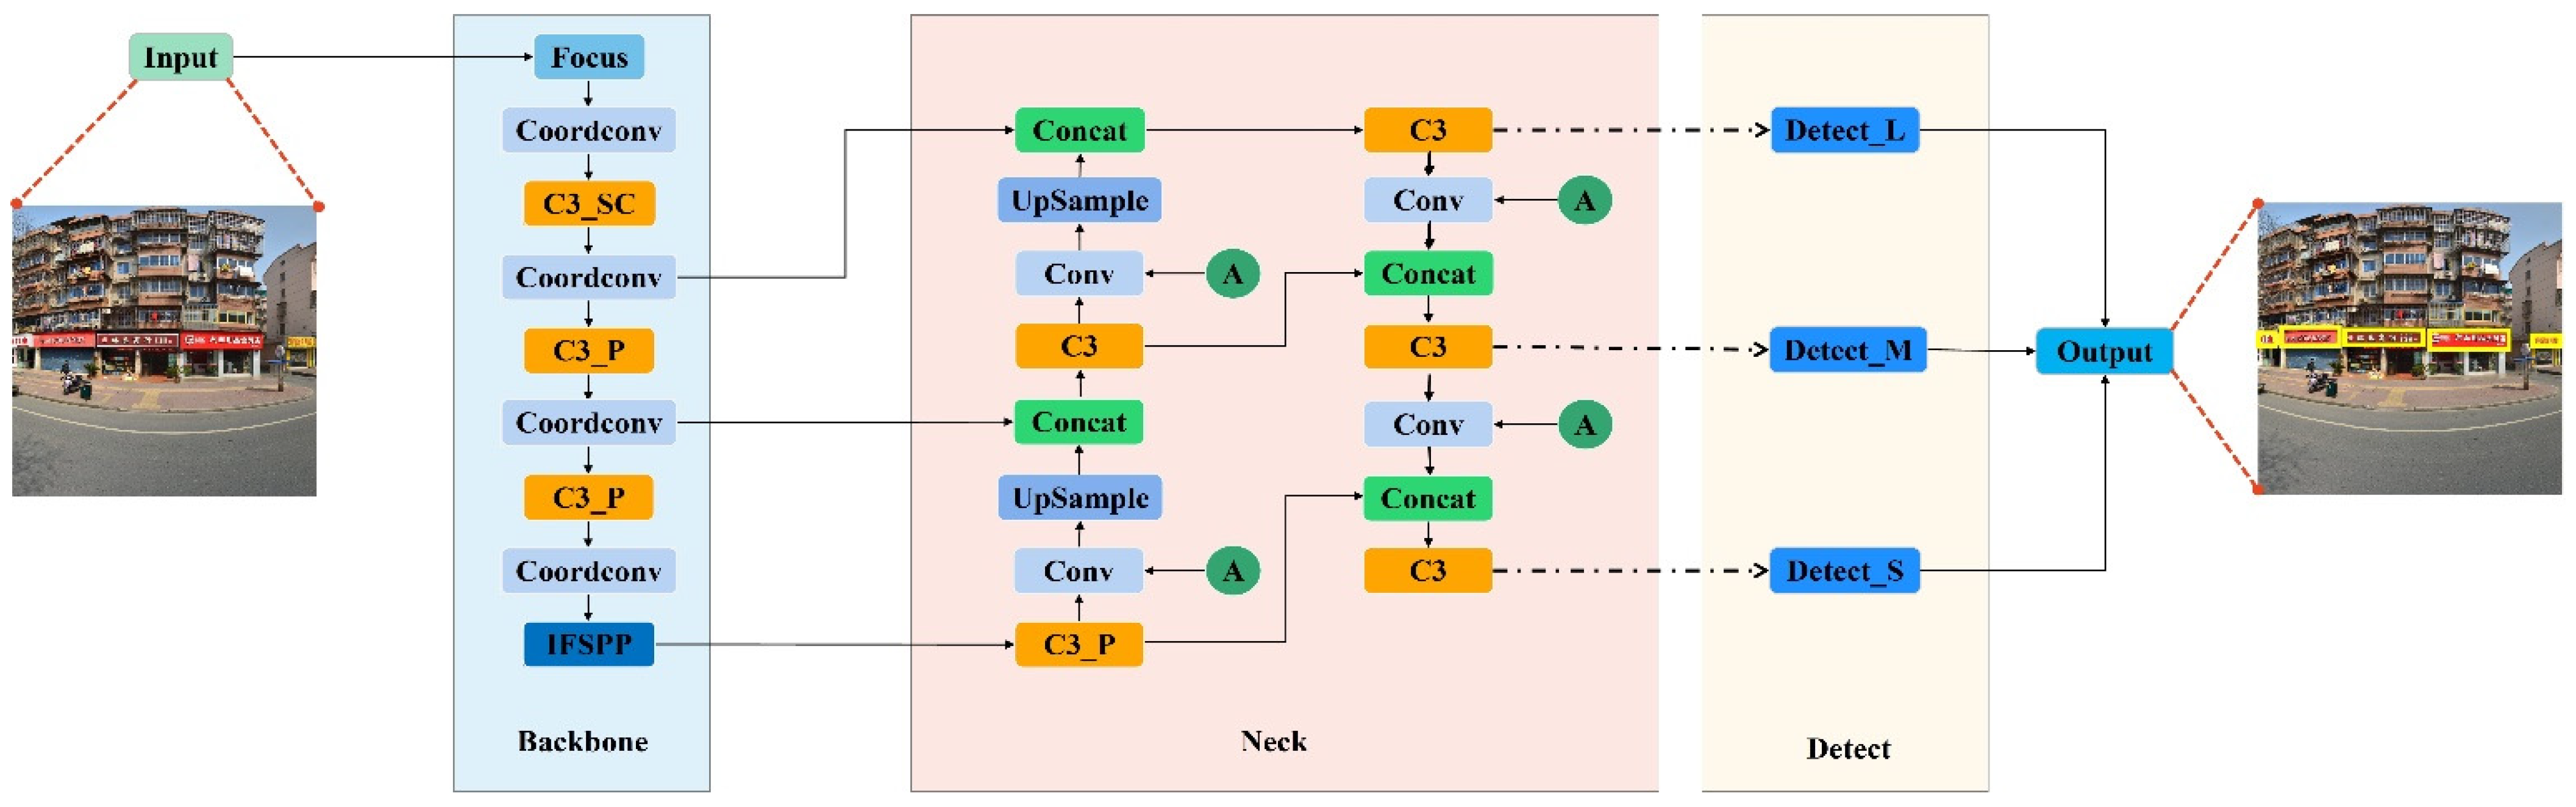
2.2. Proposed Model
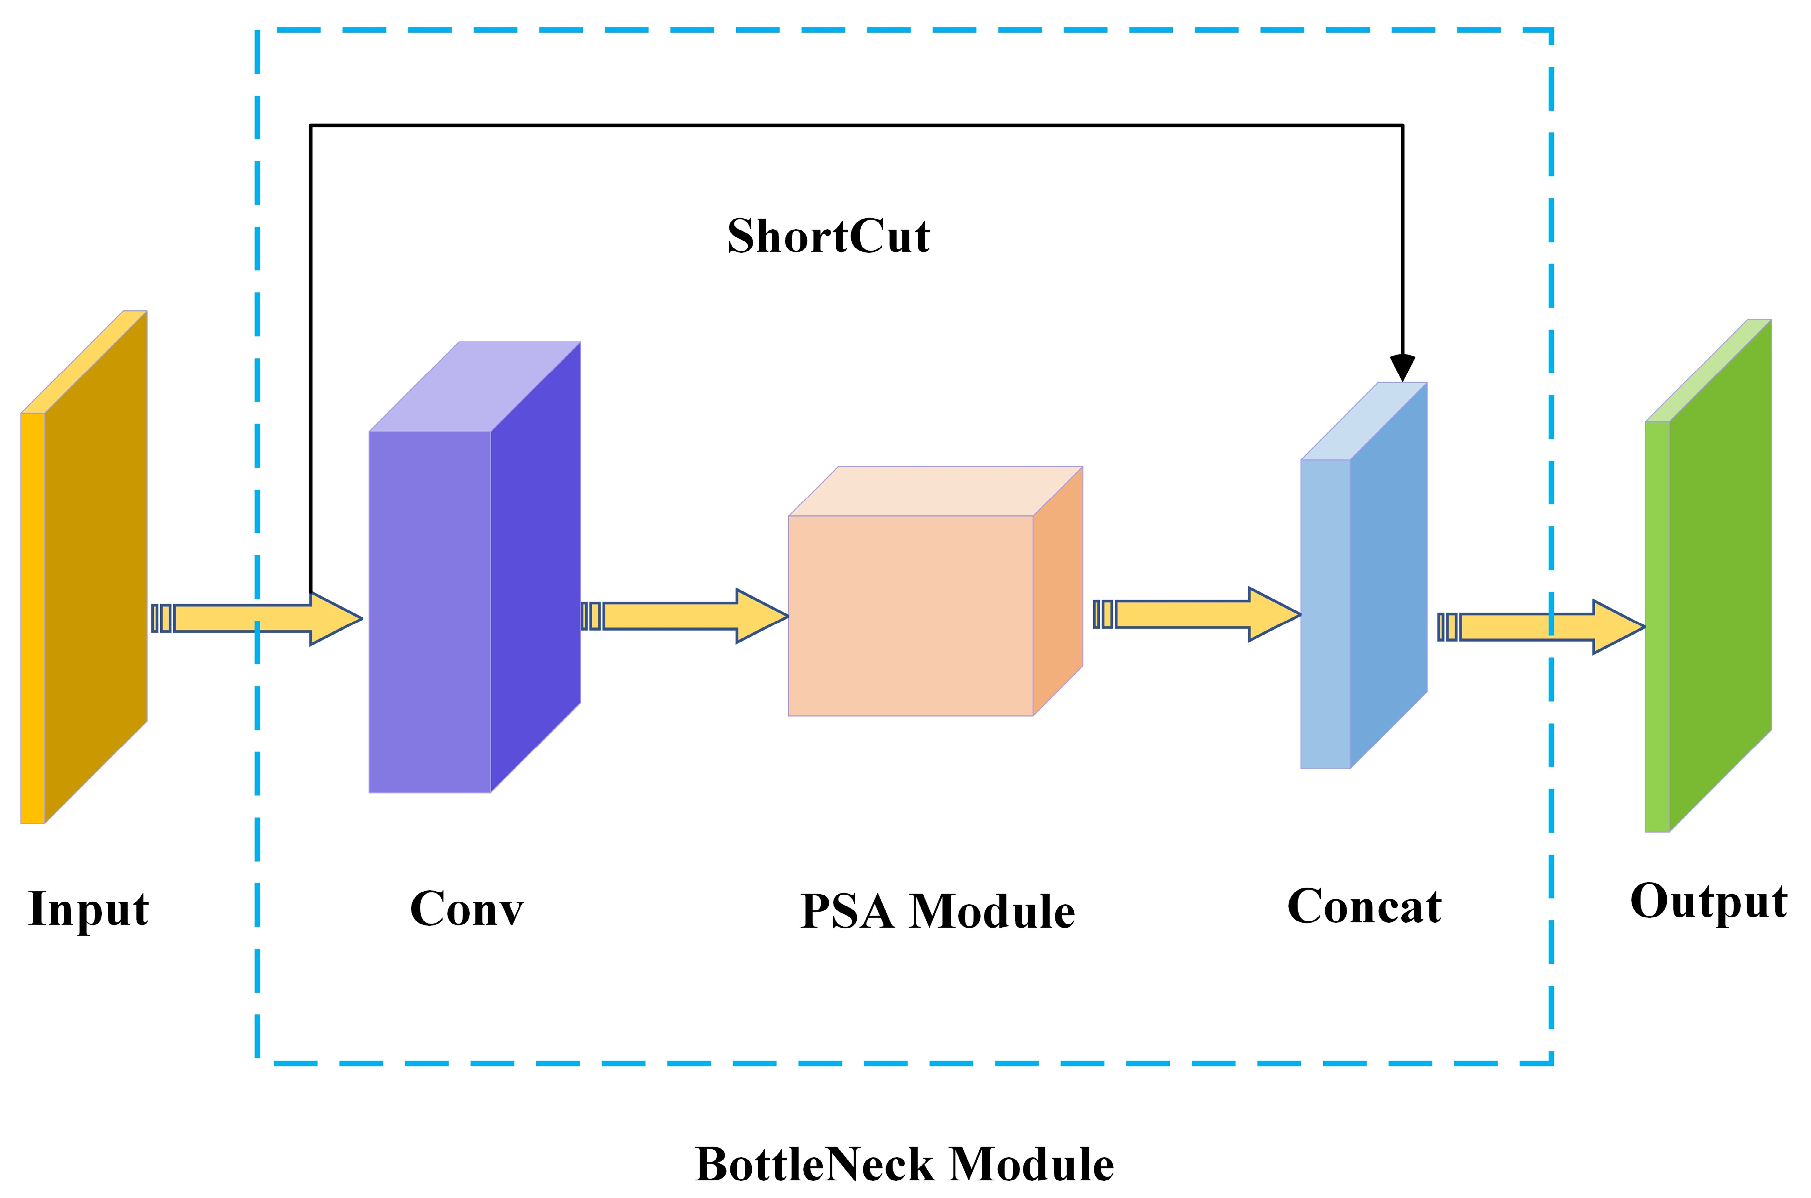
2.2.1. Improvements to the Backbone
- (1)
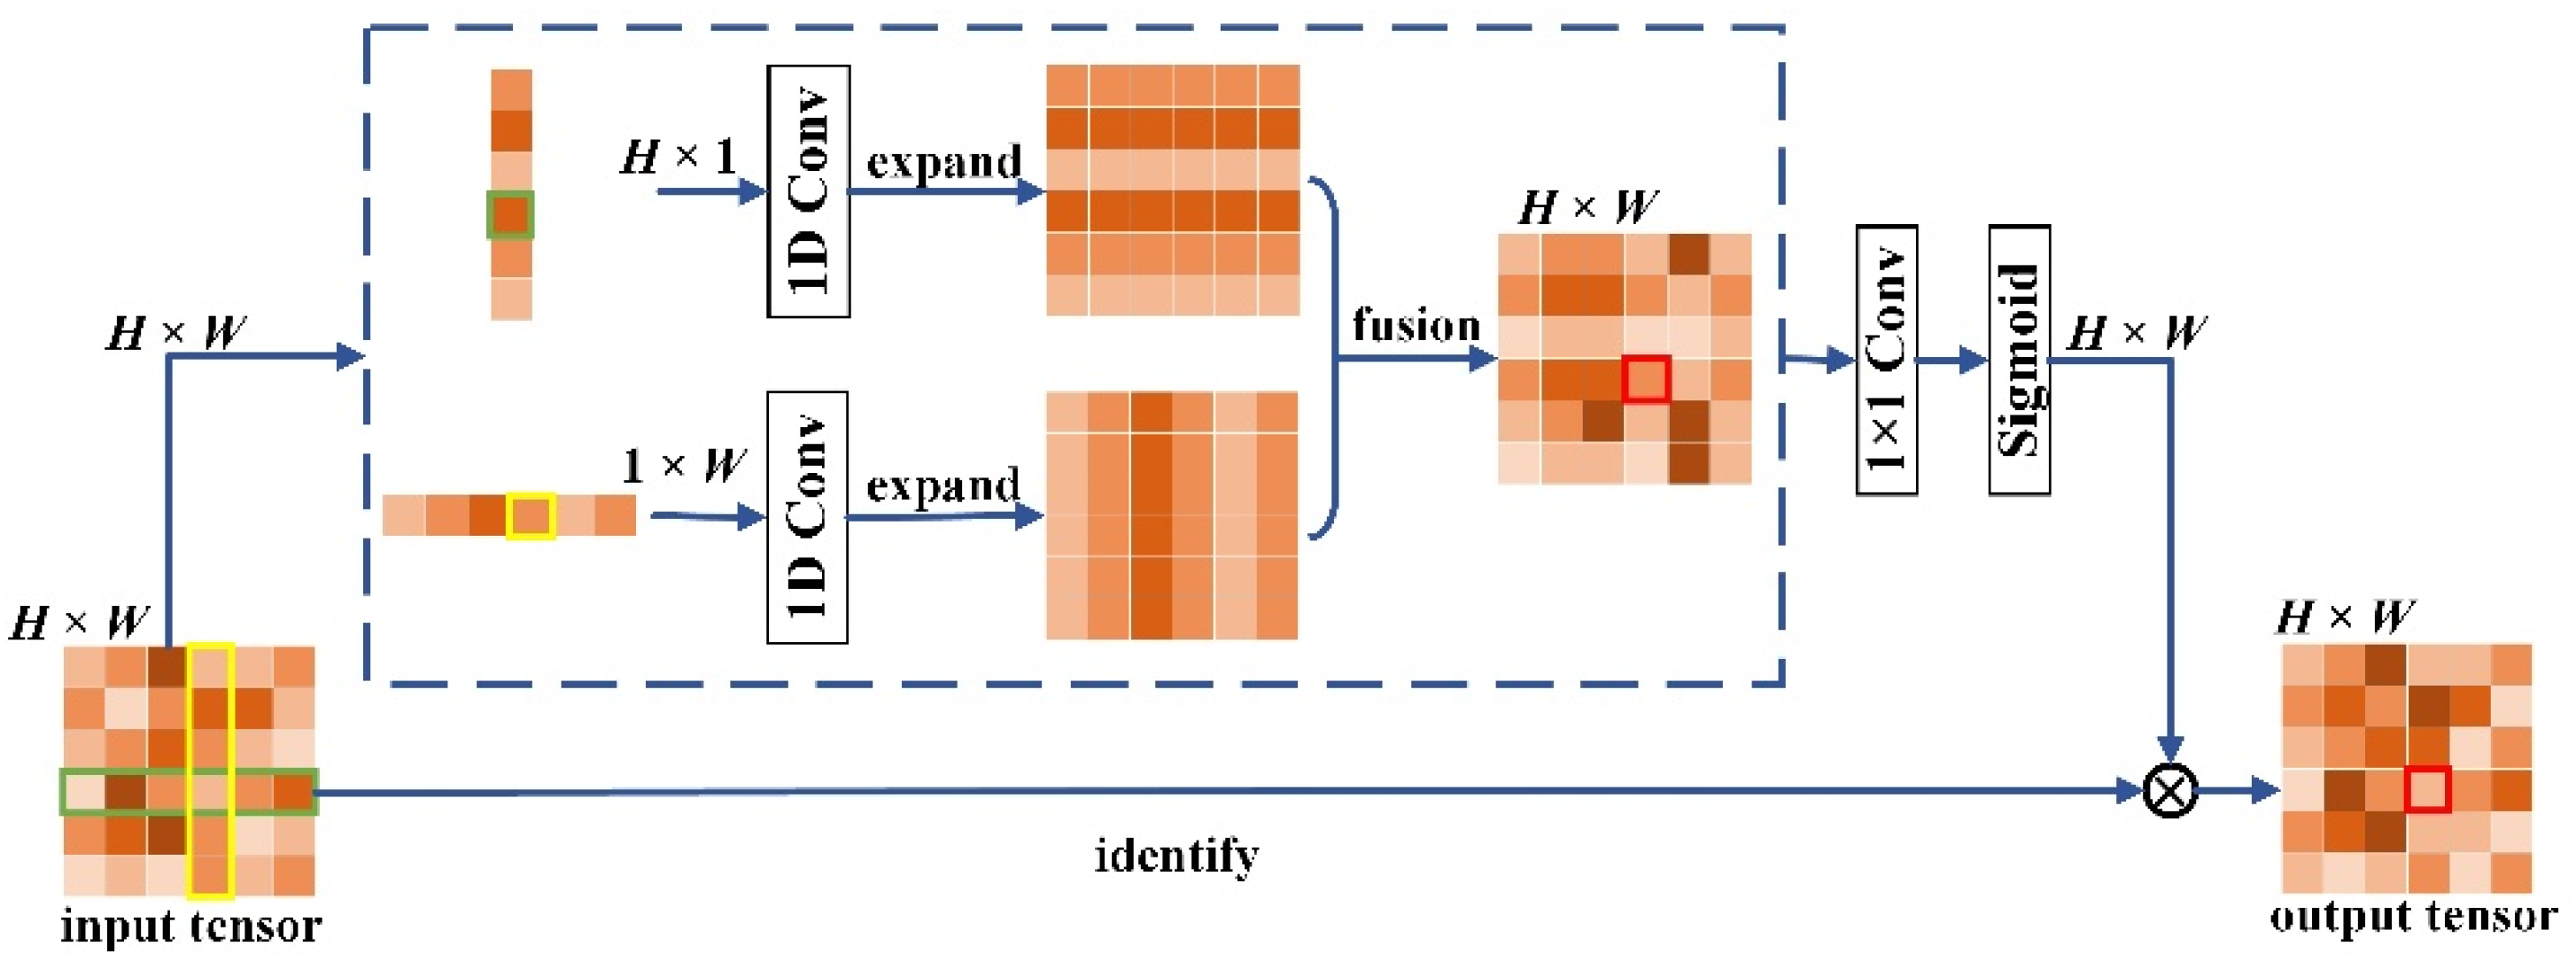
- Location Attention
- (2)
- Rectangular Feature Constraint
- (3)
- Topological Reconstruction
- (4)
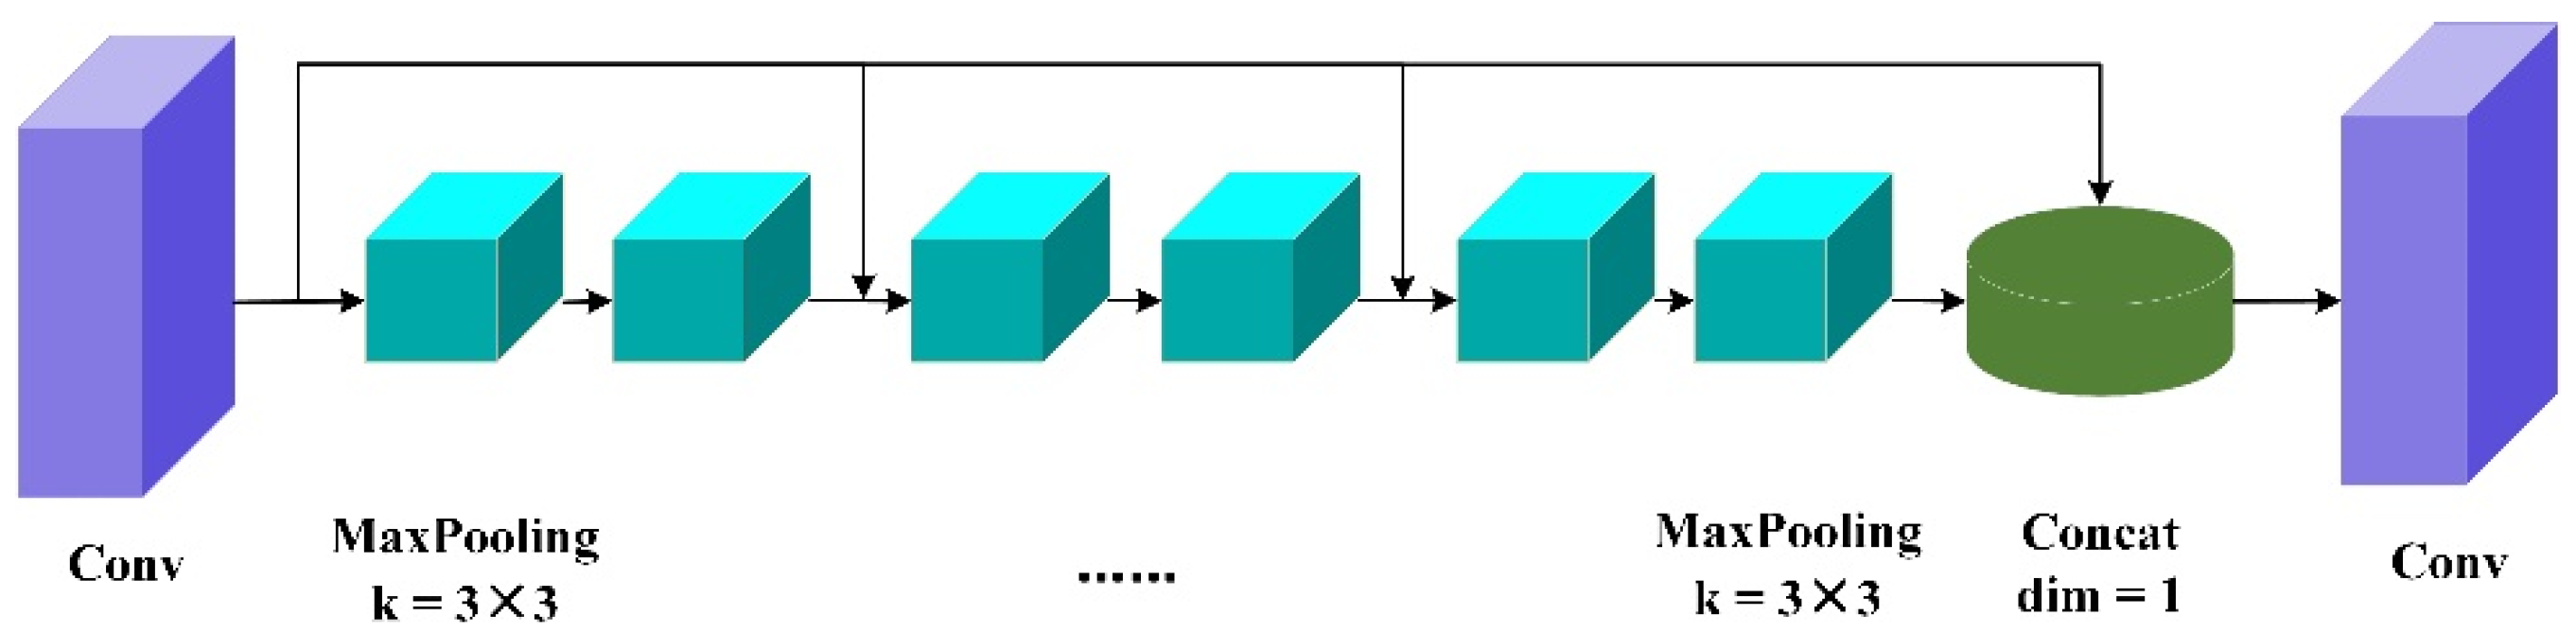
- Multi-Scale Information Extraction
- (5)
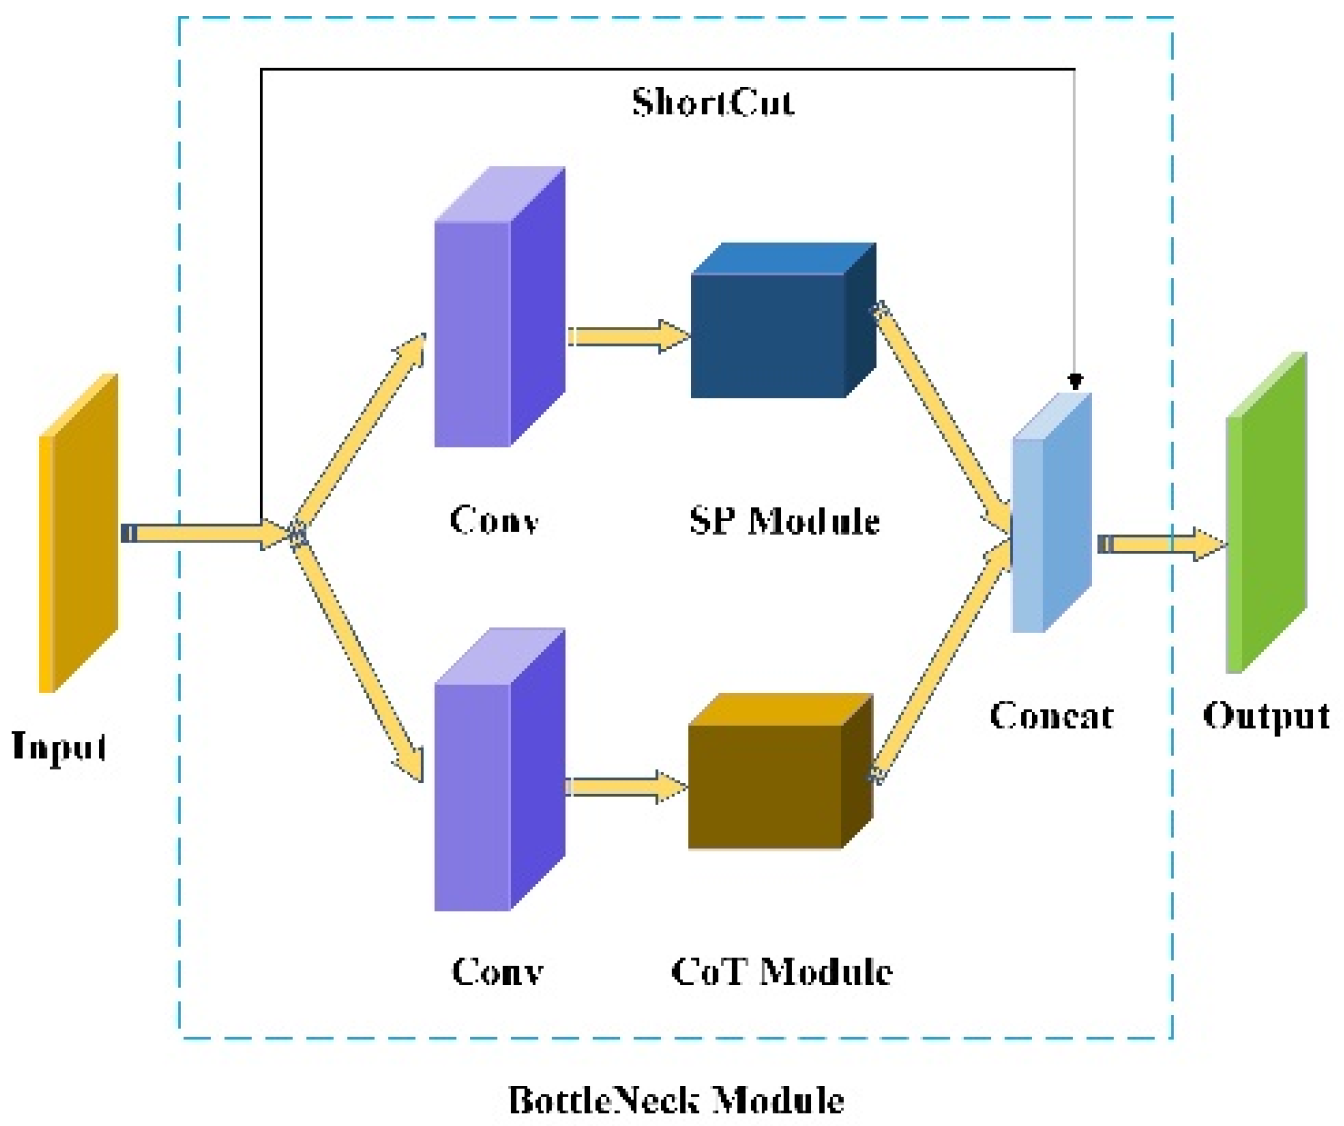
- Parallel Architecture Design
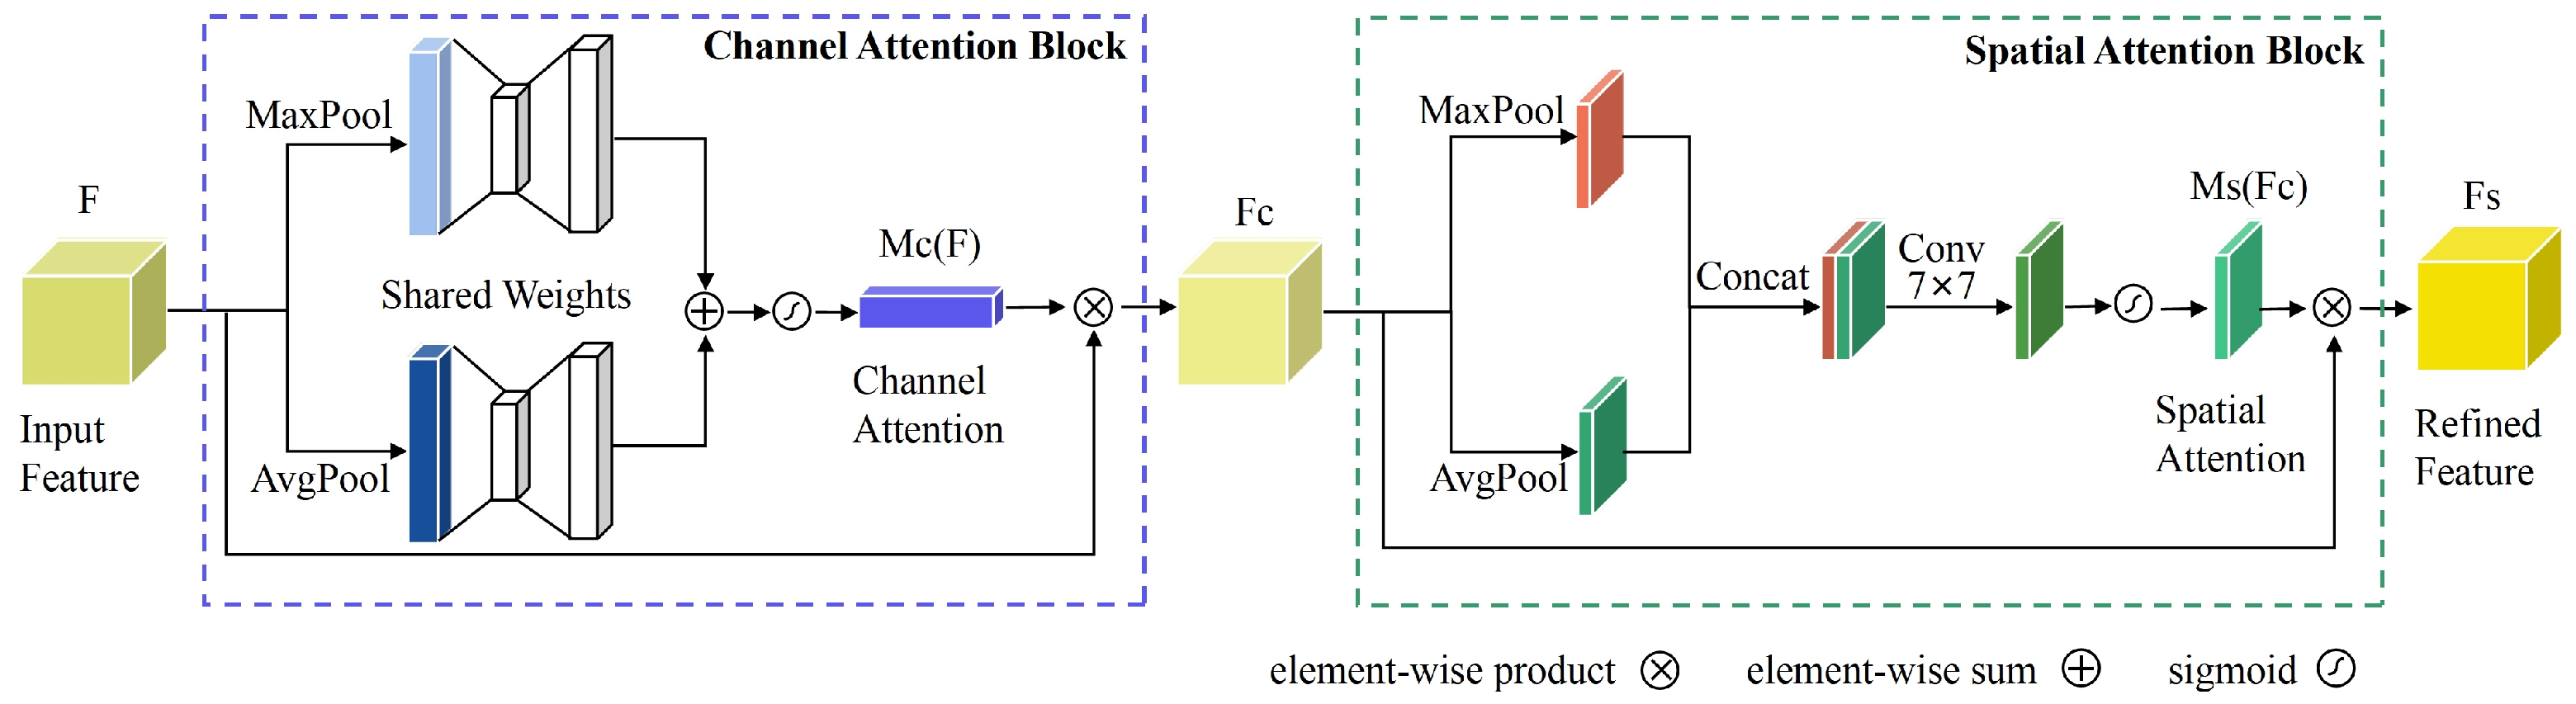
2.2.2. Improvements to the Neck
- (1)
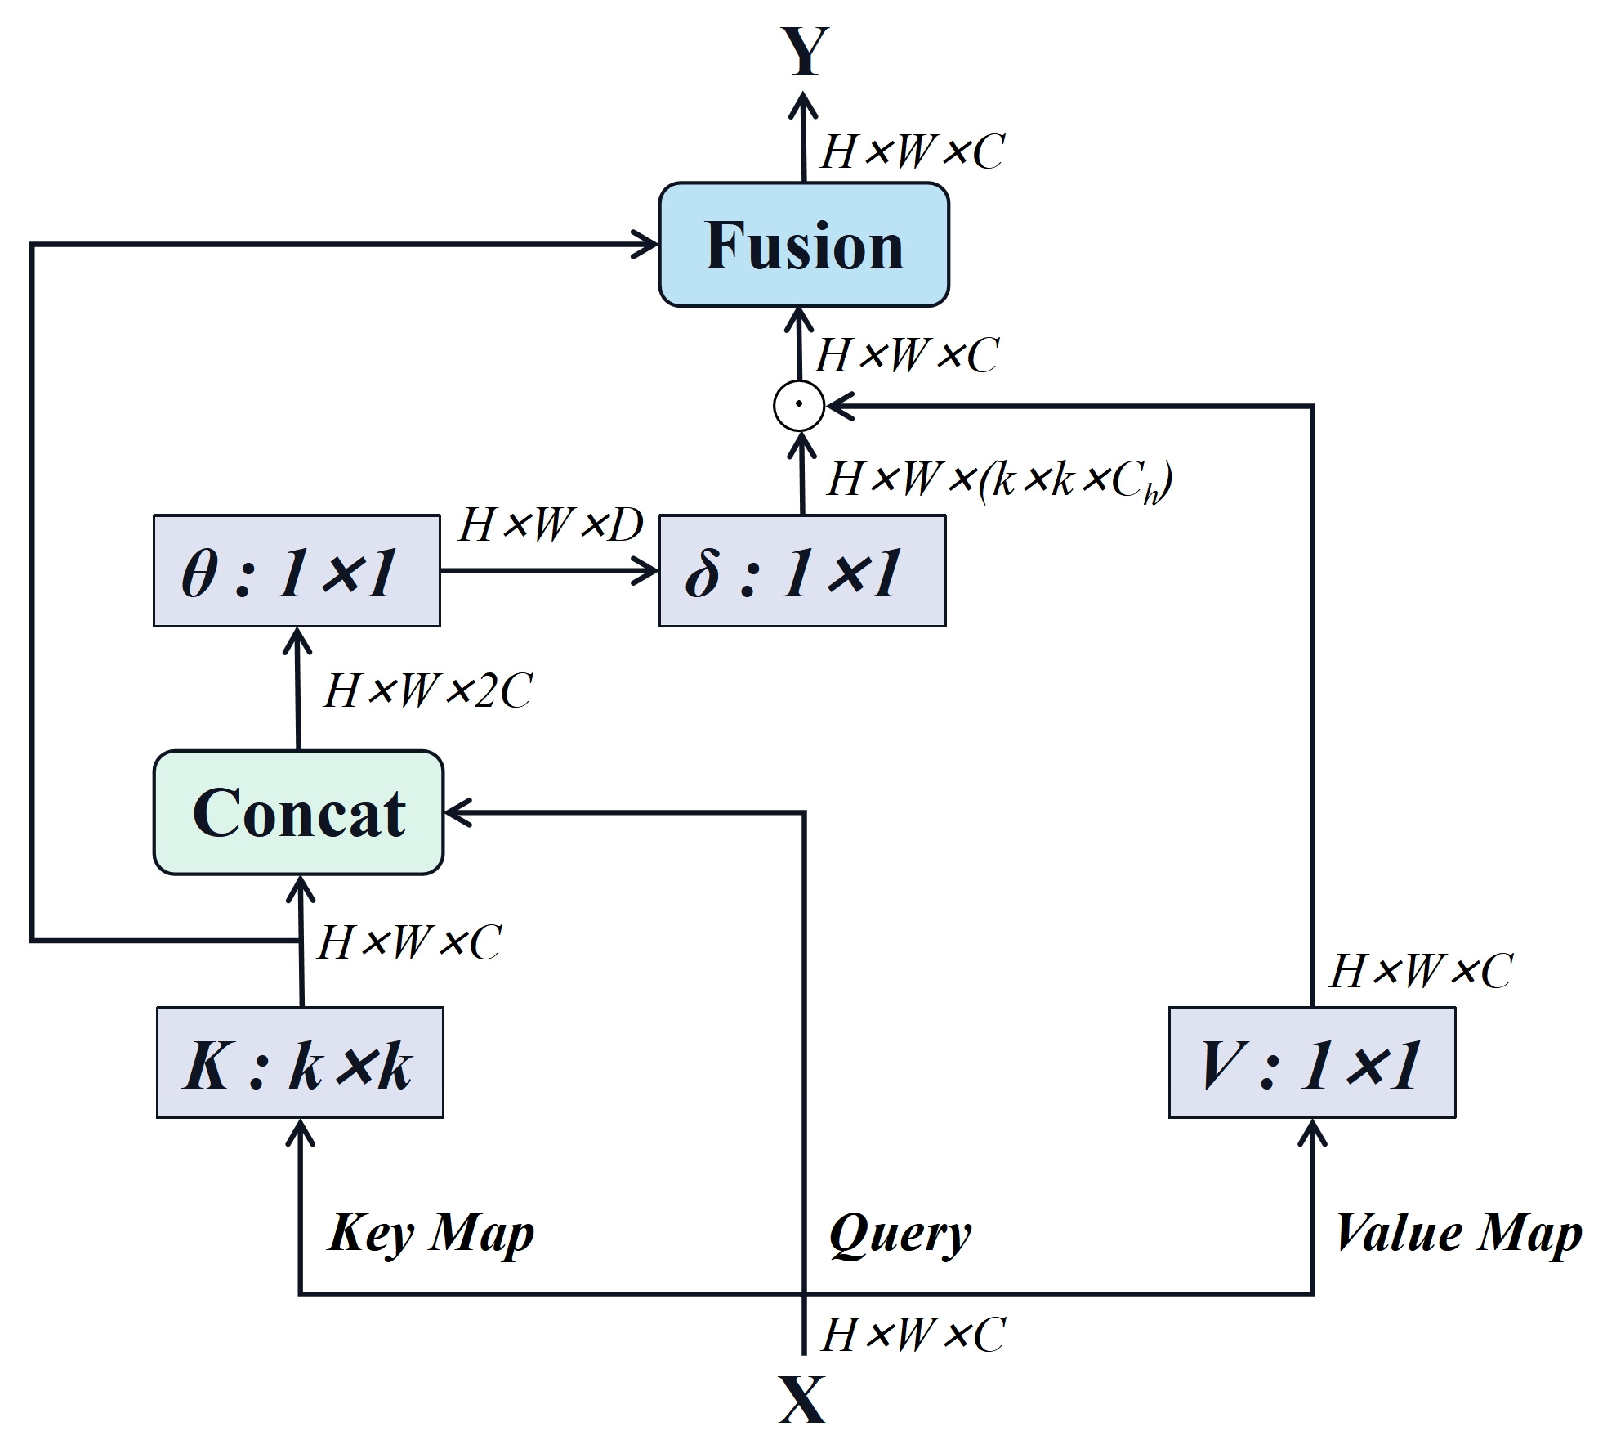
- Channel Attention Block
- (2)
- Spatial Attention Block
3. Results
3.1. Experimental Setup
3.1.1. Dataset Production
3.1.2. Network Training
3.1.3. Evaluation Indices
3.1.4. Comparison Method Selection
3.2. Experimental Results and Analysis
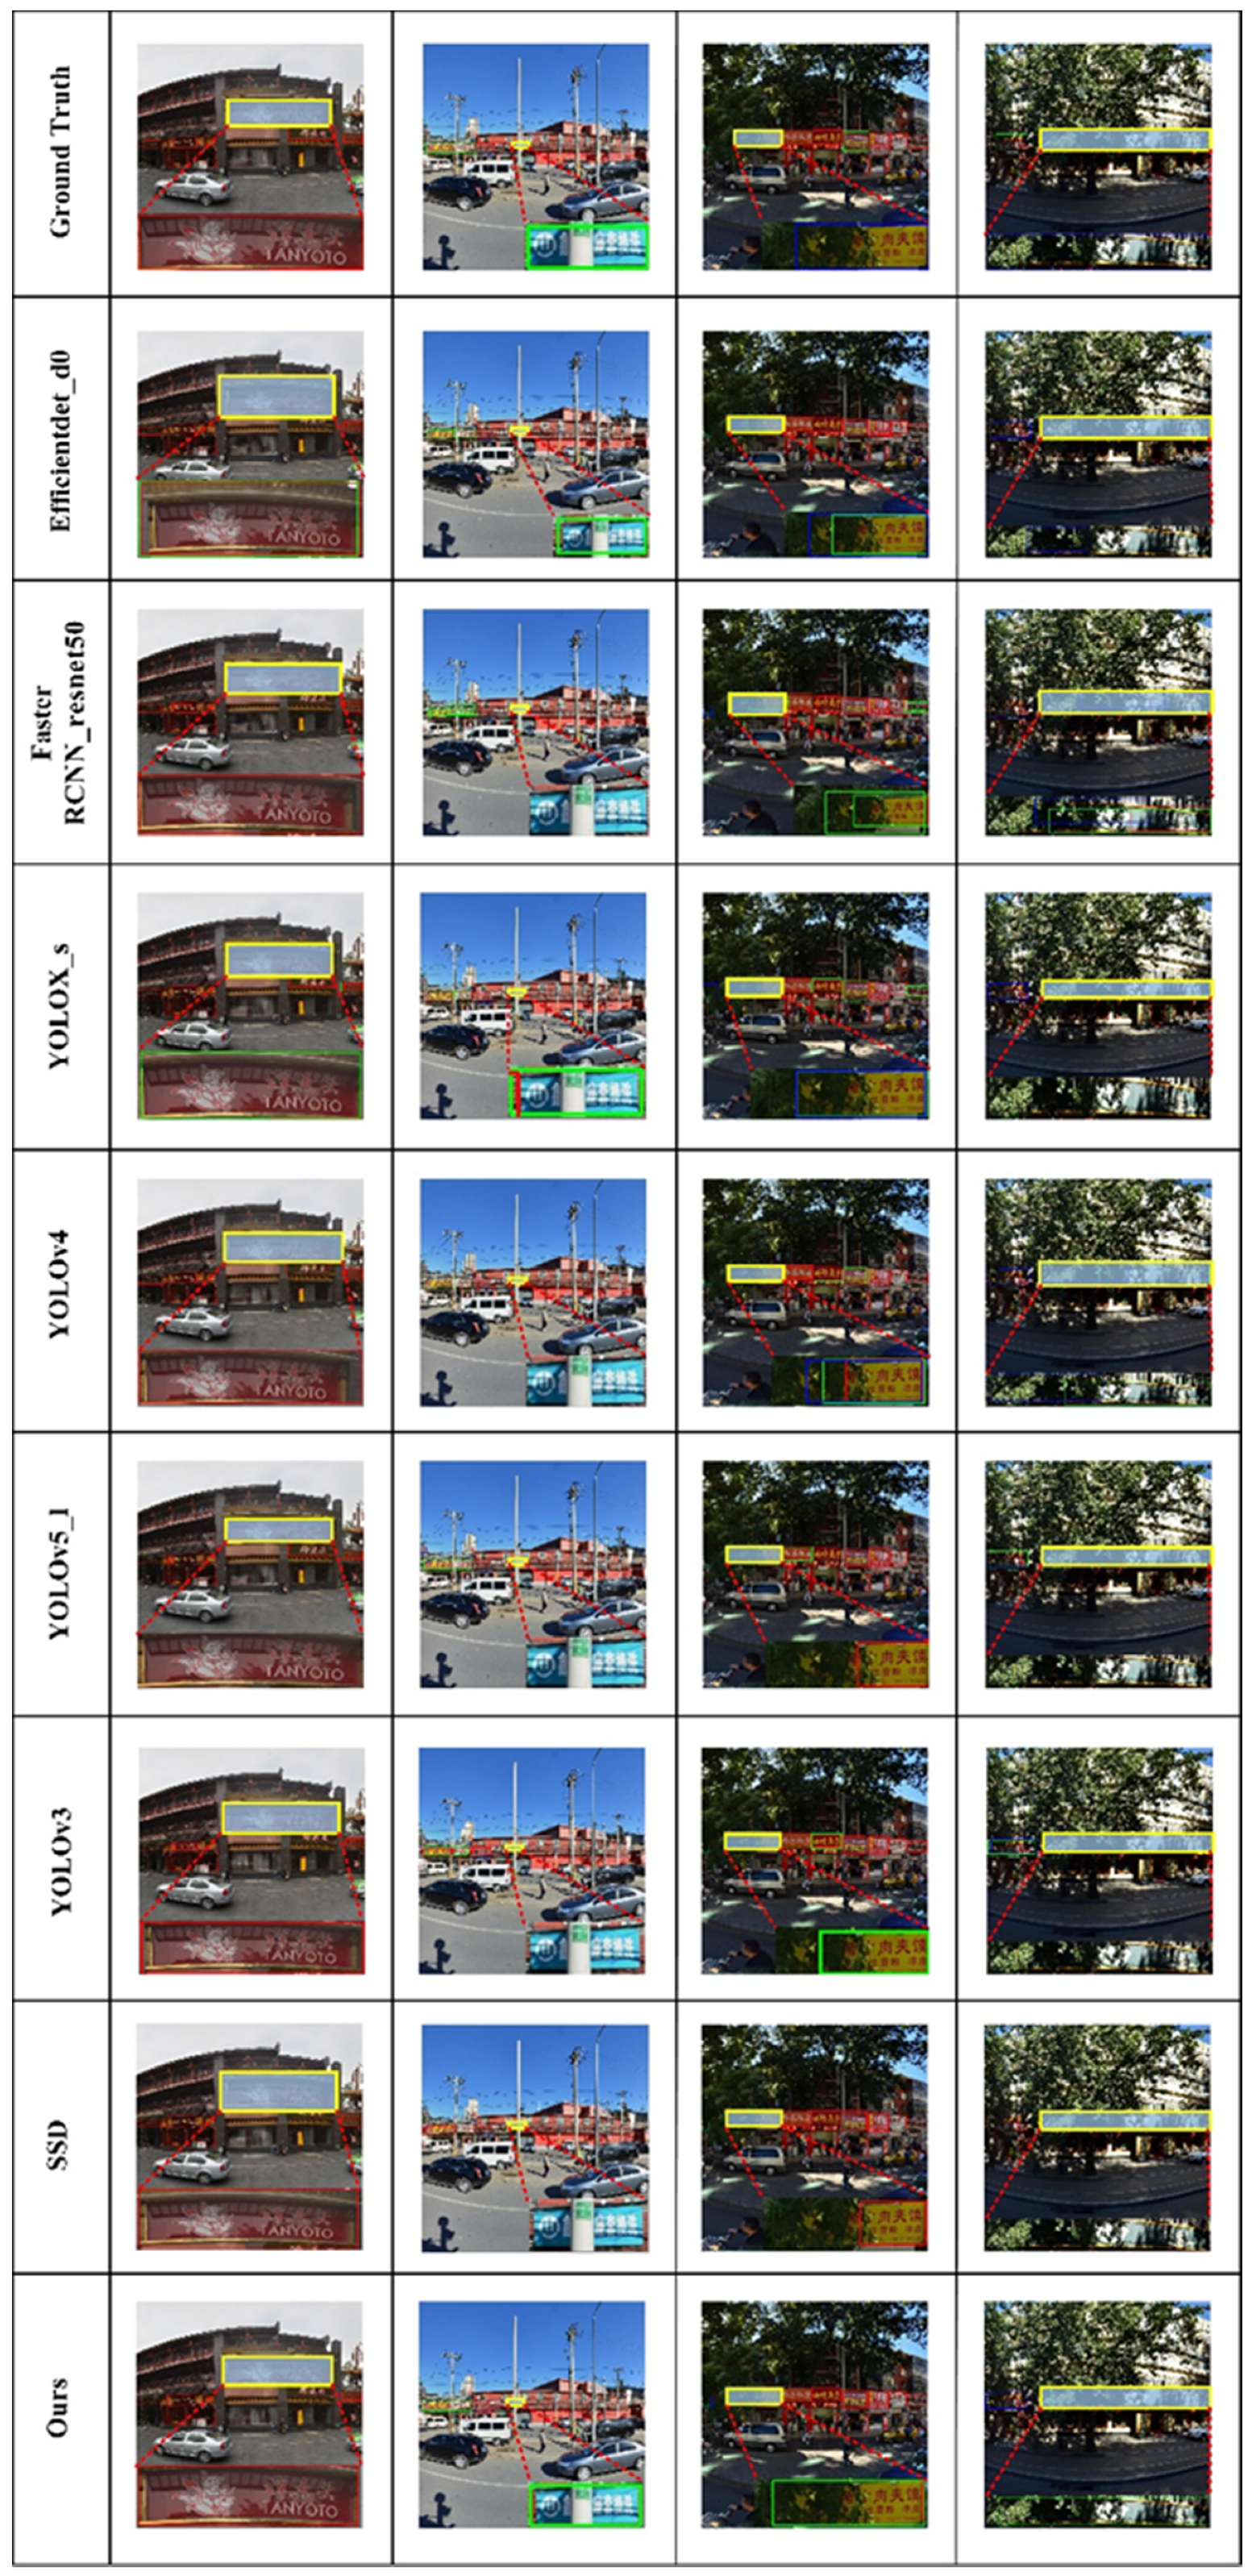
3.2.1. Comparative Experimental Results and Analysis
3.2.2. Results and Analysis for the Ablation Experiments
4. Conclusions
Author Contributions
Funding
Institutional Review Board Statement
Informed Consent Statement
Data Availability Statement
Acknowledgments
Conflicts of Interest
References
- Liu, G. Research on the Measurement of the Construction Level and Development Strategy of Yiyang Smart City Based on Principal Component Analysis. In Proceedings of the 2020 International Conference on Intelligent Transportation, Big Data & Smart City (ICITBS), Vientiane, Laos, 11–12 January 2020; pp. 176–180. [Google Scholar]
- Anguelov, D.; Dulong, C.; Filip, D.; Frueh, C.; Lafon, S.; Lyon, R.; Ogale, A.; Vincent, L.; Weaver, J. Google Street View: Capturing the World at Street Level. Computer 2010, 43, 32–38. [Google Scholar] [CrossRef]
- Balali, V.; Golparvar-Fard, M. Segmentation and recognition of roadway assets from car-mounted camera video streams using a scalable non-parametric image parsing method. Autom. Constr. 2015, 49, 27–39. [Google Scholar] [CrossRef]
- Campbell, A.; Both, A.; Sun, Q. Detecting and mapping traffic signs from Google Street View images using deep learning and GIS. Comput. Environ. Urban Syst. 2019, 77, 101350. [Google Scholar] [CrossRef]
- Zünd, D.; Bettencourt, L. Street View Imaging for Automated Assessments of Urban Infrastructure and Services. In Urban Informatics; Shi, W., Goodchild, M., Batty, M., Kwan, M., Zhang, A., Eds.; Springer: Singapore, 2021; pp. 29–40. [Google Scholar]
- Luo, H.; Yang, Y.; Tong, B.; Wu, F.; Fan, B. Traffic Sign Recognition Using a Multi-Task Convolutional Neural Network. IEEE Trans. Intell. Transp. Syst. 2018, 19, 1100–1111. [Google Scholar] [CrossRef]
- Zhou, L.; Shi, Y.; Zheng, J. Business Circle Identification and Spatiotemporal Characteristics in the Main Urban Area of Yiwu City Based on POI and Night-Time Light Data. Remote Sens. 2021, 13, 5153. [Google Scholar] [CrossRef]
- Soilán, M.; Riveiro, B.; Martínez-Sánchez, J.; Arias, P. Traffic sign detection in MLS acquired point clouds for geometric and image-based semantic inventory. ISPRS J. Photogramm. Remote Sens. 2016, 114, 92–101. [Google Scholar] [CrossRef]
- Maboudi, M.; Amini, J.; Hahn, M.; Saati, M. Road Network Extraction from VHR Satellite Images Using Context Aware Object Feature Integration and Tensor Voting. Remote Sens. 2016, 8, 637. [Google Scholar] [CrossRef]
- Patil, M.; Desai, C.; Umrikar, B. Image Classification Tool for Land Use/Land Cover Analysis: A Comparative Study of Maximum Likelihood and Minimum Distance Method. Int. J. Geol. Earth Environ. Sci. (JGEE) 2012, 2, 189–196. [Google Scholar]
- Zhao, Q.; Jia, S.; Li, Y. Hyperspectral remote sensing image classification based on tighter random projection with minimal intra-class variance algorithm. Pattern Recognit. 2021, 111, 107635. [Google Scholar] [CrossRef]
- Yang, J.; Gao, W.; Duan, X.; Hu, Y. Extraction of Building Information Based on Object-oriented Feature Automatic Selection. Remote Sens. Inf. 2020, 36, 130–135. [Google Scholar]
- Chen, C.; Yu, J.; Ling, Q. Sparse attention block: Aggregating contextual information for object detection. Pattern Recognit. 2022, 124, 108418. [Google Scholar] [CrossRef]
- Shahryari, S.; Hamilton, C. Neural Network-POMDP-Based Traffic Sign Classification under Weather Conditions. In Proceedings of the 29th Canadian Conference on Artificial Intelligence, Canadian AI 2016, Victoria, BC, Canada, May 31–June 3 2016; pp. 122–127. [Google Scholar]
- Wali, S.B.; Abdullah, M.A.; Hannan, M.A.; Hussain, A.; Samad, S.A.; Ker, P.J.; Bin Mansor, M. Vision-Based Traffic Sign Detection and Recognition Systems: Current Trends and Challenges. Sensors 2019, 19, 2093. [Google Scholar] [CrossRef] [PubMed] [Green Version]
- Li, H.; Sun, F.; Liu, L.; Wang, L. A novel traffic sign detection method via color segmentation and robust shape matching. Neurocomputing 2015, 169, 77–88. [Google Scholar] [CrossRef]
- Fleyeh, H. Shadow and Highlight Invariant Colour Segmentation Algorithm for Traffic Signs. In Proceedings of the 2006 IEEE Conference on Cybernetics and Intelligent Systems, Taipei, Taiwan, 7–9 June 2006; pp. 1–7. [Google Scholar]
- Farhat, W.; Faiedh, H.; Souani, C.; Besbes, K. Real-time embedded system for traffic sign recognition based on ZedBoard. J. Real-Time Image Process. 2019, 16, 1813–1823. [Google Scholar] [CrossRef]
- Liu, C.; Li, S.; Chang, F.; Wang, Y. Machine Vision Based Traffic Sign Detection Methods: Review, Analyses and Perspectives. IEEE Access 2019, 7, 86578–86596. [Google Scholar] [CrossRef]
- Krizhevsky, A.; Sutskever, I.; Hinton, G.E. ImageNet classification with deep convolutional neural networks. Commun. ACM 2017, 60, 84–90. [Google Scholar] [CrossRef]
- Broni-Bediako, C.; Murata, Y.; Mormille, L.H.B.; Atsumi, M. Searching for CNN Architectures for Remote Sensing Scene Classification. IEEE Trans. Geosci. Remote Sens. 2022, 60, 1–13. [Google Scholar] [CrossRef]
- Dong, Z.; Wang, M.; Wang, Y.; Zhu, Y.; Zhang, Z. Object Detection in High Resolution Remote Sensing Imagery Based on Convolutional Neural Networks with Suitable Object Scale Features. IEEE Trans. Geosci. Remote Sens. 2020, 58, 2104–2114. [Google Scholar] [CrossRef]
- Haq, M.A.; Rahaman, G.; Baral, P.; Ghosh, A. Deep Learning Based Supervised Image Classification Using UAV Images for Forest Areas Classification. J. Indian Soc. Remote Sens. 2021, 49, 601–606. [Google Scholar] [CrossRef]
- Zhu, X.X.; Tuia, D.; Mou, L.; Xia, G.-S.; Zhang, L.; Xu, F.; Fraundorfer, F. Deep Learning in Remote Sensing: A Comprehensive Review and List of Resources. IEEE Geosci. Remote Sens. Mag. 2017, 5, 8–36. [Google Scholar] [CrossRef]
- Cheng, G.; Yang, C.; Yao, X.; Guo, L.; Han, J. When Deep Learning Meets Metric Learning: Remote Sensing Image Scene Classification via Learning Discriminative CNNs. IEEE Trans. Geosci. Remote Sens. 2018, 56, 2811–2821. [Google Scholar] [CrossRef]
- Long, J.; Shelhamer, E.; Darrell, T. Fully convolutional networks for semantic segmentation. In Proceedings of the 2015 IEEE Conference on Computer Vision and Pattern Recognition (CVPR), Boston, MA, USA, 7–12 June 2015; pp. 3431–3440. [Google Scholar]
- Han, X.; Lu, J.; Zhao, C.; Li, H. Fully Convolutional Neural Networks for Road Detection with Multiple Cues Integration. In Proceedings of the 2018 IEEE International Conference on Robotics and Automation (ICRA), Brisbane, QLD, Australia, 21–25 May 2018; pp. 4608–4613. [Google Scholar]
- Zhang, P.; Liu, W.; Lei, Y.; Wang, H.; Lu, H. Deep Multiphase Level Set for Scene Parsing. IEEE Trans. Image Process. 2020, 29, 4556–4567. [Google Scholar] [CrossRef] [Green Version]
- Chen, L.; Papandreou, G.; Schroff, F.; Adam, H. Rethinking Atrous Convolution for Semantic Image Segmentation. arXiv 2017, arXiv:1706.05587v3. [Google Scholar]
- Cheng, B.; Collins, M.D.; Zhu, Y.; Liu, T.; Huang, T.S.; Adam, H.; Chen, L.C. Panoptic-DeepLab: A Simple, Strong and Fast Baseline for Bottom-Up Panoptic Segmentation. In Proceedings of the 2020 IEEE/CVF Conference on Computer Vision and Pattern Recognition (CVPR), Seattle, WA, USA, 13–19 June 2020; pp. 12472–12482. [Google Scholar]
- Li, Z.; Chen, X.; Jiang, J.; Han, Z.; Li, Z.; Fang, T.; Huo, H.; Li, Q.; Liu, M. Cascaded Multiscale Structure with Self-Smoothing Atrous Convolution for Semantic Segmentation. IEEE Trans. Geosci. Remote Sens. 2022, 60, 1–13. [Google Scholar] [CrossRef]
- Ronneberger, O.; Fischer, P.; Brox, T. U-Net: Convolutional Networks for Biomedical Image Segmentation. In Proceedings of the Medical Image Computing and Computer-Assisted Intervention—MICCAI 2015, Munich, Germany, 5–9 October 2015; pp. 234–241. [Google Scholar]
- Zhang, Z.; Liu, Q.; Wang, Y. Road Extraction by Deep Residual U-Net. IEEE Geosci. Remote Sens. Lett. 2018, 15, 749–753. [Google Scholar] [CrossRef]
- Diakogiannis, F.I.; Waldner, F.; Caccetta, P.; Wu, C. ResUNet-a: A deep learning framework for semantic segmentation of remotely sensed data. ISPRS J. Photogramm. Remote Sens. 2020, 162, 94–114. [Google Scholar] [CrossRef]
- Zhao, W.; Persello, C.; Stein, A. Building outline delineation: From aerial images to polygons with an improved end-to-end learning framework. ISPRS J. Photogramm. Remote Sens. 2021, 175, 119–131. [Google Scholar] [CrossRef]
- Hossari, M.; Dev, S.; Nicholson, M.; McCabe, K.; Nautiyal, A.; Conran, C.; Tang, J.; Xu, W.; Pitié, F. ADNet: A Deep Network for Detecting Adverts. arXiv 2018, arXiv:1811.04115v1. [Google Scholar]
- Dev, S.; Hossari, M.; Nicholson, M.; McCabe, K.; Nautiyal, A.; Conran, C.; Tang, J. The CASE Dataset of Candidate Spaces for Advert Implantation. In Proceedings of the 2019 16th International Conference on Machine Vision Applications (MVA), Tokyo, Japan, 27–31 May 2019; pp. 1–4. [Google Scholar]
- Xu, X.; Ma, Y.; Qian, X.; Zhang, Y. Scale-aware Efficient Det: Real-time pedestrian detection algorithm for automated driving. J. Image Graph. 2021, 26, 93–100. [Google Scholar] [CrossRef]
- Morera, A.; Sanchez, A.; Moreno, A.B.; Sappa, A.; Vélez, J. SSD vs. YOLO for Detection of Outdoor Urban Advertising Panels under Multiple Variabilities. Sensors 2020, 20, 4587. [Google Scholar] [CrossRef]
- Wang, G.; Zhuang, Y.; Chen, H.; Liu, X.; Zhang, T.; Li, L.; Dong, S.; Sang, Q. FSoD-Net: Full-Scale Object Detection from Optical Remote Sensing Imagery. IEEE Trans. Geosci. Remote Sens. 2022, 60, 1–18. [Google Scholar] [CrossRef]
- Hu, H.; Wang, L.; Zhang, M.; Ding, Y.; Zhu, Q. Fast and Regularized Reconstruction of Building Façades from Street-View Images Using Binary Integer Programming. arXiv 2020, arXiv:2002.08549v3. [Google Scholar] [CrossRef]
- Lee, J.; Hong, J.; Park, G.; Kim, H.S.; Lee, S.; Seo, T. Contaminated Facade Identification Using Convolutional Neural Network and Image Processing. IEEE Access 2020, 8, 180010–180021. [Google Scholar] [CrossRef]
- Wu, W.; Yin, Y.; Wang, X.; Xu, D. Face Detection with Different Scales Based on Faster R-CNN. IEEE Trans. Cybern. 2019, 49, 4017–4028. [Google Scholar] [CrossRef] [PubMed]
- Liu, W.; Wu, Z.; Luo, J.; Sun, Y.; Wu, T.; Zhou, N.; Hu, X.; Wang, L.; Zhou, Z. A divided and stratified extraction method of high-resolution remote sensing information for cropland in hilly and mountainous areas based on deep learning. Acta Geod. Cartogr. Sin. 2021, 50, 105–116. [Google Scholar] [CrossRef]
- Ultralytics Yolov5. Available online: https://github.com/ultralytics/yolov5 (accessed on 18 May 2020).
- Urtasun, R.; Mottaghi, R.; Liu, X.; Cho, N.-g.; Lee, S.-w. The Role of Context for Object Detection and Semantic Segmentation in the Wild. In Proceedings of the 2014 IEEE Conference on Computer Vision and Pattern Recognition(CVPR), Columbus, OH, USA, 23–28 June 2014; pp. 891–898. [Google Scholar]
- Liu, R.; Lehman, J.; Molino, P.; Petroski Such, F.; Frank, E.; Sergeev, A.; Yosinski, J. An Intriguing Failing of Convolutional Neural Networks and the CoordConv Solution. arXiv 2018, arXiv:1807.03247v2. [Google Scholar]
- Hou, Q.; Zhang, L.; Cheng, M.M.; Feng, J. Strip Pooling: Rethinking Spatial Pooling for Scene Parsing. In Proceedings of the 2020 IEEE/CVF Conference on Computer Vision and Pattern Recognition (CVPR), Seattle, WA, USA, 13–19 June 2020; pp. 4002–4011. [Google Scholar]
- Bello, I.; Zoph, B.; Le, Q.; Vaswani, A.; Shlens, J. Attention Augmented Convolutional Networks. In Proceedings of the 2019 IEEE/CVF International Conference on Computer Vision (ICCV), Seattle, WA, USA, 27 October–2 November 2019; pp. 3285–3294. [Google Scholar]
- Zhang, H.; Zu, K.; Lu, J.; Zou, Y.; Meng, D. EPSANet: An Efficient Pyramid Squeeze Attention Block on Convolutional Neural Network. arXiv 2021, arXiv:2105.14447v2. [Google Scholar]
- Liu, W.; Anguelov, D.; Erhan, D.; Szegedy, C.; Reed, S.; Fu, C.Y.; Berg, A.C. SSD: Single Shot MultiBox Detector. In Proceedings of the Computer Vision—ECCV 2016, Amsterdam, The Netherlands, 11–14 October 2016; pp. 21–37. [Google Scholar]
- Goyal, A.; Bochkovskiy, A.; Deng, J.; Koltun, V. Non-Deep Networks. arXiv 2021, arXiv:2110.07641v1. [Google Scholar]
- Chen, Y.; Kalantidis, Y.; Li, J.; Yan, S.; Feng, J. A2-Nets: Double Attention Networks. In Proceedings of the Advances in Neural Information Processing Systems 31: Annual Conference on Neural Information Processing Systems 2018, NeurIPS 2018, Montréal, QC, Canada, 3–8 December 2018; pp. 350–359. [Google Scholar]
- Wang, Q.; Wu, B.; Zhu, P.; Li, P.; Zuo, W.; Hu, Q. ECA-Net: Efficient Channel Attention for Deep Convolutional Neural Networks. In Proceedings of the 2020 IEEE/CVF Conference on Computer Vision and Pattern Recognition (CVPR), Seattle, WA, USA, 13–19 June 2020; pp. 11531–11539. [Google Scholar]
- Woo, S.; Park, J.; Lee, J.-Y.; Kweon, I.S. CBAM: Convolutional Block Attention Module. In Proceedings of the Computer Vision—ECCV 2018, Munich, Germany, 8–14 September 2018; pp. 3–19. [Google Scholar]
- Yuan, T.; Zhu, Z.; Xu, K.; Li, C.; Hu, S. Chinese Text in the Wild. arXiv 2018, arXiv:1803.00085v1. [Google Scholar]
- Lawal, M.O. Tomato detection based on modified YOLOv3 framework. Sci. Rep. 2021, 11, 1447. [Google Scholar] [CrossRef]
- Kong, G.; Fan, H. Enhanced Facade Parsing for Street-Level Images Using Convolutional Neural Networks. IEEE Trans. Geosci. Remote Sens. 2021, 59, 10519–10531. [Google Scholar] [CrossRef]
- Tan, M.; Pang, R.; Le, Q. EfficientDet: Scalable and Efficient Object Detection. arXiv 2019, arXiv:1911.09070v7. [Google Scholar]
- Ren, S.; He, K.; Girshick, R.; Sun, J. Faster R-CNN: Towards Real-Time Object Detection with Region Proposal Networks. IEEE Trans. Pattern Anal. Mach. Intell. 2017, 39, 1137–1149. [Google Scholar] [CrossRef] [PubMed] [Green Version]
- Ge, Z.; Liu, S.; Wang, F.; Li, Z.; Sun, J. YOLOX: Exceeding YOLO Series in 2021. arXiv 2021, arXiv:2107.08430v2. [Google Scholar]
- Bochkovskiy, A.; Wang, C.; Liao, H. YOLOv4: Optimal Speed and Accuracy of Object Detection. arXiv 2020, arXiv:2004.10934v1. [Google Scholar]
- Liu, L.; Liu, Z.; Xiong, Y. Combining object detection and semantic segmentation to detect illegal billboard. Mod. Comput. 2021, 12, 127–132. [Google Scholar]
- Joseph, R.; Ali, F. YOLOv3: An Incremental Improvement. arXiv 2018, arXiv:1804.02767v1. [Google Scholar]


| Area | Degree of Occlusion | Texture Feature | Morphology Feature | Location Feature |
|---|---|---|---|---|
| No occlusion | None | Uniform | Rectangles, Clear distinct boundaries | Concentrated in the middle of the image |
| Occlusion | Partial | Rough | Relatively clear rectangles, incomplete boundaries | Concentrated in the middle of the image |
| High | Rough and complicated | No obvious boundaries | Concentrated in the middle of the image |
| Method | Metrics (%) | ||||
|---|---|---|---|---|---|
| Precision | Recall | F1 | IoU | AP | |
| EfficientDet_d0 | 61.8 | 66.5 | 60.8 | 49.3 | 49.3 |
| Faster R-CNN_resnet50 | 42.9 | 59.0 | 48.6 | 37.8 | 42.4 |
| YOLOX_s | 66.9 | 84.4 | 72.5 | 62.3 | 61.3 |
| YOLOv4 | 74.8 | 76.3 | 73.2 | 65.9 | 56.2 |
| YOLOv5_l | 80.8 | 72.4 | 76.4 | 61.8 | 75.1 |
| YOLOv3 | 75.4 | 66.2 | 70.5 | 61.3 | 53.7 |
| SSD | 67.0 | 57.6 | 61.9 | 44.8 | 51.5 |
| Proposed | 82.7 | 87.6 | 82.4 | 78.1 | 80.1 |
| Method | Metrics (%) | ||||
|---|---|---|---|---|---|
| Precision | Recall | F1 | IoU | AP | |
| EfficientDet_d0 | 57.9 | 54.9 | 56.4 | 39.3 | 47.8 |
| Faster R-CNN_resnet50 | 45.4 | 60.7 | 51.9 | 35.1 | 43.3 |
| YOLOX_s | 59.0 | 59.1 | 59.0 | 41.5 | 49.0 |
| YOLOv4 | 69.6 | 70.7 | 70.1 | 54.0 | 56.9 |
| YOLOv5_l | 74.8 | 73.7 | 74.2 | 59.0 | 54.5 |
| YOLOv3 | 64.7 | 59.7 | 62.1 | 45.0 | 50.7 |
| SSD | 52.6 | 55.7 | 54.1 | 37.1 | 44.9 |
| Proposed | 78.5 | 86.0 | 82.1 | 69.7 | 73.3 |
Publisher’s Note: MDPI stays neutral with regard to jurisdictional claims in published maps and institutional affiliations. |
© 2022 by the authors. Licensee MDPI, Basel, Switzerland. This article is an open access article distributed under the terms and conditions of the Creative Commons Attribution (CC BY) license (https://creativecommons.org/licenses/by/4.0/).
Share and Cite
Dai, J.; Gu, Y. OSO-YOLOv5: Automatic Extraction Method of Store Signboards in Street View Images Based on Multi-Dimensional Analysis. ISPRS Int. J. Geo-Inf. 2022, 11, 462. https://doi.org/10.3390/ijgi11090462
Dai J, Gu Y. OSO-YOLOv5: Automatic Extraction Method of Store Signboards in Street View Images Based on Multi-Dimensional Analysis. ISPRS International Journal of Geo-Information. 2022; 11(9):462. https://doi.org/10.3390/ijgi11090462
Chicago/Turabian StyleDai, Jiguang, and Yue Gu. 2022. "OSO-YOLOv5: Automatic Extraction Method of Store Signboards in Street View Images Based on Multi-Dimensional Analysis" ISPRS International Journal of Geo-Information 11, no. 9: 462. https://doi.org/10.3390/ijgi11090462
APA StyleDai, J., & Gu, Y. (2022). OSO-YOLOv5: Automatic Extraction Method of Store Signboards in Street View Images Based on Multi-Dimensional Analysis. ISPRS International Journal of Geo-Information, 11(9), 462. https://doi.org/10.3390/ijgi11090462