
Refined Urban Functional Zone Mapping by Integrating Open-Source Data


Abstract
:1. Introduction
2. Related Works
2.1. Urban Function Classification
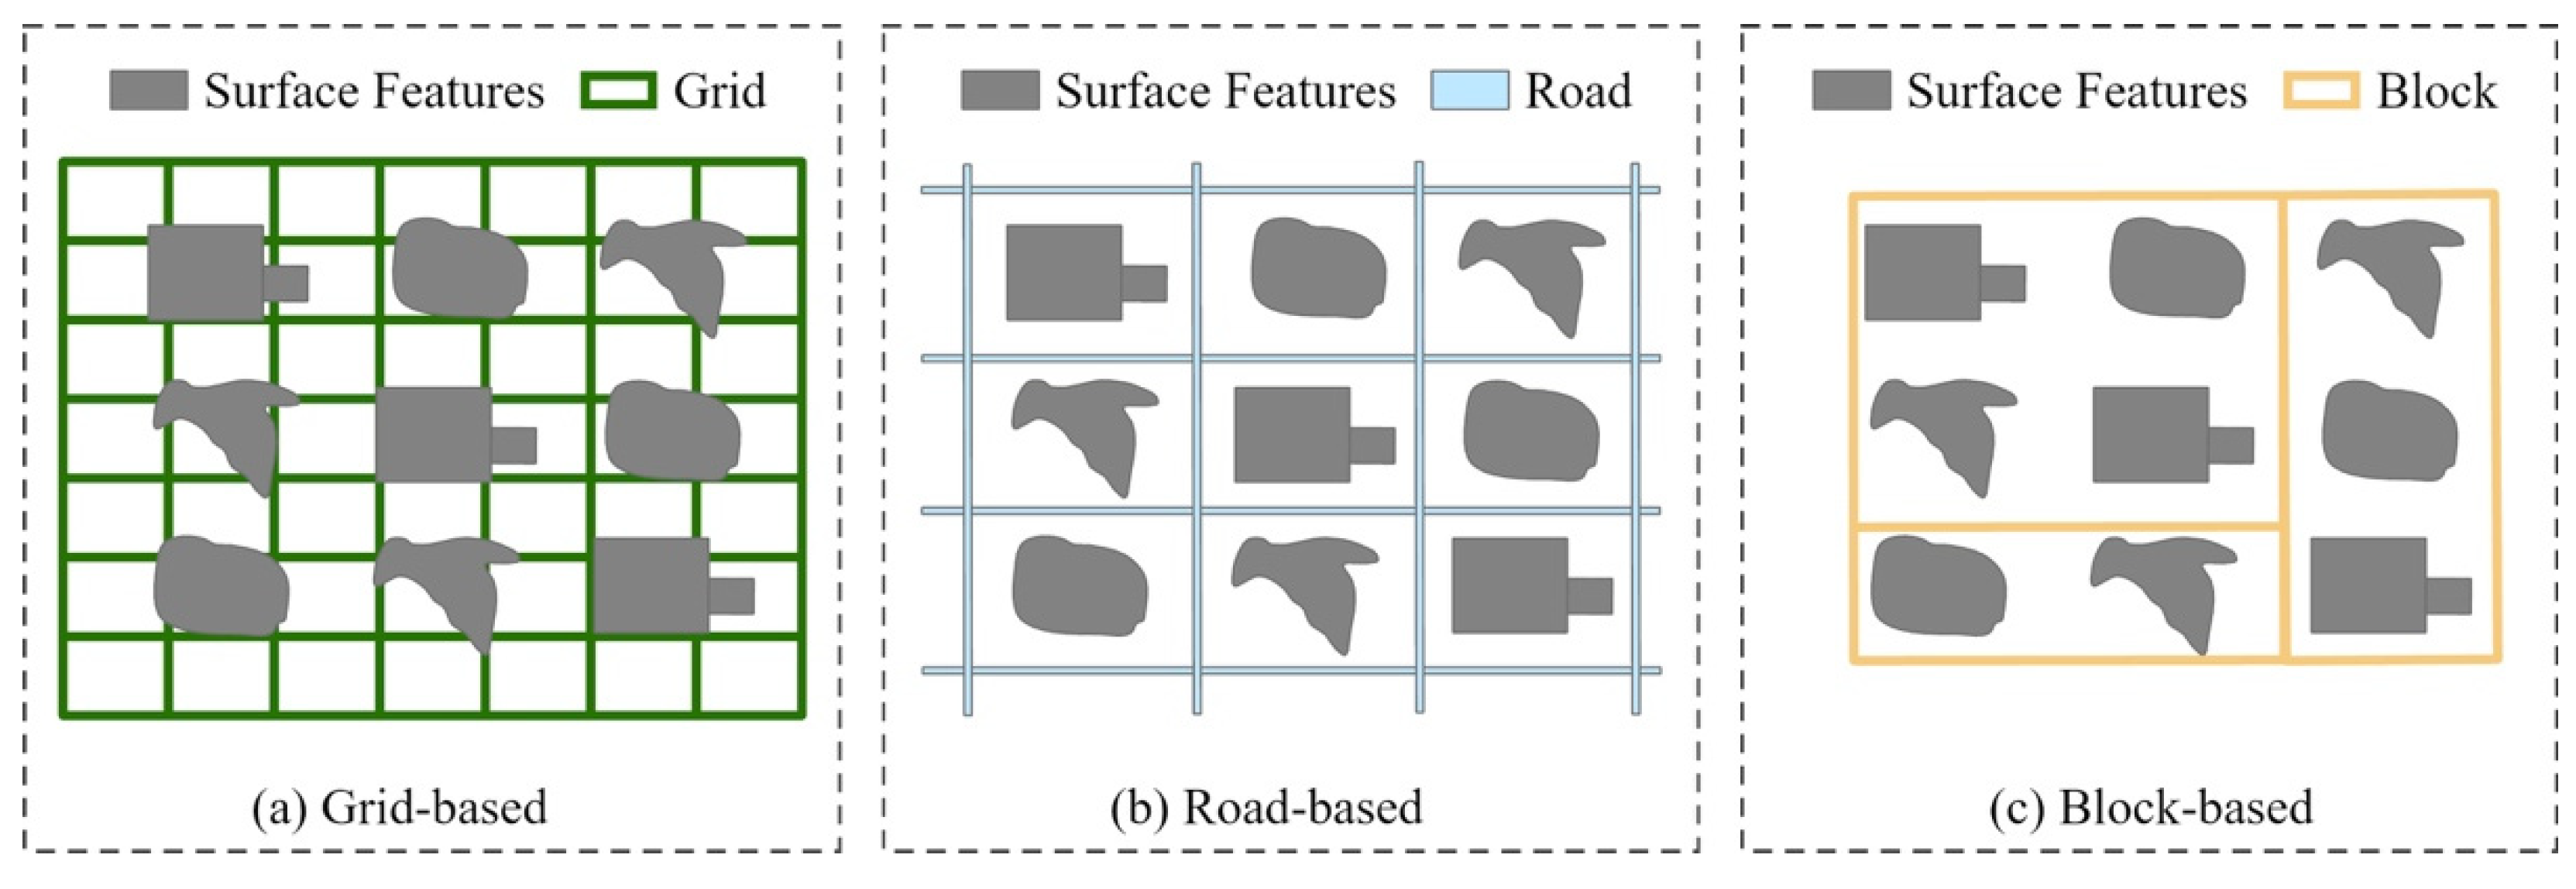
2.2. Zone Segmentation
3. Study Area and Data
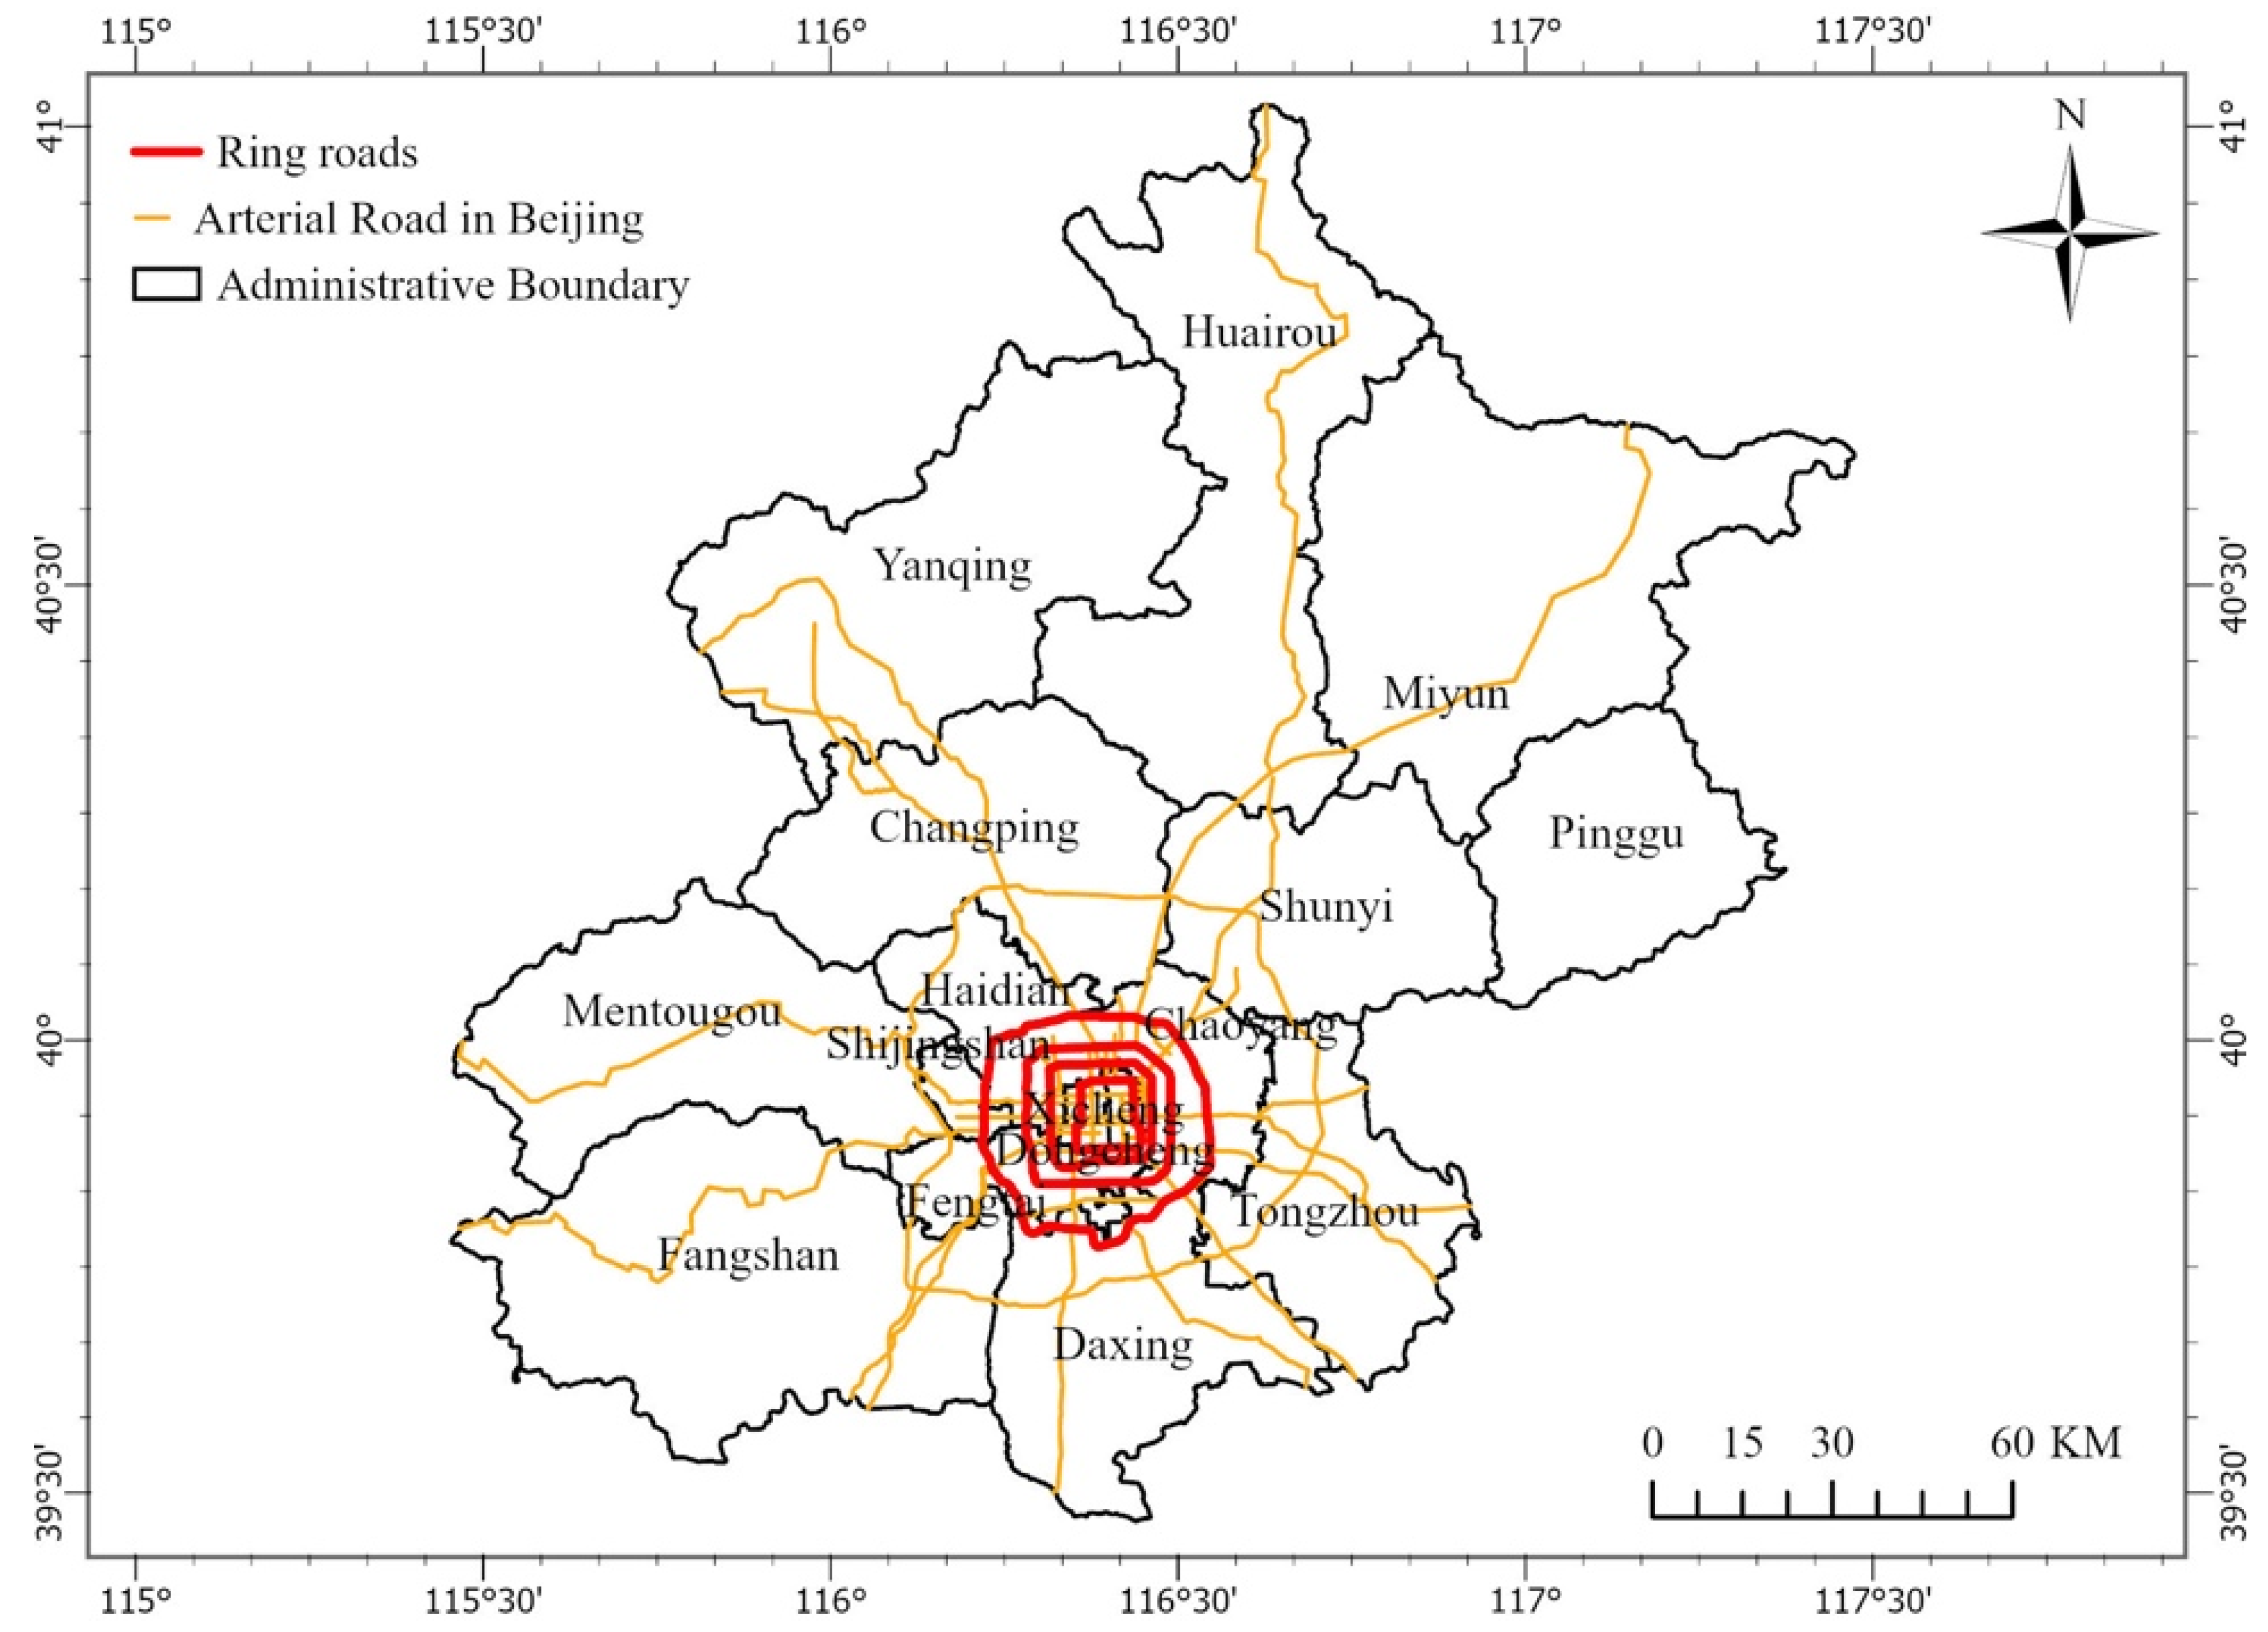
3.1. Overview of the Study Area
3.2. Data
3.2.1. POI Data
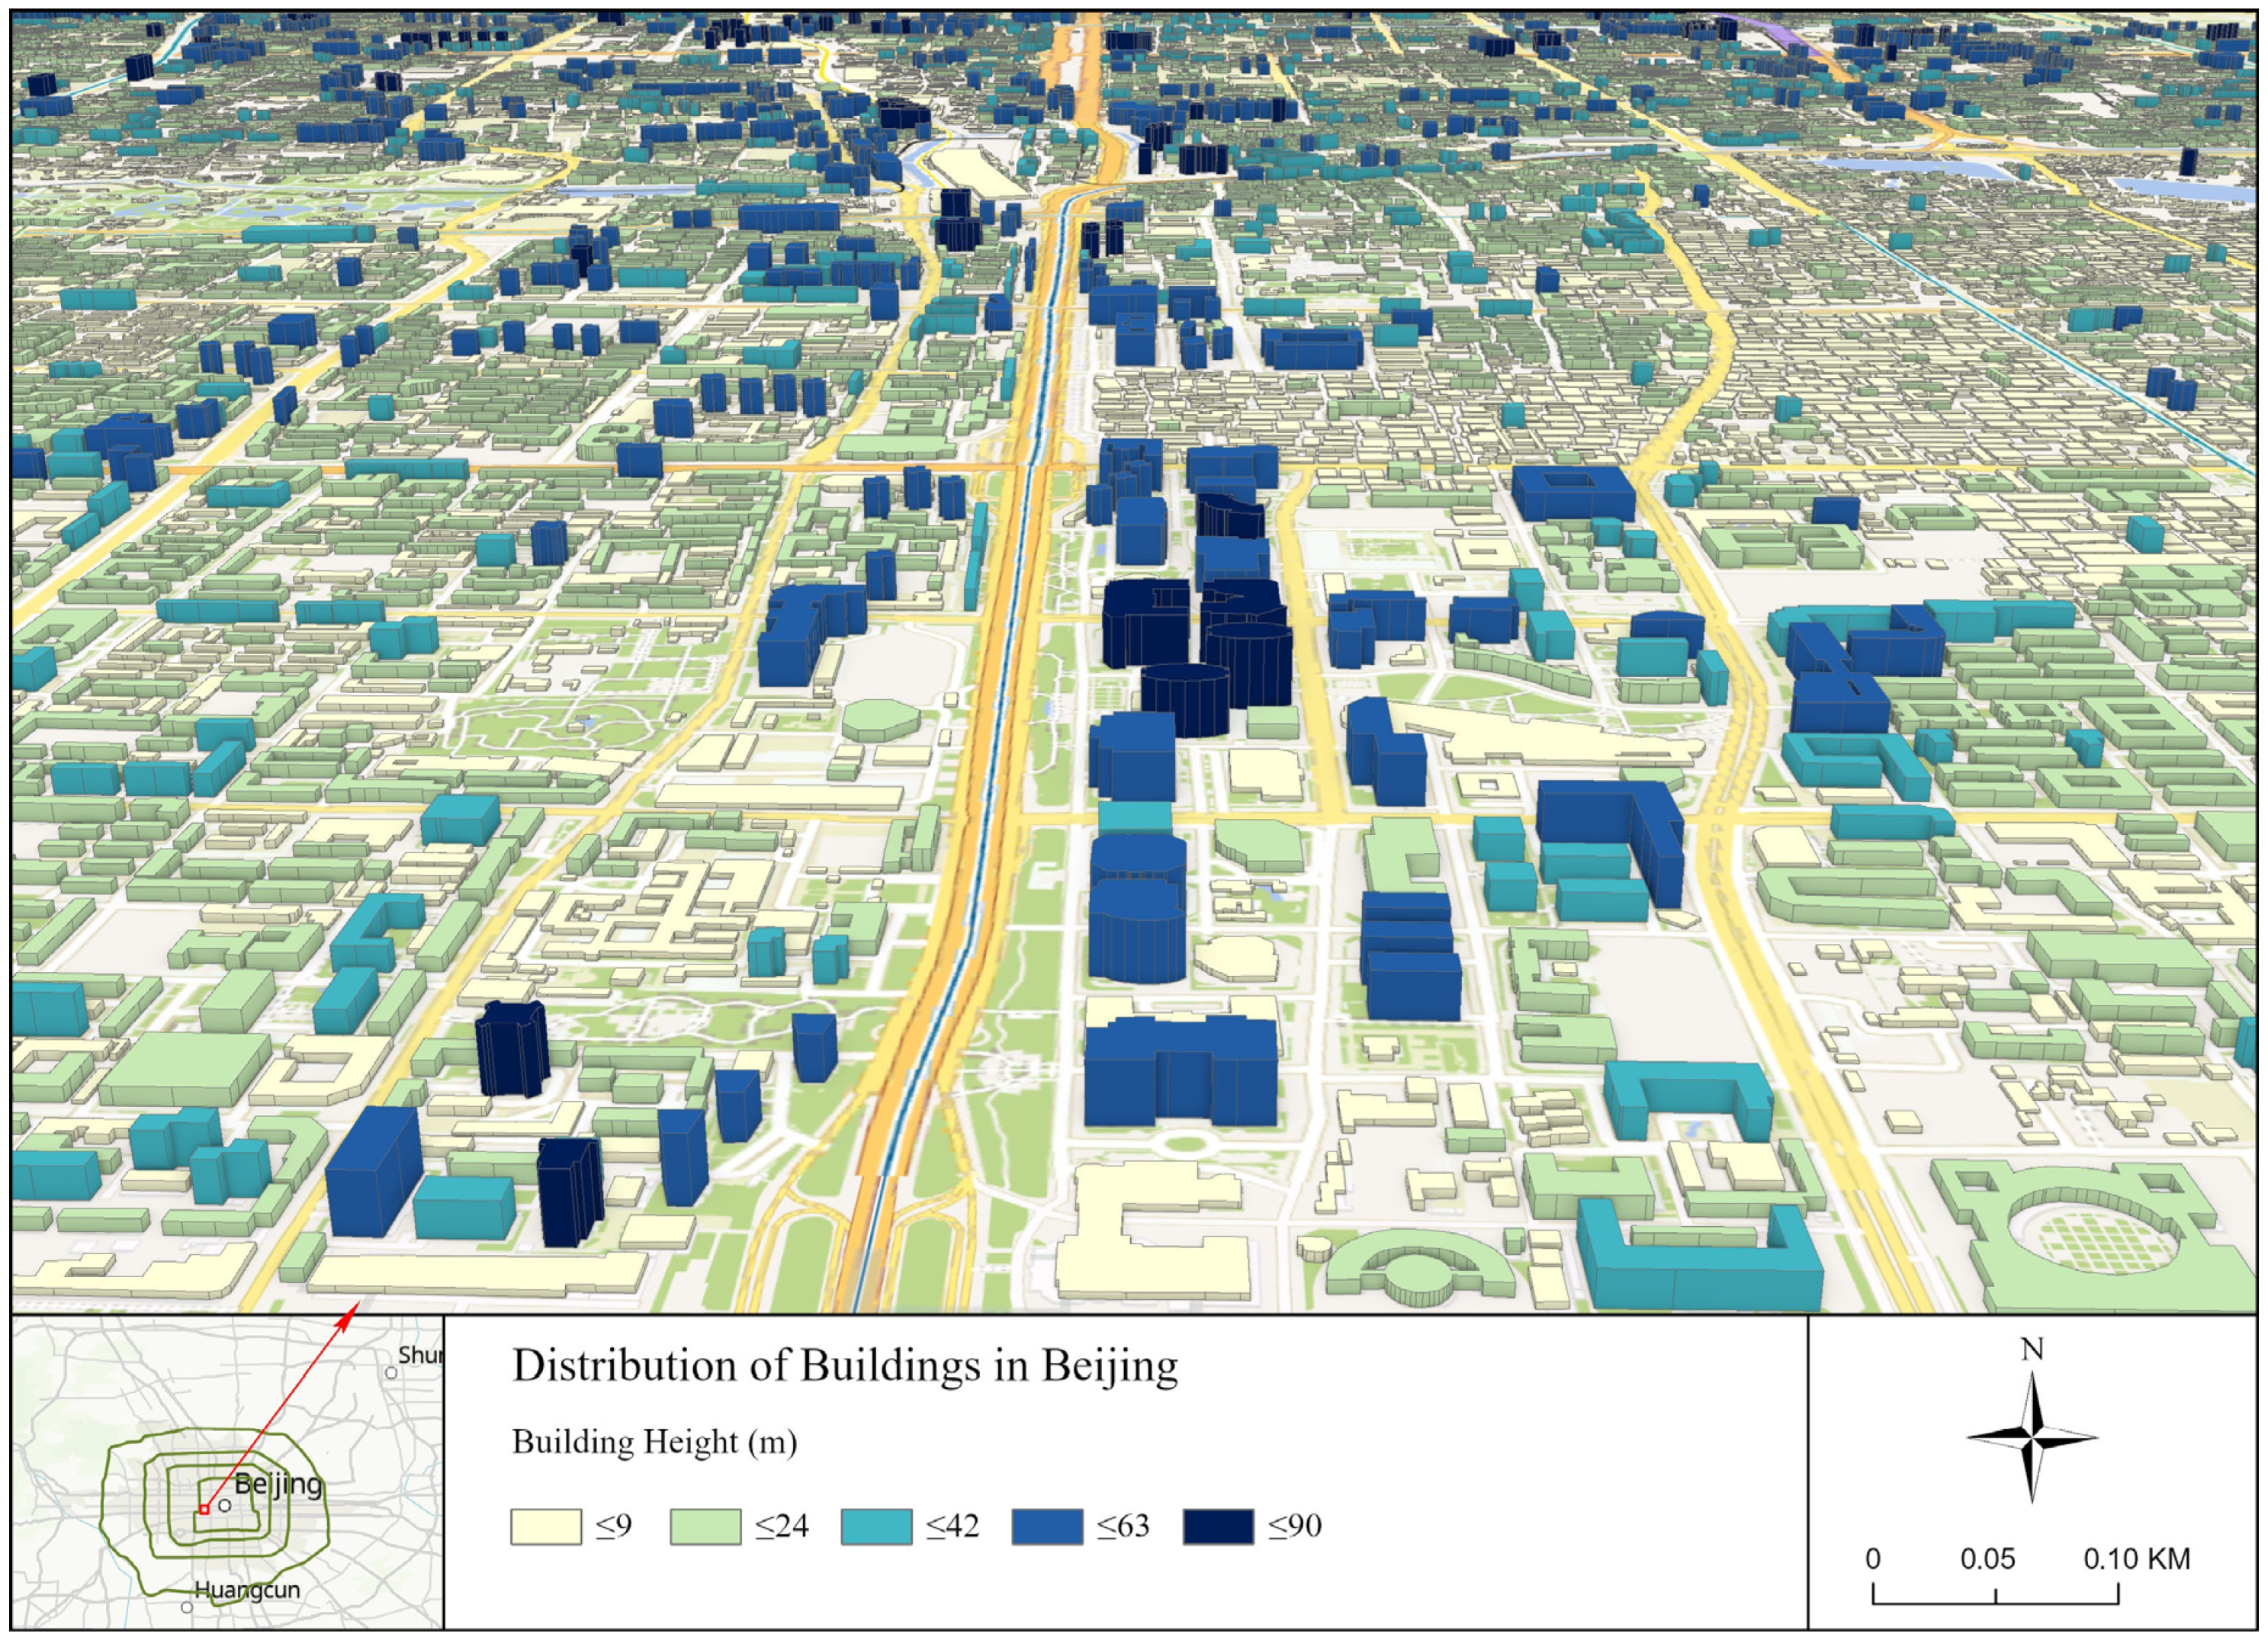
3.2.2. Building Data
3.2.3. Urban Basic Geographic Data
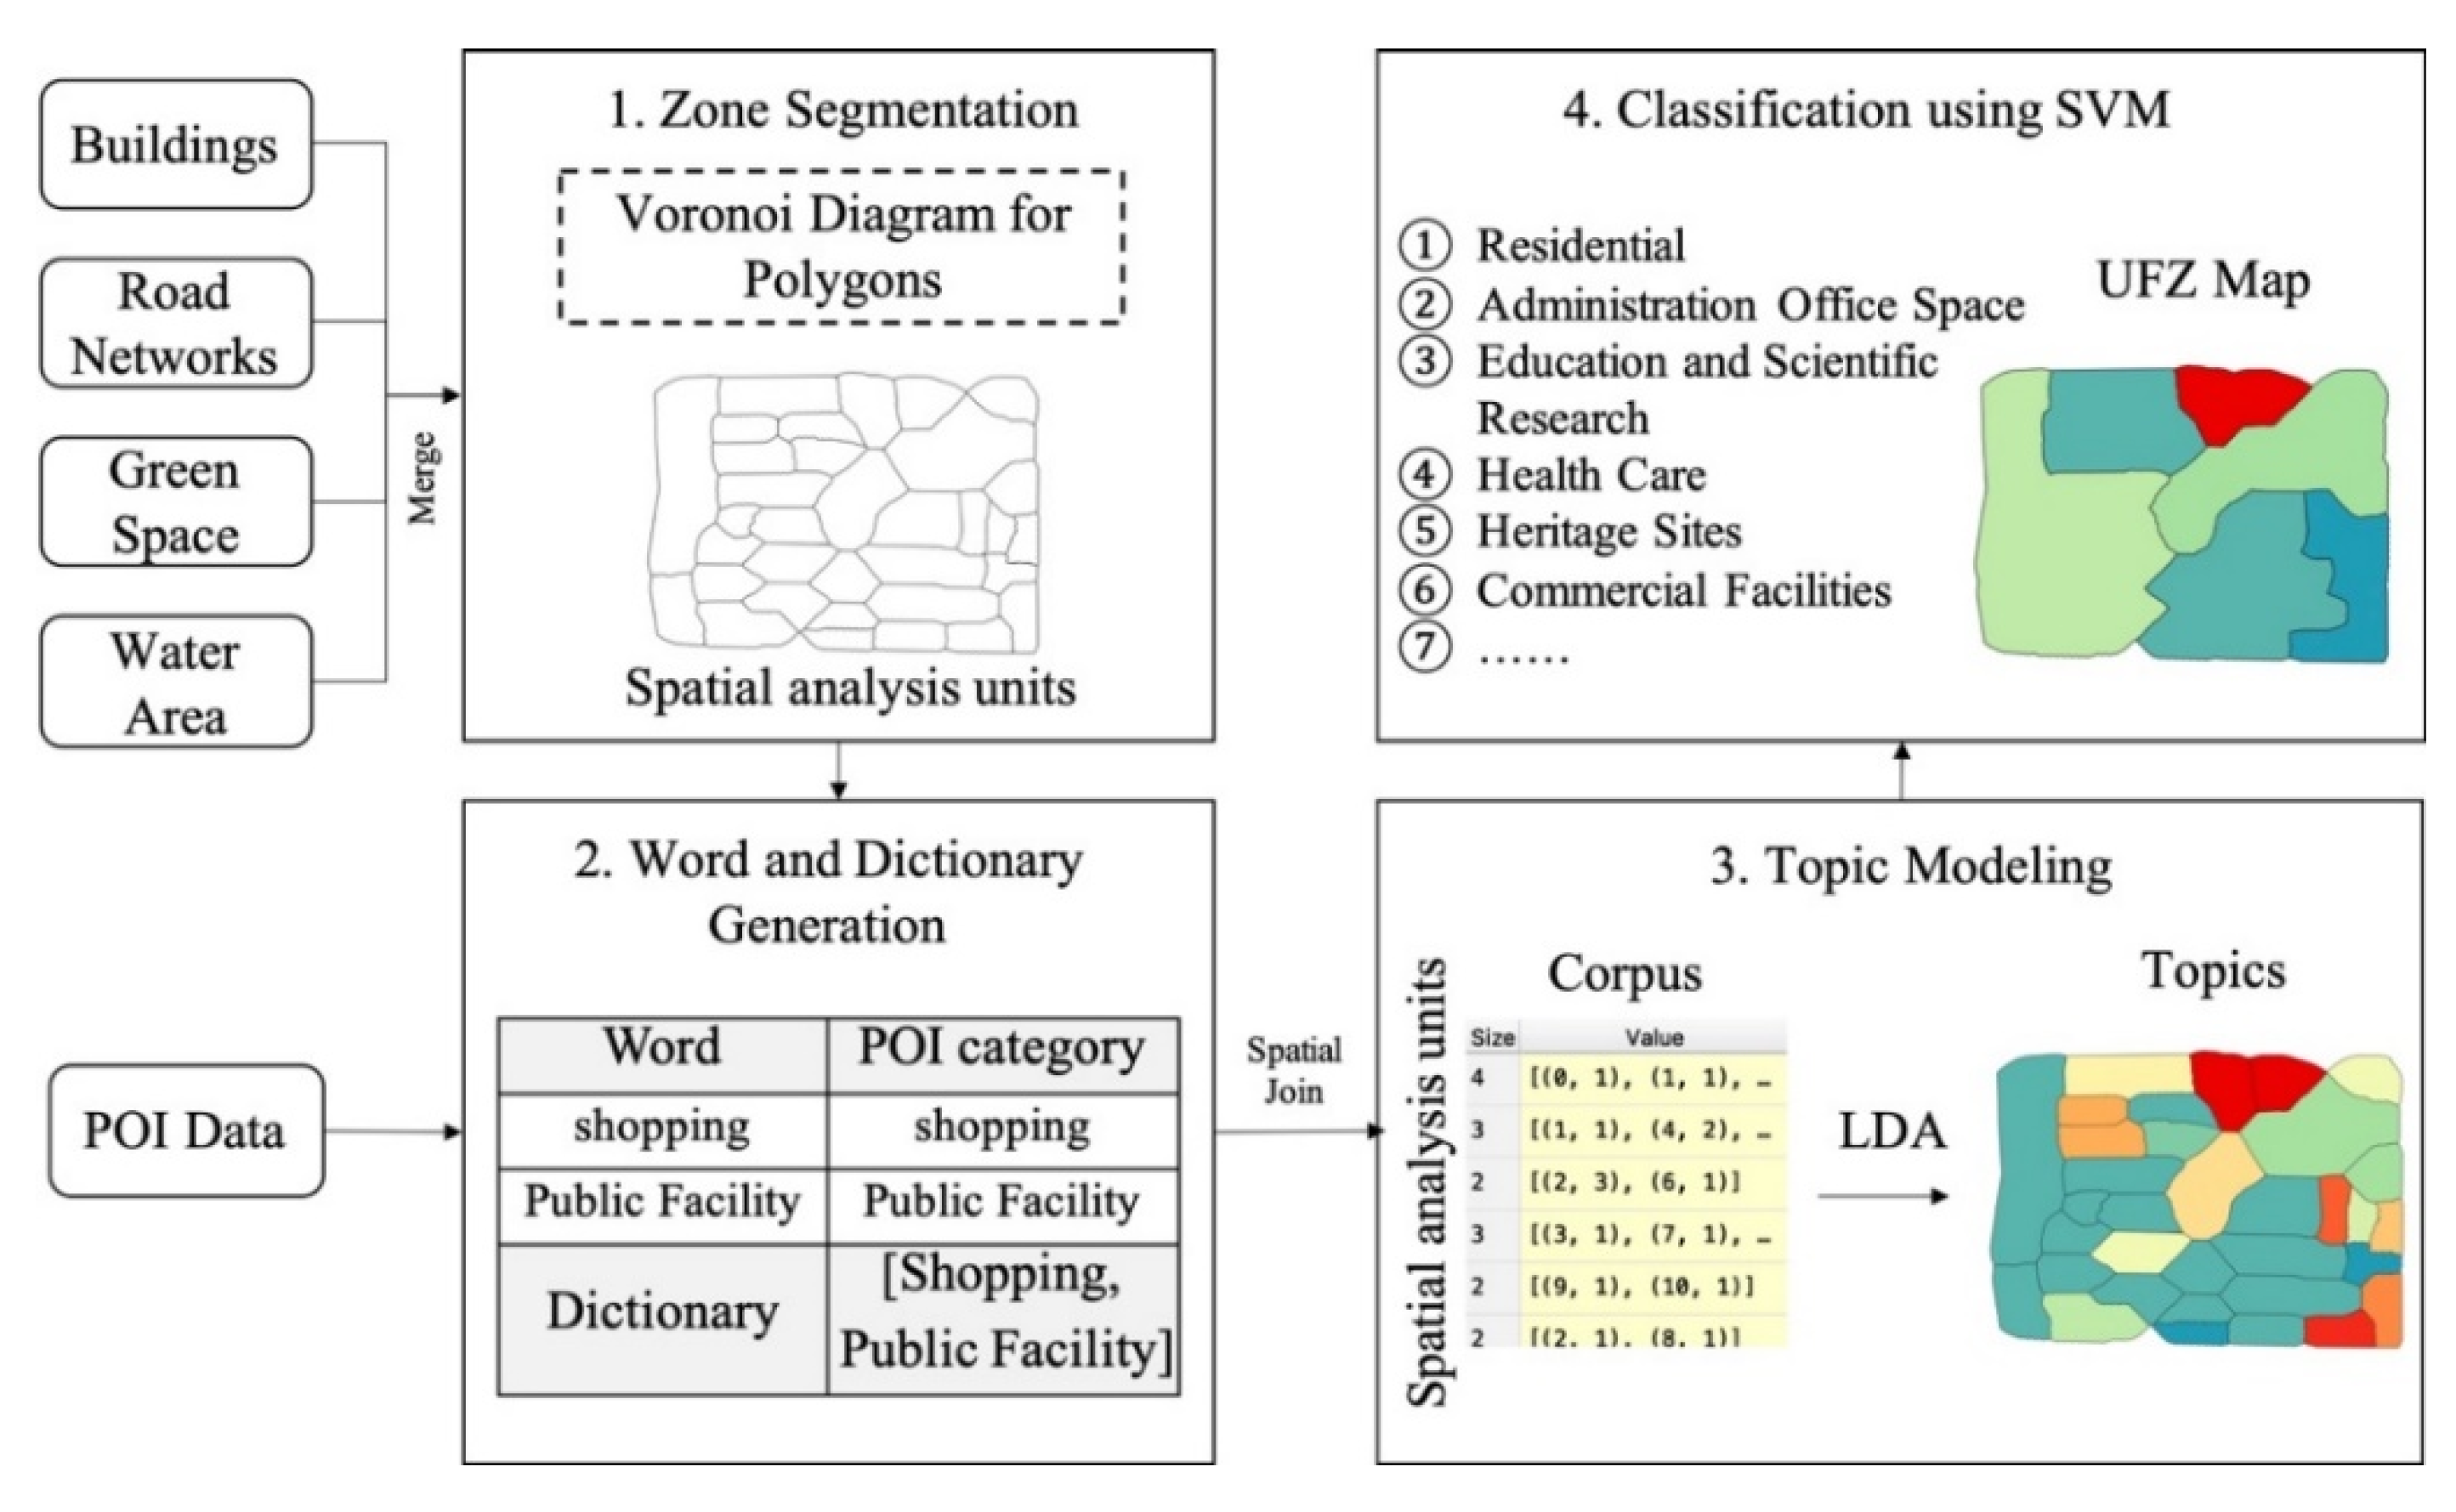
4. Methodology
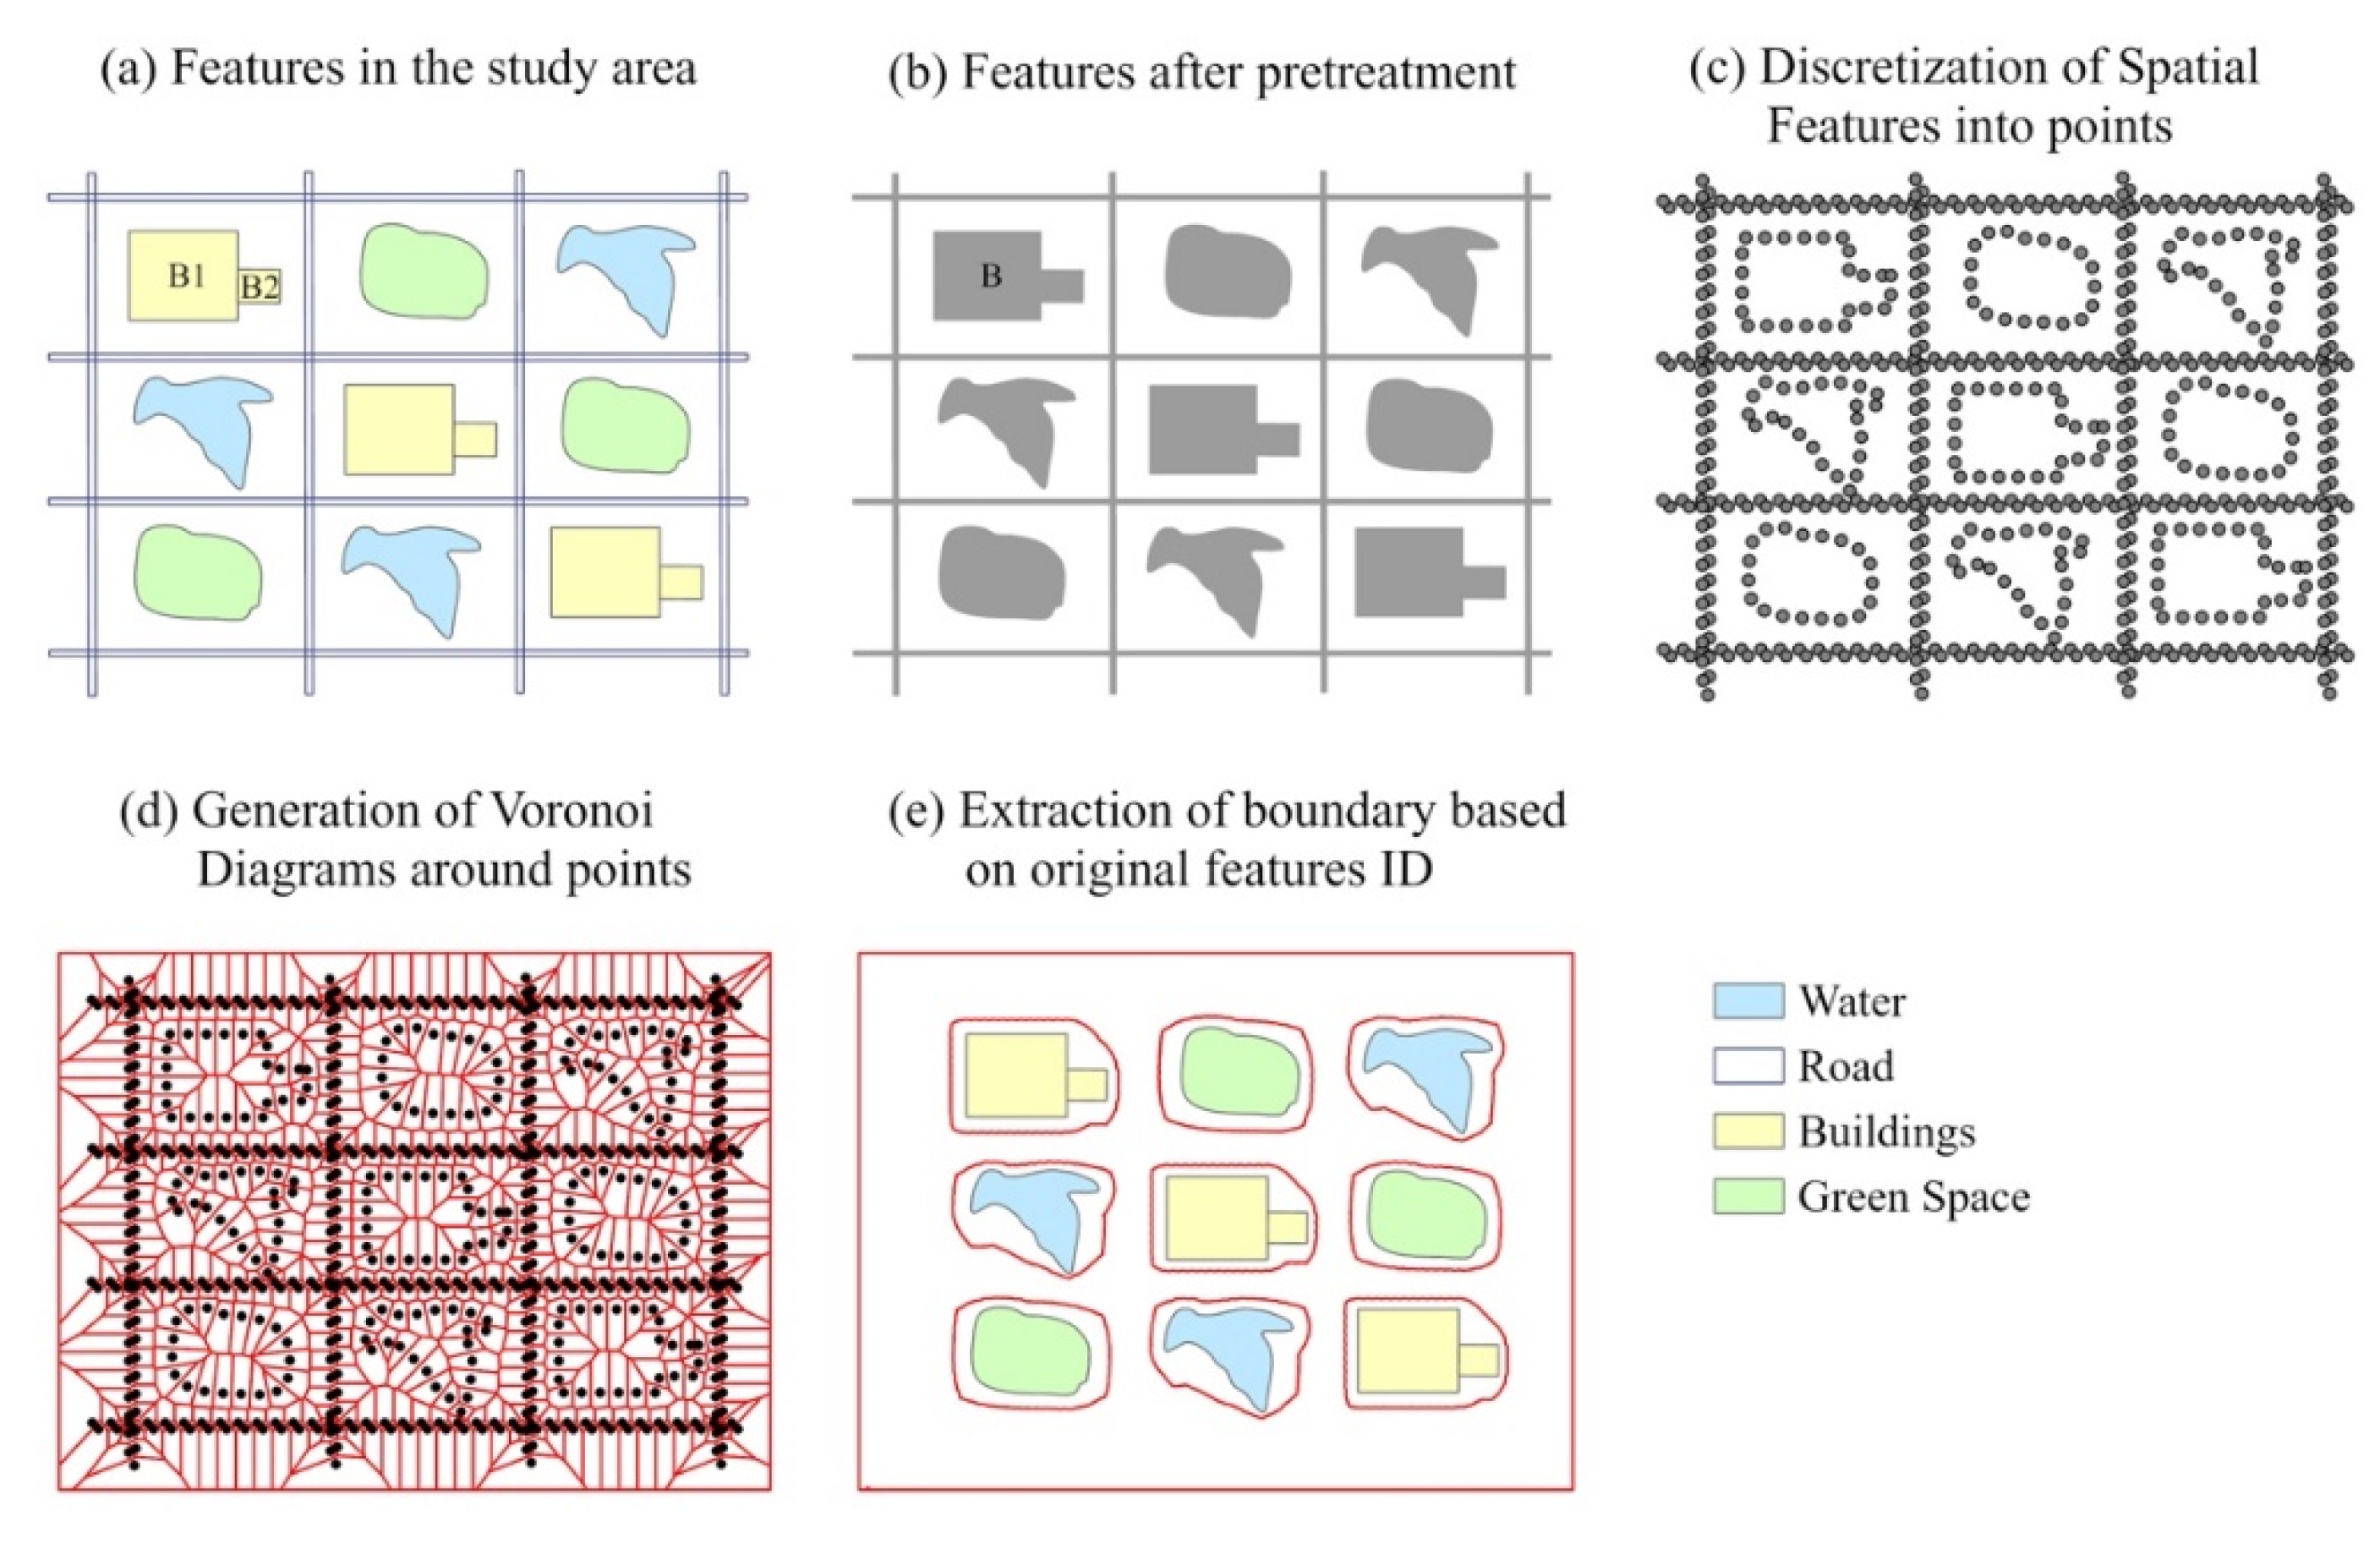
4.1. Zone Segmentation
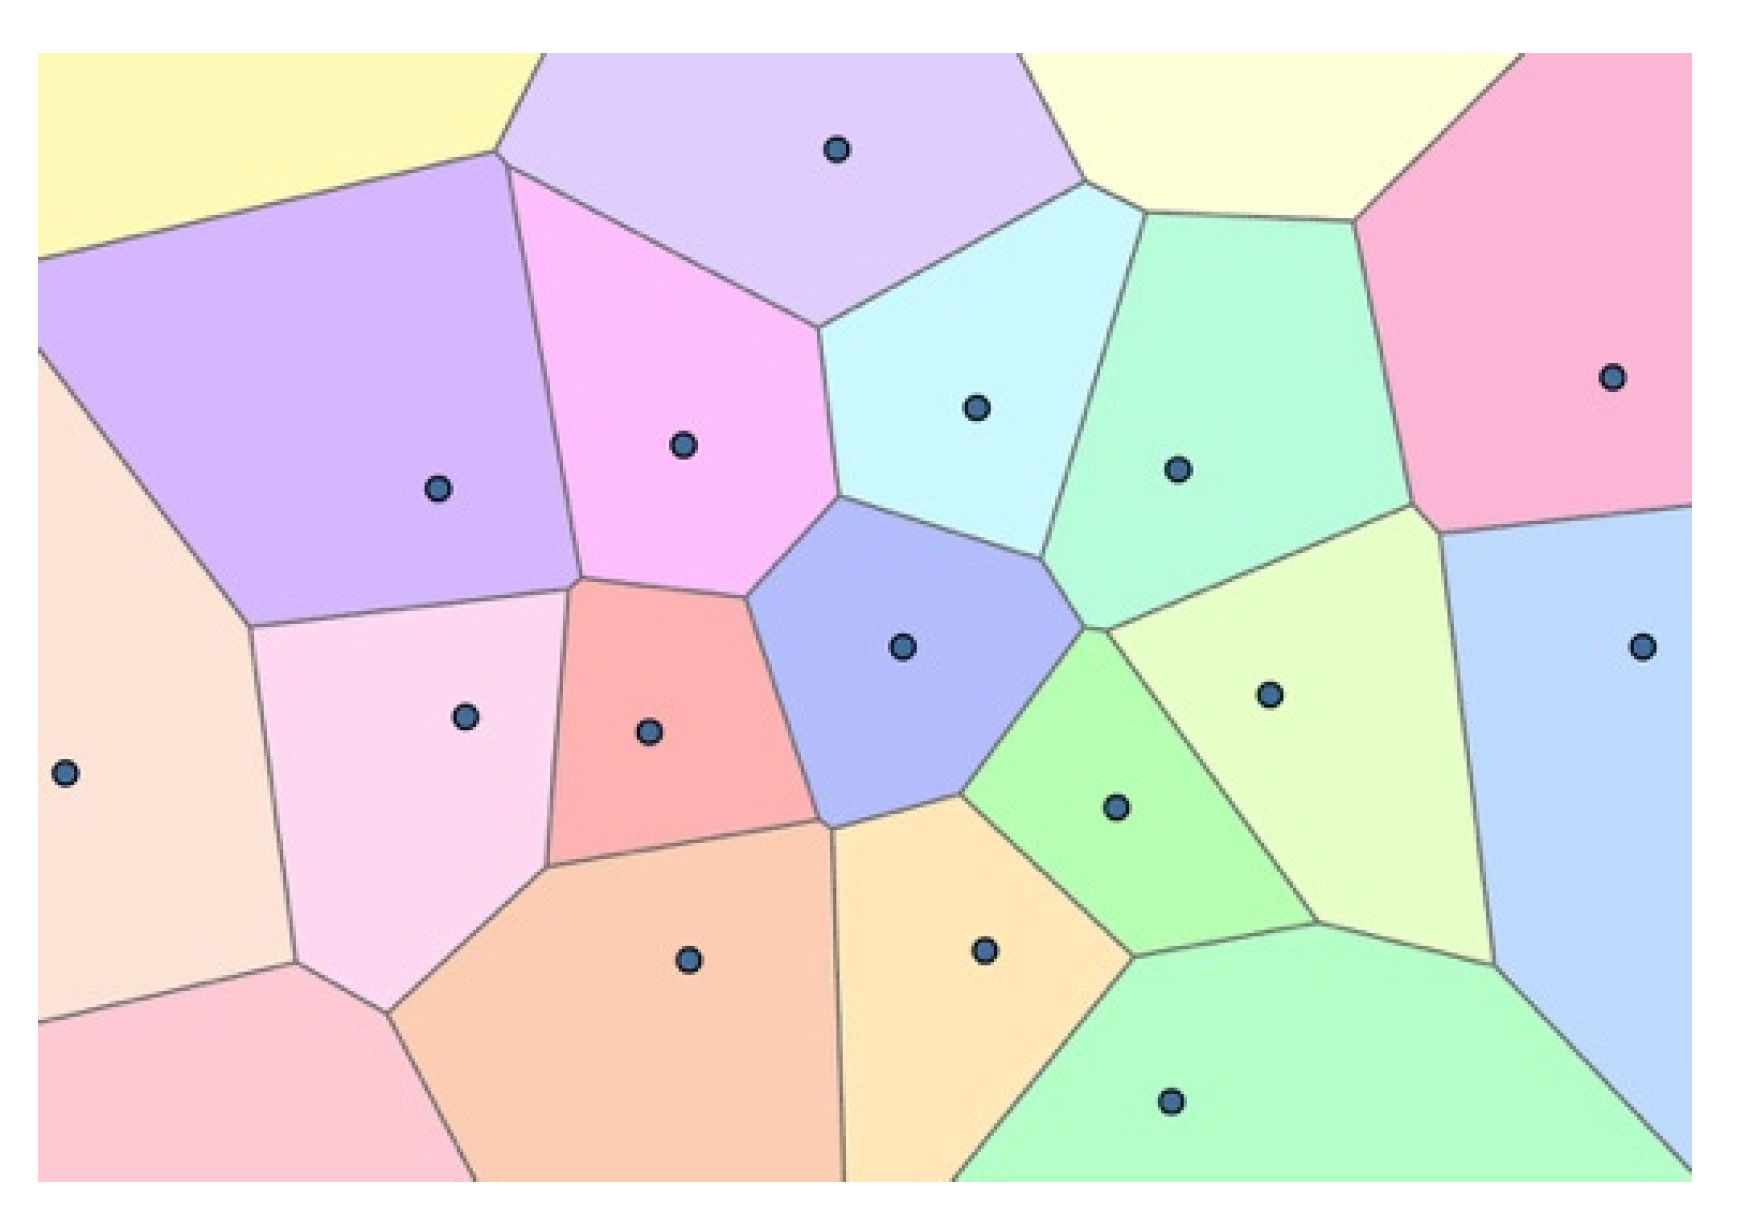
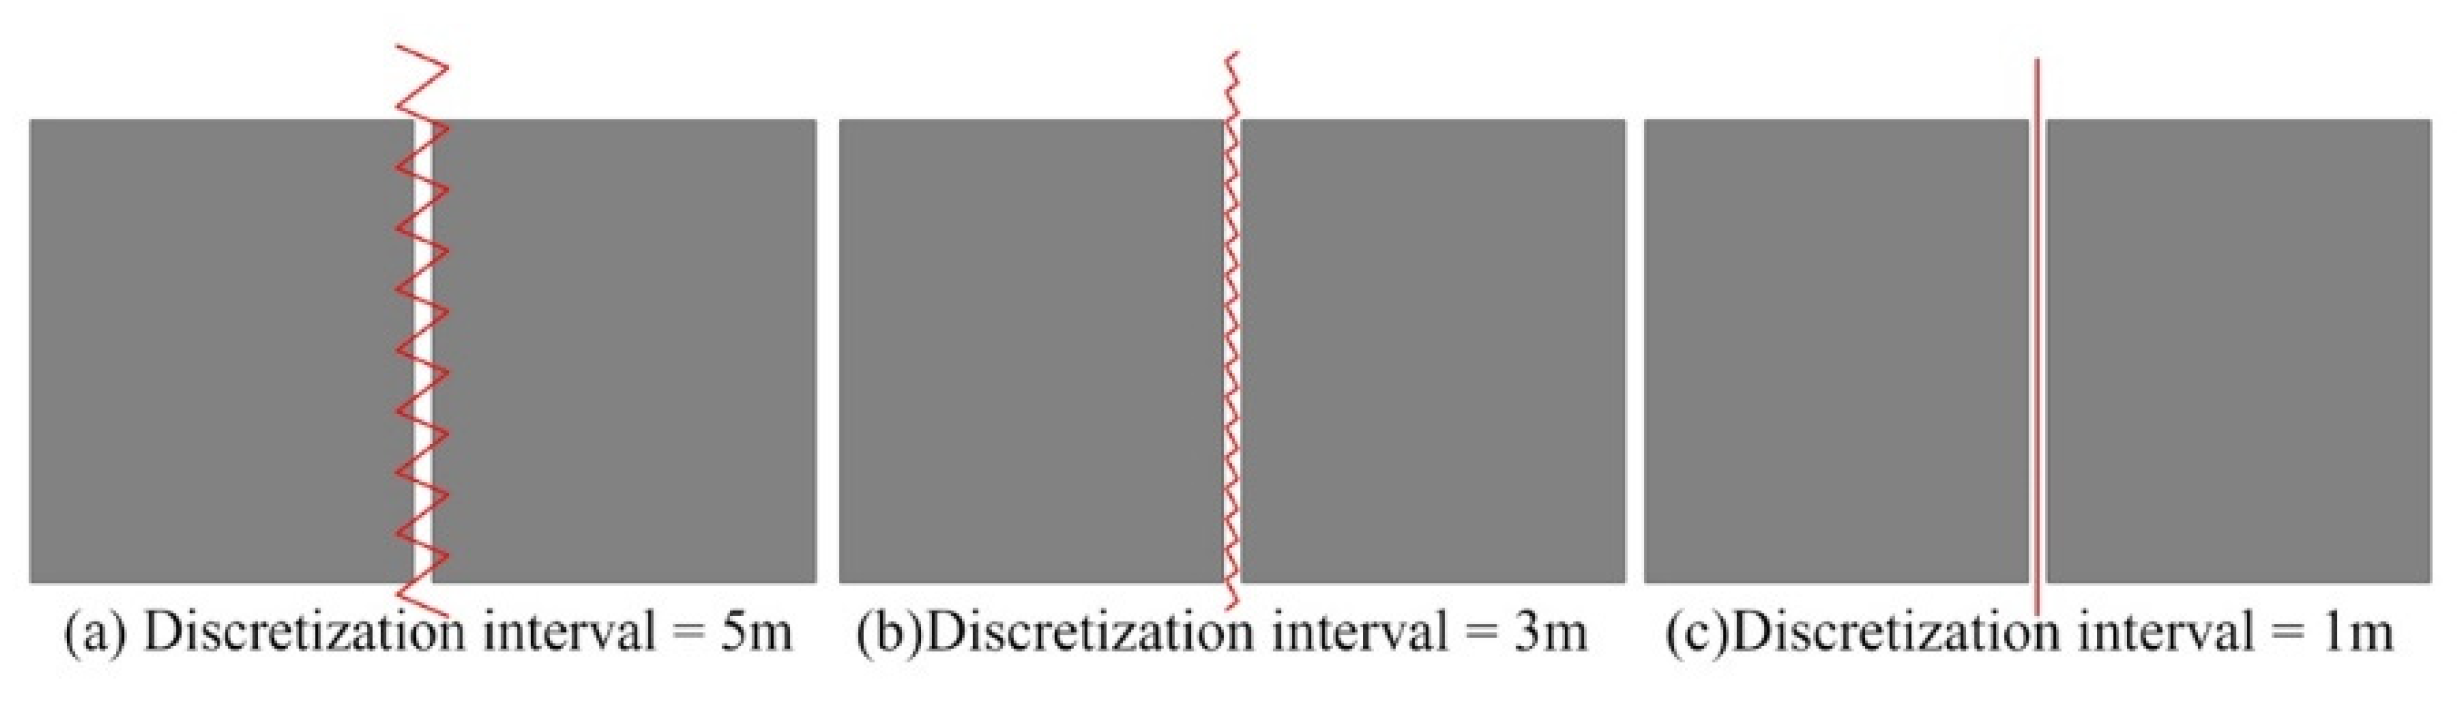
4.1.1. Voronoi Diagram for Points
4.1.2. Voronoi Diagram for Polygons
4.2. Topic Feature Extraction
4.3. UFZ Classification
5. Experimental Results
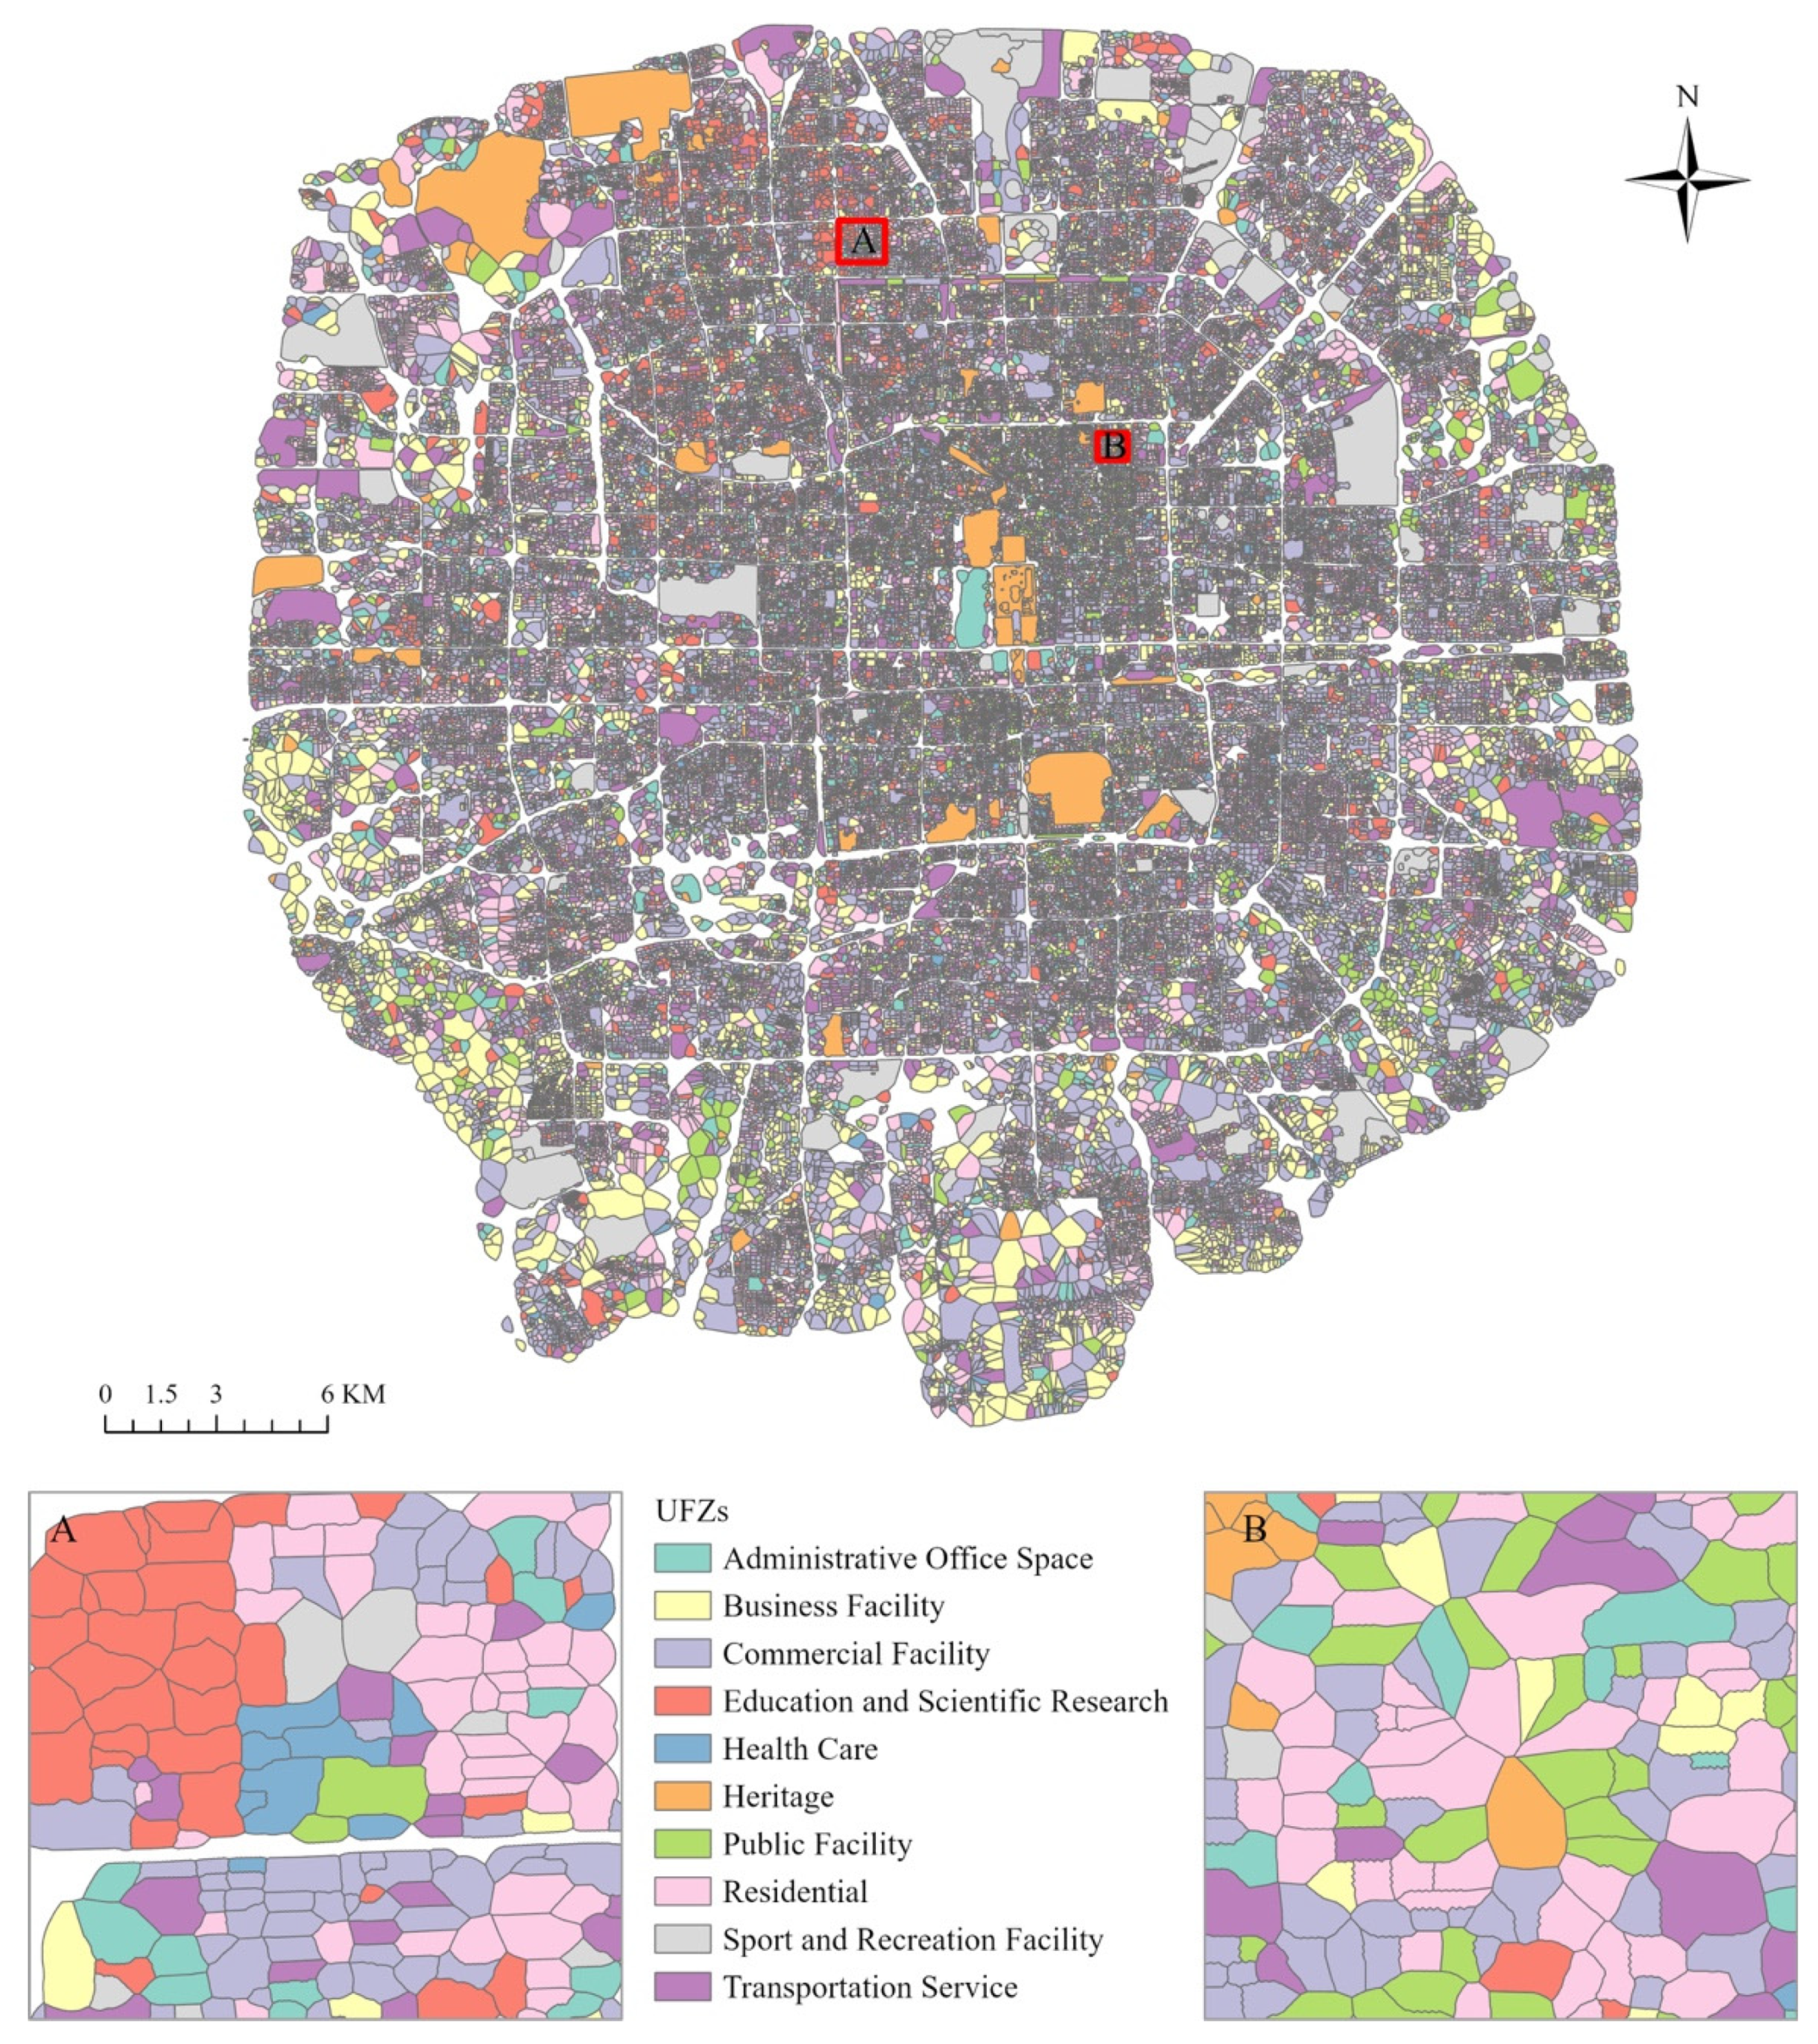
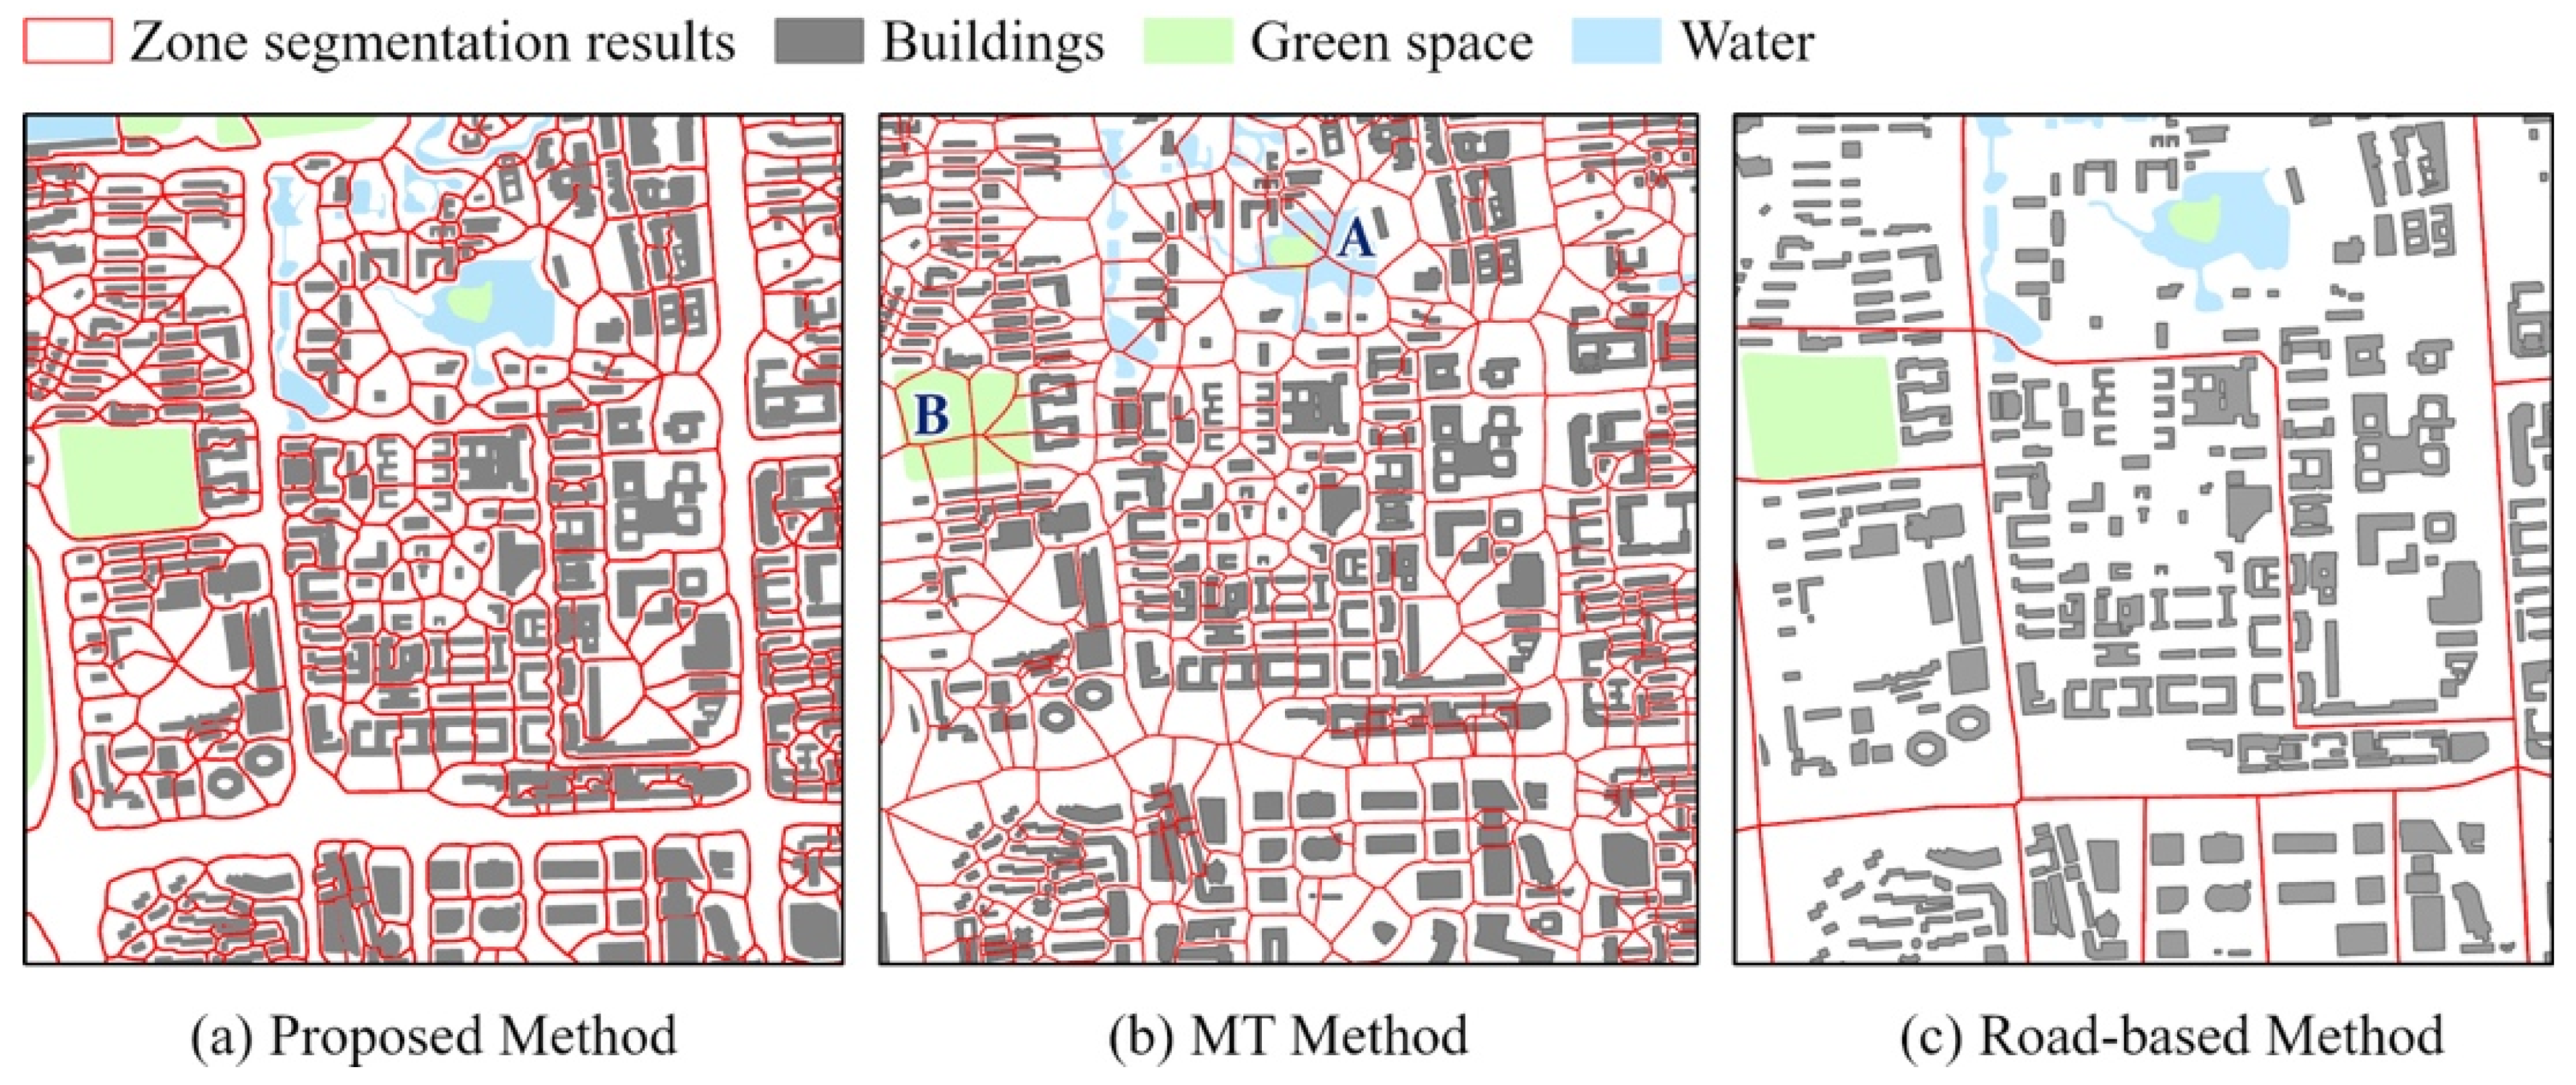
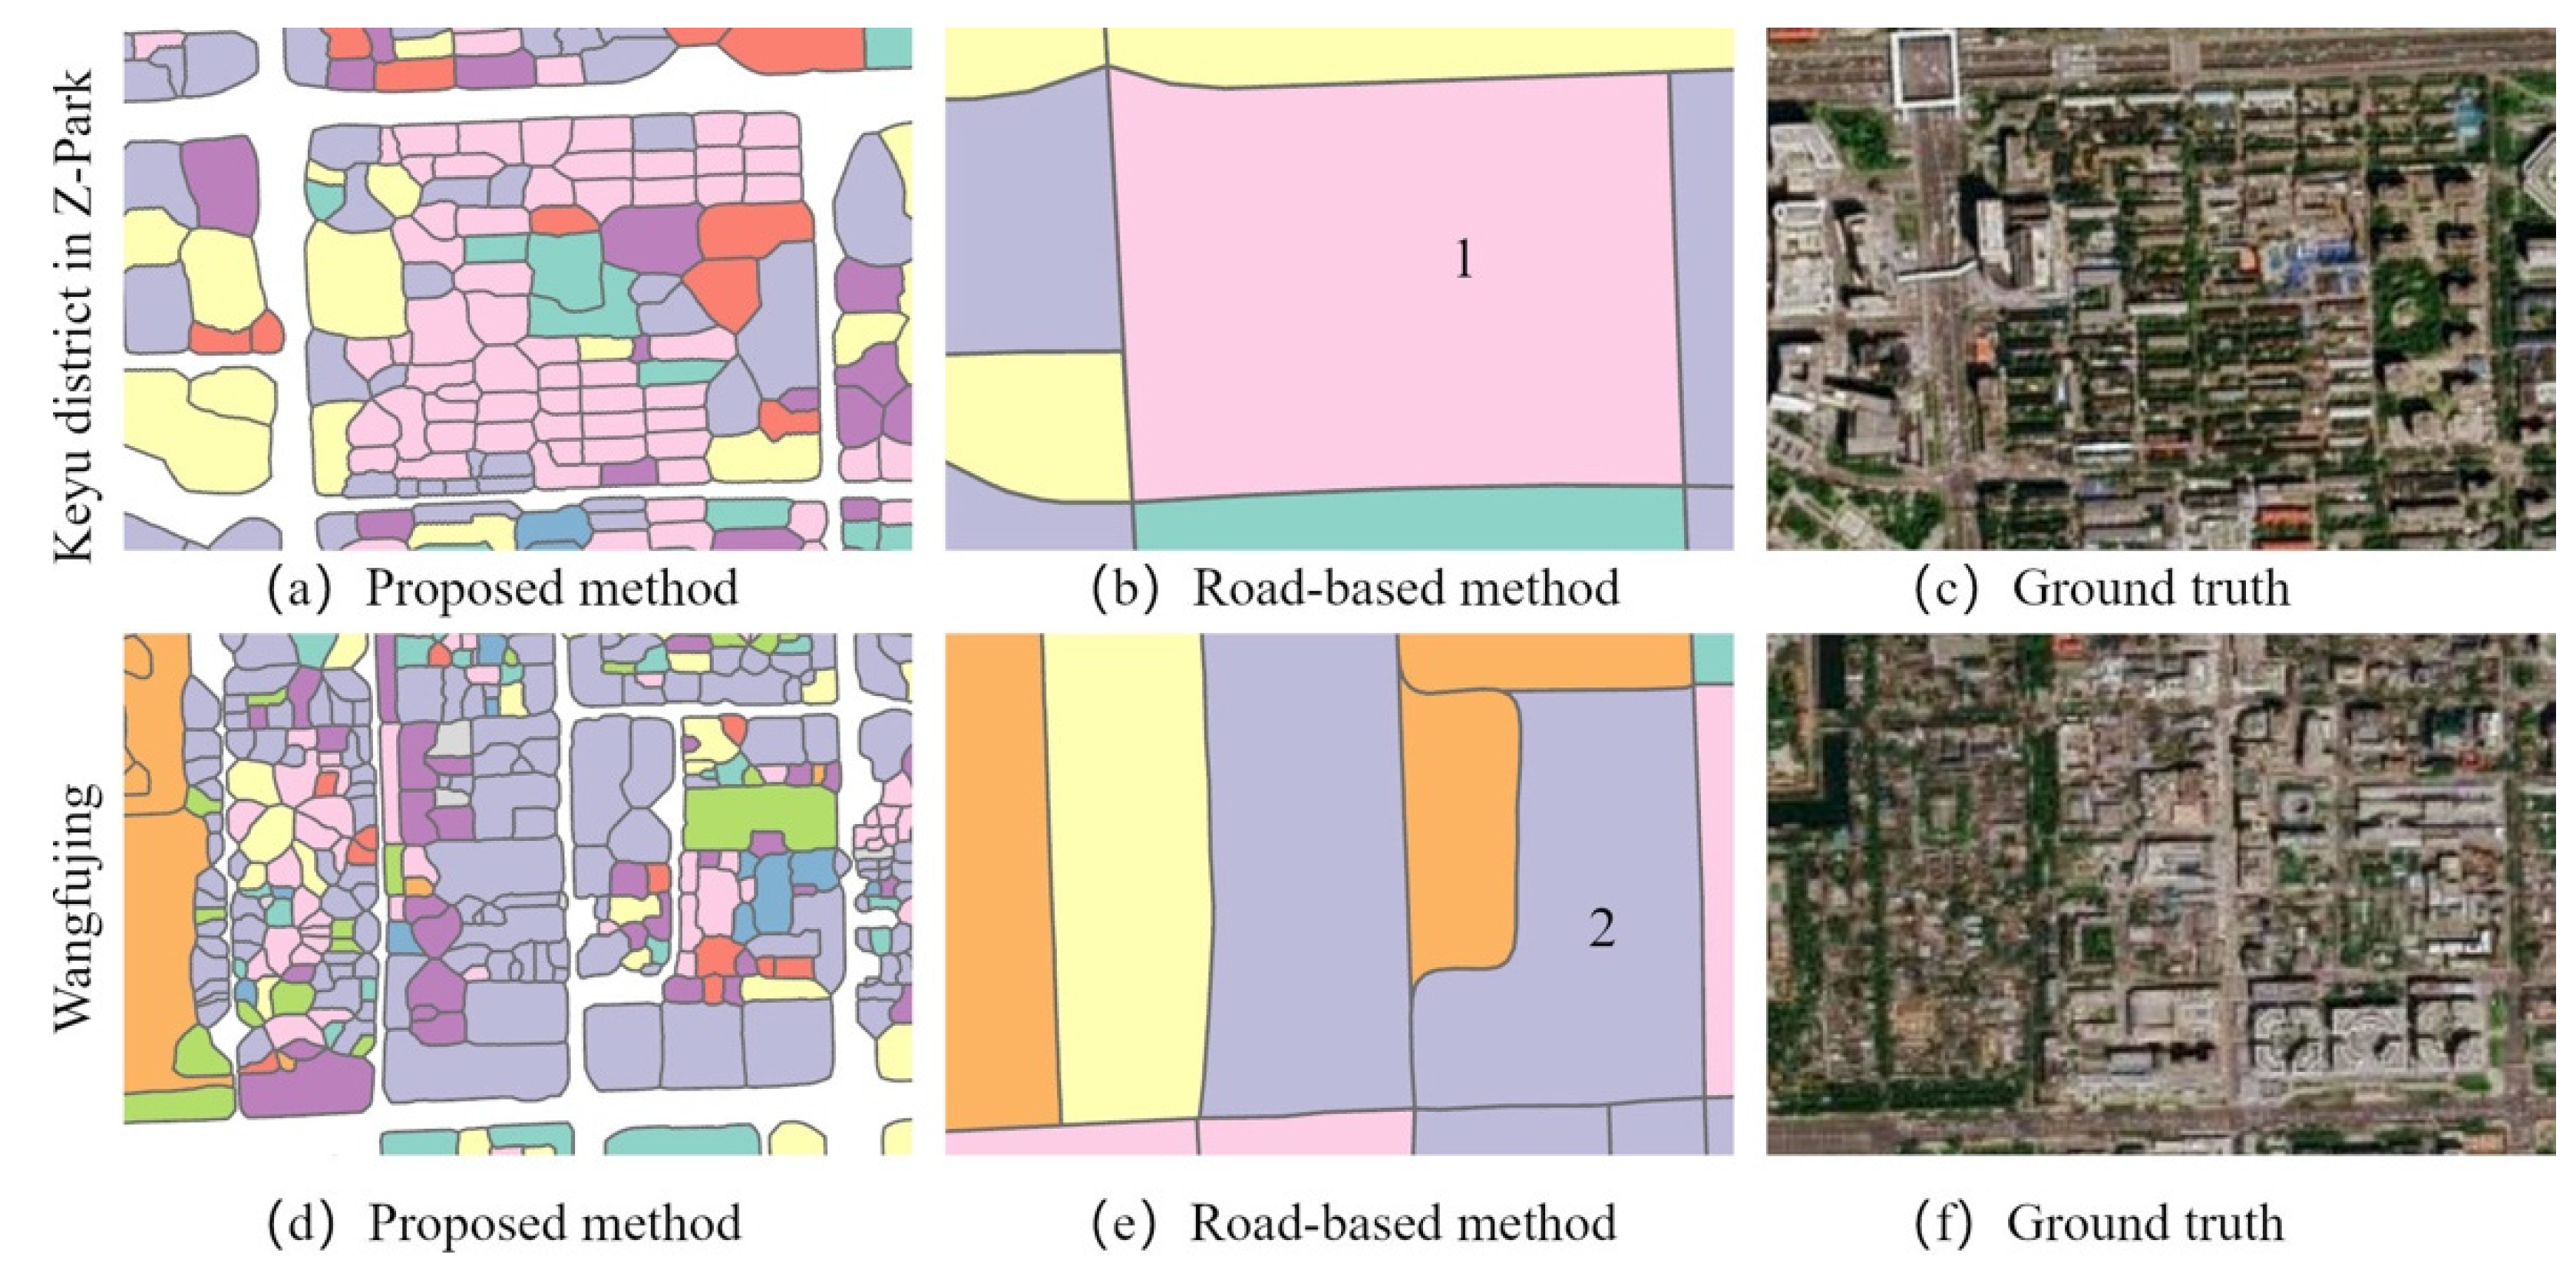
5.1. Zone Segmentation Results
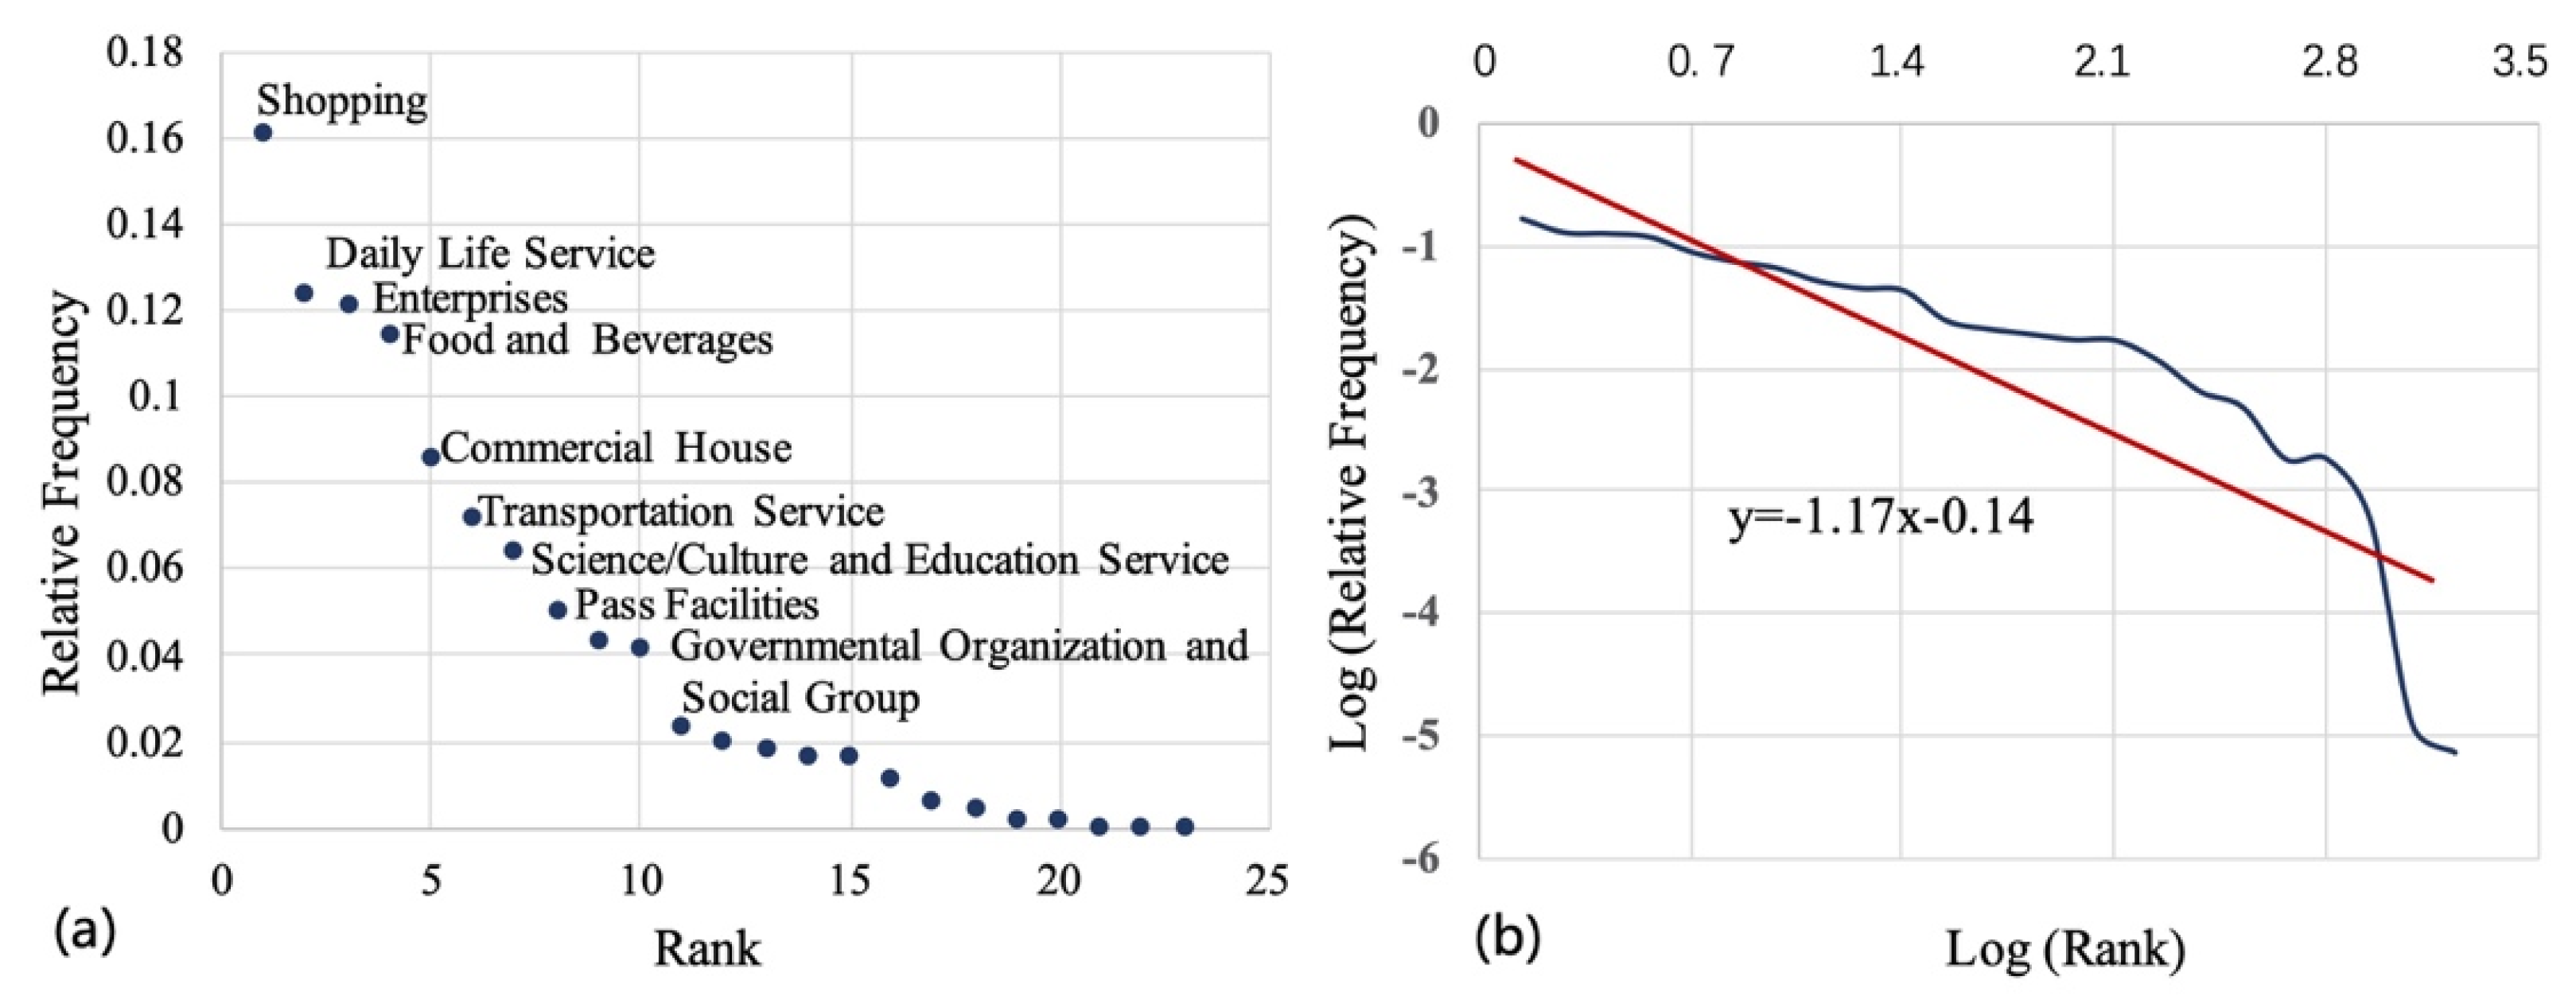
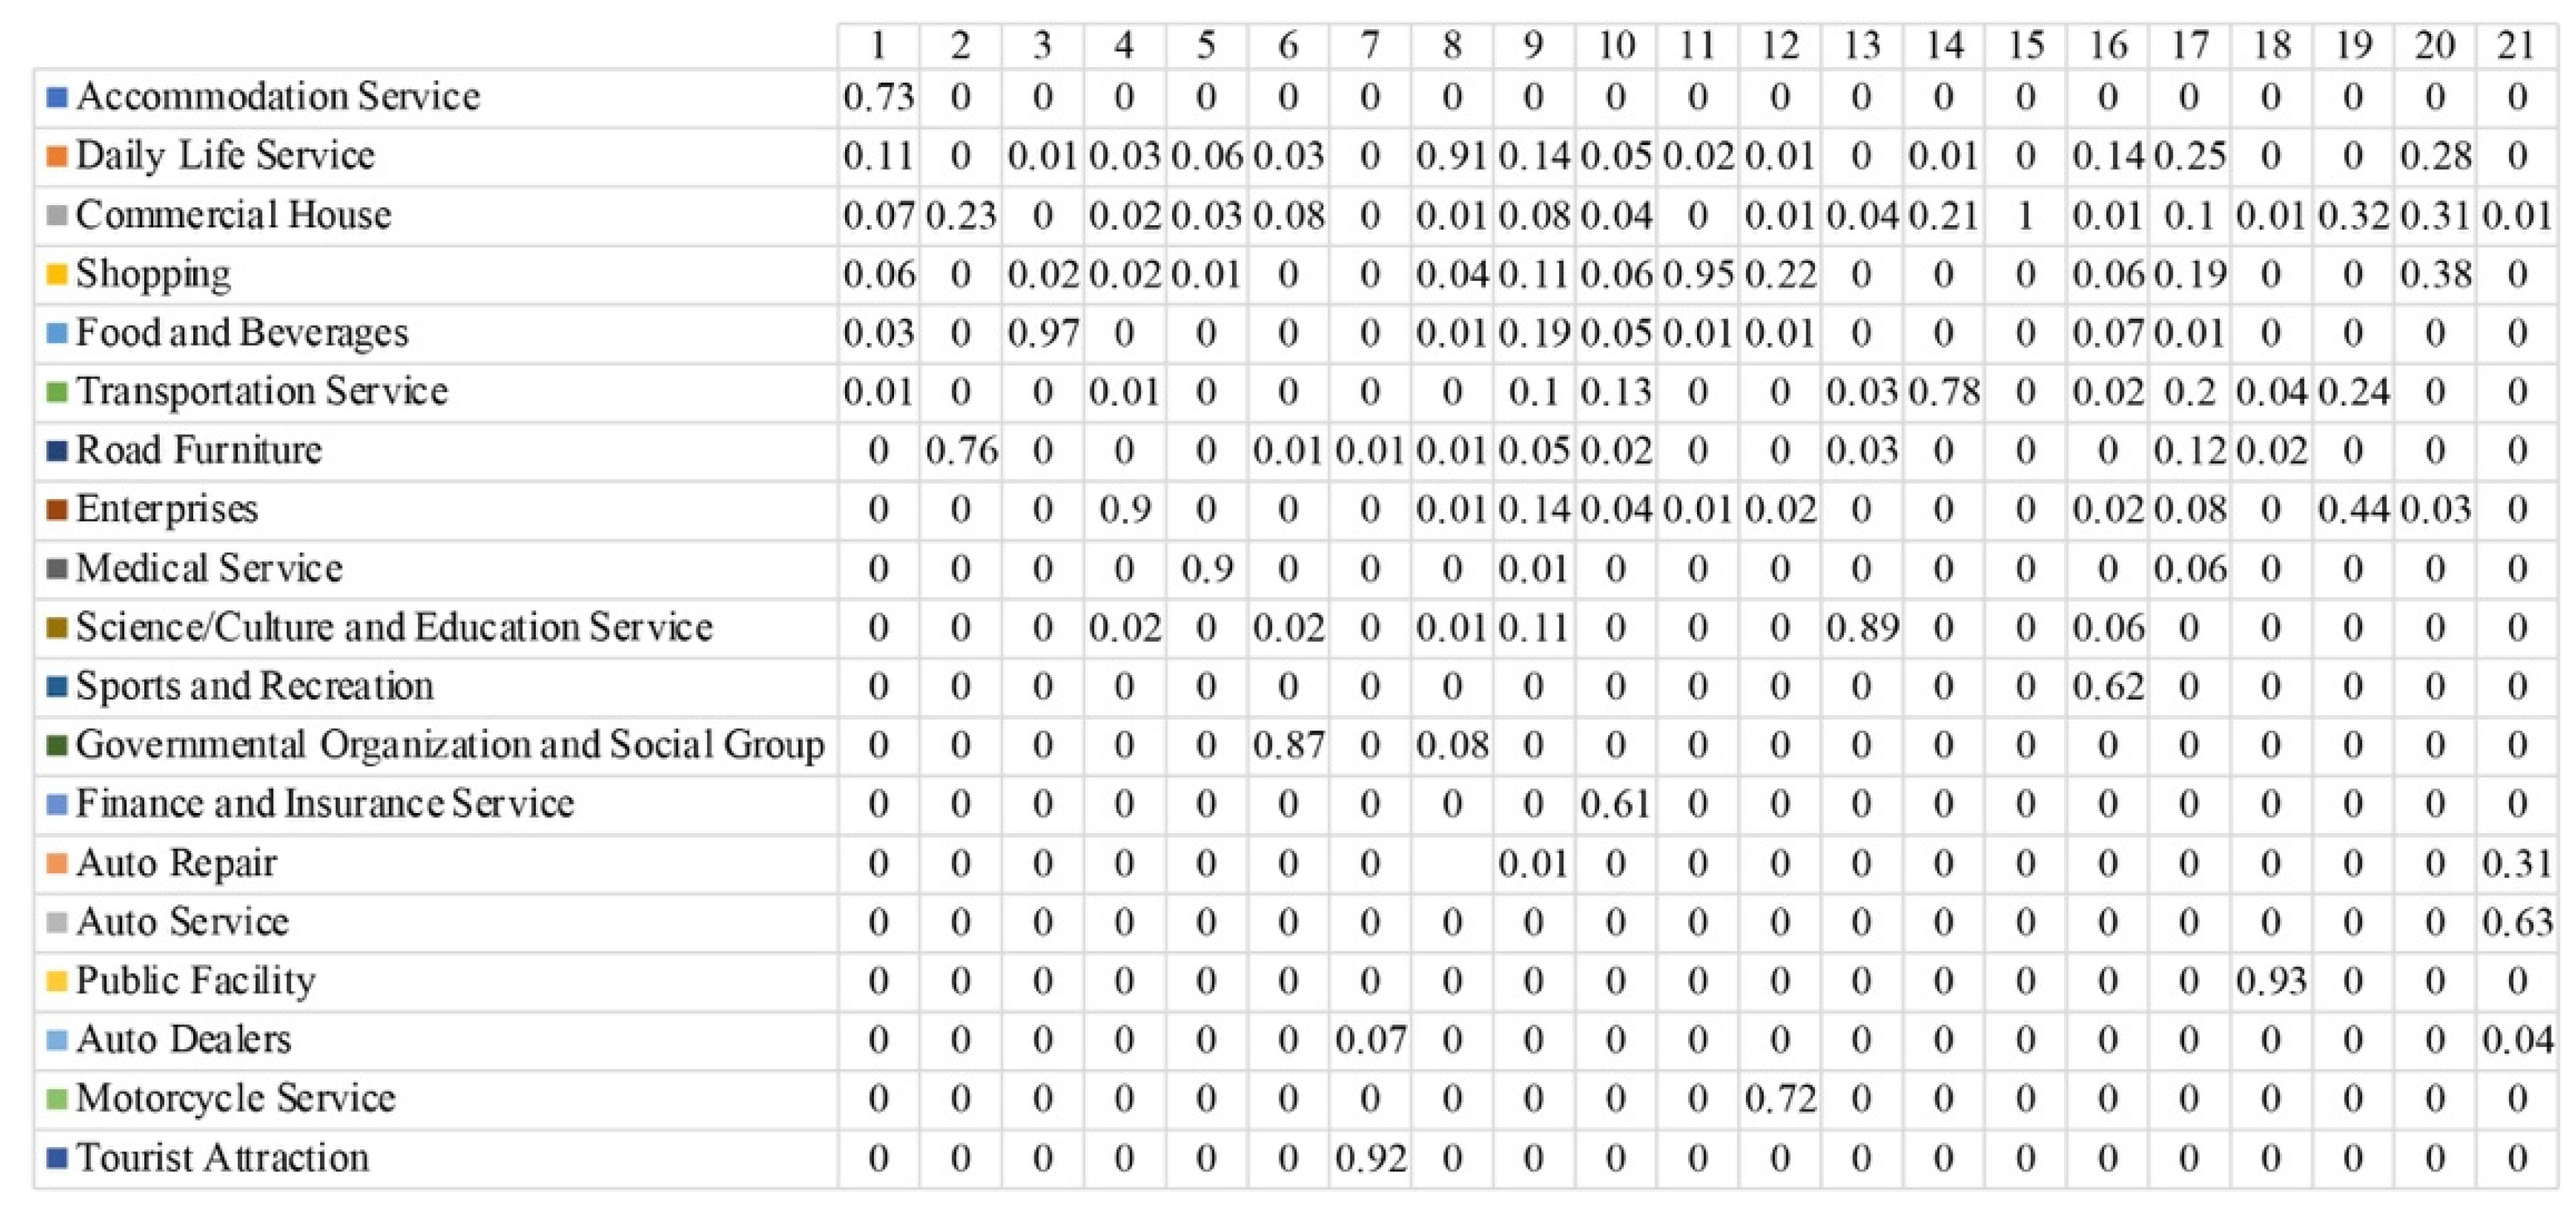
5.2. Topic Modeling Results
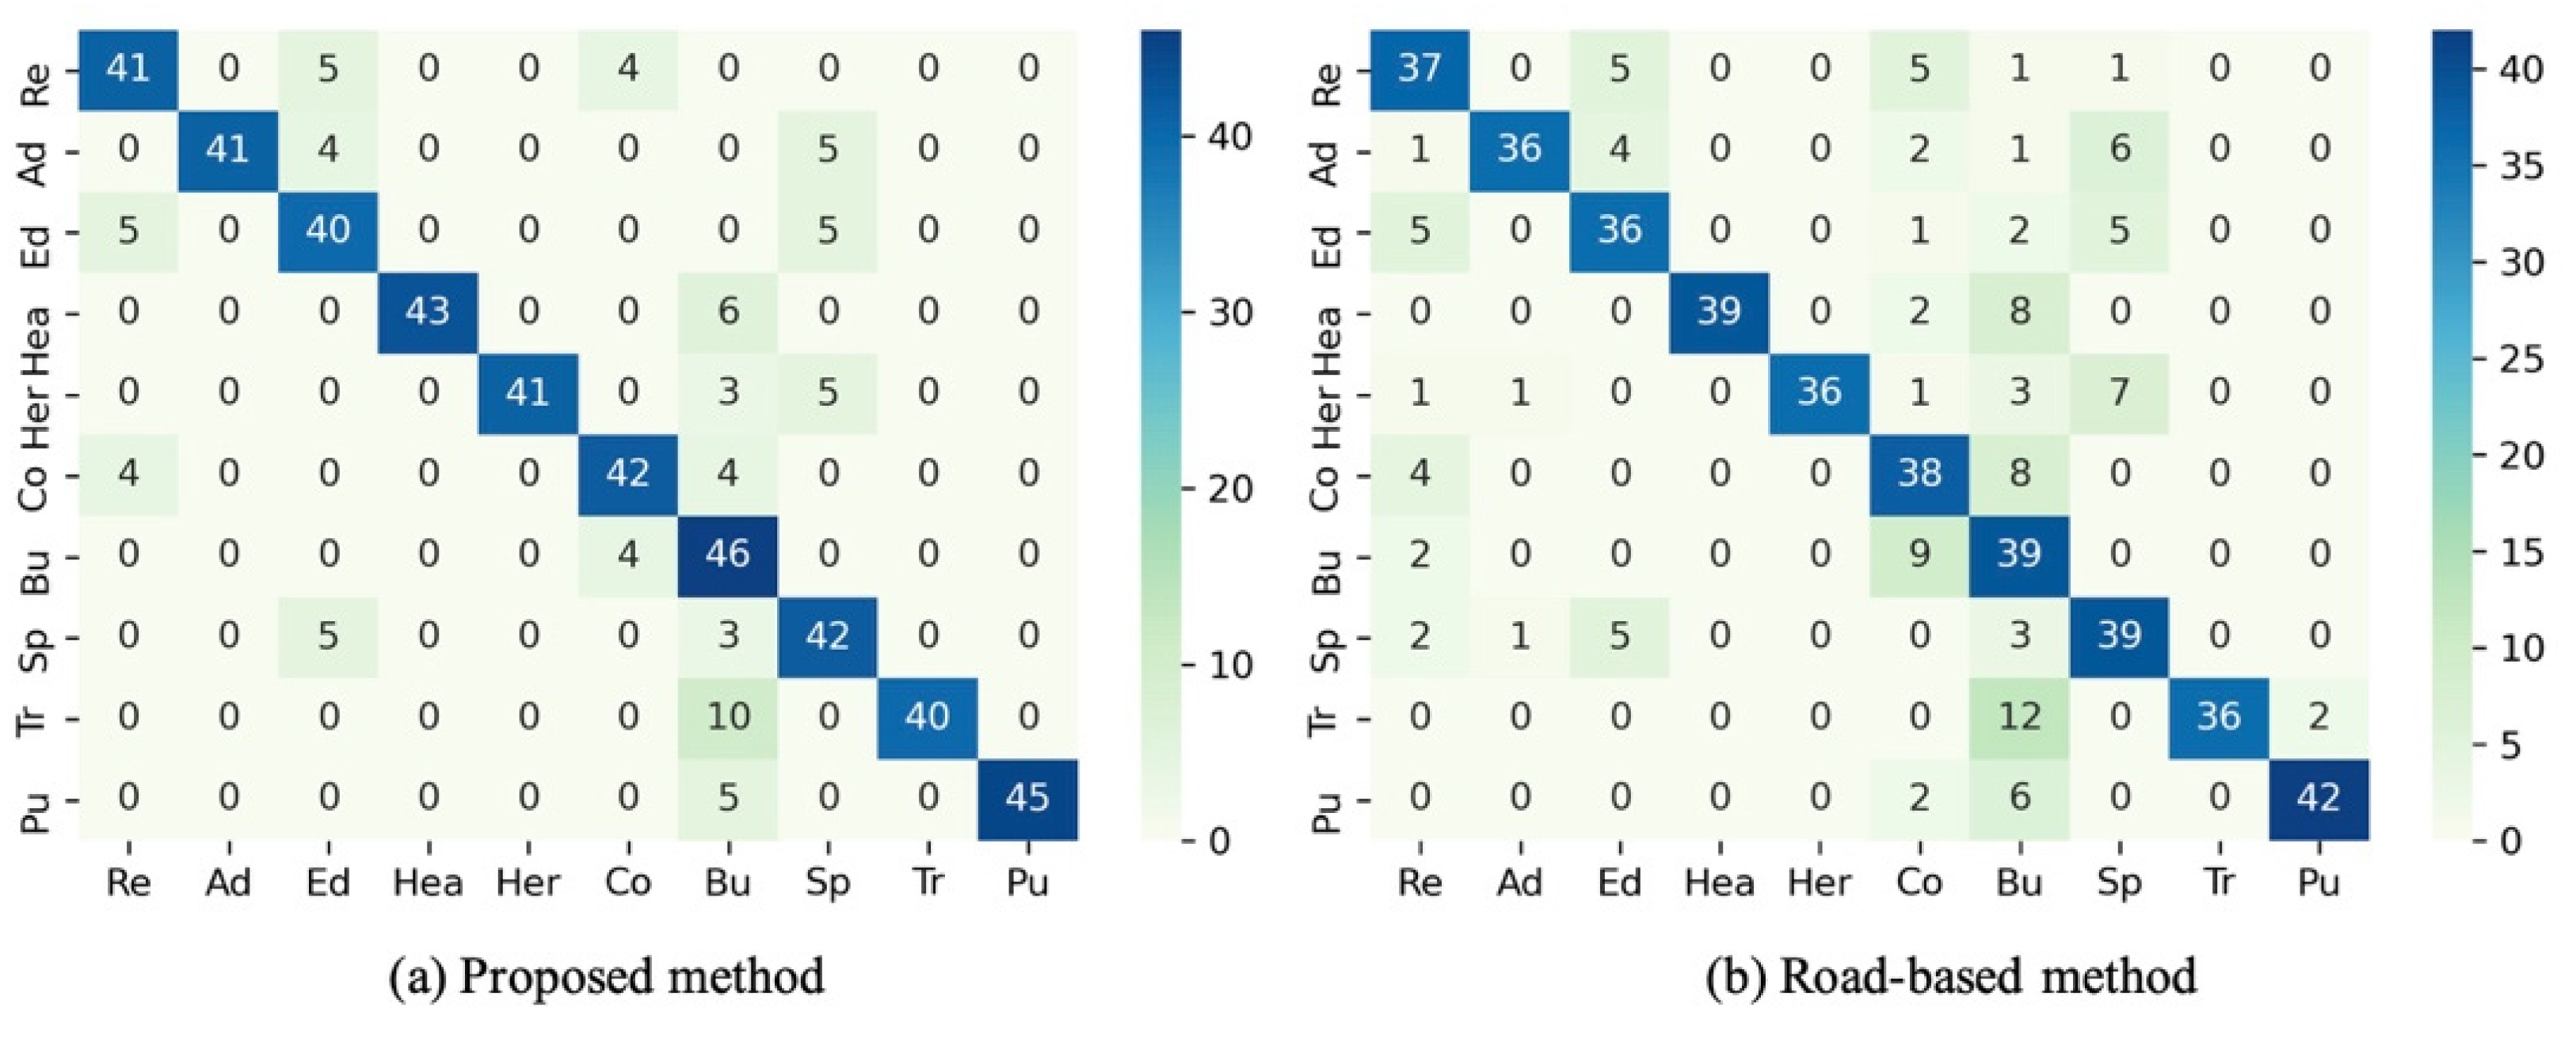
5.3. Classification Results
6. Discussion
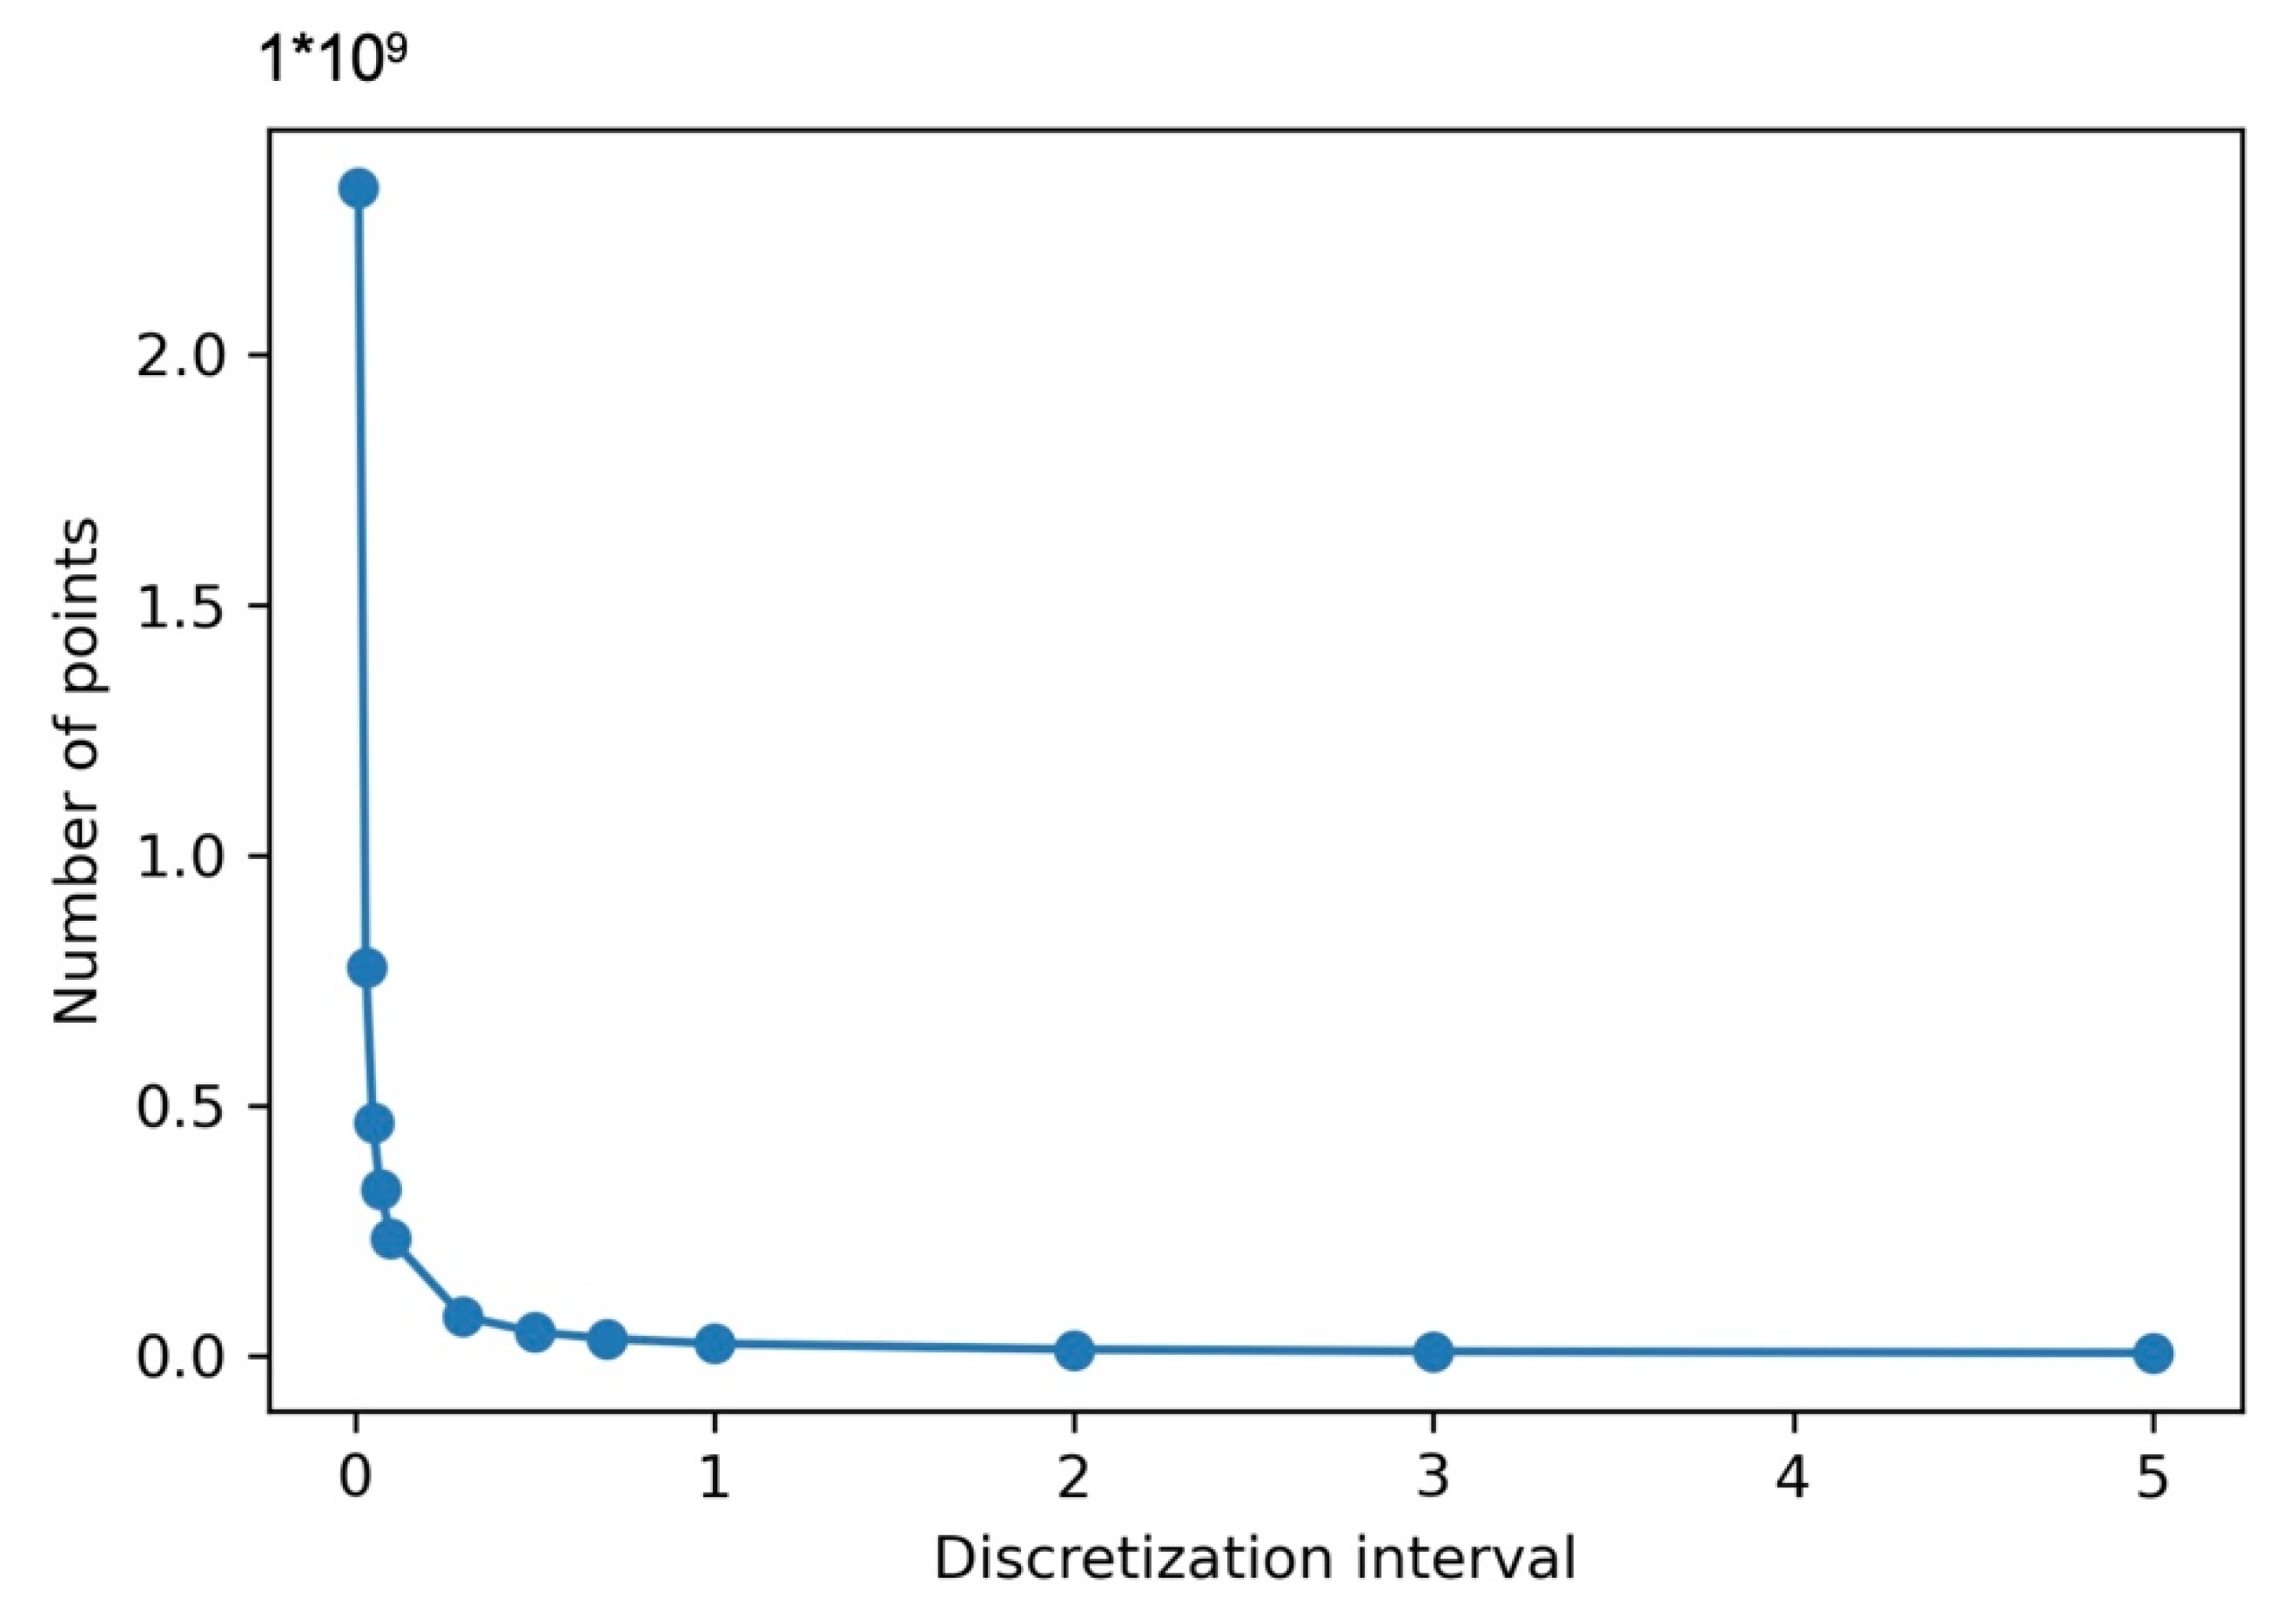
6.1. Parameter Sensitivity Analysis of Zone Segmentation
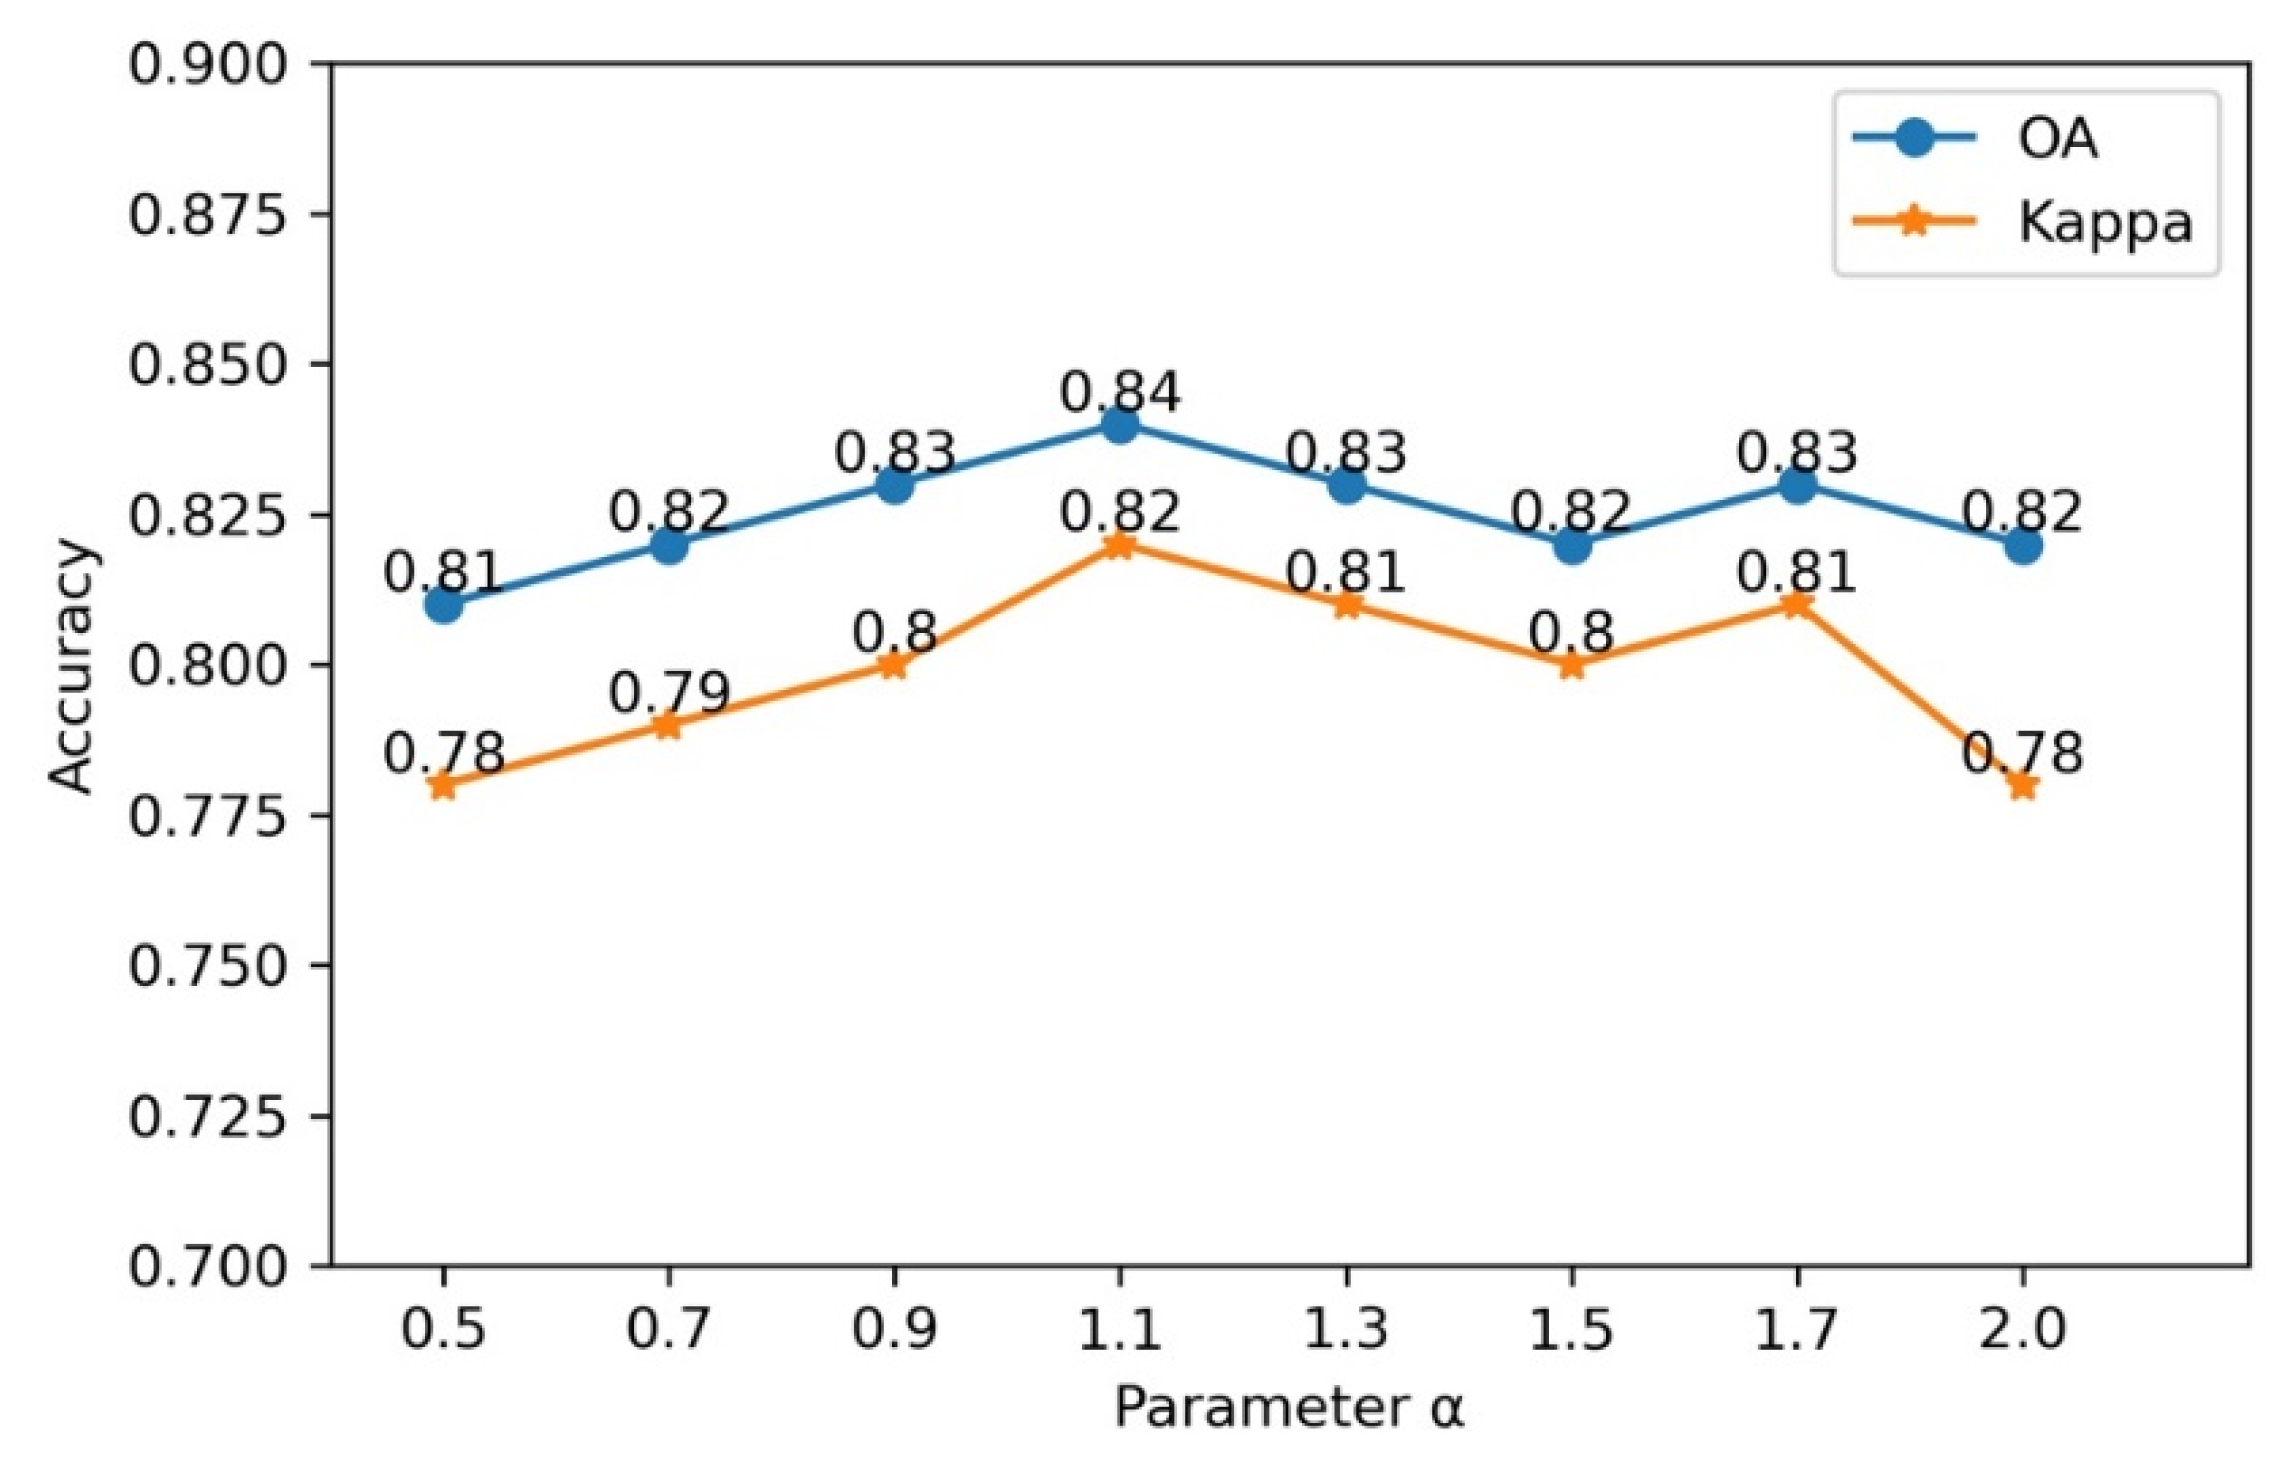
6.2. Parameter Sensitivity Analysis of LDA
- (1)
- Number of topics
- (2)
- Hyperparameter
6.3. Verification of the Classification Results
- (1)
- UFZ Mapping Units Assessment
- (2)
- Accuracy Assessment
6.4. Efficacy and Limitations
7. Conclusions
Author Contributions
Funding
Data Availability Statement
Acknowledgments
Conflicts of Interest
References
- Du, S.; Du, S.; Liu, B.; Zhang, X. Mapping large-scale and fine-grained urban functional zones from VHR images using a multi-scale semantic segmentation network and object based approach. Remote Sens. Environ. 2021, 261, 112480. [Google Scholar] [CrossRef]
- Jokar Arsanjani, J.; Helbich, M.; Bakillah, M.; Hagenauer, J.; Zipf, A. Toward mapping land-use patterns from volunteered geographic information. Int. J. Geogr. Inf. Sci. 2013, 27, 2264–2278. [Google Scholar] [CrossRef]
- Gao, S.; Janowicz, K.; Couclelis, H. Extracting urban functional regions from points of interest and human activities on location-based social networks. Trans. GIS 2017, 21, 446–467. [Google Scholar] [CrossRef]
- Niu, H.; Silva, E.A. Delineating urban functional use from points of interest data with neural network embedding: A case study in Greater London. Comput. Environ. Urban Syst. 2021, 88, 101651. [Google Scholar] [CrossRef]
- Yao, Y.; Li, X.; Liu, X.; Liu, P.; Liang, Z.; Zhang, J.; Mai, K. Sensing spatial distribution of urban land use by integrating points-of-interest and Google Word2Vec model. Int. J. Geogr. Inf. Sci. 2017, 31, 825–848. [Google Scholar] [CrossRef]
- Huang, X.; Yang, J.; Li, J.; Wen, D. Urban functional zone mapping by integrating high spatial resolution nighttime light and daytime multi-view imagery. ISPRS J. Photogramm. Remote Sens. 2021, 175, 403–415. [Google Scholar] [CrossRef]
- Tu, W.; Hu, Z.; Li, L.; Cao, J.; Jiang, J.; Li, Q.; Li, Q. Portraying Urban Functional Zones by Coupling Remote Sensing Imagery and Human Sensing Data. Remote Sens. 2018, 10, 141. [Google Scholar] [CrossRef] [Green Version]
- Liu, X.; He, J.; Yao, Y.; Zhang, J.; Liang, H.; Wang, H.; Hong, Y. Classifying urban land use by integrating remote sensing and social media data. Int. J. Geogr. Inf. Sci. 2017, 31, 1675–1696. [Google Scholar] [CrossRef]
- Martin, D.; Cockings, S.; Harfoot, A. Development of a geographical framework for census workplace data. J. R. Stat. Soc. Ser. A (Stat. Soc.) 2013, 176, 585–602. [Google Scholar] [CrossRef]
- Longley, P. Geographical Information Systems: A renaissance of geodemographics for public service delivery. Prog. Hum. Geogr. 2005, 29, 57–63. [Google Scholar] [CrossRef]
- Yuan, N.J.; Zheng, Y.; Xie, X.; Wang, Y.; Zheng, K.; Xiong, H. Discovering Urban Functional Zones Using Latent Activity Trajectories. IEEE Trans. Knowl. Data Eng. 2015, 27, 712–725. [Google Scholar] [CrossRef]
- Tu, W.; Cao, J.; Yue, Y.; Shaw, S.L.; Zhou, M.; Wang, Z.; Chang, X.; Xu, Y.; Li, Q. Coupling mobile phone and social media data: A new approach to understanding urban functions and diurnal patterns. Int. J. Geogr. Inf. Sci. 2017, 31, 2331–2358. [Google Scholar] [CrossRef]
- Song, J.; Lin, T.; Li, X.; Prishchepov, A.V. Mapping Urban Functional Zones by Integrating Very High Spatial Resolution Remote Sensing Imagery and Points of Interest: A Case Study of Xiamen, China. Remote Sens. 2018, 10, 1737. [Google Scholar] [CrossRef] [Green Version]
- Hu, Y.; Han, Y. Identification of Urban Functional Areas Based on POI Data: A Case Study of the Guangzhou Economic and Technological Development Zone. Sustainability 2019, 11, 1385. [Google Scholar] [CrossRef] [Green Version]
- Zhai, W.; Bai, X.; Shi, Y.; Han, Y.; Peng, Z.-R.; Gu, C. Beyond Word2vec: An approach for urban functional region extraction and identification by combining Place2vec and POIs. Comput. Environ. Urban Syst. 2019, 74, 1–12. [Google Scholar] [CrossRef]
- Li, W. Random texts exhibit Zipf’s-law-like word frequency distribution. IEEE Trans. Inf. Theory 1992, 38, 1842–1845. [Google Scholar] [CrossRef] [Green Version]
- Yuan, N.J.; Zheng, Y.; Xie, X. Discovering Functional Zones in a City Using Human Movements and Points of Interest. In Spatial Analysis and Location Modeling in Urban and Regional Systems; Thill, J.-C., Ed.; Springer: Berlin/Heidelberg, Germany, 2018; pp. 33–62. [Google Scholar]
- Chi, J.; Jiao, L.; Dong, T.; Gu, Y.; Ma, Y. Quantitative identification and visualization of urban functional area based on POI data. J. Geomat. 2016, 41, 68–73. [Google Scholar] [CrossRef]
- Hu, T.; Yang, J.; Li, X.; Gong, P. Mapping Urban Land Use by Using Landsat Images and Open Social Data. Remote Sens. 2016, 8, 151. [Google Scholar] [CrossRef]
- Openshaw, S. Ecological fallacies and the analysis of areal census data. Environ. Plan. A 1984, 16, 17–31. [Google Scholar] [CrossRef] [Green Version]
- Wang, N.; Li, W.; Tao, R.; Du, Q. Graph-based block-level urban change detection using Sentinel-2 time series. Remote Sens. Environ. 2022, 274, 112993. [Google Scholar] [CrossRef]
- Zhou, W.; Ming, D.; Lv, X.; Zhou, K.; Bao, H.; Hong, Z. SO–CNN based urban functional zone fine division with VHR remote sensing image. Remote Sens. Environ. 2020, 236, 111458. [Google Scholar] [CrossRef]
- Liu, Y.; Zhang, Y.; Jin, S.T.; Liu, Y. Spatial pattern of leisure activities among residents in Beijing, China: Exploring the impacts of urban environment. Sustain. Cities Soc. 2020, 52, 101806. [Google Scholar] [CrossRef]
- Niu, H.; Silva, E.A. Crowdsourced Data Mining for Urban Activity: Review of Data Sources, Applications, and Methods. J. Urban Plan. Dev. 2020, 146, 04020007. [Google Scholar] [CrossRef] [Green Version]
- Li, X.; Hu, T.; Gong, P.; Du, S.; Chen, B.; Li, X.; Dai, Q. Mapping Essential Urban Land Use Categories in Beijing with a Fast Area of Interest (AOI)-Based Method. Remote Sens. 2021, 13, 477. [Google Scholar] [CrossRef]
- Sun, Z.; Li, X.; Fu, W.; Li, Y.; Tang, D. Long-term effects of land use/land cover change on surface runoff in urban areas of Beijing, China. J. Appl. Remote Sens. 2013, 8, 084596. [Google Scholar] [CrossRef] [Green Version]
- Zhao, L.; Li, Y. Study on Urban Road Network Traffic District Division based on Clustering Analysis. In Proceedings of the 2018 Chinese Automation Congress (CAC), Xi’an, China, 30 November–2 December 2018; pp. 3556–3560. [Google Scholar]
- Chen, Y.; Liu, X.; Li, X.; Liu, X.; Yao, Y.; Hu, G.; Xu, X.; Pei, F. Delineating urban functional areas with building-level social media data: A dynamic time warping (DTW) distance based k -medoids method. Landsc. Urban Plan. 2017, 160, 48–60. [Google Scholar] [CrossRef]
- Blei, D.M.; Ng, A.; Jordan, M.I. Latent dirichlet allocation. J. Mach. Learn. Res. 2003, 30, 993–1022. [Google Scholar] [CrossRef]
- Du, S.; Du, S.; Liu, B.; Zhang, X.; Zheng, Z. Large-scale urban functional zone mapping by integrating remote sensing images and open social data. GISci. Remote Sens. 2020, 57, 411–430. [Google Scholar] [CrossRef]
- Cortes, C.; Vapnik, V. Support-Vector Networks. Mach. Learn. 1995, 20, 273–297. [Google Scholar] [CrossRef]
- Fleischmann, M.; Feliciotti, A.; Romice, O.; Porta, S. Morphological tessellation as a way of partitioning space: Improving consistency in urban morphology at the plot scale. Comput. Environ. Urban Syst. 2020, 80, 101441. [Google Scholar] [CrossRef]
- Zhang, Y.; Li, Q.; Huang, H.; Wu, W.; Du, X.; Wang, H. The Combined Use of Remote Sensing and Social Sensing Data in Fine-Grained Urban Land Use Mapping: A Case Study in Beijing, China. Remote Sens. 2017, 9, 865. [Google Scholar] [CrossRef] [Green Version]
- Deng, Y.; Liu, J.; Luo, A.; Wang, Y.; Xu, S.; Ren, F.; Su, F. Spatial Mismatch between the Supply and Demand of Urban Leisure Services with Multisource Open Data. ISPRS Int. J. Geo-Inf. 2020, 9, 466. [Google Scholar] [CrossRef]
- Ji, S.; Wei, S.; Lu, M. Fully Convolutional Networks for Multisource Building Extraction From an Open Aerial and Satellite Imagery Data Set. IEEE Trans. Geosci. Remote Sens. 2019, 57, 574–586. [Google Scholar] [CrossRef]
- Chen, K.; Fu, K.; Gao, X.; Yan, M.; Sun, X.; Zhang, H. Building extraction from remote sensing images with deep learning in a supervised manner. In Proceedings of the 2017 IEEE International Geoscience and Remote Sensing Symposium (IGARSS), Fort Worth, TX, USA, 23–28 July 2017; pp. 1672–1675. [Google Scholar]


| Variables | Definition |
|---|---|
| Word | POI category |
| Dictionary | All POI categories |
| Document | Set of POI categories in a spatial analysis unit |
| Topic | Function of the spatial analysis unit |
| Category 1 | Category 2 |
|---|---|
| Residential | Residential (Re 1) |
| Administration and Public Services | Administrative Office Space (Ad 1) |
| Education and Scientific Research (Ed 1) | |
| Health Care (Hea 1) | |
| Heritage (Her 1) | |
| Commercial and Business Facilities | Commercial Facility (Co 1) |
| Business Facility (Bu 1) | |
| Sport and Recreation Facility (Sp 1) | |
| Road, Street and Transportation | Transportation Service (Tr 1) |
| Municipal Utilities | Public Facility (Pb 1) |
| UFZ Category | Top Words in Each UFZ Category | Average Probability Distribution in Each UFZ Category |
|---|---|---|
| Residential | Commercial Houses Transportation Services Road Furniture | 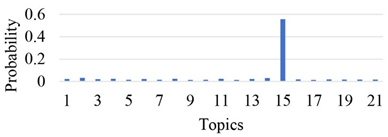 |
| Administrative Office Spaces | Governmental Organization and Social Group Commercial Houses Science/Culture and Education Services | 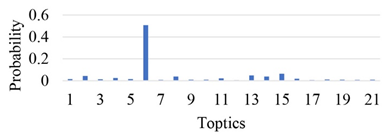 |
| Education and Scientific Research | Science/Culture and Education Services Commercial Houses Road Furniture |  |
| Health Care | Medical Services Road Furniture Transportation Services | 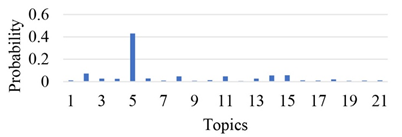 |
| Heritage Sites | Tourist Attractions Commercial Houses Road Furniture | 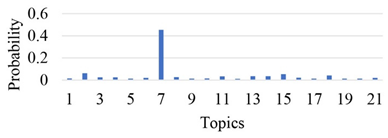 |
| Commercial Facilities | Shopping Daily Life Services Food and Beverages | 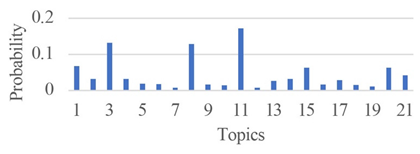 |
| Business Facilities | Enterprises Commercial Houses Science/Culture and Education Services | 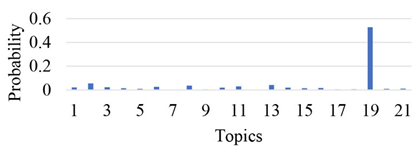 |
| Sport and Recreation Facilities | Sports and Recreation Science/Culture and Education Services Road Furniture | 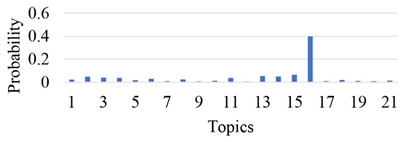 |
| Transportation Services | Road Furniture Transportation Services Commercial Houses |  |
| Public Facilities | Public Facility Commercial Houses Shopping | 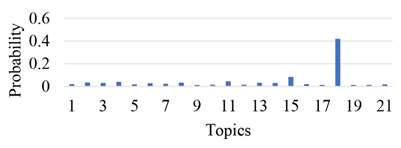 |
| UFZ Categories | Topics = 26 | Topics = 22 | Topics = 21 | Topics = 18 | Topics = 14 | Topics = 10 | Topics = 6 |
|---|---|---|---|---|---|---|---|
| Residential | 1 | 2 | 1 | 2 | 1 | 1 | 1 |
| Administrative Office Space | 2 | 3 | 1 | 1 | 1 | 1 | 0 |
| Education and Scientific Research | 1 | 1 | 1 | 2 | 1 | 1 | 1 |
| Health Care | 1 | 1 | 1 | 1 | 1 | 1 | 0 |
| Heritage | 1 | 1 | 1 | 0 | 0 | 0 | 0 |
| Commercial Facility | 11 | 10 | 9 | 6 | 6 | 3 | 2 |
| Business Facility | 4 | 1 | 3 | 2 | 2 | 1 | 1 |
| Sport and Recreation Facility | 1 | 0 | 1 | 1 | 0 | 0 | 0 |
| Transportation Service | 3 | 2 | 2 | 2 | 1 | 1 | 0 |
| Public Facility | 1 | 1 | 1 | 1 | 1 | 1 | 1 |
| Zoning Method | POI Class Richness | POI Class Diversity | ||||
|---|---|---|---|---|---|---|
| Mean | St. Dev. 1 | Median | Mean | St. Dev. | Median | |
| Proposed method | 3.3 | 2.6 | 2 | 0.84 | 0.64 | 0.69 |
| Road-based method | 17.2 | 3.5 | 18 | 2.30 | 0.39 | 2.45 |
Publisher’s Note: MDPI stays neutral with regard to jurisdictional claims in published maps and institutional affiliations. |
© 2022 by the authors. Licensee MDPI, Basel, Switzerland. This article is an open access article distributed under the terms and conditions of the Creative Commons Attribution (CC BY) license (https://creativecommons.org/licenses/by/4.0/).
Share and Cite
Deng, Y.; He, R. Refined Urban Functional Zone Mapping by Integrating Open-Source Data. ISPRS Int. J. Geo-Inf. 2022, 11, 421. https://doi.org/10.3390/ijgi11080421
Deng Y, He R. Refined Urban Functional Zone Mapping by Integrating Open-Source Data. ISPRS International Journal of Geo-Information. 2022; 11(8):421. https://doi.org/10.3390/ijgi11080421
Chicago/Turabian StyleDeng, Yue, and Rixing He. 2022. "Refined Urban Functional Zone Mapping by Integrating Open-Source Data" ISPRS International Journal of Geo-Information 11, no. 8: 421. https://doi.org/10.3390/ijgi11080421
APA StyleDeng, Y., & He, R. (2022). Refined Urban Functional Zone Mapping by Integrating Open-Source Data. ISPRS International Journal of Geo-Information, 11(8), 421. https://doi.org/10.3390/ijgi11080421