Article

Diffuse Anthropization Impacts in Vulnerable Protected Areas: Comparative Analysis of the Spatial Correlation between Land Transformation and Ecological Deterioration of Three Wetlands in Spain

by
Salvador Garcia-Ayllon
1,2,* and
John Radke
2,3
1
Department of Civil Engineering, Technical University of Cartagena, 30203 Cartagena, Spain
2
Department of Landscape Architecture and Environmental Planning, University of California Berkeley, Berkeley, CA 94720, USA
3
Department of City and Regional Planning, University of California Berkeley, Berkeley, CA 94720, USA
*
Author to whom correspondence should be addressed.
ISPRS Int. J. Geo-Inf. 2021, 10(9), 630; https://doi.org/10.3390/ijgi10090630
Submission received: 6 August 2021 / Revised: 9 September 2021 / Accepted: 16 September 2021 / Published: 21 September 2021

Abstract

:
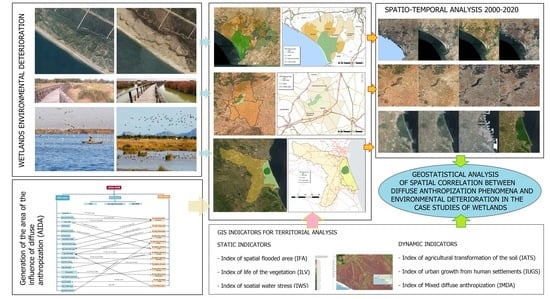
The management and conservation of wetlands and vulnerable protected areas of high ecological value dependent on the existence of water is complex and generally depends on the climate and rainfall in semi-arid territories such as southeastern Spain. However, one variable that is not usually considered sufficiently rigorously in this field of research is the environmental impact of the transformation of the surrounding territory due to anthropic diffuse issues. This phenomenon is not easy to appreciate, since it does not necessarily occur in the environment directly closest to protected areas and it is always difficult to measure and analyze. This study proposes an innovative spatiotemporal methodological framework to evaluate all these phenomena of diffuse anthropization whose indirect impacts on protected areas dependent on the existence of water are currently full of unknowns. Using GIS indicators, a geostatistical analysis based on the concept of the area of influence of diffuse anthropization (AIDA) is proposed to assess the spatial correlation between the anthropic transformation of the territory and the degradation of protected areas over time. The proposal has been applied with a comparative approach to three case studies located in Spain between 2000 and 2020, obtaining clarifying results on the existing spatial correlation patterns between both questions.

Graphical Abstract

1. Introduction

The management and conservation of wetlands and protected areas of high ecological value dependent on the existence of water is generally complex [1,2,3]. These are territories subject to a strong dependence on the climate and rainfall, in which important ecological values concur as they are a very important source of biodiversity as well as a place of passage for numerous species of birds in their migratory processes.
In Europe, there are various tools for the protection and management of these areas generally included in the Natura 2000 Network [4]. This regulatory framework establishes different categories of environmental values that have forced member countries to restrict their uses and anthropic activities within such spaces since the mid-1990s [5]. In most countries, national parks and protected areas of great importance additionally have a land reserve called a pre-park that serves as an anthropic buffer space for human activities. However, this level of protection has not always proved effective, since the threats facing these types of areas of high ecological value are sometimes located many kilometers from the protected natural space itself [6].
Maintaining a minimum amount of water within wetlands to preserve their level of quality means that not only surface conditions must be taken into account [7], but also the underground connections of these protected areas with their surrounding environment through aquifers. In this context, activities such as agriculture, livestock or the urban growth of populations have become very important anthropic impacts for this type of protected area, beyond the traditional impacts most commonly analyzed, such as industry or mining.
The water pollution phenomena that usually cause this second type of anthropic activity have been widely investigated from the point of view of disciplines such as chemistry and biology [8,9,10]. There are numerous mechanisms for measuring the presence and monitoring of heavy metals and chemicals that are harmful to ecosystems [11,12,13], which enable the origin of these pollution processes to be very reliably diagnosed.
Nevertheless, the impact caused by diffuse anthropization phenomena motivated by land transformation from activities such as agriculture or urban growth not geographically adjacent to the protected area is less common in the scientific literature [14]. In this regard, water loss is currently one of the main environmental problems in the management of wetlands in semi-arid environments [15,16,17]. The objective diagnosis of this complex problem is one of the main challenges at the scientific level for the survival of these protected spaces in developed countries such as Spain.
Large-scale transformation of the territory caused by agriculture or urbanization processes is very common in environments close to protected areas of high ecological value in countries with powerful agri-food and tourism industries, [18,19]. The development of new crop areas and resorts compete with natural protected areas such as wetlands for surface and subsoil water, sometimes even to the extent of incurring in the use of unauthorized catchment systems.
This type of phenomenon is much more difficult to analyze due to the difficulty in establishing a cause-effect relationship with clear evidence, such as the presence of polluting elements in the water [20]. The complexity of establishing an area of influence on the impact on protected areas and the large number of possible activities and affected areas as a consequence of the enormous size of many aquifers that supply these natural spaces make this phenomenon somewhat difficult for the authorities to control, although its consequences can easily be seen in the deterioration of natural protected areas due to the loss of water.
Currently, most of the existing approaches for the analysis of these problems are fundamentally centered on a diagnosis made from the point of view of hydrogeology [21,22,23]. This involves an attempt to know the behavior of aquifers by evaluating their water inlets and outlets as a mechanism for interpreting the whole phenomenon. However, such an approach does not allow a complete spatial assessment of the physical reality on which both anthropizing elements and the anthropized natural environment are based. Furthermore, it is difficult to assume a spatiotemporal analysis that evaluates the deterioration patterns of the protected area and what future trends may be [24,25].
Taking the shortcomings underlined by the literature review as the starting point, this study aims to propose an innovative methodological approach introducing the concept of Area of Influence of Diffuse Anthropization (AIDA). This concept is applied to address the analysis of this problem from a spatio-temporal comparative approach for three cases studies. Using territorial GIS indicators, a geostatistical analysis is carried out with the spatial correlation of the processes of transformation of the soil linked to anthropic activities in the AIDA of the protected areas and the evolution of the configuration and the existence of water therein.
This analysis has been carried out in an evolutionary way with georeferenced cartographic information of a historical nature between 2000 and 2020 for three wetlands of high ecological value in Spain with strong environmental imbalances: the Doñana National Park; the Tablas de Daimiel National Park; and the Albufera Natural Park. These three Spanish relevant protected wetlands, which have been included in the Natura 2000 Network for decades, are currently suffering significant environmental deterioration as a result of the loss of water due to anthropic causes. Such causes, despite being known, are often difficult to diagnose and objectively parameterize.
The comparative analysis carried out using GIS indicators allows us to establish both the benefits that this new approach can provide for the analysis and diagnosis of this problem, as well as its limitations depending on the configuration of the specific case study to be addressed.

2. Environmental Issues: Areas of Study

The three study areas will be described below, explaining the main existing boundary conditions for the comparative analysis.

2.1. National and Natural Park of Doñana

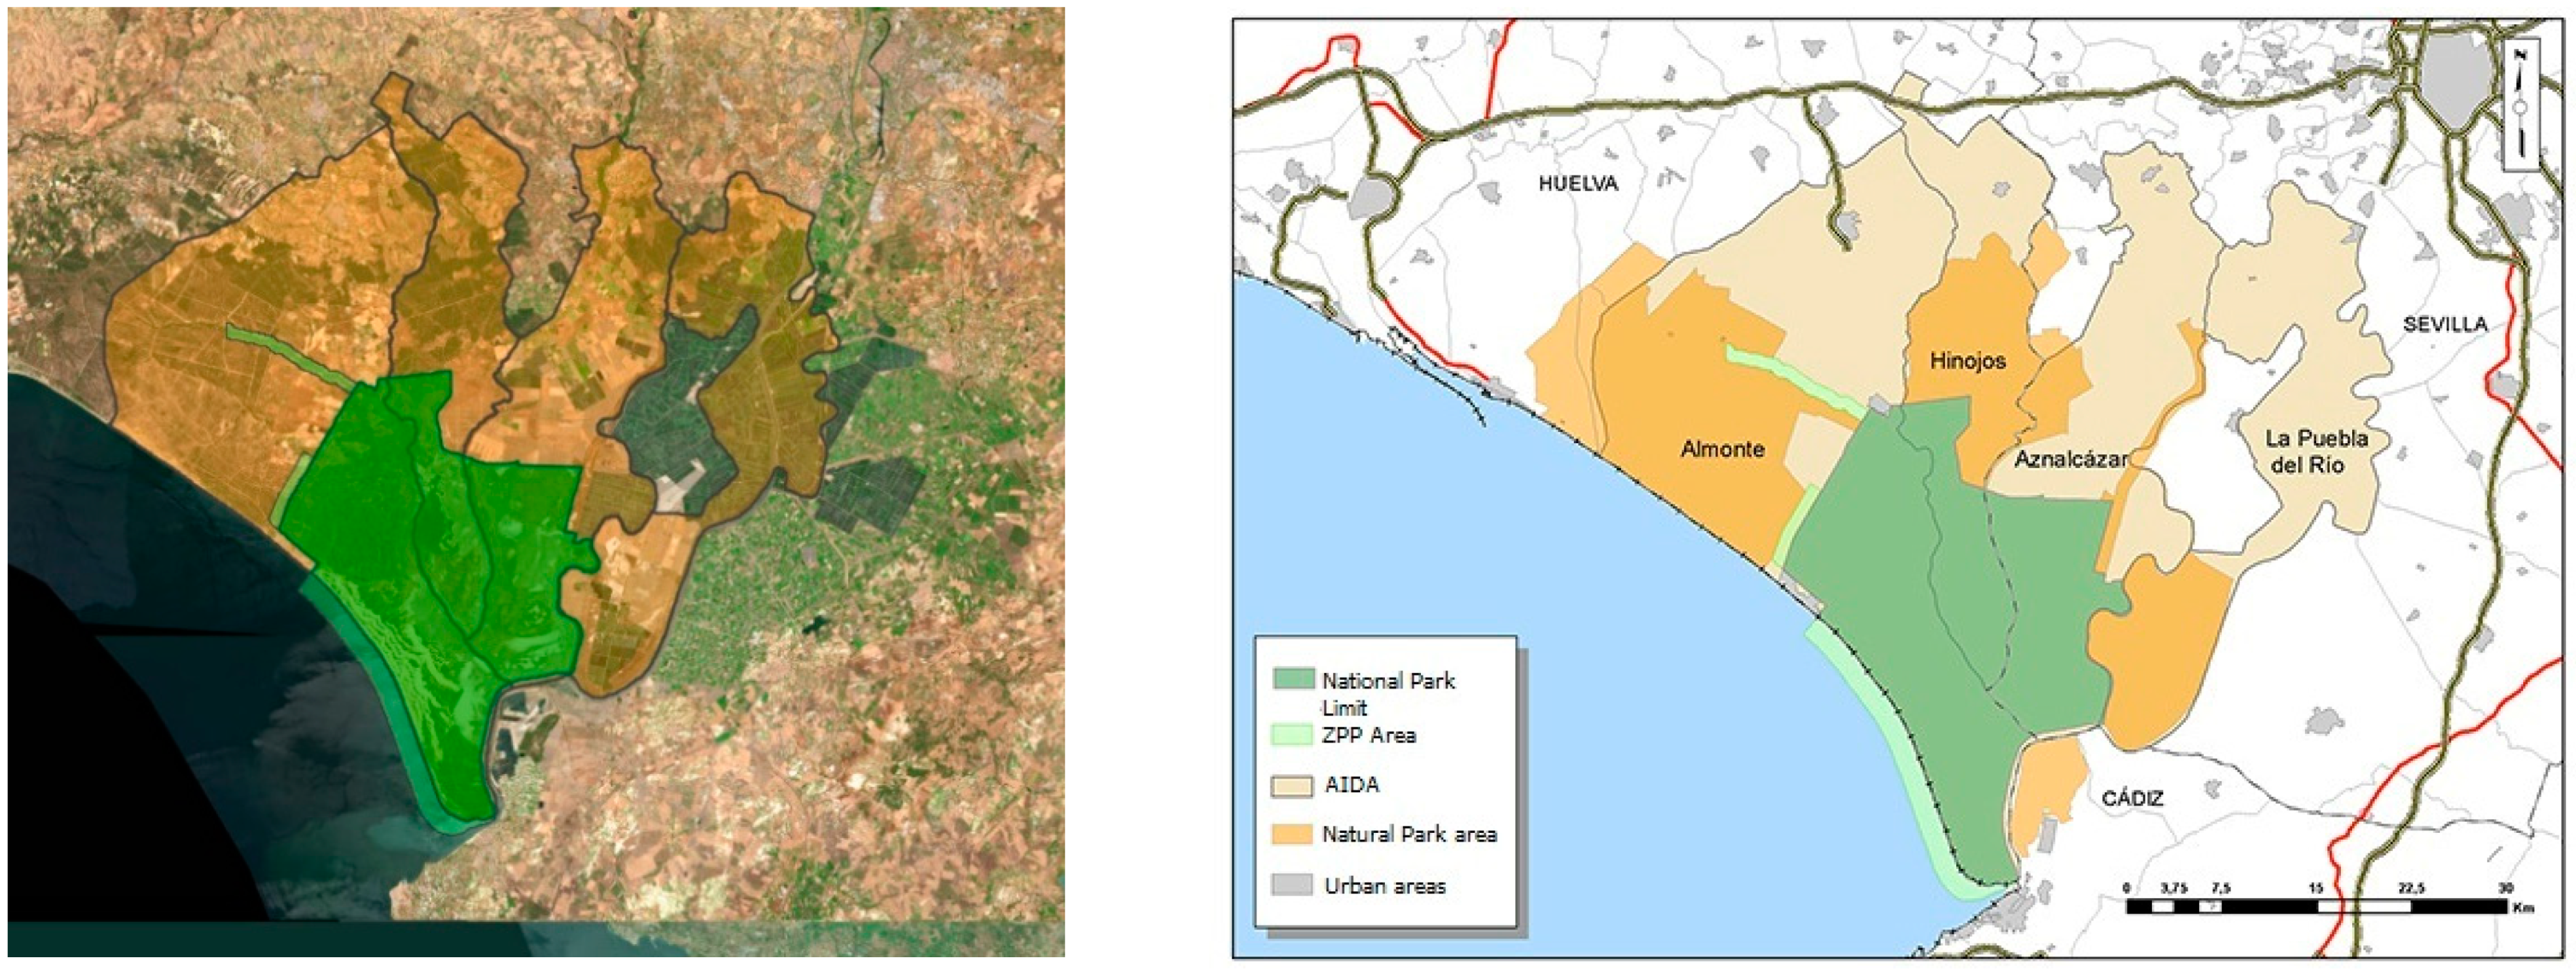
Doñana is a Spanish protected natural area located in Andalusia (Spain) covering 268,294 Ha. It comprises both the Doñana National Park created in 1969 and the Doñana Natural Park (also called the Doñana Environment Natural Park or pre-park, created in 1989 and expanded in 1997 and recently in 2016, see Figure 1). Thanks to its vast expanse of marshes, it is home to numerous species of aquatic birds during winter, which usually reach 200,000 individuals each year. Due to its privileged geographical location between two continents and its proximity to the Strait of Gibraltar, the meeting place of the Atlantic and the Mediterranean, more than 300 different species of birds can be seen in Doñana throughout the year.
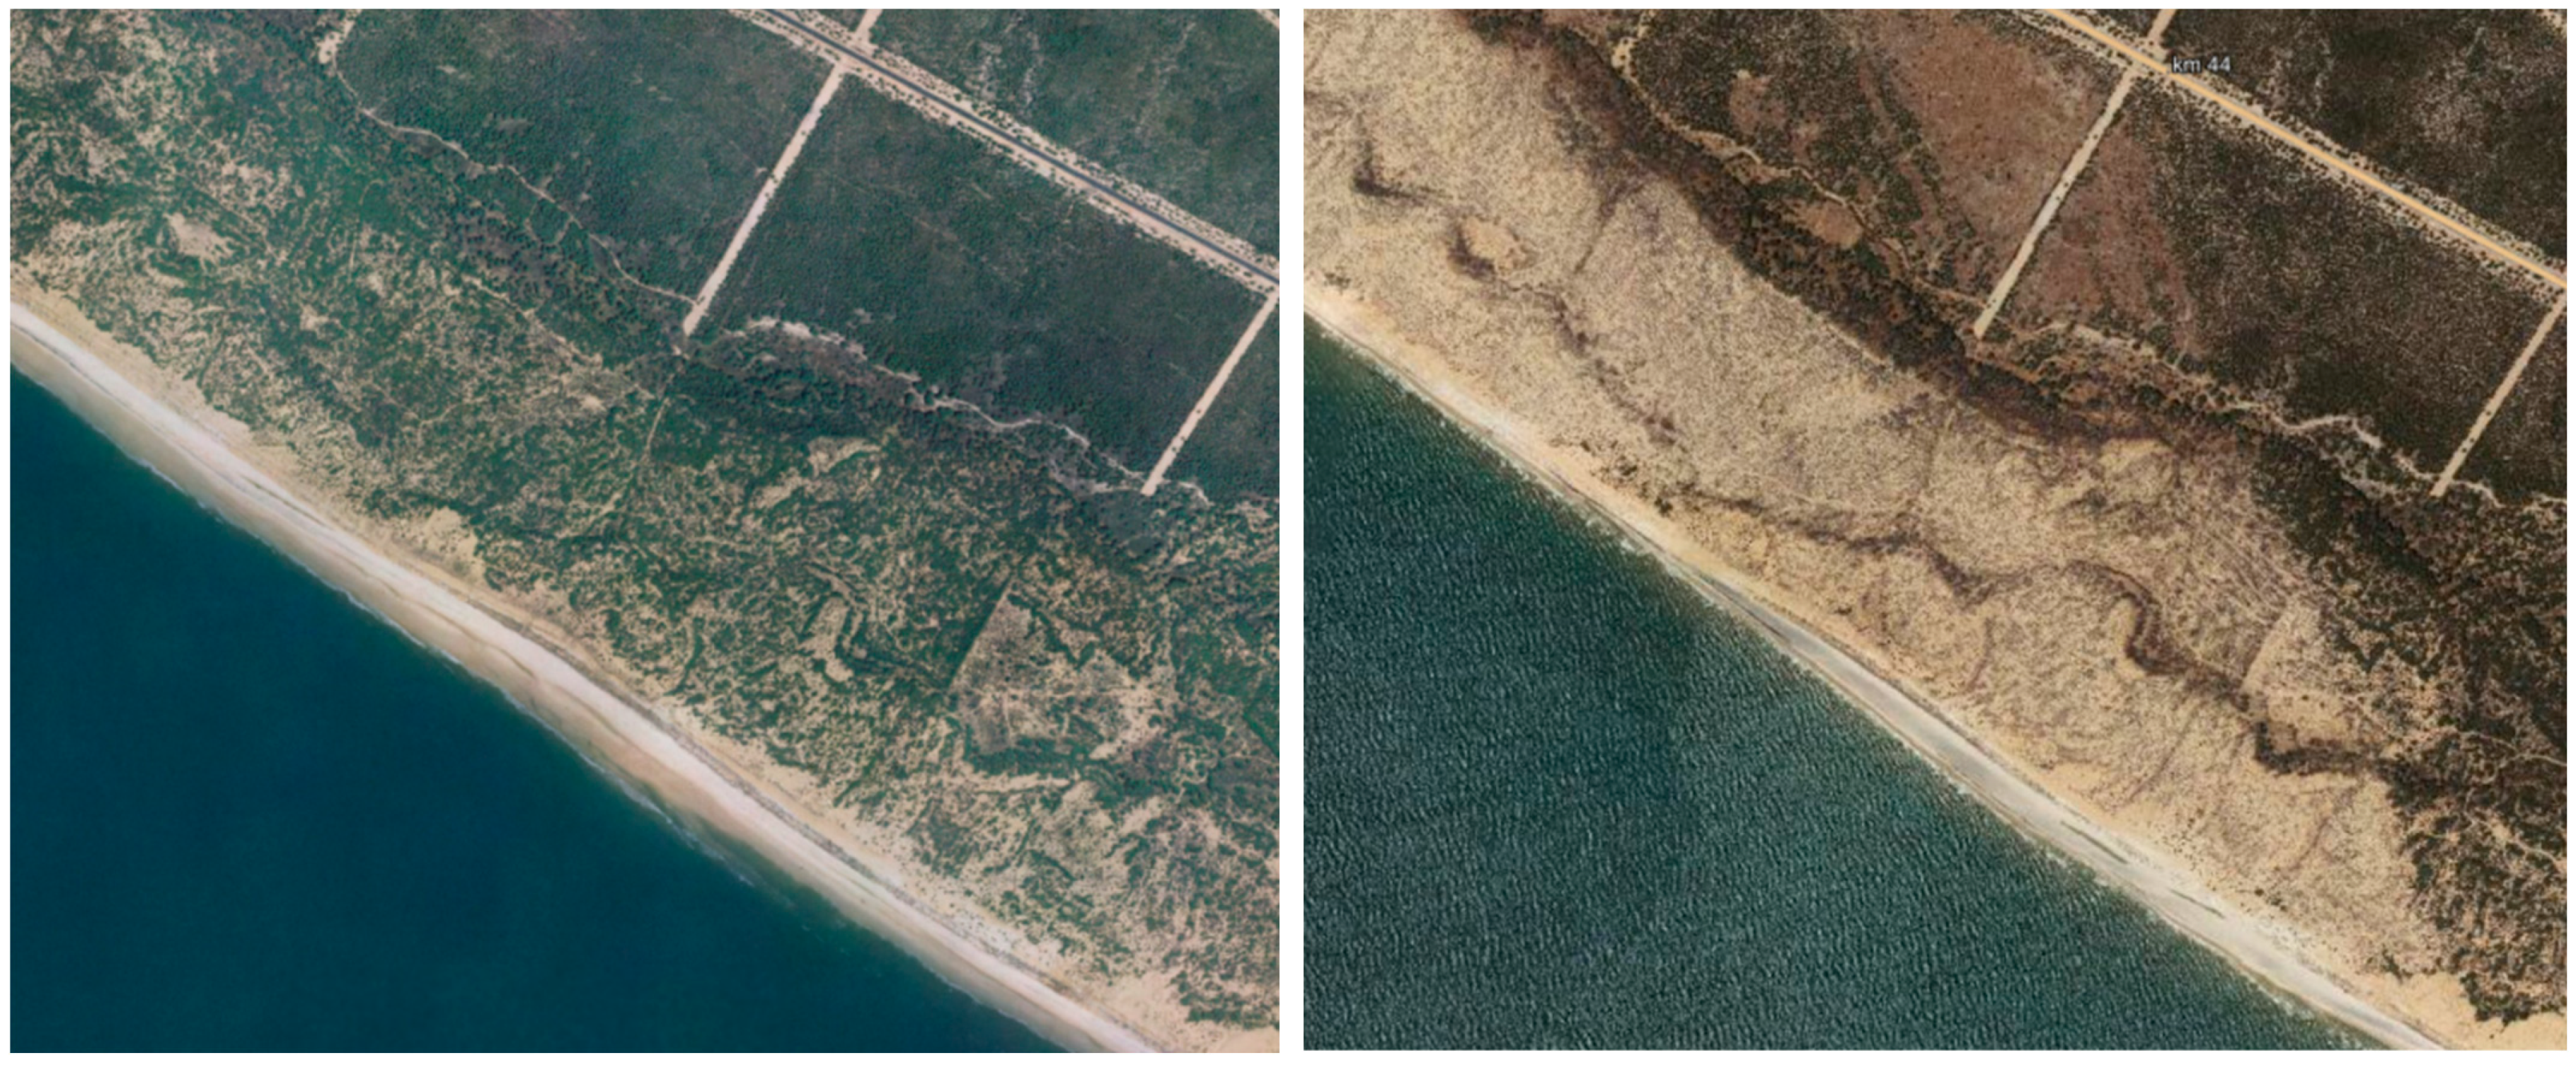
The Park was declared a World Heritage Site by UNESCO in 1994 and is currently considered the largest ecological reserve in Europe. It is included in the list of wetlands of the Ramsar Convention and is part of the network of protected areas Natura 2000 of the European Union. Despite this, the park has been subjected to a varied catalogue of anthropic pressures for decades and which have been referenced in numerous studies [26,27], to the point that UNESCO has on several occasions studied the inclusion of the park on the list of world heritage in danger because of the ecological deterioration of several of its areas (Figure 2).
Among all these environmental impacts, the most serious problem today is the water loss probably associated with withdrawals—many of them illegal—from the aquifer, for irrigation. This has greatly increased since the late 1980s to maintain intensive crops such as cotton, rice and more recently that of red fruits (especially strawberry, [28,29]). The latter is cultivated in greenhouses, the area under plastic in the Doñana area is estimated to be between 4500 and 6000 Ha, accounting for more than 60% of the Spanish strawberry production [30]. In recent years, the authorities have closed down numerous illegal wells built in these plantations and greenhouses, which were drawing water from the aquifer that feeds the natural park. However, it is difficult to know the exact number of illegal wells in the area of influence of this protected space and, therefore, the real imbalance that exists. Another difficult issue to evaluate is also the impact of the adjoining urban areas, given that the Natural Park covers the territory of four municipalities even including some urban areas [31]. The water demands of nearby urban areas such as Matalascañas, a coastal town with strong population growth due to tourism in recent years, may for instance be affecting the natural dynamics of waters in the park.

2.2. Tablas de Damiel National Park

The Las Tablas de Daimiel National Park is a Spanish national park that protects the homonymous wetland, the Tablas de Daimiel. It was declared a National Park in 1973, a Biosphere Reserve in 1981 and included in the Ramsar Convention in 1982. The national park is located in the land-locked autonomous community of Castilla-La Mancha (Figure 3) and is part of the Natura 2000 Network as a special protection area for birds (SPA) with a total area of 3030 Ha that host up to 250 different species of migratory birds [32].
The Tablas de Daimiel is one of the last representatives of an ecosystem called river tables that are formed when the rivers overflow in their middle sections, favored by phenomena of semi-endorheism and the scarcity of slopes. The wetland is formed at the confluence of the Guadiana River and its tributary Cigüela and is one of the most important aquatic ecosystems in the Iberian Peninsula, due to the variety and quality of the fauna and flora that inhabit it, as well as the birds using it in their migratory processes [33].
Nevertheless, the survival of the park has been in danger for a long time due to the overexploitation of the aquifers. Due to this degradation, the European Commission opened a sanctioning file against Spain in 2009 [34], while UNESCO has also expressed the possibility of withdrawing the figure of Biosphere Reserve on several occasions due to complaints from environmental organizations for the high-risk loss of natural values that qualified this cataloguing of the park.
In 2009, underground peat fires caused by the accumulation of gases derived from the drought added to the desiccation leading to a critical situation in the park. The degradation of the peat layer could even have compromised the waterproofing of the soil generated by the water basins or “tables”, forcing the national authorities to approve a transfer from the Tagus River. The subsequent arrival of abundant rains filled the entire floodable surface of the park, naturally quelling the underground fires and making it unnecessary to continue with the transfer [35].
Since then, hydric conditions have notably recovered and the level of the aquifer has risen more than 20 m, due to the end of a period of severe drought. However, in subsequent years the problems derived from the overexploitation of the aquifer have remained, forcing the authorities to control the extraction by farmers, through the acquisition of farms surrounding the natural park, in order to also acquire their extraction rights [36].
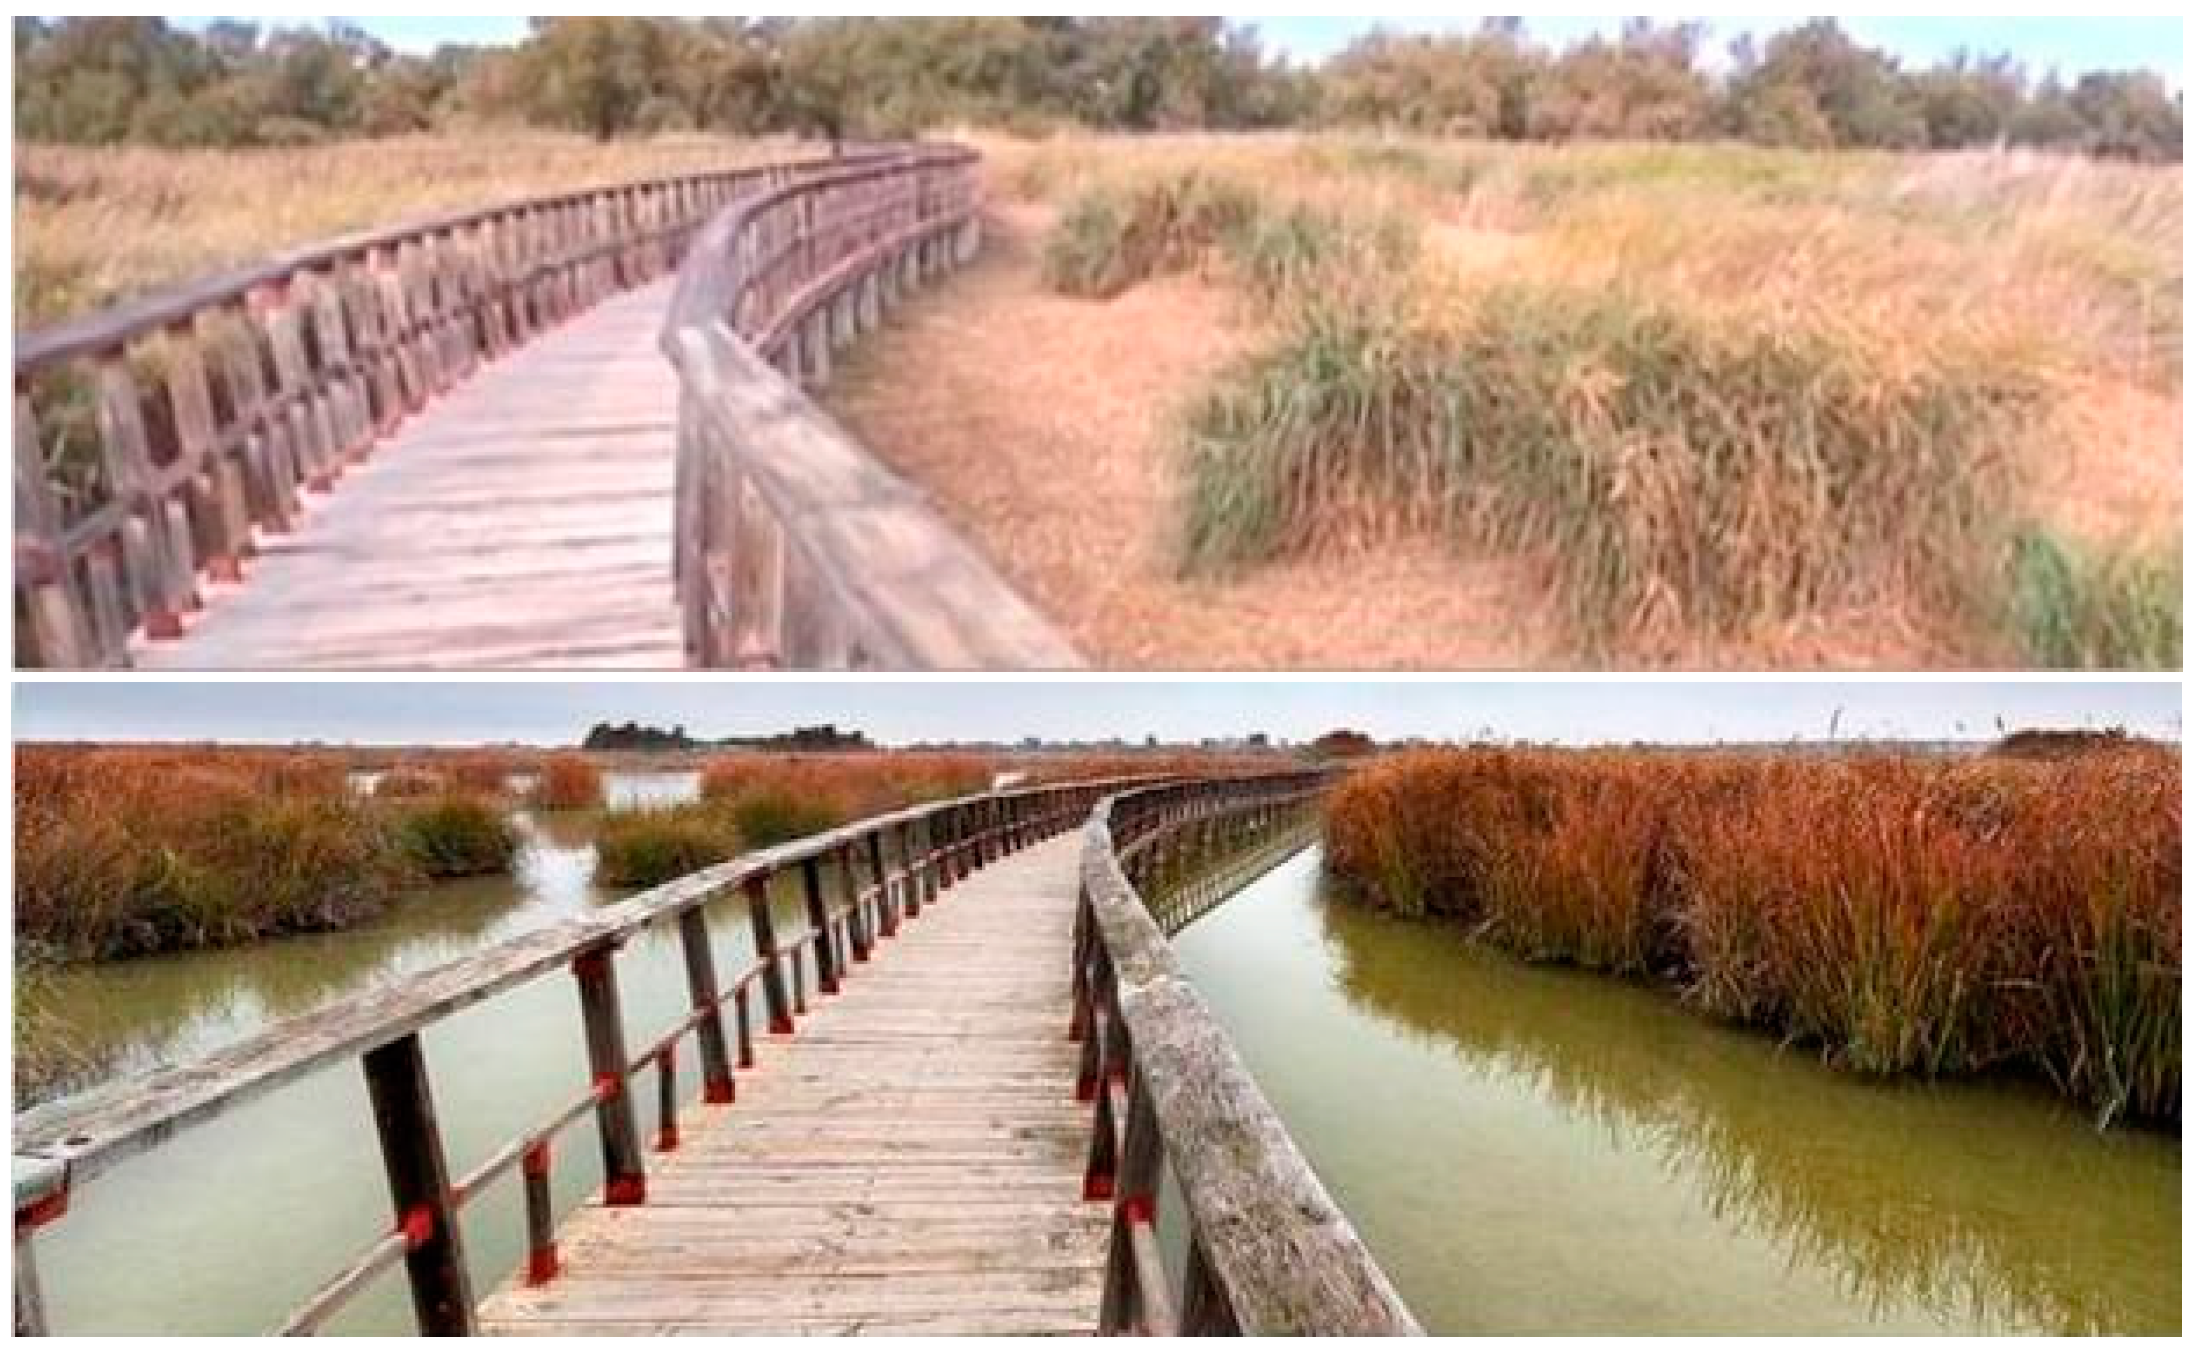
Even so, this land purchase policy was carried out without the authorities having clear criteria and the amount of cultivated land in the region has increased in the last decade. This issue, even when dealing with crops sometimes located quite a distance from the park, is understood to be closely linked to the current dramatic situation of the park, which today has less than 20% of its total surface flooded (Figure 4).

2.3. The Albufera of Valencia Natural Park

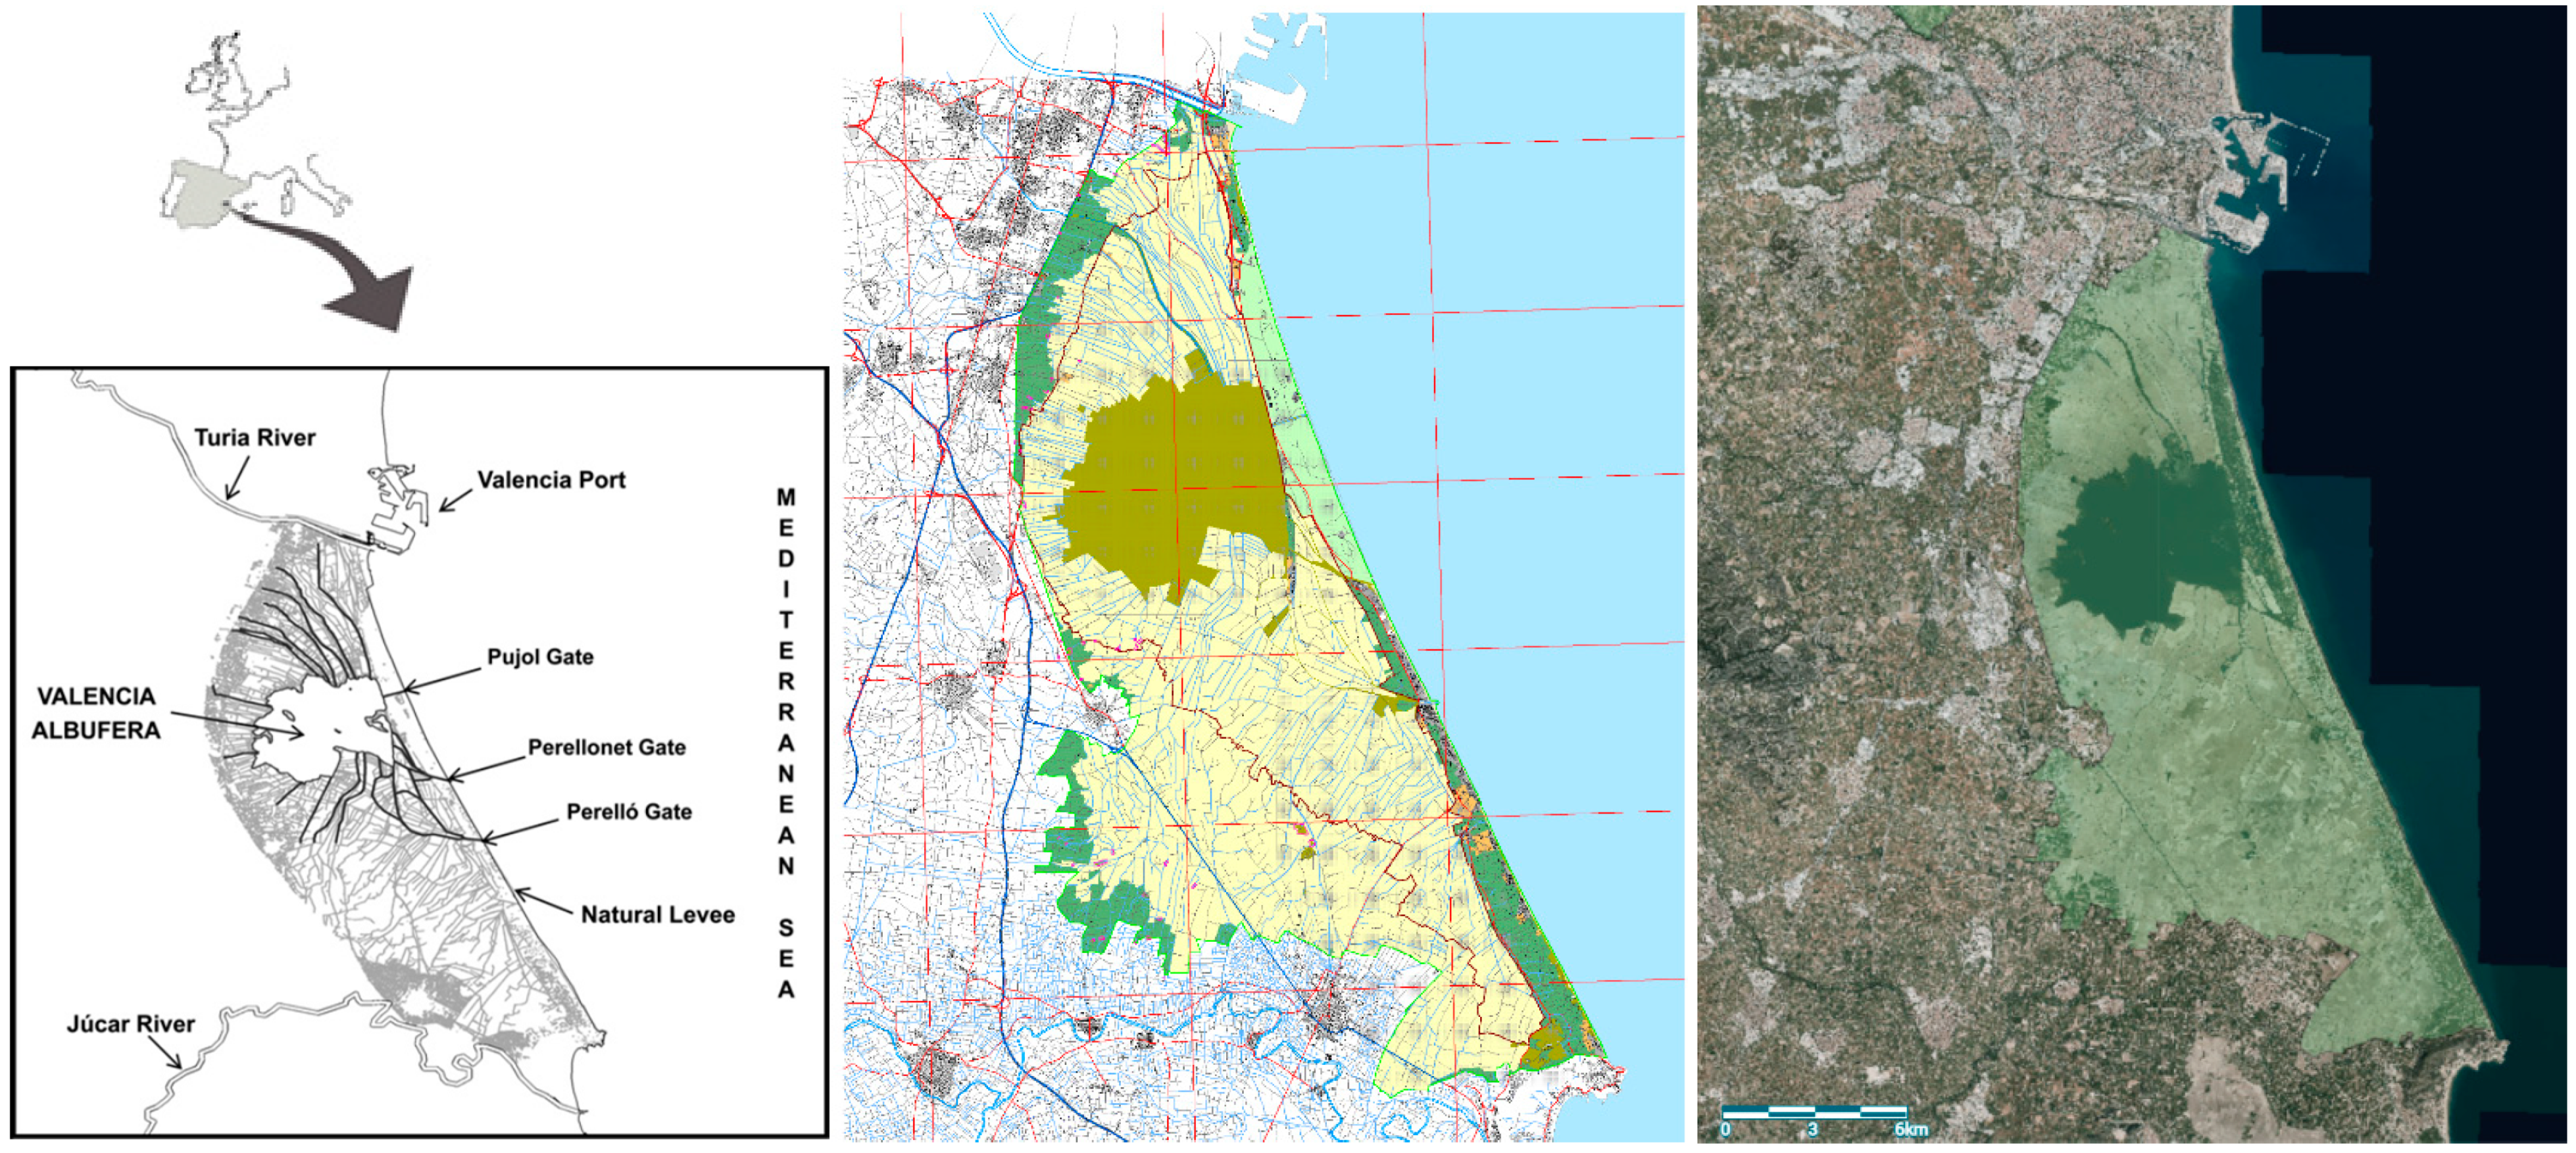
The Albufera of Valencia is a regional park of 21,120 Ha located about 10 km south of the city of Valencia (Figure 5). It has been recognized as a wetland of international importance by the Ramsar Convention since 1989 and is part of the Natura 2000 Network, having been declared a Special Bird Protection Area (SPA) in 1990 and selected as a Site of Community Importance (SCI) since 2001. It includes the Albufera, its humid environment and the coastline adjacent to both [37].
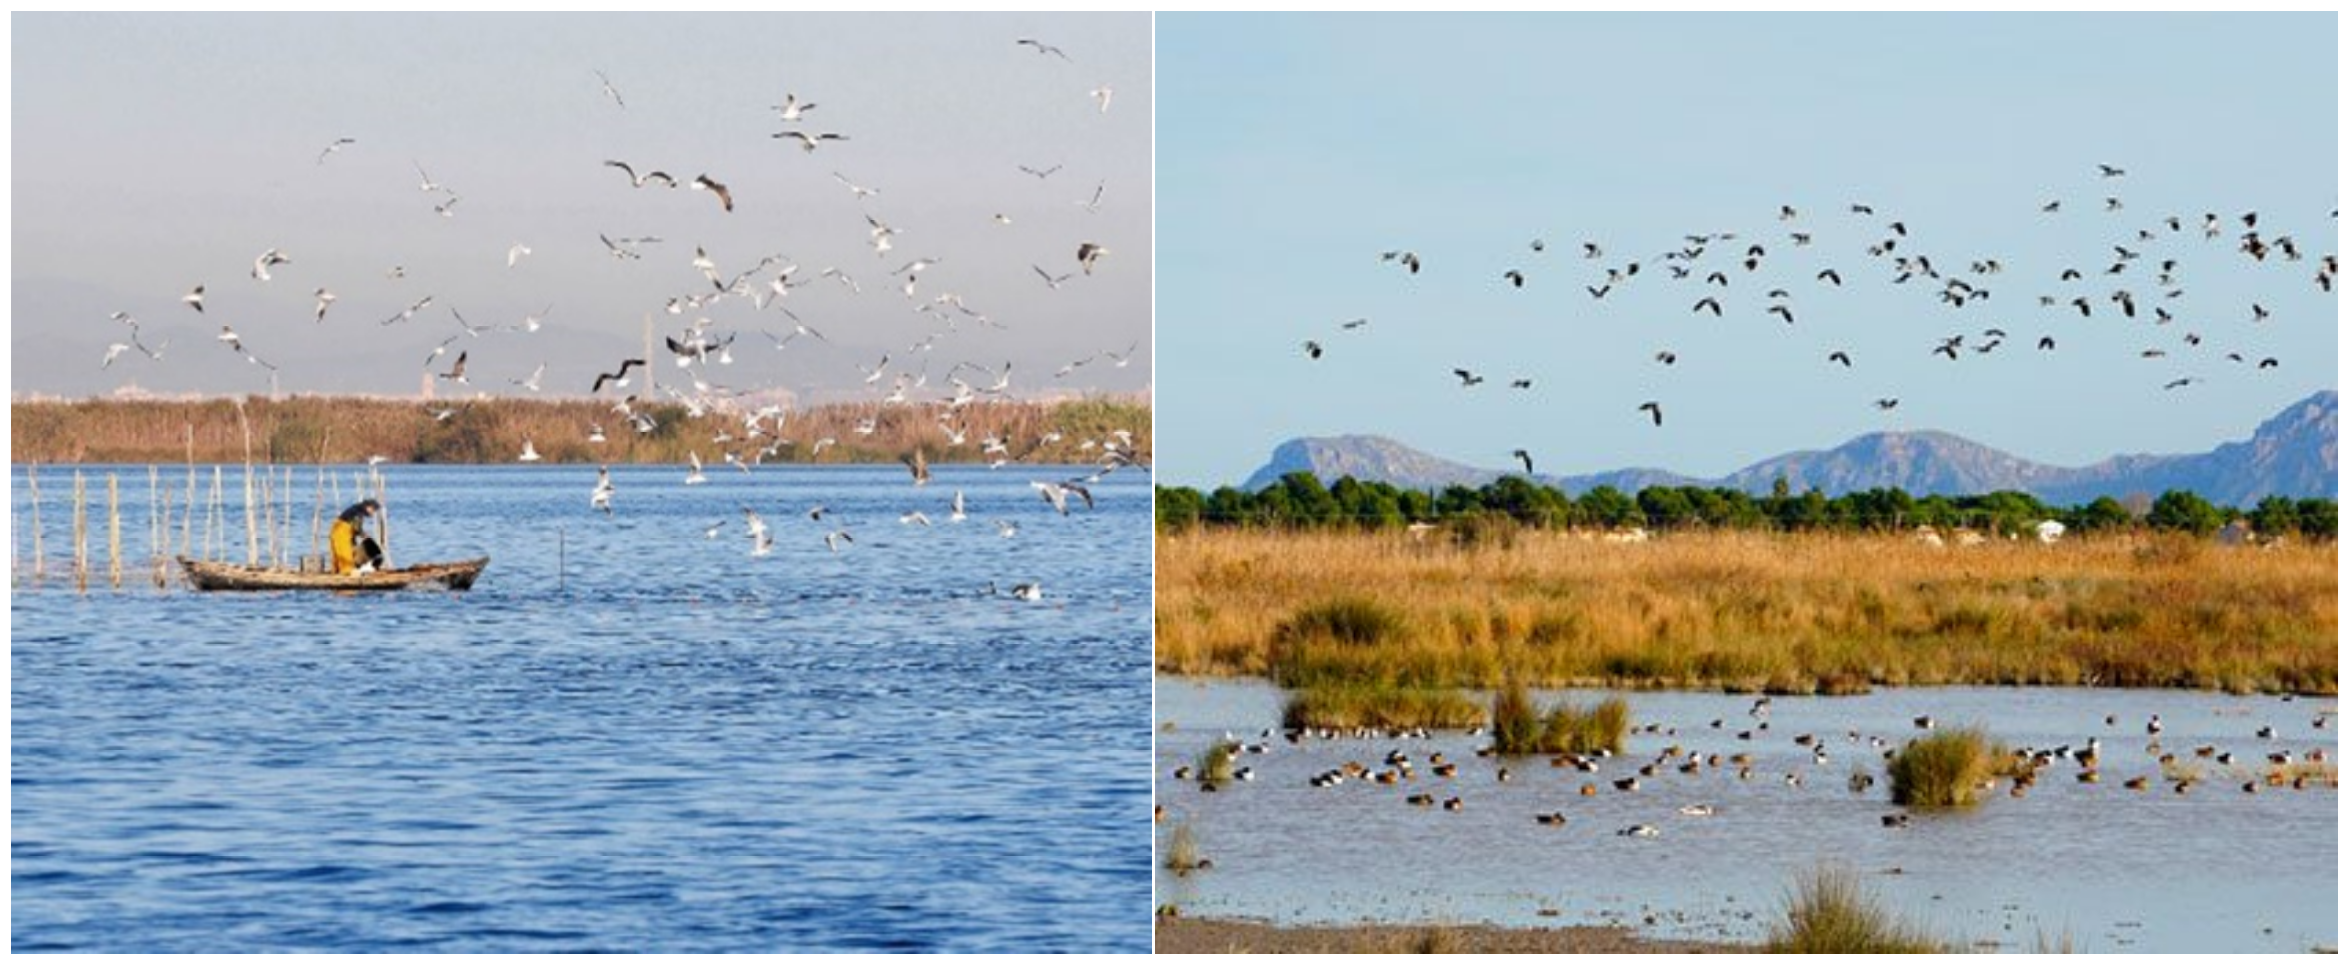
This natural park is a shallow coastal lagoon (average depth of 1 m) connected to the Mediterranean coast. The lagoon occupies an area of 2394 Ha and is surrounded by 22,300 Ha of rice fields. Its hydrographic basin extends for 91,710 Ha, from sea level to an altitude of about 1000 m above sea level. It is separated from the sea by a narrow sandy coastline with dunes stabilized by a pine forest called Dehesa del Saler. The Albufera is a transit area for many species of migratory birds [38].
Its ecological value is quite relevant since it is home to species of great ecological value in danger of extinction. It is also one of the few remaining well-preserved lagoons in Spain, whose Mediterranean coast was formerly made up of a succession of lagoons and marshes [39]. Unlike the two previous cases, its management corresponds to the regional authorities, as it has not been declared a national park.
Its management and conservation planning has historically been quite controversial. In the middle of the 20th century, a project was carried out to build the Valencia airport there, but finally, due to problems with the foundations of the land, it was moved to another place. During the 1960s and 1970s, the Ministry of Tourism authorized the execution of different urbanization works to develop it for tourism. A highway and various roads that cross its territory were built, as were some hotels and numerous buildings. However, from the late 1970s, as a result of the emergence of environmental groups and strong social opposition, that urbanization process was paralyzed [40].
In 1990, the Special Plan for the Protection of the Natural Park was approved, which was repealed by the Supreme Court of Spain because of the complex demarcation of competences between the different administrations involved in the management of this natural space. The Natural Resources Management Plan (PORN) of its hydrographic basin was approved in 1995. In 2004, the decree establishing a Rector Plan for the Use and Management (PRUG) of the Albufera was finally approved by the regional authorities. Currently, the main problem of this natural area is probably water loss as a result of both surface and underground capture of this resource by the adjoining rice fields [41]. However, unlike the two previous cases, we found new anthropic variables of ecological deterioration in the natural park because of the complex surface hydrographic network that converges into this protected area. The dragging of sediments that flow into the coastal lagoon through the wadis coming from an increasingly present agriculture in the area also exerts a quite negative influence (Figure 6), because it causes the lagoon to lose depth through a slow process of land filling [42].
On the other hand, although large-scale urbanization processes stopped in the 1980s, diffuse urban development, close but not adjacent to the natural space in the entire area of influence of the basin may also have affected the quality of the waters due to discharges from treatment plants [43]. However, as it is a generalized anthropic and quite diffuse process in the area, its relationship with the environmental deterioration of the lagoon is difficult to determine.

3. Methodology

3.1. Spatial Selection of the Area of Influence of Diffuse Anthropization (AIDA) of the Parks

In order to analyze the effect of diffuse anthropization processes in the three case studies, the use of the concept of area of influence of diffuse anthropization (AIDA) of a protected natural space will be proposed. It is an innovative multidisciplinary approach to incorporate spatial analysis into the evaluation of the deterioration processes of protected areas. Therefore, it is necessary to generate an area of influence that determines the territorial scope where human activities can generate a deterioration of the protected areas to be analyzed. In this case, the problem will be focused mainly on the loss of water from the natural parks presented, which, as has been seen, is the most relevant problem in these cases.
To determine the geographical area established as the area of influence of a protected natural area, criteria of underground hydrogeology, surface hydrology, land use planning, sociology, sedimentary dynamics and environmental planning of ecosystems will be taken into account. The envelope generated by all the factors that intervene according to these criteria, through justified interaction with a demonstrable impact, will be established as an AIDA. In order to carry out a comparative analysis of the three case studies from a homogeneous perspective, a series of general parameters have been proposed for each of the proposed criteria. These criteria have subsequently been adapted to the specific idiosyncrasy of each of the case study areas according to the existing literature to be evaluated, in order to more accurately represent the reality of the boundary conditions of each of them (Table 1). We must bear in mind that the still initiatory status of this innovative approach to determining a multidisciplinary area of influence does not yet enable us to establish categorical criteria at a general level. However, bibliography on the existing criteria has been incorporated, which has served as a reference at an orientation level for the AIDA proposal in each of the specific cases.
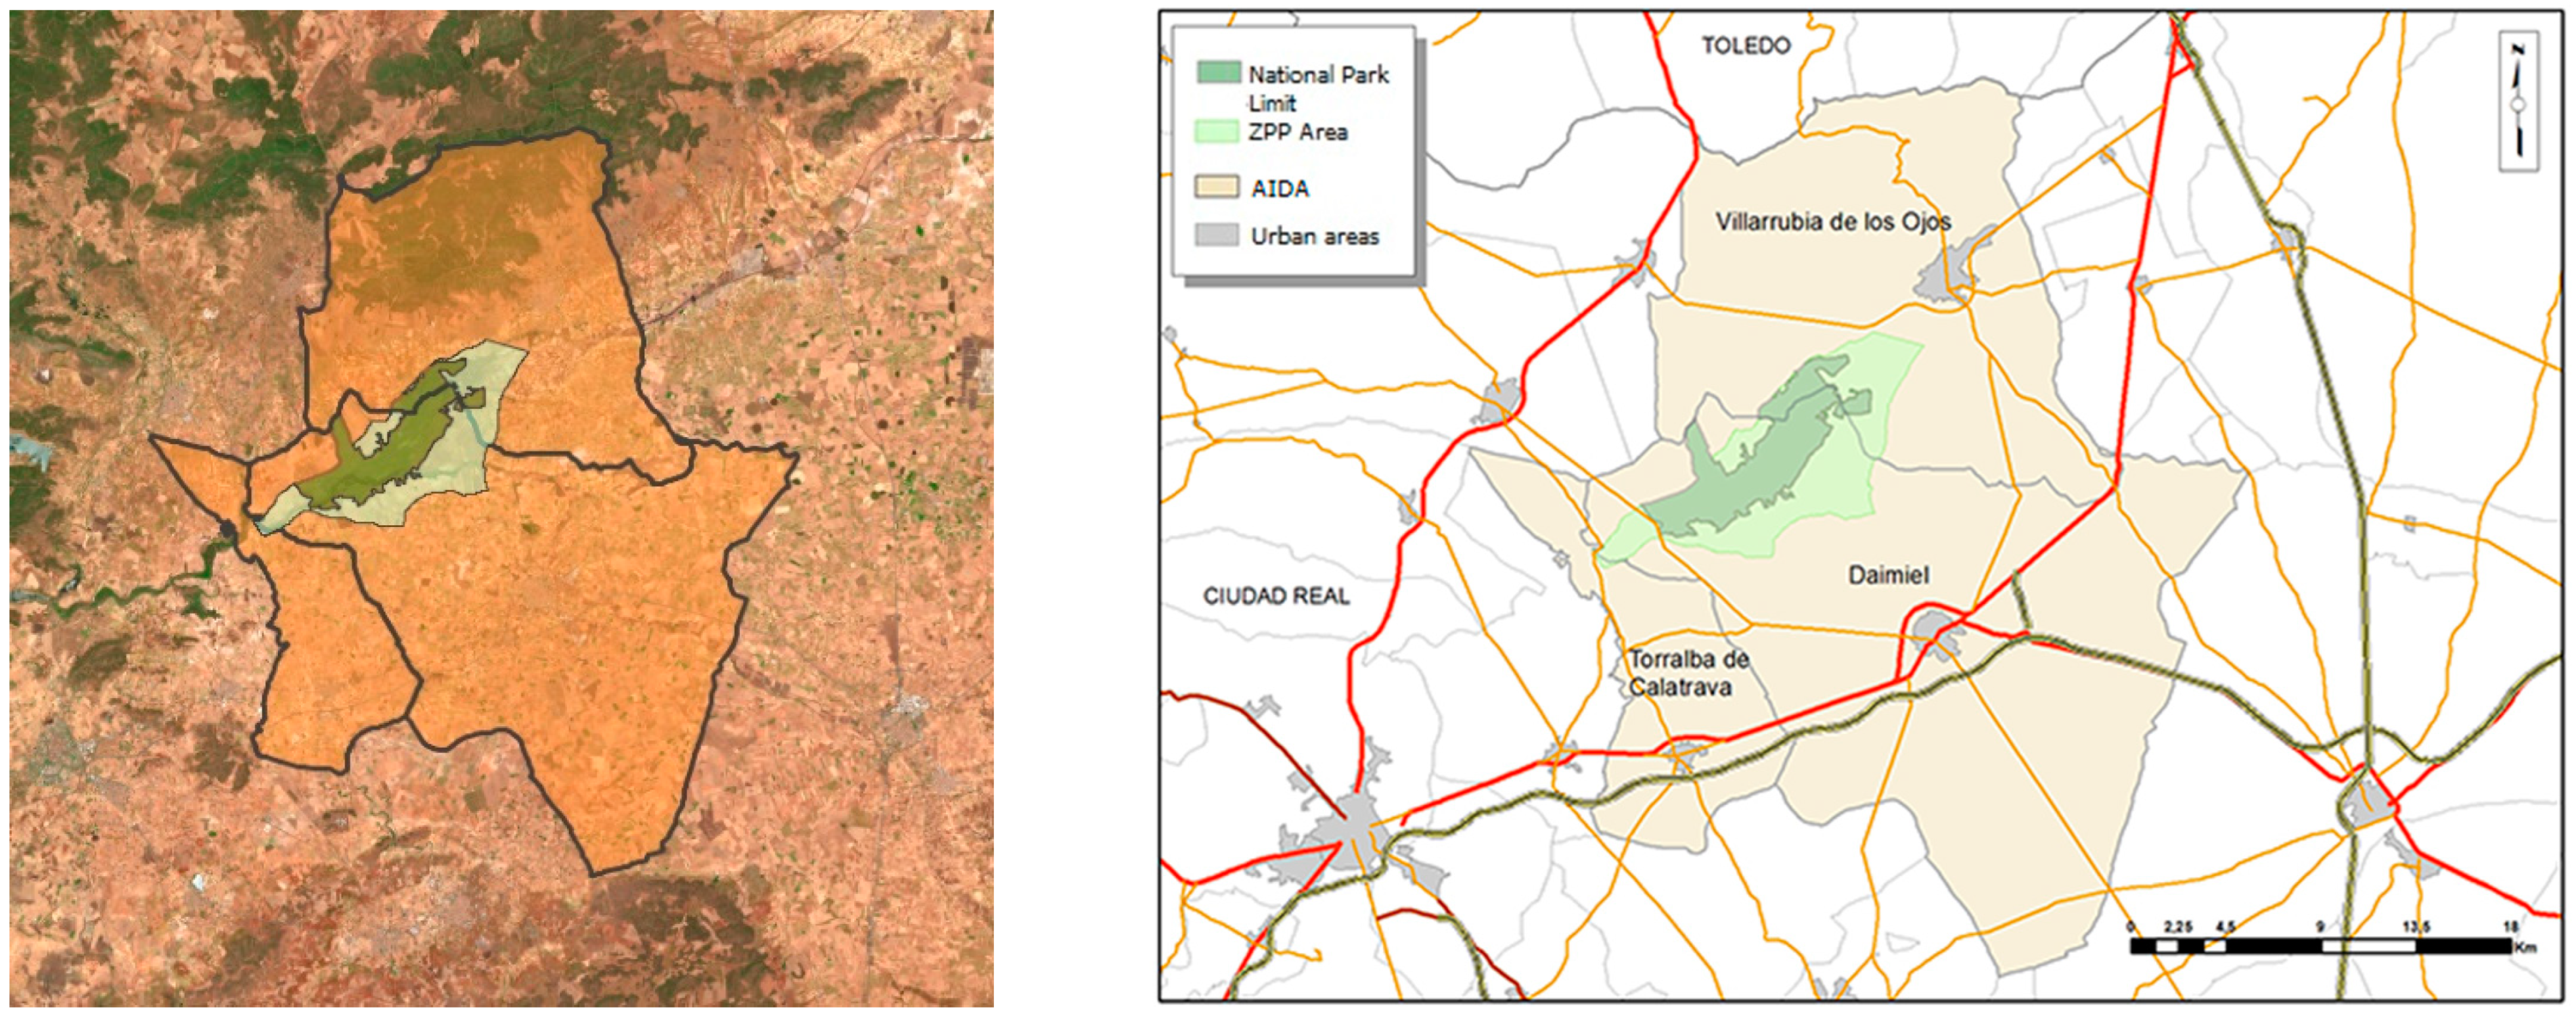
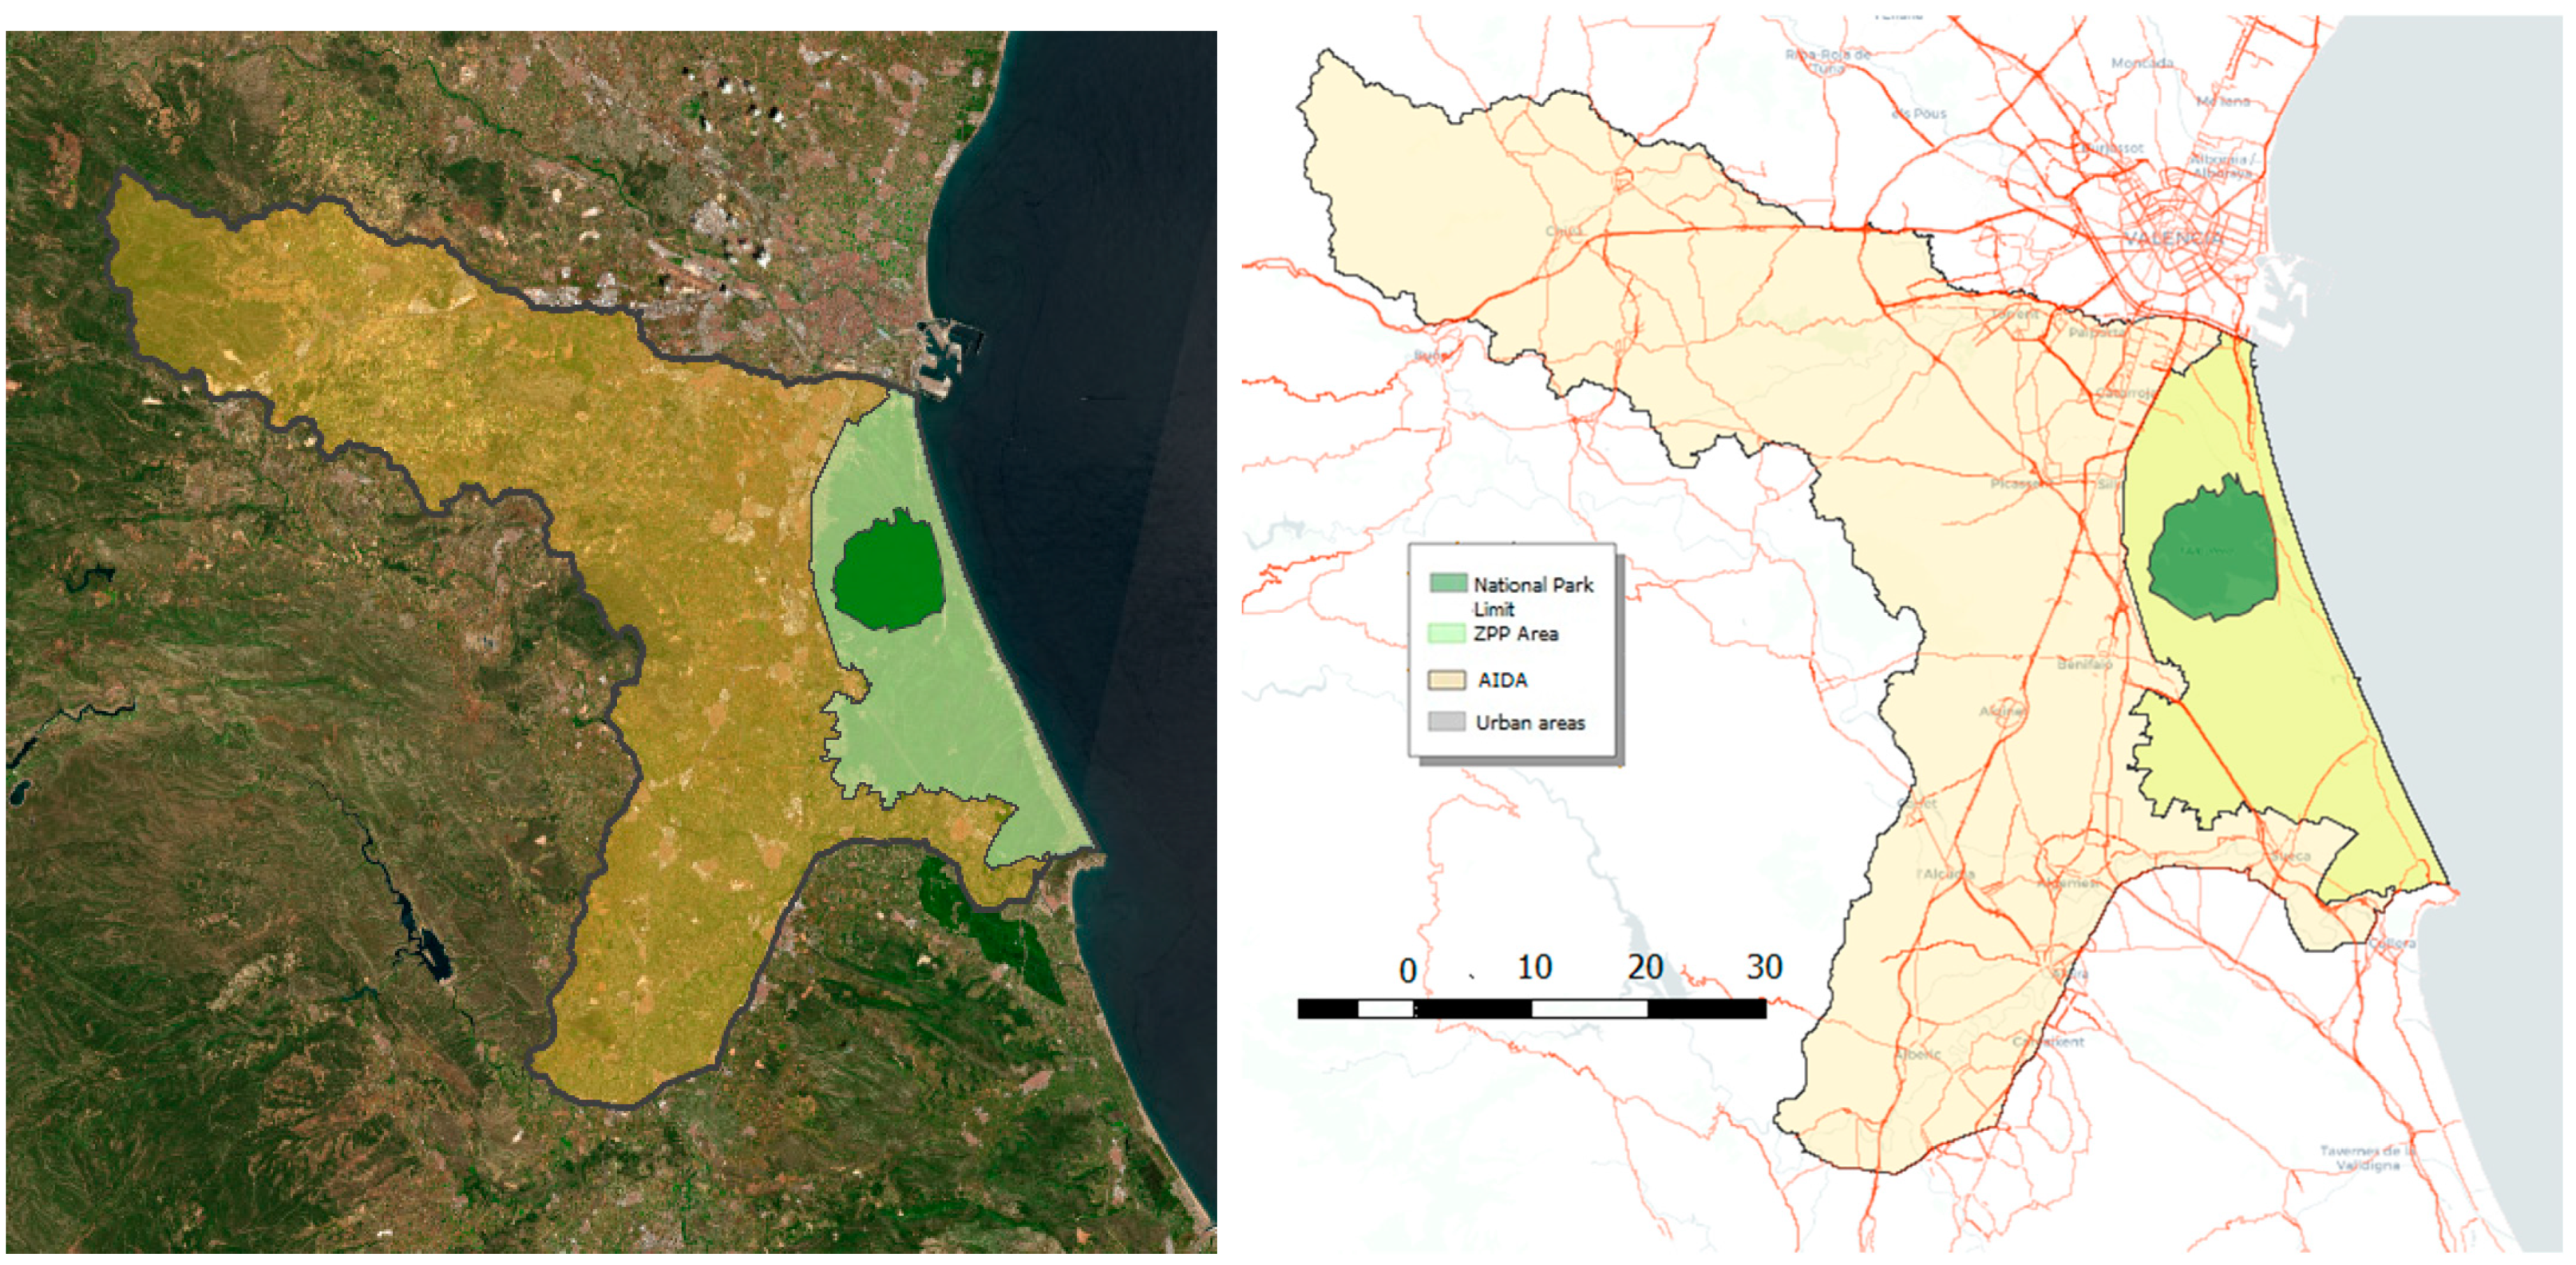
The area of influence of diffuse anthropization (hereafter AIDA) established for each of the three cases presented as a result of applying the criteria in Table 1 can be seen in Figure 7, Figure 8 and Figure 9. When there is no maximum envelope corresponding to a single criterion, the AIDA is not presented as a single area, but as an aggregation of areas of influence corresponding to different parameters. A conceptual map of the GIS data used to establish the geodatabase for generating the three diffuse anthropization areas of influence is included as Appendix A and detailed information is provided in supplementary files.
It should be noted that, while in the first two cases corresponding to Doñana and Las Tablas de Daimiel, the AIDA is the result of the aggregation of various sub-areas corresponding to different variables of spatial linkage with the Protected Natural Area, in the third case, corresponding to the Albufera of Valencia, the final envelope of the AIDA is fundamentally the result of the aggregation of the hydrographic sub-basins slopes to the Natural Park. This aspect is explained by the fact that the weighting of the orography with respect to other anthropic parameters is much greater in the third case than in the first two.

3.2. GIS Indicators for Territorial Analysis of Natural Protected Wetlands

To carry out a spatiotemporal evaluation of the evolution within wetlands and the areas of influence of the three case studies over the last 20 years, we have generated some GIS dimensionless indicators for territorial assessment. On the one hand, GIS indicators of static analysis will be used. These indicators pose the evaluation as a still picture of various issues such as the spatial flooded area (IFA index), the level of life of the vegetation (ILV index) and the level of spatial water stress (IWS index). On the other hand, GIS indicators of dynamic analysis will be used to analyze the evolution over time of anthropization phenomena in its different aspects. The choice of these indicators is justified in the analysis carried out in the previous section and the fact that, although they are indicators specifically created to better fit the analysis carried out, several of them are actually methodological variations of well-known indicators [53,54,55,56] for the analysis of the specific issues that are to be addressed in this study. The criteria for defining each of these indicators are explained in detail below.

3.2.1. Index of Spatial Flooded Area (IFA)

The spatial index of flooded area IFA is the sum of the flooded areas of the wetland at a given time with respect to its total area established as a Natural Park. It is obtained manually using the following formula:
I F A = n S F i S N P
With S F being each flooded area of the wetland (Ha) for the year t1 with respect to the total area (Ha) established as a Natural Park SNP. To avoid any biases derived from the weather stations or the specific interaction of crops with periodic cycles, the images must always correspond to the same time of year. The comparative measurement of the water masses is carried out manually, as can be seen in Figure 10.

3.2.2. Index of Life of the Vegetation (ILV)

Vegetation in the band combination is strongly reflected due to chlorophyll and vegetation in the NIR band (Near Infrared Reflectance Spectroscopy) is clearly displayed in various hues. The soil varies from light brown to dark brown; clouds, snow and ice are light blue and urban areas are cyan blue. Conifers appear darker in color than hardwood plants. In general, deep tones indicate healthier vegetation and/or broadleaf weeds, whilst lighter tones indicate natural spaces with little vegetation. Wetland water bodies appear dark, due to the absorption of energy in the shortwave infrared and near infrared bands. The Index of life of the vegetation ILV will represent the vegetation surface area of the wetland (i.e., the non-flooded area), which can be classified as healthy with respect to the total area of the wetland determined as a natural park. For this, an NDVI analysis will be used according to the following formulas.
I L V = n H V A i S N P
With H V A being healthy vegetation areas of the wetland calculated through an NDVI analysis for the year t1 with respect to the total area established as a Natural Park SNP. The Normalized Difference Vegetation Index (NDVI) calculation is a tool often used to monitor droughts, predict agricultural production, help predict fire zones and areas undergoing desertification, for example. The NDVI is calculated with the following formula:
N D V I = N I R R E D N I R + R E D
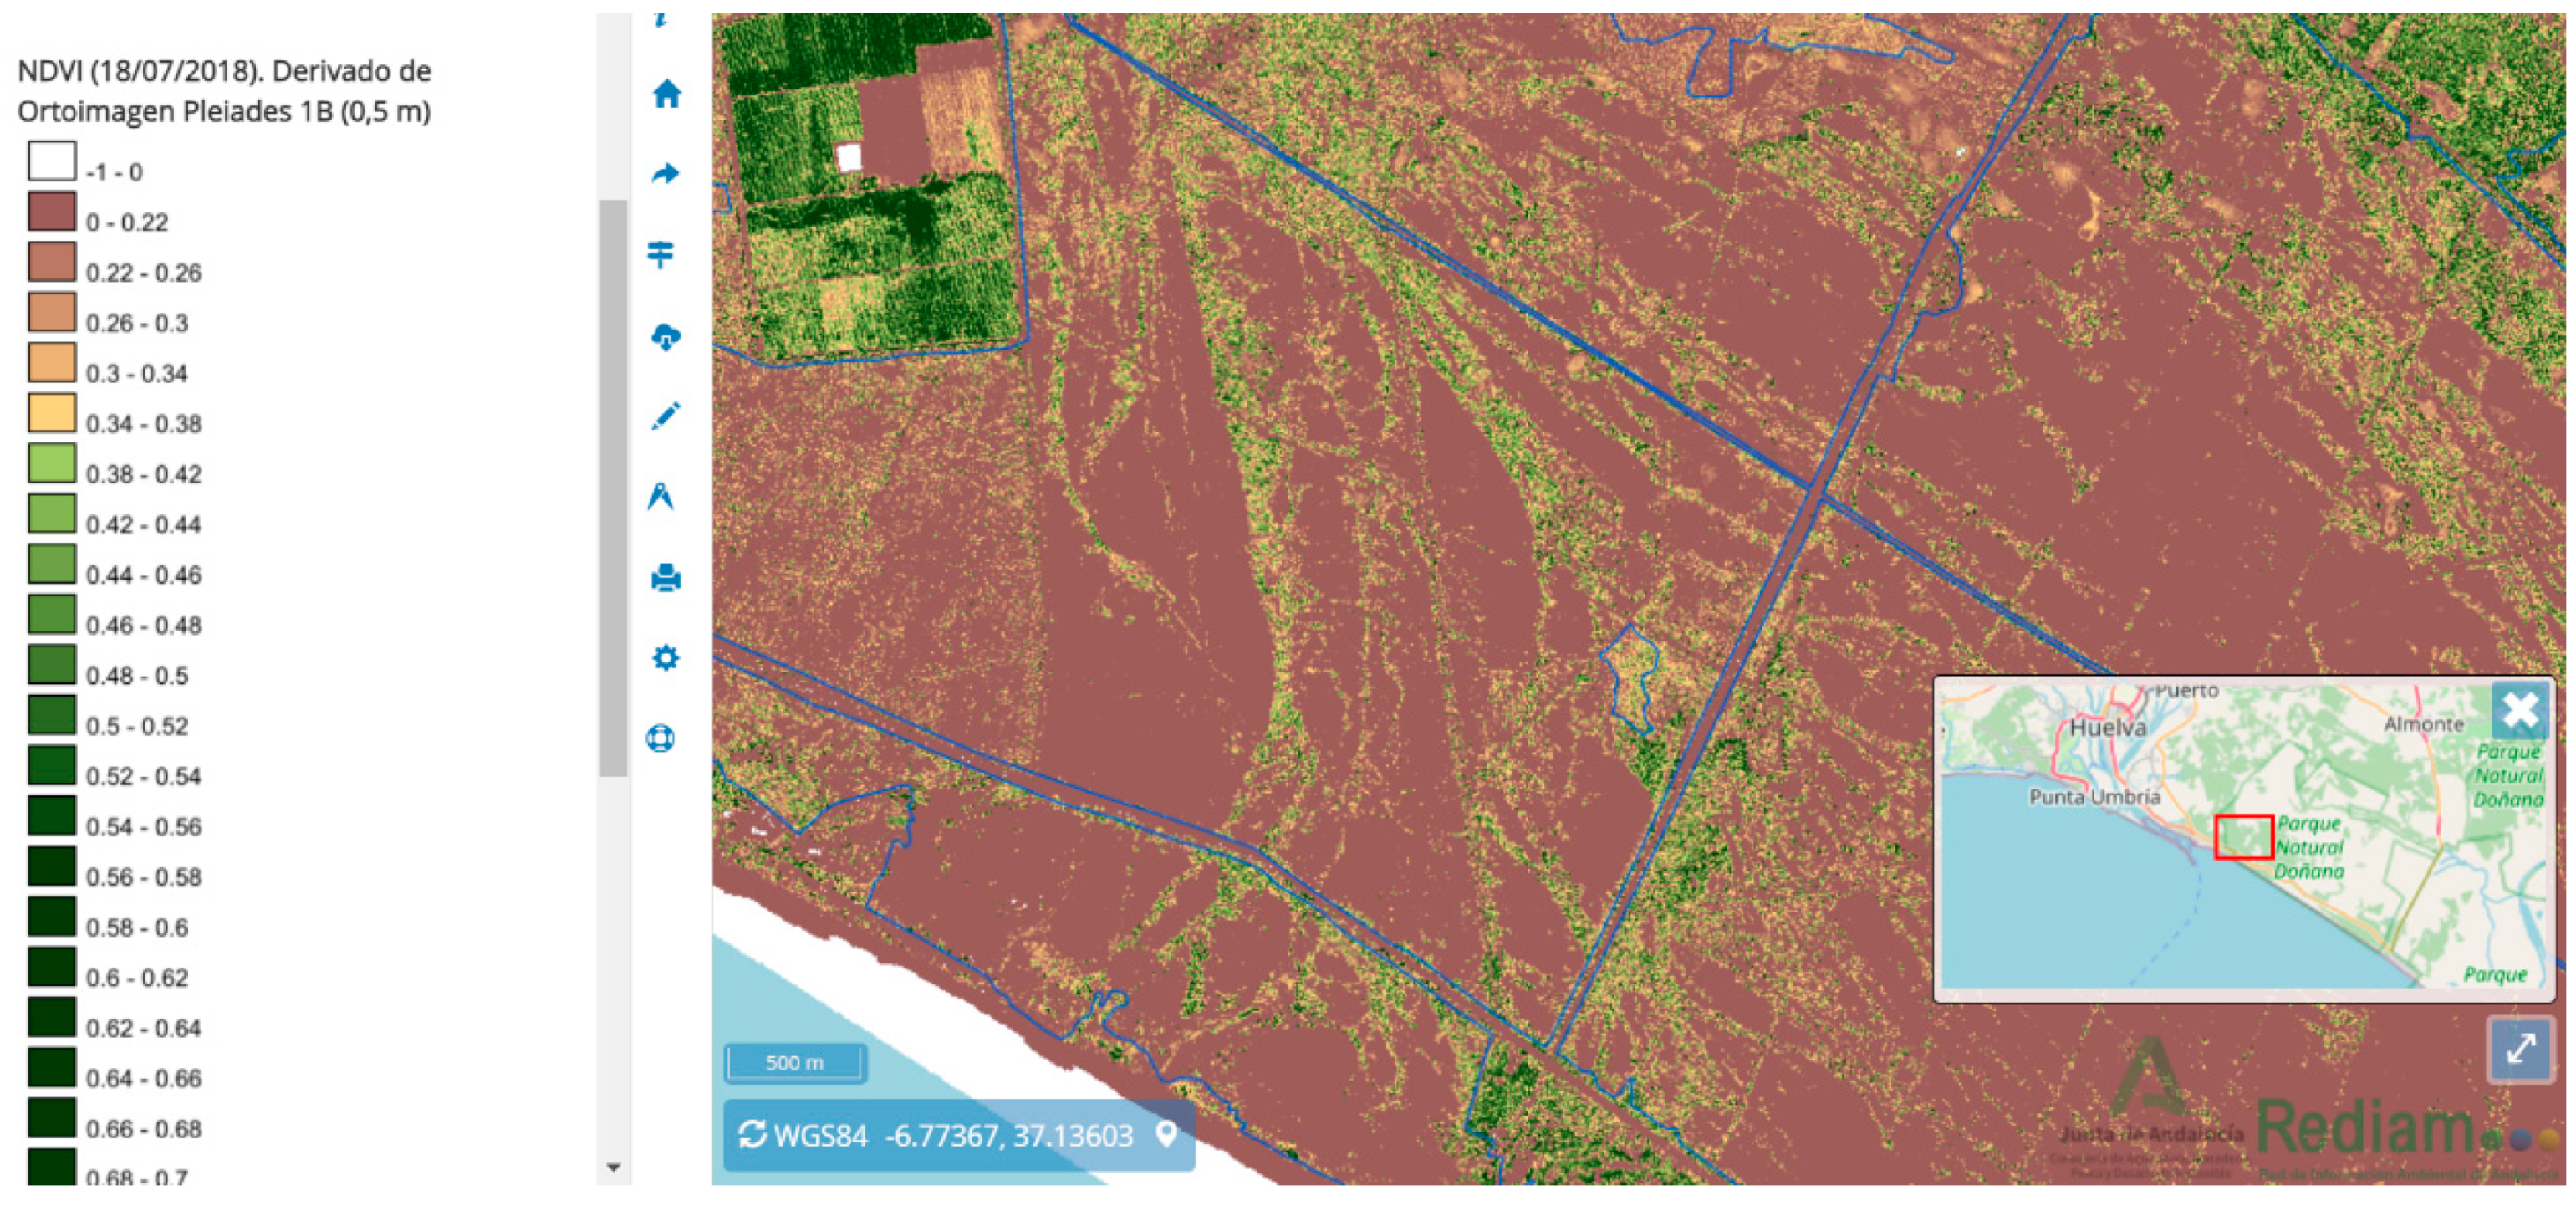
where NIR is the Near Infrared Reflectance Spectroscopy and RED is the Visible Red Part Reflectance Spectroscopy. According to this formula, the density of vegetation (NDVI) at a given point in the image is equal to the difference in the intensities of the reflected light in the red and infrared ranges divided by the sum of these intensities. This index defines values from −1.0 to 1.0, where negative values are mainly made up of water and negative values close to zero are mainly made up of rocks and bare soil. Very small values (0.1 or less) of the NDVI function correspond to areas without rocks or sand. Moderate values (0.2 to 0.3) represent shrubs and grasslands, while large values (0.6 to 0.8) indicate forested and tropical areas. In Figure 11, we can see an example of the data obtained for the Doñana Natural Park.
NDVI is a reliable measure of phytosanitary status based on the way a plant reflects light at certain frequencies (some waves are absorbed and others are reflected). Chlorophyll (an indicator of health) absorbs a large amount of visible light and the cellular structure of the leaves strongly reflects near infrared light. When a plant becomes dehydrated, becomes ill, suffers from diseases, etc. the spongy mesophyll deteriorates and the plant absorbs more near infrared light, rather than reflecting it. Thus, observing how the NIR changes compared to red light provides an accurate indication of the presence of chlorophyll, which is linked to plant health.

3.2.3. Index of Spatial Water Stress (IWS)

The vegetation on the surface of the AIDA is subjected to severe stress during a drought that causes all the actors in the territory to compete for the water in the aquifers. To spatially analyze this phenomenon, the sum of the wetland surfaces subjected to a situation of water stress will be determined with respect to the total surface area established as a natural park by means of an NDWI analysis, using the following formula:
I W S = n S W S i S N P  
With S W S being water stressed areas of the wetland for the year t1 with respect to the total area established as a Natural Park SNP. Such areas will be defined according to areas with positive NDWI values. The Normalized Differential Water Index (NDWI), first introduced in 1996 in Gao [53], reflects the moisture content in plants and soils and is considered analogous to the NDVI as follows. The index of spatial water stress of a protected area is the mean value of the NDWI parameter for the non-flooded area included in the wetland area classified as a Natural Park, according to the following formula:
N D W I = N I R S W I R N I R + S W I R    
Where NIR is the near infrared range with wavelengths of 0.841–0.876 nm and SWIR is the part of the range with wavelengths between 1.628–1.652 nm, respectively. This method allows us to identify all the areas in which the rains or underground water have produced a flood plate on the surface of the wetland in recent years regardless of whether damage has or has not occurred in an area. An example of evolution over time can be seen in the Albufera of Valencia in Figure 12.
In addition, we have the dynamic spatial analysis indices that evaluate the rate of territorial transformation in the diffuse anthropization influence area of the three case studies. These GIS indicators analyze the spatio-temporal evolution of land transformation related to the variables with the greatest incidence in the competition for water with protected wetlands. These include agricultural uses or urban development, but also focus on a general level of dispersion. The territorial transformation rates evaluated are separated into three indices that specifically address the phenomena of dispersed diffuse anthropization; agricultural transformation of the soil; and urban growth from human settlements.
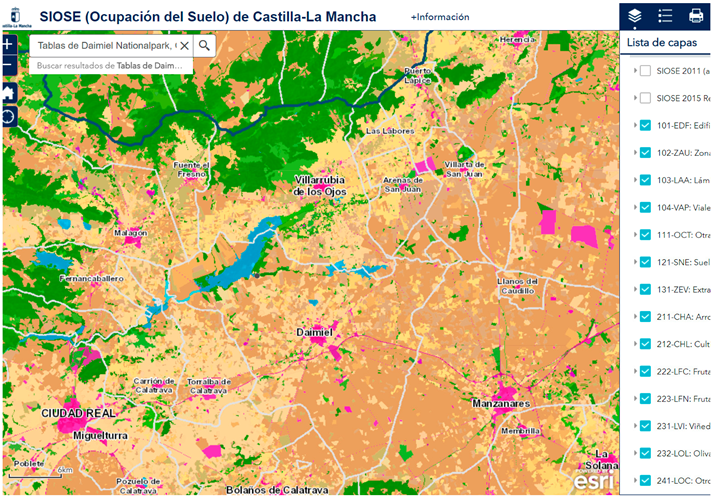
The classification of land use is made based on the criteria established in the Corine Land Cover of 2018. Corine Land Cover contains the latest pan-European land use land cover coordinated through the European Environment Agency and aimed at identifying priority areas to protect ecosystems and natural resources. The geodatabase provides information on the coverage of the soil and the changes that have occurred in six-year time periods. The information comes from the interpretation of images generating a classification of 44 categories of land use, structured into three levels of hierarchical aggregation. The specific criteria for defining each of these GIS indicators are explained in detail below.

3.2.4. Index of Agricultural Transformation of the Soil (IATS)

The variation of agricultural land uses is one of the main factors of competition for water with natural spaces that are at the origin of the ecological deterioration of wetlands. The transformation of rainfed agricultural areas into irrigated land or the creation of new cultivation areas are usually the most characteristic causes of this phenomenon. To quantify the value of this transformation, the following formulation is applied:
I A T S t 2 t 1 = n S i t 2 t 1 z S j t 2 t 1  
with S i being the set n of agricultural areas transformed within the AIDA analyzed between t 1 and t 2 and S j the set z of land uses modified within the AIDA analyzed between t 1 and t 2 . Categories of the Corine Land Cover established as agricultural transformation of the soil are detailed in Appendix B.

3.2.5. Index of Urban Growth from Human Settlements (IUGS)

The urban growth of cities and especially that of tourist centers, is usually a common factor in competition for water with natural spaces such as wetlands. This growth can be quantified at a spatial level using a GIS indicator that measures the rate of spatial expansion of the urbanized area within the AIDA for a given period of time. The formulation used is set out below:
I U G S t 2 t 1 = n S i t 2 t 1 z S j t 2 t 1
with S i being the set n of areas urbanized within the AIDA analyzed between t 1 and t 2 and S j the set z of land uses modified within the AIDA analyzed between t 1 and t 2 . Categories of the Corine Land Cover established as urbanized land are detailed in Appendix B.

3.2.6. Index of Mixed Diffuse Anthropization (IMDA)

The artificial transformation of the territory in the AIDA of wetlands is globally a diffuse factor of ecological deterioration of these protected natural spaces, even if only an indirect anthropic effect due to proximity exists. The construction of roads or the modification of orography and land uses constitute elements of diffuse anthropization that affect the fauna and flora of the wetlands. The following indicator is proposed for its measurement:
I M D A t 2 t 1 = n S i t 2 t 1 z S j t 2 t 1
with S i being the set n of areas artificially transformed within the AIDA analyzed between t 1 and t 2 and S j the set z of land uses existing within the AIDA analyzed between t 1 and t 2 . Categories of the Corine Land Cover established as artificial transformation of the territory are detailed in Appendix B.

3.3. Geostatistical Evaluation Indicators

To spatially correlate the transformation of the territory derived from the increase in agricultural or urban areas and the ecological deterioration of the protected wetlands analyzed, a geostatistical evaluation of the phenomenon of diffuse anthropization will be performed for the three case studies. The choice of geostatistics as an analysis approach is justified by the incredible capacity that this statistical approach has to spatially analyze the existing correlations between phenomena of different natures from an objective numerical perspective. In this case, the objective is to analyze the spatial distribution over time of phenomena of different natures and complex linkage. Using the GIS indicators previously described, how the spatial link between the transformation of the territory evolves over time will be analyzed with the following phenomena: the loss of water in the wetlands, the reduction in the standard of living of the vegetation of the natural park and the increase in the level of water stress in the protected areas analyzed.
Here, the territory shaped as a continuous element needs to be “discretized” as a structure composed of 1000 × 1000 m cells in order to numerically evaluate the spatial correlation between indicators with specific values over a continuous space. These cells are assigned values according to the results obtained in the flooded area, NDVI and NDWI data from Landsat 5, Landsat 7, Sentinel 2 and Landsat 8 satellites for the three case studies (see Appendix C for detailed data). In addition, patterns of diffuse anthropization of the AIDA are obtained through the GIS indicators of land transformation by using historical GIS cartographies for the years 2000, 2005, 2010, 2015 and 2020. The detailed cartography data are summarized in Table 2.
The relationship between the spatial distribution of the static indicators for the analysis of ecological state of the three case studies and that of the dynamic indicators for evaluating the territorial transformation in the AIDA of the wetland areas over time are addressed through a three-phased geostatistical evaluation by using geoprocessing tools from GvSIG desktop 2.5.1 (GvSIG Association, Spain) and ArcGIS 10.8 (Esri, USA).
This analysis will enable us to numerically assess the extent to which the transformations made by human activities in the area of influence of these wetlands over the last 20 years have influenced their current ecological deterioration linked to water loss. The spatial relationships are parameterized and assessed firstly through the use of Global Moran’s I [57] and secondly Anselin Local Moran’s I [58] bivariate statistics.
Bivariate global spatial autocorrelation allows us to assess the statistical correlation of a set of geolocated data and whether the autocorrelation is positive or negative. Bivariate Global Moran’s I statistic formula is given as I :
I = n S 0 i = 1 n j = 1 n w i , j z i z j i = 1 n z i 2
where z i is the deviation of an attribute for feature i from its mean x i X ¯ ,   w i , j is the spatial weight between features i and j , n is equal to the total number of features and S 0 is the aggregate of all the spatial weights of (10):
S 0 = i = 1 n j = 1 n w i , j
Global spatial GIS autocorrelation provides the three following values: the Moran’s I Index, the z-score and the p-value. Given a series of spatial distribution features and an associated attribute, bivariate Global Moran’s I statistic indicates whether the pattern expressed is clustered, dispersed, or random, as well as its degree of statistical correlation with some kind of phenomena. When the z-score or p-value indicates statistical significance, a positive Moran’s I index value indicates a trend toward clustering while a negative Moran’s I index value indicates a trend toward dispersion. The z-score and p-value are measures of statistical significance which inform us whether, or not, to reject the null hypothesis. For this analysis, the null hypothesis states that the values associated with features do not have any statistical correlation.
From this information, we are able to develop the hot and cold points in the mapping in a geolocated way, through the Local Indicators of Spatial Association (LISA) from Anselin [58]. Each Anselin Local Moran’s I statistic of spatial association I is given as:
I i = x i X ¯ S i 2 j = 1 , j = i n w i , j x j X ¯
where x i is an attribute for feature i , X ¯ is the mean of the corresponding attribute, w i , j is the spatial weight between features i and j and:
S i 2 = j = 1 , j = i n x j X ¯ 2   n 1
with n equating to the total number of features. More detailed data on the configuration of the statistics used is provided in Appendix D.
For this analysis, the null hypothesis states that the correlation values of two elements are randomly distributed. Thus, the higher (or lower) the z-score, the stronger the intensity of the clustering of these values. A z-score near zero indicates no apparent clustering within the study area. A positive z-score indicates clustering of high values, whilst a negative z-score indicates clustering of low values. Therefore, the bivariate statistical correlation analysis between the distribution of different GIS indicators helps to spatially understand the extent to which the consequences of diffuse human anthropization affect the evolution of ecological deterioration of these three wetlands. This multidisciplinary approach will enable better management of the territory within the framework of holistic environmental planning to end the current problems of water loss from wetlands.

4. Results

The presentation of results will be done with the following structure: first, analysis will be carried out on how the average values of the different GIS indicators proposed for the three case studies have evolved over time. Second, using geostatistical autocorrelation tools, it will be verified if these spatial distribution patterns of the data obtained really describe a relevant physical phenomenon or may merely be the subject of a statistically random distribution. Finally, the statistical spatial correlation between the indicators of territorial transformation associated with the phenomenon of diffuse anthropization and the indicators of environmental impact associated with the ecological deterioration of wetlands will be evaluated numerically through some OLS models of the LISA analysis.

4.1. Spatiotemporal Analysis of GIS Indicators

In addition to the aforementioned satellite data, we resort to the historical comparator of the Spanish National Orthophoto Program of the Ministry of Development. Since 2000, this tool allows to have access to digital frames of flights with pixel size 0.22 m or 0.45 m, 8 bits in TIFF format, with the corresponding georeferencing files in TFW format and in ECW format georeferenced in the ETRS89 geodetic reference system for the entire Spanish territory. The local cartography provided with files with four RGB and NIR bands (red, green, blue and near infrared), or an RGB file and the corresponding NIR. This makes it possible to obtain homogeneous data for similar periods of the year from 2000, 2005, 2010, 2015 and 2020 for the three study cases evaluated (Figure 13, Figure 14 and Figure 15).
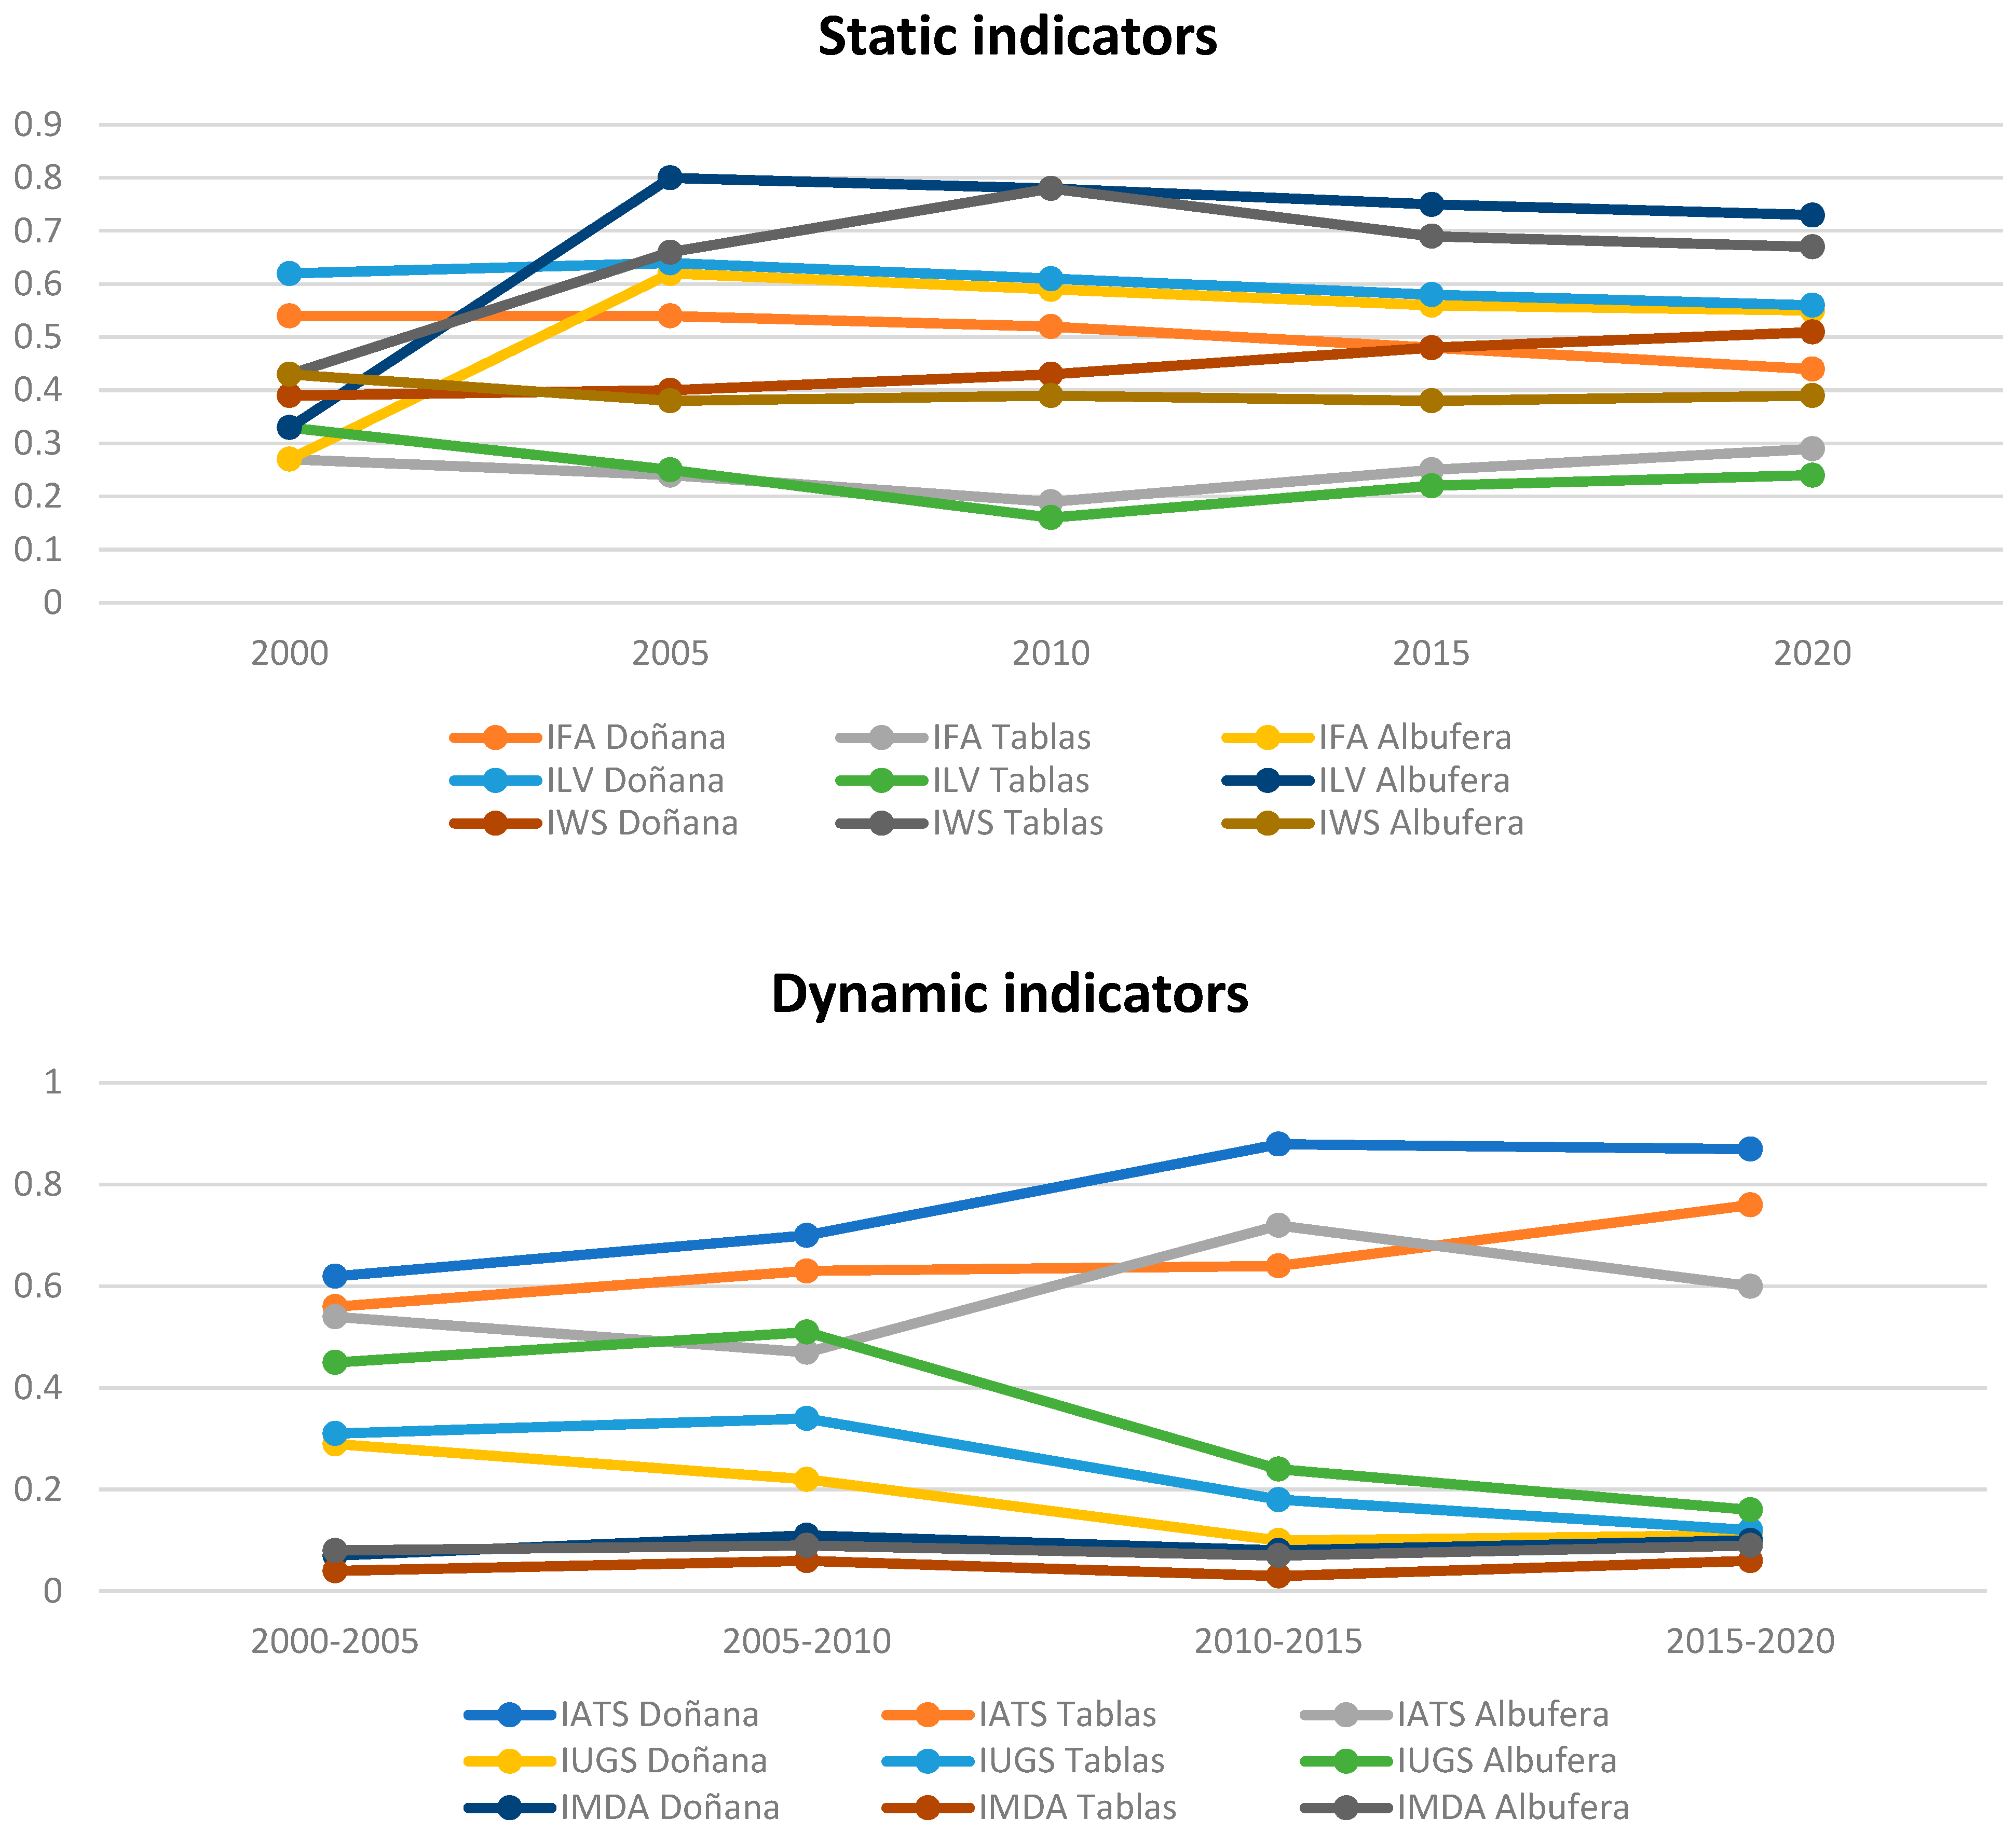
From all this georeferenced historical data, the following average values are obtained in the protected areas of the three wetlands for the GIS static indicators described in the previous section. Similarly, the values of the dynamic GIS indicators have been obtained in the AIDA for the four 5-year periods between 2000 and 2020 and are summarized in Figure 16.
From the simple observation of the numerical results of the indicators, it is possible to numerically verify the intensity of the phenomena mentioned above, such as the fluctuations in the loss of flooded area in the Tablas de Daimiel National Park (with extreme drought events such as those of 2009). The state of the water body appears to have recovered to the levels of 20 years ago. However, this recovery of the water inputs has not been associated with an equivalent recovery of the environmental deterioration suffered on the soil of the protected area. In the case of the Albufera of Valencia, despite the periodic stability of the annual cycles of rice crops, a slow (but gradual) progressive trend towards water loss is observed. However, an exact correlation with the level of ecological deterioration of the soil cannot be determined only from that. Finally, in the case of Doñana, an increasing trend in the loss of water mass and the state of ecological deterioration of the soil is noted, particularly in the last 10 years.
If we observe in detail the patterns of detailed temporal evolution of the dynamic indicators, generally, a majority presence of agriculture is observed in all time frames as the main factor of soil transformation in the area of diffuse anthropization influence of the analyzed wetlands. This trend is accentuated after 2005 in Doñana and the Albufera of Valencia, possibly as a consequence of the real estate crisis in coastal areas that reduced urban activity, limiting the growth of cities. At the level of transformation linked to the global phenomenon of diffuse anthropization, we can observe that the behavior patterns in the three cases are quite similar in their temporal evolution.

4.2. Autocorrelation Analysis

To verify that we are witnessing a spatial distribution of the indicators derived from a real physical phenomenon and not the consequence of a set of mostly random events, an analysis of the geostatistical autocorrelation of the spatial patterns of each of the static and dynamic indicators is carried out; the results obtained are shown in Table 3.
Although the cases are not homogeneous for all the indicators, it can be seen how all of them have a greater or lesser statistical significance in their distribution. Low p values and medium-high z values confirm the rejection of the null hypothesis of a random distribution. Positive values for the statistic also show a global aggregative trend of all indicators. Therefore, they all correspond to real distribution phenomena associated with verifiable physical phenomena. A couple of common patterns can also be observed. On the one hand, in the case of the static indicators, a greater similarity is observed in the cases of Doñana and the Tablas de Daimiel compared to that of the Albufera of Valencia, possibly due to the existence of different spatial patterns of ecological deterioration. On the other hand, in the case of the dynamic indicators, we appreciate generally high values in the first two, compared to relatively low values in the third. This is due to the specific nature of the dynamic indicators themselves, with a tendency to aggregate the first two phenomena analyzed (intensive agriculture and urban growth) compared to the heterogenous and dispersed nature of the third (diffuse territorial anthropization).

4.3. LISA and OLS Analysis

Finally, to contrast the statements made in the previous subsections and numerically assess the intensity of the spatial correlation between the various indicators in each of the three case studies, multiple OLS regression models based on a bivariate LISA analysis are shown in Table 4.
Various general observations can be made of the results obtained. First, the analysis carried out for the static indicators showed several common patterns of behavior for the three case studies. The IFA index for flooded area of the wetlands presented a much lower capacity for explanation for all cases (R2adj: 0.22/0.21/0.19) than those carried out for the ILV index of life of the vegetation (R2adj: 0.43/0.40/0.33) and the IWS index of water stress in the soil (R2adj: 0.39/0.36/0.34). As expected, we found that the correlations were negative in this second indicator (ILV) due to its own definition, since the greater the territorial transformation, the lower the health index of the vegetation. In addition, the link between the parameters of territorial transformation studied with said phenomena was more clearly seen in the second (ILV) and third indexes (IWS) than in the first (IFA), since in the case of the flooded surface indicator the climatic and meteorological variables of precipitation (not the object of this study) surely have a higher incidence.
Secondly, a greater capacity to explain the model was generally observed in the cases of Doñana and the Tablas de Daimiel, the values for the case of the Albufera of Valencia were generally lower. This is probably because the Albufera environment is territorially much more complex and anthropized than the other two. The cases of Doñana and the Tablas de Daimiel, being geographically more isolated from urban and anthropized areas, allow us to explain the phenomenon of ecological deterioration with simpler models based on fewer variables. The generally lower values in the AIC analysis for the GIS indicators of these first two case studies (22,765.5/23,508.1/22,061.2 and 23,116.7/23,173.2/22,038.0) in relation to the third (25,325.7/23,762.1/24,243.5) corroborate this observation.
Finally, we observe that there was a greater negative correlation in the case of the ILV index and a greater positive correlation in the case of the IWS index in relation to the factors of territorial transformation related to agriculture (IATS) than to those related to urban growth (IUGS) or the mixed anthropic transformation (IMDA). It can be deduced that the territorial transformation of an agricultural nature is consequently the factor most linked to ecological deterioration due to water loss in these wetlands.

5. Discussion and Policy Implications

The work carried out has provided interesting contributions to the field of knowledge of the analysis of indirect anthropic impacts in protected areas such as wetlands. It should be noted that we are facing the quite common consequences of diffuse anthropization close to protected areas, with numerous examples available throughout the world (see for example Pampean plain in Argentina [59], Sorocaba wetlands in Brazil [60], Sanjiang Plain in China [61] or Ria Formosa in Portugal [62]). In this context, the analysis carried out is rather attractive from a comparative point of view and to export its methodological framework elsewhere. These three wetlands suffer from problems of environmental deterioration as a result of the water loss caused by strong diffuse anthropic impacts linked to issues such as agriculture and urban development. However, the three cases cover a varied catalogue of different contour conditions of these protected areas of high ecological value: large, medium and small sizes, coastal and inland spaces, wetlands supplied only by underground aquifers or also including surface channels, different management systems at the administrative level, etc.
It is an understatement that current environmental policy and regulation is not working to keep in check the effects of diffuse human anthropization. The impact of land development on open space and natural environments continues to wreak havoc upon the landscape. Attempts to control and mitigate underlying processes have led to more progressive planning strategies and technologies, such as those introduced by McHarg [63] and Steinitz [64] in the 1970s and 1980s that fundamentally changed socio-ecological practice and research and ultimately influence many of the early software applications developed in geographic information systems (GIS). However, many of these approaches are currently spatially simplistic, static in nature and not capable of detecting indirect impacts from neighboring land uses that serve to exacerbate the problem [7,65]. Add to this climate change and landscape trends can take on new and accelerated trajectories where traditional place-based planning, coupled with negative outcomes, can lead to greater uncertainties and environmental degradation.
Transitioning from static place-based policies to space-time dynamic policies appears to be a plausible solution to landscapes impacted by real time climate change. With the evolution of GIS and Remote Sensing, a science driven, process-based approach to the development of effective dynamic policy is possible. The metrics we introduce in this study, analogous to McHarg’s introduction of suitability analysis to improve ecological planning [57], show it is possible to dynamically track indicators, both static and dynamic, to drive real time proactive environmental policy.
The approach followed supposes a preliminary approximation at a spatial level to the concept of the area of influence of diffuse anthropization (AIDA) of a protected natural space as a method for the multidisciplinary spatial diagnosis and evaluation of the environmental impact derived from diffuse anthropization phenomena. This mixes two concepts (area of influence through a socio-ecological analysis and spatial analysis of anthropic diffuse impacts) which, separately, have numerous bibliographic references in this field of research [66,67,68], yet taken together as an integrated approach for analysis have a rather scarce and unspecific bibliography [69]. Thus, it must be noted that this approach has some limitations as a result of its initiatory state as a universal research approach.
Therefore, beyond the general criteria raised for AIDA, it has been necessary to resort to specific criteria found in the existing scientific bibliography on the three case studies addressed in order to ensure the assessment of the area of influence based on the reality of their existing boundary conditions. Nevertheless, it is a tool with important applications from the point of view of policy implications. In Spain, there is a growing trend to protect natural parks of high ecological value with a buffer zone called a pre-park. However, the criteria for spatial determination of this area remain unclear and lack objectivity, so this new concept may represent an advance in a more scientific determination of this figure of environmental protection.
In the future, this concept of the diffuse anthropization influence area of a protected natural area must be perfected (probably incorporating sensitivity and reliability analyses) and made more standardizable as a tool for analyzing the impact of diffuse anthropization in these environments. This issue must be considered above all in problems such as that addressed in the case of water loss because of indirect activities, since the variables to be evaluated may not always be evident [70].
Regarding the specific results obtained, at a general level, the geostatistical approach used presents remarkable differences compared to previous studies on the subject. On the one hand, it proposes a multidisciplinary comparative analysis of the ecological deterioration of each of the wetlands. The analysis by means of GIS indicators of dimensionless deterioration within the framework of the AIDA determined by using homogeneous criteria makes it possible to compare similar problems but subjected to different boundary conditions. This represents an advance with respect to previous studies in this field and these case studies, which traditionally proposed specific analysis for only one case study [15,37,71] or carried out comparative proposals of cases that needed to be quite similar [5,72].
On the other hand, it enables the large-scale objective analysis of the existing spatial correlation between two phenomena whose link is not easy to establish a priori. The problems related to water loss in protected wetlands are a proven fact in the cases studied [28,32,41]. However, the level of spatiotemporal participation in this phenomenon of such an indirect impact and in which different actors participate, as happens in diffuse territorial anthropization, is not easily measurable. The proposed methodology allows different causes to be identified from an objective numerical approach, assigning a statistically robust spatial and temporal correlation, which could not be done with other previous approaches that addressed the impact of the set of actors involved from a spatially aggregated evaluation of consequences.
This last question can be very useful from the point of view of policy implications. Environmental planning in Spain usually poses restrictions on certain uses in collateral areas that are not strictly included within protected areas. However, these restrictions cannot be infinite or generic, so it is very important to know which the most damaging human actions are at an indirect level in protected areas to optimize environmental planning criteria in relation to the phenomenon of diffuse anthropization.
Finally, the limitations of the model represent an issue that must be addressed. As has been noted, the need for explanatory variables is far greater in highly anthropized environments, especially when they are very close to urban areas. This can result, in some cases close to large cities or in highly anthropized environments, in the analysis being insufficient. This limitation, together with the need to deepen the achievement of a more sophisticated framework to obtain AIDAs based on more robust and standardizable analyses, are issues to be addressed in future lines of research.

6. Conclusions

The indirect impacts derived from diffuse territorial anthropization are a difficult issue to assess. The concept of Area of Influence of Diffuse Anthropization (AIDA) proposed in this work helps their diagnosis by means of a geostatistical spatial analysis. In this work, different GIS indicators have been proposed to spatially correlate the transformation of the territory in the area surrounding three quite different wetlands, albeit with similar problems of ecological deterioration due to water loss. The results obtained show how, in the case of Doñana, the transformation of the territory by agriculture in its AIDA competes for water with the Natural Park. In the case of the Tablas de Daimiel, a similar phenomenon occurs, but on a much larger scale and in which the climatic variables exert a much greater incidence. Finally, in the case of the Albufera of Valencia, it is observed that the hydrological-orographic variable is the most decisive, with the global phenomenon being more complex and attributable to a greater number of variables.

Supplementary Materials

GIS files of AIDA and information for three case studies are available online at https://www.mdpi.com/article/10.3390/ijgi10090630/s1.

Author Contributions

Conceptualization, Salvador García-Ayllon and John Radke; Data curation, Salvador García-Ayllon; Methodology, Salvador García-Ayllon; Software, Salvador García-Ayllon; Supervision, John Radke; Validation, John Radke; Writing – original draft, Salvador García-Ayllon. All authors have read and agreed to the published version of the manuscript.

Funding

This research received no external funding.

Institutional Review Board Statement

Not applicable.

Informed Consent Statement

Not applicable.

Conflicts of Interest

The authors declare no conflict of interest.

Appendix A

The conceptual map of the geodatabase used in this case to establish the criteria for generating the areas of influence of diffuse anthropization is as follows:
Figure A1. Conceptual map of the geodatabase used.
Ijgi 10 00630 g0a1

Appendix B

The criteria used in the dynamic indicators of territorial transformation have been based on the following Corine Land Cover 2018 categories:
-
Agricultural transformation: categories 212, 213, 221, 222, 223, 231, 241, 242, 243 and 244.
-
Urbanized areas: categories 111, 112, 133 and 142.
-
Artificial soil transformation: agricultural transformation and urbanized areas categories plus the following ones 121,122, 123, 124, 131, 132, 141 and 211.

Appendix C

The characteristics of the data satellites used are detailed in Table A1.
Table A1. Detailed data from the Sentinel 2, LandSat 5, LandSat 7 and LandSat 8 satellites.
BandSentinel 2WavelengthLandSat 8Wavelength
1Coastal spray0.443Coastal spray0.43
2Blue0.49Blue0.482
3Green0.56Green0.562
4Red0.665Red0.655
5Red edge0.705NIRS0.865
6Red edge0.74SWIR 11.61
7Red edge0.783SWIR 22.2
8NIRS0.842Panchromatic0.59
8ARed edge0.865--
9Water steam0.945Clouds1.375
10SWIR/Clouds1.375TIRS 1 (Thermal IR)10.9
11SWIR1.61TIRS 1 (Thermal IR)12
12SWIR2.19--
BandLandSat 7WavelengthLandSat 8Wavelength
1Blue0.4775Blue0.4825
2Green0.56Green0.565
3Red0.6615Red0.66
4NIRS0.835NIRS0.8375
5SWIR 11.648SWIR 11.65
6TIR11.335TIR 111.45
7SWIR 22.2045TIR 22.22
8Panchromatic0.7055--
8A----
9----
10----
11----
12----

Appendix D

The detailed formulation of geostatistical indices is as follow:
The z I -score for the Global Moran’s I statistic is computed as in (A1):
z I = I E I V I
where E I and V I can be calculated as follows:
E I   = 1 / n 1
V I   = E I 2 E I 2
The z I -score for the Anselin Local Moran’s I statistic is computed as in (A4):
z I = I E I V I i
where E I and V I can be calculated as follows:
E I   = j = 1 , j = i n w i , j n 1
V I   = E I 2 E I i

References

  1. Zoppi, C. Integration of conservation measures concerning natura 2000 sites into marine protected areas regulations: A study related to Sardinia. Sustainability 2018, 10, 3460. [Google Scholar] [CrossRef]
  2. Bueno, P.F.; Schiavetti, A. The influence of fisherman scale in the resilience of socio-ecological systems: An analysis using Q methodology. Ocean Coast. Manag. 2019, 169, 214–224. [Google Scholar] [CrossRef]
  3. García-Ayllón, S. Diagnosis of complex coastal ecological systems: Environmental GIS analysis of a highly stressed Mediterranean lagoon through spatiotemporal indicators. Ecol. Indic. 2017, 83, 451–462. [Google Scholar] [CrossRef]
  4. Velasco, A.M.; Pérez-Ruzafa, A.; Martínez-Paz, J.M.; Marcos, C. Ecosystem services and main environmental risks in a coastal lagoon (Mar Menor, Murcia, SE Spain): The public perception. J. Nat. Conserv. 2018, 43, 180–189. [Google Scholar] [CrossRef]
  5. Waylen, K.A.; Blackstock, K.L.; Van Hulst, F.; Damian, C.; Horváth, F.; Johnson, R.K.; Kanka, R.; Külvik, M.; Macleod, C.J.; Meissner, K.; et al. Policy-driven monitoring and evaluation: Does it support adaptive management of socio-ecological systems? Sci. Total. Environ. 2019, 662, 373–384. [Google Scholar] [CrossRef]
  6. Garcia-Ayllon, S.; Miralles, J.L.; Bejan, A.; Brebbia, C.; Bryant, J.; Burgess, S.; Chon, T.; Jørgensen, S.; Patten, B.; Pasini, D.; et al. The environmental impacts of land transformation in the coastal perimeter of the Mar Menor Lagoon (Spain). Int. J. Des. Nat. Ecodynamics 2014, 9, 109–128. [Google Scholar] [CrossRef] [Green Version]
  7. Lin, Y.-P.; Hong, N.-M.; Wu, P.-J.; Wu, C.-F.; Verburg, P.H. Impacts of land use change scenarios on hydrology and land use patterns in the Wu-Tu watershed in Northern Taiwan. Landsc. Urban Plan. 2007, 80, 111–126. [Google Scholar] [CrossRef]
  8. Lins-De-Barros, F.M. Integrated coastal vulnerability assessment: A methodology for coastal cities management integrating socioeconomic, physical and environmental dimensions—Case study of Região dos Lagos, Rio de Janeiro, Brazil. Ocean Coast. Manag. 2017, 149, 1–11. [Google Scholar] [CrossRef]
  9. Kataržytė, M.; Mėžinė, J.; Vaičiūtė, D.; Liaugaudaitė, S.; Mukauskaitė, K.; Umgiesser, G.; Schernewski, G. Fecal contamination in shallow temperate estuarine lagoon: Source of the pollution and environmental factors. Mar. Pollut. Bull. 2018, 133, 762–772. [Google Scholar] [CrossRef]
  10. Yuan, F.; Wei, Y.D.; Gao, J.; Chen, W. Water crisis, environmental regulations and location dynamics of pollution-intensive industries in China: A study of the Taihu Lake watershed. J. Clean. Prod. 2019, 216, 311–322. [Google Scholar] [CrossRef]
  11. Hou, D.; O’Connor, D.; Nathanail, P.; Tian, L.; Ma, Y. Integrated GIS and multivariate statistical analysis for regional scale assessment of heavy metal soil contamination: A critical review. Environ. Pollut. 2017, 231, 1188–1200. [Google Scholar] [CrossRef]
  12. Rigollet, V.; Sfriso, A.; Marcomini, A.; De Casabianca, M. Seasonal evolution of heavy metal concentrations in the surface sediments of two Mediterranean Zostera marina L. beds at Thau lagoon (France) and Venice lagoon (Italy). Bioresour. Technol. 2004, 95, 159–167. [Google Scholar] [CrossRef]
  13. Maanan, M.; Saddik, M.; Maanan, M.; Chaibi, M.; Assobhei, O.; Zourarah, B. Environmental and ecological risk assessment of heavy metals in sediments of Nador lagoon, Morocco. Ecol. Indic. 2015, 48, 616–626. [Google Scholar] [CrossRef]
  14. Wei, L.; Luo, Y.; Wang, M.; Su, S.; Pi, J.; Li, G. Essential fragmentation metrics for agricultural policies: Linking landscape pattern, ecosystem service and land use management in urbanizing China. Agric. Syst. 2020, 182, 102833. [Google Scholar] [CrossRef]
  15. Muñoz-Reinoso, J.C. Vegetation changes and groundwater abstraction in SW Doñana, Spain. J. Hydrol. 2001, 242, 197–209. [Google Scholar] [CrossRef]
  16. Berzas, J.; García, L.; Rodríguez, R.; Martín-Alvarez, P. Evolution of the water quality of a managed natural wetland: Tablas de Daimiel National Park (Spain). Water Res. 2000, 34, 3161–3170. [Google Scholar] [CrossRef]
  17. Soria, J.; Vera-Herrera, L.; Calvo, S.; Romo, S.; Vicente, E.; Sahuquillo, M.; Sòria-Perpinyà, X. Residence time analysis in the albufera of Valencia, a Mediterranean Coastal Lagoon, Spain. Hydrology 2021, 8, 37. [Google Scholar] [CrossRef]
  18. García-Ayllón, S. GIS Assessment of mass tourism anthropization in sensitive coastal environments: Application to a case study in the Mar Menor Area. Sustainability 2018, 10, 1344. [Google Scholar] [CrossRef] [Green Version]
  19. Ju, Y.; Lindbergh, S.; He, Y.; Radke, J.D. Climate-related uncertainties in urban exposure to sea level rise and storm surge flooding: A multi-temporal and multi-scenario analysis. Cities 2019, 92, 230–246. [Google Scholar] [CrossRef]
  20. Boongaling, C.G.K.; Faustino-Eslava, D.V.; Lansigan, F.P. Modeling land use change impacts on hydrology and the use of landscape metrics as tools for watershed management: The case of an ungauged catchment in the Philippines. Land Use Policy 2018, 72, 116–128. [Google Scholar] [CrossRef]
  21. Daniele, L.; Vallejos, Á.; Corbella, M.; Molina, L.; Pulido-Bosch, A. Hydrogeochemistry and geochemical simulations to assess water-rock interactions in complex carbonate aquifers: The case of Aguadulce (SE Spain). Appl. Geochem. 2013, 29, 43–54. [Google Scholar] [CrossRef]
  22. Valdes-Abellan, J.; Pardo, M.; Jodar-Abellan, A.; Pla, C.; Fernandez-Mejuto, M. Climate change impact on karstic aquifer hydrodynamics in southern Europe semi-arid region using the KAGIS model. Sci. Total. Environ. 2020, 723, 138110. [Google Scholar] [CrossRef]
  23. Baudron, P.; Alonso-Sarría, F.; García-Aróstegui, J.-L.; Cánovas-García, F.; Martínez-Vicente, D.; Moreno-Brotóns, J. Identifying the origin of groundwater samples in a multi-layer aquifer system with Random Forest classification. J. Hydrol. 2013, 499, 303–315. [Google Scholar] [CrossRef]
  24. Falcone, J.A.; Carlisle, D.M.; Weber, L.C. Quantifying human disturbance in watersheds: Variable selection and performance of a GIS-based disturbance index for predicting the biological condition of perennial streams. Ecol. Indic. 2010, 10, 264–273. [Google Scholar] [CrossRef]
  25. García-Ayllón, S. Predictive diagnosis of agricultural periurban areas based on territorial indicators: Comparative landscape trends of the so-called “Orchard of Europe”. Sustainaility 2018, 10, 1820. [Google Scholar] [CrossRef] [Green Version]
  26. Mancilla-Leytón, J.; Fernández-Alés, R.; Vicente, Á.M. Effects of diet selection by goats grazing on the vegetation of a protected pine forest in Doñana Natural Park (SW Spain). Sustainability 2021, 13, 3950. [Google Scholar] [CrossRef]
  27. Bustamante, J.; Pacios, F.; Díaz-Delgado, R.; Aragonés, D. Predictive models of turbidity and water depth in the Doñana marshes using Landsat TM and ETM+ images. J. Environ. Manag. 2009, 90, 2219–2225. [Google Scholar] [CrossRef] [PubMed]
  28. Márquez-Ferrando, R.; Figuerola, J.; Hooijmeijer, J.C.; Piersma, T. Recently created man-made habitats in Doñana provide alternative wintering space for the threatened Continental European black-tailed godwit population. Biol. Conserv. 2014, 171, 127–135. [Google Scholar] [CrossRef] [Green Version]
  29. Adame, J.; Lope, L.; Hidalgo, P.; Sorribas, M.; Gutiérrez-Álvarez, I.; Del Águila, A.; Saiz-Lopez, A.; Yela, M. Study of the exceptional meteorological conditions, trace gases and particulate matter measured during the 2017 forest fire in Doñana Natural Park, Spain. Sci. Total. Environ. 2018, 645, 710–720. [Google Scholar] [CrossRef]
  30. Fernandez-Carrillo, A.; Sanchez-Rodriguez, E.; Rodriguez-Galiano, V. Characterising marshland temporal dynamics using remote sensing: The case of Bolboschoenetum maritimi in Doñana national park. Appl. Geogr. 2019, 112, 102094. [Google Scholar] [CrossRef]
  31. Ruiz, F.; Pozo, M.; Carretero, M.I.; Muñoz, J.M.; González-Regalado, M.L.; Abad, M.; Izquierdo, T.; Vidal, J.R.; Cáceres, L.M.; Monge, G. Whole-rock and clay mineralogy as paleoenvironmental tracers during the Late Holocene sedimentary evolution of the Doñana National Park (SW Spain). Appl. Clay Sci. 2020, 197, 105780. [Google Scholar] [CrossRef]
  32. De la Hera, Á.; Villarroya, F. Services evolution of two groundwater dependent wetland ecosystems in the “Mancha Húmeda” Biosphere Reserve (Spain). Resources 2013, 2, 128–150. [Google Scholar] [CrossRef] [Green Version]
  33. Cirujano, S.; Casado, C.; Bernués, M.; Camargo, J. Ecological study of Las Tablas de Daimiel National Park (Ciudad Real, Central Spain): Differences in water physico-chemistry and vegetation between 1974 and 1989. Biol. Conserv. 1996, 75, 211–215. [Google Scholar] [CrossRef]
  34. Valiño, M.D.; Rodríguez, A.V.; Zapata, M.B.R.; Gil García, M.J.; Gutiérrez, I.D.B. Climatic changes since the late-glacial/holocene transition in La Mancha Plain (South-central Iberian Peninsula, Spain) and their incidence on Las Tablas de Daimiel marshlands. Quat. Int. 2002, 93-94, 73–84. [Google Scholar] [CrossRef]
  35. Rey, J.; Martínez, J.; Mediavilla, R.; Santisteban, J.I.; Castaño, S.C.; De la Losa, A. Geophysical characterization of stratigraphical surfaces: Basin floor and sedimentological architectural elements of Las Tablas de Daimiel (Quaternary of Southern-Central Spain). J. Appl. Geophys. 2017, 136, 387–399. [Google Scholar] [CrossRef]
  36. Fernández-Trujillo, S.; López-Perea, J.J.; Jiménez-Moreno, M.; Martín-Doimeadios, R.C.R.; Mateo, R. Metals and metalloids in freshwater fish from the floodplain of Tablas de Daimiel National Park, Spain. Ecotoxicol. Environ. Saf. 2021, 208, 111602. [Google Scholar] [CrossRef] [PubMed]
  37. Sebastiá-Frasquet, M.-T.; Aguilar-Maldonado, J.A.; Santamaría-Del-Ángel, E.; Estornell, J. Sentinel 2 analysis of turbidity patterns in a Coastal Lagoon. Remote. Sens. 2019, 11, 2926. [Google Scholar] [CrossRef] [Green Version]
  38. Gargiulo, M.; Dell’Aglio, D.A.G.; Iodice, A.; Riccio, D.; Ruello, G. Integration of sentinel-1 and sentinel-2 data for land cover mapping using W-net. Sensors 2020, 20, 2969. [Google Scholar] [CrossRef] [PubMed]
  39. Dona, C.; Chang, N.-B.; Caselles, V.; Sánchez, J.M.; Camacho, A.; Delegido, J.; Vannah, B.W. Integrated satellite data fusion and mining for monitoring lake water quality status of the Albufera de Valencia in Spain. J. Environ. Manag. 2015, 151, 416–426. [Google Scholar] [CrossRef] [Green Version]
  40. Fernández, P.D.B.; Gómez, A.G.; Alba, J.G.; Díaz, C.Á.; Cortezón, J.A.R. A model for describing the eutrophication in a heavily regulated coastal lagoon. Application to the Albufera of Valencia (Spain). J. Environ. Manag. 2012, 112, 340–352. [Google Scholar] [CrossRef]
  41. Perilla, O.L.U.; Gómez, A.G.; Gómez, A.G.; Díaz, C.Á.; Cortezón, J.A.R. Methodology to assess sustainable management of water resources in Coastal Lagoons with agricultural uses: An application to the Albufera Lagoon of Valencia (Eastern Spain). Ecol. Indic. 2012, 13, 129–143. [Google Scholar] [CrossRef]
  42. Martín, M.; Hernández-Crespo, C.; Andrés-Doménech, I.; Benedito-Durá, V. Fifty years of eutrophication in the Albufera Lake (Valencia, Spain): Causes, evolution and remediation strategies. Ecol. Eng. 2020, 155, 105932. [Google Scholar] [CrossRef]
  43. Calvo, S.; Romo, S.; Soria, J.; Picó, Y. Pesticide contamination in water and sediment of the aquatic systems of the Natural Park of the Albufera of Valencia (Spain) during the rice cultivation period. Sci. Total. Environ. 2021, 774, 145009. [Google Scholar] [CrossRef]
  44. Wu, X.; Dong, W.; Lin, X.; Liang, Y.; Meng, Y.; Xie, W. Evolution of wetland in Honghe National Nature Reserve from the view of hydrogeology. Sci. Total. Environ. 2017, 609, 1370–1380. [Google Scholar] [CrossRef] [PubMed]
  45. Ahmed, K.R.; Akter, S.; Marandi, A.; Schüth, C. A simple and robust wetland classification approach by using optical indices, unsupervised and supervised machine learning algorithms. Remote. Sens. Appl. Soc. Environ. 2021, 23, 100569. [Google Scholar] [CrossRef]
  46. Garcia-Ayllon, S.; Radke, J. Geostatistical analysis of the spatial correlation between territorial anthropization and flooding vulnerability: Application to the DANA phenomenon in a Mediterranean watershed. Appl. Sci. 2021, 11, 809. [Google Scholar] [CrossRef]
  47. Guaita-García, N.; Martínez-Fernández, J.; Barrera-Causil, C.J.; Esteve-Selma, M.A.; Fitz, H.C. Local perceptions regarding a social–ecological system of the mediterranean coast: The Mar Menor (Región de Murcia, Spain). Environ. Dev. Sustain. 2021, 23, 2882–2909. [Google Scholar] [CrossRef]
  48. García-Ayllón, S. New strategies to improve co-management in enclosed Coastal Seas and Wetlands subjected to complex environments: Socio-economic analysis applied to an international recovery success case study after an environmental crisis. Sustainability 2019, 11, 1039. [Google Scholar] [CrossRef] [Green Version]
  49. Kantamaneni, K.; Phillips, M.; Thomas, T.; Jenkins, R. Assessing coastal vulnerability: Development of a combined physical and economic index. Ocean Coast. Manag. 2018, 158, 164–175. [Google Scholar] [CrossRef]
  50. Bianco, F.; Conti, P.; García-Ayllon, S.; Pranzini, E. An integrated approach to analyze sedimentary stock and coastal erosion in Vulnerable areas: Resilience assessment of San Vicenzo’s Coast (Italy). Water 2020, 12, 805. [Google Scholar] [CrossRef] [Green Version]
  51. García, N.G.; Fernández, J.M.; Fitz, C. Environmental scenario analysis on natural and social-ecological systems: A review of methods, approaches and applications. Sustainability 2020, 12, 7542. [Google Scholar] [CrossRef]
  52. Martín-López, B.; García-Llorente, M.; Palomo, I.; Montes, C. The conservation against development paradigm in protected areas: Valuation of ecosystem services in the Doñana social-ecological system (Southwestern Spain). Ecol. Econ. 2011, 70, 1481–1491. [Google Scholar] [CrossRef]
  53. Gao, B.-C. NDWI—A normalized difference water index for remote sensing of vegetation liquid water from space. Remote. Sens. Environ. 1996, 58, 257–266. [Google Scholar] [CrossRef]
  54. Sellers, P.J. Canopy reflectance, photosynthesis and transpiration. Int. J. Remote. Sens. 1985, 6, 1335–1372. [Google Scholar] [CrossRef]
  55. Agnoletti, M. The degradation of traditional landscape in a mountain area of Tuscany during the 19th and 20th centuries: Implications for biodiversity and sustainable management. For. Ecol. Manag. 2007, 249, 5–17. [Google Scholar] [CrossRef]
  56. García-Meléndez, E.; Molina, I.; Ferre-Julià, M.; Aguirre, J. Multisensor data integration and GIS analysis for Natural Hazard mapping in a semiarid area (Southeast Spain). Adv. Space Res. 1998, 21, 493–499. [Google Scholar] [CrossRef]
  57. Wu, C. Handbook of applied spatial analysis: Software tools, methods and applications. J. Reg. Sci. 2012, 52, 386–388. [Google Scholar] [CrossRef]
  58. Anselin, L. Local indicators of spatial association-LISA. Geogr. Anal. 1995, 27, 93–115. [Google Scholar] [CrossRef]
  59. Gómez, N.; Siri, A.; Capítulo, L.R.; Colautti, D.C.; Alcalde, L.; Capítulo, A.R.; Donato, M.; Álvarez, M.F.; de Souza, J.R.G.; Jensen, R.F.; et al. Effects of urban demand for food and water on physicochemicals and biotic structure of riverine wetlands in the Pampean plain. Ecohydrol. Hydrobiol. 2021, (in press). [Google Scholar] [CrossRef]
  60. Da Silva, F.L.; Stefani, M.S.; Smith, W.; Schiavone, D.C.; da Cunha-Santino, M.B.; Bianchini, I., Jr. An applied ecological approach for the assessment of anthropogenic disturbances in urban wetlands and the contributor river. Ecol. Complex. 2020, 43, 100852. [Google Scholar] [CrossRef]
  61. Li, D.; Tian, P.; Luo, Y.; Dong, B.; Cui, Y.; Khan, S. Importance of stopping groundwater irrigation for balancing agriculture and wetland ecosystem. Ecol. Indic. 2021, 127, 107747. [Google Scholar] [CrossRef]
  62. Sousa, C.A.; Cunha, M.E.; Ribeiro, L. Tracking 130 years of coastal wetland reclamation in Ria Formosa, Portugal: Opportunities for conservation and aquaculture. Land Use Policy 2020, 94, 104544. [Google Scholar] [CrossRef]
  63. McHarg, I.L. Design with Nature; Natural History Press: Cheltenham, UK, 1969. [Google Scholar]
  64. Steinitz, C. Simulating alternative policies for implementing the Massachusetts scenic and recreational rivers act: The North River demonstration project. Landsc. Plan. 1979, 6, 51–89. [Google Scholar] [CrossRef]
  65. Radke, J. Detecting potential erosion threats to the coastal zone: St. John, Usvi. Mar. Geodesy 1997, 20, 235–254. [Google Scholar] [CrossRef]
  66. Newton, A.; Weichselgartner, J. Hotspots of coastal vulnerability: A DPSIR analysis to find societal pathways and responses. Estuar. Coast. Shelf Sci. 2014, 140, 123–133. [Google Scholar] [CrossRef]
  67. Everard, M. A socio-ecological framework supporting catchment-scale water resource stewardship. Environ. Sci. Policy 2019, 91, 50–59. [Google Scholar] [CrossRef]
  68. Berrouet, L.; Machado, J.; Villegas-Palacio, C. Vulnerability of socio—ecological systems: A conceptual framework. Ecol. Indic. 2018, 84, 632–647. [Google Scholar] [CrossRef]
  69. Hein, M.Y.; Birtles, A.; Willis, B.L.; Gardiner, N.; Beeden, R.; Marshall, N.A. Coral restoration: Socio-ecological perspectives of benefits and limitations. Biol. Conserv. 2019, 229, 14–25. [Google Scholar] [CrossRef]
  70. Allpass, J. Static versus dynamic planning: A complimentary approach. Ekistics 1967, 24, 489–491. [Google Scholar]
  71. Fernández, B.G.; Gámir, V.N.; Sánchez, L.A. A synthetic model of surface inundation relationships and water source impacts of the wetland Las Tablas de Daimiel National Park, Central Spain. Ecol. Eng. 2013, 61, 407–418. [Google Scholar] [CrossRef]
  72. García-Ayllón, S. Integrated management in coastal lagoons of highly complexity environments: Resilience comparative analysis for three case-studies. Ocean Coast. Manag. 2017, 143, 16–25. [Google Scholar] [CrossRef]
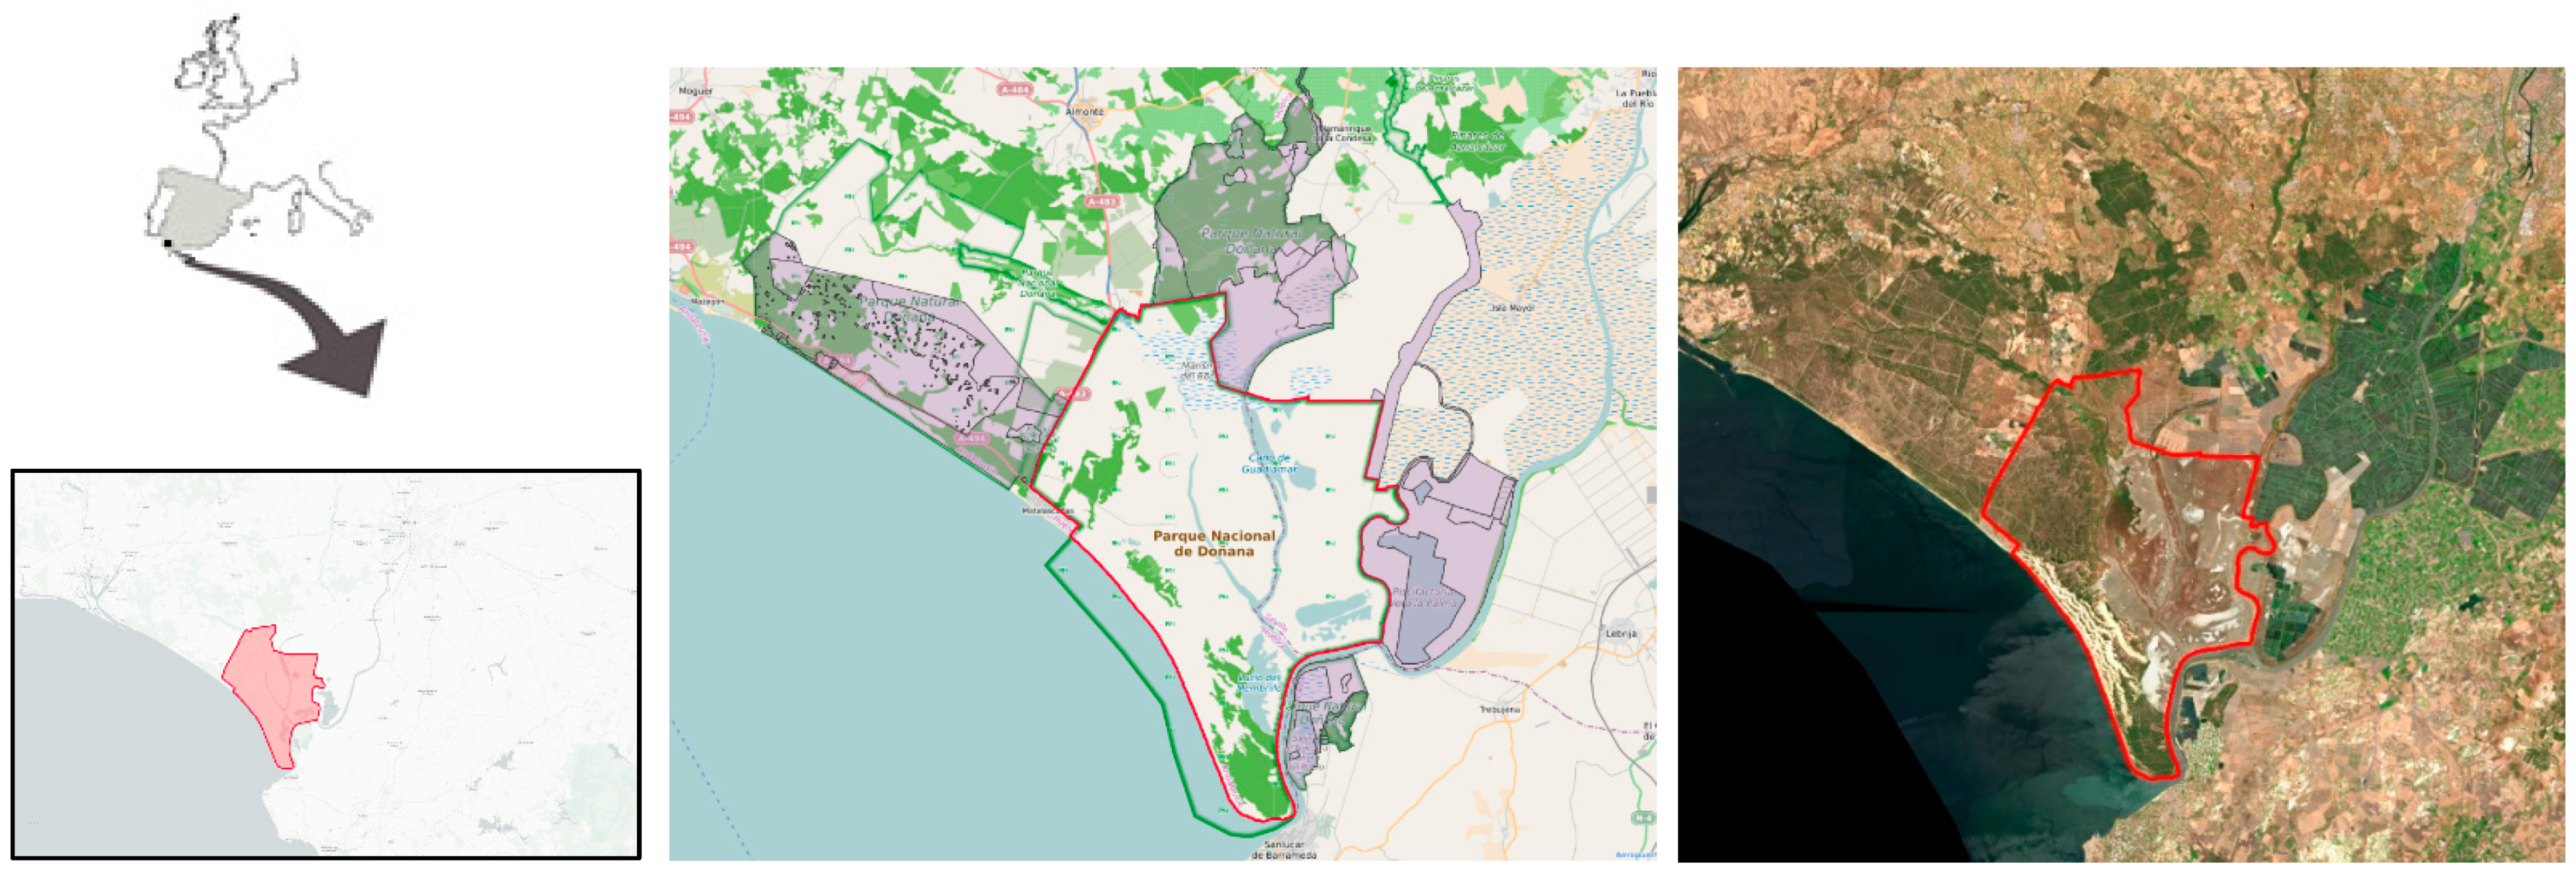
Figure 1. Doñana National Park (red) and protected areas of the Natural Park (purple): situation and boundary conditions.
Ijgi 10 00630 g001
Figure 2. Comparison of the situation of some areas of the park between 2007 and 2020.
Ijgi 10 00630 g002
Figure 3. Tablas de Daimiel National Park: situation and boundary conditions.
Ijgi 10 00630 g003
Figure 4. Comparison of an area of the park between 2013 and 2019.
Ijgi 10 00630 g004
Figure 5. The Albufera of Valencia Natural Park: situation and boundary conditions.
Ijgi 10 00630 g005
Figure 6. Comparison of the water level in the Albufera of Valencia at different times of the year.
Ijgi 10 00630 g006
Figure 7. Area of influence of diffuse anthropization in the Doñana National Park.
Ijgi 10 00630 g007
Figure 8. Area of influence of diffuse anthropization in the Tablas de Daimiel National Park.
Ijgi 10 00630 g008
Figure 9. Area of influence of diffuse anthropization in the Albufera of Valencia Natural Park.
Ijgi 10 00630 g009
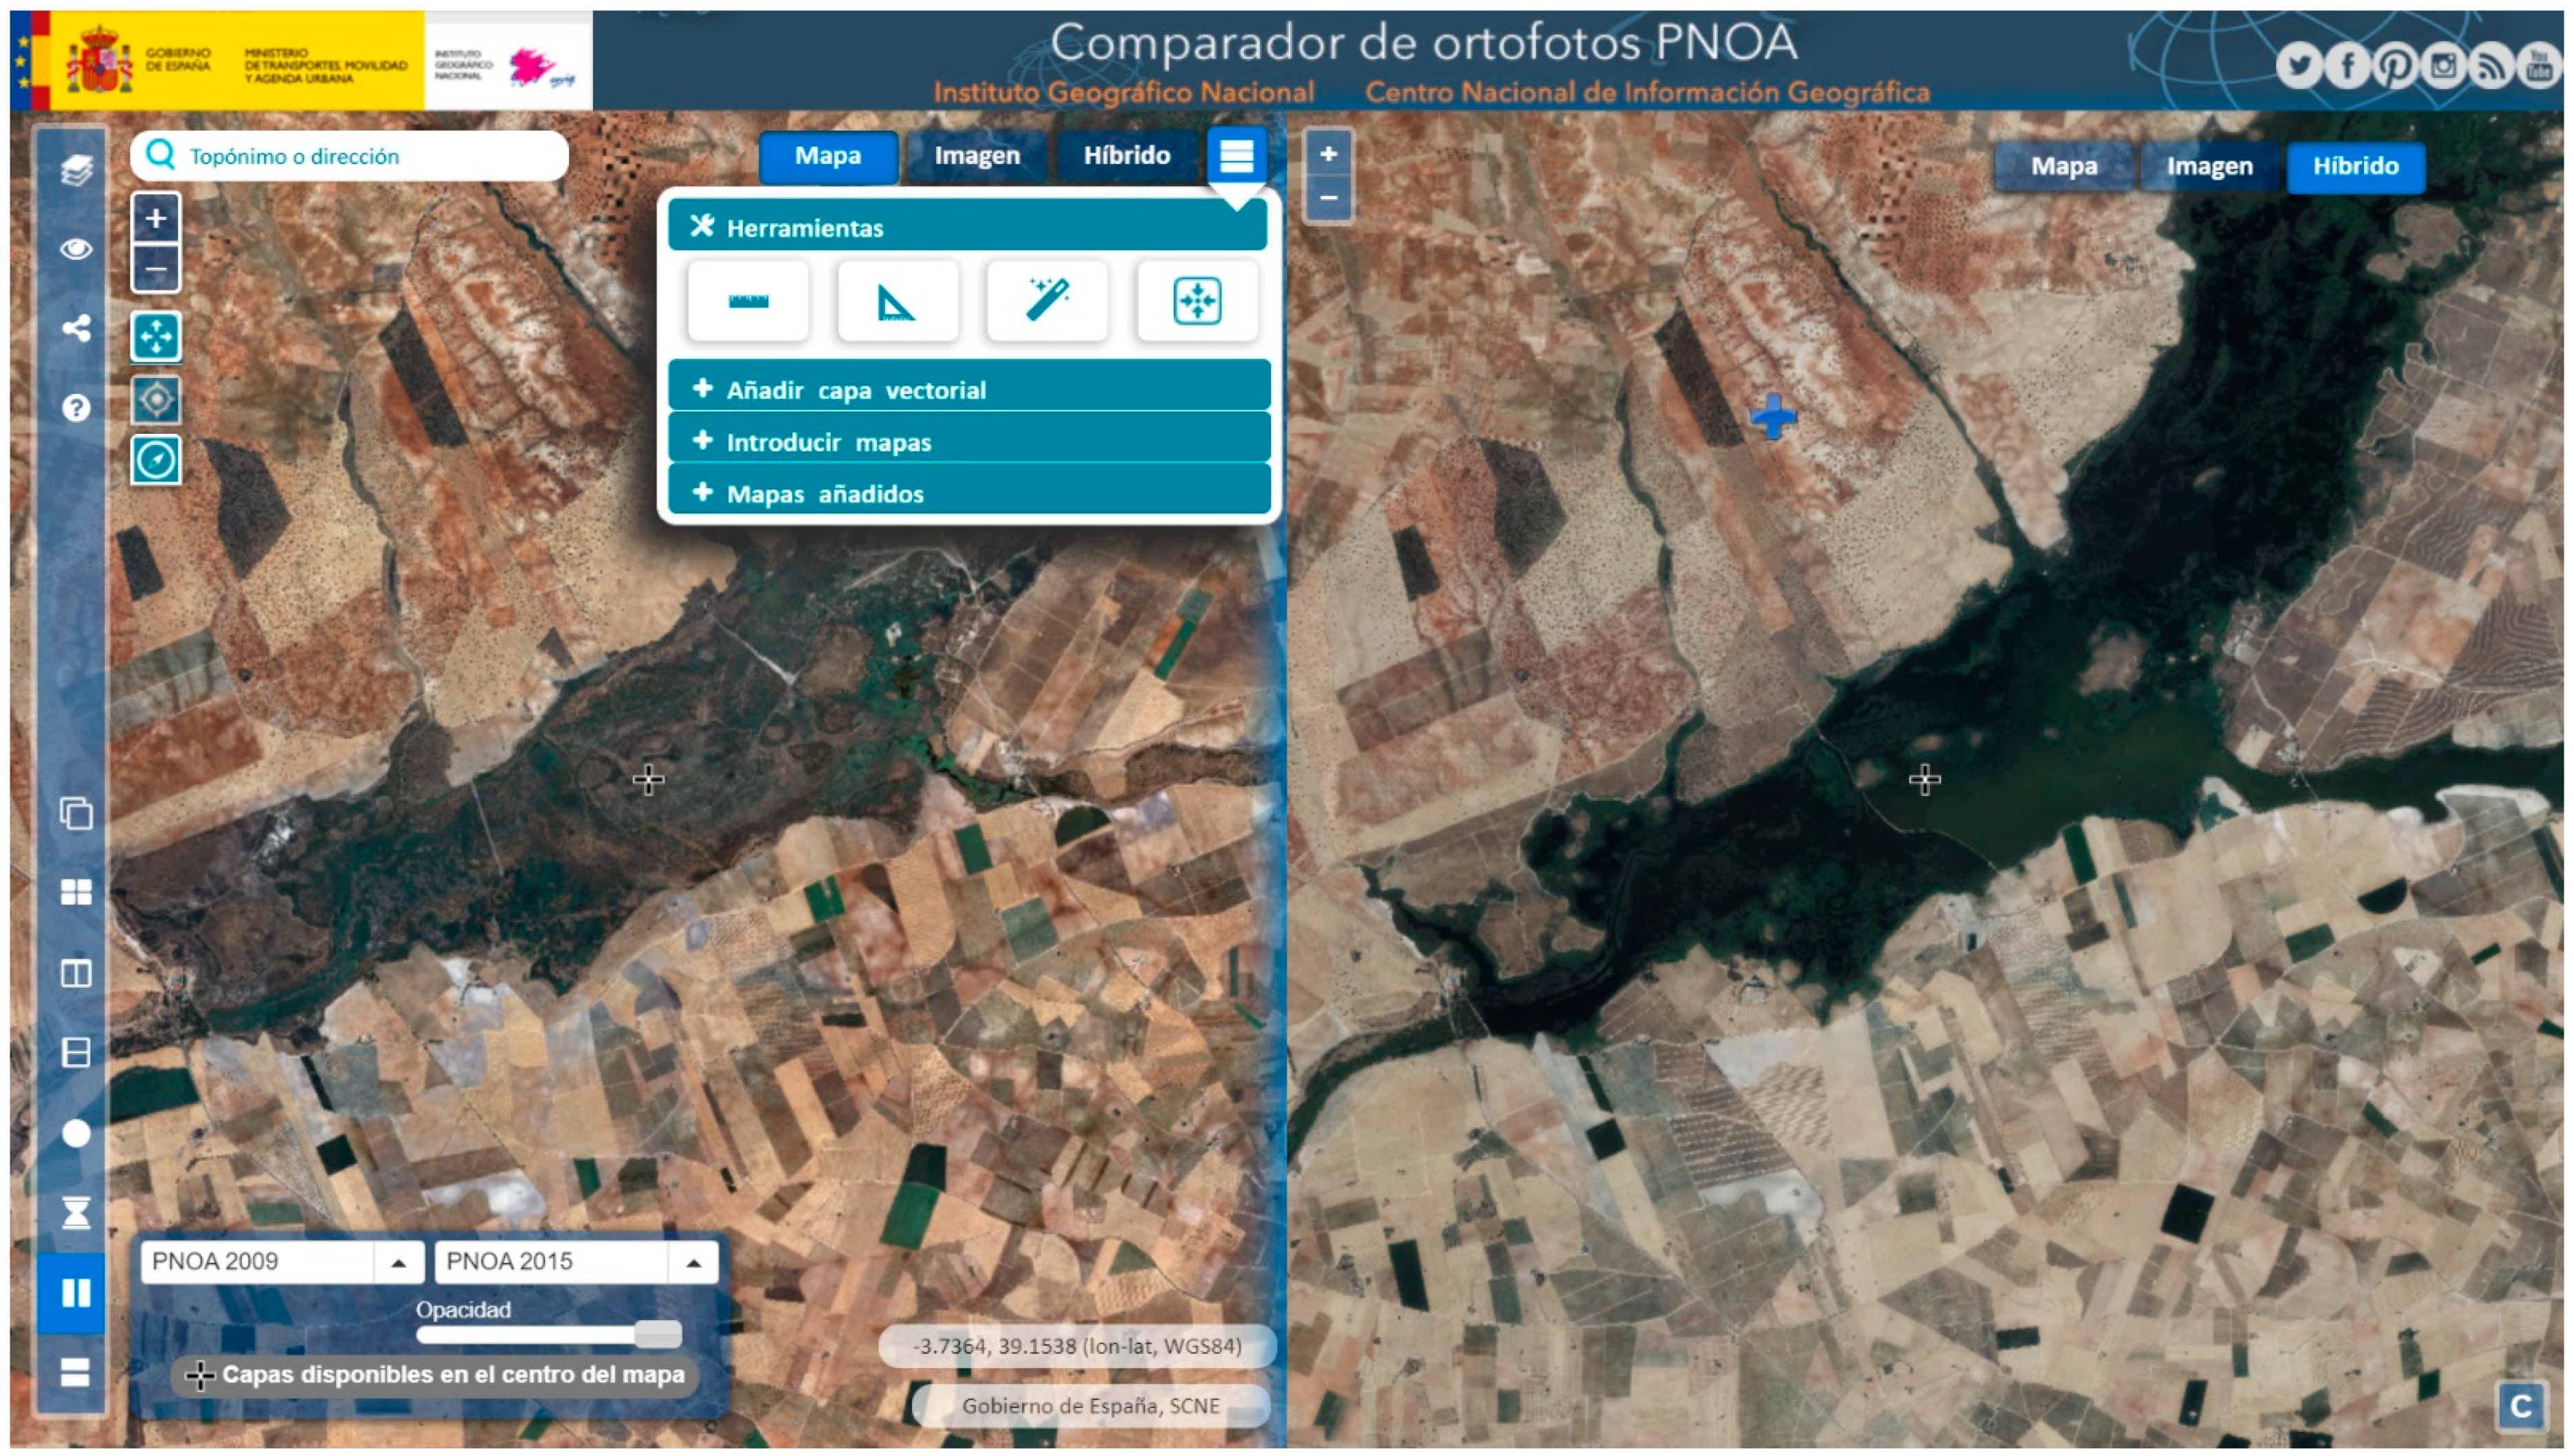
Figure 10. Comparative manual measurement of the evolution of the water masses in the Tablas de Daimiel Park with the historical comparator of the Spanish National Program for Aerial Orthophoto.
Ijgi 10 00630 g010
Figure 11. NDVI images from the Landsat 8 satellite in an area of the Doñana Natural Park subjected to an intense drought in 2018.
Ijgi 10 00630 g011
Figure 12. NDWI Evolution of rice crops in the Albufera of Valencia from August 2018 to July 2019 from Sentinel 2 images from the European space program Copernicus and the sentinel-hub web.
Ijgi 10 00630 g012
Figure 13. Sequences of satellite images of the area of study of the Doñana National Park for 2005, 2010, 2015 and 2020.
Ijgi 10 00630 g013
Figure 14. Sequences of satellite images of the area of study of the Tablas de Daimiel National Park for 2005, 2010, 2015 and 2020.
Ijgi 10 00630 g014
Figure 15. Sequences of satellite images of the area of study of the Albufera of Valencia Regional Park for 2005, 2010, 2015 and 2020.
Ijgi 10 00630 g015
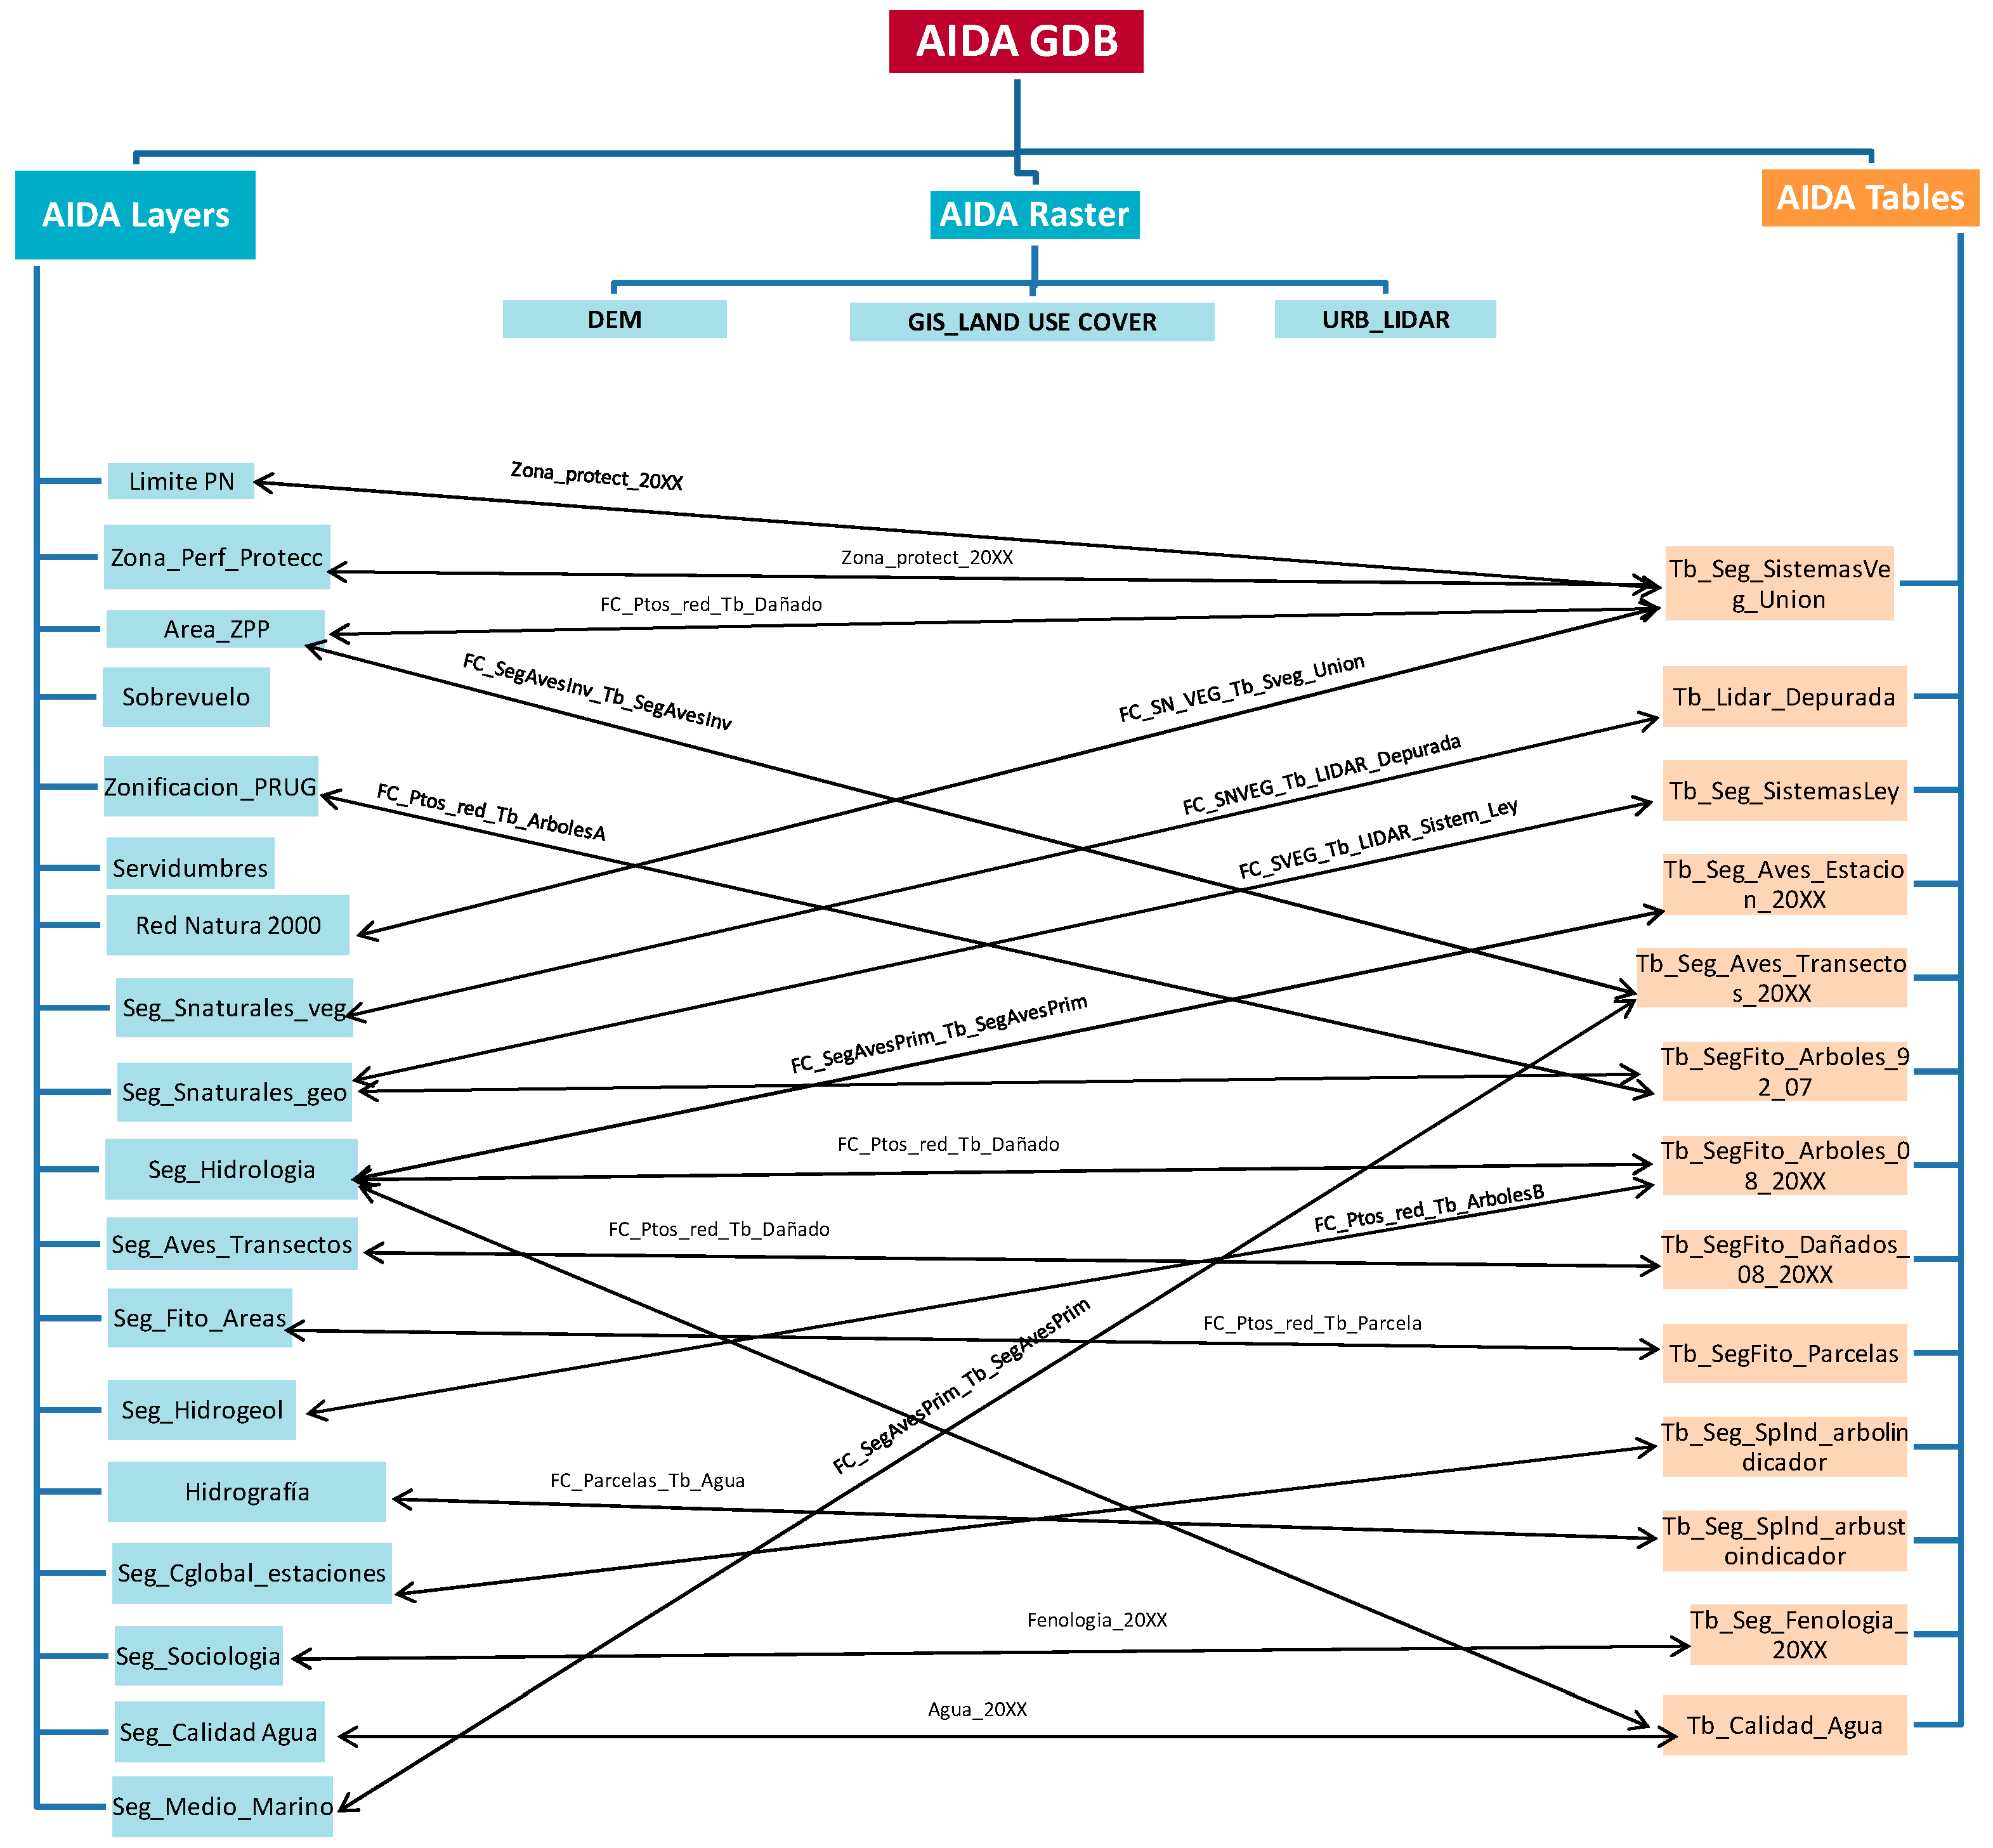
Figure 16. Evolution of static and dynamic GIS indicators for Doñana, Tablas de Daimiel and Albufera of Valencia case studies between 2000 and 2020.
Ijgi 10 00630 g016
Table 1. General and specific criteria applied for AIDA configuration.
CriteriaGeneral ParametersSpecific Criteria AppliedGIS Analysis Example
Underground hydrogeologyThe maximum area of influence is established as the surface area covered by the aquifer that feeds the protected natural space with water. In the case of very large aquifers, this area of influence can be reduced to the surface percentage that establishes a permanent flow of water in the natural space during all seasons of the year [44].[15,21,22] Ijgi 10 00630 i001
Surface hydrologyThe maximum area of influence is established as the area covered by the surface drainage hydrographic sub-basin that encompasses or empties into the protected natural area. Only channels with Horton indices greater than 2 will be computed for the surface area of the basin. In the case of very large basins, this area of impact can be reduced by computing only Horton indices greater than or equal to 4 [45].[17,34,42] Ijgi 10 00630 i002
Land use planningThe structure of the territory must be considered both at the level of uses and the terrain orography. All those uses included in Corine Land Cover categories that generate direct or indirect anthropogenic impacts on protected areas may be included [46].[35,38,42] Ijgi 10 00630 i003
SociologyThe administrative structure of territory and the mobility patterns of people in the areas adjacent to the protected area must be taken into account. The presence of relevant transport infrastructures such as motorways and urban settlements, especially those of a tourist nature, are considered [47].[48,49] Ijgi 10 00630 i004
Sedimentary dynamicsIn estuarine seaside protected areas and coastal lagoons formed from dune ridges or mangroves, coastal infrastructures such as ports or breakwaters and other anthropogenic elements that generate impacts on the sedimentary dynamics of the wetlands are considered [50].[38,39,42] Ijgi 10 00630 i005
Environmental planning of ecosystemsThe existing protection tools beyond those legally established by the protected area must be taken into account, including those other environmental management instruments that have some link to the behavior of the species (ecological corridors, management plans for adjacent spaces, etc.) [51].[16,27,52] Ijgi 10 00630 i006
Table 2. Technical characteristics of georeferenced data used.
Mapping DataPixel Size Projected on the GSD Ground (cm)Planimetric Accuracy (X,Y) Mean Squared Error (m)Altimetric Accuracy (Z) Mean Squared Error (m)Mesh Step
FlightOrthophoto
2000–20044550<1.00<2.005 × 5
2005–20202225<0.50<1.005 × 5
Table 3. Global Moran’s I statistic for static and dynamic indicators in the three case studies (data order: Doñana Park/Tablas de Daimiel/Albufera of Valencia).
Static indicatorsIFAILVIWS
Global Moran’s Index0.33/0.41/0.710.37/0.52/0.490.38/0.41/0.12
z-score29.3/35.1/62.530.0/44.8/42.434.7/22.3/13.5
p-value0.01/0.01/0.010.01/0.01/0.010.01/0.01/0.01
Dynamic indicatorsIATSIUGSIMDA
Global Moran’s Index0.46/0.31/0.650.66/0.71/0.700.11/0.14/0.16
z-score50.4/22.8/53.958.5/59.3/52.215.7/13.3/20.6
p-value0.01/0.01/0.010.01/0.01/0.010.01/0.01/0.01
Table 4. Detailed multiple regression models (OLS) for LISA analysis of the different levels of spatial correlation between indicators for each of the three case studies.
Doñana National Park.
GIS IndicatorsFlooded Area (IFA)Life of Vegetation (ILV)
BStd. ErrortSign.BStd. ErrortSign.
I A T S 0.1850.0034.1120.000 *−0.4460.003−2.0340.000 *
I U G S 0.1070.0052.2480.000 *−0.3150.0090.9320.000 *
I M D A 0.1320.0083.7100.000 *−0.2790.010−4.1830.000 *
Akaike’s information criterion (AIC): 22,765.5AIC: 23,508.1
Multiple R-squared: 0.19Multiple R-squared: 0.22
Adjusted R-squared: 0.18Adjusted R-squared: 0.22
F-statistic: 139.24 Prob (>F) (3,3) degrees of freedom: 0F-statistic: 155.81 Prob (>F) (3,3) DF: 0
GIS indicatorsWater stress (IWS)
BStd. errorTSign.
I A T S 0.3270.0042.1020.000 *
I U G S 0.2920.0101.4340.000 *
I M D A 0.2730.0121.8110.000 *
Akaike’s information criterion (AIC): 22,061.2
Multiple R-squared: 0.24
Adjusted R-squared: 0.23
F-statistic: 150.62 Prob (>F) (3,3) degrees of freedom: 0
* Significant at 0.01 level.
Tablas de Daimiel National Park
GIS indicatorsFlooded area (IFA)Life of vegetation (ILV)
BStd. ErrortSign.BStd. ErrortSign.
I A T S 0.1660.0072.6230.000 *−0.4360.0130.2270.000 *
I U G S 0.1070.0056.2430.000 *−0.3150.009−2.9240.000 *
I M D A 0.1220.0064.7140.000 *−0.1790.006−5.1320.000 *
Akaike’s information criterion (AIC): 23,116.7AIC: 23,173.2
Multiple R-squared: 0.43Multiple R-squared: 0.40
Adjusted R-squared: 0.43Adjusted R-squared: 0.40
F-statistic: 130.28 Prob (>F) (3,3) degrees of freedom: 0F-statistic: 161.12 Prob (>F) (3,3) DF: 0
GIS indicatorsWater stress (IWS)
BStd. errortSign.
I A T S 0.5290.0342.1090.000 *
I U G S 0.3820.0101.9760.000 *
I M D A 0.2090.0123.8100.000 *
Akaike’s information criterion (AIC): 22,038.0
Multiple R-squared: 0.33
Adjusted R-squared: 0.33
F-statistic: 159.67 Prob (>F) (3,3) degrees of freedom: 0
* Significant at 0.01 level.
Albufera of Valencia Regional Park
GIS indicatorsFlooded area (IFA)Life of vegetation (ILV)
BStd. ErrortSign.BStd. ErrortSign.
I A T S 0.0080.0035.6850.000 *−0.0360.003−4.0200.000 *
I U G S 0.0030.0013.2870.000 *−0.0150.009−2.9310.000 *
I M D A 0.0340.0092.7120.000 *−0.1190.010−1.1080.000 *
Akaike’s information criterion (AIC): 25,325.7AIC: 23,762.1
Multiple R-squared: 0.40Multiple R-squared: 0.36
Adjusted R-squared: 0.39Adjusted R-squared: 0.36
>F-statistic: 93.78 Prob (>F) (3,3) degrees of freedom: 0F-statistic: 110.03 Prob (>F) (3,3) DF: 0
GIS indicatorsWater stress (IWS)
BStd. errortSign.
I A T S 0.0170.0041.3280.000 *
I U G S 0.0120.0102.4300.000 *
I M D A 0.0980.0131.9270.000 *
Akaike’s information criterion (AIC): 24,243.5
Multiple R-squared: 0.34
Adjusted R-squared: 0.34
F-statistic: 101.24 Prob (>F) (3,3) degrees of freedom: 0
* Significant at 0.01 level.
Publisher’s Note: MDPI stays neutral with regard to jurisdictional claims in published maps and institutional affiliations.