Abstract
Pedestrian Navigation Applications (PNAs) provide assistance in terms of self-localization, space recognition, and turn-by-turn navigation. The use, motivations and perceptions associated with these applications have been under investigated due to users being insufficiently involved in their design and development. This paper analyses the extent to which PNAs are used for assisting people to walk, the frequencies and reasons of using these applications, the perceptions about them, and the barriers preventing them from being used. The study is supported by a questionnaire (N = 1438) that was administered in Bologna (Italy) and Porto (Portugal). Results indicated that 42% of the respondents use PNAs mainly on an occasional basis to find locations and the shortest routes. Google Maps was the preferred navigation service. Statistical tests showed that PNAs were more likely to be used by younger adults and students. The lack of need was the main reason for not using these apps, due to the good spatial knowledge of the cities or the non-use of the pedestrian mode for regular trips. Respondents would like to have apps that are more accurate, usable, and adjusted to pedestrian navigation. The findings described in this paper could be helpful for future designs of PNAs, especially to match pedestrian needs more effectively and to enhance the role of these apps in promoting healthier and sustainable lifestyles.
1. Introduction
Walking is the oldest and simplest form of human mobility and people walk for many reasons. Regardless of the type of trip, such as commuting, going to school, for shopping, or to catch a bus, walking is often the first and last mode used.
Besides being an enjoyable and natural activity, walking is a sustainable and healthy mode of transport. Walking reduces the negative environmental impact of motorized vehicles in terms of CO2, air pollutants, noise, and the depletion of the earth’s non-renewable resources [1]. Walking is also an active mode of transport and a way of doing physical activity that helps to prevent various physiological and mental diseases associated with sedentary lifestyles, such as obesity, diabetes and depression [2,3]. Although the health benefits of sufficient physical activity are well known, just under one third of adults in the European Union declared they were physically active [4].
Characteristics of the urban environment influence the overall experience of walking in terms of comfort, safety, and satisfaction. The extent to which the built environment is pedestrian-friendly and enables walking is broadly defined as “walkability” [5]. Walkability is often evaluated by measuring specific built environment attributes, such as the diversity and density of land use and characteristics of pedestrian facilities [6]. Enhancing these attributes through proper planning and design solutions leads to improving walkability.
Spatial knowledge, which corresponds to a mental representation of space, is also important for pedestrian travel [7]. Spatial knowledge can be acquired by repeated travel experiences, e.g., living in a city for a long time or visiting a place many times, as well as by using signs, maps, landmarks, or other external orientation sources. Limited spatial knowledge and walking in unfamiliar streets has been associated to specific problems, especially the anxiety of wandering into unsafe areas and being lost [8,9]. Understanding space and making travel choices depends, to a large extent, on using mental maps. Thus, both walkability and spatial cognition influence people’s willingness to walk, but these two topics have been scarcely connected in the literature [10].
With the recent advancements in Information and Communication Technology (ICT), a growing number of mobile applications become available to help people stay physically active and walk [2]. This includes various types of pedestrian navigation apps (PNAs). PNAs hereafter also designated as “apps” are usually supported with a Global Positioning System (GPS) to obtain positional information data to localize and guide pedestrians [11]. These apps can be used by pedestrians for walking from one place to another without becoming lost [7]. They can also be used for guiding people with cognitive limitations. They may also provide information about the surrounding environment, the various modes of transport available and statistical data about the walk, such as the distance walked, time spent walking, among others.
Using ICT in transportation has been widely analyzed [12,13]. However, studies analyzing smartphone apps and travel behavior are still limited [12,14] and the impact of mobility apps on walking is considered an evolving research topic [14,15]. The literature has focused on the features and contents of mobile apps, but critical factors that lead to using apps and to individual behaviors associated with their use need to be fully understood [2]. The demand of navigation apps is growing [16,17], but there is evidence that some of these apps are not very well suited for pedestrians, partially due to the actual users not being sufficiently involved in their design and development process [18]. Within the research field of pedestrian navigation aids, the impact of individual differences has not yet been systematically studied and the needs of people in navigation have rarely been researched [19]. For example, the effects of variables, such as gender and age, have been omitted even if these factors are known to influence navigational use and skills [20]. Furthermore, little work has been done on how navigation aids influence walkability [10] and very little is known about the role that pedestrian navigation systems have on navigation performance and spatial cognition [21].
To enrich the knowledge in this specific research field, this paper provides additional evidence about the extent to which PNAs are used for walking, about how people evaluated and perceived these apps, as well as about the barriers preventing their use. To the best of the authors’ knowledge, this is the first study examining the most critical features that convince people to use PNAs and their correlation with the decision to walk. The results of this study are based on a questionnaire (N = 1438) administered in Bologna and Porto within the context of the Smart Pedestrian Net (SPN) research project. The described findings can influence future designs of PNAs to match pedestrian needs more effectively and to enhance the role of these apps in promoting walking.
This paper is organized as follows. The next section presents a theoretical background focused on key aspects linked to pedestrian navigation. Then, Section 3 describes the materials and method used in this study. The results are presented in Section 4 and discussed in Section 5. Finally, the last section summarizes the main conclusions of this study.
2. Background
Every day we carry out navigation tasks to move from one location to another. The concept of navigation involves two distinct but complementary processes: wayfinding and locomotion [22,23]. Wayfinding refers to the cognitive dimension of navigation, bringing into play planning and decision-making processes associated with spatial cognitive abilities [24]. These mental capabilities ensure actions such as choosing a route, estimating distances, and maintaining a sense of orientation while moving [25]. In turn, locomotion is the ability that enables people to move through space to reach a specific destination [22]. Walking is the basic form of human locomotion.
In successful navigation, people can orientate themselves in space, such as in the case of routine trips in familiar environments. In this case, navigation is relatively automatic and easy. In contrast, when travelling through unfamiliar areas, including in bounded environments (indoor), in open environments (outdoor), or both, successful navigation is much more complex. In this case, specific aids could be necessary, such as asking for the assistance of other people [22], using paper maps [26], web mapping services and navigation systems installed in mobile devices, such as tablets and smartphones [22,24,25,27]. These navigation systems are often available as geo-mobile applications, which provide a multitude of information across an array of travel modes [15,18,28].
PNAs are geo-mobile tools for pedestrian orientation and wayfinding, mainly for outdoor environments. This is because GPS signals are weaker indoors as buildings attenuate the signal strength [29]. As a result, alternative approaches have been developed for addressing indoor navigation, such as wireless indoor positioning techniques and systems [29,30]. In turn, the accuracy of GPS signals outdoors allows the development of various mobile navigation tools typically supported with cartographic interfaces, which present the user with position and orientation details through visual modalities, usually multilayer maps. Generally, the shortest pedestrian route is overlaid on the map and text-based/audio turn-by-turn instructions are provided for guiding pedestrians [31,32]. These apps may also provide complementary data, such as the location of sight-seeing attractions, monuments, restaurants, among others.
PNAs were designed analogously to car navigation systems [16]. However, driving and walking are quite different experiences and drivers and pedestrians have different needs. Inversely to cars, pedestrians are not constrained by street network lanes and can move freely in any direction [16,20]. In addition, pedestrians move at slower speeds, and require map information on larger scales and in higher levels of detail [18]. Whereas car-based navigation apps tend to focus on distances and street names/numbers, pedestrians generally prefer landmarks to navigate [17]. For these reasons, it is recognized that many apps do not entirely satisfy pedestrian needs due to an insufficient incorporation of built environment information and landmarks in the navigation [33]. For example, PNAs usually do not use the sidewalk network and the quality of the routes on the routing [34]. However, such variables define the walkability of an area and are important attributes influencing the decision to walk and the selection of a specific route.
To solve or at least mitigate these problems, various efforts have been made to make PNAs more pedestrian-friendly, especially by adding built environment and natural variables into the routing process. This includes weather variables and pedestrian traffic [35], landmark locations [17,36], top-bounded environment paths for providing protection to pedestrians against adverse weather conditions [32], and noise, greenery, water fountain areas, and architectural design data [37]. Some prototypes and apps have also been developed such as: pathNav, a pedestrian navigation web app that utilizes smart data and a connected network of sidewalk and pathway data [34]; the Landmark Identification Service and the OpenRouteService, which includes landmarks from OpenStreetMap in instructions [17]; Walkstreets (http://walkstreets.urbica.co, accessed on 20 December 2020) that provides users with the possibility of selecting the greenest, most quiet, or cleanest air route; and the Smart Pedestrian Assistant (https://asidees.org/index.php?id=smart-pedestrian-assistant, accessed on 20 December 2020), which provides optional pedestrian routes and allows users to interact with city managers [38].
In addition to the lack of built environment and landmark variables in the routing process, navigating from apps installed on smartphones could be difficult due to the small size of the device and to the generally narrow area mapped around the user [27]. For these reasons, maps and text can be difficult to read and navigation often requires a “neck-down” interaction to pan and zoom the map [31]. Consequently, many pedestrians do not take their eyes off their smartphones while walking, which can cause misunderstandings of the space, reduces the user’s spontaneous ability to gain orientation in an unfamiliar environment [24], and can create discomfort and safety risks to pedestrians, such as collisions with obstacles and other pedestrians, accidents with cars, and falls [21,39].
To mitigate these problems, different prototypes have been developed to improve the overall experience of pedestrian navigation. These include audio and feedback technologies, such as haptics to guide pedestrians without needing to look at the screen [31], sensors to notify the pedestrians about the nearby presence of obstacles [40] and Augmented Reality and 3D visualization to provide a better recognition of the surrounding urban environment [41,42]. Other authors have attempted to improve the usability of pedestrian navigation systems by adopting a user-centered design approach to include the user’s requirements in these apps [18].
Individual variables, such as gender, age, income, and being tech-savvy have also been reported for their influence in using travel and navigation apps [16]. While the influence of gender in spatial cognition has been analyzed for a long time [43], the influence of gender in using travel and navigation apps has been much less studied. Recent studies showed inconclusive results, suggesting that both males and females were likely to use these tools [44,45]. However, app usage has different motivations and perceptions. A recent study carried out by Blasko et al. [46] showed that both men and women found mobile maps useful, but women were more likely to feel that using Google Maps increased safety, while men found paper maps more useful than women. In the case of the navigation tool Waze, Silber-Varod et al. [47] reported some different perceptions among men and women. They highlighted that women tended to value the psychological and financial benefits of the system more than men, while men reported more motivation for using the system because of its innovative aspects. Liao and Dong [45] also showed that males using 3D maps paid more attention to landmarks and demonstrated better orientation than females. In terms of age, it is recognized that smartphone users are mostly young/middle-aged groups and well-educated individuals [12]. In general, the elderly population has difficulties in using smartphones due to many reasons—such as a lack of experience and interest in mobile computing technologies, financial limitations, vision impairments, among others [48]. There is also evidence that the elderly differ from young people in app usage behavior: they use fewer apps, take longer to complete tasks and use their phones earlier in the day [49]. In terms of mobile travel apps, recent research suggested that these apps are more likely to be used by young and tech-savvy individuals [13,14,15]. Some studies also suggest that transportation apps were more likely to be used by middle to upper income individuals [50].
3. Materials and Method
In this section, the methodology used to collect and analyze data about the use and non-use of PNAs in Bologna and Porto is presented. Data is based on a questionnaire administered in these two cities, which were selected for implementing the SPN research project. The goal of SPN was to promote walkability as one of the critical dimensions of smart and sustainable mobility in European cities.
3.1. Case Studies
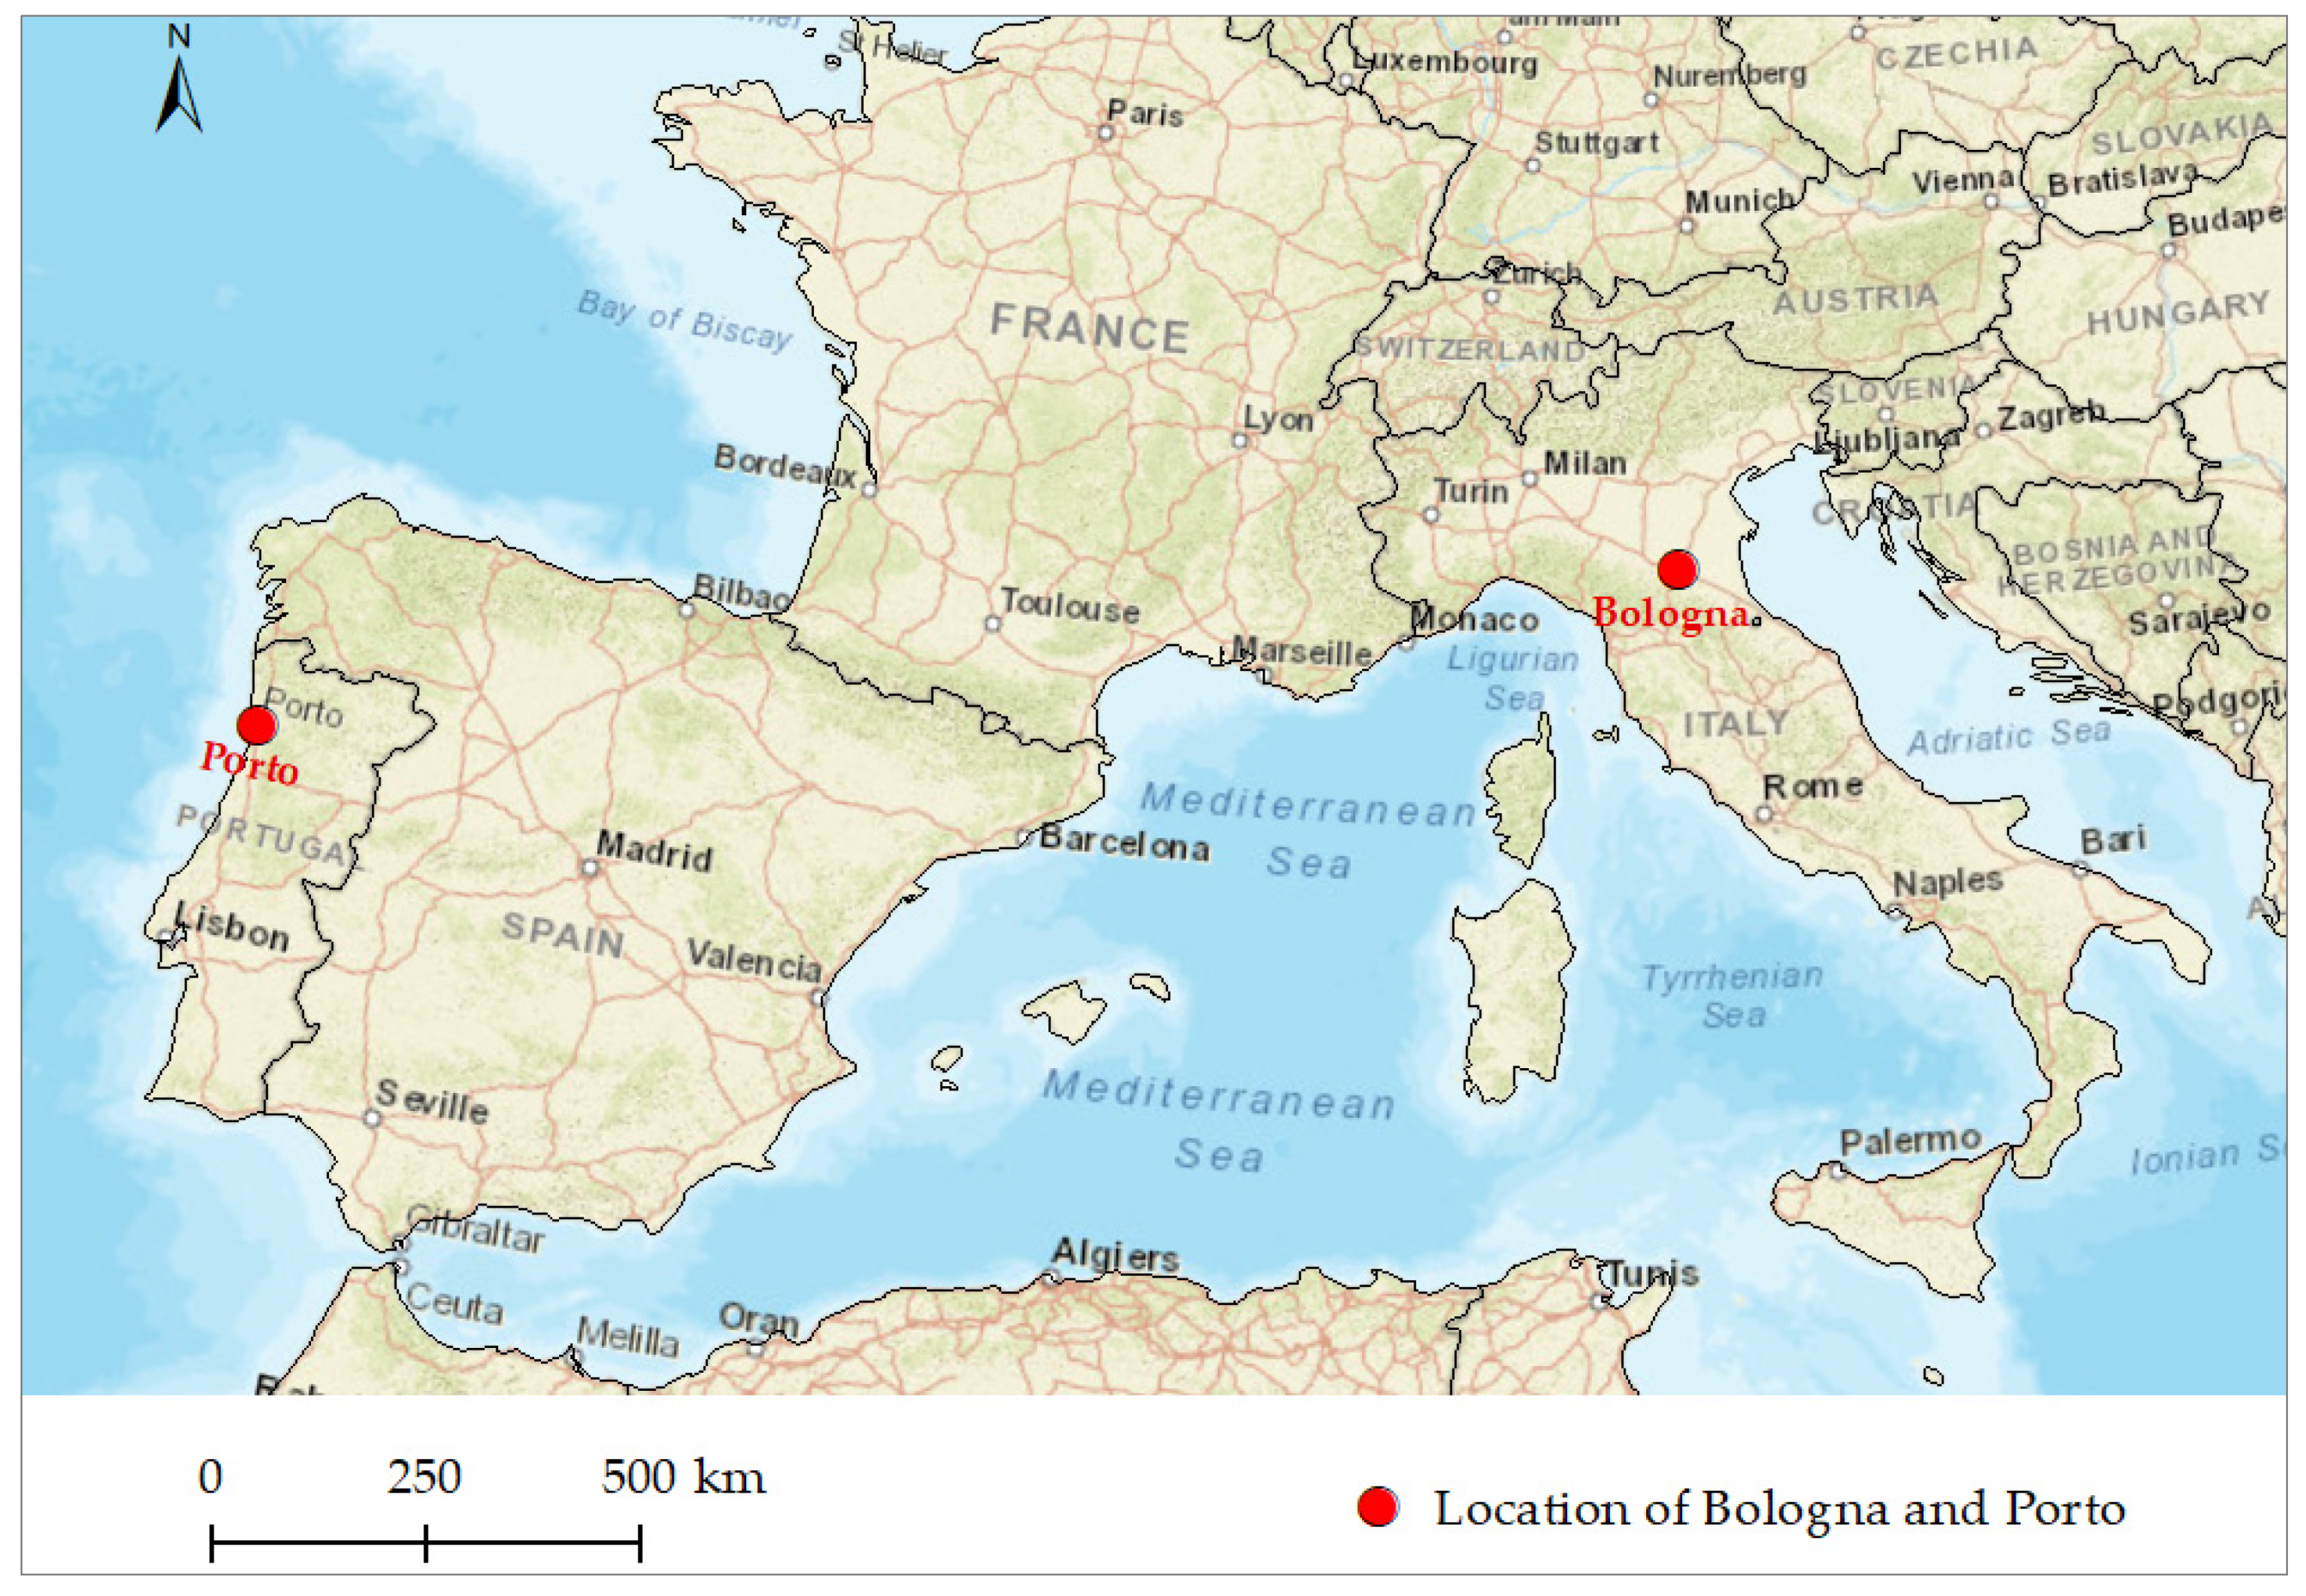
The two cities where the use of PNAs was analyzed are Bologna and Porto (Figure 1). Bologna is the capital of the Emilia-Romagna region in Italy and has about 390,000 inhabitants. Porto is the biggest city located in the North of Portugal and has a population of about 250,000 inhabitants. Both were walled cities and are recognized by their rich history and culture. Bologna is particularly famous for its monuments and extensive porticoes and arcades that cover most of the city center, while the historical center of Porto is classified as a World Heritage Site. Therefore, the two cities are important sites visited by thousands of tourists every year. They also attract many users that commute to the cities mainly for working and studying.
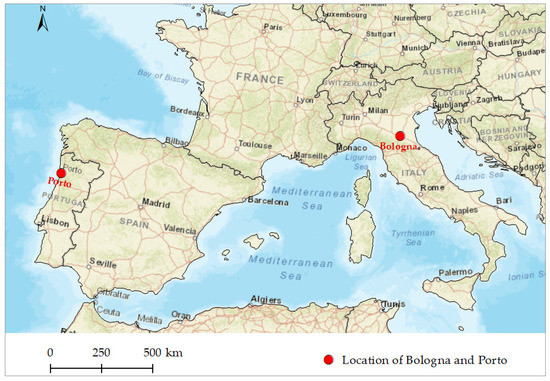
Figure 1.
Location of Bologna and Porto in Italy and Portugal, respectively. Source: ArcGIS World Street Map.
Both cities are engaged in promoting sustainable mobility policies to limit the negative effects of motorized traffic, especially in the city centers. This includes policies that have led to an increase in using electric mobility, public transport, alternative vehicles such as scooters, and cycling and walking. Regarding walking, both cities are improving walkability in terms of pedestrian facilities, such as the number of pedestrian-only streets and traffic safety. Smart mobility technology has been used to change habits towards more sustainable modes of transport in both cities. This includes some mobile apps, such as VeloBÒ that can be used to find cycle lanes, racks, and bike sharing hotspots in Bologna; and the apps Moovit and Move-Me to encourage people to travel by public transport in Bologna and Porto, respectively.
3.2. Data Collection
Data about the use and perceptions of PNAs was collected by designing and distributing an online questionnaire implemented through Google Forms. As highlighted by Frehlich et al. [51], population studies using Internet-administered questionnaires are becoming more frequent due to the continued growth of Internet access. In addition, online questionnaires have several advantages compared to face-to-face questionnaires, such as being inexpensive and fast, allowing easy control over the sequence of questions and skipping questions, monitoring the level of answers, among others.
The first step of the work consisted of developing the questionnaire according to the research goals of SPN. The questionnaire was previously structured and consisted of a mix of single choice, multiple choice, ranking, and open-ended types of questions. The inclusion of open-ended questions was provided to allow respondents to answer in an open text format so that they would answer based on their feelings and understanding. The final version contained 20 questions divided into three main parts. The first part included personal information related to gender, age, education level, type of occupation and type of pedestrian (residents, commuters and tourists). The second part was addressed to participants that use PNAs. Participants were asked to report: (i) if they used PNAs for walking and which app they had installed at the time of response; (ii) the frequency of using these apps; (iii) the reasons for using PNAs to walk; (iv) how they evaluate the installed app by using a five-point Likert scale, ranging from 1 (“very bad”) to 5 (“very good”); and (v) what they like and dislike in their apps. The third part contained questions specifically addressed to participants that never use PNAs to walk. Non-users were asked to explain: (i) the reasons for not using PNAs; (ii) if they were available to use a PNA in the future; and (iii) the respective reasons. Finally, a pilot test was run to check the meaning of the various questions and the overall organization of the questionnaire. As a result, some changes were carried out to improve the reliability and sensitivity of the questionnaire.
The second step of the work consisted of estimating the minimum sample size necessary for this study. The method described by Israel [52] was adopted to define the sample size. This method (Equation (1)) takes into consideration the population size, a confidence level, and a level of precision:
In Equation (1), n is the sample size, N is the population size, and e is the margin error. The parameters adopted to define the sample were: (i) the number of inhabitants in each city in 2019 (disaggregated commuting and tourism data at the city level was not available); (ii) a 95% confidence level; and (iii) a level of precision of 5%. In 2019, as the population living in Bologna was 301,984 [53] and in Porto was 216,606 [54], the required sample size was 384 individuals in Bologna and 383 in Porto.
The third step of the work consisted of distributing and conducting the questionnaire. The questionnaire was administered through the Internet and the target population, residents, commuters and tourists in Bologna and Porto, were approached through social media, the SPN website and databases from the municipalities and from the universities of Bologna and Porto. In Bologna, the questionnaire was distributed in Italian from May to July 2019; in Porto, the questionnaire was distributed in Portuguese from September to November 2019.
3.3. Data Analysis
After making basic operations of data editing, correction, and compilation, the collected data were analyzed by using various descriptive and statistical analysis to extract key success features and shortcomings about the use and non-use of PNAs. Firstly, conventional descriptive statistics, such as averages and percentages, were used to describe the sample and main findings on the use and non-use of PNAs.
Then, a complementary analysis was performed by using the Statistical Package for the Social Sciences (SPSS) to find inferential statistic associations between the variables. In particular, the aim was to test relationships between groups and differences between individual and geographic variables in terms of app use, feature preferences, app rating, and reasons for using and not using the apps. Relationships between the variables were confirmed through Chi-square tests, Pearson correlations, and T-tests. These statistical tests have been widely used in transport studies to compare variables and groups [41,55,56]. Chi-square tests were conducted to test associations between individual and geographic variables and the use of PNAs, the reasons for using PNAs, as well as to test associations between the individual and geographic variables and the barriers for not using PNAs. Individual variables include aspects such as gender, age, education level and occupation of participants, while the geographic variables are related to the two cities involved in this study. The type of Chi-square test used for the analysis varied depending on the cross tabulation and included one of the following: (i) Pearson Chi-square; (ii) Likelihood-ratio Chi-square; (iii) Fisher’s exact test; and (iv) Yates’ corrected Chi-square (continuity correction). Accordingly, the appropriate Chi-square test was automatically selected by the SPSS algorithm. For 2 × 2 tables, Fisher’s exact test was computed when a table that does not result from missing rows or columns in a larger table has a cell with an expected frequency of less than 5. Yates’ corrected chi-square is computed for all other 2 × 2 tables. For tables with any number of rows and columns, SPSS calculated the Pearson Chi-square and the likelihood-ratio Chi-square. When both table variables are quantitative, Chi-square yields the linear-by-linear association test [57]. Furthermore, T-tests and Pearson correlations were computed to test the association between specific individual variables and app ratings. The conventional level of p ≤ 0.05 was taken to represent statistical significance [55,56,58]. The analyzed data were finally used to produce charts, tables, and other supports that helped us to understand the extent to which PNAs are used in Bologna and Porto to assist people to walk.
4. Results
This section presents the results of the different analyses performed. We start by describing the sample to give an overview of the participants who took part in this study. Then, the descriptive statistics of the analysis are presented. Finally, the analysis of the correlations between the different variables is described.
4.1. General Description of the Sample
As shown in Table 1, the sample consisted of 1438 respondents. From these, 865 were respondents from Bologna, while 573 were from Porto. Respondents included slightly more females (59%), most of them were adults aged between 45–65 years old (48%), but the proportion of young adults (25–45 years old) was also high (35%). The sample mostly comprised residents (57%), people that had an undergraduate degree (61%) and those who were employed full-time (74%) or studying (25%).

Table 1.
Descriptive statistics of the sample.
As can be concluded from Table 1, the questionnaire sample’s sociodemographic characteristics do not differ much from the population living in the two cities in some variables, such as gender and city of origin. However, there are some deviations in other variables. More specifically, elderly people (≥65 years old) and consequently retired people, are underrepresented in our sample, while adults, employed people, and graduates are overrepresented. These deviations are mostly justified by the difficulty in targeting specific groups with an online questionnaire. Online samples are regarded as biased, especially in terms of age and education [59], because aged people with low levels of education and less tech-savvy skills are more difficult to target with online questionnaires.
4.2. Use and Frequencies of Using Pedestrian Navigation Apps
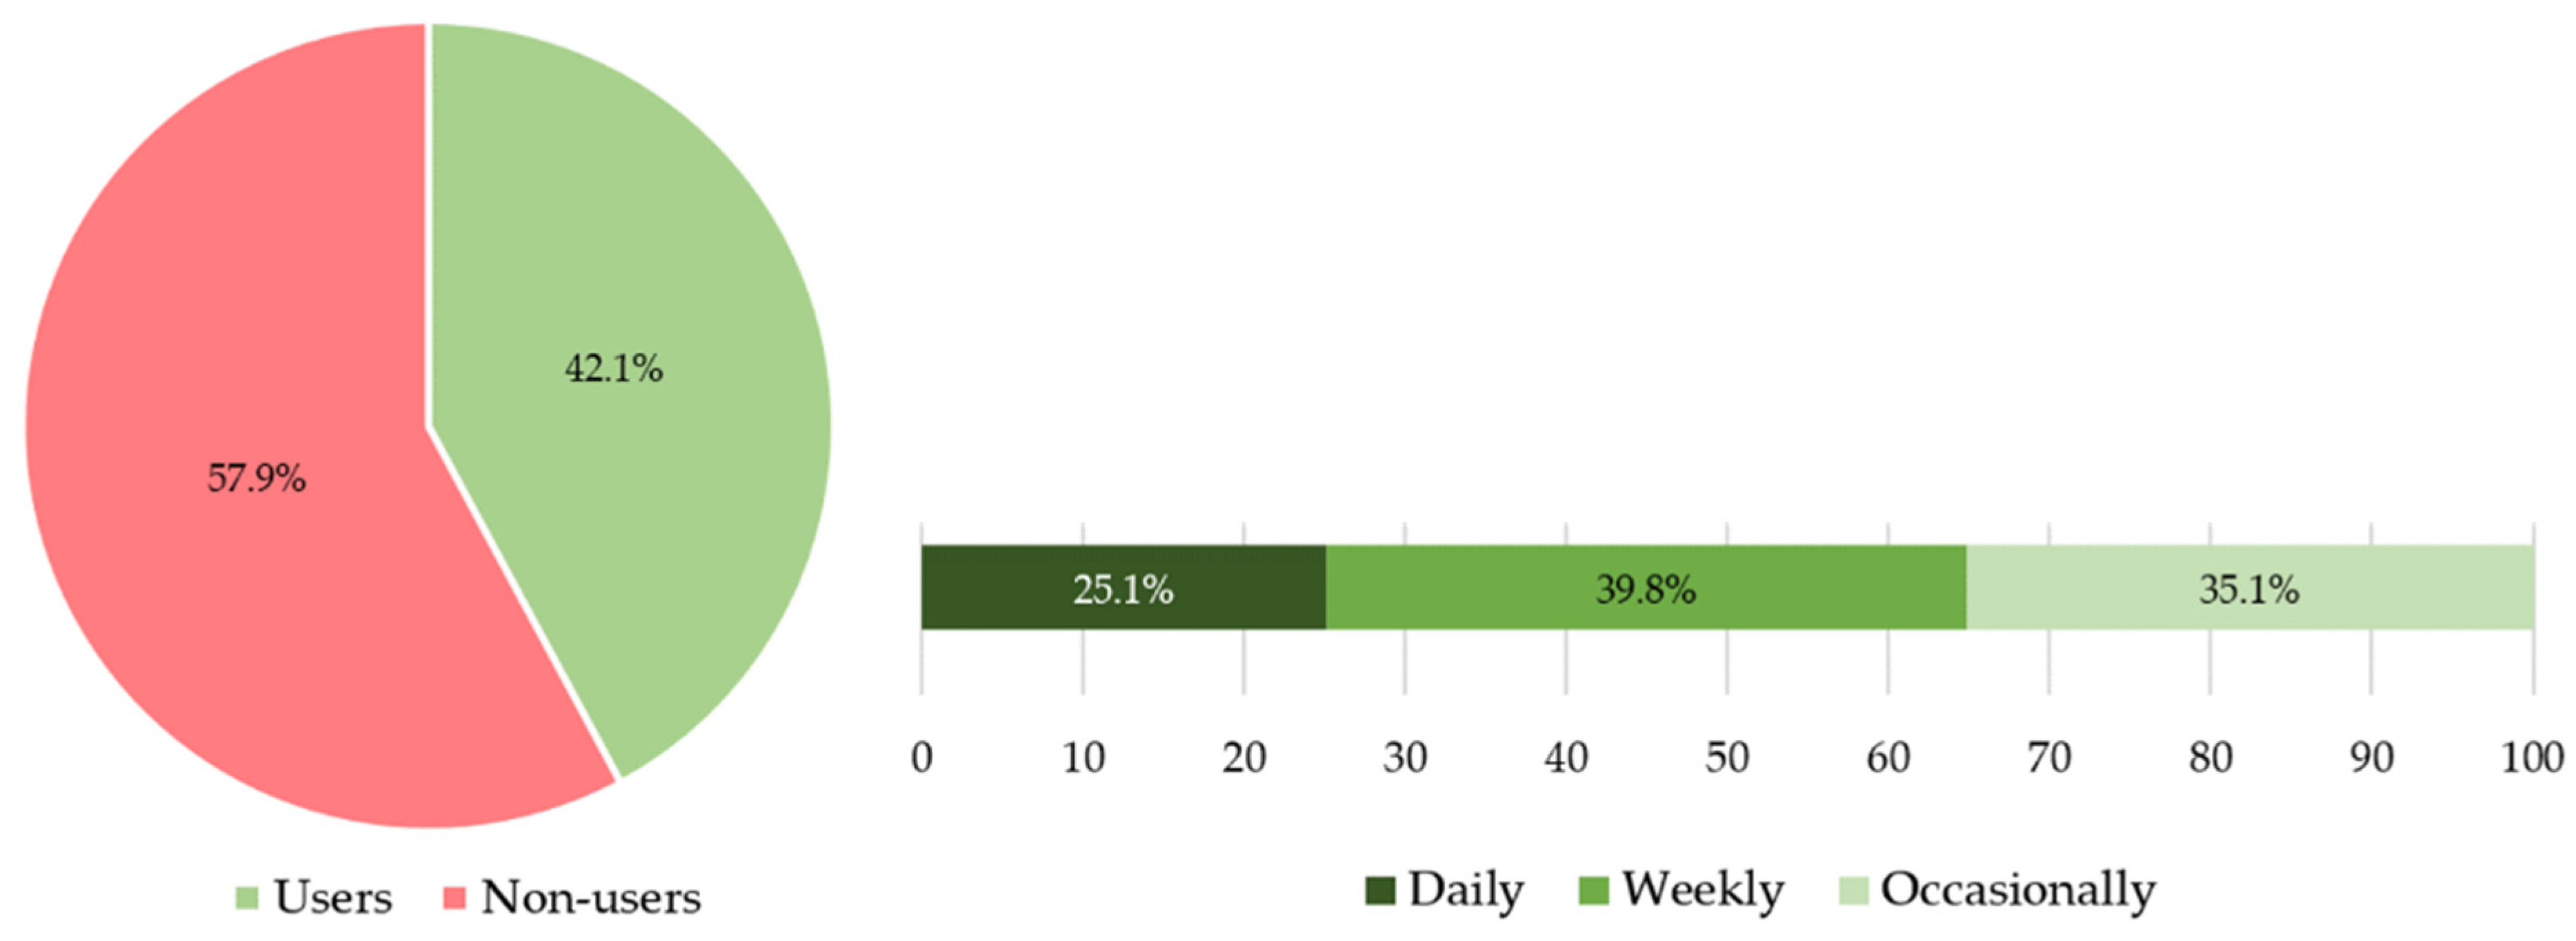
One of the main goals of this study was to understand the extent to which PNAs are used, the type of app used, as well as the frequency of using these apps for walking purposes. Therefore, participants were asked to report if they use any type of navigation app for walking and how frequently they use this PNA in their lives. Results indicated that besides the very high use of smartphones in general (92%), the use of PNAs was much lower. As shown in Figure 2, the percentage of respondents using this type of app was 42%. Users of these apps were mainly young people aged less than 25 years old, young adults (25–44 years old), and students (Table 2). The percentage of users was also higher among tourists and commuters than among residents and was higher among undergraduates than graduates. Geographically, results indicated a higher proportion of users in Porto than in Bologna.

Figure 2.
Users and frequencies of using pedestrian navigation apps.
Table 2.
Characteristics of the users and non-users of pedestrian navigation apps (N = 1438).
Regarding the apps used for pedestrian navigation, results indicated that people mostly used Google Maps. The service provided by Google was preferred by 95% of the respondents. The remaining reported apps providing pedestrian navigation were Apple Maps, Here WeGo, and Maps.Me.
In terms of frequencies of using these apps, as shown in Figure 2, three options were considered: daily use (at least once/day), weekly use (at least once/week), and occasional use (less than once/week). Results indicated that most of the respondents (about 40%) used PNAs weekly, while about 35% of respondents used these tools more occasionally. In turn, frequencies of daily use were the lowest (around 25%).
To find inferential statistic associations between the variables, especially to analyze whether individual and geographic factors were associated with using PNAs, a Chi-square test was performed (Table 2). The Chi-square test confirmed significant relations between age and the type of occupation and the use of PNAs. More specifically, the relation between age and app use was found to be significant, X2 (1, N = 1438) = 26.936, p < 001, confirming that young people (individuals who were less than 25 years old) and young adults (25–44 years old) were more likely to use a PNA than older individuals. The relation between occupation and app use was also found to be significant, X2 (1, N = 1438) = 36.169, p < 001, confirming that students were more likely to use a PNA than employed and other (retired and unemployed) individuals. The relation between the other variables and the app use was not significant.
4.3. Reasons for Using Pedestrian Navigation Apps
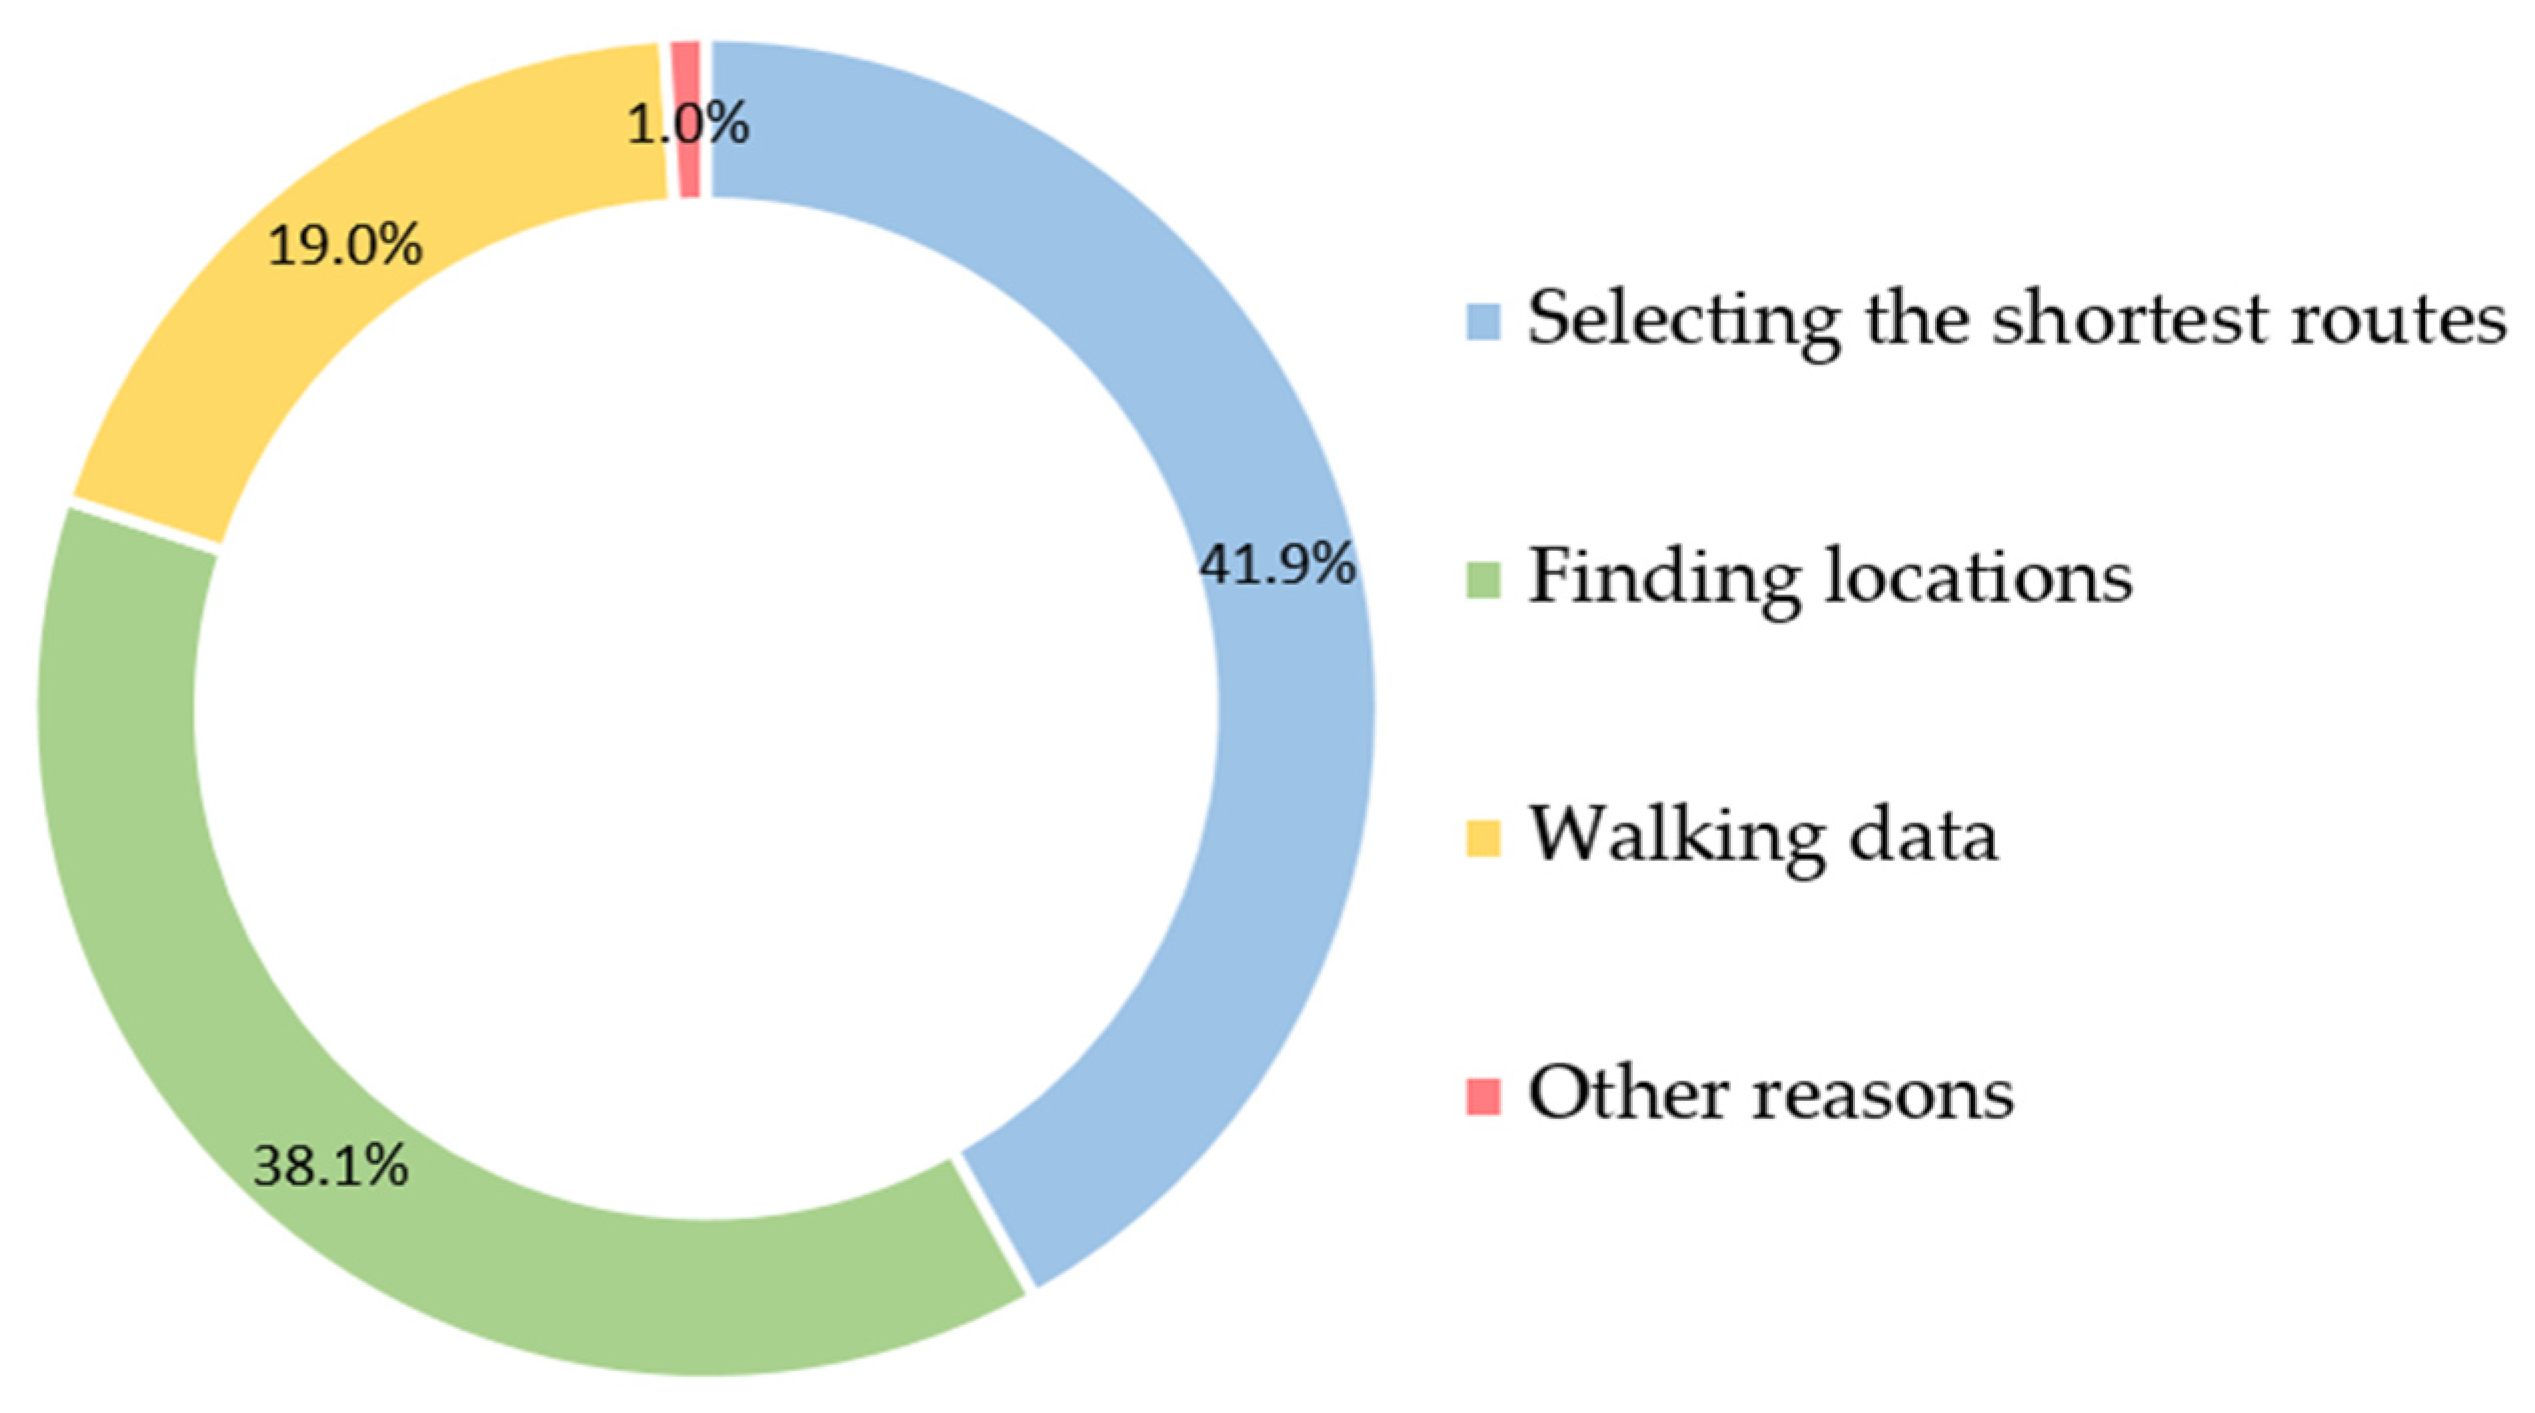
Another main goal of this study was to understand the reasons for using pedestrian navigation apps. Thus, participants who use PNAs were also invited to report the reasons for doing so. The options given were: (i) for selecting the shortest routes between two locations; (ii) for finding specific locations, such as restaurants, shops, and public facilities; and (iii) for collecting useful walking data (travel distance, travel time, optional routes, etc.). Besides these three, participants could also add and describe other reasons not listed in the questionnaire.
Results are summarized in Figure 3. For around 42% of participants, selecting the shortest routes was the main reason for using PNAs. In turn, about 38% of them used these apps for finding specific locations, while for 19% obtaining walking data was the reported reason. The other reasons are of little relevance as they were reported by only 1% of the participants.

Figure 3.
Reasons for using pedestrian navigation apps.
A Chi-square test was also performed to analyze the relation between individual and geographic variables and the reasons for using PNAs. As shown in Table 3, significant relations between gender and using PNAs for finding specific locations (X2 (1, N = 606) = 5.012, p = .025) and for obtaining walking data (X2 (1, N = 606) = 4.558, p = .032) were found. In this case, females were found more likely to use PNAs for finding locations, while males were found more likely to use PNAs for obtaining walking data. Regarding age, a significant relation was also found (X2 (1, N = 606) = 18.659, p < 001), showing that individuals aged 45–64 years old and ≥65 years old were more likely to use PNAs for obtaining walking data. Finally, significant relations were also found between the type of occupation and the use of PNAs for finding locations (X2 (1, N = 606) = 8.762, p = .012) and for obtaining walking data (X2 (1, N = 606) = 6.741, p = .034), confirming that students were more likely to use PNAs for finding locations, while employed individuals were more likely to use PNAs for obtaining walking data.
Table 3.
Reasons for using a pedestrian navigation app (N = 606).
Geographically, a significant relation was found between app use and finding locations (X2 (1, N = 606) = 31.645, p < 001), and between app use and defining the shortest routes (X2 (1, N = 606) = 25.861, p < 001). These results confirmed that in Bologna, individuals were more likely to use PNAs for finding locations, while in Porto they were more likely to be used for defining the shortest routes.
4.4. Users’ Satisfaction and Perceptions about the Pedestrian Navigation Apps
Another main goal of this study was to understand the users’ satisfaction and their perceptions about PNAs. The level of satisfaction was evaluated by asking the participants to rate the respective app on a five-point Likert scale, ranging from 1 (“very bad”) to 5 (“very good”). With an average score of 3.95, respondents made an overall good evaluation. No respondent rated the app as “very bad” and few respondents (2.3%) classified the app as “bad”. In turn, more than a half of them (55%) evaluated the app as “good”, while 25% considered the app “very good”. The overall evaluation of Google Maps (average score of 3.95), was similar to the evaluation given to the other navigation apps (average score of 4.01).
In order to investigate any relationships between the app rating and individual and geographic variables, a series of statistical tests were also carried out. Specifically, a Pearson correlation test was performed to investigate the relationship between PNA rating and age. Among the people of Bologna and Porto, age and app rating were negatively weakly correlated, r(606) = −.161, p < 001. This might be expected as with aging it might be more mentally demanding and difficult to use a PNA. Furthermore, a Pearson correlation test was also performed to investigate the relationship between PNA rating and education level. However, these two variables were not significantly correlated, r(606) = −.036, p < 371. To investigate any differences between the evaluation and gender, a T-test was also performed. No significant differences were found between men and women. More specifically, the relation between these variables was not significant, X2 (1, N = 606) = 0.32, p = .871. Women and men were found to be equally likely to rate PNAs.
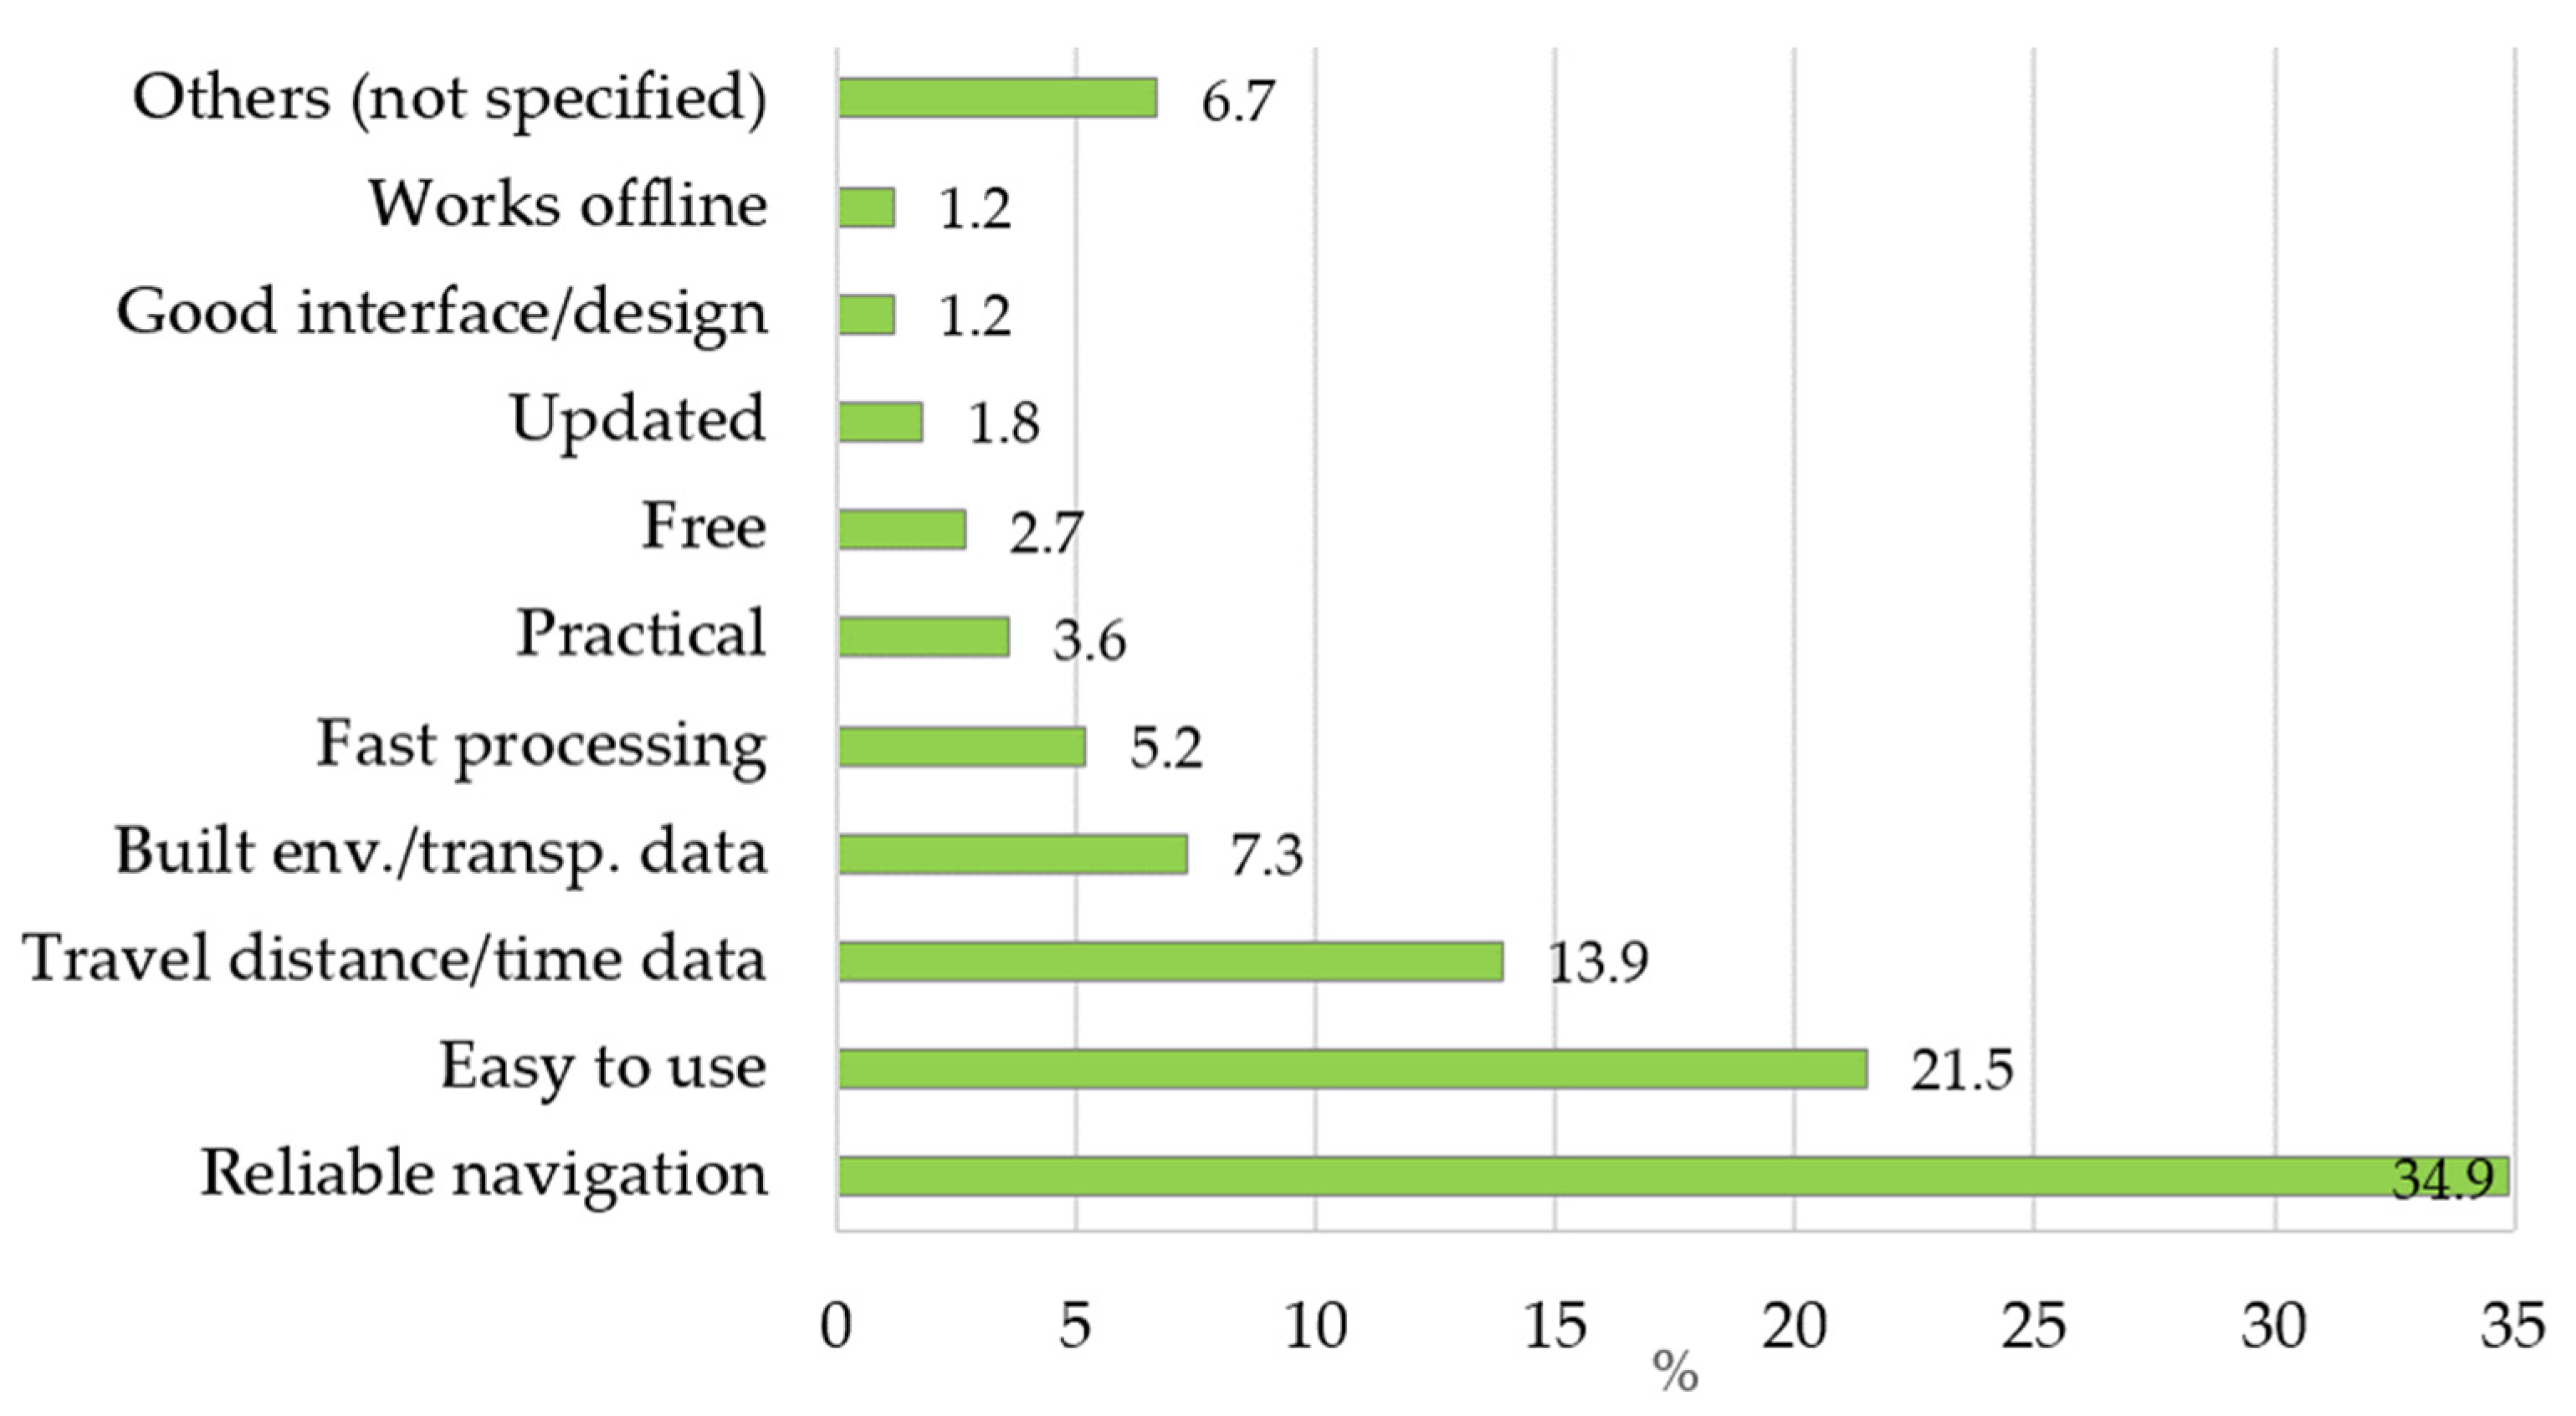
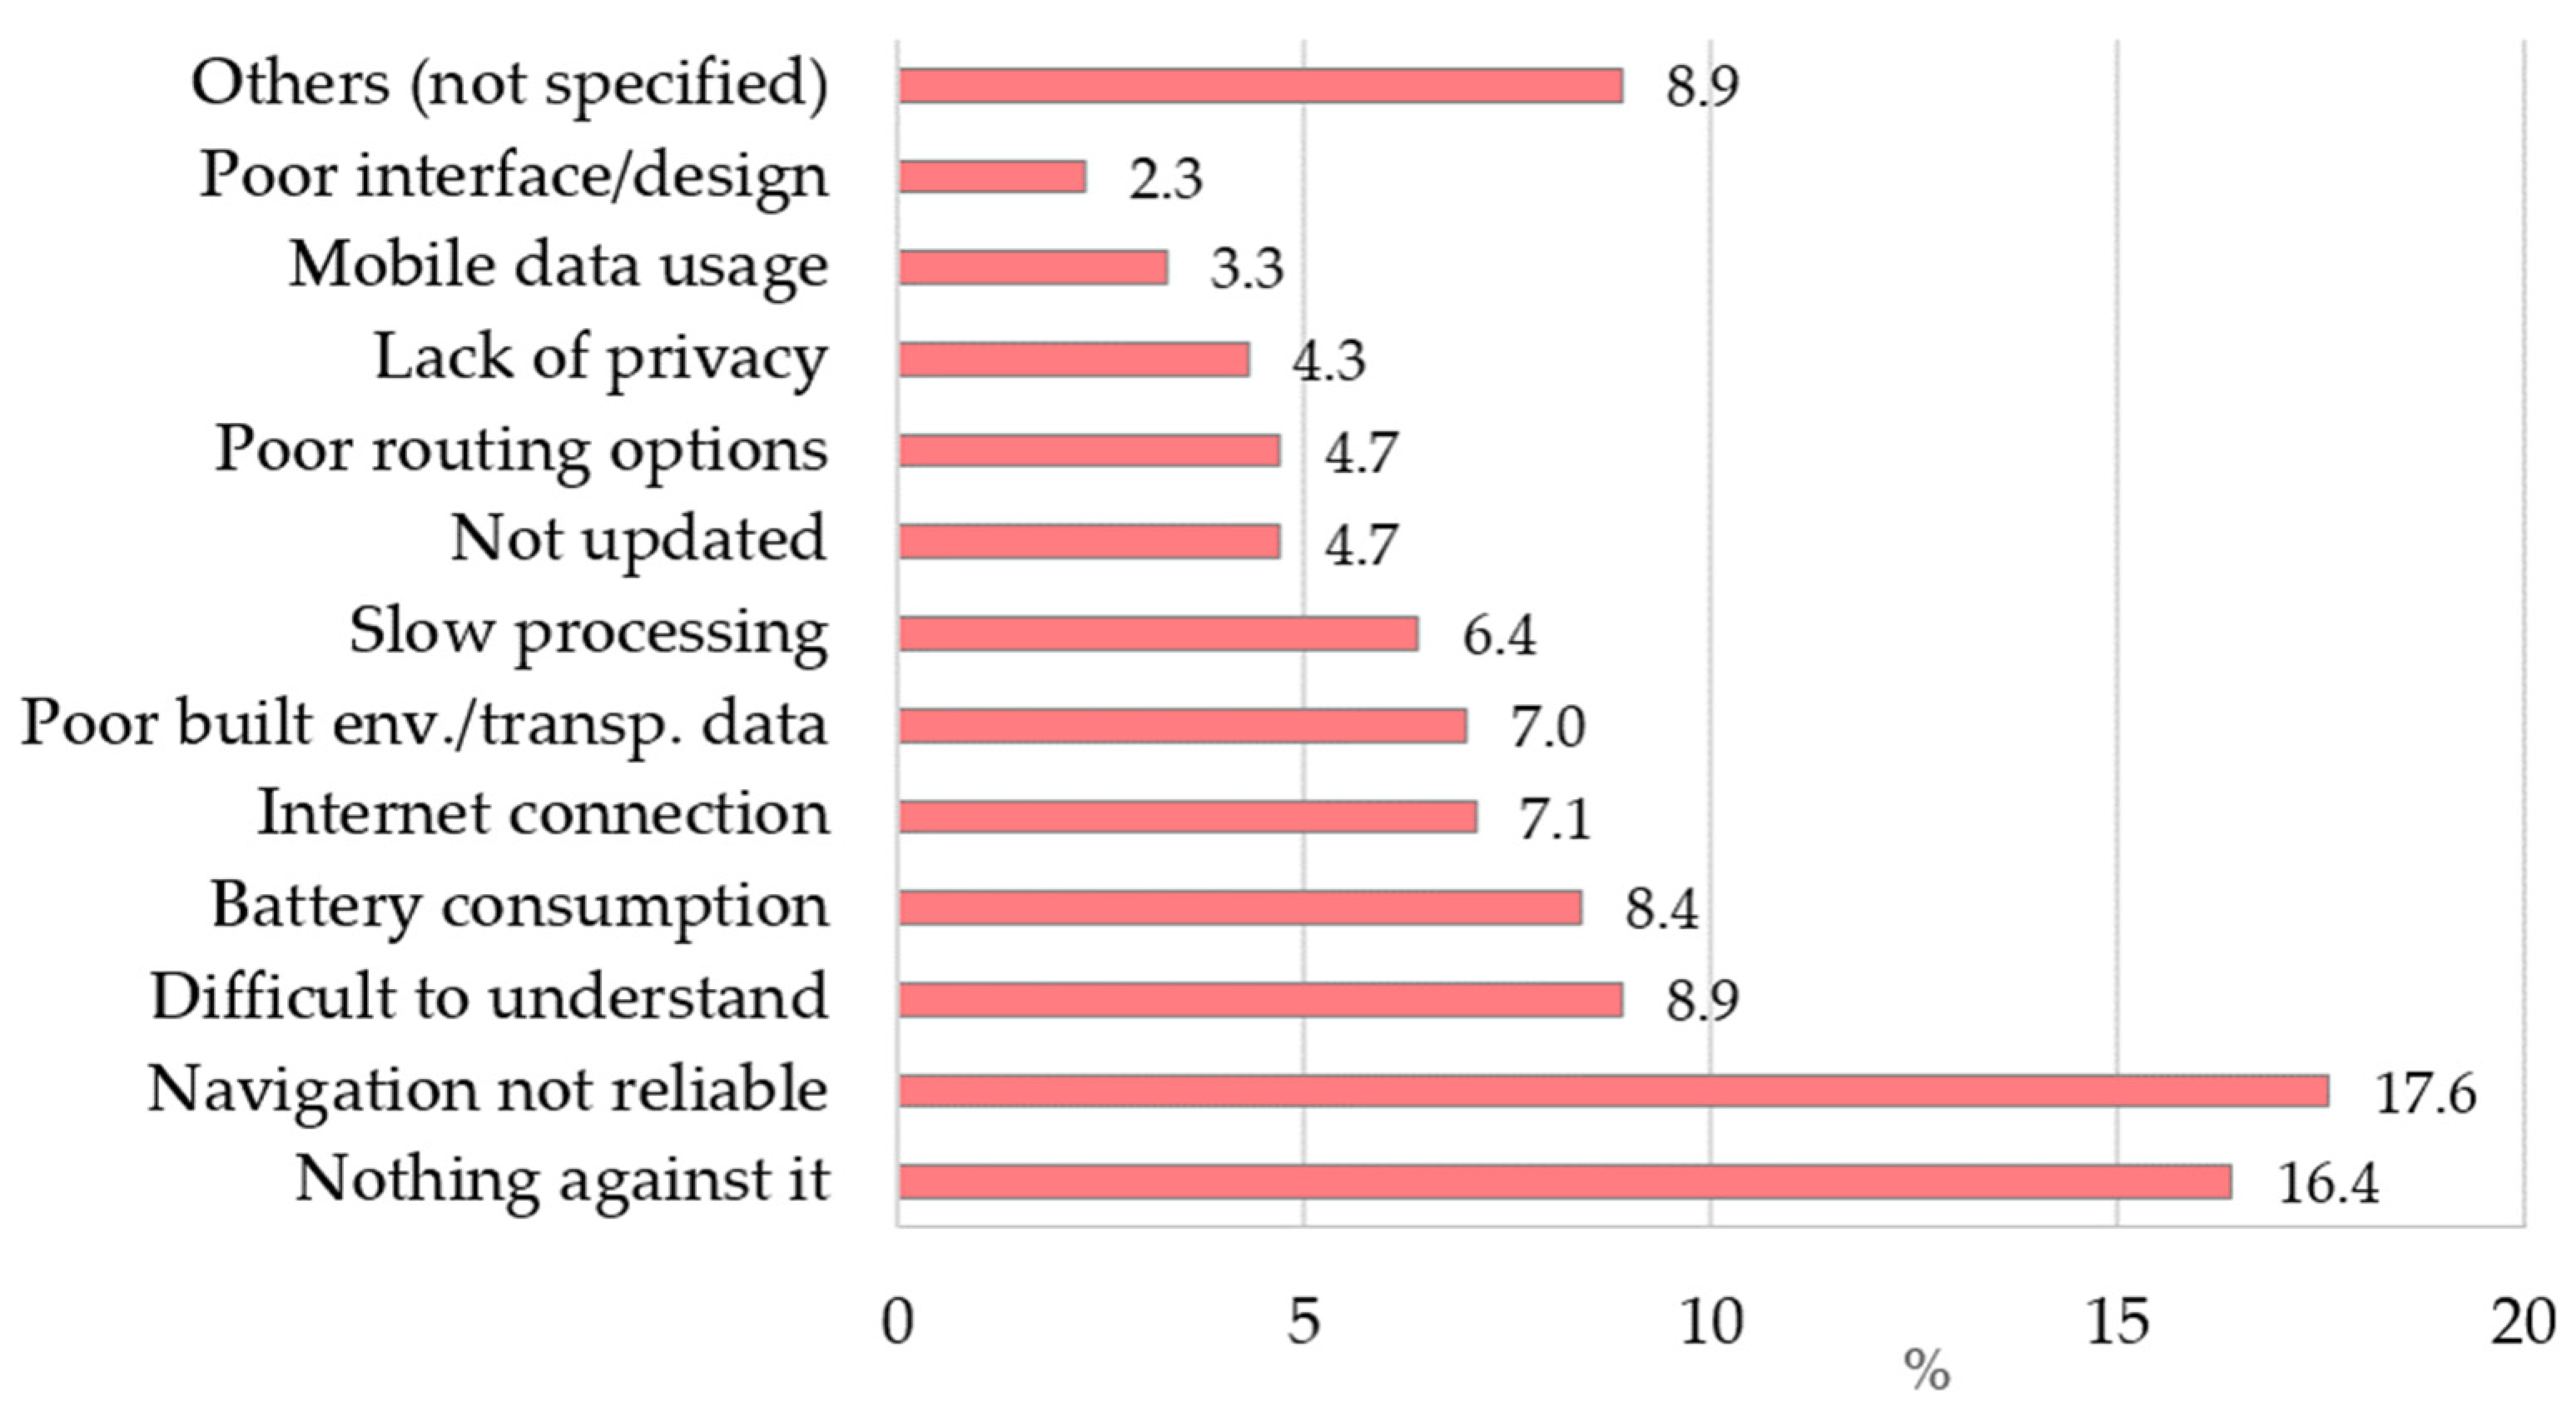
Participants were also invited to report their perceptions about the navigation app installed in their mobile devices through the two following open-ended questions: “what do you like the most in your PNA?” and “what do you like the least in your PNA?”. The results of this individual evaluation are respectively summarized in Figure 4 and Figure 5.

Figure 4.
What people like the most in their pedestrian navigation apps.
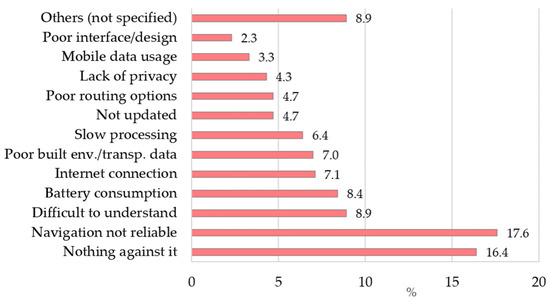
Figure 5.
What people like the least in their pedestrian navigation apps.
Regarding the aspects that people like the most (N = 330), 35% of participants pointed out that these apps provide reliable pedestrian navigation, while 22% highlighted that they are easy to use. For the first group, these apps are helpful for providing turn-by-turn guidance and for finding destinations without becoming lost or asking for help. For the second group, the apps are easy to use, which gives clues about the usability of the app, reflecting the efficiency and satisfaction of the users. The remaining aspects were much less reported. About 14% of the respondents emphasized the useful travel data provided by the app in terms of travel distance and time, which helped them to plan trips (arrival time, just walking or walking in combination with other modes, etc.). Much less (7%) valued the information provided by the apps about various public and private services (shops, restaurants, museums), and about public transport (stations, schedules) in the walking area. Other less reported positive features included fast processing, free downloads and use, updated maps, and the fact that some apps work offline.
Regarding the aspects that people liked the least (N = 285), 16% of the respondents expressed that they have nothing against it, which reinforces the overall satisfaction and positive perceptions about PNAs. Nevertheless, and as shown in Figure 5, the most reported problem, reported by around 18% of participants, was related to the lack of reliability, meaning that the apps are not entirely accurate in terms of navigation (turn-by-turn) and wayfinding (location of specific destinations). The second aspect was mentioned by about 9% of the respondents and was related to the difficulty in understanding the app instructions. More precisely, users said that when they are disoriented, they have difficulty in understanding the right direction to start walking. Approximately 8% of the participants preferred to point out the rapid battery consumption and the need to recharge devices frequently. Some apps also require an Internet connection in order to operate. This problem that may involve additional costs (mobile data usage) and coverage problems (low speed, delay, no signal) was identified by 7% of the respondents. About 7% of the respondents also expressed that the app should provide more data about the built environment and other modes of transport. In this group, some users would like to have a real pedestrian navigation tool, which provides data regarding footpaths, slopes, benches for resting, etc. Others were dissatisfied because their apps did not provide real time information about the public transport systems, especially to track vehicles and know when they will arrive at a specific stop, as well as about the cycling lanes. Other participants mentioned that the app runs slowly, especially for calculating the route. Other issues were less reported, including the fact that some apps have limited routing options, especially in terms of providing alternative routes (not only the shortest), filtering options for planning a trip (the route often starts from the current location), poor interface/graphic design, data not being updated, and privacy issues associated with smartphone location and the risk of being tracked.
4.5. Non-Users and Barriers Preventing the Use of Pedestrian Navigation Apps
Results indicated that 832 respondents (58%) do not use any PNA for walking. As shown in Table 2, non-users were more likely to be adults aged between 45–64 years old and elderly individuals aged ≥65 years old. Results also revealed that non-users were more representative in Bologna than in Porto and among residents than among commuters and tourists.
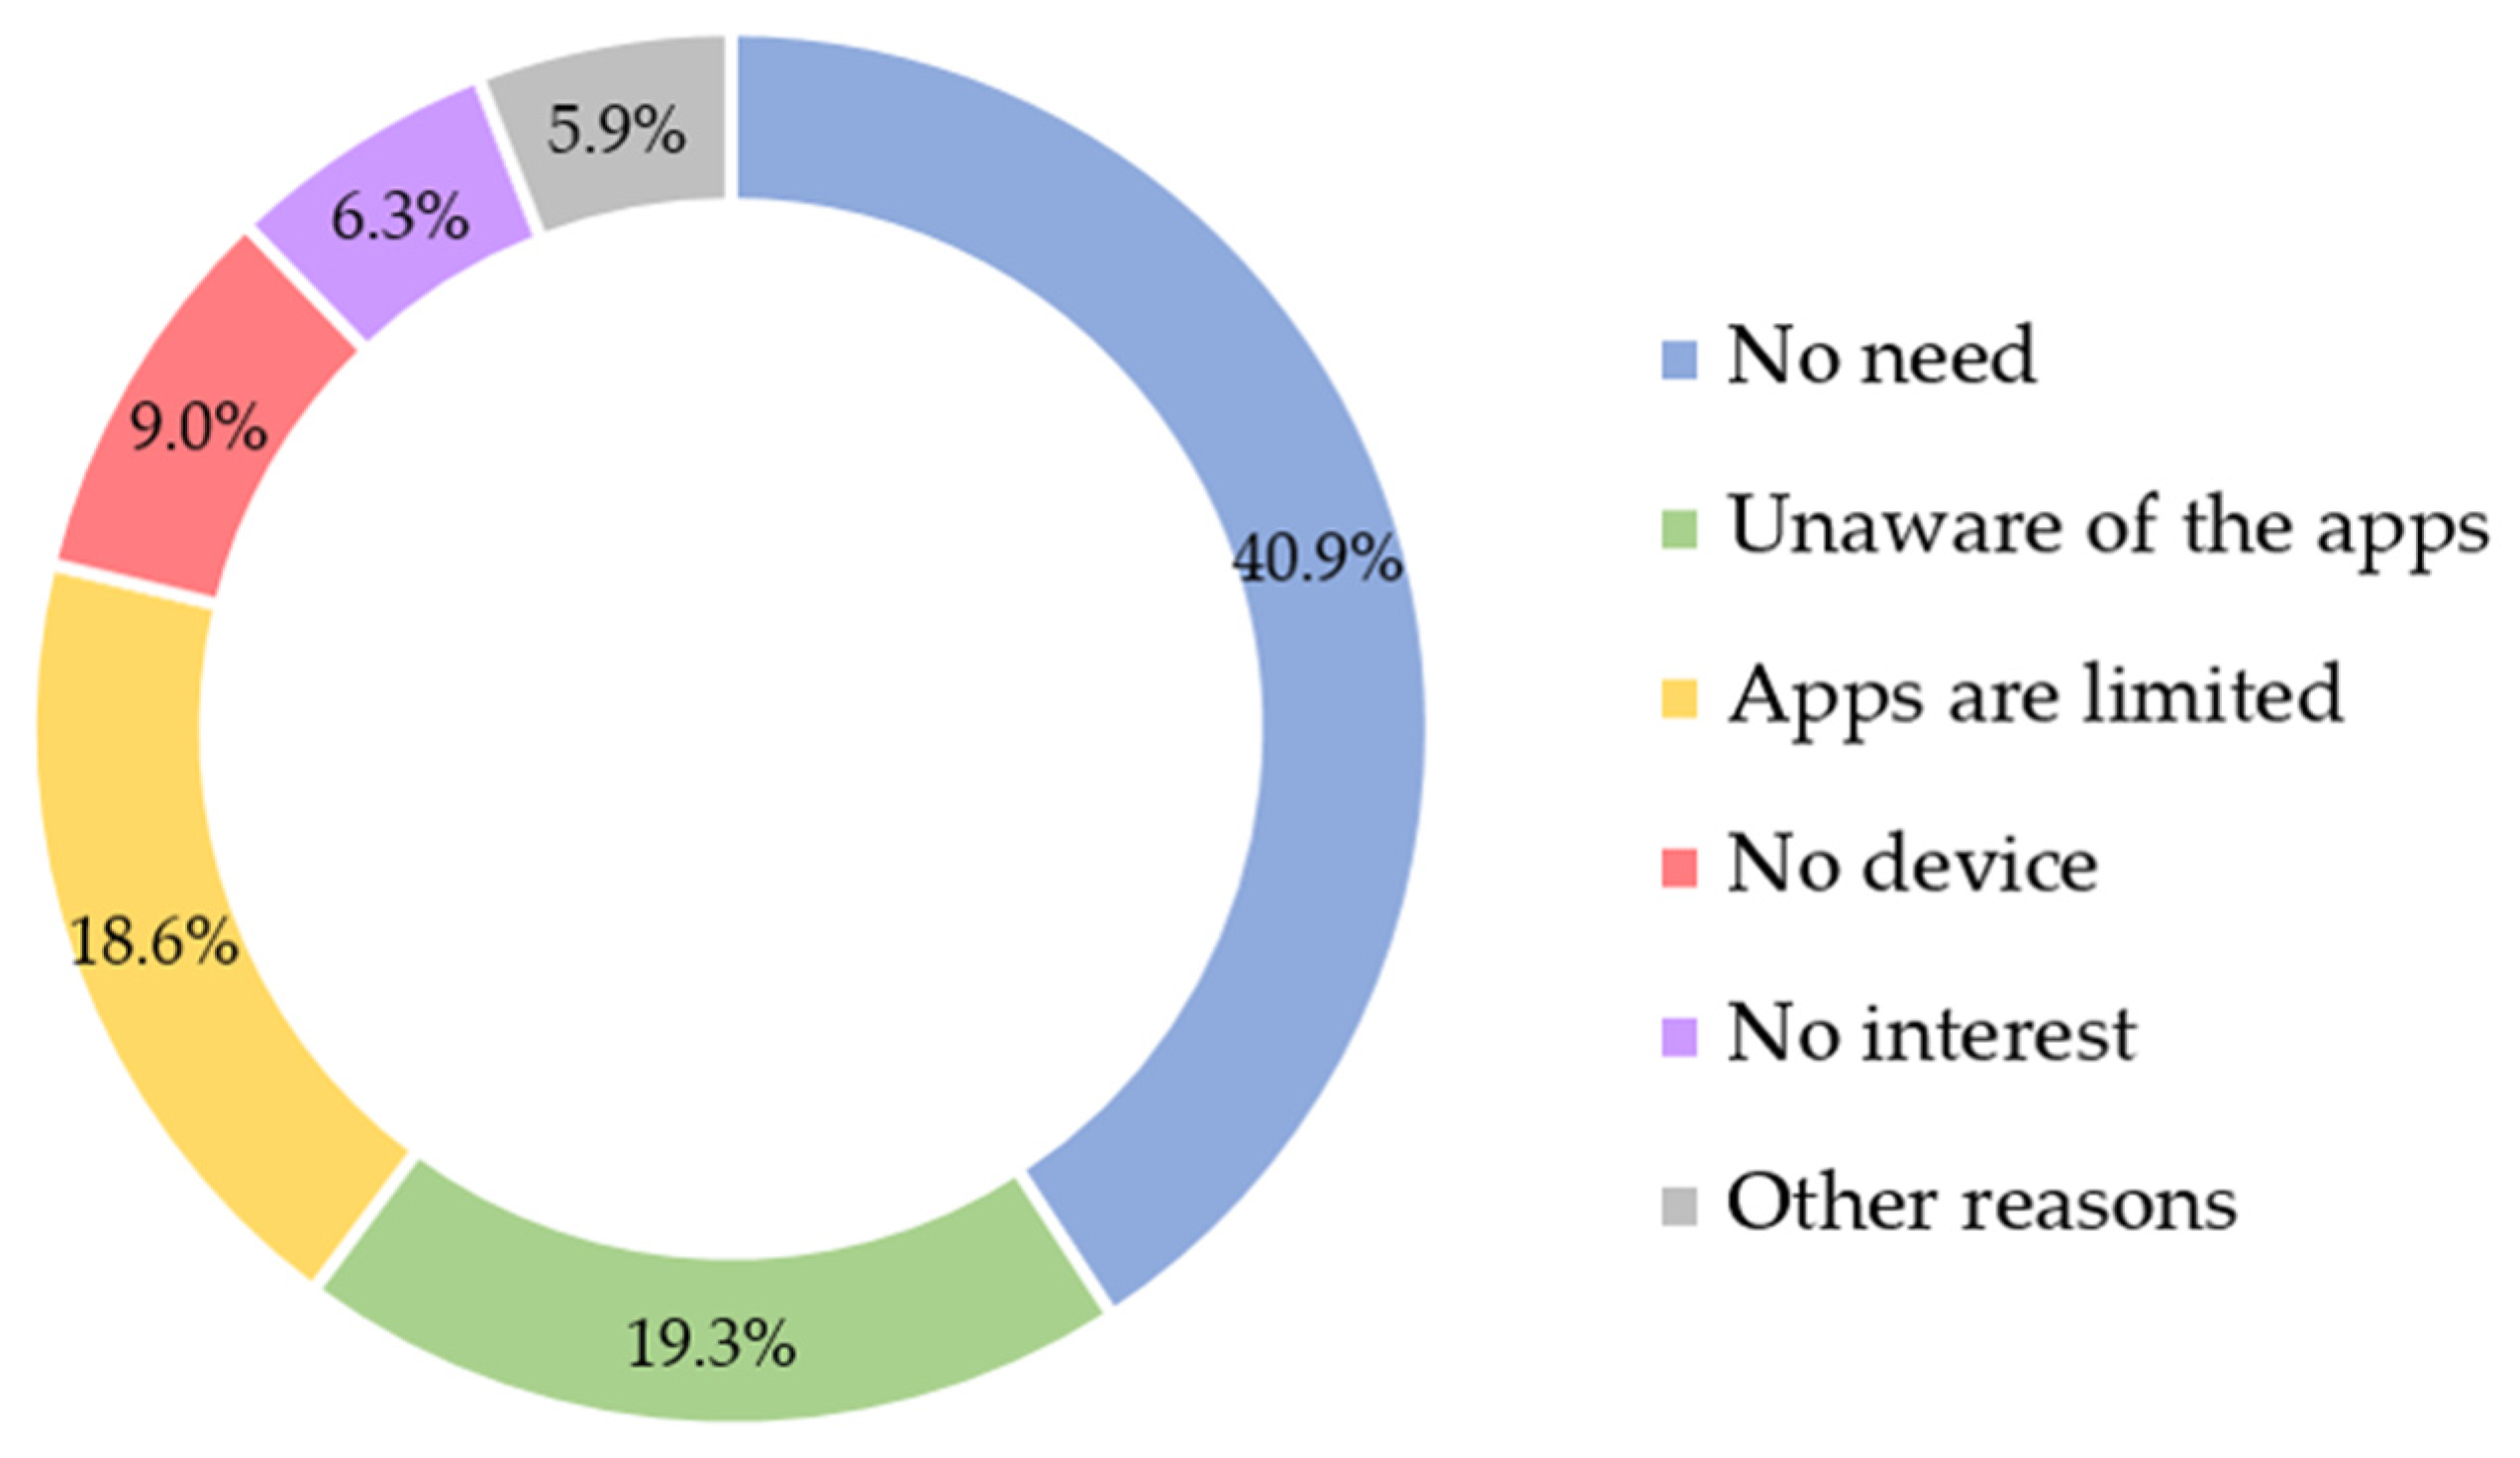
To understand the reasons preventing the use of PNAs, non-users were invited to report the respective barriers from a given list of options. From these, 698 participants (84% of non-users) reported the respective reasons. The results are summarized in Figure 6.
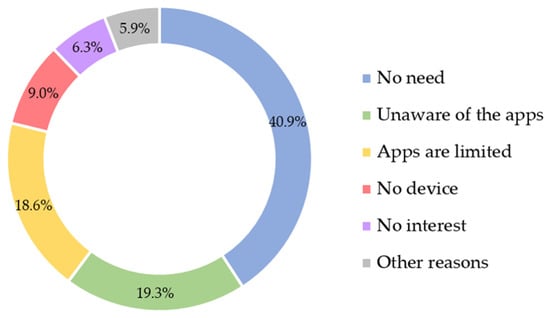
Figure 6.
Barriers preventing the use of pedestrian navigation apps.
Accordingly, non-use was mainly justified by three main reasons: (i) no need of using PNAs; (ii) unaware of the apps available; and (iii) the perception that these apps are limited or not useful. The first was identified as a barrier by around 41% of participants. From these, a significant part (59%) does not need any navigation assistance because they know the city well. This includes people who have lived and worked for a long time in both cities, which comprehensibly do not need the support of any PNA to walk around them. The remaining participants (41%) do not use any PNA because walking is not their exclusive/main daily mode of transport. This could be related to various reasons, including long travel distance and time, comfort and safety issues, or lack of physical condition to walk. The second barrier was much less representative (about 19%) and includes those that are unaware of the navigation apps available. In this case, non-use could be justified by various reasons, including poor computer literacy and technological skills that may prevent people from choosing, understanding and operating a PNA. A similar percentage of respondents (19%) does not use PNAs because in their view these apps are limited or not useful. This could be related with problems of reliability and accuracy of the apps in locating and finding places, as highlighted by some respondents, as well as by the lack of technological skills to operate these apps. In relation to the other less reported barriers, the lack of an appropriate mobile device (smartphone) for running the app was indicated by about 9% of the non-users. No interest in using PNAs was expressed by about 6% of respondents, while a similar percentage of participants reporting various other reasons including mobile data usage, privacy reasons, dislike of the apps, apps causing stress and distract, enjoying the landscape, self-orientation, among others.
A Chi-square test was also carried out to find associations between the individual and geographic variables and the barriers preventing the use of PNAs (Table 4).
Table 4.
Main barriers preventing the use of pedestrian navigation apps (N = 698).
As shown in Table 4, various significant relations were found. An association between gender and the non-use due to the perception that PNAs are limited/not useful was found (X2 (1, N = 698) = 6.962, p .008). The test confirmed that this barrier prevents more males than females from using PNAs. Associations between age and the non-use due to being unaware of the PNAs available (X2 (1, N = 698) = 19.392, p < 001) due to the perception that PNAs are limited/not useful (X2 (1, N = 698) = 10.053, p .018), and to the lack of suitable devices for running the apps (X2 (1, N = 698) = 28.614, p < 001) were also found. In this case, the test confirmed that the lack of suitable mobile devices and the perception that PNAs are limited/not useful are barriers that mainly prevent people ≥65 years old from using these apps. In turn, unawareness of the PNAs available limited more young individuals (≤24 years old) from using these apps than adult individuals. Associations between the type of occupation and the non-use due to the lack of a suitable mobile device (X2 (1, N = 698) = 63.199, p < 001) and due to no need (X2 (1, N = 698) = 6.647, p .036) were also identified. This analysis confirmed that the lack of an appropriate device restricts more individuals with other occupations (retired and unemployed individuals) from using these apps than students and employed individuals. On the contrary, the lack of need was the barrier most reported by students and the employed population to not use these apps. The lack of an appropriate device also restricted more tourists than residents and commuters in using PNAs (X2 (1, N = 698) = 23.089, p .001).
When asked about the future utilization of PNAs, 66% of the non-users (n = 548) said that they do not intend to use these apps in the future. These respondents were mostly those that do not need, do not see usefulness or were unaware of the existing PNAs. This finding suggests that most of the non-users will hardly ever use a PNA in the future. In relation to the non-users thinking about using a PNA in the future, about 80% of them are interested in their usefulness in terms of wayfinding. Other reasons include curiosity in operating a PNA and the data associated with walking.
5. Discussion
Smartphones were widely used by the population involved in this study. This is in line with recent travel studies carried out in other European countries [60]. However, PNAs installed in smartphones were used by 42% of the respondents in both cities. This could be explained by two main reasons. First, the low usage of PNAs could be explained by most of the travel being local and familiar to participants and made by other modes of transport. In fact, the lack of need was the main barrier preventing the use of PNAs in Bologna and Porto. Our findings are in line with previous research, confirming that these apps are mostly used to plan occasional trips [61]. Interestingly, the lowest regular use of PNAs was found among commuters in Porto (57%), while the highest was found among tourists in Bologna (75%). This could be directly related to the type of activity and spatial cognition people have from these cities. As tourists generally have less spatial knowledge of cities, using navigation tools can be useful for them to define routes and to find specific places, such as monuments, museums, stations, restaurants, etc. In turn, commuters are usually engaged in utilitarian walking associated to mandatory and fixed activities, controlled by relatively rigid schedules [56]. For that reason, they make repeated trips using the same routes between two locations, which may explain the low regular use of PNAs among these users [62]. Second, some authors such as Gadziński [12] argued that besides the increasing rate of smartphone ownership, many individuals only use basic functionalities of their mobile phones, especially to make calls and send text messages. In our study, we cannot confirm this assumption, although most of the participants do not use apps for walking navigation. Obviously, this does not prevent participants from using other apps on their smartphones, but these issues were not explored in our questionnaire.
Regarding the users of PNAs, Google Maps was the preferred navigation service in both cities, which is in line with recent research [60,63]. The prevalence of Google Maps could be justified by the popularity of the mapping service, the mapping capability across multiple locations globally and by the open-access planning router that can be used for several independent or mixed transport modes [10].
This paper also confirmed that some individual variables exert a significant influence in using PNAs. Confirming previous studies [12,14,16], we found that PNAs were more likely to be used by younger people: the percentage of users decreases from about 50% among people aged ≤24 years old, to 25% among people aged ≥65 years old. This could be explained by the fact that using mobility apps for trip planning and travel outcomes is usually associated to young and tech-savvy individuals [14,16]. This also suggests that older individuals generally use fewer technologies (and less frequently) than younger people, as previously confirmed in other studies [48,49]. Nonetheless, it is well-known that age affects several abilities which are important to ensure effective mobility and navigation. Mobility degrades with aging, while wayfinding is highly affected by the aging process: old people have more difficulty in locating destinations, finding routes, remembering landmarks, and inferring distances and directions [16,36,43]. As highlighted by Renaudin et al. [20], PNAs are assistive technologies that have the potential to enable elderly users to move more efficiently and autonomously in unfamiliar environments. The findings of this study suggest that seniors do not have this understanding about the assistance that can be provided by these technologies. The lack of an appropriate mobile device (35%) and unaware of the navigation apps available (23%) were the main reasons preventing seniors from using PNAs. Some studies also emphasized that gender may have an impact on using ICT for travelling [15,64]. In the present study, gender was not relevant, as females and males were found to be equally likely to use PNAs. However, we found that females were more likely to use the apps for finding locations, while males were more likely to use them for collecting useful walking data. This could be explained by the fact that women generally walk more, but for shorter periods of times, because they have more time restrictions than men [56]. Similarly, previous research also suggested that transportation apps were more likely to be used by higher educated people than by their undergraduate counterparts [50,65], showing that the higher the education level, the more such a person is likely to use apps. However, in our sample, the education level was not significantly correlated with using PNAs. This could be explained by the fact of undergraduate students tending to use mobile apps frequently due to their age and tech skills [66] and by the fact that they were more likely to walk and cycle than older graduate individuals [55]. Moreover, more educated individuals, who often have higher incomes, tend to walk less [56], which makes using PNAs expendable.
The apps were generally well rated by respondents, with an overall average score of 3.95 on a five-point Likert scale, showing that users were satisfied with their PNAs. Interestingly, specific issues that some users liked the most corresponded to issues that other users liked the least. This includes the reliability of the navigation service and the usability of the apps, as well as other less reported issues (speed, interface, update). This could be explained by many reasons, including the navigation service used, the characteristics of the mobile device, poor GPS coverage at specific locations, individual difficulties in operating the apps and navigating with them, among others. Individually or jointly, these issues can result in very different navigation experiences. These findings corroborate previous research indicating that navigating with mobile devices is affected by the variability of contexts of use, the diversity of users and their preferences and capabilities [18]. Nonetheless, the findings also showed that the accuracy and usability of the navigation services towards targeting a destination are critical [11,41]. They also confirm that battery consumption, mobile data usage, processing speed and updated information are relevant navigation issues as found in previous studies [18,67,68]. About 7% of users also highlighted the need for improving the pedestrian navigation service, especially by including more built environment and transport data, to reach the pedestrians’ needs and preferences more effectively. It has been argued that one feasible way to increase the number of people walking is to provide as much information as possible about the most walkable streets and areas in our cities, which require mapping services showing the suitability of a street for walking [69]. However, as described in the Background [16,17,70], PNAs are inspired by car navigation systems, which are strongly based on road networks, distances and turn-by-turn instructions, which do not effectively and properly reply to the pedestrians’ needs. Pedestrian infrastructure data, such as the characteristics of sidewalks (width, slopes, condition, etc.), the existence of footpaths and pedestrian bridges/tunnels allowing shorter connections, and landmark data have been insufficiently included in PNAs. As also mentioned in the Background, some prototypes and new apps have been recently developed to include landmark and built environment data, but they are only available for specific locations, providing navigation for a restricted number of pedestrians. Similarly, the deployment of multimodal transport data could provide interesting extensions towards the use of smartphone apps [13]. While some navigation services provide integrated data for various modes of transport, such as Google Maps, data are not available for all cities and for all modes of transport. For instance, for Bologna and Porto, Google Maps do not provide cycling navigation. Nonetheless, in our study, the lack of pedestrian infrastructure and transport data in PNAs was reported by a relatively low number of participants (7%), which means that these problems were not identified as critical by many of them.
The study also showed that 58% of the participants do not use any PNA for walking. From these, a significant part does not need any technological aid, because walking is not their main mode of transport mode (41%) or because they know the cities well (59%). Regarding the first barrier, it is recognized that walking is preferred for short distances up to 0.8 km or 10-min walking [71]. For longer distances, other modes, including motorized modes of transport, are frequently preferred. They are faster and may provide other benefits, including comfort, convenience, security, and safety [55]. However, even for short urban trips, the literature shows that some people prefer to drive rather than walk, especially in Southern Europe [72]. However, this is not always the case in Bologna and Porto. In a recent study focused on utilitarian walking, Fonseca et al. [56] showed that 21% and 47% of the daily trips to the central areas of these cities were, respectively, made on foot or using a pedestrian mode combined with other modes of transport. In this study, the preference for other modes of transport (public transport, car, bicycle) was an important reason but not the main barrier preventing the use of PNAs. In fact, the main barrier found was knowing the cities well. It is recognized that the main advantage of PNAs is to guide people in unfamiliar environments [8,9,22]. This was not the case particularly of those engaged in utilitarian walking, including students and employed individuals, who make repeated daily trips to the same destinations. In turn, not having a suitable mobile device was associated with elderly individuals, while more surprisingly, unawareness of the apps available was a barrier deterring more young adults from using these apps than older individuals.
Finally, this study revealed some interesting differences between Bologna and Porto. In their recent study on utilitarian walking in the central areas of these cities, Fonseca et al. [56] found a share of utilitarian walking higher in Bologna than in Porto. In this current study, we found a slightly greater percentage of individuals using PNAs in Porto (45%) than in Bologna (40%). Thus, the use of these technological aids does not seem to explain the different patterns of utilitarian walking in both cities. The study also found that individuals from Bologna were more critical regarding the usefulness of these apps. The perception that PNAs are limited/not useful was more likely to be held by individuals from Bologna, who also evaluated these apps slightly lower (average score of 3.9) when compared to the evaluation given by the participants from Porto (average score of 4.1). These different perceptions about PNAs may also explain the lower percentage of users among the participants of Bologna.
6. Conclusions
City planning is increasingly concerned with becoming more pedestrian-friendly due to the environmental and health benefits of walking. Policies for developing safe, comfortable, and connected pedestrian networks have been implemented worldwide. In turn, technology is changing the way people live and travel. In a time where transport modes are undergoing great changes, technological efforts have been developed to promote active mobility. Smartphone apps have been used to improve different travel related activities, including active transportation, and to change travel behaviors towards more sustainable and healthy modes of transport. By providing self-localization, spatial recognition, and turn-by-turn navigation, PNAs allow people to walk independently and confidently without being concerned about becoming lost and taking more time to arrive at a destination. Thus, user-friendly, reliable, and efficient navigation apps, could influence individuals’ mobility in various ways, especially to address misunderstandings about the route, distance, and time it would take to walk to a destination.
Based on an extensive questionnaire carried out in Bologna and Porto (N = 1438), this paper examined the extent to which PNAs are used for walking, how people evaluated and perceived these apps and the main barriers preventing their use in both cities. Results indicated that 42% of the participants use pedestrian navigation tools frequently/occasionally, mainly for finding locations and for selecting the shortest routes for specific destinations. The use/non-use pattern revealed some specificities related to individual and geographic attributes. PNAs were found to be more used by young adults and students. The occasional use and non-use of these apps was not associated to operational problems, but mostly to the fact that participants do not need these tools because they know the cities well and because walking is not their daily main mode of transport.
While these apps are mostly used by their functional value (navigation and wayfinding), there is room for increasing their regular use and, therefore, their role in promoting healthier and sustainable lifestyles. According to the findings described in this paper, app developers should concentrate on developing mobility-supported smartphone applications with different types of adjustable features to match the pedestrians’ daily mobility needs more effectively. The apps should be more reliable and precise in terms of navigation, they should offer several options for selecting routes and be easier to understand, particularly regarding the beginning of the route: where am I? Which is the right direction to start walking? Furthermore, these apps should provide navigation that is more supported on pedestrian infrastructure data (characteristics and conditions of sidewalks, informal paths, pedestrians barriers, landmarks) rather than on road data. This will lead to real and easier pedestrian navigation and not a car navigation service used for pedestrian purposes. In addition, PNAs should provide access to integrated transport data to allow the use of the pedestrian mode in combination with other modes of transport (public transport stations and schedules, bike share docks, bike lanes, among others) to reach a specific destination. The provision of complementary data (health, biological data associated to the walk), the provision of incentives for using these navigation apps (such as vouchers) and the promotion of marketing campaigns may also encourage more people to use these apps and motivate them to change their travel behaviors, especially in the case of short urban trips.
Finally, this study has some limitations that should be considered. The described results are based on a questionnaire, meaning that results are based on self-reported usage and not on direct observations that are often more objective. Subjective evaluations can contain inconsistencies between reported options/preferences and individual behaviors. Furthermore, this study reflects the use of PNAs in a broader context. Using a specific navigation app for making specific walking trips would provide more accurate results, especially to compare the subjective evaluations and objective measurements (travel distance and time in a specific route, features of the built environment, etc.). Plus, tourists and elderly people are under-represented in this study due to the difficulties in targeting these groups with an online questionnaire. Thus, the findings described were not able to represent the use of PNAs by these groups appropriately, especially tourists.
Author Contributions
Conceptualization: Fernando Fonseca, Elisa Conticelli and George Papageorgiou; methodology: Fernando Fonseca and Elisa Conticelli; software: George Papageorgiou; validation: George Papageorgiou, Fernando Fonseca and Paulo Ribeiro; formal analysis: George Papageorgiou; investigation: Fernando Fonseca; resources: Paulo Ribeiro and Mona Jabbari; data curation: Fernando Fonseca, Elisa Conticelli and Mona Jabbari; writing—original draft preparation: Fernando Fonseca and Elisa Conticelli; writing—review and editing: George Papageorgiou, Paulo Ribeiro, Mona Jabbari and Rui Ramos; visualization: Fernando Fonseca; supervision: Simona Tondelli and Rui Ramos; project administration: Rui Ramos. All authors have read and agreed to the published version of the manuscript.
Funding
This research was funded by the JPI Urban Europe, FCT—PT (ENSUF/0004/2016), MIUR-I, FFG—A and RPF—CY.
Informed Consent Statement
Informed consent was obtained from all subjects involved in the study.
Data Availability Statement
The data that support the findings of this study are available on request from the corresponding author [F.F.]. The data are not publicly available due to privacy restrictions.
Conflicts of Interest
The authors declare no conflict of interest.
References
- Taleai, M.; Amiri, E.T. Spatial multi-criteria and multi-scale evaluation of walkability potential at street segment level: A case study of tehran. Sustain. Cities Soc. 2017, 31, 37–50. [Google Scholar] [CrossRef]
- Chiu, W.; Cho, H.; Chi, C.G. Consumers’ continuance intention to use fitness and health apps: An integration of the expectation–confirmation model and investment model. Inf. Technol. People 2021, 34, 978–998. [Google Scholar] [CrossRef]
- Kamboj, A.K.; Krishna, S.G. Pokémon GO: An innovative smartphone gaming application with health benefits. Prim. Care Diabetes 2017, 11, 397–399. [Google Scholar] [CrossRef] [PubMed]
- EC-European Commission. EU Science Hub: Health Promotion and Disease Prevention Knowledge Gateway. 2018. Available online: https://ec.europa.eu/jrc/en/health-knowledge-gateway/promotion-prevention/nutrition (accessed on 20 December 2020).
- Habibian, M.; Hosseinzadeh, A. Walkability index across trip purposes. Sustain. Cities Soc. 2018, 42, 216–225. [Google Scholar] [CrossRef]
- Fonseca, F.; Ribeiro, P.J.G.; Conticelli, E.; Jabbari, M.; Papageorgiou, G.; Tondelli, S.; Ramos, R.A.R. Built environment attributes and their influence on walkability. Int. J. Sustain. Transp. 2021, 1–40. [Google Scholar] [CrossRef]
- Wang, J.; Worboys, M. Pedestrian Navigation Aids, Spatial Knowledge and Walkability. In Proceedings of the 9th International Conference on Geographic Information Science, Montreal, QC, Canada, 27–30 September 2016. [Google Scholar]
- Appleyard, B. The meaning of livable streets to schoolchildren: An image mapping study of the effects of traffic on children’s cognitive development of spatial knowledge. J. Transp. Health 2017, 5, 27–41. [Google Scholar] [CrossRef]
- Phillips, J.; Walford, N.; Hockey, A.; Foreman, N.; Lewis, M. Older people and outdoor environments: Pedestrian anxieties and barriers in the use of familiar and unfamiliar spaces. Geoforum 2013, 47, 113–124. [Google Scholar] [CrossRef] [Green Version]
- Lyons, G. Walking as a service–Does it have legs? Transp. Res. Part A Policy Pr. 2020, 137, 271–284. [Google Scholar] [CrossRef]
- Ranasinghe, C.; Heitmann, S.; Hamzin, A.; Pfeiffer, M.; Kray, C. Pedestrian navigation and GPS deteriorations: User behavior and adaptation strategies. In Proceedings of the 30th Australian Conference on Computer-Human Interaction, Melbourne, Australia, 5–7 December 2018. [Google Scholar]
- Gadziński, J. Perspectives of the use of smartphones in travel behaviour studies: Findings from a literature review and a pilot study. Transp. Res. Part C Emerg. Technol. 2018, 88, 74–86. [Google Scholar] [CrossRef]
- Tsirimpa, A.; Polydoropoulou, A.; Pagoni, I.; Tsouros, I. A reward-based instrument for promoting multimodality. Transp. Res. Part F Traffic Psychol. Behav. 2019, 65, 121–140. [Google Scholar] [CrossRef]
- Jamal, S.; Habib, M.A. Investigation of the use of smartphone applications for trip planning and travel outcomes. Transp. Plan. Technol. 2019, 42, 227–243. [Google Scholar] [CrossRef]
- Khan, N.A.; Habib, M.A.; Jamal, S. Effects of smartphone application usage on mobility choices. Transp. Res. Part A Policy Pr. 2020, 132, 932–947. [Google Scholar] [CrossRef]
- Cœugnet, S.; Dommes, A.; Panëels, S.; Chevalier, A.; Vienne, F.; Dang, N.-T.; Anastassova, M. Helping older pedestrians navigate unknown environments through vibrotactile guidance instructions. Transp. Res. Part F Traffic Psychol. Behav. 2018, 58, 816–830. [Google Scholar] [CrossRef]
- Rousell, A.; Zipf, A. Towards a landmark-based pedestrian navigation service using OSM data. ISPRS Int. J. Geo-Inf. 2017, 6, 64. [Google Scholar] [CrossRef] [Green Version]
- Delikostidis, I.; Van Elzakker, C.P.; Kraak, M.-J. Overcoming challenges in developing more usable pedestrian navigation systems. Cartogr. Geogr. Inf. Sci. 2015, 43, 189–207. [Google Scholar] [CrossRef]
- Fang, Z.; Li, Q.; Shaw, S.-L. What about people in pedestrian navigation? Geo-Spat. Inf. Sci. 2015, 18, 135–150. [Google Scholar] [CrossRef] [Green Version]
- Renaudin, V.; Dommes, A.; Guilbot, M. Engineering, human, and legal challenges of navigation systems for personal mobility. IEEE Trans. Intell. Transp. Syst. 2016, 18, 177–191. [Google Scholar] [CrossRef]
- Brügger, A.; Richter, K.-F.; Fabrikant, S.I. How does navigation system behavior influence human behavior? Cogn. Res. Princ. Implic. 2019, 4, 1–22. [Google Scholar] [CrossRef] [PubMed] [Green Version]
- He, G.; Ishikawa, T.; Takemiya, M. Collaborative navigation in an unfamiliar environment with people having different spatial aptitudes. Spat. Cogn. Comput. 2015, 15, 285–307. [Google Scholar] [CrossRef]
- Mottet, M.; Eccles, D.W.; Saury, J. Navigation in outdoor environments as an embodied, social, cultural, and situated experience: An empirical study of orienteering. Spat. Cogn. Comput. 2016, 16, 220–243. [Google Scholar] [CrossRef] [Green Version]
- Schwering, A.; Krukar, J.; Li, R.; Anacta, V.J.; Fuest, S. Wayfinding through orientation. Spat. Cogn. Comput. 2017, 17, 273–303. [Google Scholar] [CrossRef]
- Ohm, C.; Müller, M.; Ludwig, B. Evaluating indoor pedestrian navigation interfaces using mobile eye tracking. Spat. Cogn. Comput. 2016, 17, 1–32. [Google Scholar] [CrossRef]
- Münzer, S.; Zimmer, H.D.; Schwalm, M.; Baus, J.; Aslan, I. Computer-assisted navigation and the acquisition of route and survey knowledge. J. Environ. Psychol. 2006, 26, 300–308. [Google Scholar] [CrossRef]
- Keil, J.; Mocnik, F.-B.; Edler, D.; Dickmann, F.; Kuchinke, L. Reduction of map information regulates visual attention without affecting route recognition performance. ISPRS Int. J. Geo-Inf. 2018, 7, 469. [Google Scholar] [CrossRef] [Green Version]
- Zhao, S.; Li, S.; Ramos, J.; Luo, Z.; Jiang, Z.; Dey, A.K.; Pan, G. User profiling from their use of smartphone applications: A survey. Pervasive Mob. Comput. 2019, 59. [Google Scholar] [CrossRef]
- Kandalan, R.N.; Namuduri, K. Techniques for constructing indoor navigation systems for the visually impaired: A review. IEEE Trans. Hum. Mach. Syst. 2020, 50, 492–506. [Google Scholar] [CrossRef]
- Harle, R. A Survey of indoor inertial positioning systems for pedestrians. IEEE Commun. Surv. Tutor. 2013, 15, 1281–1293. [Google Scholar] [CrossRef]
- Jacob, R.; Winstanley, A.; Togher, N.; Roche, R.; Mooney, P. Pedestrian navigation using the sense of touch. Comput. Environ. Urban Syst. 2012, 36, 513–525. [Google Scholar] [CrossRef] [Green Version]
- Yan, J.; Diakité, A.A.; Zlatanova, S.; Aleksandrov, M. Top-bounded spaces formed by the built environment for navigation systems. ISPRS Int. J. Geo-Inf. 2019, 8, 224. [Google Scholar] [CrossRef] [Green Version]
- Walford, N.; Samarasundera, E.; Phillips, J.; Hockey, A.; Foreman, N. Older people’s navigation of urban areas as pedestrians: Measuring quality of the built environment using oral narratives and virtual routes. Landsc. Urban Plan. 2011, 100, 163–168. [Google Scholar] [CrossRef] [Green Version]
- Sinagra, E. Development of pathNav: A Pedestrian Navigation Tool that Utilizes Smart Data for Improved Accessibility and Walkability; Pathway Accessibility Solutions, Inc.: Pittsburgh, CA, USA, 2019. [Google Scholar]
- Dang, C.; Iwai, M.; Tobe, Y.; Umeda, K.; Sezaki, K. A framework for pedestrian comfort navigation using multi-modal environmental sensors. Pervasive Mob. Comput. 2013, 9, 421–436. [Google Scholar] [CrossRef]
- Ohm, C.; Bienk, S.; Kattenbeck, M.; Ludwig, B.; Müller, M. Towards interfaces of mobile pedestrian navigation systems adapted to the user’s orientation skills. Pervasive Mob. Comput. 2016, 26, 121–134. [Google Scholar] [CrossRef]
- Semenov, A.; Zelentsov, V.; Pimanov, I. Application suggesting attractive walking routes for pedestrians using an example of Saint-Petersburg City. Procedia Comput. Sci. 2019, 156, 319–326. [Google Scholar] [CrossRef]
- Fonseca, F.; Ribeiro, P.; Jabbari, M.; Petrova, E.; Papageorgiou, G.; Conticelli, E.; Tondelli, S.; Ramos, R. Smart Pedestrian Network: An integrated conceptual model for improving walkability. In Society with Future: Smart and Liveable Cities; Pereira, P., Ribeiro, R., Oliveira, I., Novais, P., Eds.; Springer International Publishing: Lisbon, Portugal, 2020; pp. 1–18. [Google Scholar]
- Appel, M.; Krisch, N.; Stein, J.-P.; Weber, S. Smartphone zombies! Pedestrians’ distracted walking as a function of their fear of missing out. J. Environ. Psychol. 2019, 63, 130–133. [Google Scholar] [CrossRef]
- Malathy, N.; Nandha, S.S.; Praveen, B.; Kumar, K.P. Pedwarn-enhancement of pedestrian safety using mobile application. Lect. Notes Data Eng. Commun. Technol. 2020, 35, 877–887. [Google Scholar] [CrossRef]
- Aditya, T.; Laksono, D.; Sutanta, H.; Izzahudin, N.; Susanta, F. A usability evaluation of a 3D map display for pedestrian navigation. In Proceedings of the 13th 3D GeoInfo Conference, Delft, The Netherlands, 1–2 October 2018. [Google Scholar]
- Chung, J.; Pagnini, F.; Langer, E. Mindful navigation for pedestrians: Improving engagement with augmented reality. Technol. Soc. 2016, 45, 29–33. [Google Scholar] [CrossRef]
- Iachini, T.; Ruggiero, G.; Ruotolo, F.; Pizza, R. Age and gender differences in some components of spatial cognition. In Women and Aging: New Research; Benninghouse, H.T., Rosset, A.G., Eds.; Nova Publishers: New York, NY, USA, 2009; pp. 365–388. [Google Scholar]
- Dastjerdi, A.M.; Kaplan, S.; Silva, J.D.A.E.; Nielsen, O.A.; Pereira, F.C. Use intention of mobility-management travel apps: The role of users goals, technophile attitude and community trust. Transp. Res. Part A Policy Pr. 2019, 126, 114–135. [Google Scholar] [CrossRef]
- Liao, H.; Dong, W. An exploratory study investigating gender effects on using 3D maps for spatial orientation in wayfinding. ISPRS Int. J. Geo-Inf. 2017, 6, 60. [Google Scholar] [CrossRef] [Green Version]
- Blasko, D.G.; Lum, H.C.; Campbell, J. Gender Differences in Perceptions of Technology, Technology Readiness, and Spatial Cognition. In Proceedings of the Human Factors and Ergonomics Society Annual Meeting, Virtual Meeting, 5–9 October 2021; Volume 64, pp. 1395–1399. [Google Scholar] [CrossRef]
- Silber-Varod, V.; Blau, I.; Lis-Hacohen, R. Gender in shared navigation: Men to Mars, women to Venus? J. Comput. Inf. Syst. 2017, 59, 171–177. [Google Scholar] [CrossRef]
- Mohadis, H.; Ali, N. A study of smartphone usage and barriers among the elderly. In Proceedings of the 3rd International Conference on User Science and Engineering (i-USEr), Shah Alam, Malaysia, 2–5 September 2015. [Google Scholar]
- Gordon, M.L.; Gatys, L.; Guestrin, C.; Bigham, J.P.; Trister, A.; Patel, K. App Usage Predicts Cognitive Ability in Older Adults. In Proceedings of the 2019 CHI Conference on Human Factors in Computing Systems, Glasgow, Scotland, UK, 4–9 May 2019. [Google Scholar]
- Shaheen, S.; Martin, E.; Cohen, A.; Musunuri, A.; Bhattacharyya, A. Mobile Apps and Transportation: A Review of Smartphone Apps and a Study of User Response to Multimodal Traveler Information; Technical Report; Department of Transportation, State of California: Sacramento, CA, USA, 2016. [Google Scholar]
- Frehlich, L.; Blackstaffe, A.; McCormack, G.R. Test-retest reliability and Walk Score® neighbourhood walkability comparison of an online perceived neighbourhood-specific adaptation of the International Physical Activity Questionnaire (IPAQ). Int. J. Environ. Res. Public Health 2019, 16, 1917. [Google Scholar] [CrossRef] [Green Version]
- Israel, G. Determining Sample Size; University of Florida Cooperative Extension Service, Institute of Food and Agriculture Sciences, EDIS: Gainesville, FL, USA, 2012. [Google Scholar]
- ISTAT-Istituto Nazionale di Statistica. Annual Estimated Population. 2019. Available online: www.istat.it (accessed on 28 December 2020).
- SP-Statistics Portugal. Annual Estimated Population. 2019. Available online: www.ine.pt (accessed on 28 December 2020).
- Ribeiro, P.; Fonseca, F.; Meireles, T. Sustainable mobility patterns to university campuses: Evaluation and constraints. Case Stud. Transp. Policy 2020, 8, 639–647. [Google Scholar] [CrossRef]
- Fonseca, F.; Conticelli, E.; Papageorgiou, G.; Ribeiro, P.; Jabbari, M.; Tondelli, S.; Ramos, R. Levels and characteristics of utilitarian walking in the central areas of the cities of Bologna and Porto. Sustainability 2021, 13, 3064. [Google Scholar] [CrossRef]
- IBM SPSS Statistics 24.0, Crosstabs Statistics. Available online: https://www.ibm.com/docs/en/spss-statistics/24.0.0?topic=crosstabs-statistics (accessed on 1 April 2021).
- Li, H.; Zhang, J.; Xia, L.; Song, W.; Bode, N.W. Comparing the route-choice behavior of pedestrians around obstacles in a virtual experiment and a field study. Transp. Res. Part C Emerg. Technol. 2019, 107, 120–136. [Google Scholar] [CrossRef] [Green Version]
- Blasius, J.; Brandt, M. Representativeness in online surveys through stratified samples. Bull. Sociol. Methodol. 2010, 107, 5–21. [Google Scholar] [CrossRef]
- Fioreze, T.; Thomas, T.; Huang, B.; Van Berkum, E. How employees view smart cycling to work: A regional survey in the Netherlands. Travel Behav. Soc. 2019, 16, 224–234. [Google Scholar] [CrossRef] [Green Version]
- Pronello, C.; Simão, J.P.R.V.; Rappazzo, V. The effects of the multimodal real time information systems on the travel behaviour. Transp. Res. Procedia 2017, 25, 2677–2689. [Google Scholar] [CrossRef] [Green Version]
- Tang, W.; Cheng, L. Analyzing multiday route choice behavior of commuters using GPS data. Adv. Mech. Eng. 2016, 8, 1–11. [Google Scholar] [CrossRef] [Green Version]
- Savino, G.-L.; Emanuel, N.; Kowalzik, S.; Kroll, F.; Lange, M.C.; Laudan, M.; Leder, R.; Liang, Z.; Markhabayeva, D.; Schmeißer, M.; et al. Comparing Pedestrian Navigation Methods in Virtual Reality and Real Life. In Proceedings of the 2019 International Conference on Multimodal Interaction, Suzhou, China, 14–18 October 2019; pp. 16–25. [Google Scholar]
- Gardony, A.L.; Brunyé, T.T.; Taylor, H.A. Navigational aids and spatial memory impairment: The role of divided attention. Spat. Cogn. Comput. 2015, 15, 246–284. [Google Scholar] [CrossRef]
- Ncube, B.; Koloba, H.A. Branded mobile app usage intentions among generation Y students: A comparison of gender and education level. Int. J. eBus. eGov. Stud. 2020, 12, 91–106. [Google Scholar] [CrossRef]
- Eveleth, L.B.; Stone, R.W. User’s perceptions of perceived usefulness, satisfaction, and intentions of mobile application. Int. J. Mob. Commun. 2020, 18, 1–18. [Google Scholar] [CrossRef]
- Joseph, L.; Neven, A.; Martens, K.; Kweka, O.; Wets, G.; Janssens, D. Measuring individuals’ travel behaviour by use of a GPS-based smartphone application in Dar es Salaam, Tanzania. J. Transp. Geogr. 2020, 88. [Google Scholar] [CrossRef]
- Lim, K.-W.; Secci, S.; Tabourier, L.; Tebbani, B. Characterizing and predicting mobile application usage. Comput. Commun. 2016, 95, 82–94. [Google Scholar] [CrossRef] [Green Version]
- Kapenekakis, I.; Chorianopoulos, K. Citizen science for pedestrian cartography: Collection and moderation of walkable routes in cities through mobile gamification. Hum. Cent. Comput. Inf. Sci. 2017, 7. [Google Scholar] [CrossRef] [Green Version]
- Karimi, H.A.; Jiang, M.; Zhu, R. Pedestrian navigation services: Challenges and current trends. Geomatica 2013, 67, 259–271. [Google Scholar] [CrossRef]
- Kang, B.; Moudon, A.V.; Hurvitz, P.M.; Saelens, B.E. Differences in behavior, time, location, and built environment between objectively measured utilitarian and recreational walking. Transp. Res. Part D Transp. Environ. 2017, 57, 185–194. [Google Scholar] [CrossRef]
- Fiorello, D.; Martino, A.; Zani, L.; Christidis, P.; Navajas-Cawood, E. Mobility Data across the EU 28 Member States: Results from an Extensive CAWI Survey. Transp. Res. Procedia 2016, 14, 1104–1113. [Google Scholar] [CrossRef] [Green Version]
Publisher’s Note: MDPI stays neutral with regard to jurisdictional claims in published maps and institutional affiliations. |
© 2021 by the authors. Licensee MDPI, Basel, Switzerland. This article is an open access article distributed under the terms and conditions of the Creative Commons Attribution (CC BY) license (https://creativecommons.org/licenses/by/4.0/).