
Geospatial Decision-Making Framework Based on the Concept of Satisficing


Abstract
1. Introduction
- Develop a decision-making model based on the concept of satisficing;
- Design a visualization framework that incorporates visualization units and interaction paths compatible with the model;
- Create a fully functional decision support tool that integrates the decision-making model and the visualization framework.
2. Related Work
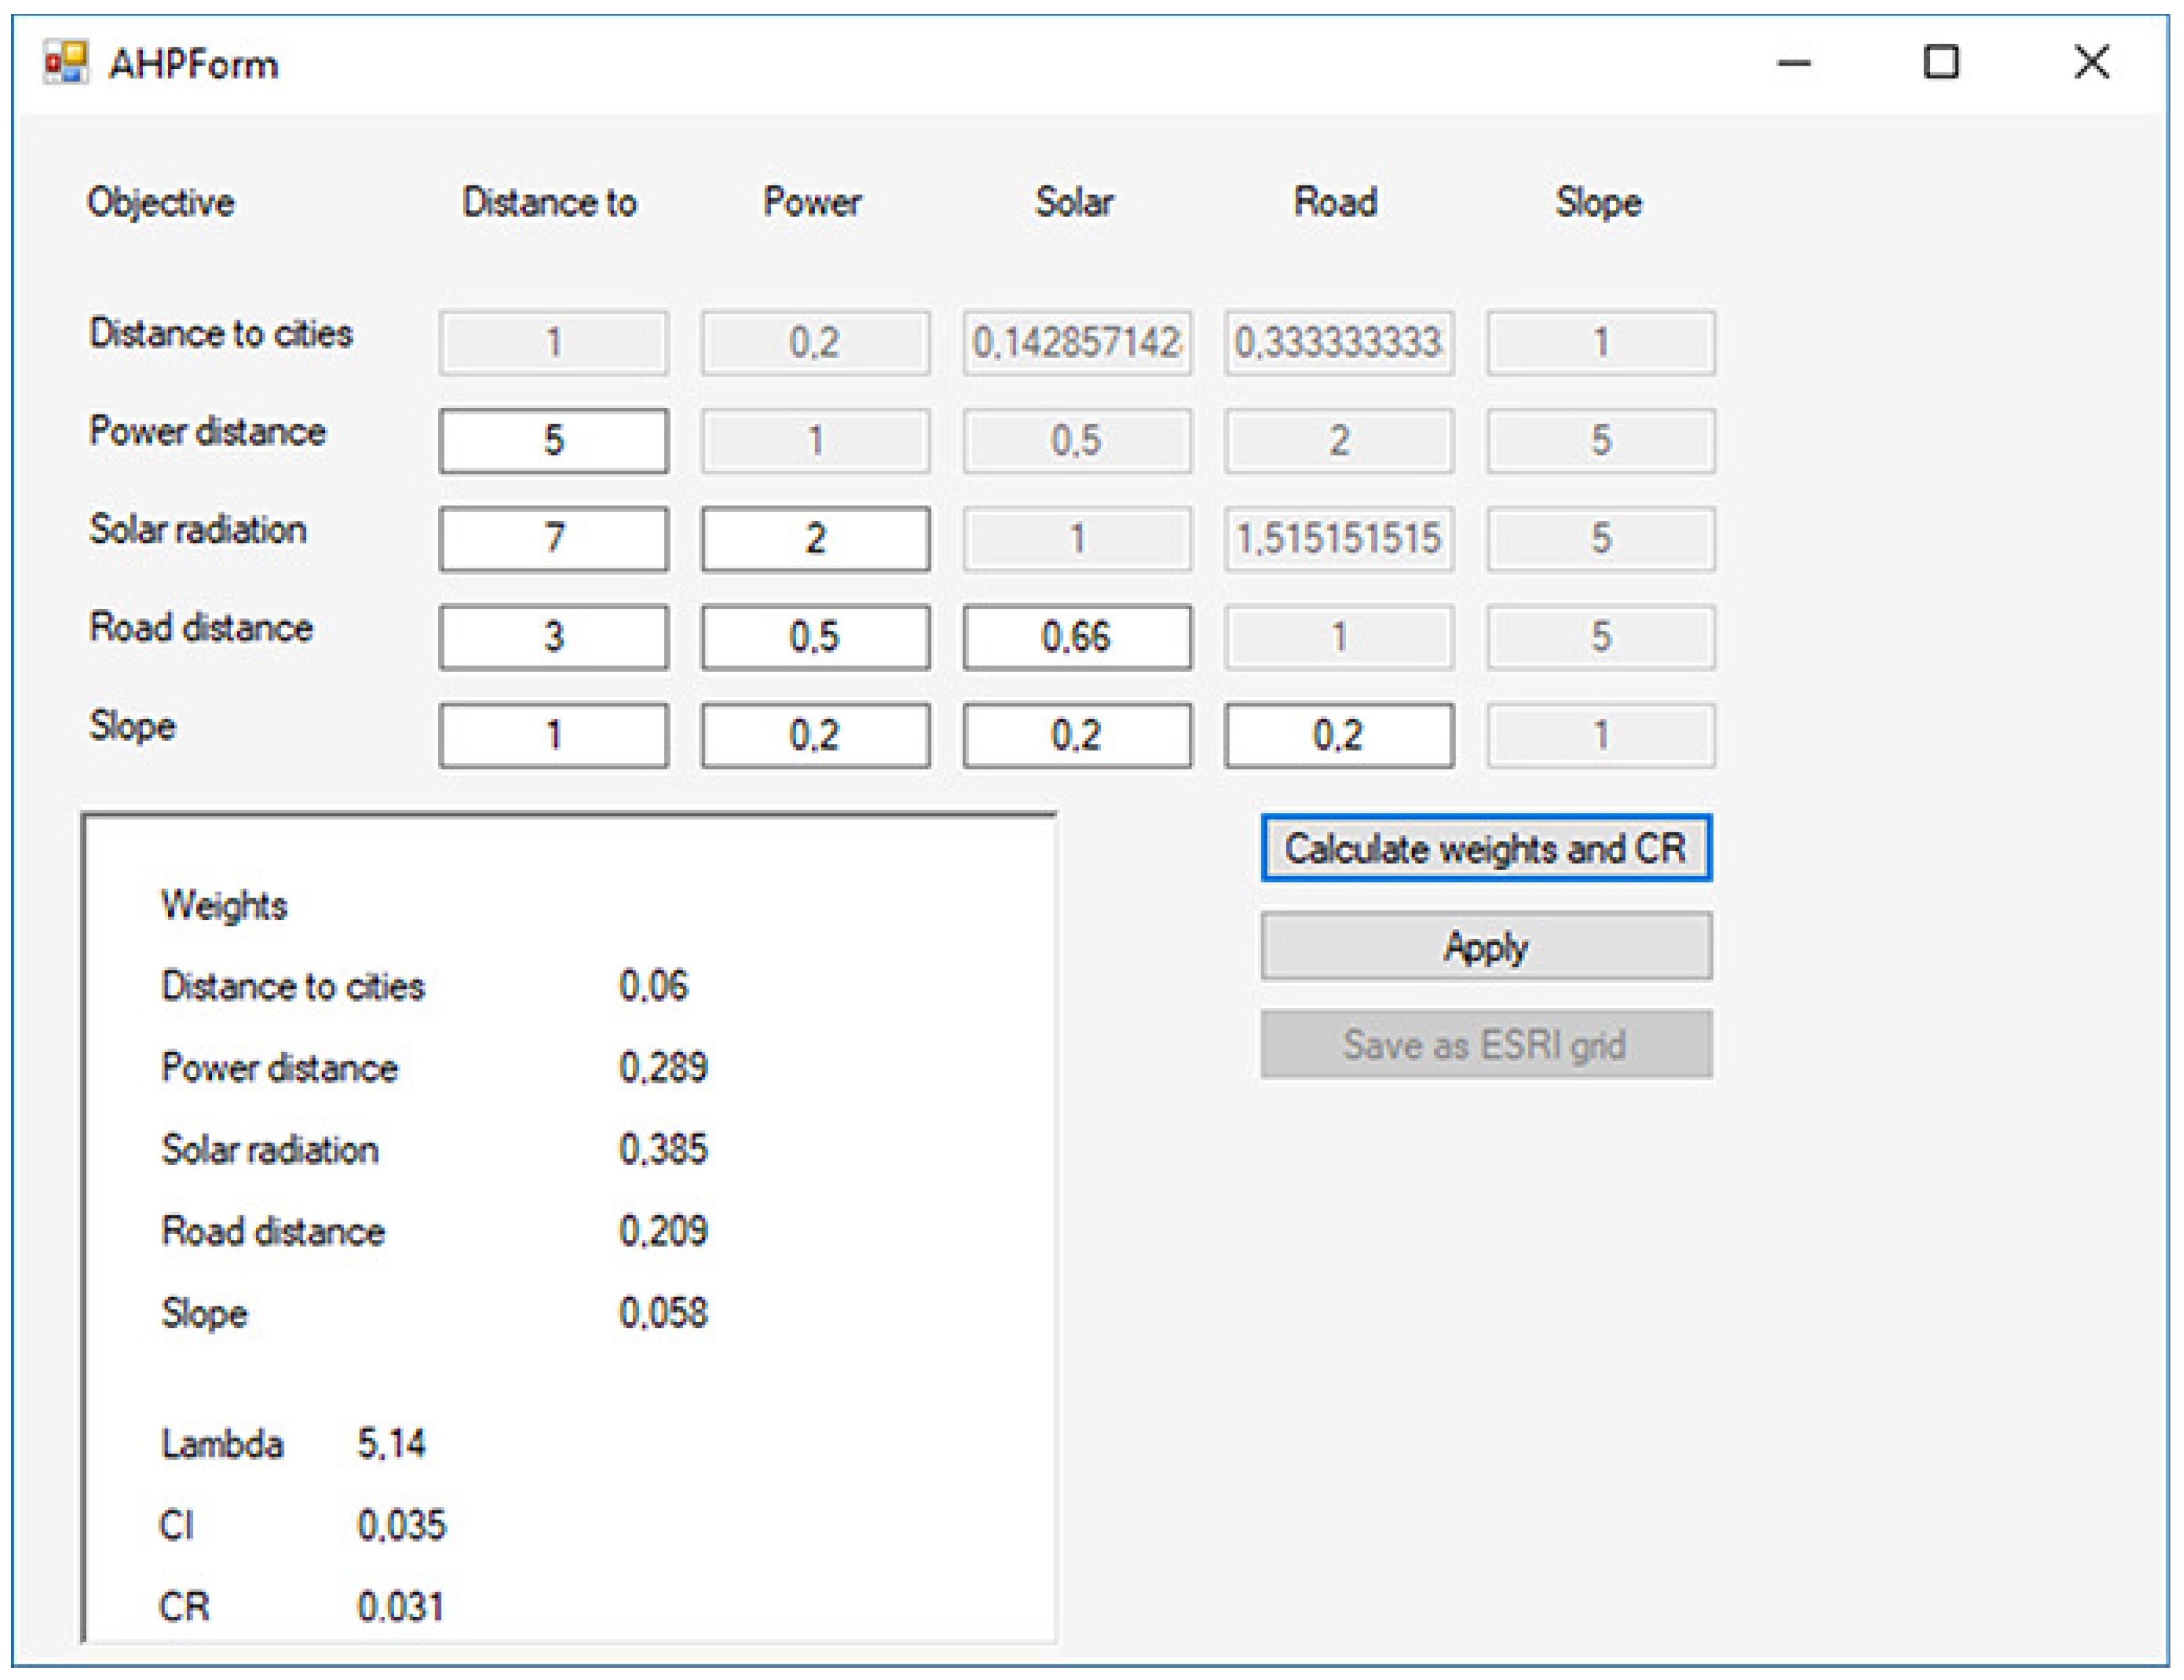
2.1. MADM Methods
- Preparing criteria maps;
- Generating alternatives;
- Deciding relative importance of criteria;
- Creating the overall utility layer.
2.2. Bounded Rationality and the Satisficing Model
- Recognition principle: If only one of the two objects (alternatives) is recognized, choose that object. If neither of the two objects are recognized, make a random choice. Otherwise, proceed to step two;
- Search for cue values: Retrieve from memory the cue values for the highest ranking cue (criterion);
- Discrimination rule: Decide whether the cue discriminates between the alternatives;
- Cue-substitution principle: If the cue discriminates, stop search. Otherwise, go back to step 2 and continue with the next cue;
- Maximizing rule: Choose the object with the positive cue value, or choose randomly if no cue discriminates.
2.3. Interactive Visualization in Decision Making
2.4. Interactive Visualization in GIS Decision Support Systems
3. Method
3.1. ESRDS Decision-Making Model
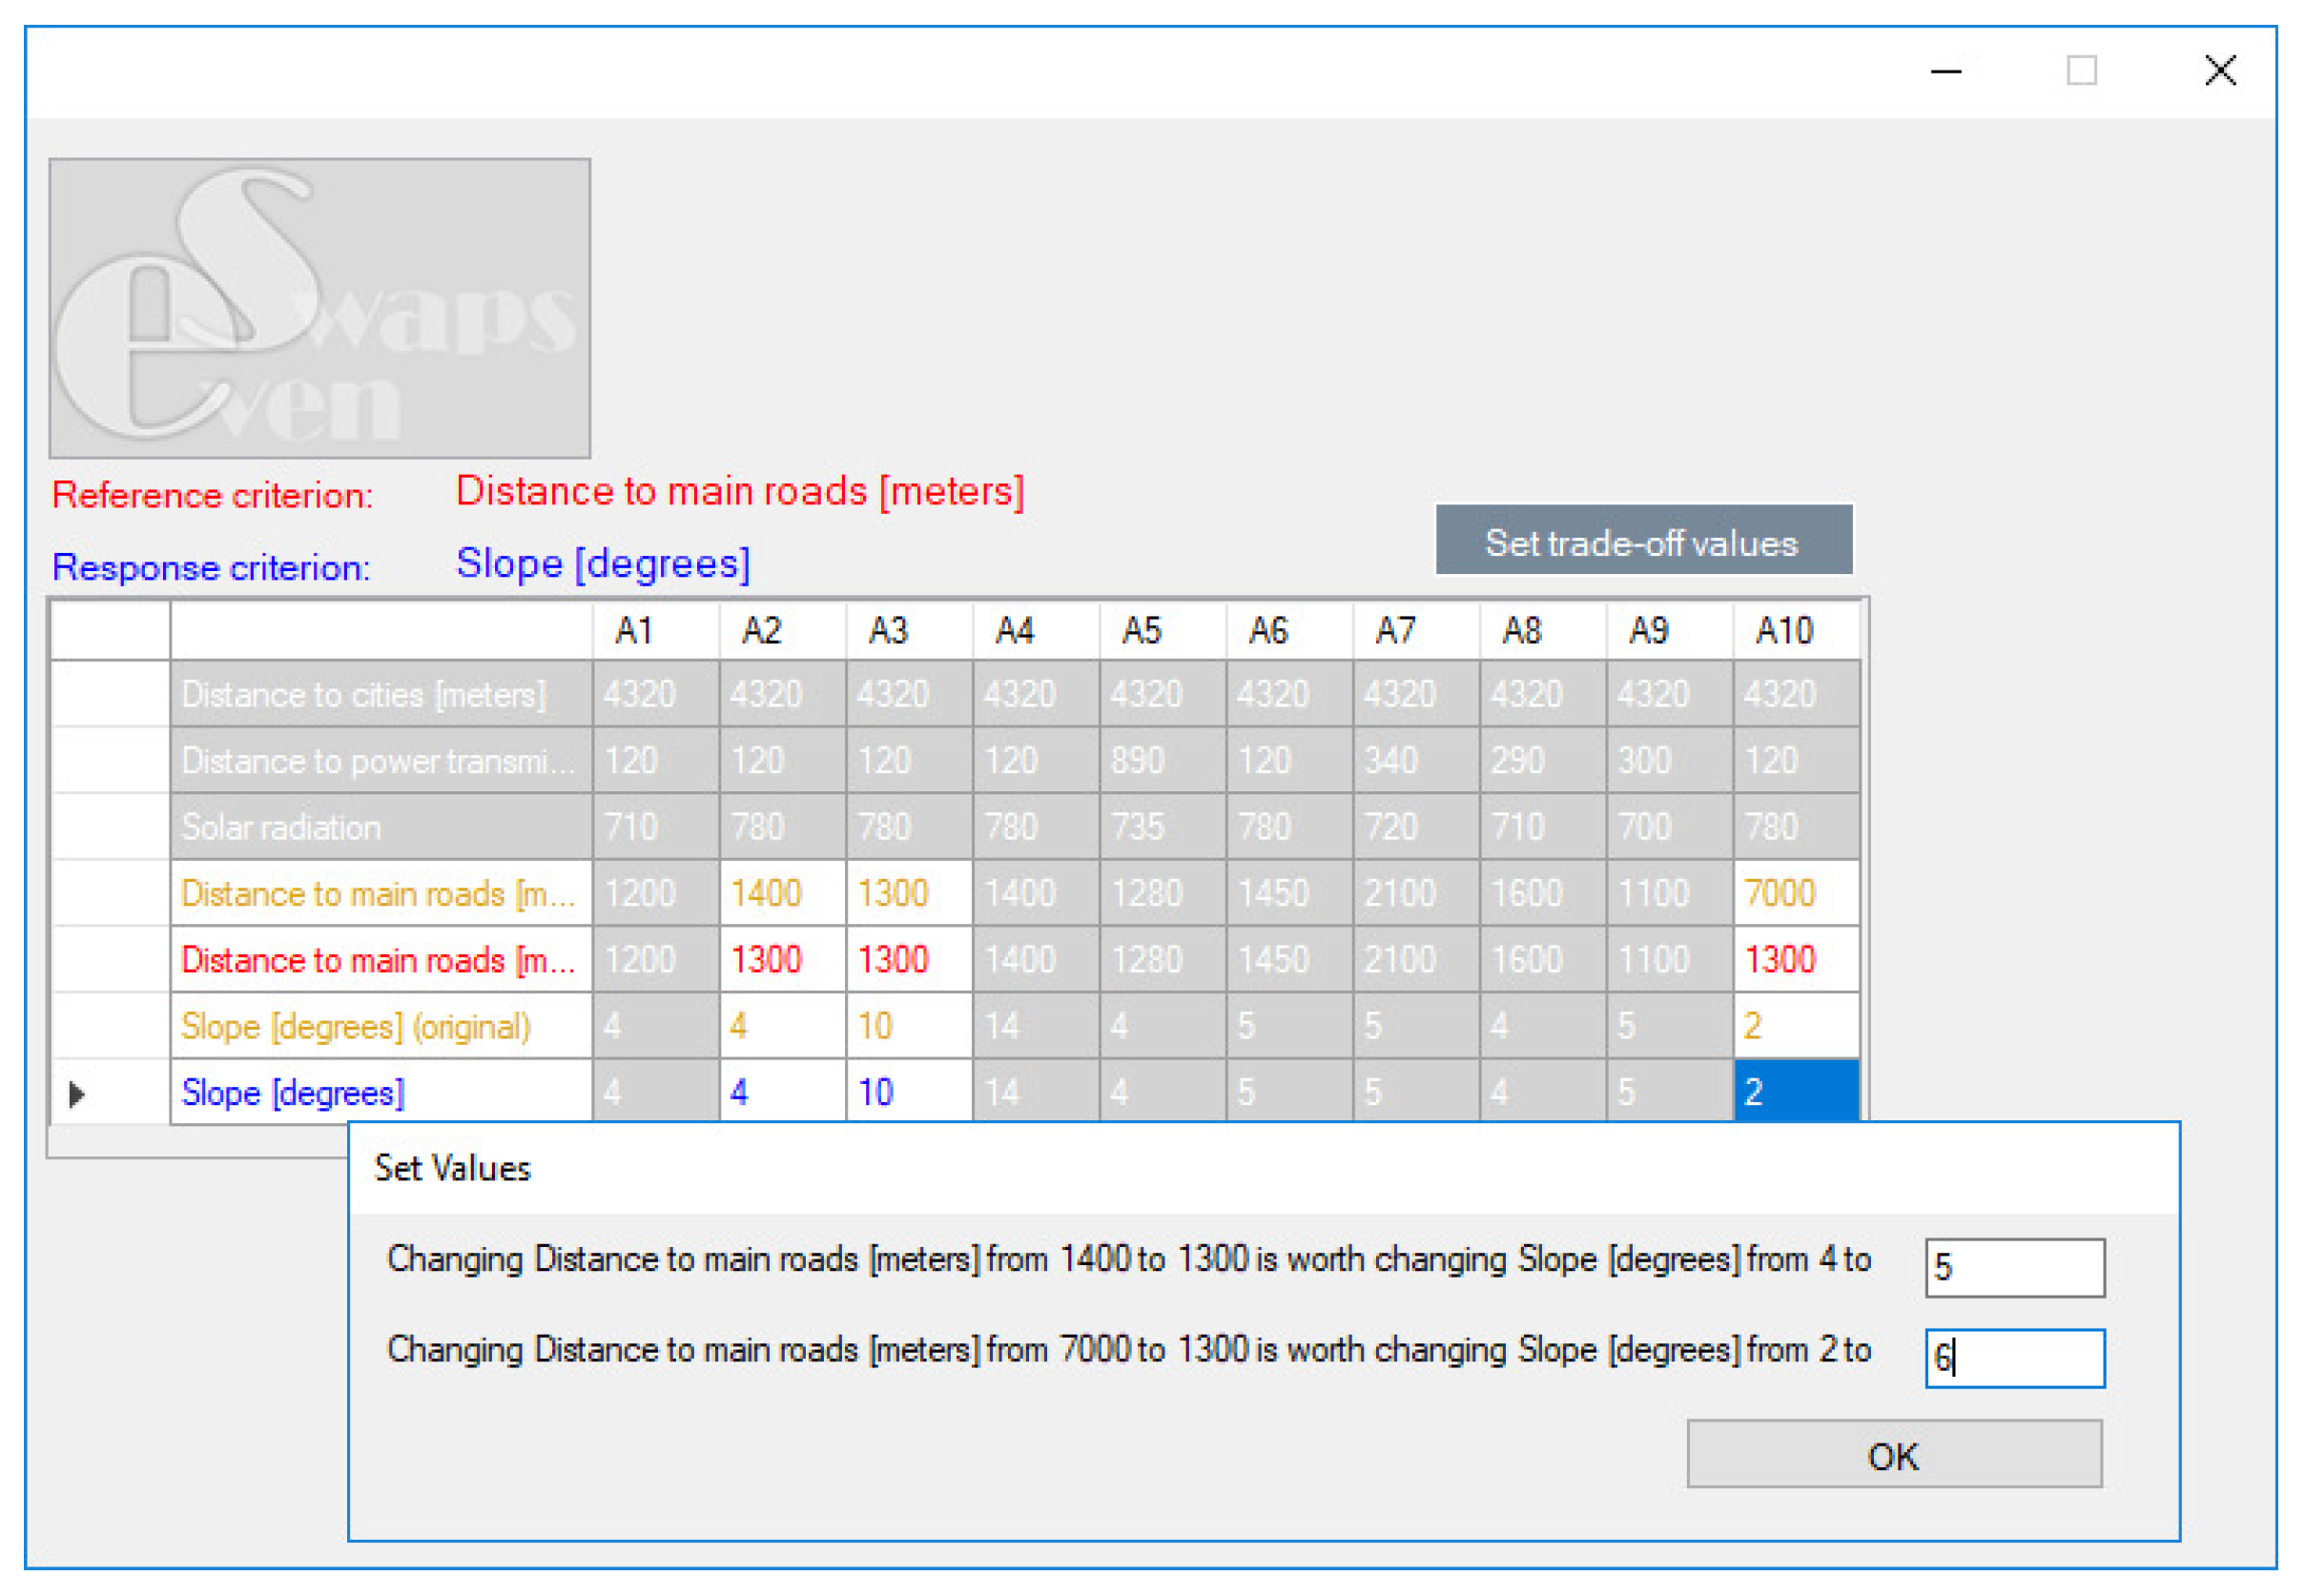
- Determine the change necessary to cancel out criterion R;
- Assess what adjustments need to be done in another criterion, M, in order to compensate for the needed change;
- Make even swap. An even swap is a process of increasing the value of an alternative in terms of one criterion and decreasing the value by an equivalent amount in terms of another. After the swaps are performed over the whole range of alternatives, all alternatives will have the same value on R and it can be cancelled out as irrelevant in the process of ranking the alternatives;
- Cancel out the now-irrelevant criterion R;
- Eliminate the dominated alternative(s).
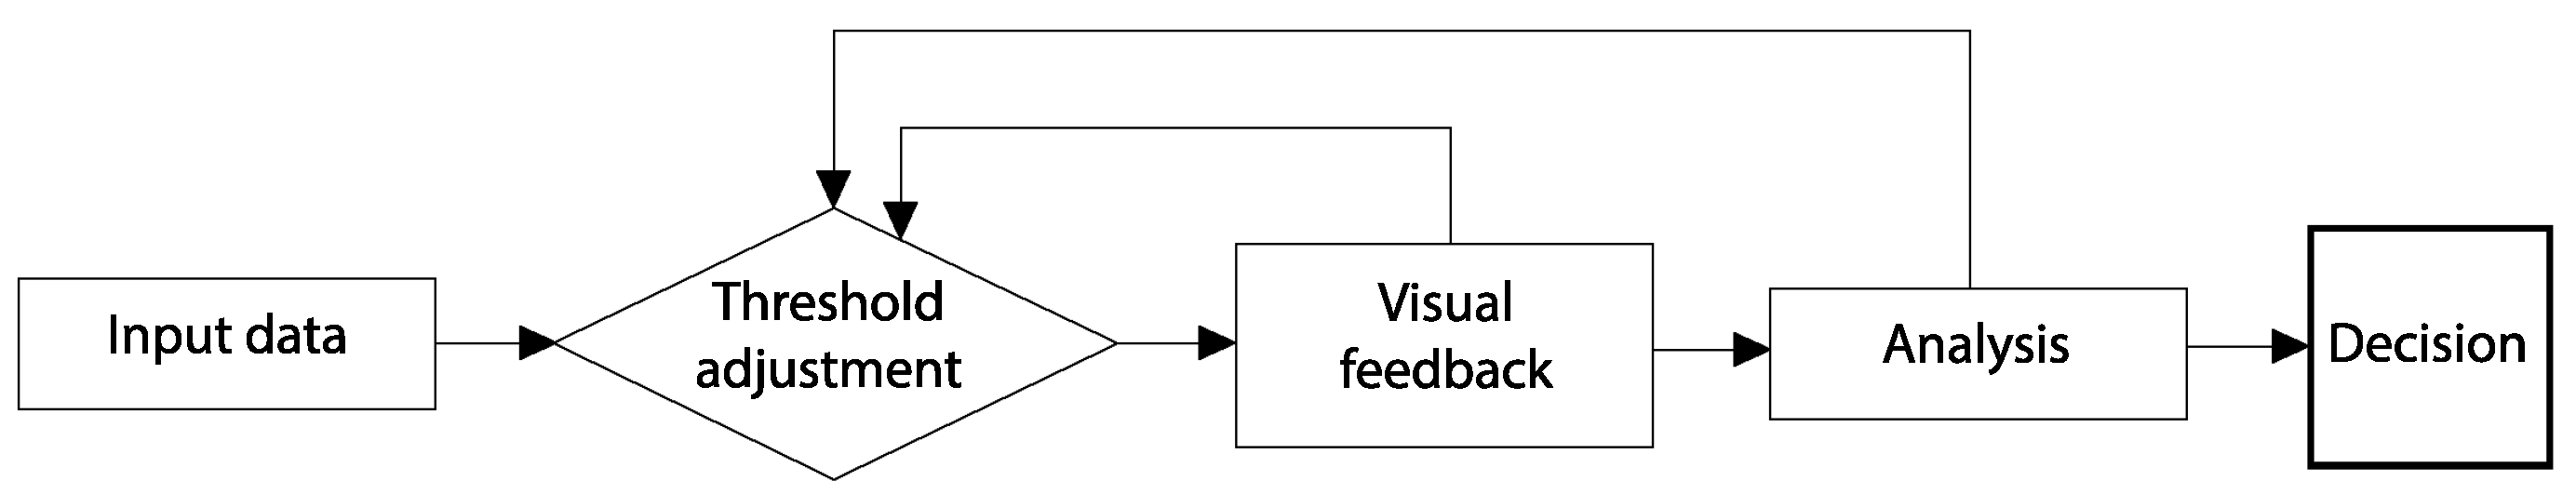
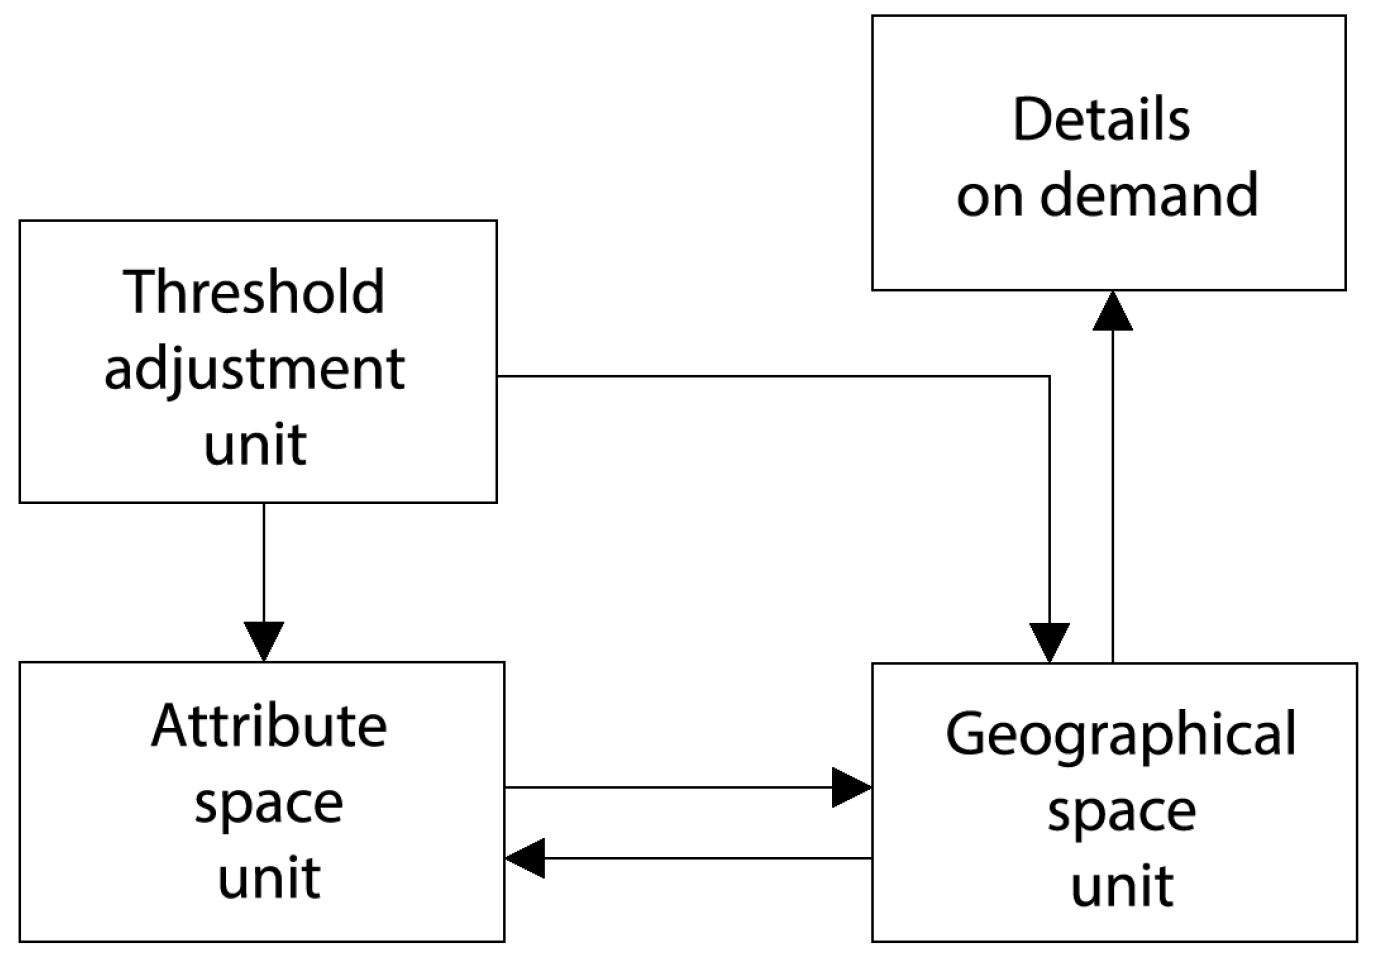
3.2. Visualization Framework
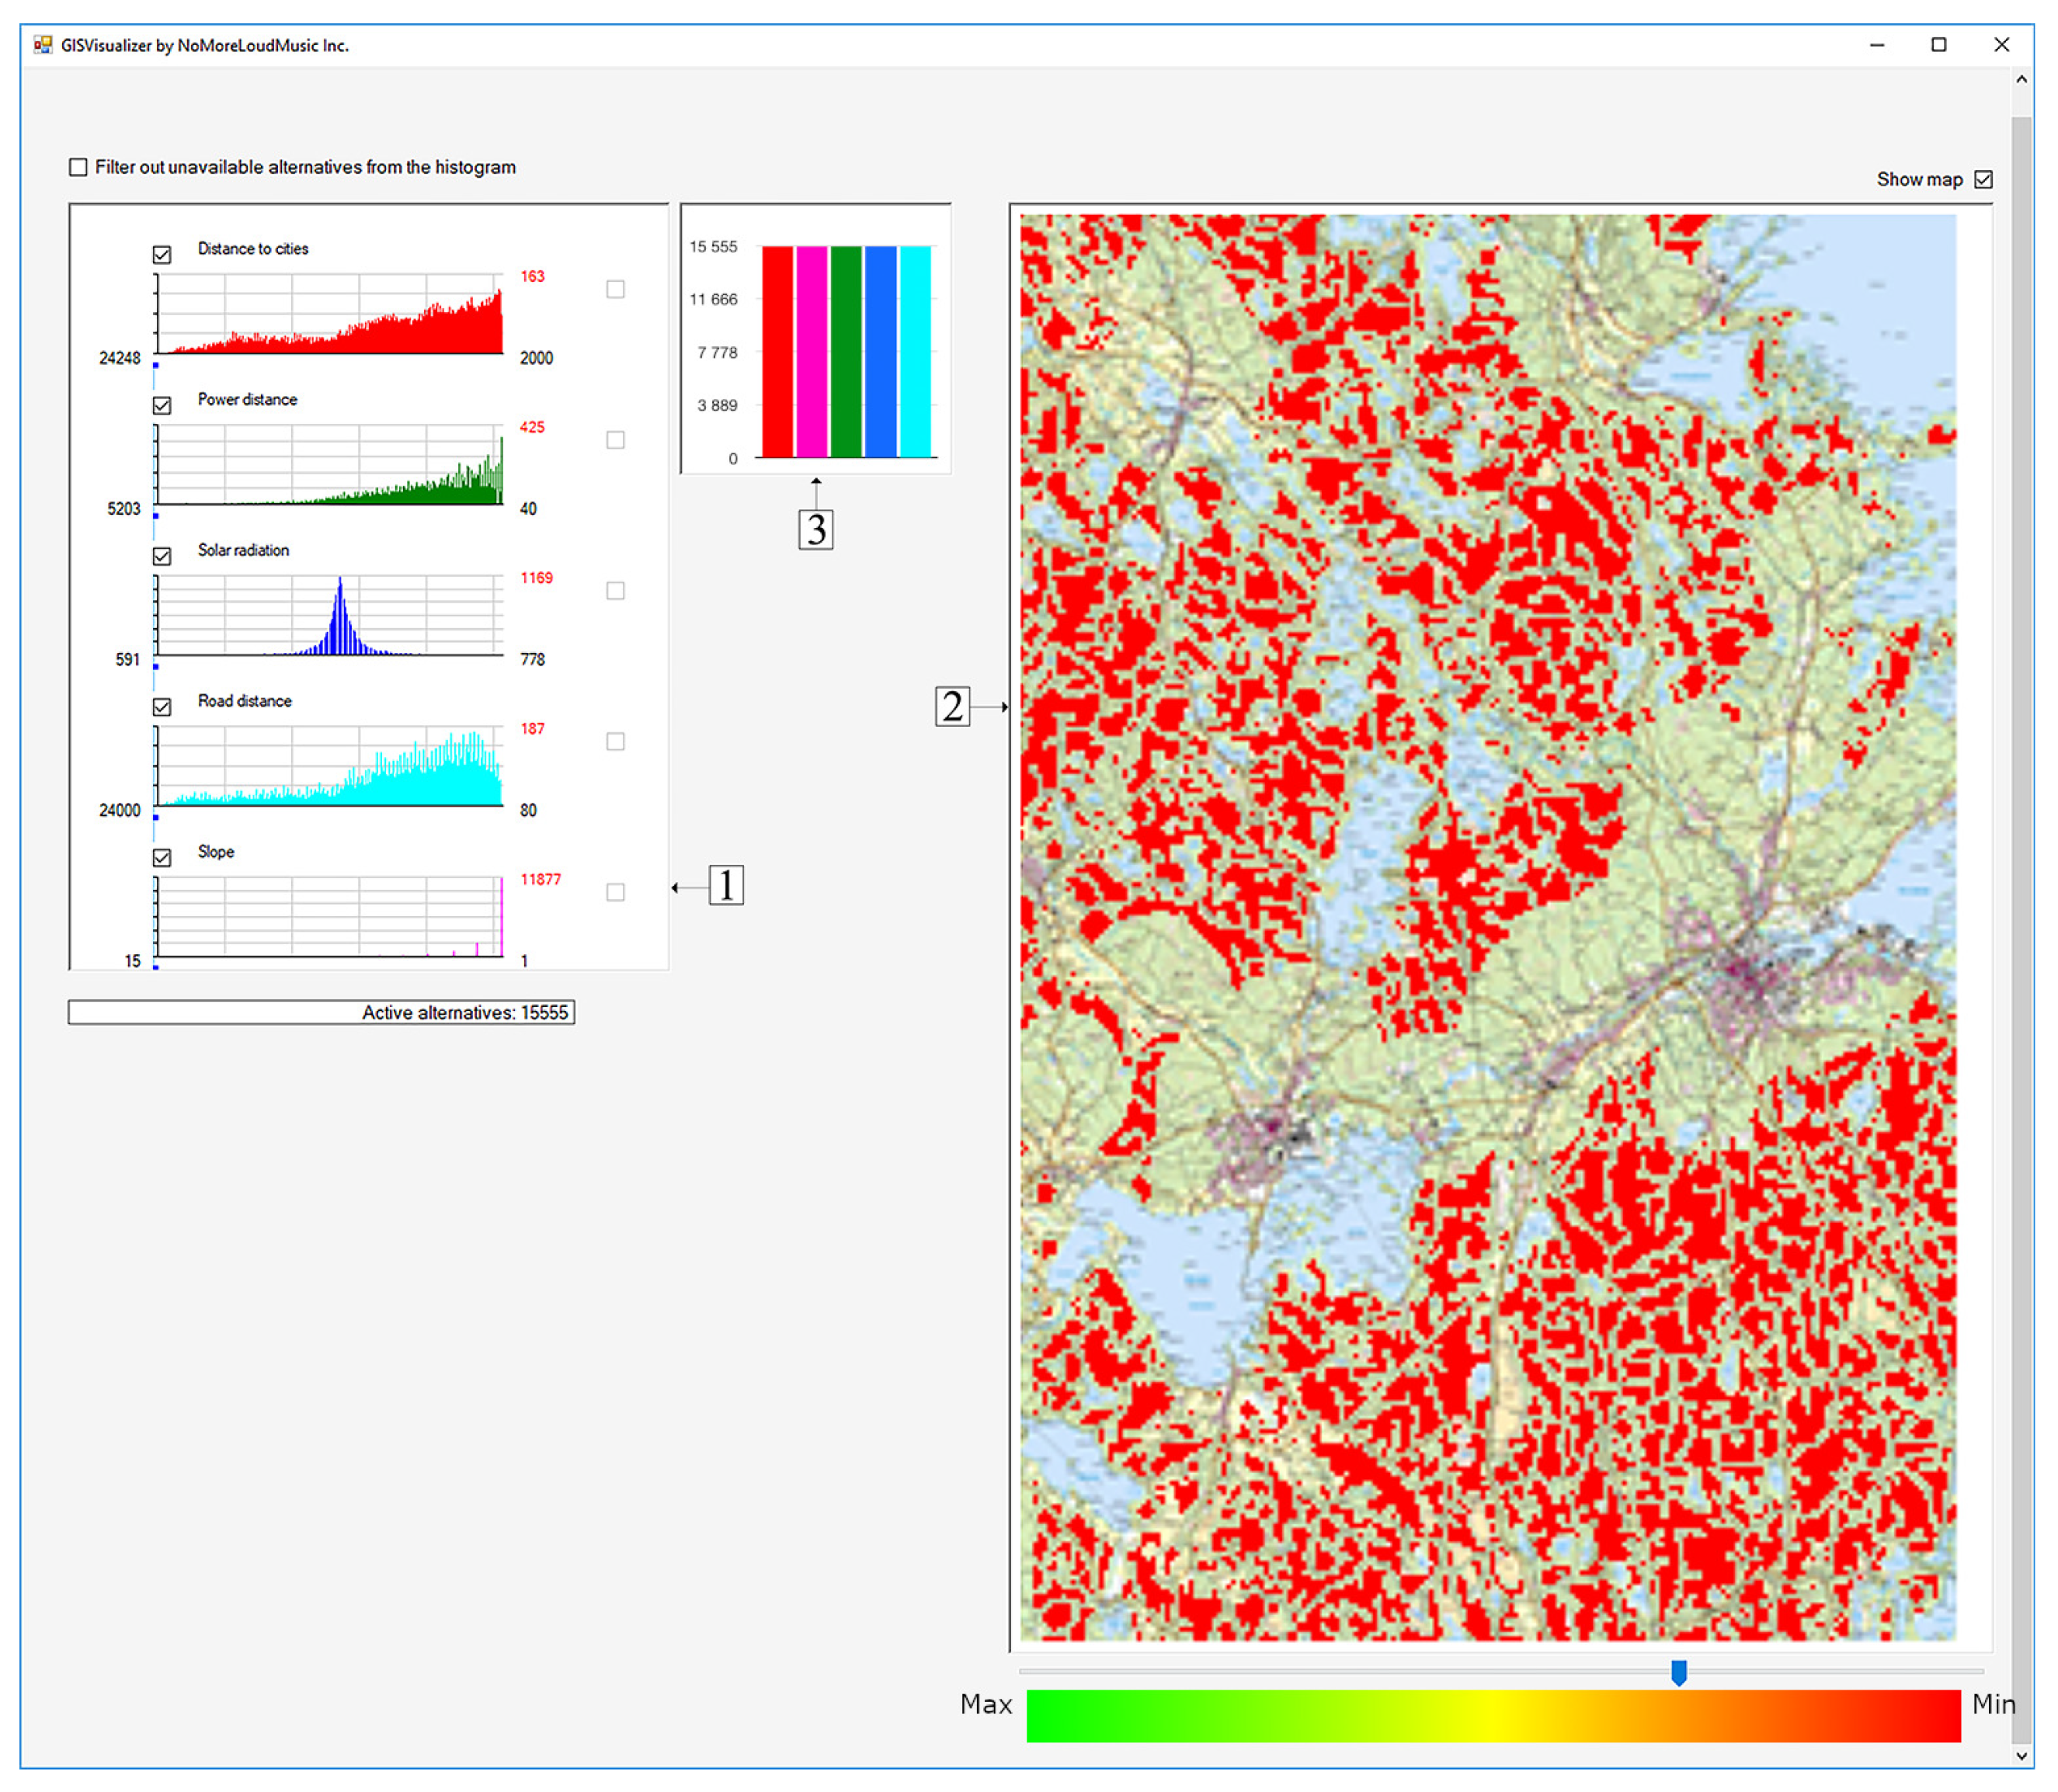
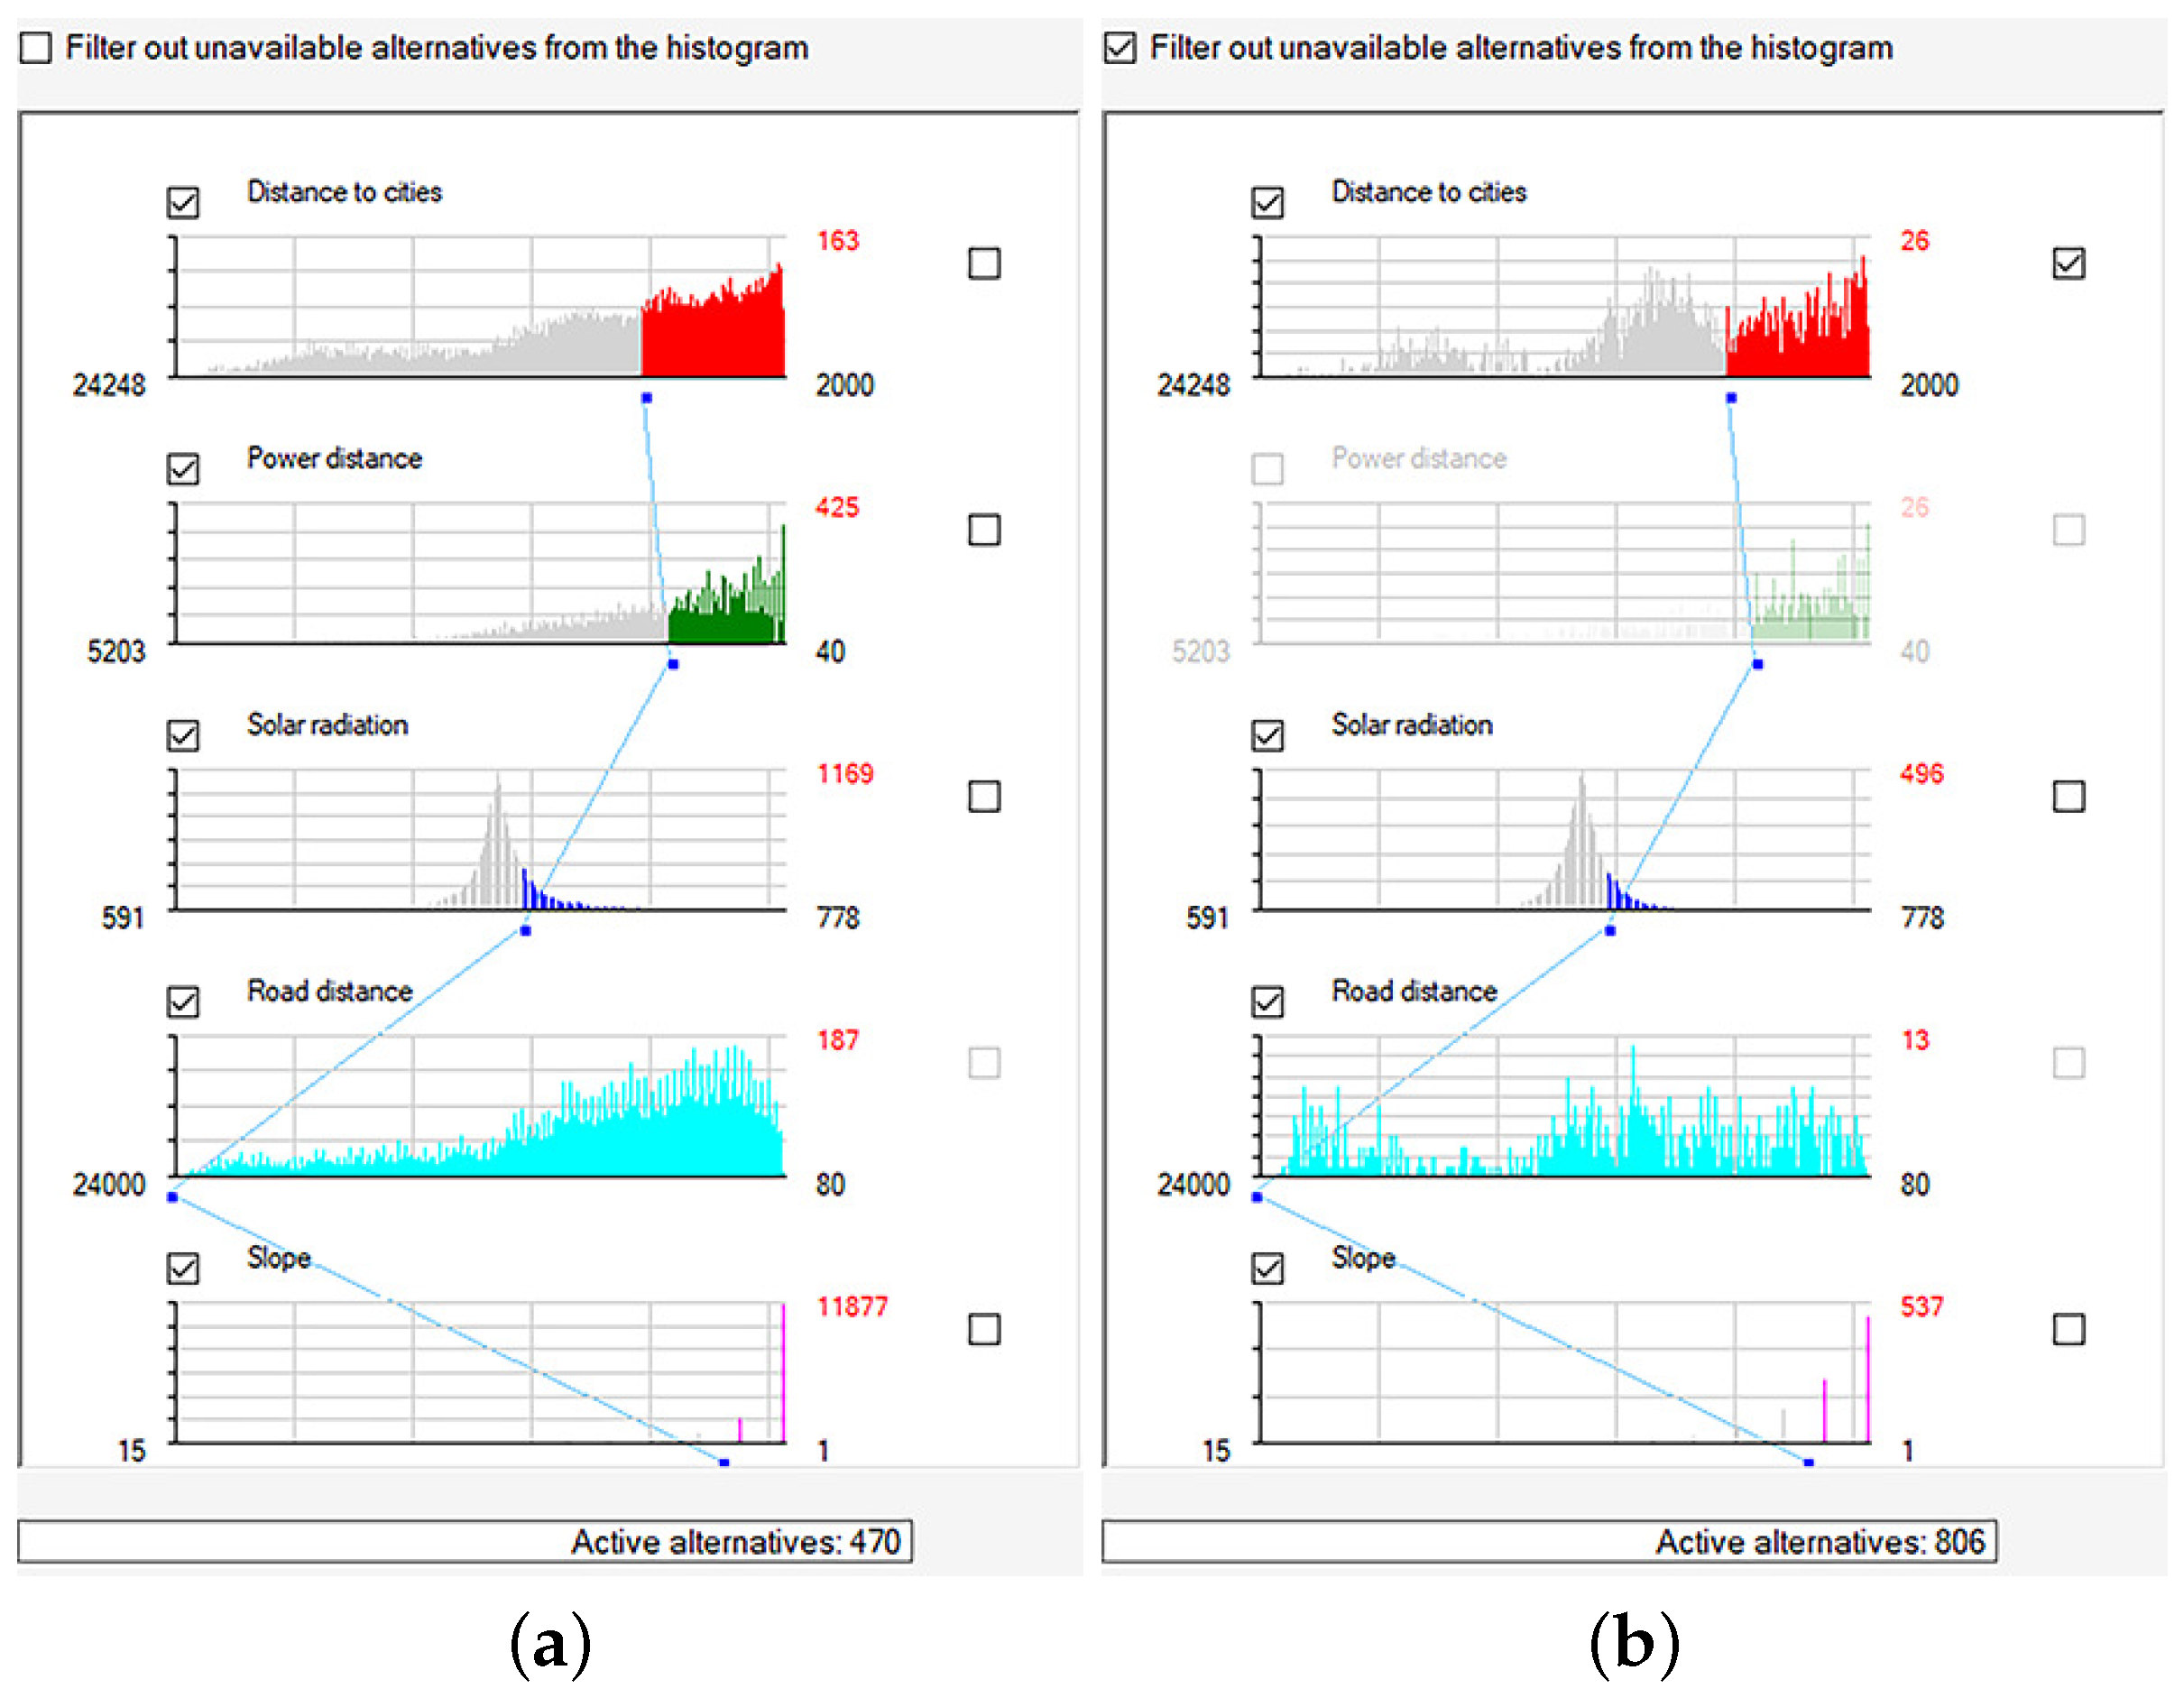
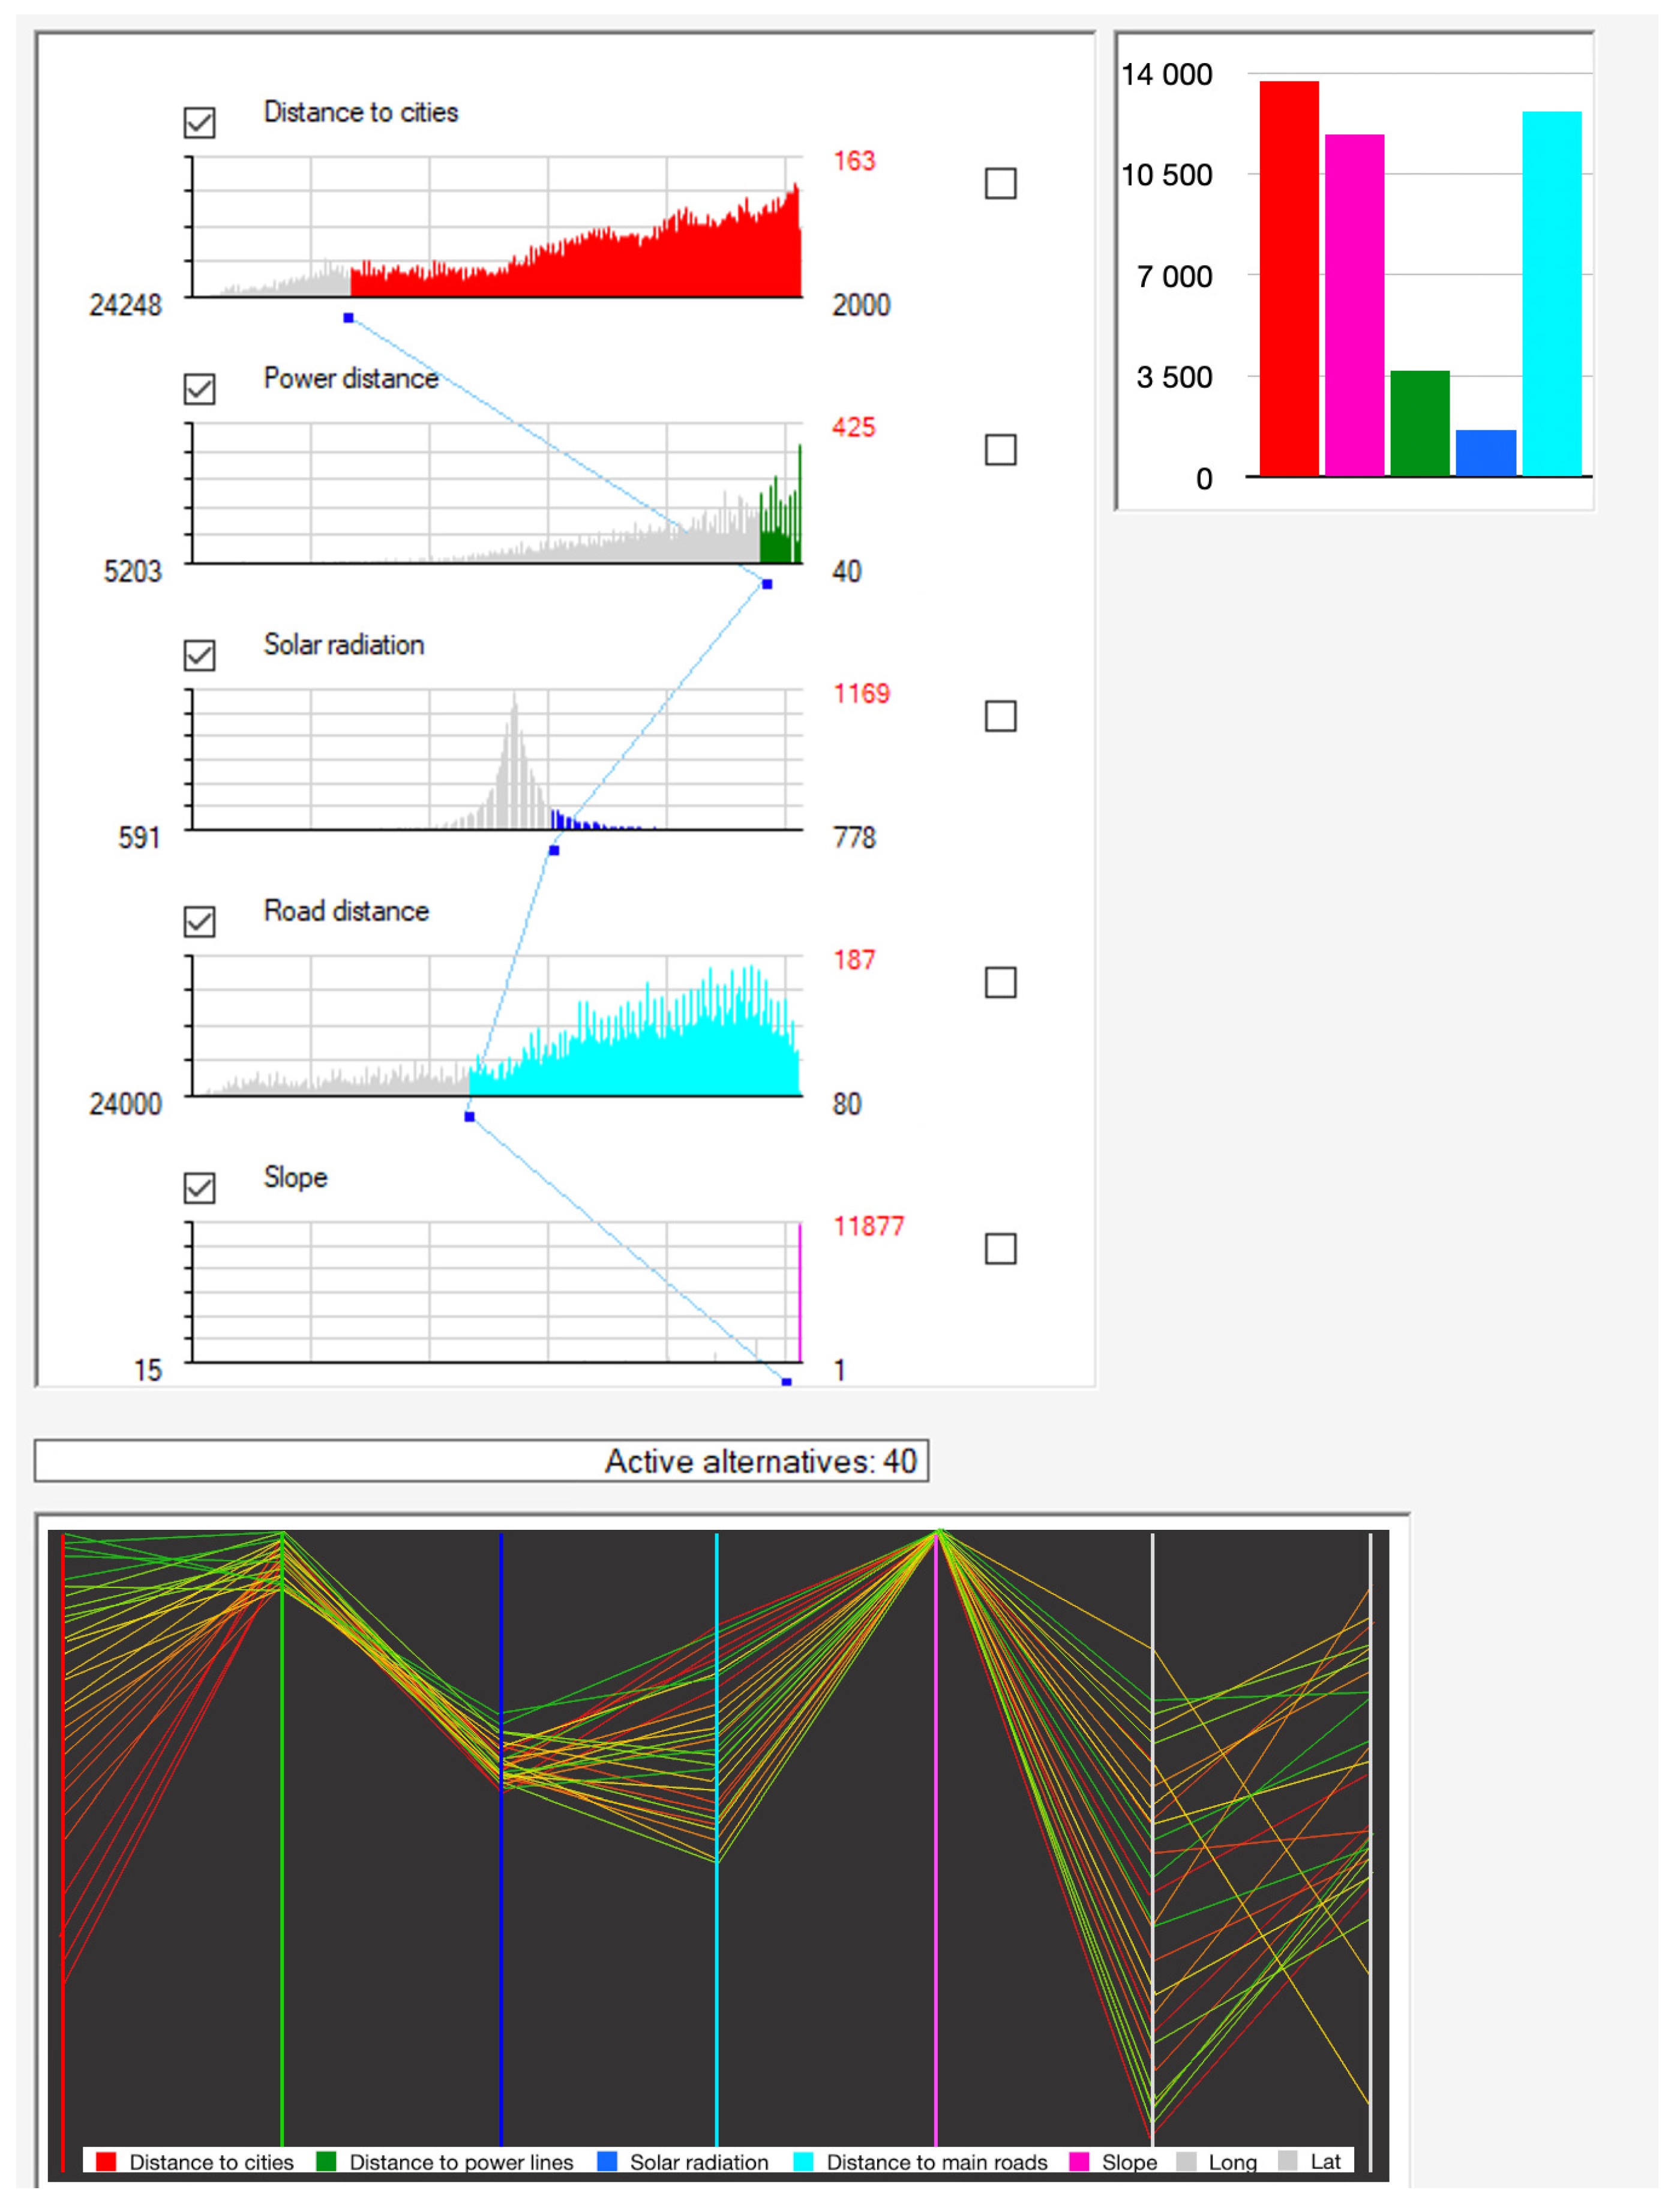
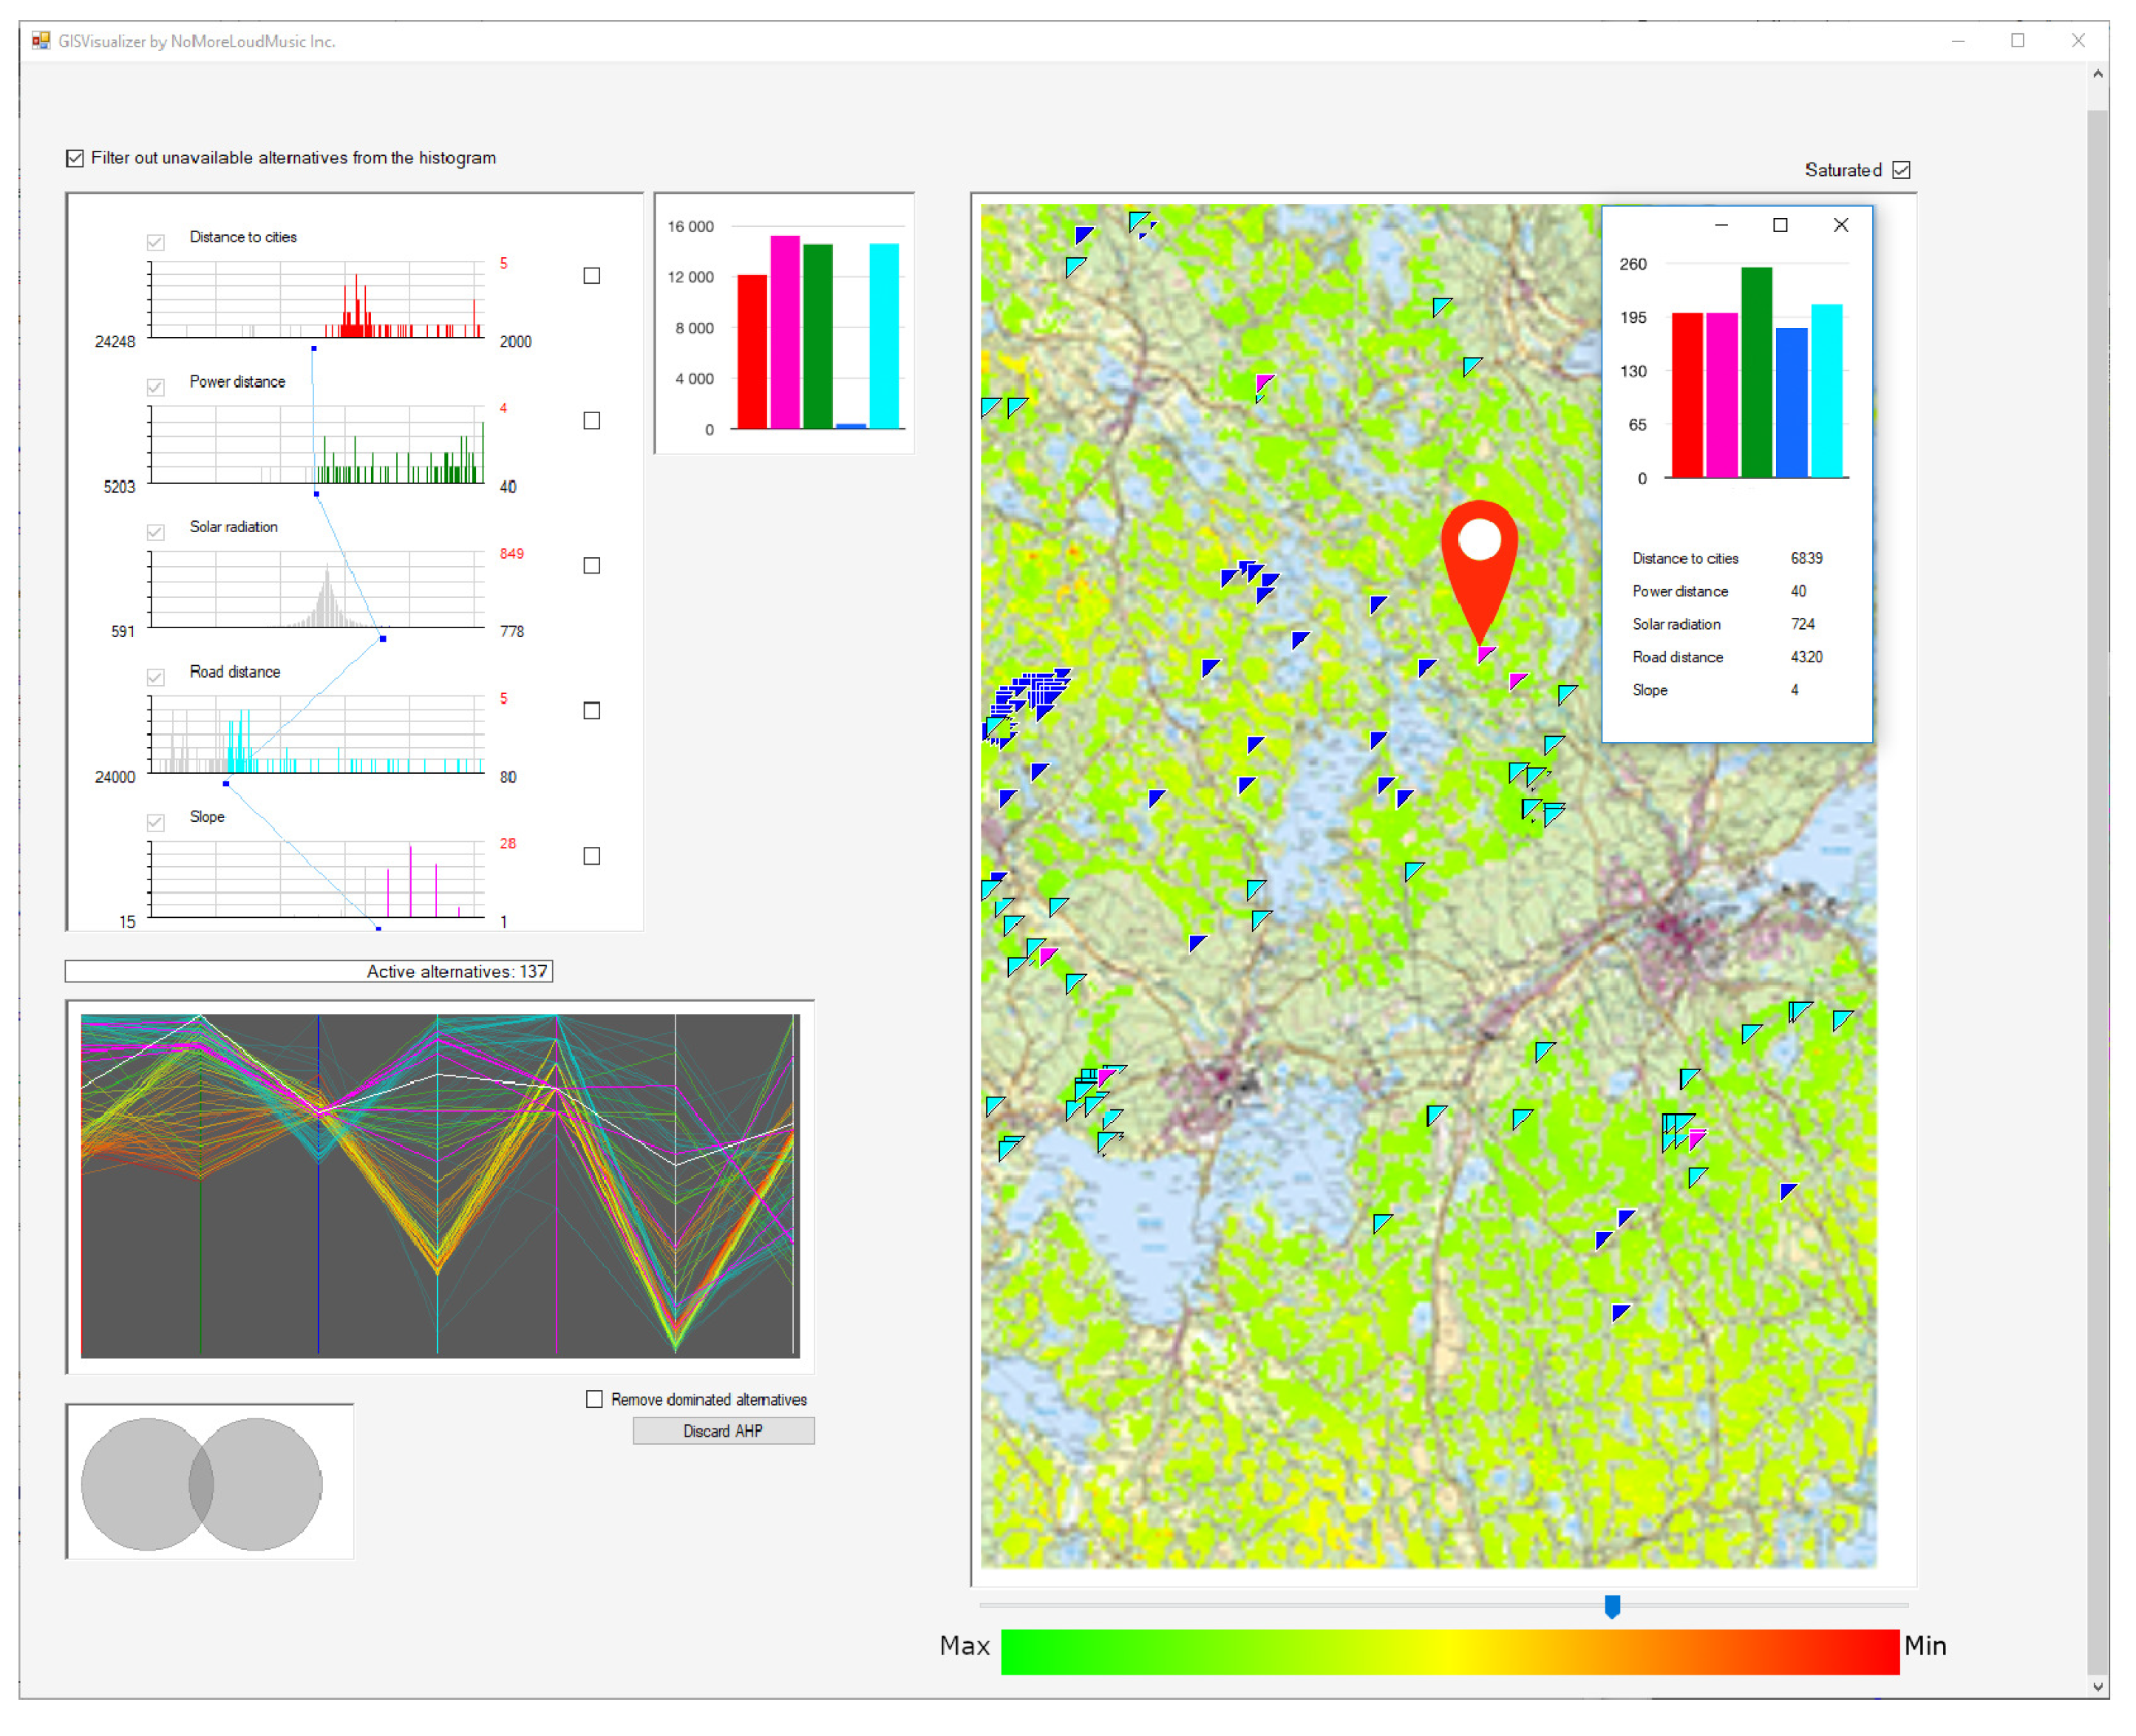
- Threshold adjustment unit. This is the core interaction unit, in which the user adjusts threshold values for the criteria. The direct result of an adjustment is shown for the adjusted criterion and every other criterion, if affected. The unit panel contains sliders for threshold adjustments for each of the criteria. For each criterion, a histogram is provided that shows the distribution of the values in terms of that particular criterion;
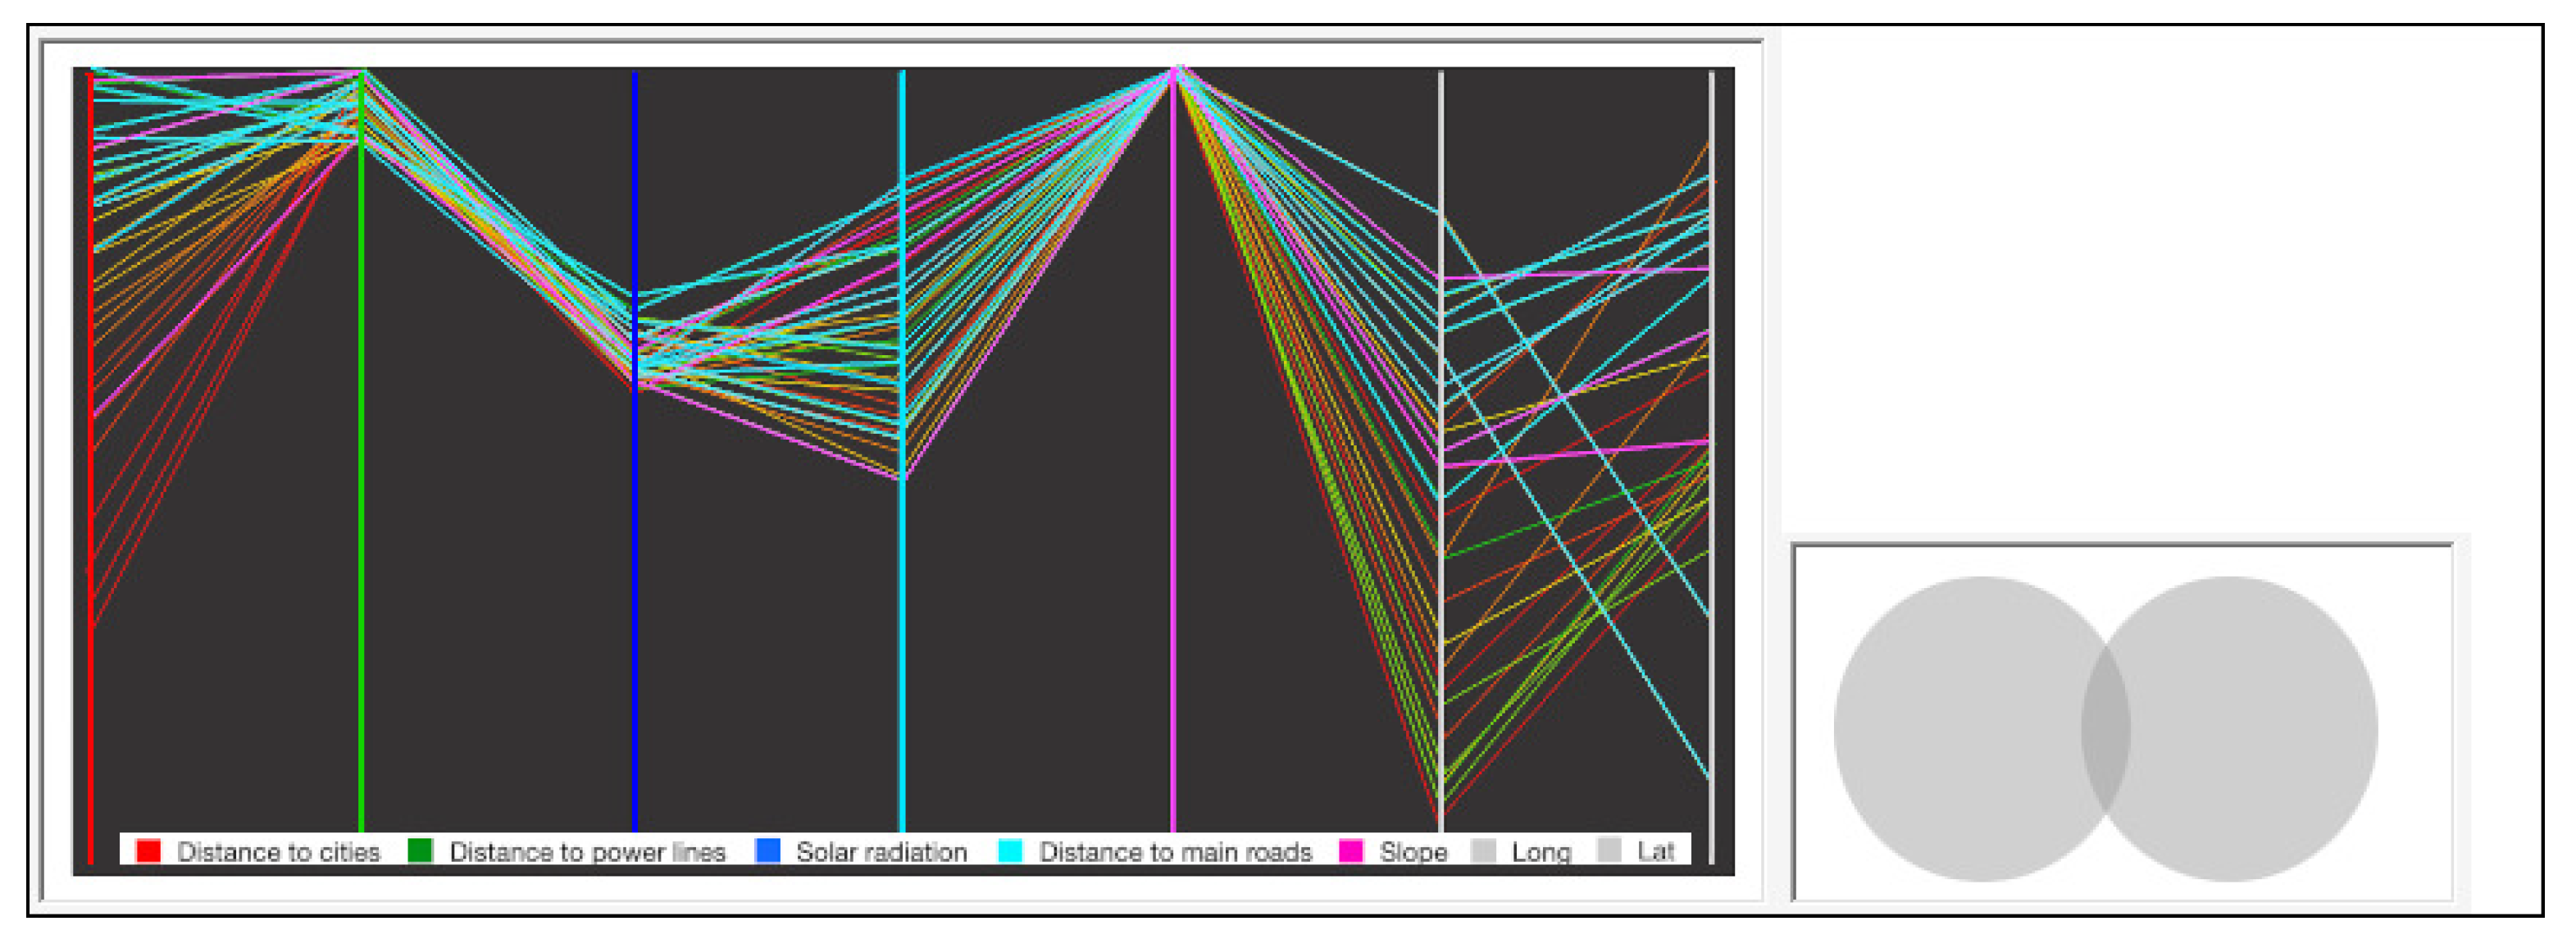
- Attribute space analysis unit. This panel is shown when the set of acceptable alternatives is reduced to a manageable level. A parallel coordinates plot is used to visualize the relations between the remaining acceptable alternatives in attribute space;
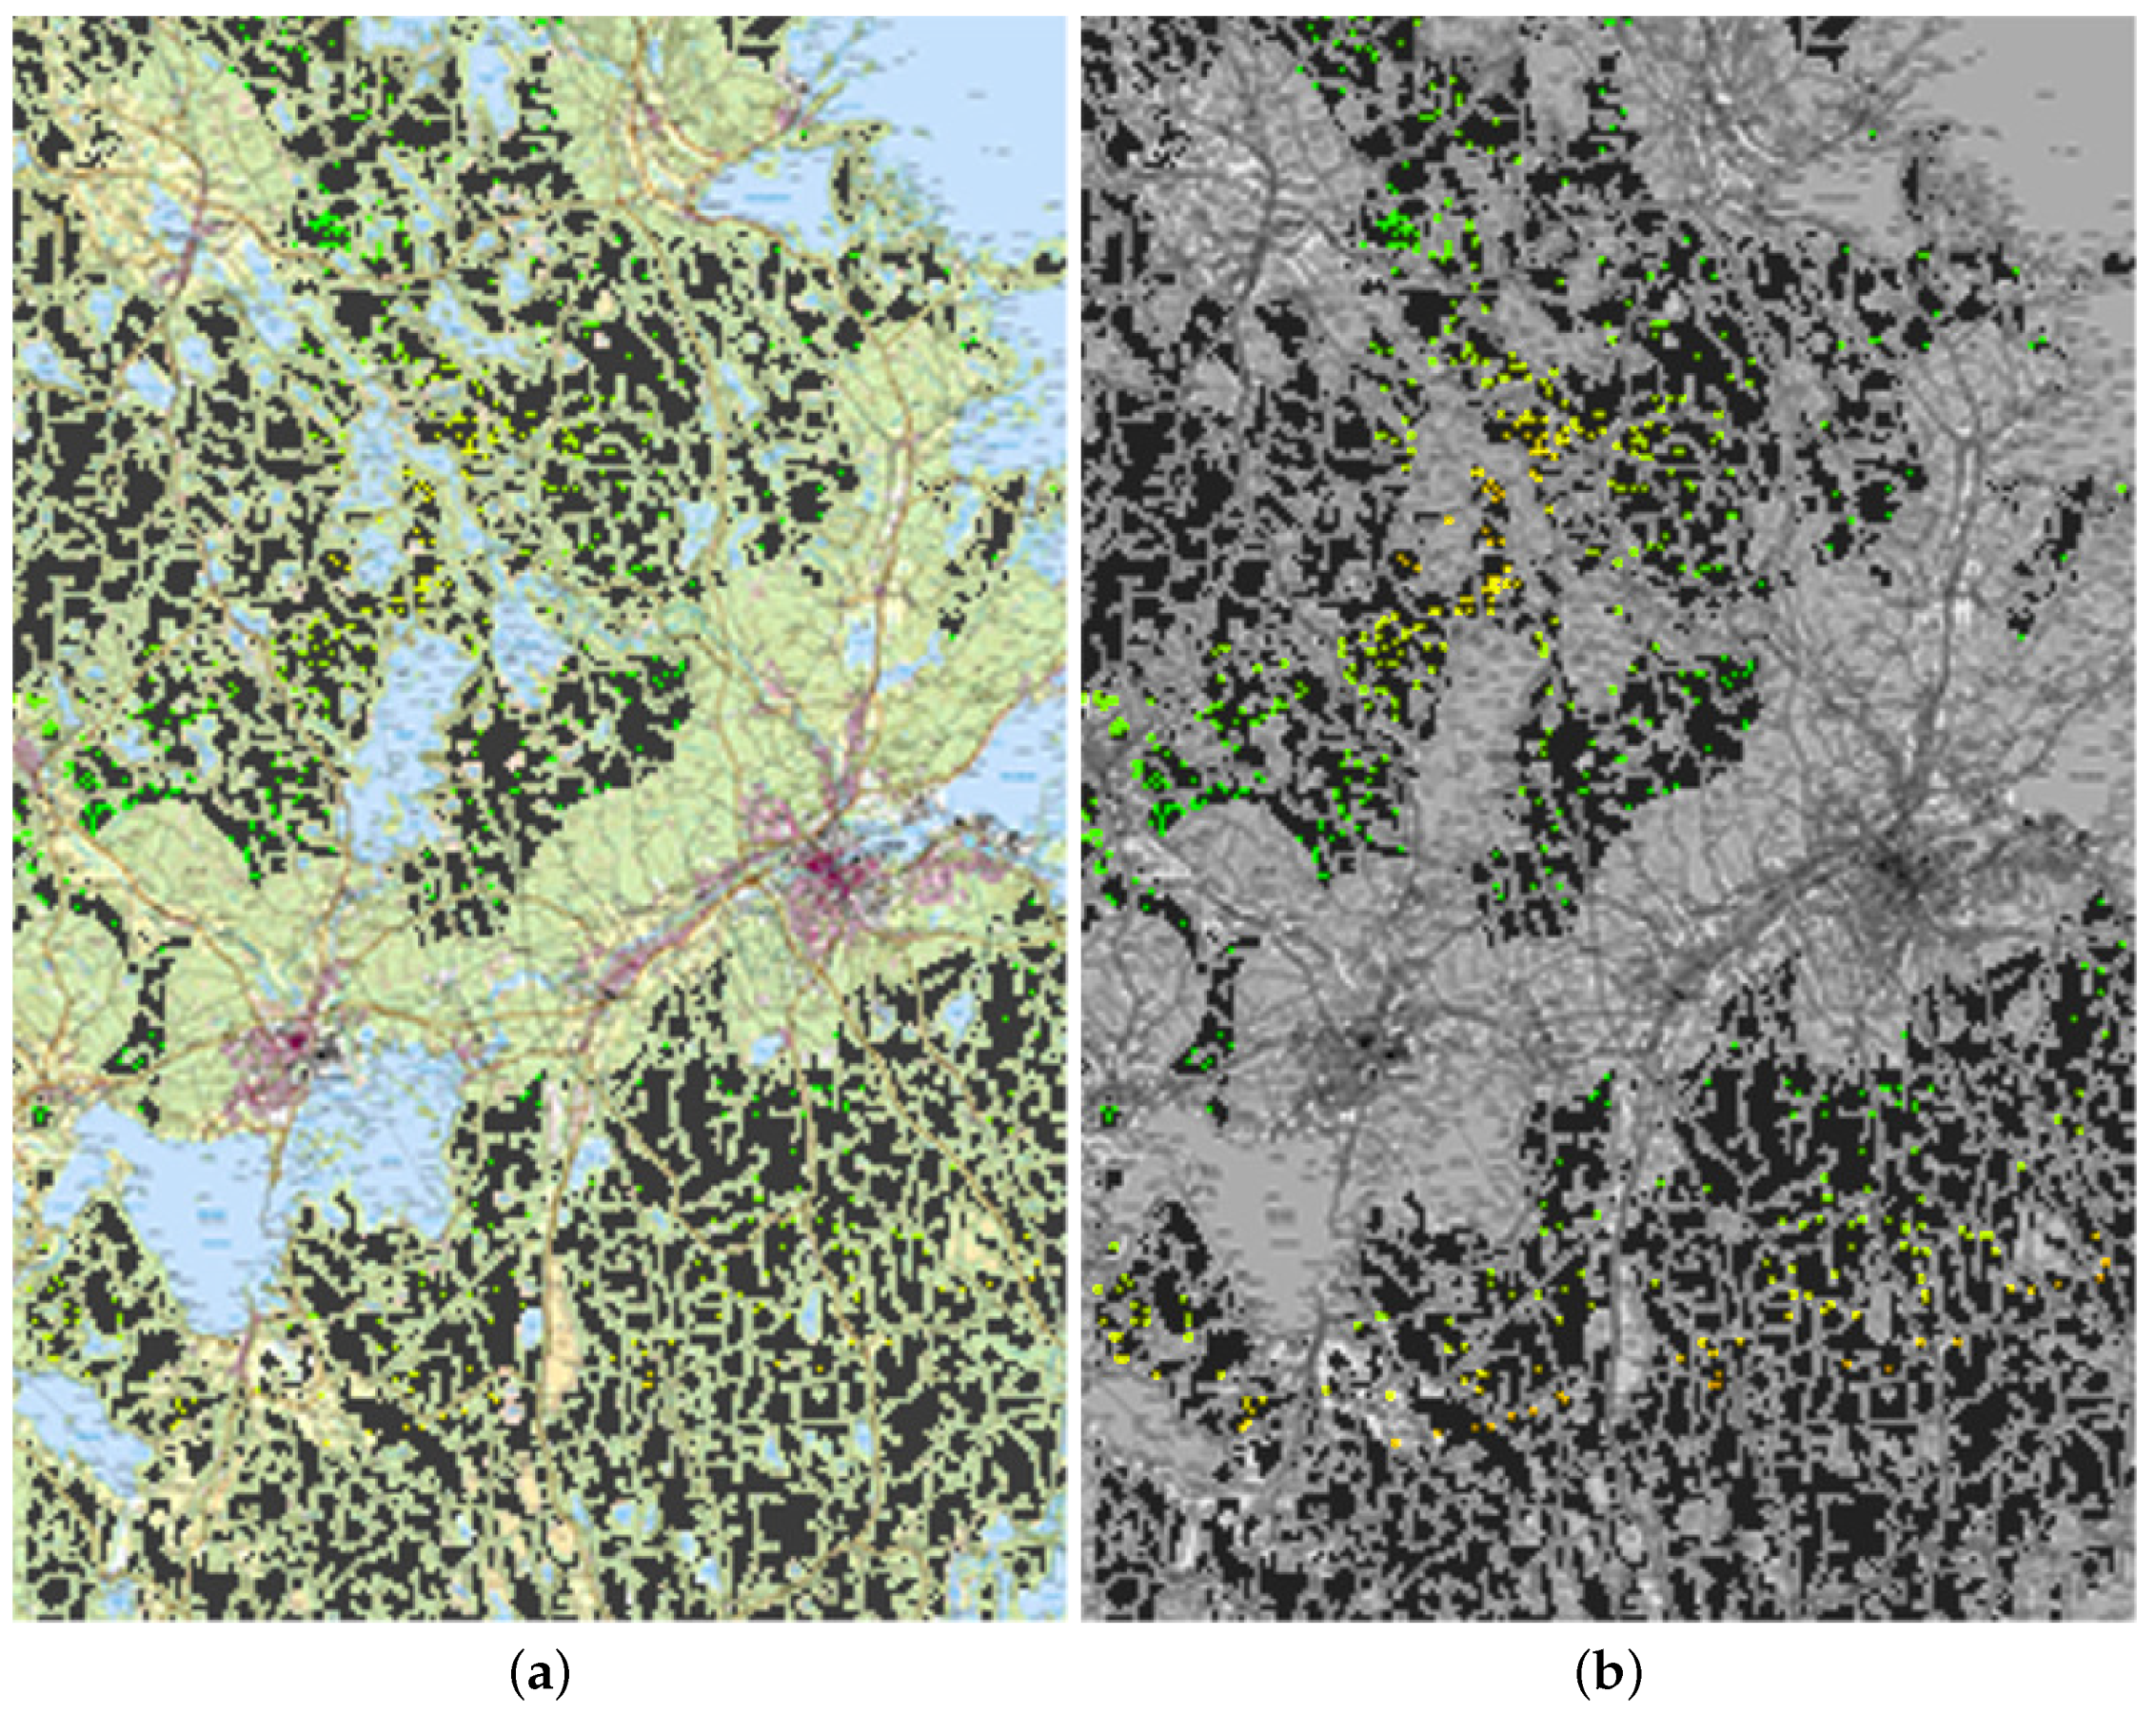
- Geographical space analysis unit. A geomap is used for visualization of the positions of the acceptable alternatives in geographical space;
4. Result
- : magenta;
- : cyan;
- : colour-coded from red to green based on the value of , where is the alternative represented by the polyline, n is the number of criteria, and is the value of in terms of the criterion .
5. Discussion and Conclusions
Author Contributions
Funding
Conflicts of Interest
References
- Malczewski, J.; Rinner, C. Multicriteria Decision Analysis in Geographic Information Science; Springer Science + Business Media: Berlin/Heidelberg, Germany, 2015. [Google Scholar]
- Zavadskas, E.K.; Turskis, Z.; Kildienė, S. State of art surveys of overviews on MCDM/MADM methods. Technol. Econ. Dev. Econ. 2014, 20, 165–179. [Google Scholar] [CrossRef]
- Milutinovic, G.; Ahonen-Jonnarth, U.; Seipel, S. GISwaps—A New Method for Decision Making in Continuous Choice Models Based on Even Swaps. Int. J. Decis. Support Syst. Technol. 2018, 10, 57–78. [Google Scholar] [CrossRef]
- Milutinovic, G.; Seipel, S. Visual GISwaps—An Interactive Visualization Framework for Geospatial Decision Making. In Proceedings of the 13th International Joint Conference on Computer Vision, Imaging and Computer Graphics Theory and Applications, Madeira, Portugal, 27–29 January 2018; SCITEPRESS: Setubal, Portugal, 2018; Volume III, pp. 236–243. [Google Scholar]
- Andrienko, N.; Andrienko, G. Informed spatial decisions through coordinated views. Inf. Vis. 2003, 2, 270–285. [Google Scholar] [CrossRef]
- Simon, H.A. New Science of Management Decision; Harper: New York, NY, USA, 1960. [Google Scholar]
- Simon, H.A. Behavioral Model of Rational Choice. Q. J. Econ. 1955, 69, 99–118. [Google Scholar] [CrossRef]
- Simon, H.A. Rational choice and the structure of the environment. Psychol. Rev. 1956, 63, 129–138. [Google Scholar] [CrossRef]
- Bouyssou, D. Outranking methods. In Encyclopedia of Optimization, Volym 1; Christodoulos, F.A., Panos, P.M., Eds.; Springer: Berlin/Heidelberg, Germany, 2009; pp. 249–255. [Google Scholar]
- Roy, B. The outranking approach and the foundations of electre methods. Theory Decis. 1991, 31, 49–73. [Google Scholar] [CrossRef]
- Saaty, T. The Analytic Hierarchy Process; McGraw-Hill: New York, NY, USA, 1980. [Google Scholar]
- Buckley, J.J. Fuzzy hierarchical analysis. Fuzzy Sets Syst. 1985, 17, 233–247. [Google Scholar] [CrossRef]
- Rezaei, J. Best-worst multi-criteria decision-making method. Omega 2015, 53, 49–57. [Google Scholar] [CrossRef]
- Liang, F.; Brunelli, M.; Rezaei, J. Consistency issues in the best worst method: Measurements and thresholds. Omega 2020, 96, 102175. [Google Scholar] [CrossRef]
- Guo, S.; Zhao, H. Fuzzy best-worst multi-criteria decision-making method and its applications. Knowl. Based Syst. 2017, 121, 23–31. [Google Scholar] [CrossRef]
- Karimi, H.; Sadeghi-Dastaki, M.; Javan, M. A fully fuzzy best–worst multi attribute decision making method with triangular fuzzy number: A case study of maintenance assessment in the hospitals. Appl. Soft Comput. 2020, 86, 105882. [Google Scholar] [CrossRef]
- Pamučar, D.; Stević, Ž.; Sremac, S. A New Model for Determining Weight Coefficients of Criteria in MCDM Models: Full Consistency Method (FUCOM). Symmetry 2018, 10, 393. [Google Scholar] [CrossRef]
- Pamučar, D.; Ecer, F. Prioritizing the weights of the evaluation criteria under fuzziness: The fuzzy full consistency method—fucom-f. Facta Univ. Ser. Mech. Eng. 2020, 18, 419–437. [Google Scholar]
- Simon, H.A. Models of Man; John Wiley: New York, NY, USA, 1957. [Google Scholar]
- Simon, H.A. Models of Thought; Yale University Press: New Haven, CT, USA, 1979. [Google Scholar]
- Gigerenzer, G. The adaptive toolbox. In Bounded Rationality: The Adaptive Toolbox; Gigerenzer, G., Selten, R., Eds.; The MIT Press: Cambridge, MA, USA, 2001; pp. 37–50. [Google Scholar]
- Maldonato, N.M.; Chiodi, A.; Di Corrado, D.; Esposito, A.M.; De Lucia, S.; Sperandeo, R.; Muzii, B. Heuristics, abductions and adaptive algorithms: A toolbox for human decision making. In Proceedings of the 11th IEEE International Conference on Cognitive Infocommunications, CogInfoCom, Online. 23–25 September 2020; pp. 273–282. [Google Scholar]
- Klein, G. The Fiction of Optimization. In Bounded Rationality: The Adaptive Toolbox; Gigerenzer, G., Selten, R., Eds.; The MIT Press: Cambridge, MA, USA, 2001; pp. 103–121. [Google Scholar]
- Lieder, F.; Griffiths, T.L. Resource-rational analysis: Understanding human cognition as the optimal use of limited computational resources. Behav. Brain Sci. 2020, 43, 1–60. [Google Scholar] [CrossRef] [PubMed]
- Mohnert, F.; Pachur, T.; Lieder, F. What’s in the Adaptive Toolbox and How Do People Choose From It? Rational Models of Strategy Selection in Risky Choice. In Proceedings of the 41st Annual Conference of the Cognitive Science Society, Montreal, QC, Canada, 24–27 July 2019; pp. 2378–2384. [Google Scholar]
- Gigerenzer, G. Reasoning the fast and frugal way: Models of bounded rationality. Psychol. Rev. 1996, 103, 650–669. [Google Scholar] [CrossRef]
- Agosto, D.E. Bounded rationality and satisficing in young people’s web-based decision making. J. Am. Soc. Inf. Sci. Technol. 2002, 53, 16–27. [Google Scholar] [CrossRef]
- Zhu, W.; Timmermans, H. Modeling pedestrian shopping behavior using principles of bounded rationality: Model comparison and validation. J. Geogr. Syst. 2011, 13, 101–126. [Google Scholar] [CrossRef]
- Nakayama, H.; Sawaragi, Y. Satisficing Trade-Off Method for Multiobjective Programming and its Applications. IFAC Proc. Vol. 1984, 17, 1345–1350. [Google Scholar] [CrossRef]
- Jankowski, P. Behavioral decision theory in spatial decision-making models. In Handbook of Behavioral and Cognitive Geography; Montello, D.R., Ed.; Edward Elgar Publishing: Cheltenham, UK, 2018; pp. 41–55. [Google Scholar]
- Pike, W.A.; Stasko, J.T.; Chang, R.; O’Connell, T.A. The science of interaction. Inf. Vis. 2009, 8, 263–274. [Google Scholar] [CrossRef]
- Yi, J.S.; Kang, Y.; Stasko, J.T.; Jacko, J.A. Toward a Deeper Understanding of the Role of Interaction in Information Visualization. IEEE Trans. Vis. Comput. Graph. 2007, 13, 1224–1231. [Google Scholar] [CrossRef]
- Elmqvist, N.; Moere, A.V.; Jetter, H.-C.; Carnea, D.; Reiterer, H.; Jankun-Kelly, T.J. Fluid interaction for information visualization. Inf. Vis. 2011, 10, 327–340. [Google Scholar] [CrossRef]
- Beaudouin-Lafon, M. Designing interaction, not interfaces. In Proceedings of the Working Conference on Advanced Visual Interfaces, Gallipoli, Italy, 25–28 May 2004; pp. 15–22. [Google Scholar]
- Shneiderman, B. The eyes have it: A task by data type taxonomy for information visualizations. In Proceedings of the 1996 IEEE Symposium on Visual Languages, Boulder, CO, USA, 3–6 September 1996; pp. 336–343. [Google Scholar]
- Vartak, M.; Huang, S.; Siddiqui, T.; Madden, S.; Parameswaran, A. Towards Visualization Recommendation Systems. ACM SIGMOD Rec. 2017, 45, 34–39. [Google Scholar] [CrossRef]
- Vincent, K.; Roth, R.E.; Moore, S.A.; Huang, Q.; Lally, N.; Sack, C.M.; Nost, E.; Rosenfeld, H. Improving spatial decision making using interactive maps: An empirical study on interface complexity and decision complexity in the North American hazardous waste trade. Environ. Plan. B Urban Anal. City Sci. 2018, 46, 1706–1723. [Google Scholar] [CrossRef]
- Cheong, l.; Bleisch, S.; Kealy, A.; Tolhurst, K.; Wilkening, T.; Duckham, M. Evaluating the impact of visualization of wildfire hazard upon decision-making under uncertainty. Int. J. Geogr. Inf. Sci. 2016, 30, 1377–1404. [Google Scholar] [CrossRef]
- Andrienko, N.; Andrienko, G. The Complexity Challenge to Creating Useful and Usable Geovisualization Tools. In Proceedings of the Geographic Information Science: Fourth International Conference, Münster, Germany, 20–23 September 2006; pp. 23–27. [Google Scholar]
- Hamilton, M.C.; Nedza, J.A.; Doody, P.; Bates, M.E.; Bauer, N.L.; Voyadgis, D.E.; Fox-Lent, C. Web-based geospatial multiple criteria decision analysis using open software and standards. Int. J. Geogr. Inf. Sci. 2016, 30, 1667–1686. [Google Scholar] [CrossRef]
- Arciniegas, G.; Janssen, R.; Rietveld, P. Effectiveness of collaborative map-based decision support tools: Results of an experiment. Environ. Model. Softw. 2013, 39, 159–175. [Google Scholar] [CrossRef]
- Nair, L.R.; Saleem, S.; Shetty, D. Scalable Interactive Geo Visualization Platform for GIS Data Analysis. In Proceedings of the 2016 IEEE 14th Intl Conf on Dependable, Autonomic and Secure Computing, 14th Intl Conf on Pervasive Intelligence and Computing, 2nd Intl Conf on Big Data Intelligence and Computing and Cyber Science and Technology Congress, Auckland, New Zealand, 8–12 August 2016; pp. 886–889. [Google Scholar]
- Zhang, M.; Wang, H.; Lu, Y.; Li, T.; Guang, Y.; Liu, C.; Edrosa, E.; Li, H.; Rishe, N. TerraFly GeoCloud. ACM Trans. Intell. Syst. Technol. 2015, 6, 1–24. [Google Scholar] [CrossRef]
- Leskens, J.G.; Kehl, C.; Tutenel, T.; Kol, T.; de Haan, G.; Stelling, G.; Eisemann, E. An interactive simulation and visualization tool for flood analysis usable for practitioners. Mitig. Adapt. Strateg. Glob. Chang. 2017, 22, 307–324. [Google Scholar] [CrossRef]
- Aye, Z.C.; Jaboyedoff, M.; Derron, M.H.; Van Westen, C.J.; Hussin, H.Y.; Ciurean, R.L.; Frigerio, S.; Pasuto, A. An interactive web-GIS tool for risk analysis: A case study in the Fella River basin, Italy. Nat. Hazards Earth Syst. Sci. 2016, 16, 85–101. [Google Scholar] [CrossRef]
- Waser, J.; Konev, A.; Adransky, B.; Horváth, Z.; Ribičic, H.; Carnecky, R.; Kluding, P.; Schindler, B. Many plans: Multidimensional ensembles for visual decision support in flood management. Comput. Graph. Forum 2014, 33, 281–290. [Google Scholar] [CrossRef]
- Zhang, S.; Xia, Z.; Wang, T. A real-time interactive simulation framework for watershed decision making using numerical models and virtual environment. J. Hydrol. 2013, 493, 95–104. [Google Scholar] [CrossRef]
- Kienberger, S.; Hagenlocher, M.; Delmelle, E.; Casas, I. A WebGIS tool for visualizing and exploring socioeconomic vulnerability to dengue fever in Cali, Colombia. Geospat. Health 2013, 8, 313–316. [Google Scholar] [CrossRef]
- Nagel, T.; Duval, E.; Vande Moere, A. Interactive exploration of geospatial network visualization. In Proceedings of the 2012 ACM Annual Conference on Human Factors in Computing Systems, Kherson, Ukraine, 6–10 June 2012. [Google Scholar]
- Kulawiak, M.; Prospathopoulos, A.; Perivoliotis, L.; Łuba, M.; Kioroglou, S.; Stepnowski, A. Interactive visualization of marine pollution monitoring and forecasting data via a Web-based GIS. Comput. Geosci. 2010, 36, 1069–1080. [Google Scholar] [CrossRef]
- Nost, E.; Rosenfeld, H.; Vincent, K.; Moore, S.A.; Roth, R.E. HazMatMapper: An online and interactive geographic visualization tool for exploring transnational flows of hazardous waste and environmental justice. J. Maps 2017, 13, 14–23. [Google Scholar] [CrossRef]
- Herring, J.; VanDyke, M.S.; Cummins, R.G.; Melton, F. Communicating Local Climate Risks Online Through an Interactive Data Visualization. Environ. Commun. 2017, 11, 90–105. [Google Scholar] [CrossRef]
- Dhillon, K.B.; Laird, M.R.; Shay, J.A.; Winsor, G.L.; Lo, R.; Nizam, F.; Pereira, S.K.; Waglechner, N.; McArthur, A.G.; Langille, M.g.I.; et al. IslandViewer 3: More flexible, interactive genomic island discovery, visualization and analysis. Nucleic Acids Res. 2015, 43, 104–108. [Google Scholar] [CrossRef]
- Elwood, S.; Leszczynski, A. New spatial media, new knowledge politics. Trans. Inst. Br. Geogr. 2013, 38, 544–559. [Google Scholar] [CrossRef]
- MacCrimmon, K.R. Decisionmaking Among Multiple-Attribute Alternatives: A Survey and Consolidated Approach; RAND Corporation: Santa Monica, CA, USA, 1968. [Google Scholar]
- Malczewski, J.; Ogryczak, W. The Multiple Criteria Location Problem: 2. Preference-Based Techniques and Interactive Decision Support. Environ. Plan. A Econ. Space 1996, 28, 69–98. [Google Scholar] [CrossRef]
- Keeney, R.L.; Raiffa, H. Decisions with Multiple Objectives—Preferences and Value Tradeoffs; John Wiley & Sons: Hoboken, NJ, USA, 1976. [Google Scholar]
- Hammond, J.S.; Keeney, R.L.; Raiffa, H. Even Swaps: A Rational Method for Making Trade-offs. Harv. Bus. Rev. 1998, 76, 137–149. [Google Scholar]
- Hammond, J.S.; Keeney, R.L.; Raiffa, H. Smart Choices—A Practical Guide to Making Better Life Decisions; Broadway Books: New York, NY, USA, 1999. [Google Scholar]
- Sacha, D.; Zhang, L.; Sedlmair, M.; Lee, J.A.; Peltonen, J.; Weiskopf, D.; North, S.C.; Keim, D.A. Visual Interaction with Dimensionality Reduction: A Structured Literature Analysis. IEEE Trans. Vis. Comput. Graph. 2017, 23, 241–250. [Google Scholar] [CrossRef]
- Andrienko, G.; Andrienko, N.; Schumann, H.; Tominski, C.; Demsar, U.; Dransch, D.; Dykes, J.; Fabrikant, S.; Jern, M.; Kraak, M.-J. Space and Time. In Mastering the Information Age: Solving Problems with Visual Analytics; Keim, D., Kohlhammer, J., Ellis, G., Mansmann, F., Eds.; Eurographics Association: Munich, Germany, 2010; pp. 57–86. [Google Scholar]


| Method | Nr. of Alternatives | Criteria Weighting | Handles Uncertainty |
|---|---|---|---|
| ESRDS | Large | No | No |
| Weighted summation methods | Small | Yes | No |
| Outranking methods (ELECTRE, PROMETHEE) | Small | Yes | No |
| Ideal point methods (TOPSIS) | Small | Yes | No |
Publisher’s Note: MDPI stays neutral with regard to jurisdictional claims in published maps and institutional affiliations. |
© 2021 by the authors. Licensee MDPI, Basel, Switzerland. This article is an open access article distributed under the terms and conditions of the Creative Commons Attribution (CC BY) license (https://creativecommons.org/licenses/by/4.0/).
Share and Cite
Milutinović, G.; Seipel, S.; Ahonen-Jonnarth, U. Geospatial Decision-Making Framework Based on the Concept of Satisficing. ISPRS Int. J. Geo-Inf. 2021, 10, 326. https://doi.org/10.3390/ijgi10050326
Milutinović G, Seipel S, Ahonen-Jonnarth U. Geospatial Decision-Making Framework Based on the Concept of Satisficing. ISPRS International Journal of Geo-Information. 2021; 10(5):326. https://doi.org/10.3390/ijgi10050326
Chicago/Turabian StyleMilutinović, Goran, Stefan Seipel, and Ulla Ahonen-Jonnarth. 2021. "Geospatial Decision-Making Framework Based on the Concept of Satisficing" ISPRS International Journal of Geo-Information 10, no. 5: 326. https://doi.org/10.3390/ijgi10050326
APA StyleMilutinović, G., Seipel, S., & Ahonen-Jonnarth, U. (2021). Geospatial Decision-Making Framework Based on the Concept of Satisficing. ISPRS International Journal of Geo-Information, 10(5), 326. https://doi.org/10.3390/ijgi10050326