1. Introduction
Our understanding of land use/land cover change influences decision making on resource management, protected lands designation, urban planning, and policy making. Reliable, standardized land cover data provides the foundation for developing knowledge to inform such decisions. In addition to the National Land Cover Dataset (NLCD) developed and managed by the United States Geologic Survey (USGS), the United States Department of Agriculture (USDA) Cropland Data Layer (CDL) provides fundamental data for monitoring land cover changes with a focus on croplands in the U.S. The CDL is a land cover classification map that has covered the contiguous 48 states since 2008 [
1]. The CDL is available for limited states back to 1997. The data consisting of 134 land cover classes are produced annually based on the interpretation of satellite imagery and ground information. The CDL provides useful information for estimating in-season area of crop production [
2,
3] and for automatically stratifying areas (identifying locations for statistical sampling) with improved accuracy over previous methods [
2]. In the last decade, the CDL has served as a primary data source for characterizing cropland change in the U.S. [
4,
5]. The CDL has also been used for biodiversity conservation research [
6,
7,
8,
9,
10,
11,
12] and post-disaster damage assessment [
13]. This wide range of applications show the contributions of the CDL to advancing our knowledge about environmental change and making decisions on land management.
When utilizing the CDL as the primary data source, the reliability of research results largely hinges on the classification accuracy. The area indicated by the pixel count of the CDL are not official estimates per disclaimer provided with USDA CropScape [
14] tabular results, and the dataset should be used with caution when assessing cropland area and changes [
1]. The USDA focuses on estimating cropland in the CDL, and a number of studies have raised concerns about the accuracy of non-cropland land cover classification in the CDL and its appropriateness for quantifying land cover changes [
3,
13,
14,
15,
16,
17,
18,
19]. In developing the CDL, the National Agricultural Statistics Service (NASS) focuses on identifying crops across the U.S. not on other land cover types such as grassland or forest [
3]. The USDA publishes overall accuracy for the crop classes and relies on the NLCD for accuracies of other land cover classes. Because class-specific accuracy is not published by the creators of the NLCD, limited published accuracy measures are available for non-cropland in the CDL. This information, however, is critical for understanding the classification accuracy of CDL when estimating cropland change, and more specifically, when estimating cropland expansion into non-cropland land cover classifications.
Researchers have employed various methods to improve reliability of the CDL. Lark et al. [
20] utilized a series of post-classification refinement techniques based on logical reasoning. They simplified the CDL into three classes—cropland, non-crop, and fallow classes—and created a new dataset representing a land cover change trajectory of each pixel using a CDL annual time series. Applying a majority filter, temporal filter, and minimum mapping unit, areas of less confident cropland change were potentially removed. The NLCD from previous years was used to identify uncertain cropland areas in the CDL. Similarly, Zhang et al. [
21] extracted cropland pixels in the CDL based on the crop rotation pattern to predict land cover a year ahead. To understand the impact of errors in the CDL, Sun and Congalton [
22] examined aggregated cropland maps using two spatial aggregation techniques together with confidence level probability techniques for Nebraska as a case study.
The above studies applied various methods with the intention of improving confidence in estimating land cover changes using the CDL. However, because these methods alter the final CDL values, any accuracy assessment provided by the USDA is no longer valid. Any change in accuracy after application of these methods was not quantified. It is unclear how these methods influenced the appropriateness of the CDL for estimating cropland change. Single year accuracy assessments may not provide comprehensive insights for the magnitude and types of potential errors when estimating cropland change with the CDL which will require the use of multiple CDL years. This lack of clarity for accuracy after modifying the CDL and combining years impedes its use to understand cropland change. Analysis results’ accuracy depends on the input data quality.
The goal of this study was to gain insights into the characteristics of cropland area classified in the CDL in the context of estimating cropland change and how inconsistencies in cropland and non-cropland area from year to year might impact CDL-based cropland change accuracy. Four study objectives were to: (1) compare the CDL with the USDA National Resources Inventory (NRI) and USDA Census of Agriculture (Census) data on cropland area at the state level, (2) compare the CDL with the Principal Crops Harvested Acreage (PCHA) dataset which is a USDA survey-based estimate of harvested area for the 20 principal crops grown in the United States and includes the area by state. These same 20 crops are included as individual classes in the CDL allowing for direct comparison for specific crops between the CDL and USDA statistical data, (3) evaluate the effectiveness of post-classification refinement techniques on the CDL, and (4) assess the consistency in change of cropland area within the CDL based on a comparison of two time-intervals on cropland change.
2. Materials and Methods
2.1. Data
The primary datasets used in this study were the CDL, Census, NRI, and USDA PCHA, all of which are developed and managed by the USDA. The CDLs used for this study were from 2007 to 2017 [
23]. Year 2007 was used as the initial year of the study to enable the comparison of cropland change between the CDL and other credible data sources that may have limited temporal availability, such as the Census and the NRI which are produced every 5 years. This resulted in the study only utilizing the 20 states available in the 2007 CDL for any analyses which included 2007 (Arkansas, CA, Idaho IL, Indiana, Iowa, Kansas, Louisiana, Michigan, Minnesota, Mississippi, Missouri, Nebraska, North Dakota, Ohio, Oklahoma, Oregon, South Dakota, Washington, and Wisconsin).
The Census is conducted by the USDA National Agricultural Statistics Service (NASS) based on information from a large proportion of agricultural producers. It estimates agricultural production across the entire U.S. agricultural population [
24]. The Census reports results at the county, state, and national level.
The NRI, prepared by the USDA’s Natural Resources Conservation Service (NRCS), conducts a continuous inventory of land use and natural resource conditions and trends on non-federal lands across 49 states (except for Alaska). Surveys employ recognized, rigorous statistical sampling methods to produce scientifically credible information [
25]. The 2007, 2012 and 2017 NRI datasets were used in this study [
25].
NASS also reports crop area annually for principal crops planted and harvested in the U.S. [
26,
27]. The 2007, 2012 and 2017 PCHAs were used in this study [
27]. The PCHA is very similar to the harvested area in the Census (
Table 1).
2.2. Statistical Analysis
Statistical analyses were performed to determine how well total cropland and cropland change estimated by each dataset correlated with other datasets. Linear regressions were performed between the different datasets for total cropland and cropland change by state, the correlation coefficient and the line slope were analyzed. A higher correlation coefficient and a slope near one indicate good agreement. A one-way analysis of variance (ANOVA) was performed to assess state-level cropland change agreement between data sets between 2007 and 2012 and between 2012–2017. Only the twenty states included in the 2007 CDL were used for both year combinations.
2.3. Comparing Total Cropland Area and Its Change between the CDL, NRI, and Census
This analysis examined the consistency of total cropland area and change in cropland area when estimated from the CDL with total cropland and change in cropland estimated from the USDA’s tabular datasets—the NRI and Census. Each of the CDL, NRI, and Census is developed using a different method, such as satellite image interpretation (CDL), statistically based field sampling (NRI), aerial photograph interpretation (NRI) and farmer surveys (Census). Thus, examining the consistency in estimated total cropland area and its change among these datasets could provide insights for characteristics of the CDL in the context of reliably quantifying cropland change over time.
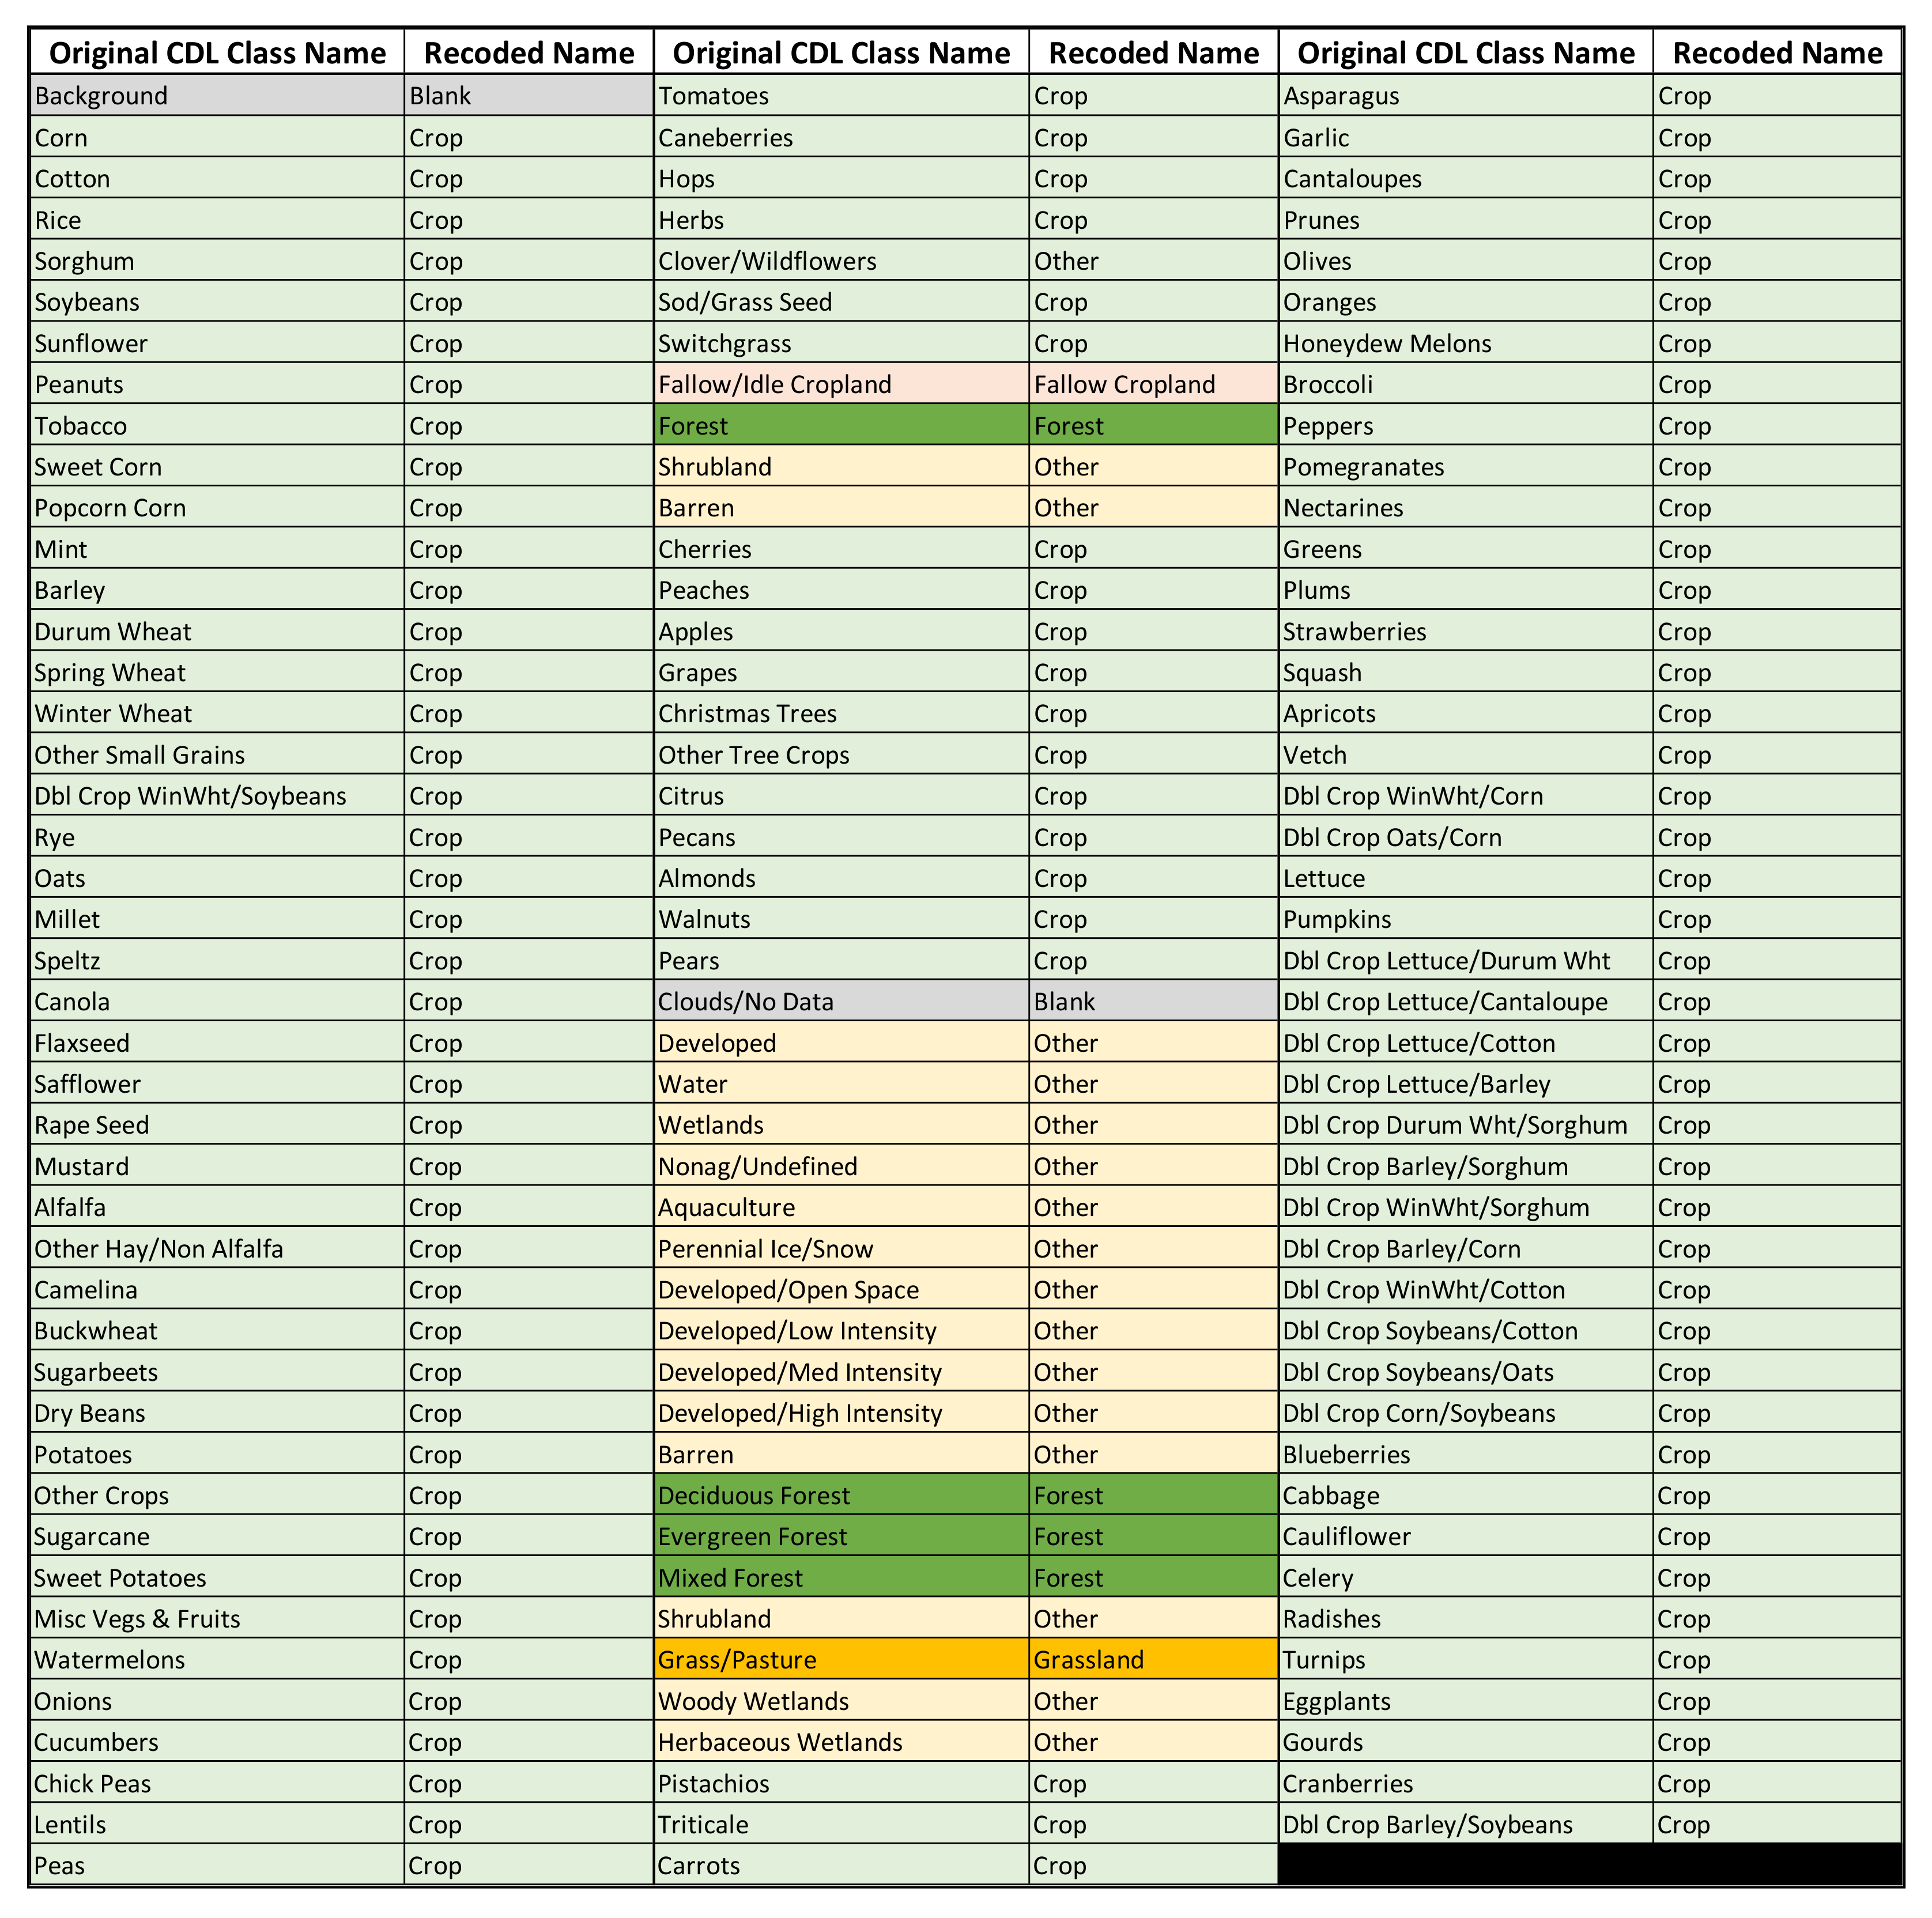
For the CDL, to best match the Census and NRI, total cropland was defined as an aggregate of over 100 crop types including hay, tree fruits, and fallow and idle croplands. A complete list of classes included in total cropland is provided in
Figure A1. For the NRI, total cropland was defined as a sum of cultivated and non-cultivated croplands. For the Census, total cropland was obtained by subtracting cropland in pasture from total cropland. This would include the sub-categories “harvested cropland”, “failed cropland”, “idle cropland” and “cultivated summer fallow”. Cropland pasture was removed to improve compatibility with the NRI and CDL, which do not have a “cropland pasture” category. Although the constituents of specific crop types defining total cropland varied by dataset, comparisons of total cropland area and its change across the datasets could be meaningful, and similarities found between the CDL and the NRI or Census could provide insights for how to use the CDL for quantifying cropland change.
Based on the availability of each dataset, the total cropland comparisons of the CDL with the NRI and Census was performed for 2007, 2012 and 2017. Because the 2007 CDL covered only 20 states, the comparative analyses were performed for those states only when examining 2007. Change in total cropland for each dataset was estimated for 2007 to 2012 and 2012 to 2017. Total cropland changes for the Census and NRI was obtained by subtracting 2007 estimated cropland area from 2012 estimated cropland area for each state. For the CDL, total cropland change was obtained by comparing the datasets with a pixel-by-pixel analysis.
2.4. Comparing Total Cropland Area and Cropland Change between the CDL and PCHA
This analysis provided an in-depth understanding of the CDL’s cropland estimates through comparison with those reported by NASS annually for the PCHA. The PCHA dataset is used as a component of the information used for the Census for estimating total cropland (USDA, NASS, 2014a). The total cropland reported in the Census is adjusted to conform to PCHA for each state [
25]. Total area reported in the PCHA corresponded to approximately 95% of the 2012 Census of harvested cropland [
25,
26]. Unlike the Census, which reports areas of total cropland every five years, PCHA reports annually and, like the CDL, can be broken out by crop (
Table A1). Thus, the PCHA could provide sound reference data for additional assessment of the CDL.
The state-level total cropland area for the 20 states estimated from the 2007 and 2012 CDLs and 48 states from the 2012 and 2017 CDLs was plotted against that obtained from the PCHA for the corresponding years also at the state level. The difference in area between the CDL estimates and the PCHA for the top five crops (corn, soybean, wheat, hay, and sorghum) was compared in order to gain in-depth understanding of the characteristics of the CDL, including potential sources of uncertainty.
2.5. Evaluating Post-Classification Refinment Techniques for Cropland Change Estimate Using the CDL
This analysis examined the effectiveness of post-classification refinement techniques to improve the consistency of cropland change estimated from the CDL with those estimated from the NRI and Census (
Supplementary Figure S1). The analysis adapted the methods outlined in Lark et al. [
20] as closely as possible and was performed for the 2007 to 2012, 2008 to 2012 (to access a 48 state CDL) and 2012 to 2017 time. It should be noted that for analysis 2.1 the “Other Hay/Non-alfalfa” class from the CDL was classified as crop to better match NRI and Census cropland definitions but was classified as non-crop for this analysis to better align with Lark’s methods. Workflow is presented in
Supplementary Figure S1. Efforts were made to emulate the methods identified by Lark. Classes in the CDL from 2007, 2008, 2012 and 2017 were first generalized into three categories: Crop, Non-crop and fallow crop. Next, fallow crop was recoded to the previous year’s land cover (except for year one which was recoded to the following year’s generalized land cover class). Next, all years in the analysis were stacked to create a 5-year CDL layer stack (4 year for 2008 to 2012). Using this stacked dataset, the post-classification-refinement technique consisting of four geospatial techniques were applied: (1) temporal filter to remove inconsistent land cover trajectories (
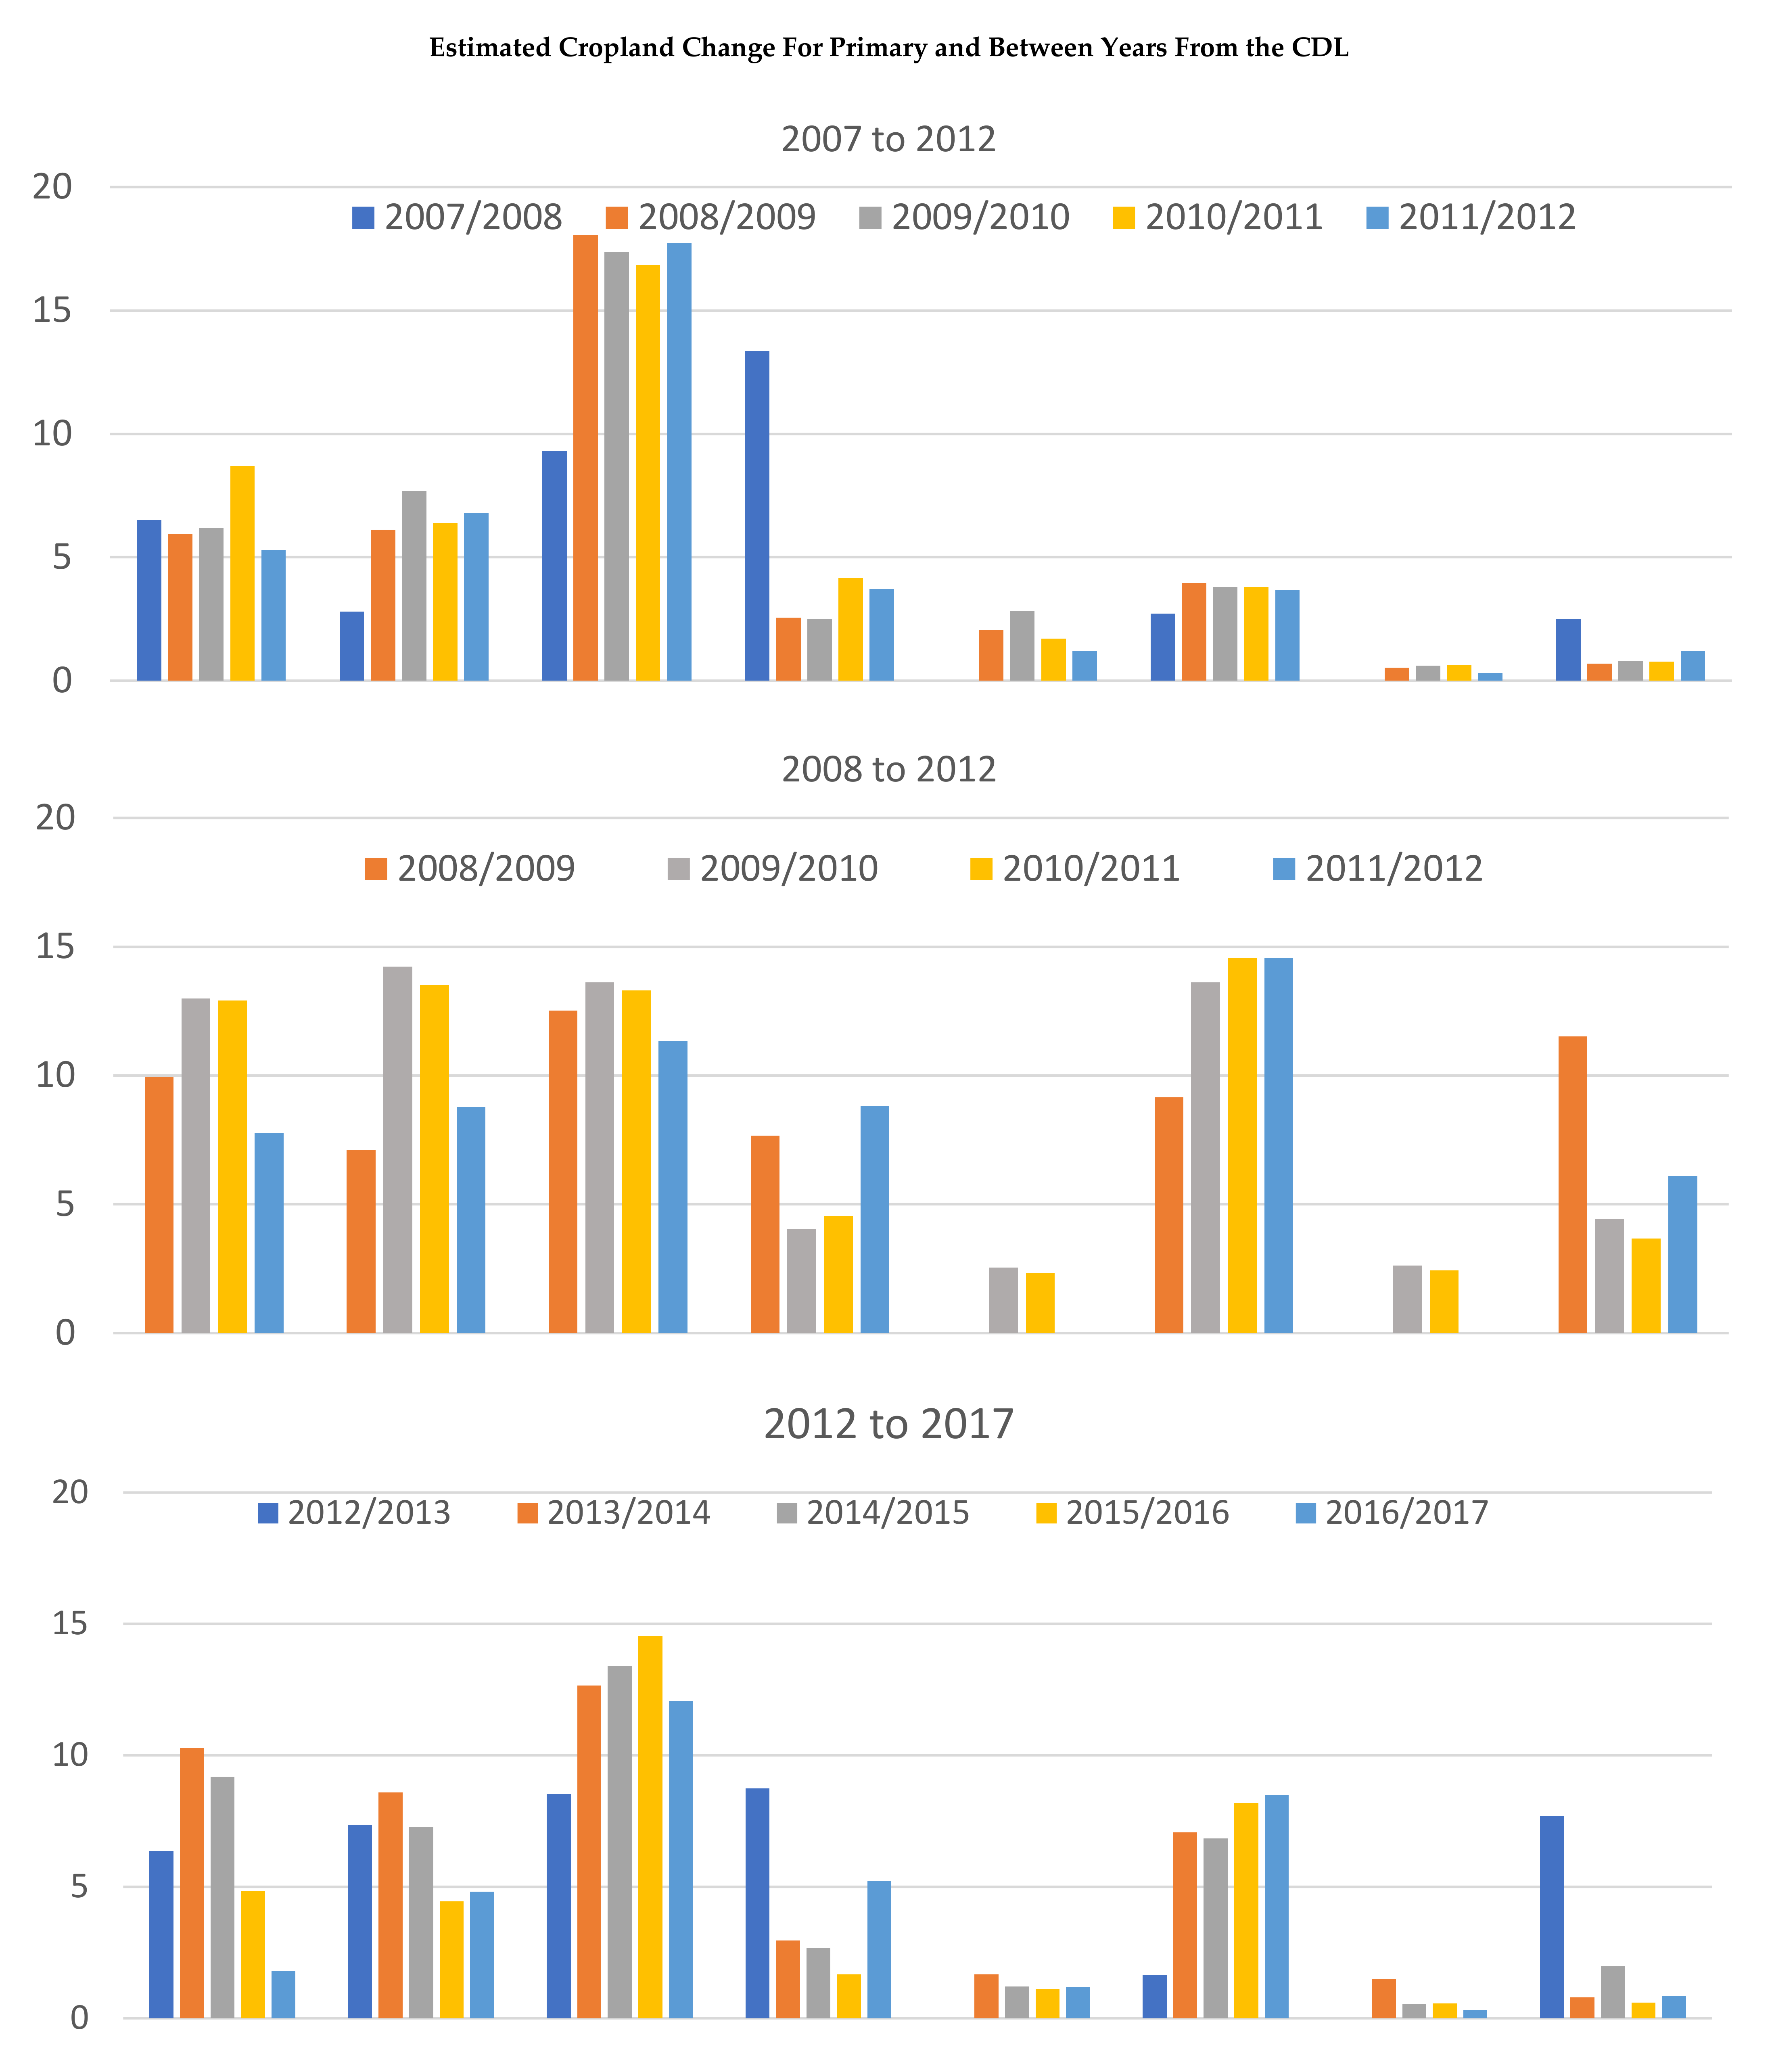
Table 2), (2) NLCDs from previous years used in certain situations to ensure land identified as change to crop was not previously crop, (3) spatial majority filter that aims to reduce spatially incohesive noise in the data that is repeated within a small area, and (4) minimum mapping unit that aims to remove land cover parcels smaller than a pre-defined area (6 hectares). Finally, crop change estimated from each step in this analysis was compared to change estimated from the Census and NRI.
2.6. Assessing the Consistency of Year to Year Cropland Change between an Initial-and-Final-Year
This analysis examined the consistency of the CDL in estimating cropland change by comparing two different but overlapping time intervals: year to year (i.e., 1-year interval), and the initial and final years using a spatial comparison of estimated change locations (i.e., 5-year interval). This analysis was performed for the 2007 to 2012, 2008 to 2012 and 2012 to 2017 CDLs. If the CDL classification is reliably estimating cropland change, a comparison of the initial and final years (initial-and-final-year comparison) would provide the combined total of cropland changes observed year to year during the same time period. Cropland change that is still present for year-to-year comparisons after the removing all pixels identified as change in the initial and final years was measured. This change would require conversion to cropland and then reversion to another land cover in a one to three-year timeframe (
Supplementary Figure S2). While it is possible that land could be converted to crop from 2008 to 2009, become fallow in 2010 and then convert to another land cover in 2011, this is not the most likely scenario. Satellite imagery would most likely detect a field that was taken out of crop after 2009 and see it as fallow in 2010. The soil will still be visible, signs of cultivation present. Allowing for this period of transition from cropland to fallow cropland and then to another land cover, this transition would be highly unlikely and not possible for years closest to the final year.
In this analysis, net conversion was examined. Net change to cropland was obtained by subtracting gross reversion (i.e., land cover changes from cropland) from gross conversion (i.e., land converted to cropland) each year. To identify non-cropland that was converted to cropland from the initial year to the final year (5-year interval), all pixels indicating non-cropland in 2007 and cropland in 2012 were identified in the CDL. The same steps were taken to identify year-to-year conversion for each pair of CDL for consecutive years (i.e., from 2007 to 2008, from 2008 to 2009, 2009 to 2010, 2010 to 2011 and from 2011 to 2012). The different time-interval change images were combined, and each pixel was analyzed to determine when change was consistent or inconsistent over different time periods. The same analysis was performed for 2008 to 2012 and 2012 to 2017.
3. Results
3.1. Comparing Total Cropland Area and Its Change between the CDL, Census, and NRI
The relationship of total cropland area on a state-by-state basis between the NRI and Census for 2007, 2012 and 2017 are shown in
Figure 1. Total cropland area reported in these two tabular datasets were strongly correlated (
R2 = 0.99). However, the Census tends to report larger cropland area than the NRI. The total cropland area in these two datasets were different by over 9 million hectares. The NRI provides a margin of error for each year (
Table A2). The margin for the 2007 and 2012 national total cropland area is approximately 800,000 hectares for 2007 and 2012, respectively. Total estimated change could be as high as 1.6 million hectares. Total cropland change is very close to the combined error for the two years. Combined error at the state level is typically higher than estimated change. This should be taken into consideration when using the data.
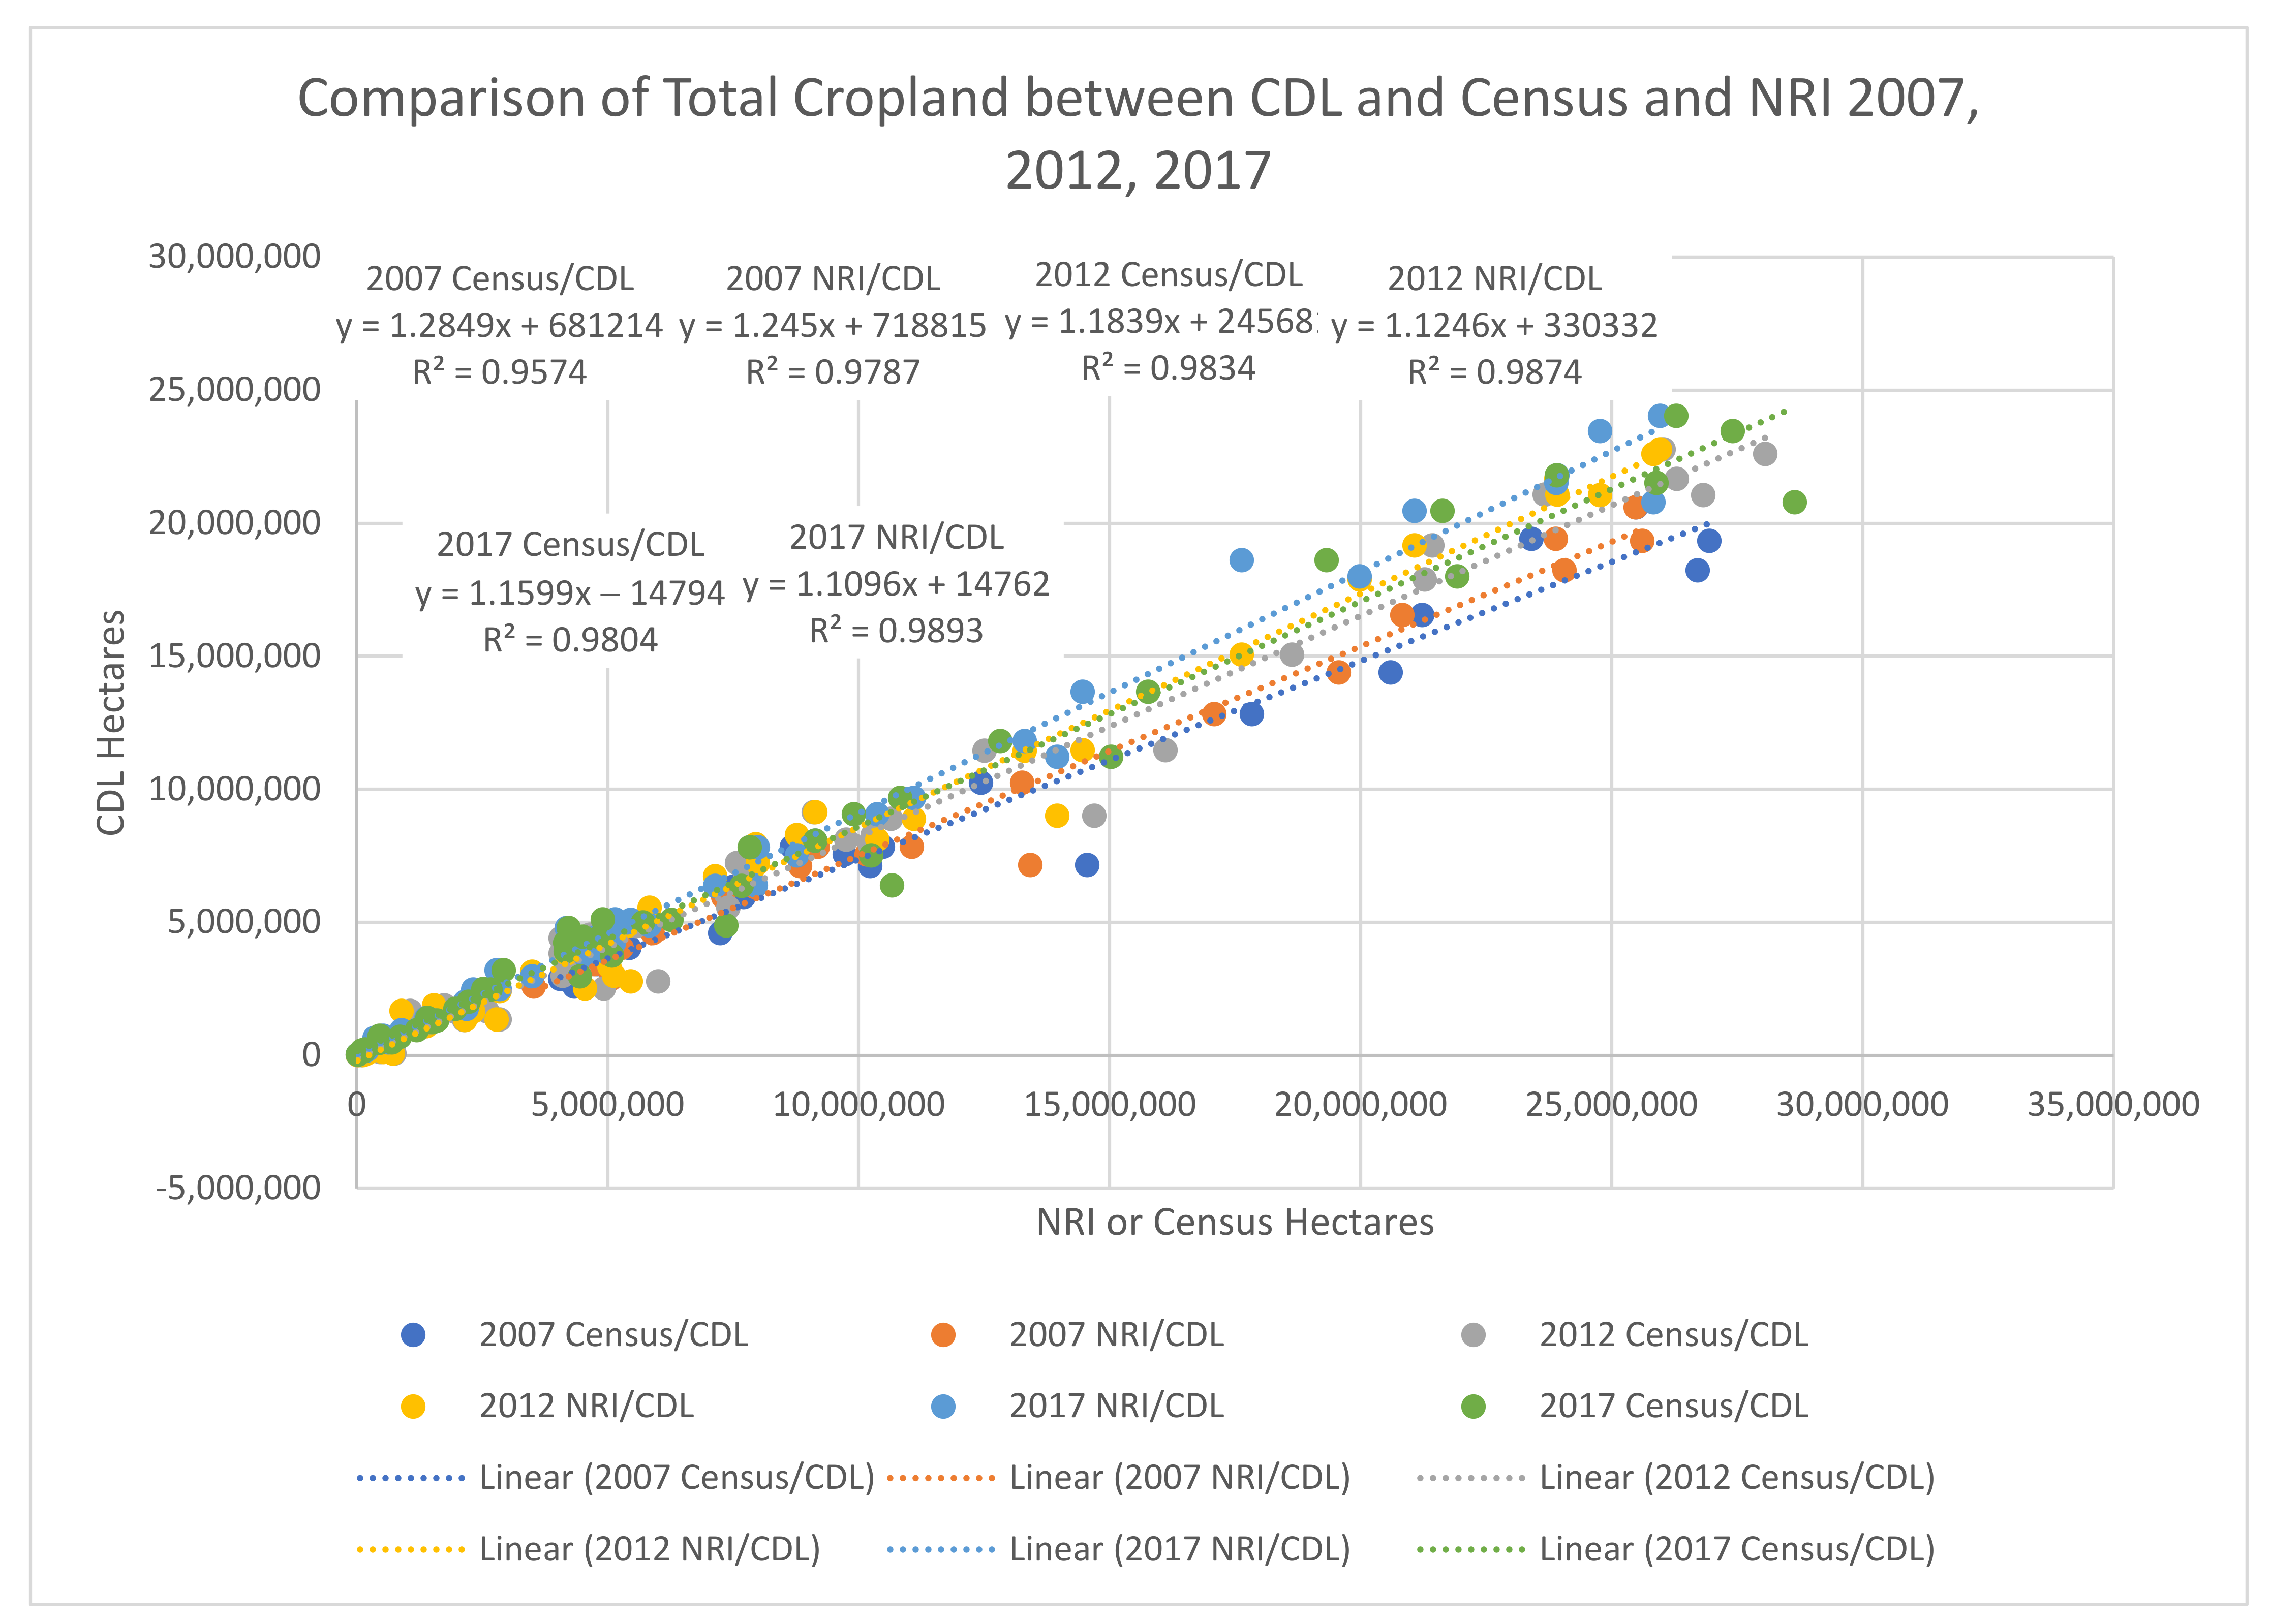
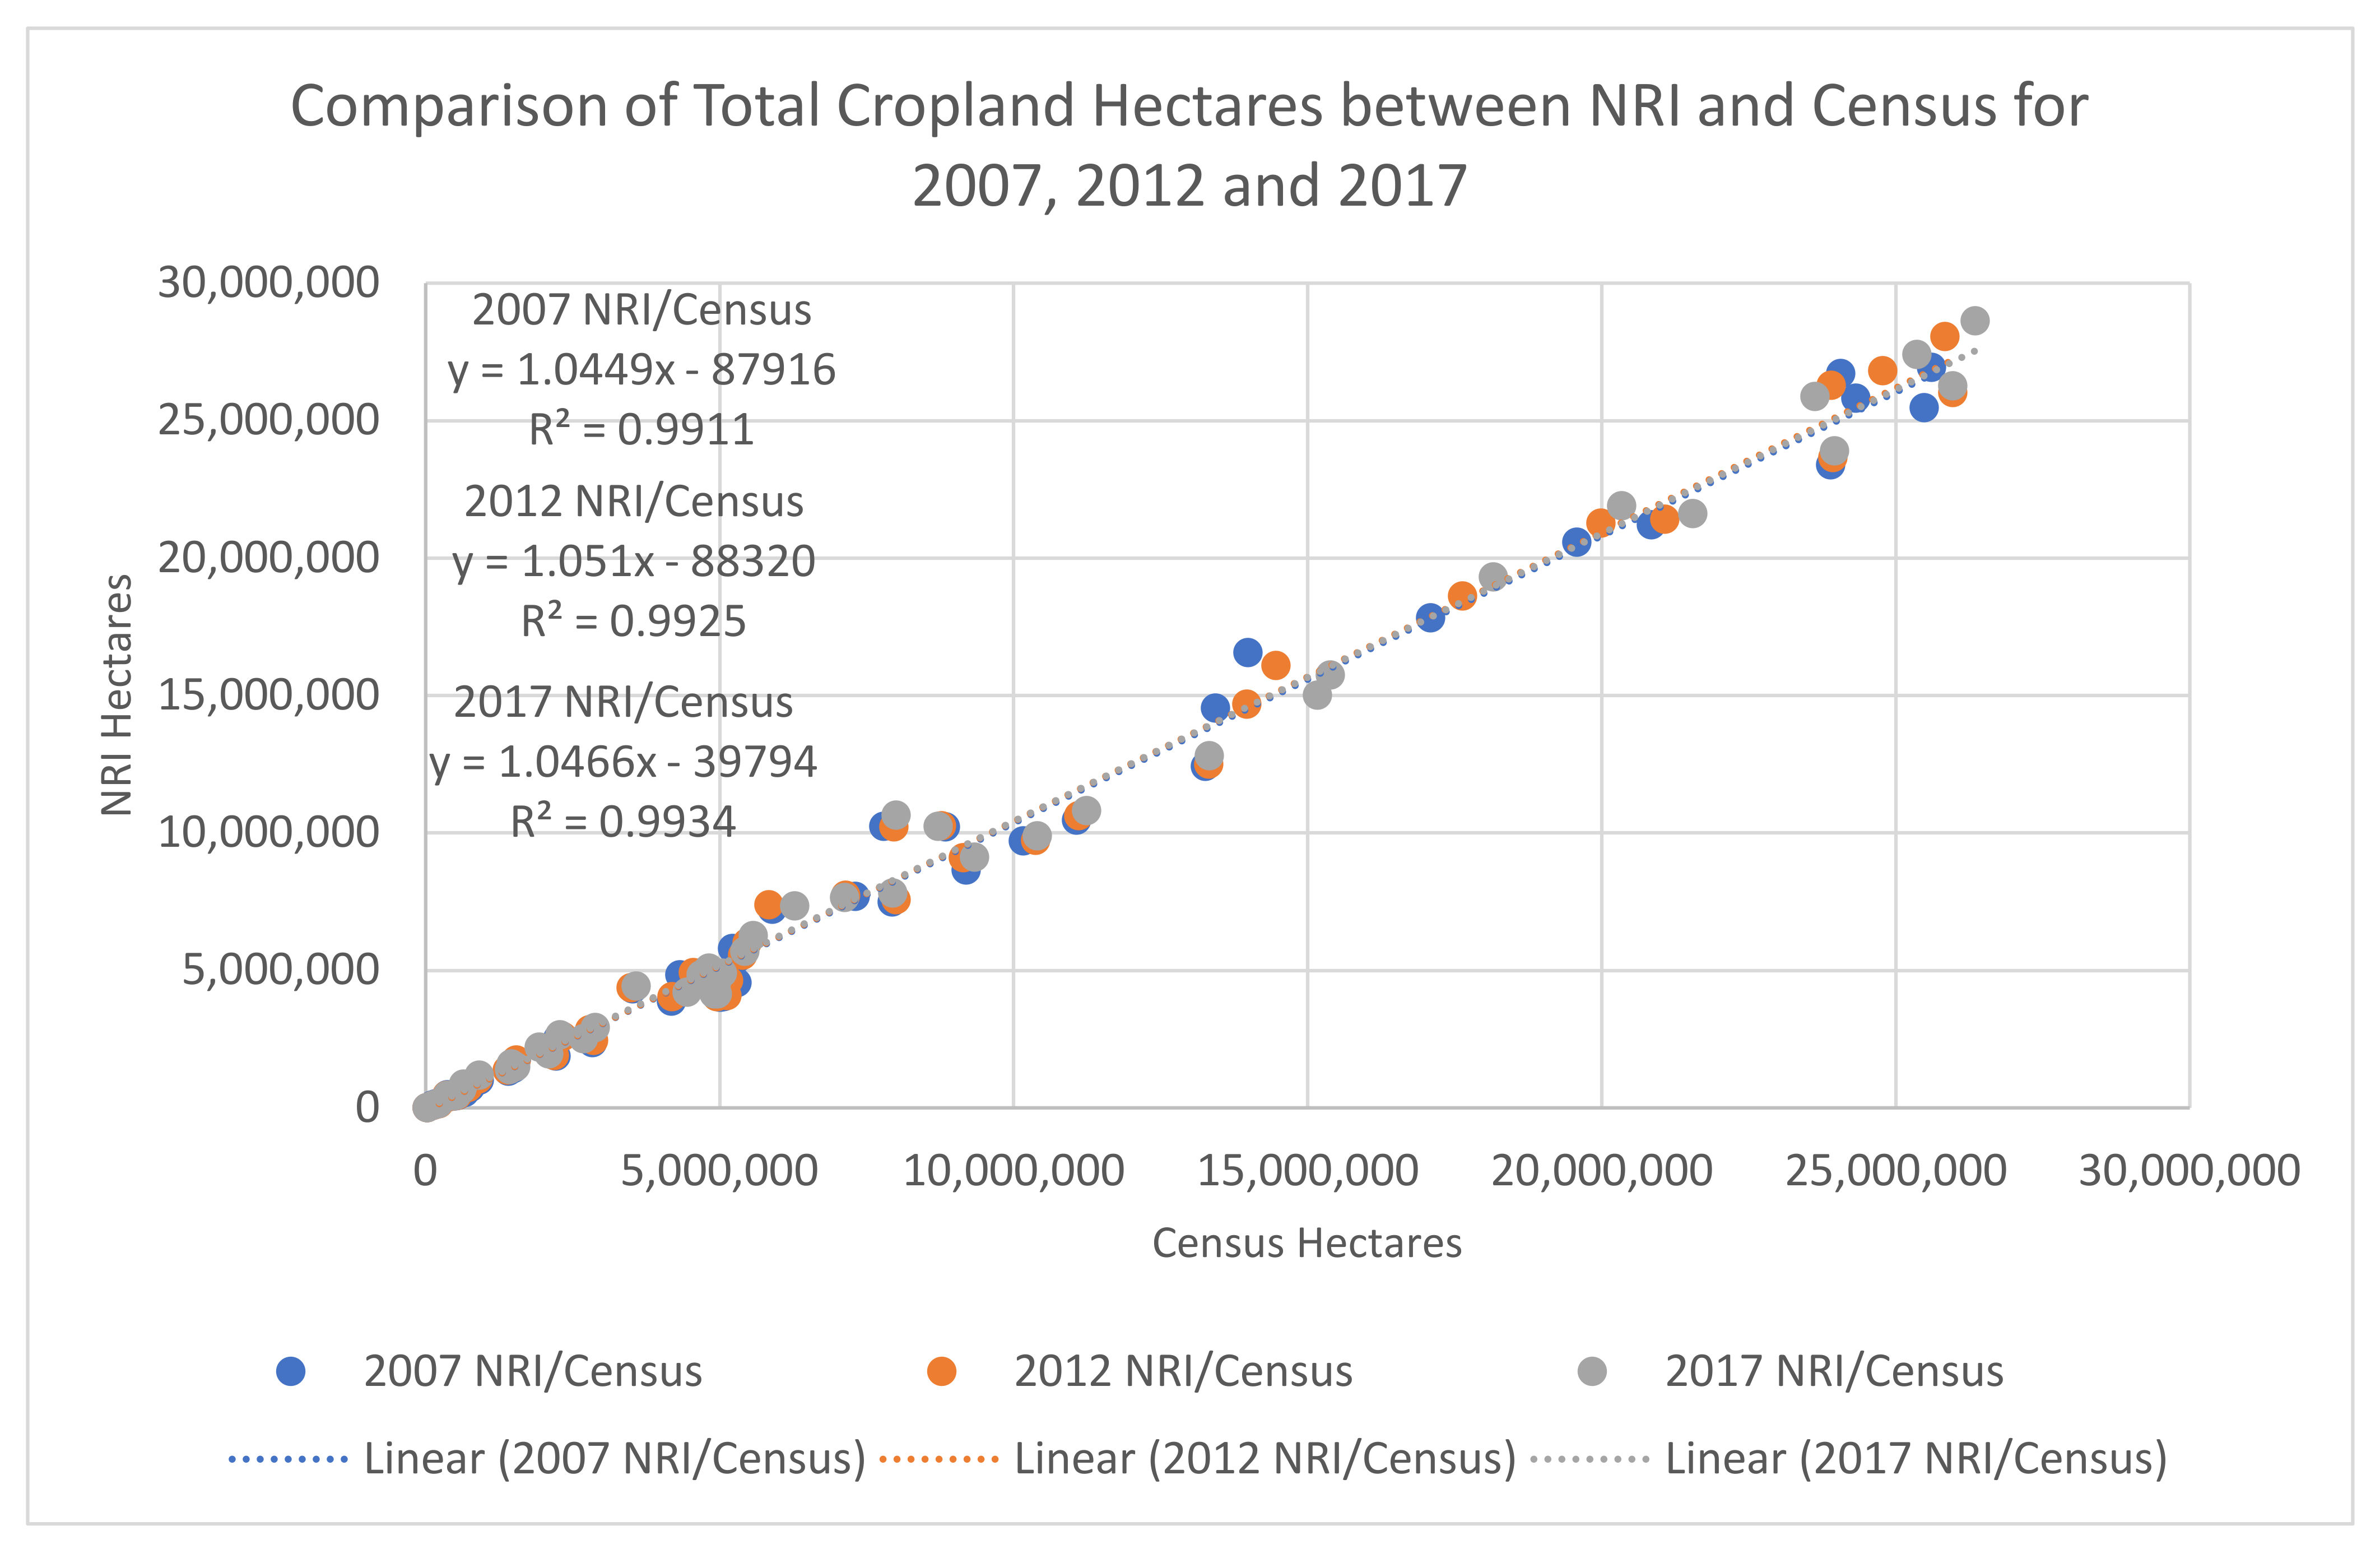
A comparison of total cropland area estimated from the 2007 CDL at the state level (for the 20 states available) to total cropland area estimated from the NRI and Census for the same year is shown in
Figure 2. The total cropland area from the 2007 CDL was strongly correlated with those estimates from the NRI (
R2 = 0.98) and Census (
R 2 =0.96). Totals for each dataset across the 20 states indicated that the CDL tended to estimate less cropland compared to the other two datasets. For example, the NRI, Census, and CDL estimated total croplands approximately 106 million hectares, 113 million hectares, and 97 million hectares, respectively. The total cropland area estimated using the 2007 CDL was 8.5% and 14.0% smaller than the estimates from the NRI and Census. Total cropland area estimated using the 2012 CDL compared to area estimated from the NRI and Census for 2012 are also shown in
Figure 2. The total cropland area estimated using the CDL for 2012 was also strongly correlated with those from the NRI (
R2 = 0.99,
Figure 2) and Census (
R2 = 0.98,
Figure 2). However, similar to the comparison for 2007, the CDL appeared to estimate less total cropland (125 million hectares) compared to the NRI (146 million hectares) and to the Census (152 million hectares). Total cropland area estimated using the 2012 CDL was approximately 15.0% and 18.2% lower than the area from the NRI and Census. The slope of the line in 2012 was much closer to one as total cropland by state in the CDL more closely approximated the totals for the Census and NRI. The relationships between the different datasets in 2017 was also very strong (
Figure 2).
When comparing cropland change estimated from the NRI and Census for 2007 and 2012, the estimated changes in total cropland area were weakly correlated (
Figure 3). The Census estimated increases in cropland for all 20 states while the NRI had some states declining in cropland area from 2007 to 2012. The weak correlation in cropland change between these datasets may stem from considerable discrepancies observed in a few states. For example, almost five times greater change from non-cropland to cropland (i.e., conversion) was estimated for Kansas in the Census than in the NRI. In contrast, nearly four times greater conversion was estimated for Missouri in the NRI than in the Census. The discrepancy in Missouri could be associated with the fact that the Census includes harvested acres while the NRI focuses on planted area. The year 2012 was a drought year in the United States and only 84% of corn acres were harvested, for example, while the average since 2007 was over 94%, a potential difference of over 200,000 hectares [
28]. Unfortunately, the NRI does not list area for individual crops to examine the discrepancy in Kansas in more detail but the Census does have an increase in harvested acres in Kansas from 2007 to 2012 despite the drought.
A comparison between estimated state by state change in total cropland from 2012 to 2017 for the NRI and the Census shows that estimated change between states do not often agree (
Figure 3). In particular, Arizona (NRI = 1300 hectares and Census = 51,300 hectares), Pennsylvania (NRI = 1050 hectares and Census = 27,400 hectares), and Texas (NRI = 4,735 hectares and Census = −165,750 hectares) show the greatest differences. These could partly be a result of the Census estimating harvested areas compared to the NRI estimating planted acres since some states may have weather or other factors which impact how much planted area can be harvested. Essentially, in figure three any points located in the upper right or lower left quadrants in the chart indicate states where one dataset estimated increasing cropland and the other estimated a decline.
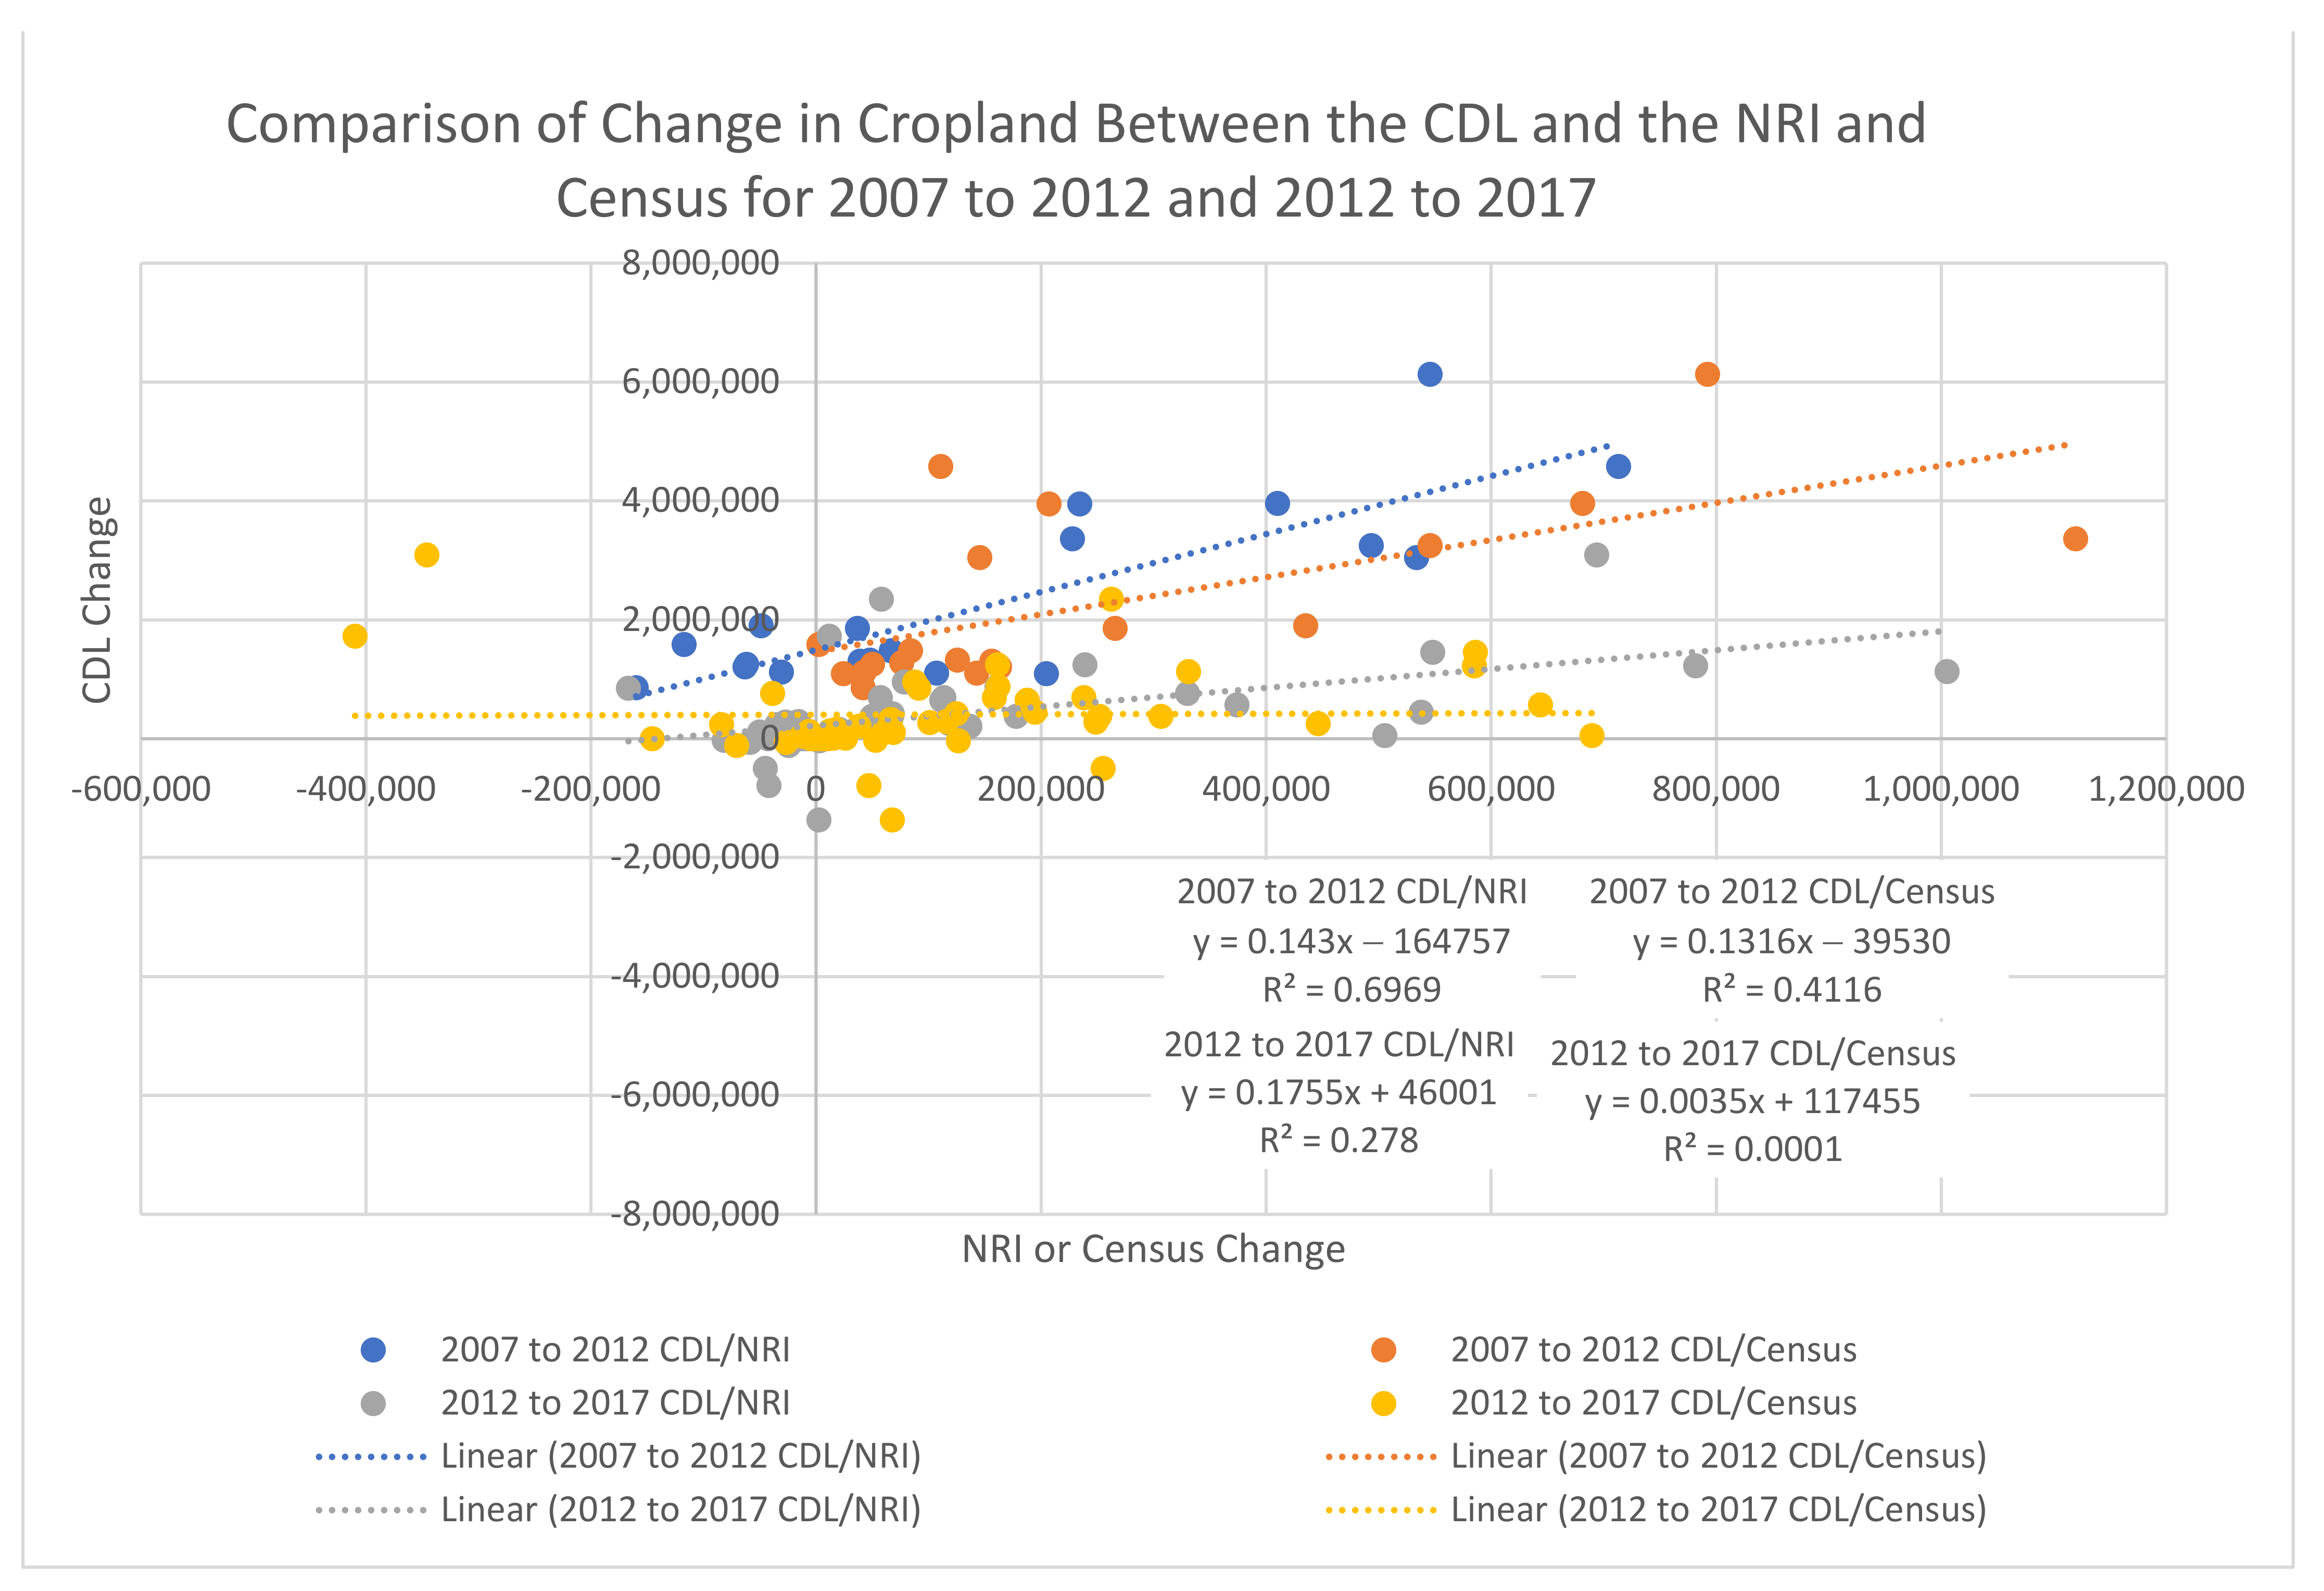
A comparison of change in total cropland area for the 20 states estimated using the CDL, NRI, and Census from 2007 to 2012 are shown in
Figure 4. The estimated area of cropland change using the CDL was moderately correlated with the change estimated from the NRI. While six states, Arkansas, California, Louisiana, Oklahoma, Oregon, and Washington, were estimated to decline in cropland in the NRI, all other states were estimated to have increased cropland in the CDL. Kansas has an increase of over 1.4 million hectares in cropland in the CDL, while the NRI has an increase of only 92,000 hectares. The contrasting direction of cropland change (i.e., increase in one dataset and decrease in the other) and inconsistency in cropland increase were the two major factors contributing to the low correlation of total cropland change between the CDL and NRI. The total cropland change estimated from the CDL had a moderate correlation with the change estimated from the Census. Although the CDL consistently estimated more cropland change compared to the Census, both datasets showed increase in cropland for all 20 states. The greatest difference between the two datasets was observed for Louisiana, which had nearly 500 times greater cropland increase in the CDL (492,000 hectares) than the Census (1,000 hectares).
Likewise, a comparison of the NRI with the CDL estimated change from 2012 to 2017 shows a decline in the relationship compared to 2007 to 2012 (
Figure 4). The higher cropland-change hectares estimated by the CDL (8 million compared to 2.3 million for the NRI) resulted in a slope of only 0.18. Here, also, Pennsylvania (NRI = 1,052 hectares and CDL = −551,317 hectares) and Texas (NRI = 4,735 hectares and CDL = 698,133 hectares) showed great variability. Most of the major crop producing states such as Illinois, Iowa and Nebraska showed increased estimated cropland change in the CDL than in the NRI (6 times, 2 times and 1.5 times, respectively). Comparing the 2012 to 2017 CDL to the 2012 to 2017 Census indicated no relationship. Several states estimated opposite change including Montana (CDL = +2,352,041 hectares and Census = −40,006 hectares), Pennsylvania (CDL = −551,317 hectares and Census = 27,374 hectares) and North Carolina (CDL = −200,425 hectares and Census = 103,268 hectares). Similar to the NRI comparison, the CDL estimated over 7.9 million hectares of increasing crop while the Census estimated just over 3.1 million hectares.
3.2. Comparing Total Cropland Area and Its Change between the CDL and PCHA
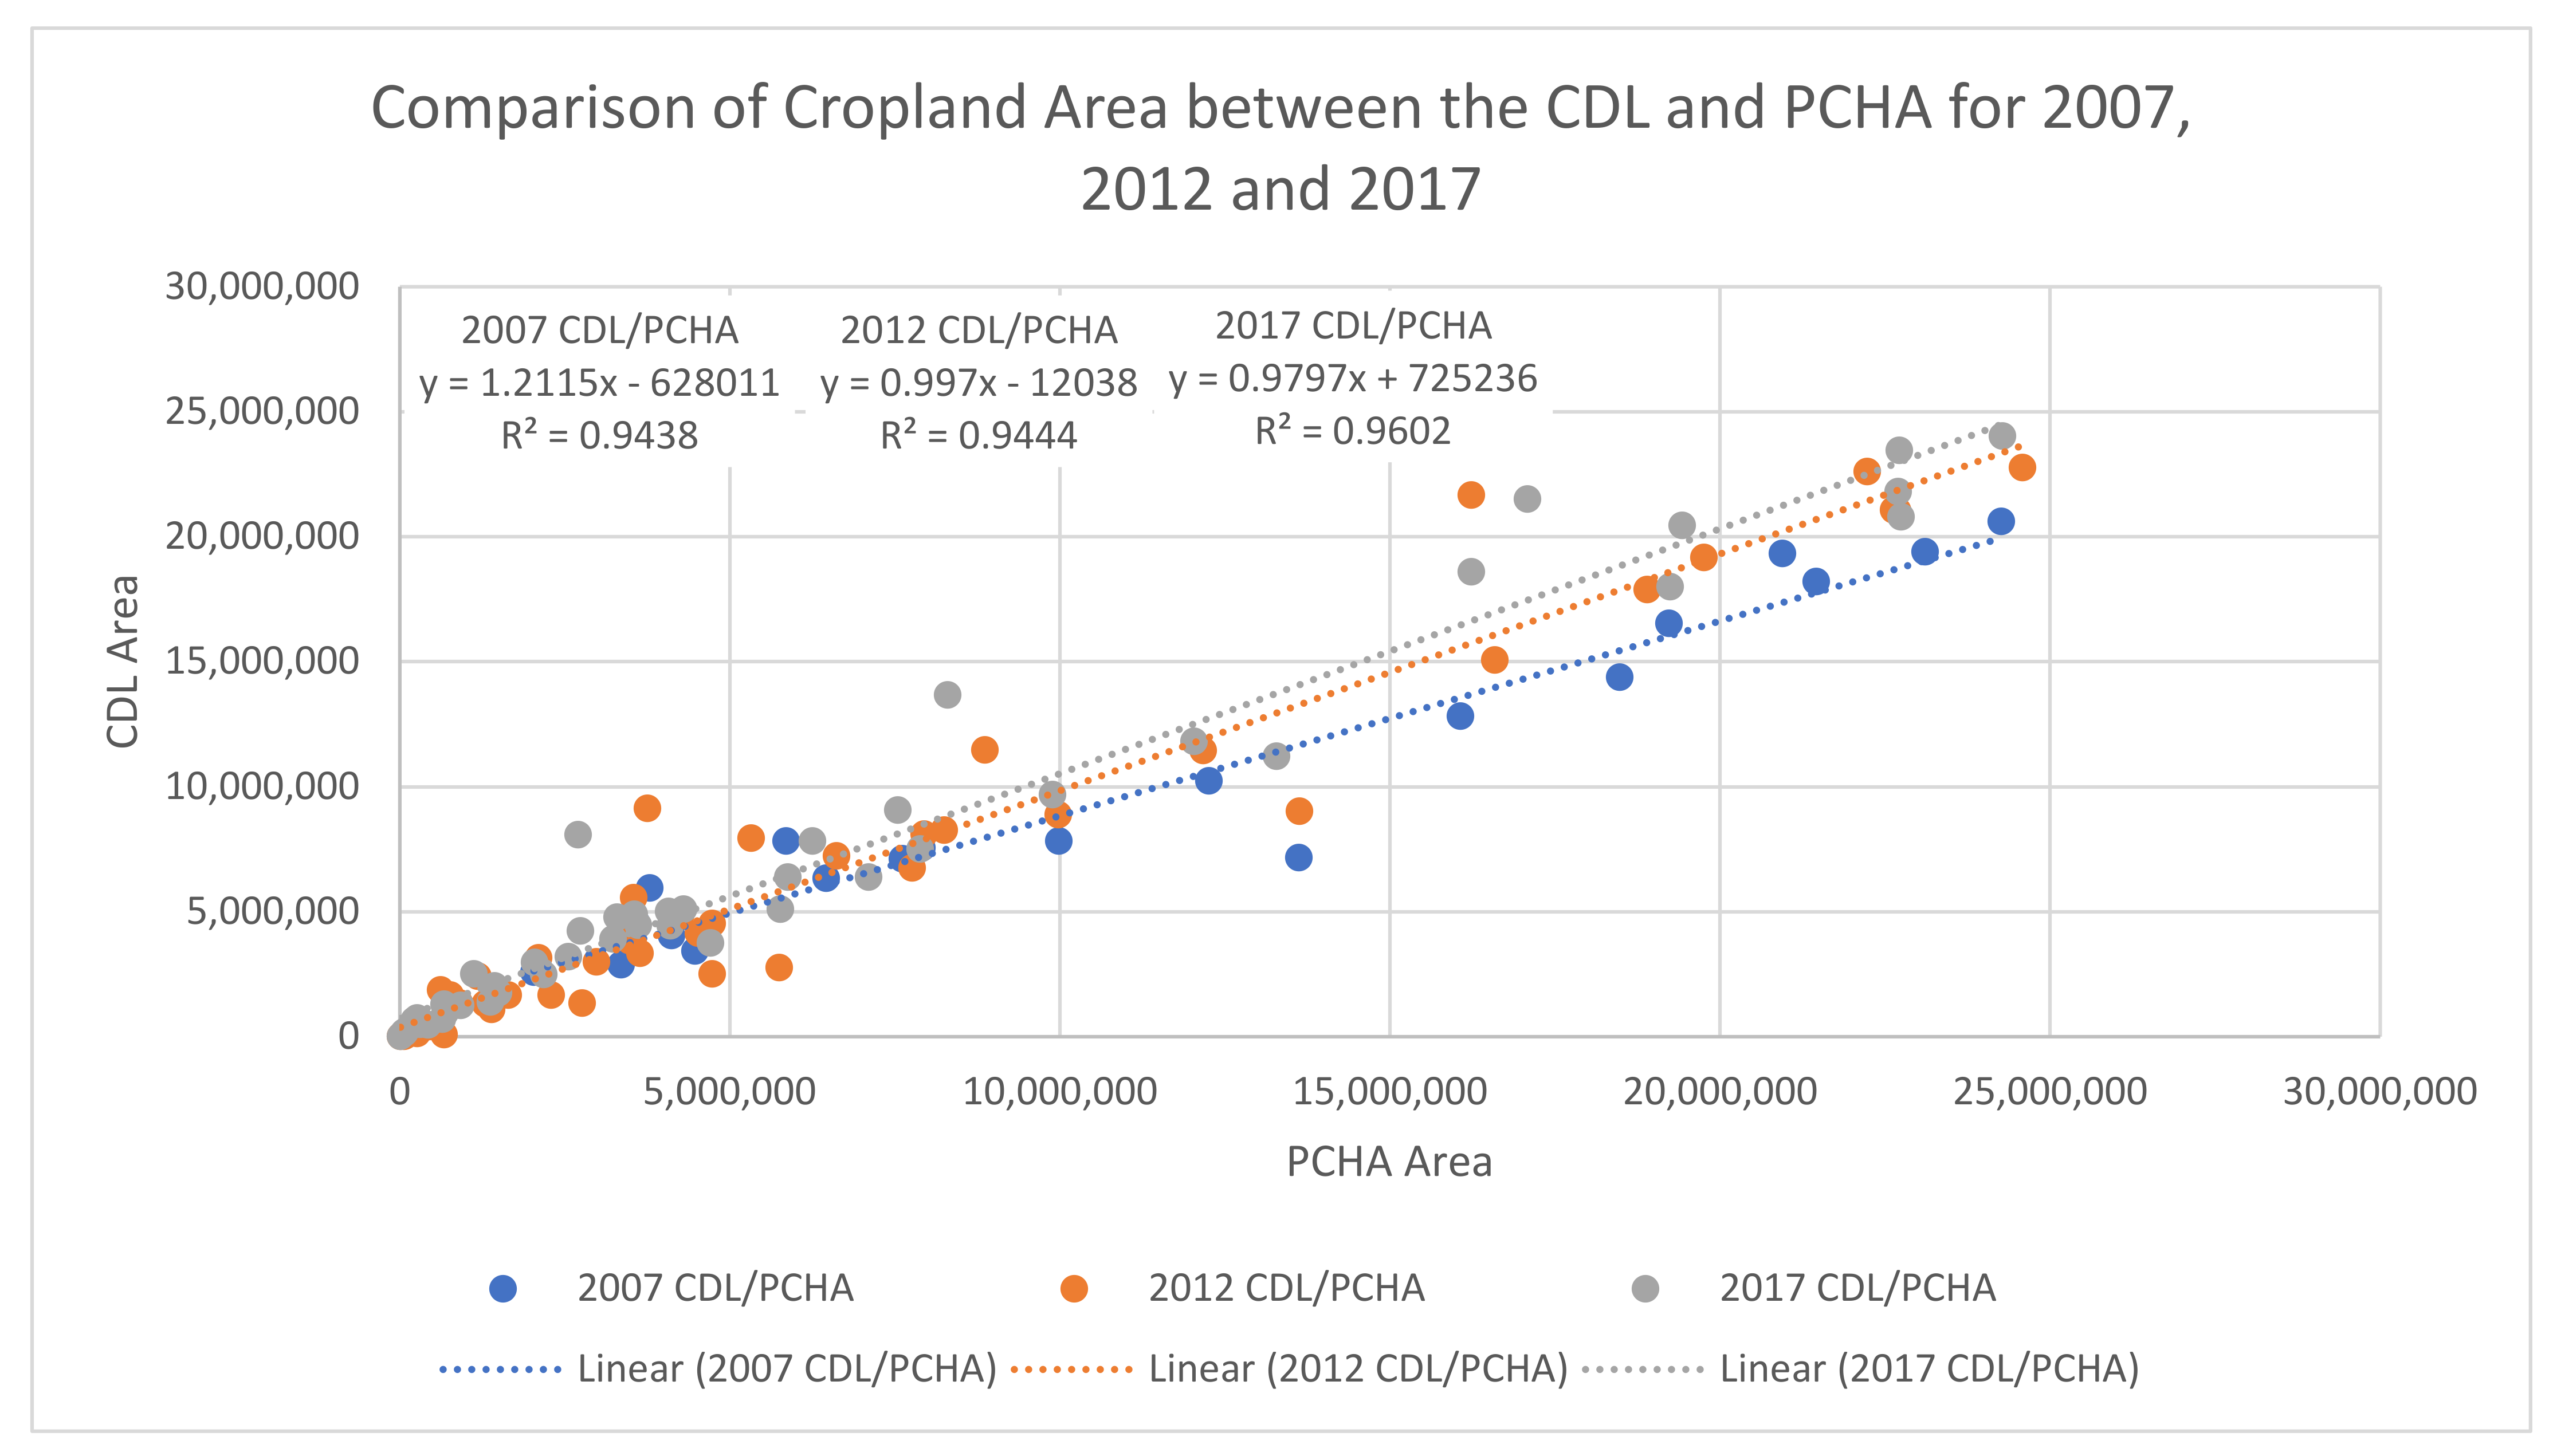
The state-level harvested area reported in the 2007, 2012 and 2012 and 2017 PCHA were plotted against the total area of corresponding cropland estimated using the CDL (
Figure 5). The total cropland area from the two datasets showed a strong correlation in all three years (2007 =
R2 > 0.94, 2012 =
R2 > 0.94 and 2017 =
R2 > 0.96). However, total area estimated using the CDL was approximately 17 million hectares smaller in 2007 and 2 million hectares larger in 2012 than the same crops in the PCHA. This discrepancy (19,784,113 hectares) may help explain much of the additional 16+ million hectares of cropland conversion estimated in the CDL from 2007 to 2012 in comparison to the three other datasets (NRI, Census, and PCHA). Some of this larger estimated change could be the 2012 CDL more accurately estimating crop area than the 2007 CDL. An analysis of the estimated change in cropland from 2007 to 2012 and 2012 to 2017 between the CDL and PCHA indicated a relationship between 2007 and 2012 but not between 2012 and 2017 (
Figure 6). The 2012 to 2017 PCHA for several states had declining crop acreage while the CDL increasing cropland in almost every state.
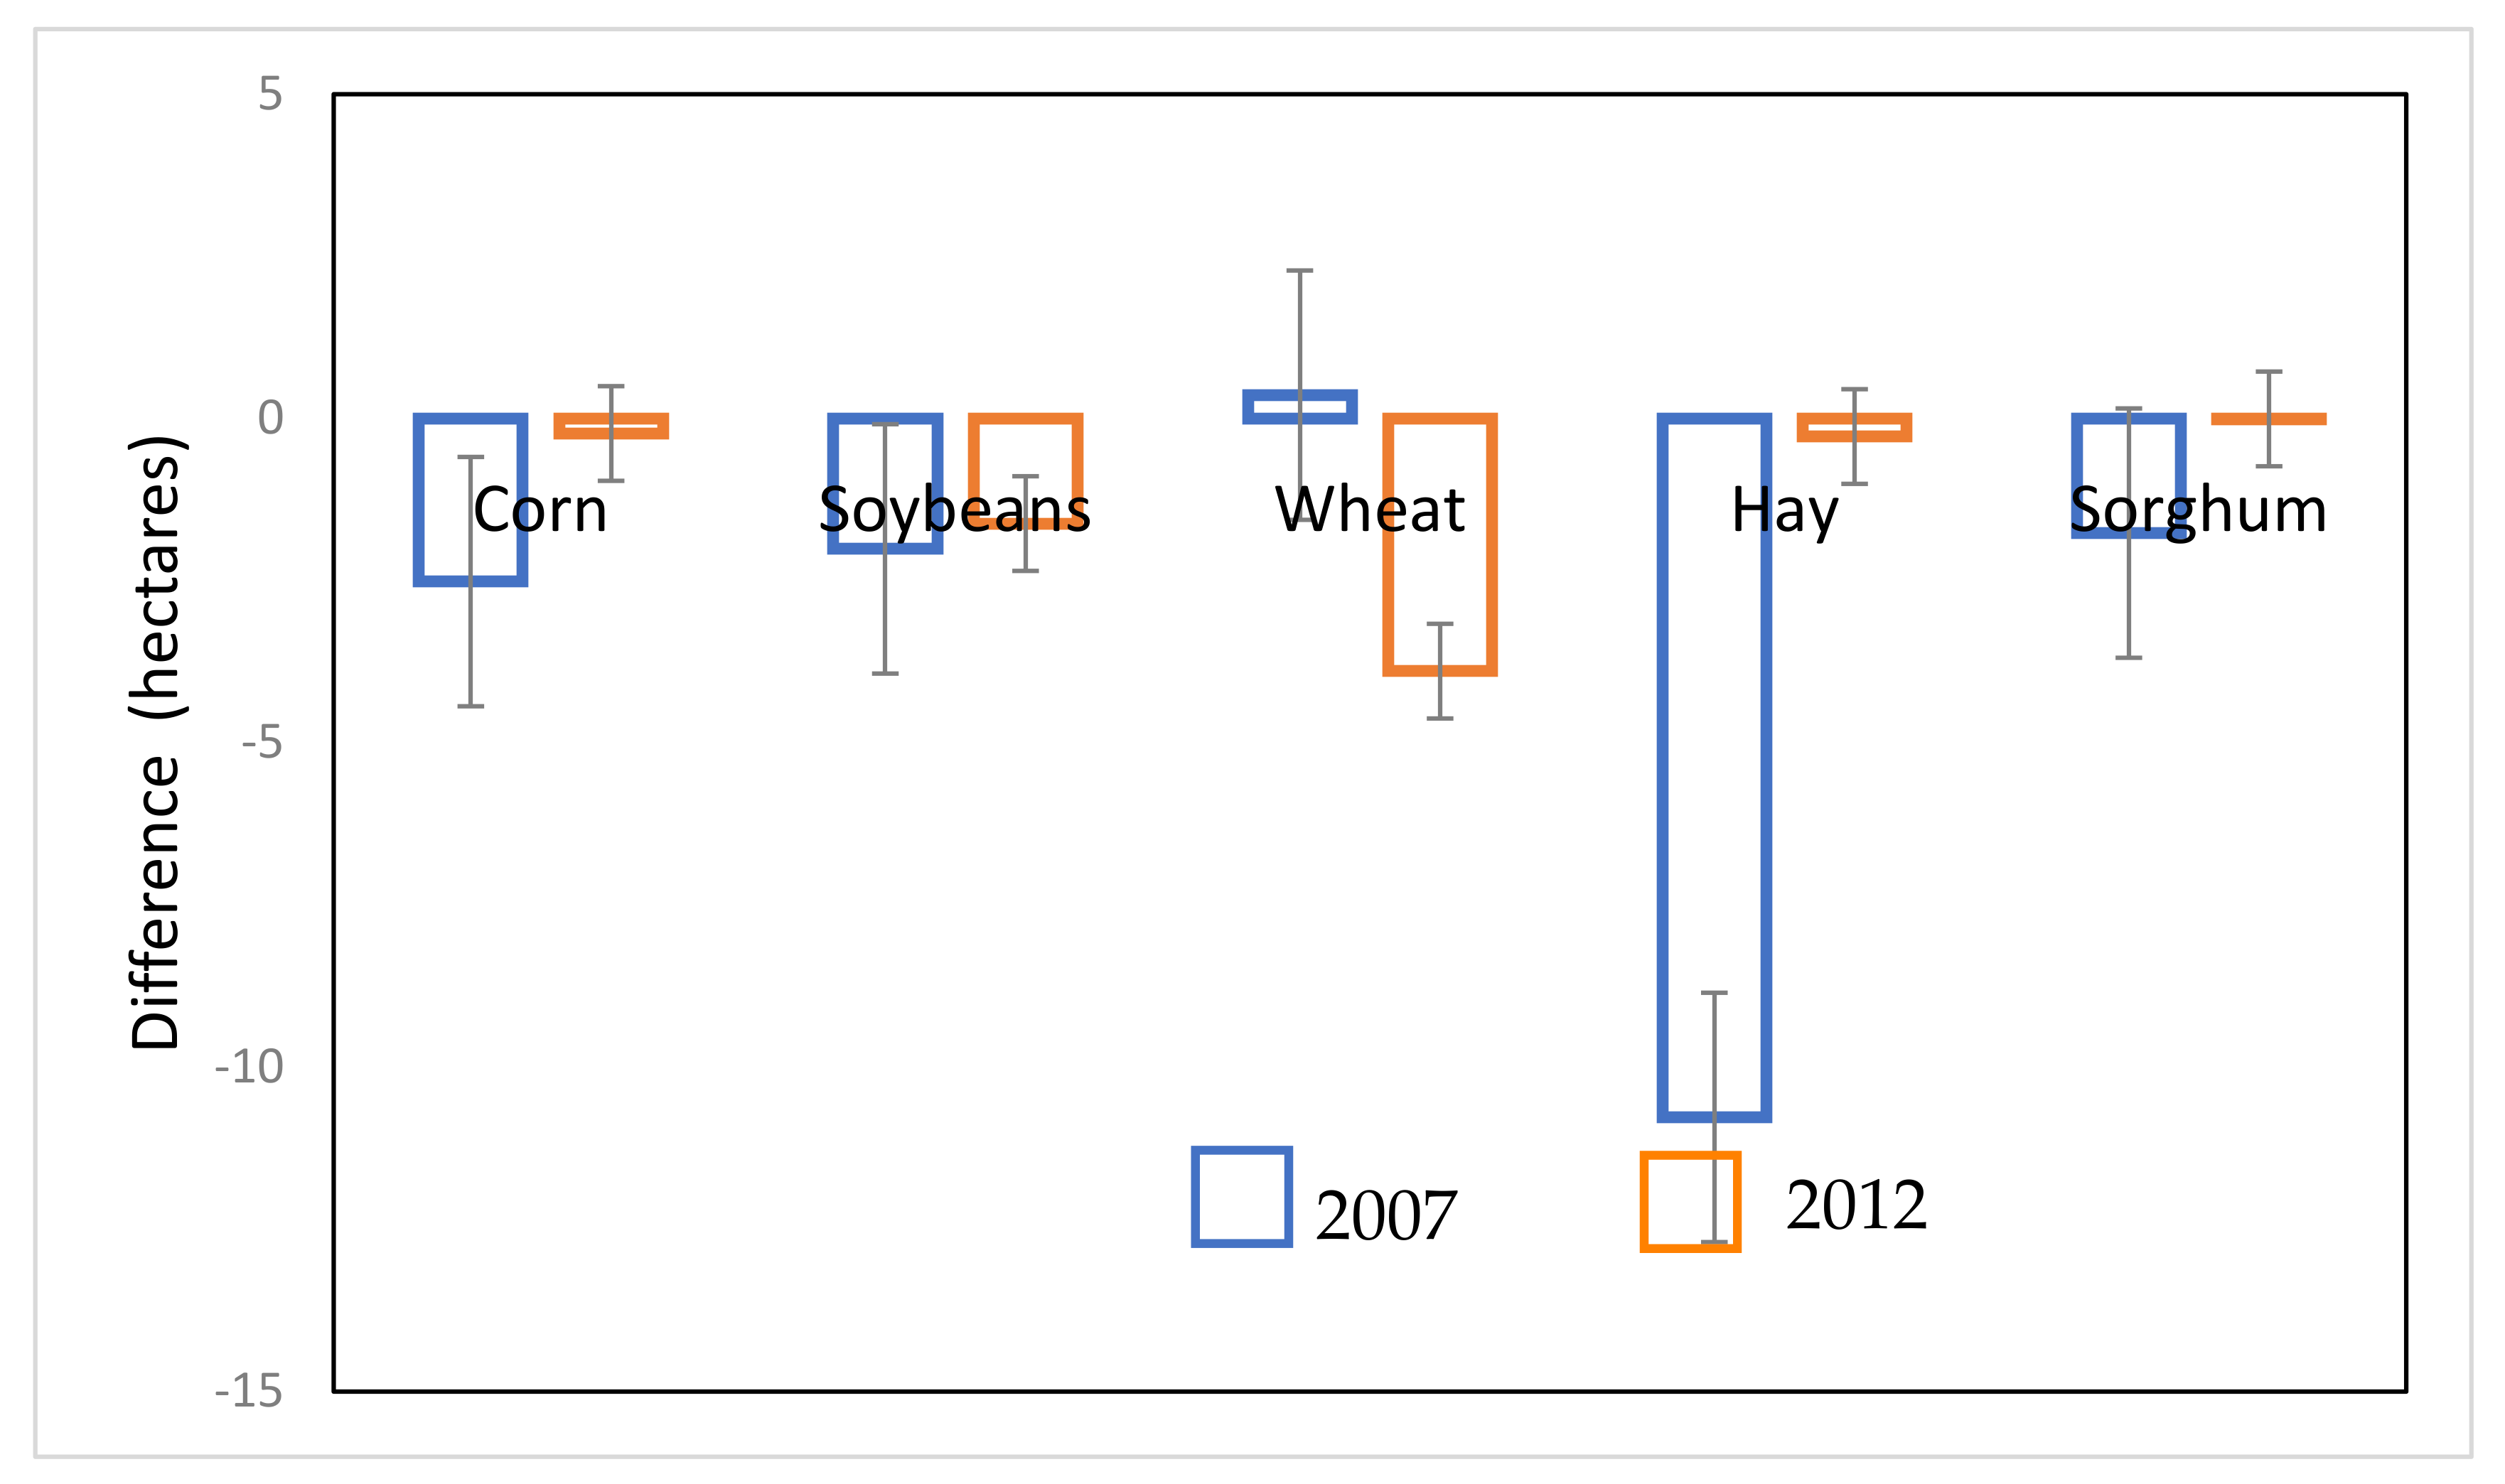
The difference in estimated total area using the 2007 and 2012 PCHA and CDL datasets for the top five crops are presented in
Figure 7. The difference in estimated area was greater in 2007 than 2012. Hay, in the 2007 comparison showed the greatest difference (approximately 10.8 million hectares). For 2012, the difference in estimated area varied across the crops. Wheat showed the greatest difference in estimated area for 2012. The CDL consistently estimated smaller area than that reported in the PCHA, which suggest that some croplands may not be correctly classified in the 2007 and 2012 CDL or overcounted in the PCHA, particularly in 2007. Cropland excluded from the 2007 CDL but not the 2012 CDL would be erroneously included as change to cropland in a change analysis.
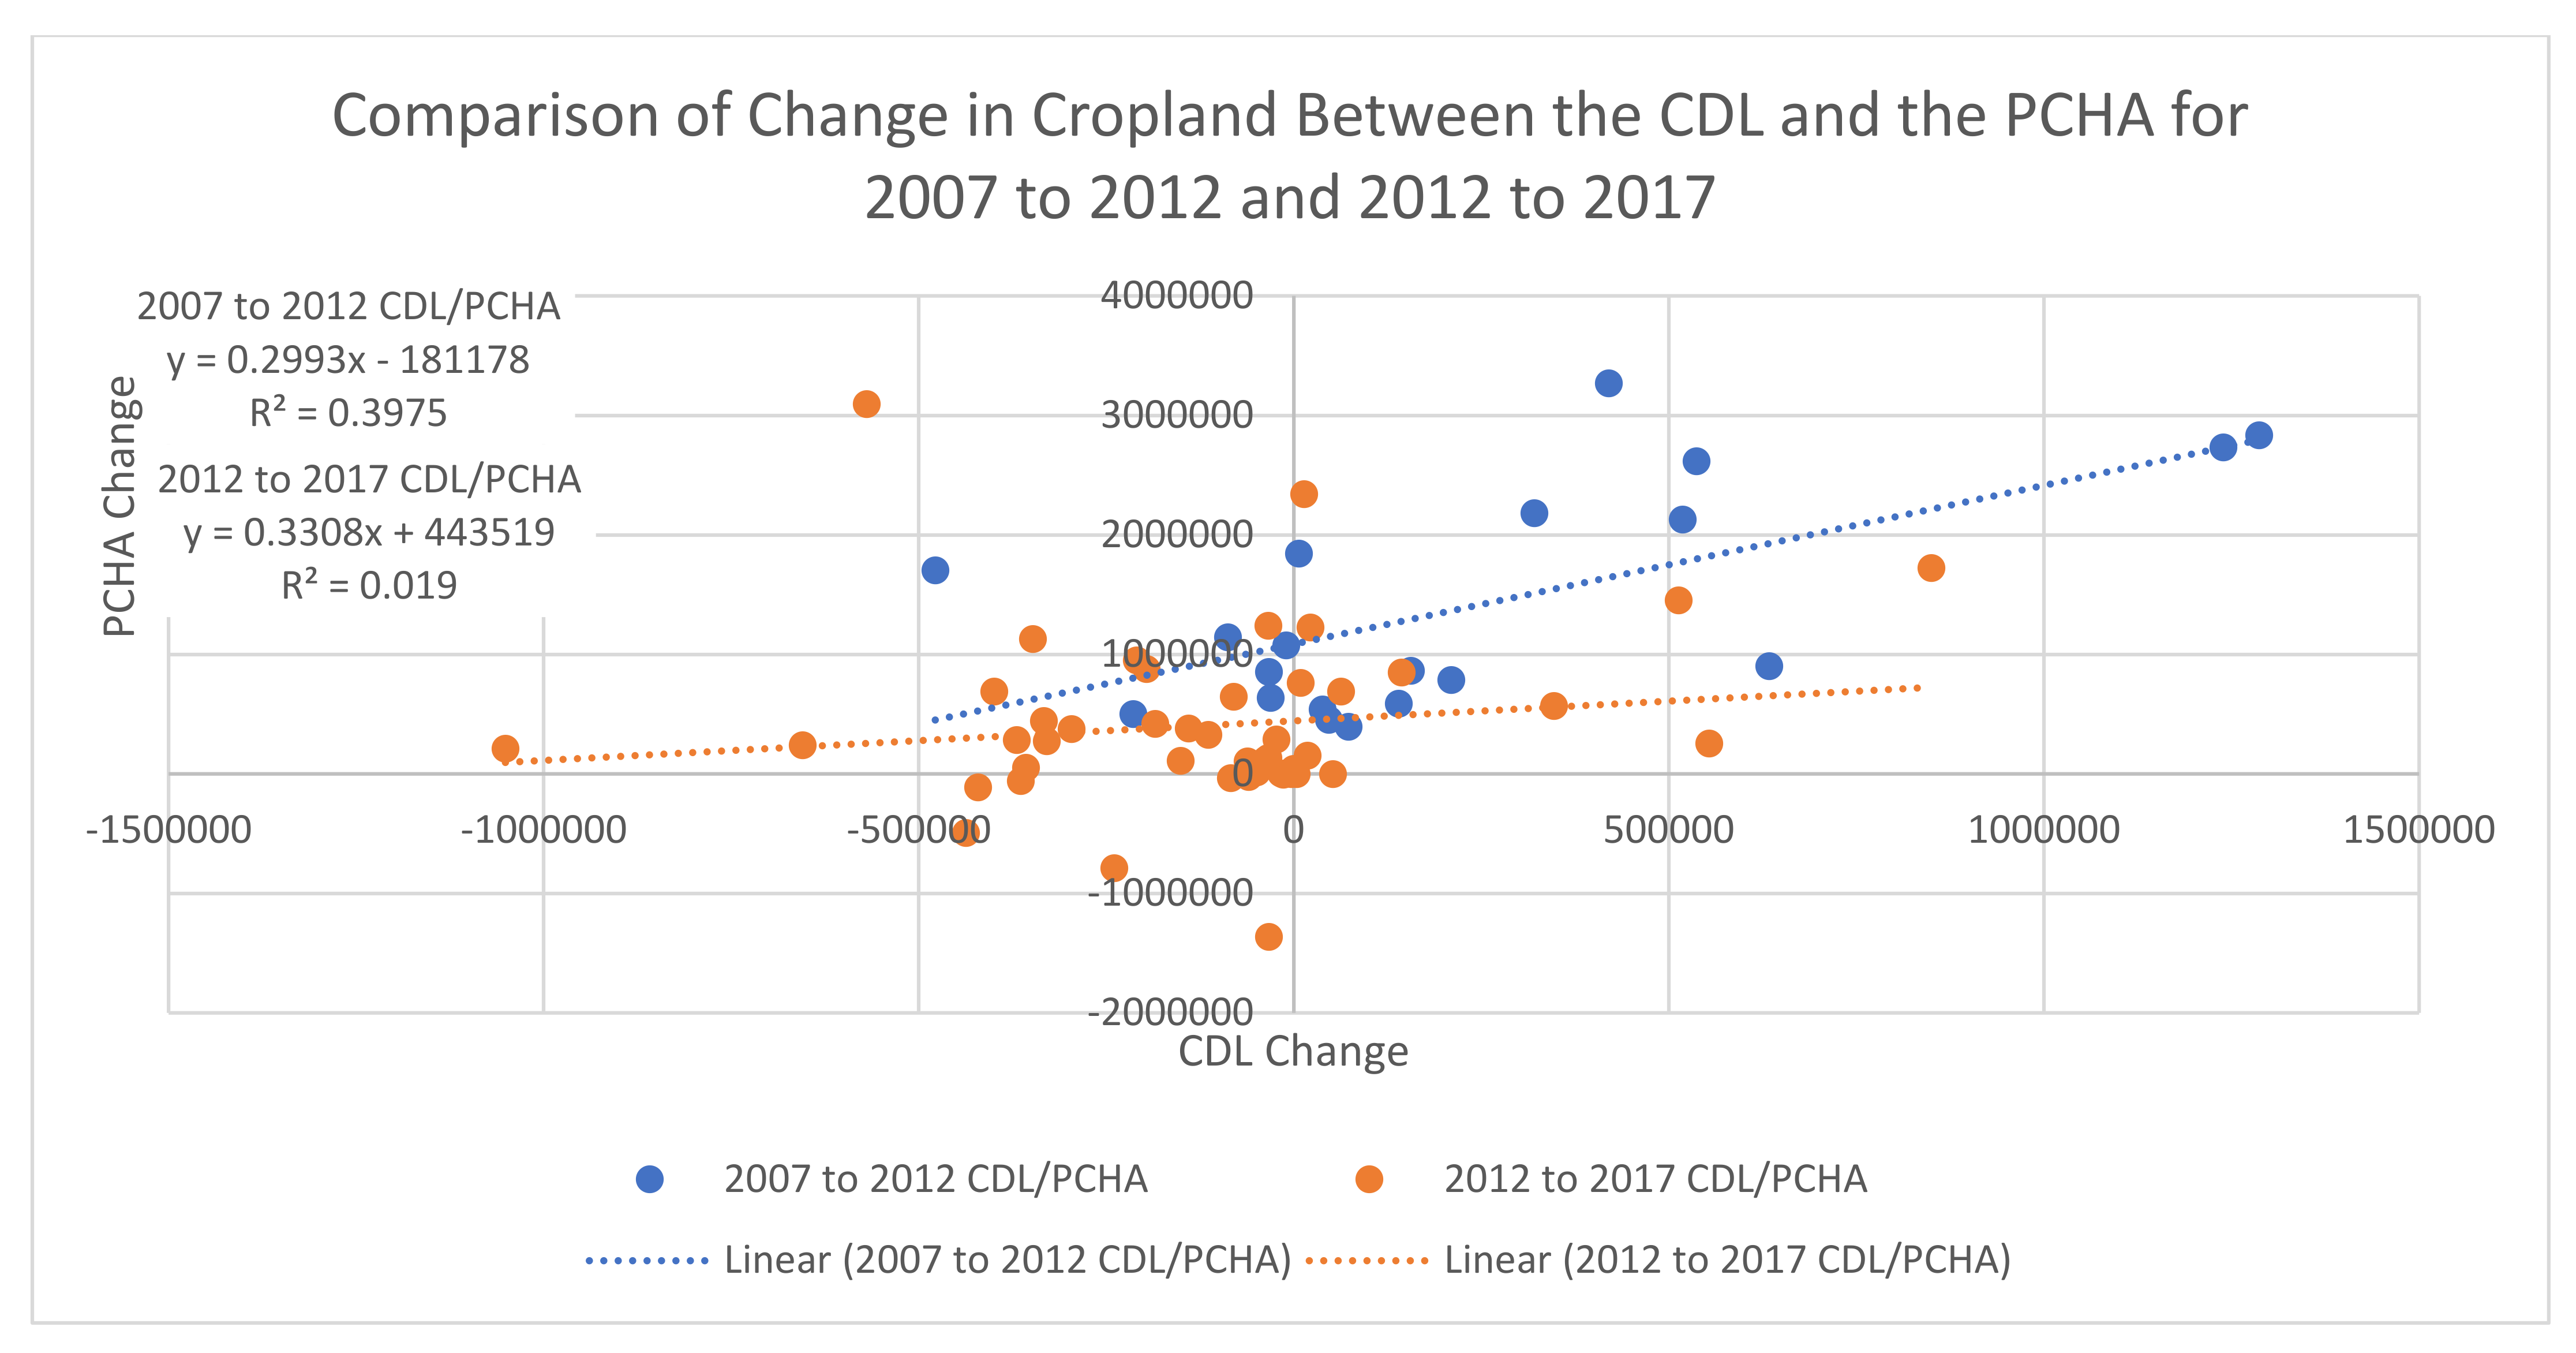
A Database (CDL, NRI, PCHA, and Census) × Time Period (2007–2012, 2012–2017) repeated measures ANOVA was conducted. The results indicated the main effects of Database (F (3, 17) = 33.32,
p = 0.000) and Time Period (F (1, 19) = 31.66,
p = 0.000, as well as a Database × Time Period interaction (F (3,17) = 13.48,
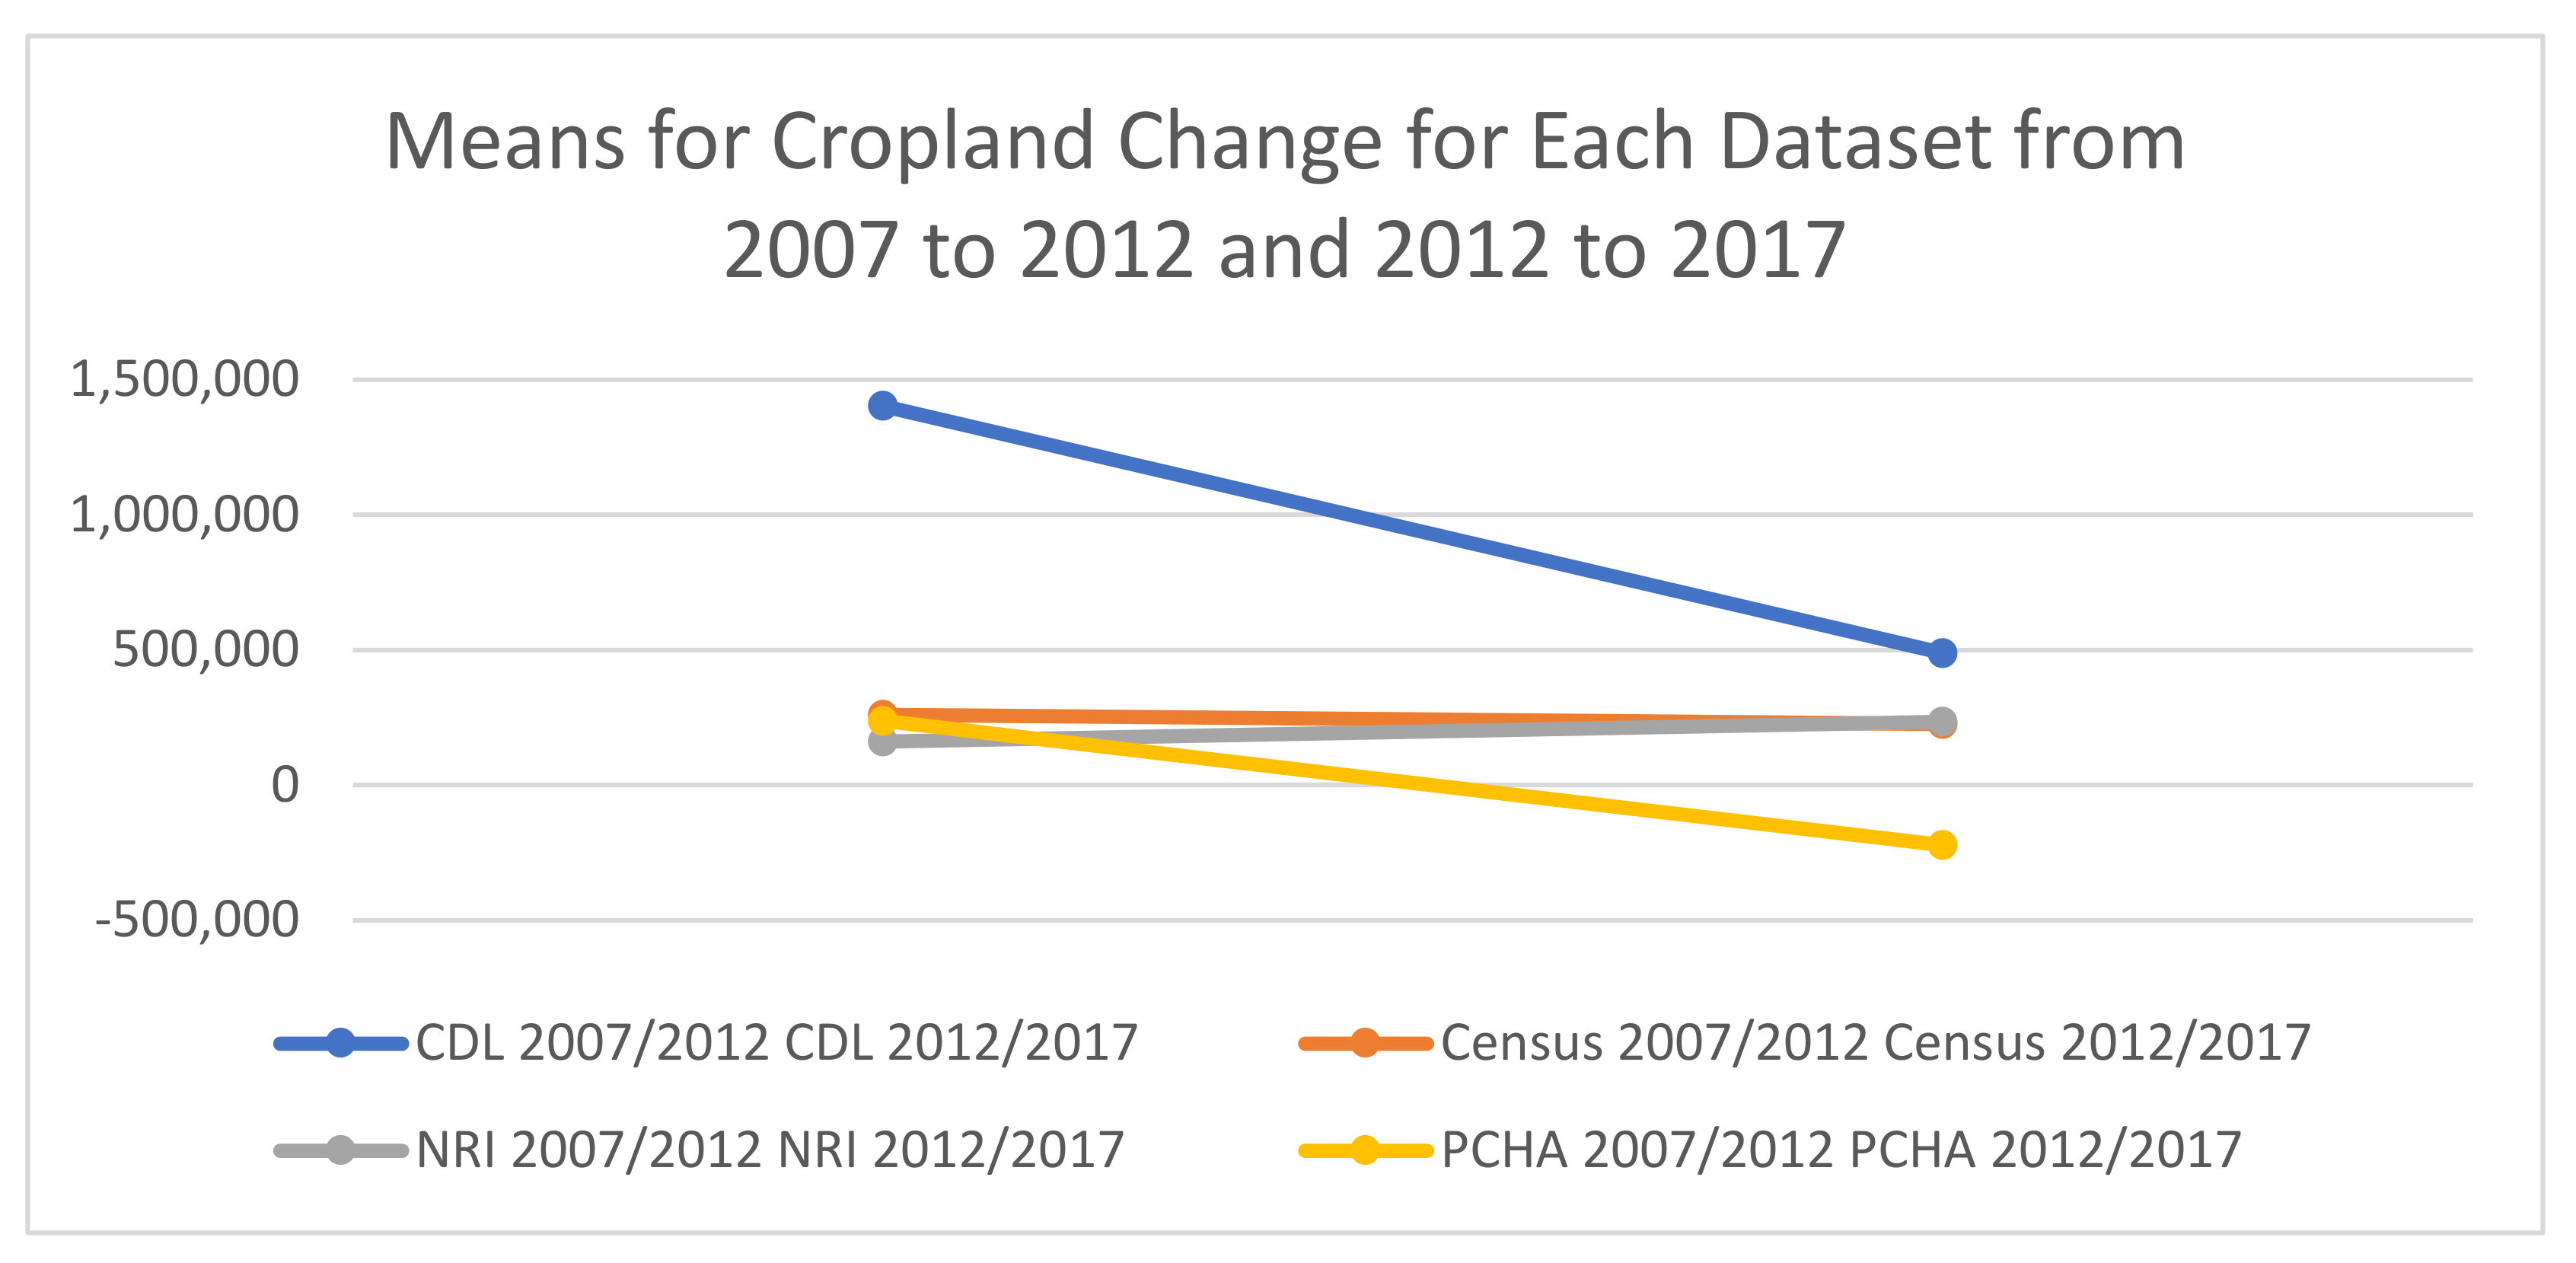
p = 0.000. Decomposition of the interaction within Database indicated that cropland change differed for the CDL and PCHA databases (F (1, 19) = 27.36 and 22.96, ps = 0.000, partial eta-squared =0.54 − 0.59), but not for NRI or Census databases (F (1, 19) = 2.96 and 0.44, ps = 0.102 − 0.514, partial eta-squared = 0.02 − 0.14). The discrepancies between the CDL and PCHA compared to the other two datasets are most likely a result of the very high change area in the 2007 CDL and the fact that the PCHA land area change transitioned from positive to negative (
Figure 8).
3.3. Evaluating Post-Classification-Refinement Techniques for Land Cover Change Estimate Using the CDL
Three separate year to year comparisons (2007 to 2012, 2008 to 2012, and 2012 to 2017) were performed to better understand how post-classification refinement techniques such as those introduced by Lark et al. [
20] can impact the accuracy of cropland change estimation using the CDL. Unfortunately, the analysis performed by Lark et al. used the older 56 m resolution CDL for 2008 and 2009, which is no longer available from the USDA. Therefore, a direct data comparison between the present study and the study conducted by Lark et al. was not possible.
The results from the post-classification refinement performed by Lark et al. [
20] for 2008 to 2012 using the older 56 m CDLs for the years 2008 and 2009 indicated a net change in cropland of +1,207,854 hectares compared to estimated cropland changes for the 2007 to 2012 Census of +2,419,465 hectares and NRI of +1,575,967 hectares. Using the more recent, 30 -meter-resolution CDLs for 2008 to 2012, this study found the CDL estimated +1,141,751 hectares without any modifications (
Table 3). A value very similar to the previous analysis after the modifications were applied. After the application of the post-classification refinement techniques, there was actually an estimated decline in cropland of −1,044,720 hectares. Net change when comparing the 20 states available for 2007 was almost 5 times higher for the CDL with a direct comparison (+11,354,033 hectares) compared to the Census (+2,109,452 hectares) and almost 9 times higher compared to the NRI (+1,307,013 hectares). After applying post-classification refinement techniques estimated cropland change was negative again (−127,380 hectares). The 2012 to 2017 results were similar. Direct net cropland change for the CDL was about 2.5 times higher (+5,992,023 hectares) than estimated by the Census or NRI (+2,309,621 hectares and +2,285,097 hectares, respectively). After post-classification refinement techniques were applied, the CDL estimated positive change like the Census and NRI but only estimated 917,255 hectares, which is 2.5 times lower than the other two datasets. It appears the effectiveness of the post-classification refinement techniques may be dependent on the CDL years compared. It is clear that the methods reduce total estimated change which brings the values closer to those estimated by the Census and NRI, but actually produced an estimated decline in cropland for two of the three datasets.
A justification presented for the modification of the final CDL released by the USDA is that post-classification refinement techniques will improve the accuracy of change estimations. It is recognized that the CDL often estimates more cropland-change when compared to other USDA datasets. The fact, however, that the post-classification refinement techniques reduce estimated change should be a byproduct of error reduction not the only measurement of success. Most of the post-classification techniques reduce estimated change, but are they just removing pixels which reduces change area or are they also improving accuracy? One way to potentially determine improved accuracy would be to compare estimated change from the CDL to estimated cropland change from the Census and NRI after each post-classification refinement step. If the relationship improves the step may be improving accuracy. This study compared estimated cropland change on a state-by-state basis for the CDL after each refinement for the three time periods listed in the study (2007 to 2012, 2008 to 2012 and 2012 to 2017) and performed a regression to the Census and NRI estimated cropland change for the same time periods to see if the relationship between estimated cropland-change in the CDL and the other two datasets improved. The results are in table four. According to the analysis, only one instance out of the 30 tested resulted in an improved R2 between the CDL estimated cropland change and either the Census or NRI, and in no instances was the final R2, after all techniques for post-classification refinement were applied, better than the R2 from a direct comparison. This would indicate that the post-classification refinement techniques, while reducing total area in cropland change, do not necessarily improve accuracy.
3.4. Assessing the Consistency of Cropland Change between Year-to-Year and Initial-and-Final-Year Comparisons
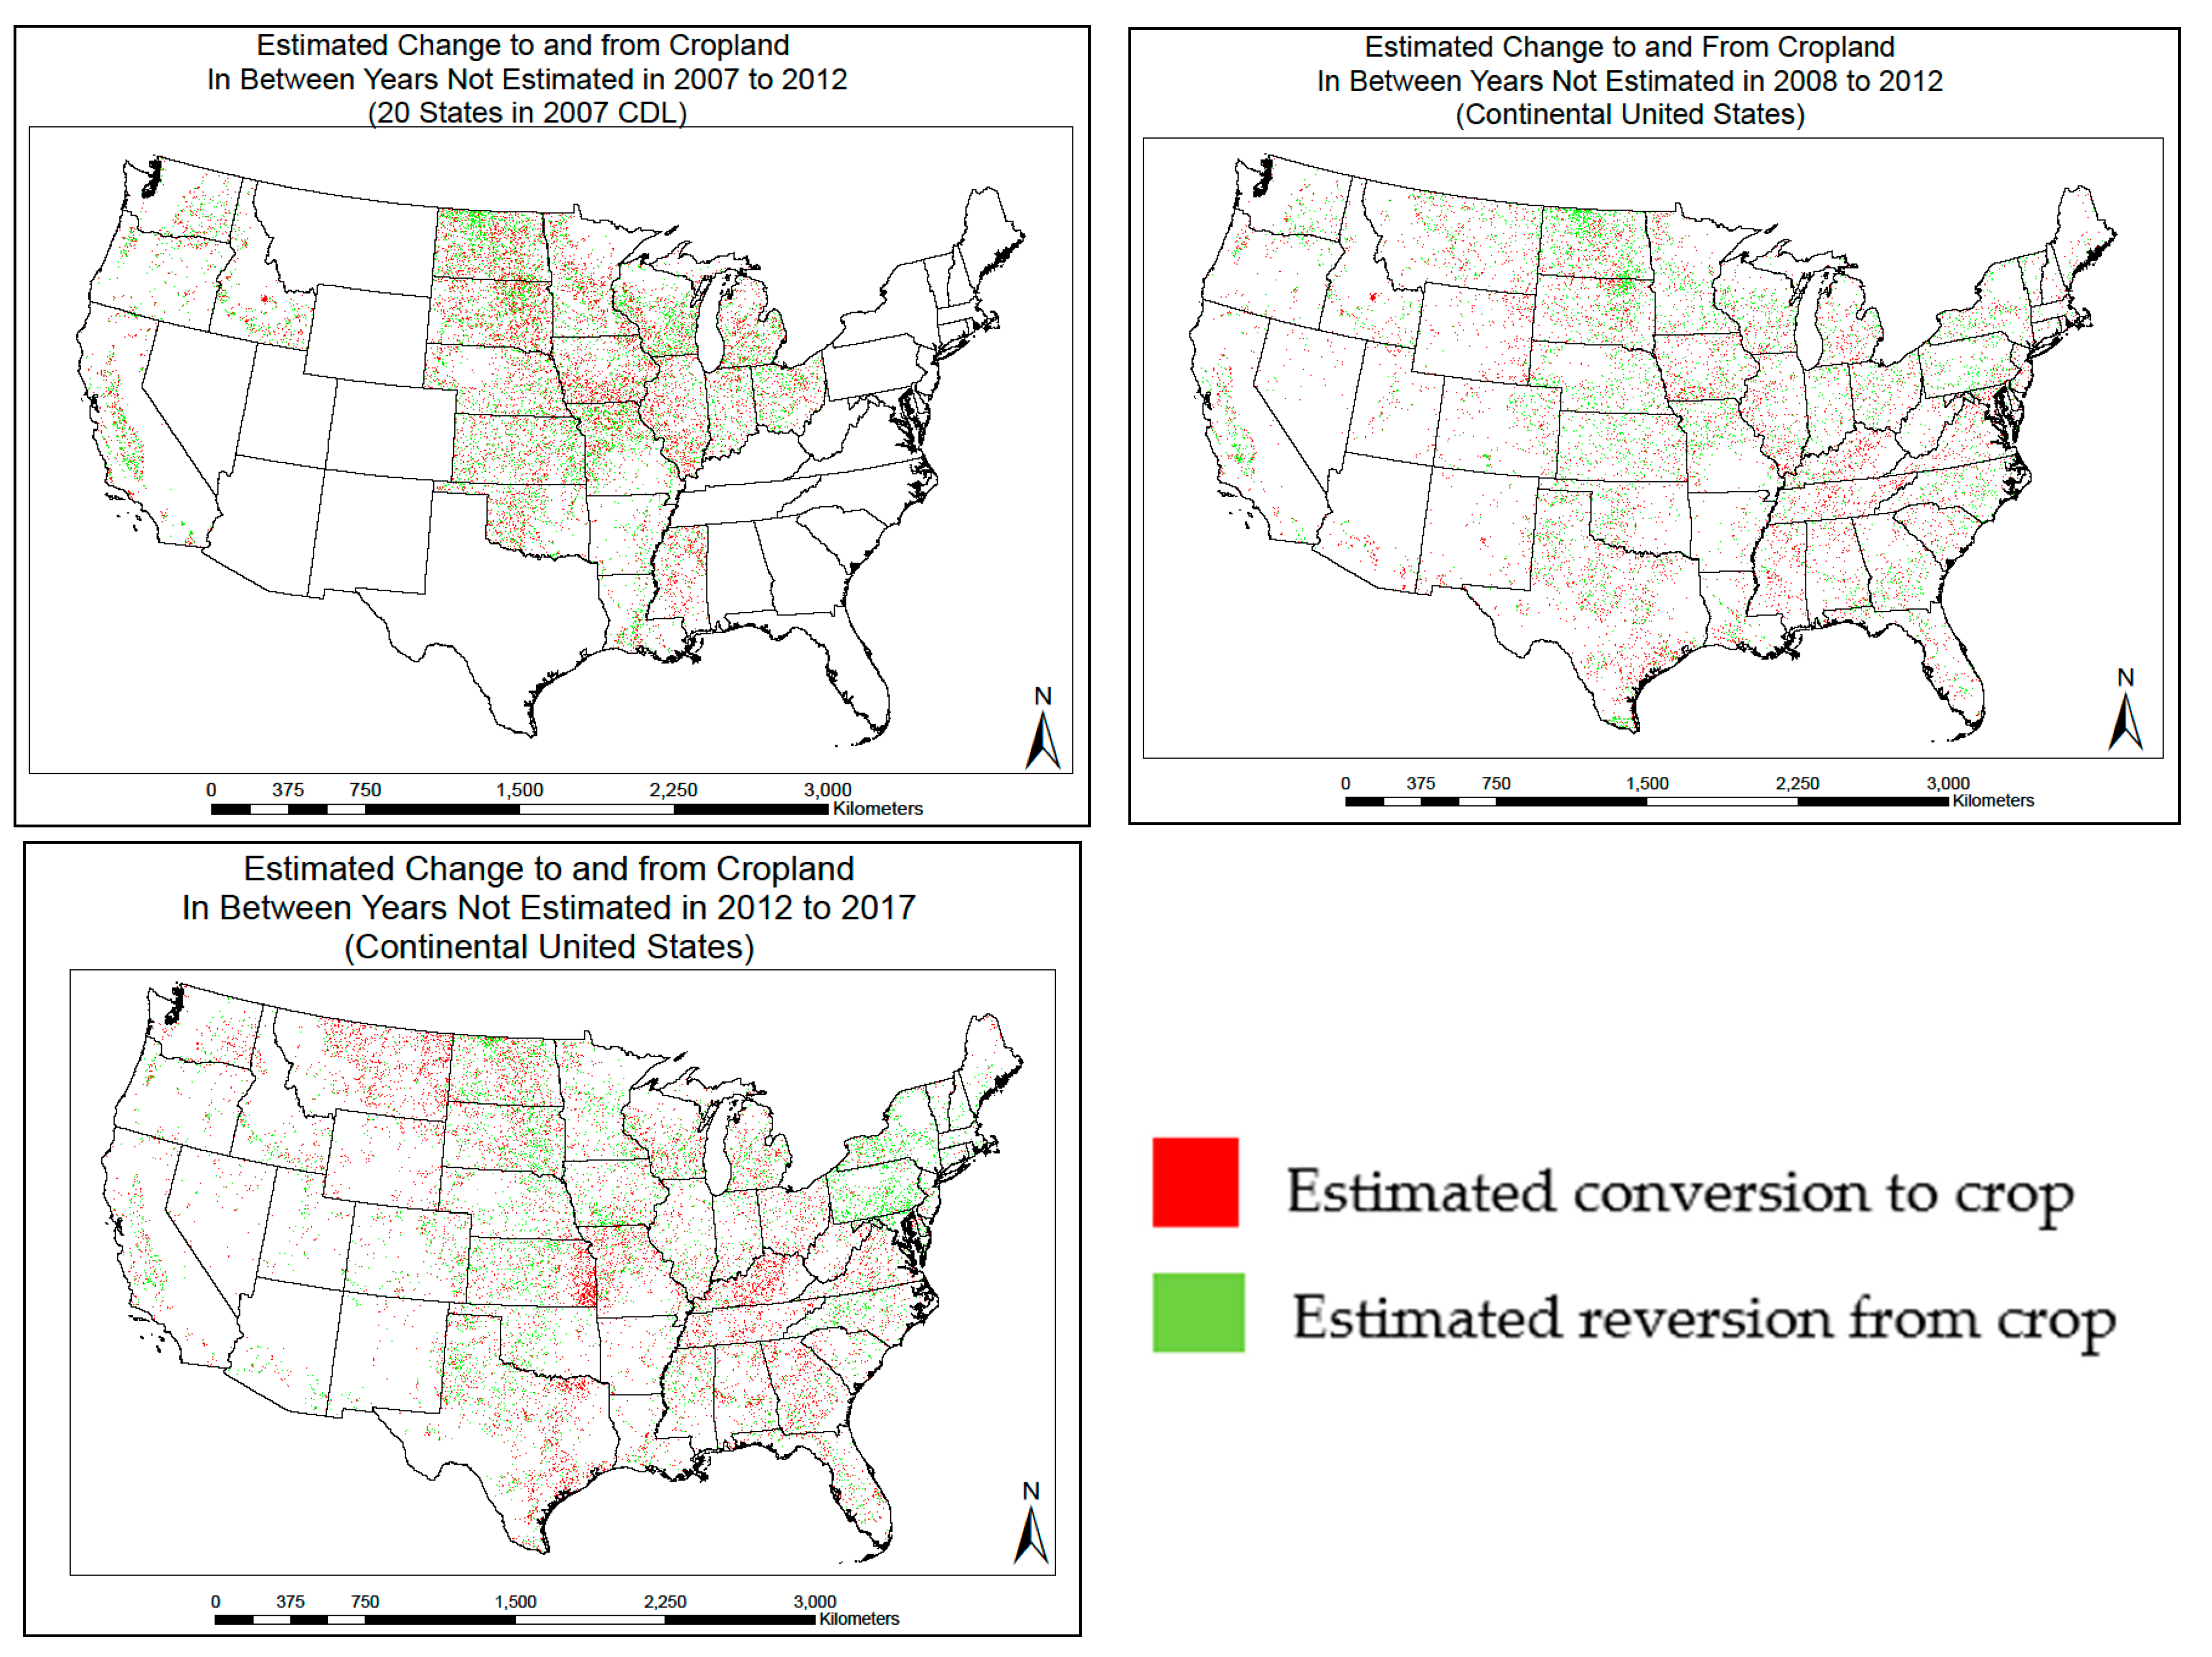
To examine the agreement of estimated cropland-change between an initial-and-final-year (for 2007 to 2012, 2008 to 2012 and 2012 to 2017) to year-to-year cropland changes for years within these time frames, a spatial analysis was performed to measure when cropland change agreed for the different time intervals. The results, in
Figure 9, show millions of hectares of change occurring outside of the initial/final year change footprint. These changes (outside of any change from the initial and final year) would require an unlikely scenario of conversion to crop and reversion back to native land within a 4 to 5 year period. Previous studies such as the study conducted by Lark et al. have only observed change within the footprint of the initial and final years. Any of these additional inconsistencies presented by this study will be removed by the post-classification refinement techniques, which only focus on the initial and final year change footprint.
The cropland change (conversion and reversion) identified in the year-to-year comparison and those identified in the initial-and-final-year comparison using the CDL is presented in map form in
Figure 10. This spatial visualization is useful for examining potential sources of uncertainty in the CDL. The red (conversion estimated in between years but not estimated in initial and final year) and green (reversion estimated in between years but not estimated in initial and final year) indicate large areas of inconsistent change. The agricultural Midwest shows greater dynamics in cropland change than rest of the states examined. Because of substantial net conversion estimated during the analysis period (approximately 17 million hectares), cropland conversion may be observed more easily than cropland reversion. These locations would be outside of the initial and final year change footprint. The discrepancy in these locations between the two different time intervals for change analysis (e.g., the abrupt change between Iowa and Missouri) may stem from data-specific classification schemes or satellite data.
4. Discussion
Based on the analysis, the total cropland area in the 2007, 2012 and 2017 CDLs were strongly correlated with those estimated using the Census and NRI (
R2 > 0.95,
Figure 2). However, total cropland area was approximately 10% to 20% lower in the CDL estimates than those estimated from the NRI and the Census in 2007. This suggests that the three USDA datasets, the CDL, NRI, and Census, share comparable cropland totals across the states in a relative, aspatial manner, and cropland totals by state in a given year may be estimated reliably using the CDL.
The estimated changes in cropland between 2007, 2012 to 2017, showed weak to moderate associations between the CDL and Census and NRI. The strongly correlated total cropland area in a given year (R2 > 0.95) resulting in these moderately correlated cropland changes suggests uncertainty in cropland totals not identified in the single-year analysis.
In both comparisons, several states showed noticeable discrepancies in magnitude and some cases in direction of change (i.e., increase and decrease). These inconsistent totals varied between the CDL-Census and CDL-NRI comparisons. Further examination of these states could provide insight into the nature of discrepancies in cropland change between the datasets. These states could also be good candidates for investigating positional accuracy in cropland in the CDL.
Consistently smaller area estimated using the 2007 CDL than the PCHA across the crop types was unexpected. Based on the anticipated timing of source data collection for the CDL (i.e., before harvest), one would expect larger crop area in the CDL estimate than the PCHA. This may indicate some cropland is not correctly classified in the earlier CDLs or that the PCHA is overestimating crop, particularly in 2007 which is much lower in the CDL than the PCHA dataset. Since the CDL estimates lower crop area, especially in earlier years, compared to the Census and NRI and the PCHA is close to the Census it is more likely that the CDL is incorrect, especially since the CDL catches up to the principal acres in later years. Depending on the crop type, under-classification of cropland is potentially significant in the CDL. These under-classified area in the 2007, 2008 and 2012 CDLs could result in estimated cropland change that are higher than other datasets.
Estimated cropland change from 2007 to 2012 according the CDL would be over a 17 million hectares increase. However, an almost 500,000 hectares decrease in cropland change was estimated from 2008 to 2012 and an increase of almost 8 million hectares from 2012 to 2017. The 2007 CDL estimates over 76 million hectares in crops while the 2012 CDL estimated over 95 million hectares. This would be a 28% increase in crop from 2007 to 2012. The PCHA dataset estimates just over 93 million hectares in crops in the same states in 2007. This is 16+ million hectares than the CDL estimates. In 2012, the difference is actually 2+ million more crop hectares for the CDL than the PCHA resulting in an increase in cropland area for the CDL compared to cropland area in the PCHA of over 18 million hectares. The 18+ million hectares increase in cropland area in the CDL would help explain a large portion of the 17+ million hectares in change estimated in the CDL from 2007 to 2012. These lands would be identified as change to crop in a land cover change analysis.
Post-classification refinement techniques tested in this study primarily resulted in no change or reduced agreement between datasets (CDL to Census and NRI) (
Table 4). The effectiveness in reducing area associated with change using a complete sequence of the post-classification refinement techniques seems to be dataset dependent as some year-to-year change was reduced to negative cropland change while other year to year change was closer to Census and NRI values (
Table 3). It should be also noted that using post-classification processing alters the values of a USDA-released dataset (the CDL) and negates any accuracy assessments associated with the CDL itself.
If the CDL land cover classification is suitable for quantifying the area of cropland change, estimated cropland change should be comparable for different time intervals within the same timeframe. However, when examining cropland change (conversion and reversion) spatially, the locations of the change were noticeably different between any two time-intervals (
Figure 8 and
Figure 9). Meaning cropland change not identified at all in the primary years (for instance from 2012 to 2017) was identified in between years (for instance 2013 to 2014). An important consideration is that cropland cannot convert directly to another land cover but would transition to fallow for at least one to two years prior requiring the land to remain in the cropland category for at least two years. These characteristics in cropland change demonstrated that a sequential analysis of not only net conversion but also conversion and reversion would be useful for understanding positional uncertainty when quantifying cropland change using the CDL. Most locations of estimated change in the year-to-year comparisons (1-year interval) were not observed in the comparison in longer time-interval (i.e., the 2012 and 2017 comparison) indicating a large source of potential error. Thus, systematically evaluating land cover using high resolution imagery could provide additional insights for reliability of the CDL classification.
5. Conclusions
Four analyses were performed in this study to understand the performance of the CDL in the context of cropland change estimation using the 2007–2012, 2008-2012 and 2012-2017 time periods: (1) comparison of the CDL, NRI, and Census, (2) comparison between the CDL and the PCHA dataset, (3) effectiveness evaluation of post-classification refinement techniques on the CDL, and (4) consistency assessment of CDL-estimated cropland change from overlapping time intervals. The CDL, NRI, and Census showed comparable total cropland area at the state level when examining one year at a time. However, the estimated change in cropland area by state showed noticeable differences. Estimated cropland change over time using the CDL would yield very different trends with those estimated from the NRI and Census. Post-classification refinement techniques intended to improve the accuracy of cropland change estimates for the CDL did not appear to improve the overall association with the Census or NRI (i.e., improve R2). Multiple factors seem to limit the correlation to the NRI or Census in general. The CDL appeared to estimate less cropland in earlier years for instance. Locations of change to cropland identified in the CDL are not consistently at the same location but move to different locations from year to year, indicating likely inconsistencies. Therefore, the limitations of the CDL should be made clear and efforts to remove these limitations should include evidence of correction such as a new accuracy assessment. The analyses presented in this study could be used as a framework for evaluating the CDL in future land cover change studies if there are new vetting/error reducing strategies to be tested.
Major insights from our analysis for CDL-based land use change work include:
Careful determination of classes or crop types for defining ‘cropland’ for each dataset is important for meaningful comparison of cropland area between datasets.
A sequential analysis is useful for understanding positional uncertainty when quantifying cropland change using the CDL. In addition to net conversion, analysis of conversion and reversion will provide insights for potential inconsistencies or uncertainty in the CDL classification. The spatial comparison in conversion and reversion further suggests positional uncertainty of cropland classified in the CDL.
Recommended future studies include: (1) inclusion of more recent datasets (i.e., CDL, NRI, Census, and PCHA dataset, USGS Land Cover Monitoring, Assessment) in the data evaluation for estimating cropland change to improve robustness of findings, (2) a verification of cropland or non-cropland using high resolution imagery in transition areas with anticipated high uncertainties to provide additional insights for the reliability of the CDL classification, and (3) Year-to-year ground information to allow for new accuracy assessments to be applied after post-classification refinement are made.
Supplementary Materials
The following are available online at
https://www.mdpi.com/article/10.3390/ijgi10050281/s1, Figure S1. Workflow of determining cropland change using the Crop Data Layer. Figure S2. Analysis method for comparison of estimated change between years to estimated change in 2007 to 2012.
Author Contributions
Conceptualization, Ken Copenhaver, Yuki Hamada, Steffen Mueller and Jennifer B. Dunn; methodology, Ken Copenhaver and Steffen Mueller; formal analysis Ken Copenhaver, Data curation, Ken Copenhaver, investigation Steffen Mueller; writing—original draft, Yuki Hamada; writing—review and editing, Ken Copenhaver, Steffen Mueller, Jennifer B. Dunn; Oversight, Jennifer B. Dunn. All authors have read and agreed to the published version of the manuscript.
Funding
This project was funded by the U.S. Environmental Protection Agency (EPA), grant number EPA Order No. EP-15-C-000044.
Institutional Review Board Statement
Not applicable.
Informed Consent Statement
Not applicable.
Data Availability Statement
Acknowledgments
The authors thank four anonymous reviewers for providing reviews and constructive criticism to improve the quality of the manuscript. The views expressed in this manuscript are those of the authors and do not necessarily reflect the views or policies of the U.S. EPA. Mention of trade names or commercial products is for descriptive purposes only and does not constitute endorsement or recommendation for use by the United States Government. The authors would also like to thank Christopher Clark of U.S. EPA Integrated Environmental Assessment Branch, Jan Lewandrowski of USDA Office of the Chief Economist for their assistance and extensive review of the paper and Randy Pearson and Joshua Pritsolas of the Laboratory for Applied Remote Sensing at Southern Illinois University Edwardsville for their assistance with methods, and Edelyn Verona of the University of South Florida for assistance with statistical analyses.
Conflicts of Interest
The authors declare no conflict of interest.
Appendix A
Figure A1.
Crop classes in the Cropland Data Layer that were included in total cropland calculation.
Figure A1.
Crop classes in the Cropland Data Layer that were included in total cropland calculation.
Table A1.
Crop types or classes included in the Principal Crops Harvested Acreage dataset and in the Cropland Data Layer defined in this study.
Table A1.
Crop types or classes included in the Principal Crops Harvested Acreage dataset and in the Cropland Data Layer defined in this study.
| Cropland Data Layer | Principal Crops Harvested Acreage Dataset |
|---|
| Barley | Barley |
| Canola | Canola |
| Chickpeas | Chickpeas |
| Corn | Corn |
| Cotton | Cotton |
| Dry edible beans | Dry edible beans |
| Other hay non-alfalfa + alfalfa | Hay |
| Millet | Millet |
| Oats | Oats |
| Peanuts | Peanuts |
| Potatoes | Potatoes |
| Rice | Rice |
| Rye | Rye |
| Sorghum | Sorghum |
| Soy | Soy |
| Sugarbeets | Sugarbeets |
| sugarcane | Sugarcane |
| Sunflower | Sunflower |
| Tobacco | Tabacco |
| Wheat (winter, spring, durum) | Wheat |
Table A2.
State and national level total cropland estimates of 2007 and 2012 and the difference between the two years with estimated error margins in thousands of hectares.
Table A2.
State and national level total cropland estimates of 2007 and 2012 and the difference between the two years with estimated error margins in thousands of hectares.
| State | 2007 | 2012 | Difference | Combined Error |
|---|
| Total Cropland | Error | Total Cropland | Error |
|---|
| Alabama | 906.3 | ±74.7 | 939.9 | ±88.0 | 33.6 | ±162.6 |
| Arizona | 365.2 | ±57.7 | 360.2 | ±60.7 | −5.0 | ±118.4 |
| Arkansas | 2955.0 | ±179.2 | 2890.3 | ±180.5 | –64.7 | ±359.7 |
| California | 3718.2 | ±266.4 | 3698.5 | ±264.4 | –19.7 | ±530.8 |
| Colorado | 3151.5 | ±227.2 | 3218.5 | ±220.1 | 67.0 | ±447.3 |
| Connecticut | 70.1 | ±12.6 | 70.0 | ±12.8 | –0.1 | ±25.4 |
| Delaware | 168.8 | ±15.2 | 166.2 | ±15.4 | –2.5 | ±30.6 |
| Florida | 1144.9 | ±138.1 | 1152.6 | ±122.7 | 7.8 | ±260.7 |
| Georgia | 1689.2 | ±107.4 | 1694.9 | ±114.7 | 5.7 | ±222.1 |
| Idaho | 2135.7 | ±142.9 | 2179.0 | ±135.7 | 43.3 | ±278.5 |
| Illinois | 9665.4 | ±90.8 | 9680.4 | ±97.7 | 15.0 | ±188.5 |
| Indiana | 5365.4 | ±96.8 | 5385.6 | ±94.0 | 20.2 | ±190.8 |
| Iowa | 10,309.3 | ±91.7 | 10,509.0 | ±103.1 | 199.7 | ±194.8 |
| Kansas | 10,362.5 | ±159.5 | 10,454.7 | ±197.0 | 92.2 | ±356.6 |
| Kentucky | 2109.6 | ±117.8 | 2211.0 | ±104.6 | 101.3 | ±222.4 |
| Louisiana | 2047.9 | ±76.0 | 2000.4 | ±74.7 | –47.4 | ±150.6 |
| Maine | 146.7 | ±39.2 | 142.9 | ±37.4 | –3.8 | ±76.6 |
| Maryland | 567.5 | ±36.7 | 561.1 | ±36.9 | –6.4 | ±73.6 |
| Massachusetts | 90.3 | ±18.5 | 88.5 | ±17.9 | –1.7 | ±36.4 |
| Michigan | 3208.3 | ±117.5 | 3235.3 | ±119.2 | 27.0 | ±236.7 |
| Minnesota | 8431.5 | ±212.8 | 8526.3 | ±195.7 | 94.9 | ±408.6 |
| Mississippi | 1912.8 | ±92.0 | 1932.3 | ±98.0 | 19.4 | ±190.0 |
| Missouri | 5431.8 | ±113.2 | 5647.8 | ±107.5 | 216.0 | ±220.7 |
| Montana | 5656.8 | ±347.9 | 195.4 | ±19.9 | –5461.4 | ±367.8 |
| Nebraska | 7919.2 | ±169.1 | 622.3 | ±80.7 | –7296.9 | ±249.8 |
| Nevada | 267.0 | ±62.7 | 2073.0 | ±92.0 | 1806.1 | ±154.7 |
| New Hampshire | 48.4 | ±10.9 | 2083.8 | ±104.5 | 2035.5 | ±115.4 |
| New Jersey | 200.7 | ±20.7 | 10,024.0 | ±175.1 | 9823.2 | ±195.7 |
| New Mexico | 617.9 | ±80.7 | 4491.6 | ±92.8 | 3,873.7 | ±173.5 |
| New York | 2025.7 | ±89.0 | 3548.8 | ±170.9 | 1,523.2 | ±259.9 |
| North Carolina | 2141.0 | ±93.6 | 1412.8 | ±124.3 | –728.2 | ±218.0 |
| North Dakota | 9735.3 | ±170.3 | 2038.8 | ±110.2 | –7696.4 | ±280.5 |
| Ohio | 4475.8 | ±90.7 | 7.0 | ±2.7 | –4468.9 | ±93.4 |
| Oklahoma | 3573.8 | ±162.5 | 885.0 | ±64.7 | –2688.8 | ±227.2 |
| Oregon | 1425.3 | ±128.2 | 7133.6 | ±152.5 | –5708.3 | ±280.7 |
| Pennsylvania | 2017.4 | ±106.8 | 1838.9 | ±81.7 | –178.5 | ±188.5 |
| Rhode Island | 7.2 | ±2.7 | 9670.2 | ±300.3 | 9663.1 | ±302.9 |
| South Carolina | 896.7 | ±60.7 | 588.5 | ±127.4 | –308.2 | ±188.1 |
| South Dakota | 6912.8 | ±144.8 | 215.4 | ±25.7 | –6697.4 | ±170.4 |
| Tennessee | 1746.6 | ±80.4 | 1127.0 | ±75.6 | –619.6 | ±156.0 |
| Texas | 9841.7 | ±297.0 | 2359.8 | ±146.0 | –7481.9 | ±443.0 |
| Utah | 601.8 | ±127.3 | 291.0 | ±36.4 | –310.8 | ±163.7 |
| Vermont | 220.8 | ±25.2 | 4194.5 | ±115.5 | 3973.8 | ±140.7 |
| Virginia | 1126.9 | ±77.0 | 873.9 | ±120.5 | –253.0 | ±197.5 |
| Washington | 2385.4 | ±151.3 | 2359.8 | ±782.3 | –25.6 | ±933.5 |
| West Virginia | 304.3 | ±35.8 | 291.0 | ±36.4 | –13.3 | ±72.2 |
| Wisconsin | 4111.8 | ±118.9 | 4194.5 | ±115.5 | 82.8 | ±234.4 |
| Wyoming | 869.4 | ±115.3 | 869.4 | ±115.3 | 0.0 | ±230.7 |
| Total | 145,228.2 | ±813.1 | 146,790.2 | ±782.3 | 1562.0 | ±1,595.4 |
References
- Boryan, C.; Yang, Z.; Mueller, R.; Craig, M. Monitoring US agriculture: The US Department of Agriculture, National Agricultural Statistics Service, Cropland Data Layer Program. Geocarto Int. 2011, 26, 341–358. [Google Scholar] [CrossRef]
- Boryan, C.G.; Yang, Z.; Willis, P.; Di, L. Developing crop specific area frame stratifications based on geospatial crop frequency and cultivation data layers. J. Integr. Agric. 2017, 16, 312–323. [Google Scholar] [CrossRef]
- Johnson, D.; Mueller, R.; Willis, P. The utility of the Cropland Data Layer for monitoring US grassland extent. In Proceedings of the 3rd Biennial Conference on the Conservation of America’s Grasslands, Washington, DC, USA, 2 September–1 October 2015; pp. 15–19. [Google Scholar]
- Solutions, Decision Innovation. Multi-State Land Use Study: Estimated Land Use Changes 2007–2012. Urbandale, IA. 2013; 50322. Available online: http://www.decision-innovation.com/webres/File/docs/130715%20Multi-State%20Land%20Use%20Report.pdf (accessed on 10 February 2021).
- Johnston, C.A. Agricultural expansion: Land use shell game in the U.S. Northern Plains. Landsc. Ecol. 2014, 29, 81–95. [Google Scholar] [CrossRef]
- Alemu, W.G.; Henebry, G.M.; Melesse, A.M. Land Surface Phenologies and Seasonalities in the US Prairie Pothole Region Coupling AMSR Passive Microwave Data with the USDA Cropland Data Layer. Remote. Sens. 2019, 11, 2550. [Google Scholar] [CrossRef] [Green Version]
- Augustine, D.; Davidson, A.; Dickinson, K.; Van Pelt, B. Thinking Like a Grassland: Challenges and Opportunities for Biodiversity Conservation in the Great Plains of North America. Rangel. Ecol. Manag. 2019. [Google Scholar] [CrossRef]
- Gage, A.M.; Olimb, S.K.; Nelson, J. Plowprint: Tracking Cumulative Cropland Expansion to Target Grassland Conservation. Great Plains Res. 2016, 26, 107–116. [Google Scholar] [CrossRef]
- Johnston, C.A.; McIntyre, N.E. Effects of cropland encroachment on prairie pothole wetlands: Numbers, density, size, shape, and structural connectivity. Landsc. Ecol. 2019, 34, 827–841. [Google Scholar] [CrossRef]
- Scholtz, R.; Polo, J.; Fuhlendorf, S.; Duckworth, G. Land cover dynamics influence distribution of breeding birds in the Great Plains, USA. Biol. Conserv. 2017, 209, 323–331. [Google Scholar] [CrossRef] [Green Version]
- Wang, T.; Ayesh, A.; Hennessy, D.; Feng, H. Cropland Reflux: Trends in and Locations of Land Use Change in the Dakotas, 2007 to 2012 and 2012 to 2017. 2018 July 11. (No. 1354-2018-4564). Available online: http://dx.doi.org/10.22004/ag.econ.274938 (accessed on 10 February 2021).
- Bawa, R.; Dwivedi, P. Impact of land cover on groundwater quality in the Upper Floridan Aquifer in Florida, United States. Environ. Pollut. 2019, 252, 1828–1840. [Google Scholar] [CrossRef] [PubMed]
- Shrestha, D.; Staab, B.; Duffield, J. Biofuel impact on food prices index and land use change. Biomass Bioenergy 2019, 124, 43–53. [Google Scholar] [CrossRef]
- CropScape. Available online: https://nassgeodata.gmu.edu/CropScape/ (accessed on 10 September 2020).
- Dunn, J.; Mueller, S.; Eaton, L. Comments on: Cropland Expansion Outpaces Agricultural and Biofuel Policies in the United States. Argonne National Lab Publication. Available online: https://greet.es.anl.gov/publication-comments-cropland-expansion.2015 (accessed on 20 February 2021).
- Dunn, J.B.; Merz, D.; Copenhaver, K.L.; Mueller, S. Measured extent of agricultural expansion depends on analysis technique. Biofuels Bioprod. Biorefining 2017, 11, 247–257. [Google Scholar] [CrossRef] [Green Version]
- Kline, K.L.; Singh, N.; Dale, V.H. Cultivated hay and fallow/idle cropland confound analysis of grassland conversion in the Western Corn Belt. Proc. Natl. Acad. Sci. USA 2013, 110, E2863. [Google Scholar] [CrossRef] [PubMed] [Green Version]
- Mueller, S.; Copenhaver, K. Use of Remote Sensing to Measure Land cover Change from Biofuel Production. Bull. Program Arms Control Disarm. Int. Secur. 2009, 2, 32–38. [Google Scholar]
- Reitsma, K.; Dunn, B.; Mishra, U.; Clay, S.; DeSutter, T.; Clay, D. Land-Use Change Impact on Soil Sustainability in a Climate and Vegetation Transition Zone. Agron. J. 2015, 107, 2363–2372. [Google Scholar] [CrossRef] [Green Version]
- Lark, T.J.; Salmon, J.M.; Gibbs, H.K. Cropland Expansion Outpaces Agricultural and Biofuel Policies in the United States. Available online: https://iopscience.iop.org/article/10.1088/1748-9326/10/4/044003/meta (accessed on 10 February 2021).
- Zhang, C.; Di, L.; Lin, L.; Guo, L. Extracting Trusted Pixels from Historical Cropland Data Layer Using Crop Rotation Patterns: A Case Study in Nebraska, USA. In Proceedings of the 2019 8th International Conference on Agro-Geoinformatics (Agro-Geoinformatics), Istanbul, Turkey, 16–19 July 2019; pp. 1–6. [Google Scholar]
- Sun, P.; Congalton, R.G. Comparing the impact of mapping error on the representation of landscape pattern on upscaled agricultural maps. In Proceedings of the 2019 8th International Conference on Agro-Geoinformatics (Agro-Geoinformatics), Istanbul, Turkey, 16–19 July 2019; pp. 1–6. [Google Scholar]
- Ag Data Commons. Available online: https://data.nal.usda.gov/dataset/cropscape-cropland-data-layer (accessed on 10 September 2020).
- USDA Census of Agriculture. Available online: https://www.nass.usda.gov/AgCensus/ (accessed on 10 September 2020).
- USDA NRCS National Resources Inventory. Available online: https://www.nrcs.usda.gov/wps/portal/nrcs/main/national/technical/nra/nri/ (accessed on 10 September 2020).
- U.S. Department of Agriculture, National Agricultural Statistics Service (USDA, NASS). 2012 Census of Agriculture Vol. 1: Part 51, Chapter 1, AC-12-A-51, United States Summary and State Data. 2014. Available online: https://www.nass.usda.gov/AgCensus/ (accessed on 10 February 2021).
- U.S. Department of Agriculture, National Agricultural Statistics Service (USDA, NASS). Crop Production, 2013 Summary. 2014. Available online: https://www.nass.usda.gov/ (accessed on 10 February 2021).
- U.S. Department of Agriculture, National Agricultural Statistics Service (USDA, NASS). Crop Production, 2012 Summary. 2013. Available online: https://www.nass.usda.gov/ (accessed on 10 February 2021).
Figure 1.
Relationship between reported total cropland area in the NRI and Census for 2007, 2012 and 2017.
Figure 1.
Relationship between reported total cropland area in the NRI and Census for 2007, 2012 and 2017.
Figure 2.
The relationships in total cropland area at the state level estimated using the 2007, 2012 and 2017 CDL with the area estimated from the NRI and Census for corresponding years.
Figure 2.
The relationships in total cropland area at the state level estimated using the 2007, 2012 and 2017 CDL with the area estimated from the NRI and Census for corresponding years.
Figure 3.
The relationship in total cropland change estimated using the National Resources Inventory (NRI) and the Census of Agriculture (Census) for 2007 to 2012 and 2012 to 2017.
Figure 3.
The relationship in total cropland change estimated using the National Resources Inventory (NRI) and the Census of Agriculture (Census) for 2007 to 2012 and 2012 to 2017.
Figure 4.
Relationships in total cropland change estimated using the CDL compared to the NRI and Census for the 2007 to 2012 and 2012 to 2017.
Figure 4.
Relationships in total cropland change estimated using the CDL compared to the NRI and Census for the 2007 to 2012 and 2012 to 2017.
Figure 5.
Relationships in total cropland area estimated using the CDL and PCH for 2007, 2012, and 2017.
Figure 5.
Relationships in total cropland area estimated using the CDL and PCH for 2007, 2012, and 2017.
Figure 6.
Relationships in total cropland change estimated using the CDL compared to the PCHA for the 2007 to 2012 and 2012 to 2017.
Figure 6.
Relationships in total cropland change estimated using the CDL compared to the PCHA for the 2007 to 2012 and 2012 to 2017.
Figure 7.
Differences in total cropland area for the top five crops between the estimates from the Cropland Data Layer (CDL) and the reported area in PCHA for the 20 states in 2007 and 2012.3.3. Comparing cropland change in datasets to determine if there is agreement.
Figure 7.
Differences in total cropland area for the top five crops between the estimates from the Cropland Data Layer (CDL) and the reported area in PCHA for the 20 states in 2007 and 2012.3.3. Comparing cropland change in datasets to determine if there is agreement.
Figure 8.
Mean values for cropland change for each dataset from 2007 to 2012 and 2012 to 2017.
Figure 8.
Mean values for cropland change for each dataset from 2007 to 2012 and 2012 to 2017.
Figure 9.
In millions of hectares, change to and from cropland from a comparison of CDLs with a 4 to 5year time-span and for year-to-year change.
Figure 9.
In millions of hectares, change to and from cropland from a comparison of CDLs with a 4 to 5year time-span and for year-to-year change.
Figure 10.
Distribution of estimated cropland change across the 20 states for 3007 to 2012 and continental U.S. for 2008 to 2012 and 2012 to 2017 occurring in years between (red and green) but not in a direct year to year analysis using the Cropland Data Layer. Change estimated in direct year to year comparison is colored white to overlay between years (red and green).
Table 1.
Totals for Census harvested area and PCHA area.
Table 1.
Totals for Census harvested area and PCHA area.
| Year | Census Harvested Area (Hectares) | PCHA Area (Hectares) | Difference (Hectares) | % Difference |
|---|
| 2007 | 127,461,651 | 123,176,597 | 4,285,054 | 3.40% |
| 2012 | 125,293,750 | 124,989,184 | 304,567 | 0.24% |
| 2017 | 129,516,345 | 122,125,628 | 7,390,716 | 5.90% |
Table 2.
Examples of cropland change trajectory.
Table 2.
Examples of cropland change trajectory.
| | 2007 | 2008 | 2009 | 2010 | 2011 | 2012 | Cropland Change |
|---|
| 1 | Cropland | Cropland | Cropland | Cropland | Cropland | Cropland | No change |
| 2 | Non-cropland | Non-cropland | Non-cropland | Non-cropland | Non-cropland | Non-cropland | No change |
| 3 | Cropland | Cropland | Cropland | Non-cropland | Non-cropland | Non-cropland | Reversion |
| 4 | Non-cropland | Non-cropland | Non-cropland | Cropland | Cropland | Cropland | Conversion |
| 5 | Non-cropland | Non-cropland | Non-cropland | Cropland | Non-cropland | Cropland | Confusion 1 |
Table 3.
Estimated Net Change in Cropland for the NRI, Census and CDL for different year intervals before and after the CDL has post-classification refinement techniques applied.
Table 3.
Estimated Net Change in Cropland for the NRI, Census and CDL for different year intervals before and after the CDL has post-classification refinement techniques applied.
| | Census | NRI | Original CDL | Remove Fallow | Remove Unlikely Trajectories | NLCD Analysis | Filters and Final |
|---|
| Net Change (2008 to 2012) | 2,419,465 | 1,575,967 | 1,141,751 | 873,060 | 840,755 | −3,983,457 | −1,044,720 |
| Net Change (2007 to 2012) | 2,109,452 | 1,307,013 | 11,354,033 | 10,590,042 | 8,576,087 | −1,518,440 | −127,380 |
| Net Change (2012 to 2017) | 2,309,621 | 2,285,097 | 5,992,023 | 6,685,541 | 5,262,498 | 946,842 | 917,255 |
Table 4.
Coefficients of determination for Estimated Net Change in Cropland for the CDL compared to the NRI and Census for different year intervals before and after the CDL has post-classification refinement techniques applied.
Table 4.
Coefficients of determination for Estimated Net Change in Cropland for the CDL compared to the NRI and Census for different year intervals before and after the CDL has post-classification refinement techniques applied.
| 2008 to 2012 CDL | Direct Comparison | Remove Fallow | Remove Unlikely Trajectories | NLCD Analysis | Filters and Final | Lark’s Results |
|---|
| to 2007 to 2012 Census | 0.46 | 0.42 | 0.40 | 0.05 | 0.12 | 0.41 |
| to 2007 to 2012 NRI | 0.07 | 0.07 | 0.08 | 0.03 | 0.05 | 0.24 |
| 2007 to 2012 CDL | | | | | | |
| 2007 to 2012 Census | 0.44 | 0.16 | 0.55 | 0.00 | 0.03 | |
| 2007 to 2012 NRI | 0.57 | 0.60 | 0.42 | 0.00 | 0.49 | |
| 2012 to 2017 CDL | | | | | | |
| to 2012 to 2017 Census | 0.16 | 0.15 | 0.16 | 0.06 | 0.08 | |
| to 2012 to 2017 NRI | 0.64 | 0.61 | 0.62 | 0.42 | 0.59 | |
| Publisher’s Note: MDPI stays neutral with regard to jurisdictional claims in published maps and institutional affiliations. |
© 2021 by the authors. Licensee MDPI, Basel, Switzerland. This article is an open access article distributed under the terms and conditions of the Creative Commons Attribution (CC BY) license (https://creativecommons.org/licenses/by/4.0/).


