Article

Inferring Urban Land Use from Multi-Source Urban Mobility Data Using Latent Multi-View Subspace Clustering

Department of Geo-Informatics, Central South University, Changsha 410006, China
*
Author to whom correspondence should be addressed.
ISPRS Int. J. Geo-Inf. 2021, 10(5), 274; https://doi.org/10.3390/ijgi10050274
Submission received: 10 March 2021 / Revised: 15 April 2021 / Accepted: 21 April 2021 / Published: 23 April 2021

Abstract

:
In the era of big data, vast urban mobility data introduce new opportunities to infer urban land use from the perspective of social function. Most existing works only derive land use information from a single type of urban mobility dataset, which is typically biased and results in difficulty obtaining a comprehensive view of urban land use. It remains challenging to fuse high-dimensional and noisy multi-source urban mobility data to infer urban land use. This study aimed to infer urban land use from multi-source urban mobility data using latent multi-view subspace clustering. The variation in the number of origin/destination points over time was initially used to characterize land use types. Then, a latent multi-view representation was applied to construct the common underlying structure shared by multi-source urban mobility data and effectively deal with noise. Finally, based on the latent multi-view representation, the subspace clustering method was used to infer the land use types. Experiments on taxi trajectory data and bus smart card data in Beijing reveal that, compared with the method using a single type of urban mobility dataset and the weighted fusion method, the approach presented in this study obtains the highest detection rate of land use. The urban land use inferred in this study provides calibration and reference for urban planning.

1. Introduction

Urban land use typically refers to syndromes of human activities that alter land surface processes in a city [1]. Urban land use information is of vital significance for urban planning and environmental management processes [2,3]. Remote sensing images are widely used to extract urban land use information. A number of remote sensing methods have been developed, based on physical characteristics of ground components, such as spectral, shape, and texture [4,5,6]. Although remote sensing images are effective for identifying natural properties of ground objects, it is difficult to indicate the socioeconomic attributes and human activities that are highly related to urban land use types [7,8]. In the era of big data, a wide spectrum of urban mobility datasets is currently available, including taxi GPS trajectories [9], smart card transactions [10], and mobile phone records [11]. These urban mobility datasets can reflect the temporal rhythms of human activities and can be used to uncover the social functions of urban land use types [12,13]. This could help urban planners make more informed and human-centric decisions in their planning [14].
Taxi GPS trajectories [9,15,16], smart card transactions [10], and mobile phone records [13,17,18] have been widely used to infer urban land use from the perspective of social function. The main framework of existing work generally consists of three parts: First, features (variables for clustering or classification) were extracted from urban mobility data to construct the relationship between temporal rhythms of human activities and urban land use types. Second, by using the extracted features, classification/clustering methods were used to discover regions. Third, the land use types of the discovered regions were annotated and analyzed based on prior knowledge and/or auxiliary data.

1.1. Extraction of Features from Urban Mobility Datasets

An effective feature is vital for inferring urban land use. For mobile phone data, research pioneers applied the normalized time series of hourly volume within the same base transceiver station (BTS) to define features [17]. Such features ignore the differences in total volume between different BTSs. To overcome this limitation, normalized hourly call volumes and total call volumes were combined to construct a two-day pattern feature vector, that is, a weekday pattern and a weekend pattern [18]. This two-day pattern cannot fully reveal the difference in human activities between weekdays and non-weekdays. Hence, Pei et al. [13] further constructed a novel feature vector by combining hourly call volume and total call volume to generate a linear combination of a four-day mode (general weekday, Friday, Saturday, and Sunday).
For taxi GPS trajectories and smart card transactions, land use types are usually characterized by the temporal dynamics of the get-on/get-off amount [15]. These features were usually defined by the difference between the pick-up and set-down number in each hour, and the ratio of the pick-up number to the set-down number in each hour [9,10,16,19,20,21,22].

1.2. Land use Classification/Clustering Methods

When the land use labels of regions are available, some supervised classification methods (e.g., k-nearest neighbor algorithm, random forest algorithm, support vector machines) can be used to infer the land use types of other unlabeled regions [9,15,22]. In practice, land use labels are usually lacking. Therefore, clustering methods (e.g., K-means, fuzzy c-means, spectral clustering, and the Expectation–Maximization algorithm) are frequently employed to identify clusters with similar land use types, based on the similarity of extracted features [10,13,17,23]. Additional datasets or prior knowledge should be employed further in order to annotate the land use types of these clusters.

1.3. Annotation and Analysis of Classified Regions

Points of interest (POIs), remote sensing images, and digital maps are used to annotate the land use types of identified clusters [22,24,25]. POIs are highly related to human activities and can be used to extract information pertaining to urban land use [8]. The frequency density (FD) and category ratio (CR) of POIs contribute to annotating the land use type of a cluster [26]. For example, if POIs such as service facilities, shopping malls, restaurants, and sports centers frequently occur in a single cluster, that cluster can be defined as a residential area. By using the remote sensing images and digital maps, the landmarks can be visually identified and used further in order to annotate the land use type of a cluster [10,22]. If landmarks such as the National Palace Museum, Summer Palace, and Yuanmingyuan are in the same cluster, the cluster may be denoted as a tourism area. In addition, the arriving/leaving transition matrix can indicate the human travel pattern between regional clusters [24,26]. For example, on weekdays, if most people depart from a cluster after work (5 pm–6 pm), while during weekends, people arrive at and depart from a particular cluster throughout the day, the cluster may be denoted as a commercial area.
This study concluded that significant progress has been made in using urban mobility data to infer urban land use types. Although fruitful research outcomes have been achieved, most existing works only derive land use information from a single type of urban mobility dataset. Because land use information inferred from a single-source urban mobility dataset is usually biased [27,28], it is difficult to obtain a comprehensive view of urban land use. Therefore, it is important to fuse multi-source urban mobility data to obtain a comprehensive view of urban land use. In recent years, some scholars have attempted to combine various urban mobility datasets to infer urban land use. The simplest strategy has been to combine the taxi GPS trajectories and smart card transactions to represent urban mobility. To consider the relative importance of different types of urban mobility data, some scholars have used weighted fusion strategies to combine multi-source urban mobility data by determining weights based on the proportions of the total bus and cab ridership or by applying the entropy weight approach [23,29]. Although these methods can integrate multi-source data information to an extent, it is difficult to determine the accurate weight for different source data. More importantly, urban mobility data are usually noise, and the features extracted from urban mobility data are usually high-dimensional [30,31]. It remains challenging to fuse multi-source, high-dimensional, and noisy urban mobility data to infer urban land use [27].
To address these challenges, this study aimed to infer urban land use from multi-source urban mobility data using latent multi-view subspace clustering. In this study, multi-source urban mobility data were treated as different views for observing urban land use, and multi-source urban mobility data were used to obtain a comprehensive view of urban land use. Using Beijing as a case study, taxi GPS trajectories and bus smart card data from 9 May 2016, to 15 May 2016 were combined to infer urban land use types from the perspective of social function. This study resulted in the following three contributions:
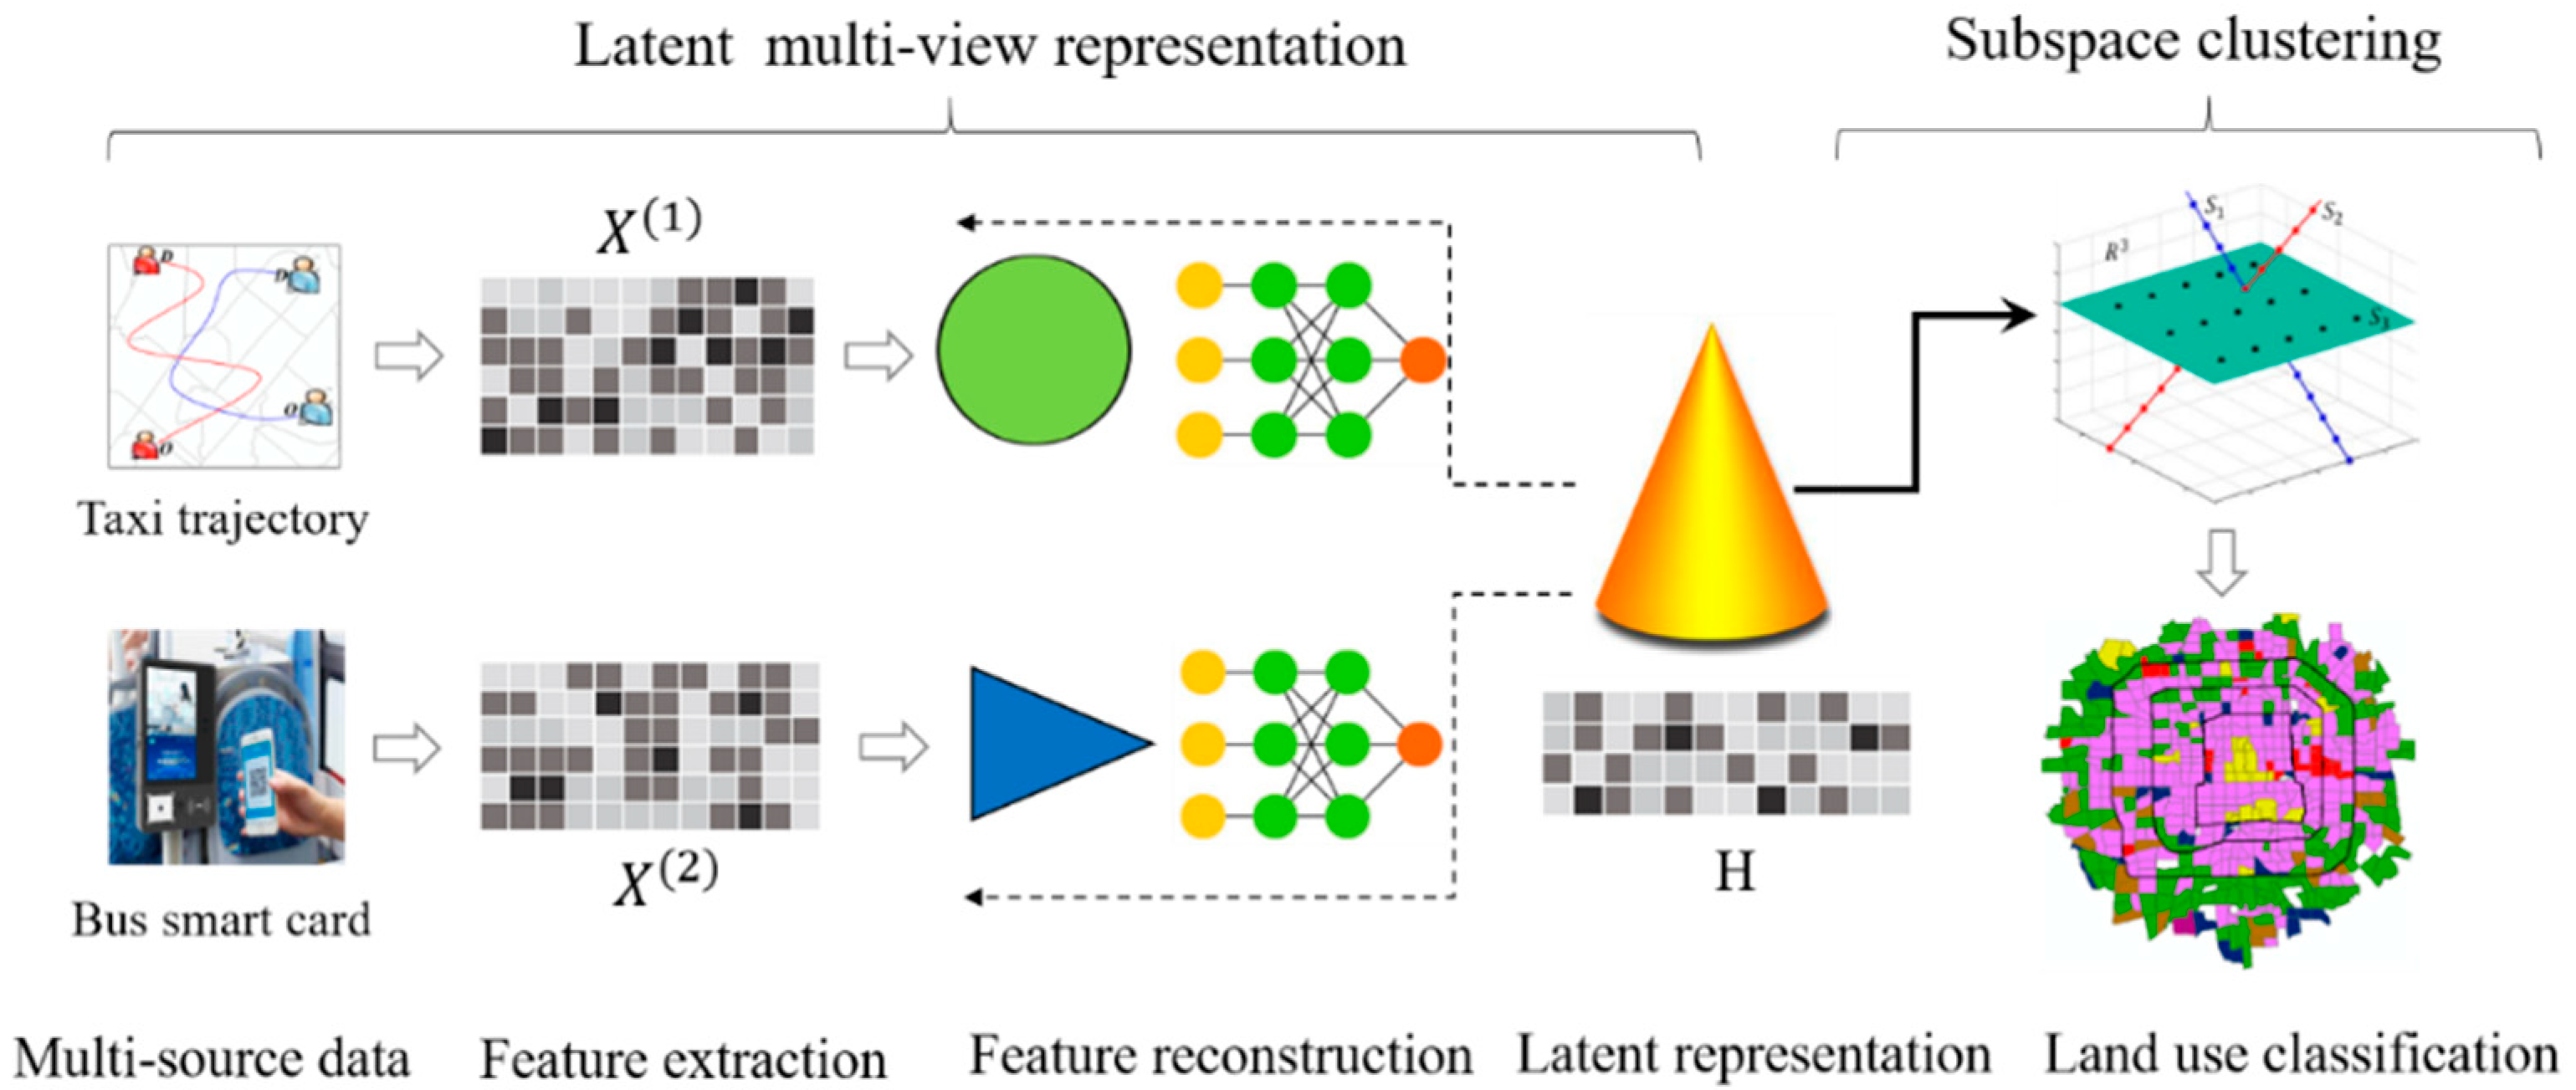
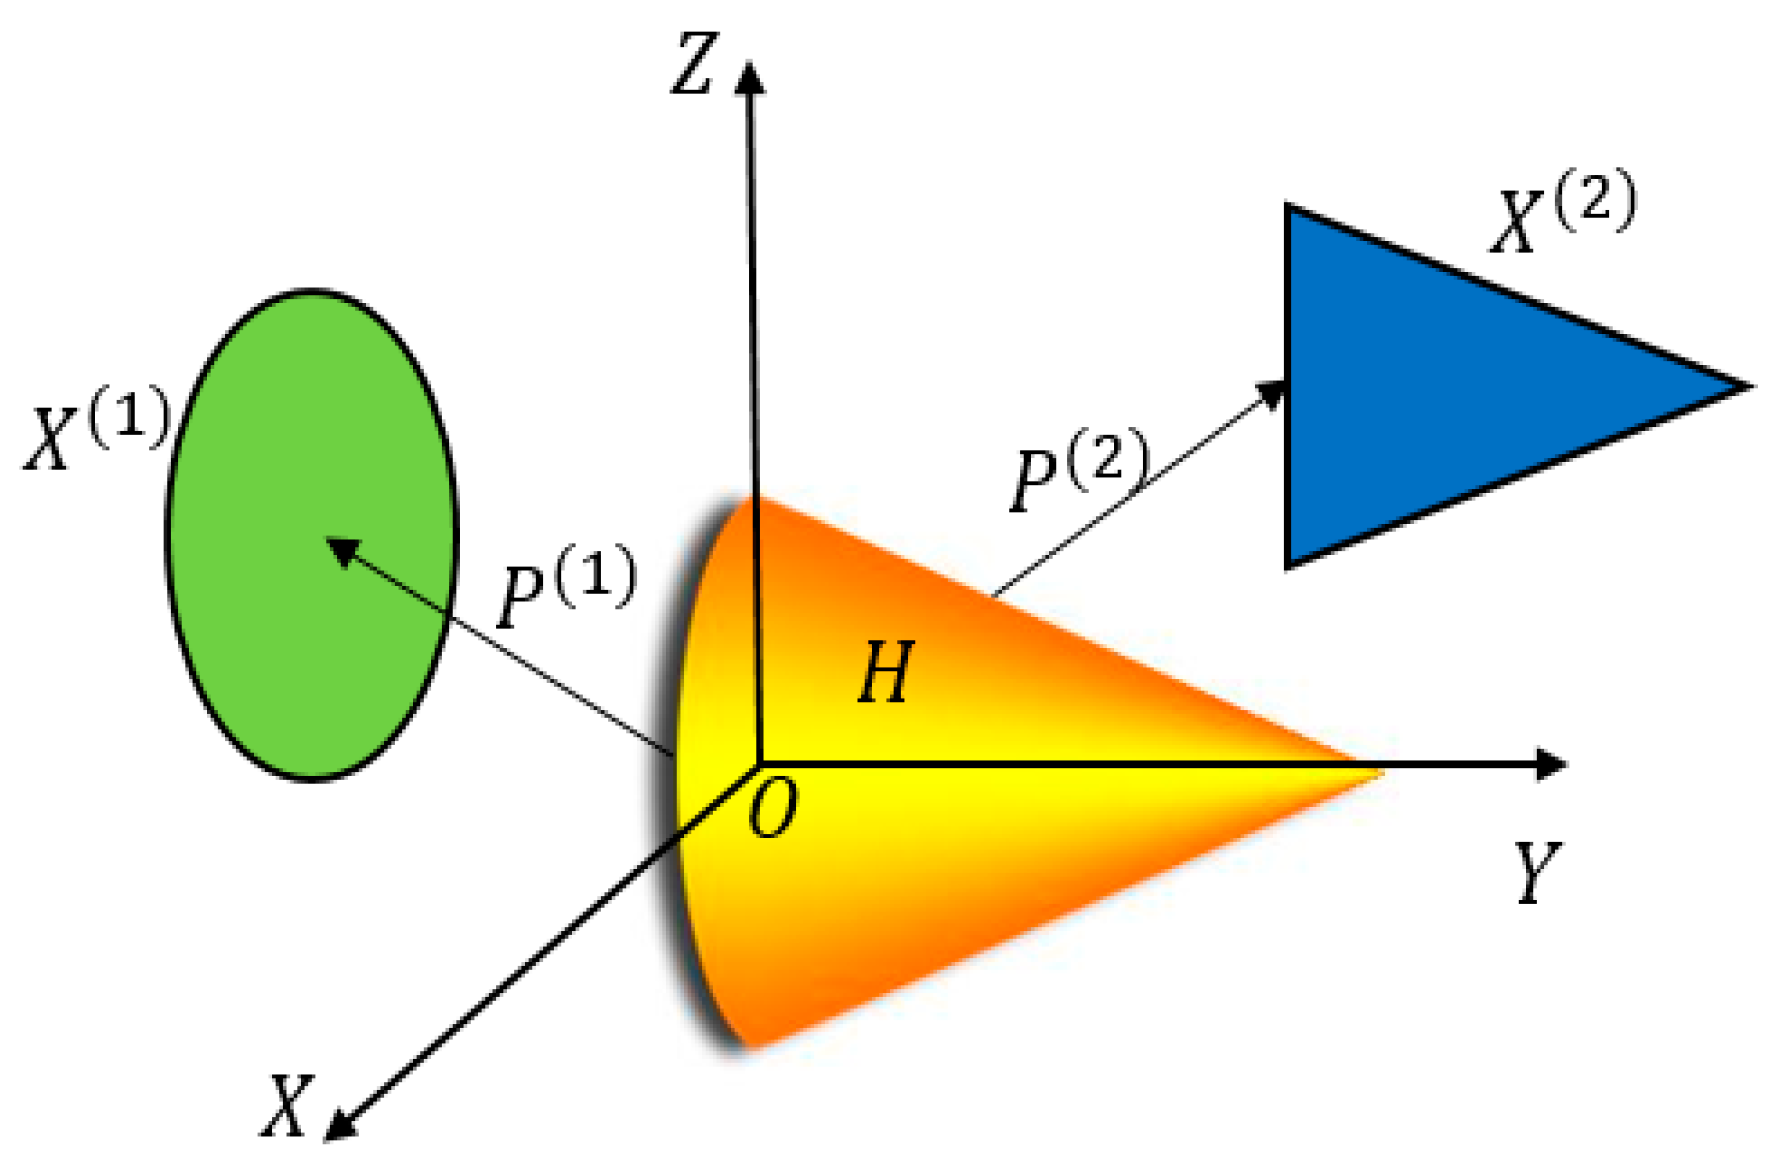
  • Multi-source and noisy urban mobility data (for example, GPS signal may be blocked by urban buildings, thus leading to noise) were fused by first applying the variation in the number of origin/destination points over time to characterize land use types, and then a latent multi-view representation [32] was applied to construct the common underlying structure, shared by multi-source urban mobility data;
  • The high-dimensional features were handled by using the subspace clustering method [33] to infer the land use types based on the latent multi-view representation;
  • Experimental results revealed that, compared with the method using a single type of urban mobility dataset and the weighted fusion method, the approach presented in this study obtains the highest detection rate of land use and provides a reference for urban planning.
The remainder of this paper is organized as follows: Section 2 introduces the study area and multi-source urban mobility data used in this work. Section 3 describes the methods for inferring urban land use from multi-source urban mobility data. Section 4 presents and discusses the experimental results. Section 5 concludes this study and outlines future work directions. Table 1 summarizes the abbreviations used in this paper.

2. Study Area and Datasets

2.1. Extraction of Features from Urban Mobility Datasets

As the capital of China, Beijing features a tridimensional transportation network and ranks higher in the development of business, finance, education, and high technology than many other cities in the country. The region within the Beijing Fifth Ring Road was selected as the study area, and was divided into 577 traffic analysis zones (TAZs) and seven administrative districts (Figure 1a). The governmental land use map of the study area is shown in Figure 1b (obtained from Beijing Municipal Commission of Planning and Natural Resources). The land use information was extracted from the Landsat TM/ETM/OLI image in 2017. By using the method of remote sensing information extraction (image geometric correction, band selection and fusion, visual interpretation, and data quality check), urban region in Beijing was divided into 17 land use types. The 17 types of land use types were aggregated into seven categories according to the standard of current land classification (GB/T 21010-2017): commercial and business facility (CBF), residential land (RUL), tourist attraction and water (TAW), industrial land (IUL), public administration and service (PAS), road and transportation facility (RTF), and agriculture (AGR).

2.2. Datasets

Multi-source urban mobility data: in this study, taxi GPS trajectories and bus smart card data from May 9, 2016, to May 15, 2016 were used to record the relationship between urban mobility and urban land use types. The collection time was from 8:00 to 24:00, daily. Taxi GPS trajectories were generated from more than 33,000 taxis (approximately 50% of the total number of taxis) and bus smart card data were derived from 834 lines (81.76% of the total bus lines). Each taxi trajectory contained four essential attributes: taxi ID, recording time, and longitude and latitude of position. Each record of bus smart card data contained four essential attributes: bus ID, transaction time, pick-up station, and drop-off station. A total of 14,157,913 bus OD flows and 792,497 taxi OD flows were extracted on weekdays. A total of 4,157,948 bus OD flows and 237,441 taxi OD flows were extracted on weekends. Figure 2 depicts the variation in pick-up and set-down points over time. The characteristics of urban mobility on weekdays were obviously different from those on weekends because there was more temporal and spatial flexibility for residents’ activities on weekends than on weekdays.
POI data: points of interest data were obtained from Gaode Map, a leading digital map content, navigation, and location service provider in China. POIs collected in 2017 included 23 types within the Beijing Fifth Ring Road, with 1,210,197 total records. Each POI was classified by its name, ID, longitude, latitude, and category. Taxi GPS trajectory data, bus smart card data, and POI data were all matched onto 577 TAZs according to their spatial locations.

3. Method

First, features from taxi GPS trajectories and bus smart card data were collected. Second, the latent multi-view representation was used to fuse multi-source urban mobility data. Finally, the subspace clustering method was applied to infer urban land use types based on latent multi-view representation (Figure 3).

3.1. Clustering Feature Extraction

The clustering features were constructed based on the temporal dynamics of the get-on/get-off amount in each TAZ. Based on existing research, seven features were constructed [9,34], based on the number of pick-up and set-down points.
(I)
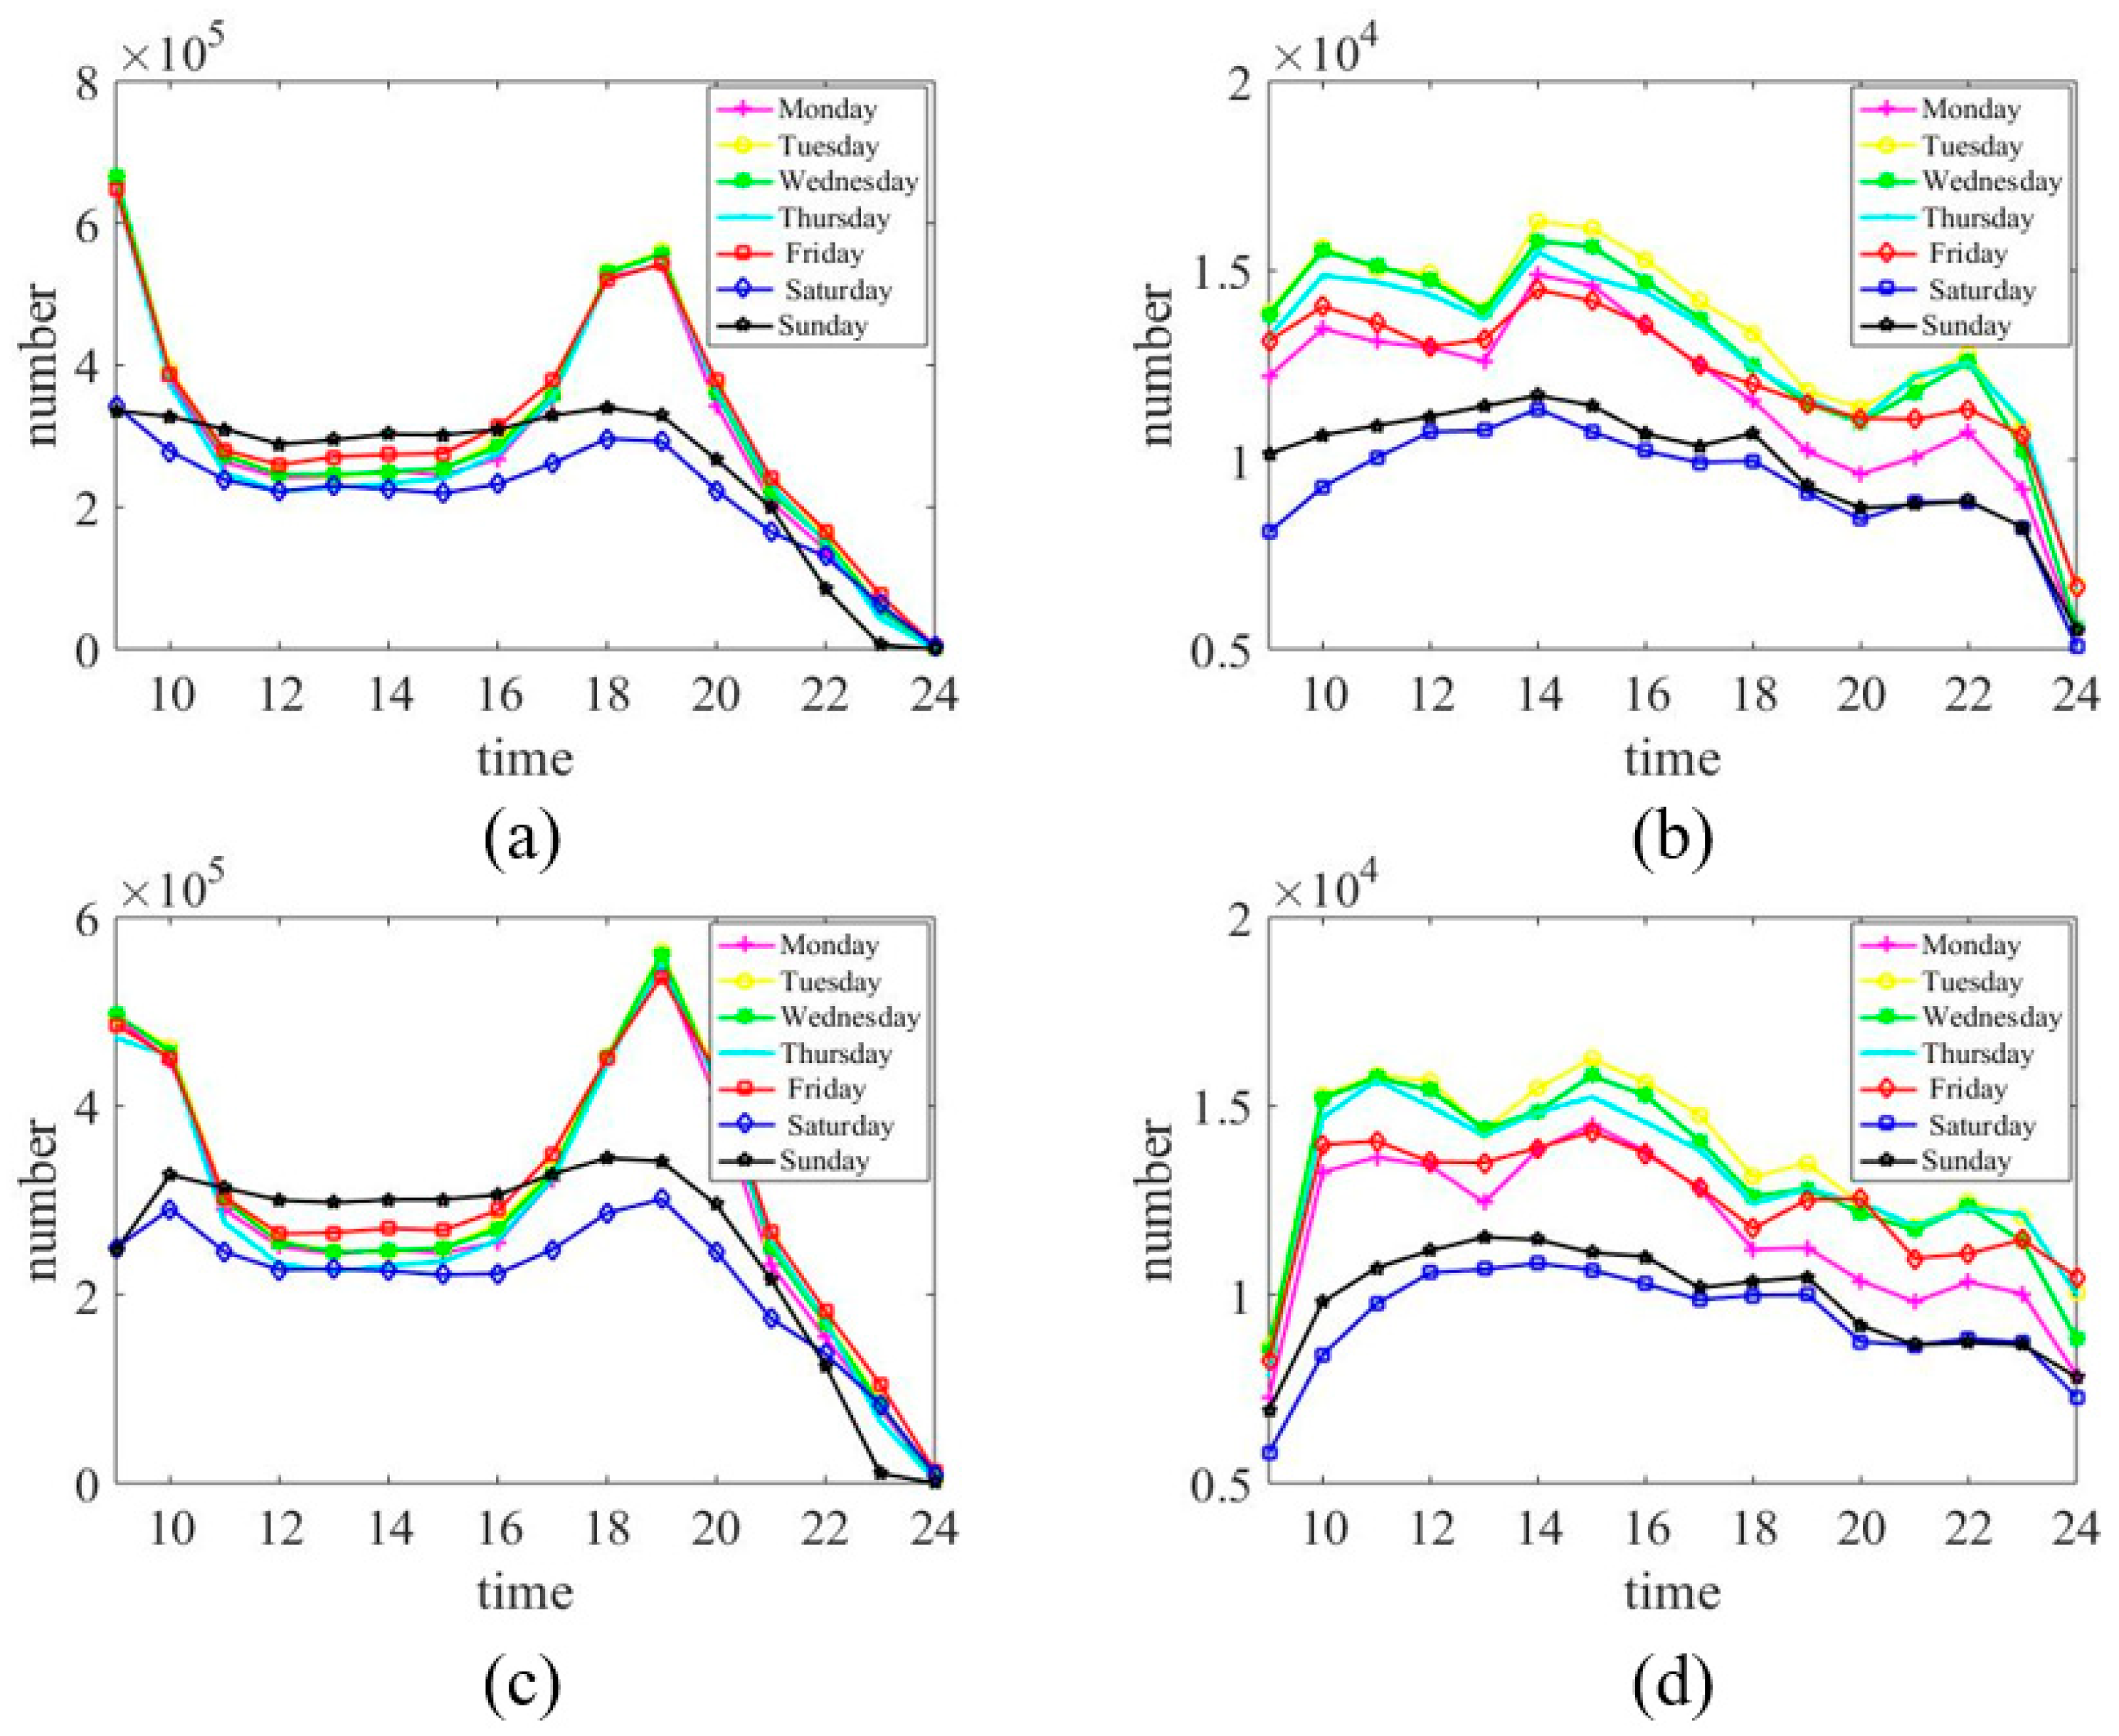
Weekday/weekend pick-up feature vector: it was used to measure the number of passengers boarding the bus during weekdays or weekends, which can be denoted as a 16-dimension vector as the formulation of
[ O w 1 , , O w 16 ]   o r   [ O r 1 , , O r 16 ] ,
where O w i and O r i represent the number of pick-ups in the i t h hour on weekdays and weekends. The symbols below have the same meaning.
(II)
Weekday/weekend set-down feature vector: similar to feature I, this is also a 16-dimension vector, which can be denoted as
[ D w 1 , , D w 16 ]   o r   [ D r 1 , , D r 16 ] .
D w i and D r i represent the number of set-downs in the i t h hour on weekdays and weekends.
(III)
Daily pick-up feature vector: This feature is the combination of the weekday and weekend pick-up features, which measures the total number of pick-ups, on both weekdays and weekends. The form of this 32-dimensional vector is
[ O w 1 , , O w 16 , O r 1 , , O r 16 ]
(IV)
Daily set-down feature vector: Similar to feature III, the daily set-down feature vector is also a 32-dimensional vector denoted as
[ D w 1 , , D w 16 , D r 1 , , D r 16 ] .
(V)
Pick-up/set-down difference feature vector: This feature measures the difference between the pick-up number and set-down number as
[ O w 1 D w 1 , , O w 16 D w 16 , O r 1 D r 1 , , O r 16 D r 16 ] .
(VI)
Pick-up/set-down ratio feature vector: similar to feature V, the 32-dimensional vector measures the ratio of pick-up number and set-down number as
[ O w 1 / D w 1 , , O w 16 / D w 16 , O r 1 / D r 1 , , O r 16 / D r 16 ] .
(VII)
Daily pick-up and set-down combination vector: this feature is a 64-dimensional vector measuring the total flow over days as
[ O w 1 , , O w 16 , O r 1 , , O r 16 , D w 1 , , D w 16 , D r 1 , , D r 16 ] .

3.2. Latent Multi-View Representation

This study assumed that multi-source urban mobility data originated from one underlying latent representation. As shown in Figure 4, N   observations from V views can be represented as
X = { [ X i ( 1 ) ; X i ( 2 ) ; ; X i ( V ) ] } i = 1 N
The goal of latent multi-view representation was to obtain H = [ h 1 , h 2 , , h N ] by the projection models P = [ P ( 1 ) , P ( 2 ) , , P ( V ) ] . Compared with biased single-source data, this shared latent multi-view representation combined essential consistent information from multiple views. The objective function can be expressed as min P , H L h ( X , P H ) , where L h represents the reconstruction loss function from the latent representation to multi-view features [35].
To construct the relationships between the latent multi-view representation and the features from individual views, a BP neural network was employed to capture this non-linear projection interaction, and the objective function was formulated as [32]
min { θ v } v = 1 V , H , Z v = 1 V α v L v ( X v , g θ v ( H ) )
where g θ v ( H ) = W ( k , v ) f ( W ( k 1 , v ) f ( W ( 1 , v ) H ) ) denotes the neural network model. f ( a ) = tan ( a ) = 1 e 2 a 1 + e 2 a is the activation function and W ( k , v ) indicates the weight matrix from the k t h layer to the ( k + 1 ) t h layer in the v t h view. L v measures the reconstruction loss from the latent representation to the observed features under the v t h view.   α v is the tradeoff parameter.

3.3. Subspace Clustering

Subspace clustering is an effective technique for dealing with high-dimensional data [33,36,37]. It assumes that high-dimensional data points lie in multiple low-dimensional subspaces [38]. In this study, subspace clustering based on the self-representation property of high-dimensional data was performed [39], where each high-dimensional data point x i can be expressed as a combination of other points x j   ( i j ) . The formulation can generally be expressed as
min Z L ( X , X Z ) + λ Ω ( Z ) ,
where Z = [ z 1 , z 2 , , z n ] R n × n is the subspace representation matrix (reconstruction coefficient matrix). z i is the similarity representation of the original data point x i based on the subspace. X = [ x 1 , x 2 , , x n ] are extracted features from   n observations. In this study, the latent multi-view representation H was used as the feature X . Therefore, the objective function of subspace clustering can be obtained by jointly combining Formulas (9) and (10):
min { θ v } v = 1 V , H , Z v = 1 V α v L v ( X v , g θ v ( H ) ) + L ( H , H Z ) + λ Ω ( Z ) ,
Z was used to construct a similarity matrix with S = a b s ( Z ) + a b s ( Z T ) for spectral clustering [40]. The objective function in Formula (11) can be optimized in the following two steps [32]:
(i)
Updating BP neural network parameters using the gradient descent algorithm. The BP neural network is composed of two hidden layers W ( 1 , v ) and W ( 2 , v ) . First, W ( 1 , v ) and H were randomly initialized. Second, the loss function L w = α v 2 X v W ( 2 , v ) f ( W ( 1 , v ) H ) F 2 and activation function M v = t a n h ( W ( 1 , v ) H ) were defined. For each view, updated W ( 1 , v ) = W ( 1 , v ) η L w W ( 1 , v ) and W ( 2 , v ) = X v M v T ( M v M v T + γ α v ) 1 , W ( 1 , v ) and W ( 2 , v ) can be outputted until the reconstruction error is sufficiently small.
(ii)
Solving and optimization. First, H was updated by using the gradient descent algorithm with L H = 1 2 H H Z F 2 + v = 1 V α v 2 X v W ( 2 , v ) f ( W ( 1 , v ) H ) F 2 . Second,   Z was iteratively updated by using the alternating direction method of multiplier algorithm [41].

4. Results and Discussion

4.1. Comparative Methods and Parameter Setting

The latent multi-view subspace clustering method was compared with the following two baselines:
(i)
Methods using a single type of urban mobility data [9]: Taxi GPS trajectory or bus smart card data were used to construct feature vectors. Spectral clustering was employed to cluster the TAZs into K land use types based on their extracted feature vectors.
(ii)
Weighted fusion method [23]: Two similarity matrices W t a x i ,   W b u s were first calculated for taxi trajectory and bus smart card data. Then, the integrated similarity matrix W was computed as W = α 1 W t a x i + α 2 W b u s . α 1 and α 2 are two weights determined by the proportion of taxi ridership and bus ridership. In the experiment, α 1 and α 2 were 96.34% and 4.66%, respectively. The similarity matrix W was provided as an input for spectral clustering.
Existing research has demonstrated that feature VII introduced in Section 3.1 is the best feature to reveal pick-up/set-down patterns for land use classification [9]. Therefore, for the proposed method, feature VII was initially used in the clustering method. The silhouette coefficient was used to select the cluster number [42]. Figure 5 illustrates that the value of the silhouette coefficient is maximized when the cluster number is 8. Therefore, the cluster number was set to 8. As shown in Table 2, six other features in the clustering method were used and feature VII achieved the highest overall accuracy (OA). As a result, for all the three methods evaluated in this study, feature VII was selected as the feature vector, and the cluster number was set to 8.

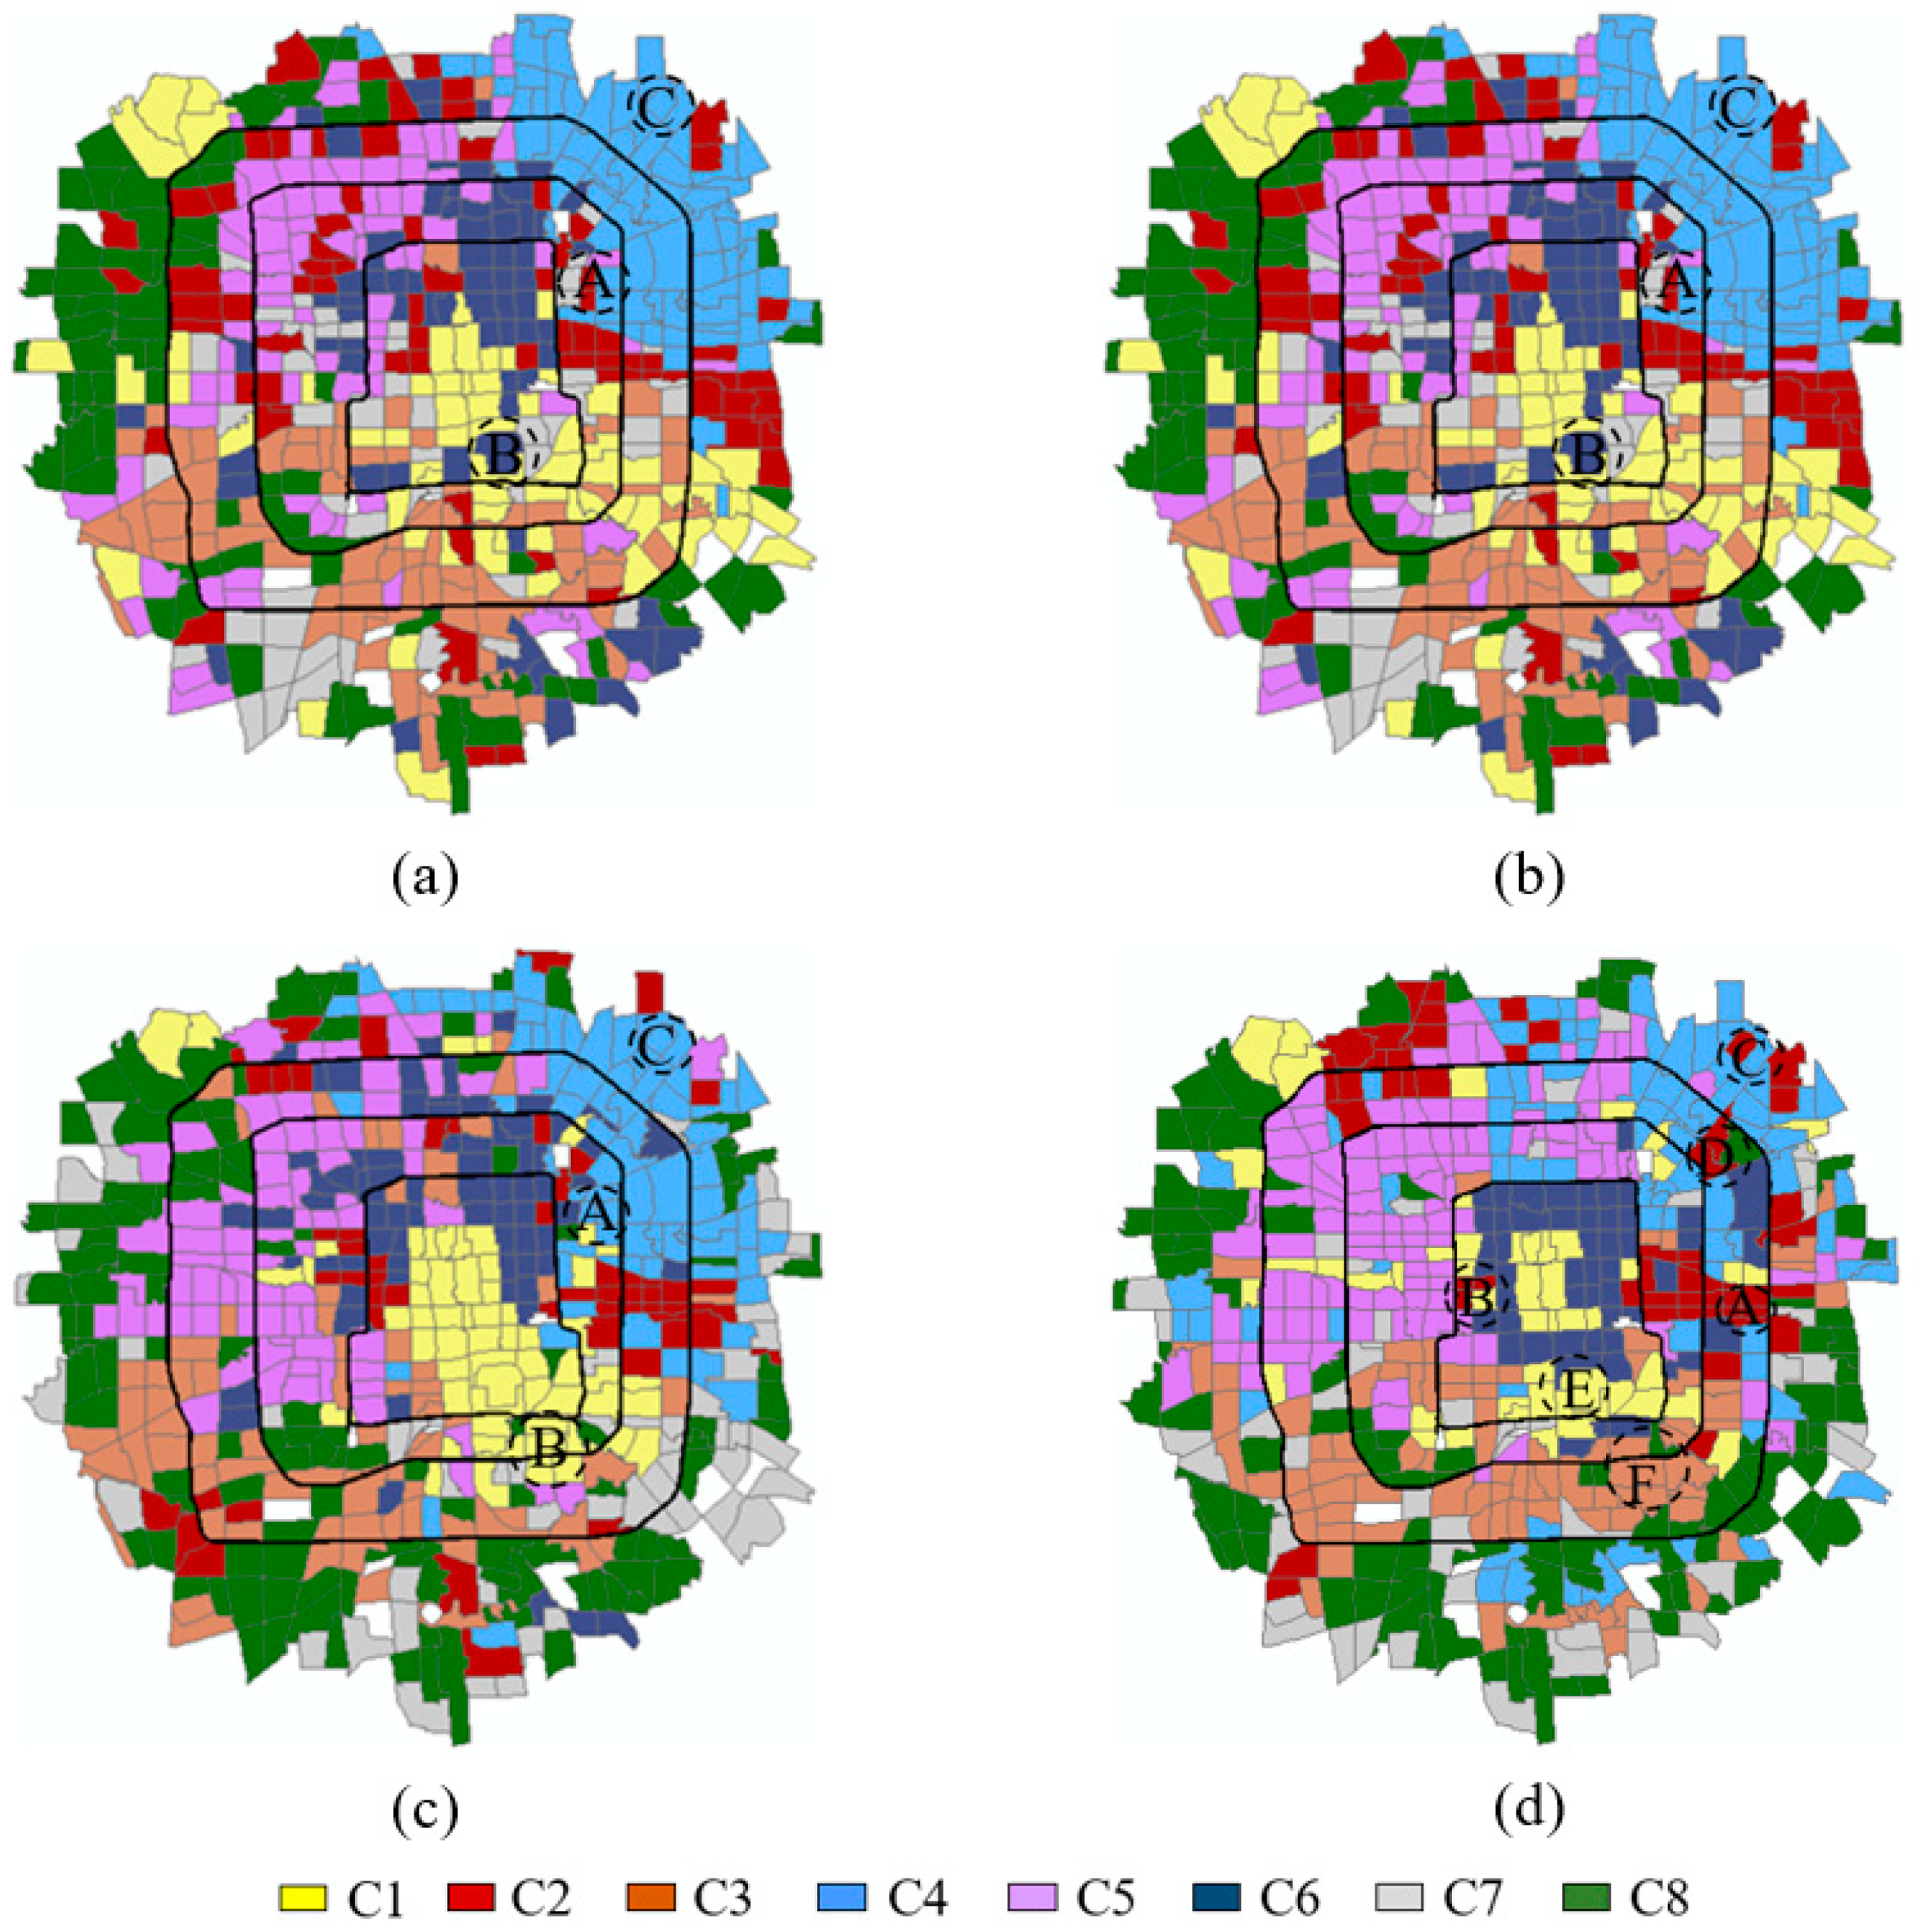
4.2. Annotation of Urban Land Use Types

The latent multi-view subspace clustering method was compared with the following two baselines:
Figure 6 illustrates the clusters of TAZs discovered using the adopted method and baselines introduced in Section 4.1. The discovered clusters were annotated as follows:
(i)
FD and CR of POIs in each cluster (Table 3):
FD ij = number   of   the   i th   category   of   POI   in   cluster   j the   area   of   cluster   j
CR ij = number   of   the   i th   category   of   POI   in   cluster   j the   number   of   POIs   in   cluster   j × 100 %
(ii)
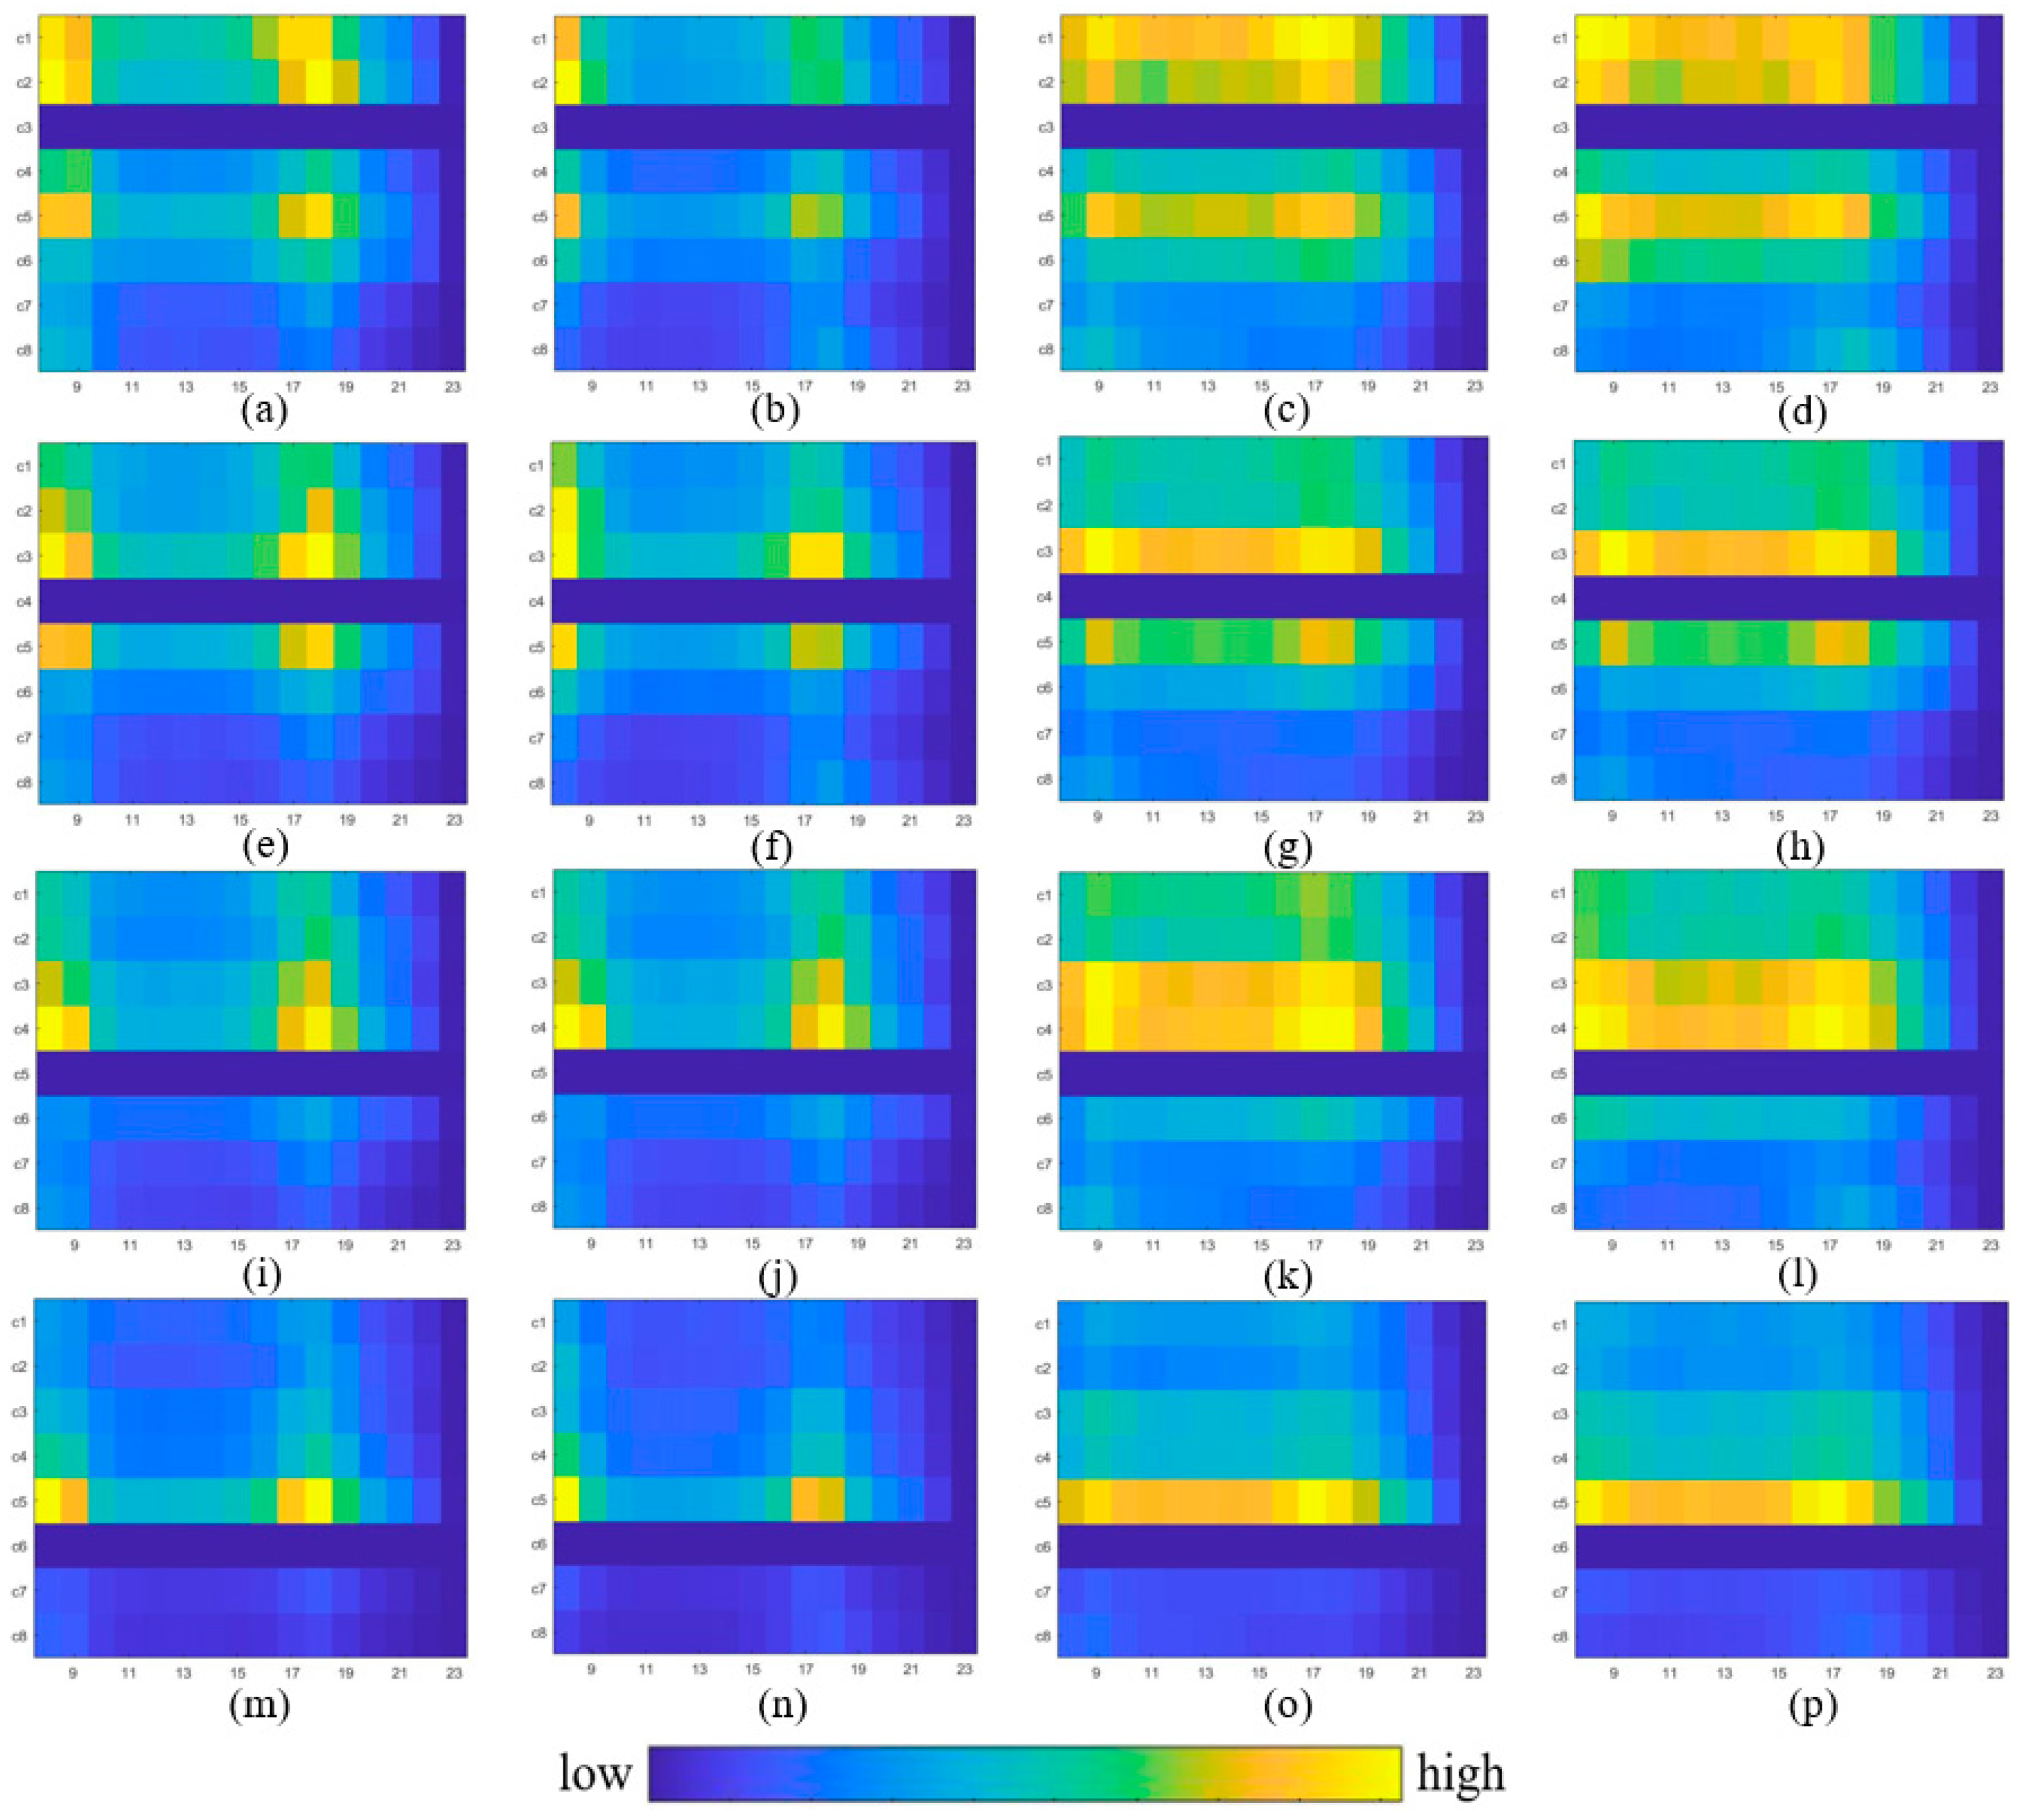
Arriving/leaving transition matrices: As shown in Figure 7, the horizontal axes represent the time over the day from 8:00 to 24:00, and the vertical axes represent the clusters for which passengers either arrive or leave.
As in previous methods, for the clusters discovered by the latent multi-view subspace clustering in this study, the land use types can be annotated as follows:

4.2.1. Tourist Attraction and Water Areas (C1)

C1 is annotated as a tourist attraction and water area because FD and CR of tourist attractions in C1 are the highest among the eight clusters (Table 3). Figure 8a illustrates the intensities of three representative types of POIs (natural place names, famous tourist sites, scenic spots) located in C1. Most historical sites, such as Tiananmen Square, the Palace Museum, Forbidden City, Summer Palace, and Temple of Heaven, are concentrated in this cluster.

4.2.2. Developed Commercial Areas (C2)

C2 is a developed commercial area with a mature POI configuration of buildings, companies, restaurants, and theaters. Figure 8b illustrates the intensity of the four types of representative POIs (building, company, well-known enterprise, and foreign institution) located in C2. Popular business circles such as the Central Business District, Zhongguancun, Xidan, and Sanlitunan business circles are located in this cluster.

4.2.3. Less Developed Residential Areas (C3)

Figure 7a–d show that C3 has the characteristics of a residential area. Specifically, residents typically depart this area during the morning peak (8 am–9 am) and arrive at this area during the evening peak (5 pm–7 pm) on weekdays. This same commuting pattern cannot be found on weekends.
C3 features many ancient buildings in old streets and alleys, known as “hutong” or “quadrangle dwellings.” Table 3 illustrates that the representative types of POIs in C3 are dwelling and doorplate information (doorplate is the sign of “hutong”). Therefore, the POI configuration indicates that C3 is a less developed residential area.

4.2.4. Emerging Residential Areas (C4)

Figure 7e–h illustrate that C4 presents the characteristics of a residential area. The POI configuration of C4 is similar to that of C5, featuring dwellings, living services, shopping malls, healthcare treatments, and convenient stores. However, the FD and CR of the POIs at C4 are lower than those in C5. Therefore, C4 is classified as an emerging residential area.

4.2.5. The Developed Residential Areas (C5)

Figure 7i–l show that C5 has the characteristics of a residential area similar to C3. Table 3 illustrates that C5 has a mature POI configuration with dwellings, living services, healthcare treatments, hospitals, banks, sports centers, courier services, and convenient stores. In C5, an adequate number of POIs provide necessary conditions for residents in all aspects of life. Therefore, C5 was annotated as a developed residential area.

4.2.6. Residential/Entertainment/Commercial Areas (C6)

C6 is annotated as a mixture of residential, entertainment, and commercial areas because it has the characteristics of the three land use types. Table 3 illustrates that C6 exhibits a balanced POI configuration with shopping malls, living services, healthcare treatments, attractions, recreation, buildings, companies, and theaters. The former three types of POIs are the signs of residential areas (Figure 7m–p also indicate that C6 exhibits the characteristics of a residential area). There are a number of attractions and entertainment venues in C6, such as Bell Tower, Drum Tower, Prince Kung’s Mansion, and some former ancestral residences. The number of buildings, companies, hotels, and theaters in C6 is only second to that in developed commercial areas (C2).

4.2.7. Public Administration and Service (C8)

C8 possesses the fewest POIs of all the clusters. The administrative place name is the only representative POI in C8, and is primarily covered by green space, representing Liangshan Park, Beiwu Park, Laoshan Forest Park, Haizi Park, Wangxing Lake Park, and Zhenhai Temple Park.

4.2.8. Industrial/Transportation Service Areas (C7)

In Table 3, all the toll stations and most industries are positioned in C7. Toll stations are representative transportation services, such as Beijing railway station, highway, and long-distance bus station. Some industries, such as electronic bases, printing workhouses, power, and equipment plants, are primarily located in this cluster. Therefore, C7 can be annotated as a mixture of industrial and transportation areas.

4.3. Quantitative Comparison and Analysis

Table 4 illustrates the OA of the identified land use types with various methods. The latent multi-view subspace clustering method used in this study achieves the highest classification accuracy of 57.7%.
To illustrate the advantage of the multi-view subspace clustering method, the classification results obtained by different methods were further analyzed. Based on the classification results obtained using only the taxi data (Figure 6a), the commercial area around region A was highly overestimated; however, commercial areas such as Xidan (Region B) and Wangjing (Region C) could not be identified. From the classification results obtained using only the bus smart card data (Figure 6b), it was noted that some commercial areas (e.g., Wangjing in Region C) and commercial/entertainment areas (e.g., Sanlitun in Region A) could not be discovered. In addition, tourist attractions and water areas in the vicinity of region B (Temple of Heaven) were highly overestimated; however, the Temple of Heaven was wrongly identified as a residential/entertainment/commercial area. The classification results shown in Figure 6b,c are similar, because the proportion of bus ridership (96.34%) is much higher than that of taxi (4.66%) ridership. From the classification result obtained by the weighted method, some commercial areas (Region C) and commercial/entertainment areas (Region A) were unidentifiable, and some residential areas (e.g., Region B) were wrongly classified as tourist attractions and water areas. From the classification results obtained by the multi-view clustering method (Figure 6d), the misclassified areas in Figure 6a–c became correctly identified.

4.4. Discussion

Although the multi-view method can achieve higher land use classification accuracy than the method using a single type of urban mobility data and the weighted fusion method, the detection rate is relatively low (OA = 57.7%). The possible causes for the low detection rate of the multi-view clustering method were analyzed, and three primary factors were determined to likely affect the error rate of the classification.

4.4.1. Mismatch between Physical Characteristics and Social Function of Urban Land

The mismatch between the physical characteristics and social function of urban land may be the primary factor contributing to classification inaccuracy. The current land use maps were primarily obtained using remote sensing images and were closely related to the physical characteristics of the observed ground characteristics (e.g., spectral, shape, and texture). In fact, these land use maps cannot reflect the socioeconomic properties that are useful for urban planning [43]. For example, from the perspective of remote sensing images, C6 is a residential area because most of the buildings are houses. However, from the perspective of social function, C6 is a mixture of residential, entertainment, and commercial areas because it contains some famous shopping malls, tourist attractions, and bars. As a result, the urban mobility patterns in C6 are different from those in pure residential areas (e.g., C3, C4, and C5). Another example is Wangjing Street. From the perspective of remote sensing images, the main land covers in Wangjing Street are road and green land. Although the number of commercial facilities is not dominant in Wangjing Street, these commercial facilities are the main attractions and Wangjing Street is an emerging commercial area. By using urban mobility data, the commercial functions of Wangjing Street are obvious.

4.4.2. The Influence of Feature Construction

It is necessary to construct features that model the relationship between the temporal rhythms of human activities and urban land use types. The features extracted from urban mobility datasets significantly affect classification accuracy. In this study, these features were constructed based on experience. Although the pick-up/set-down dynamics on weekdays and weekends play an important role in modeling the relationship between temporal rhythms of human activities and urban land use types, some complex relationships may not be captured. In the future, the construction of features from urban mobility data should be paid more attention.

4.4.3. The Influence of Latent Multi-View Representation Model

The latent multi-view representation constructed a common underlying structure to preserve consistent information shared by multiple views. However, there may be some specific and discriminative information in each view. As a result, the underlying data distribution within varying views may not be comprehensively reconstructed. Correspondingly, the classification accuracy is affected. In the future, both consistent and specific information between multiple views should be considered to improve the performance of the multi-view clustering method.
The urban land use inferred from the perspective of social functions may provide calibration and reference for urban planning.
(i)
By using the latent multi-view subspace clustering method, more sophisticated land use types can be identified. For example, residential areas can be further divided into developed residential areas, less developed residential areas, and emerging residential areas. This sophisticated division will help urban planners formulate more targeted and effective policies for urban planning.
(ii)
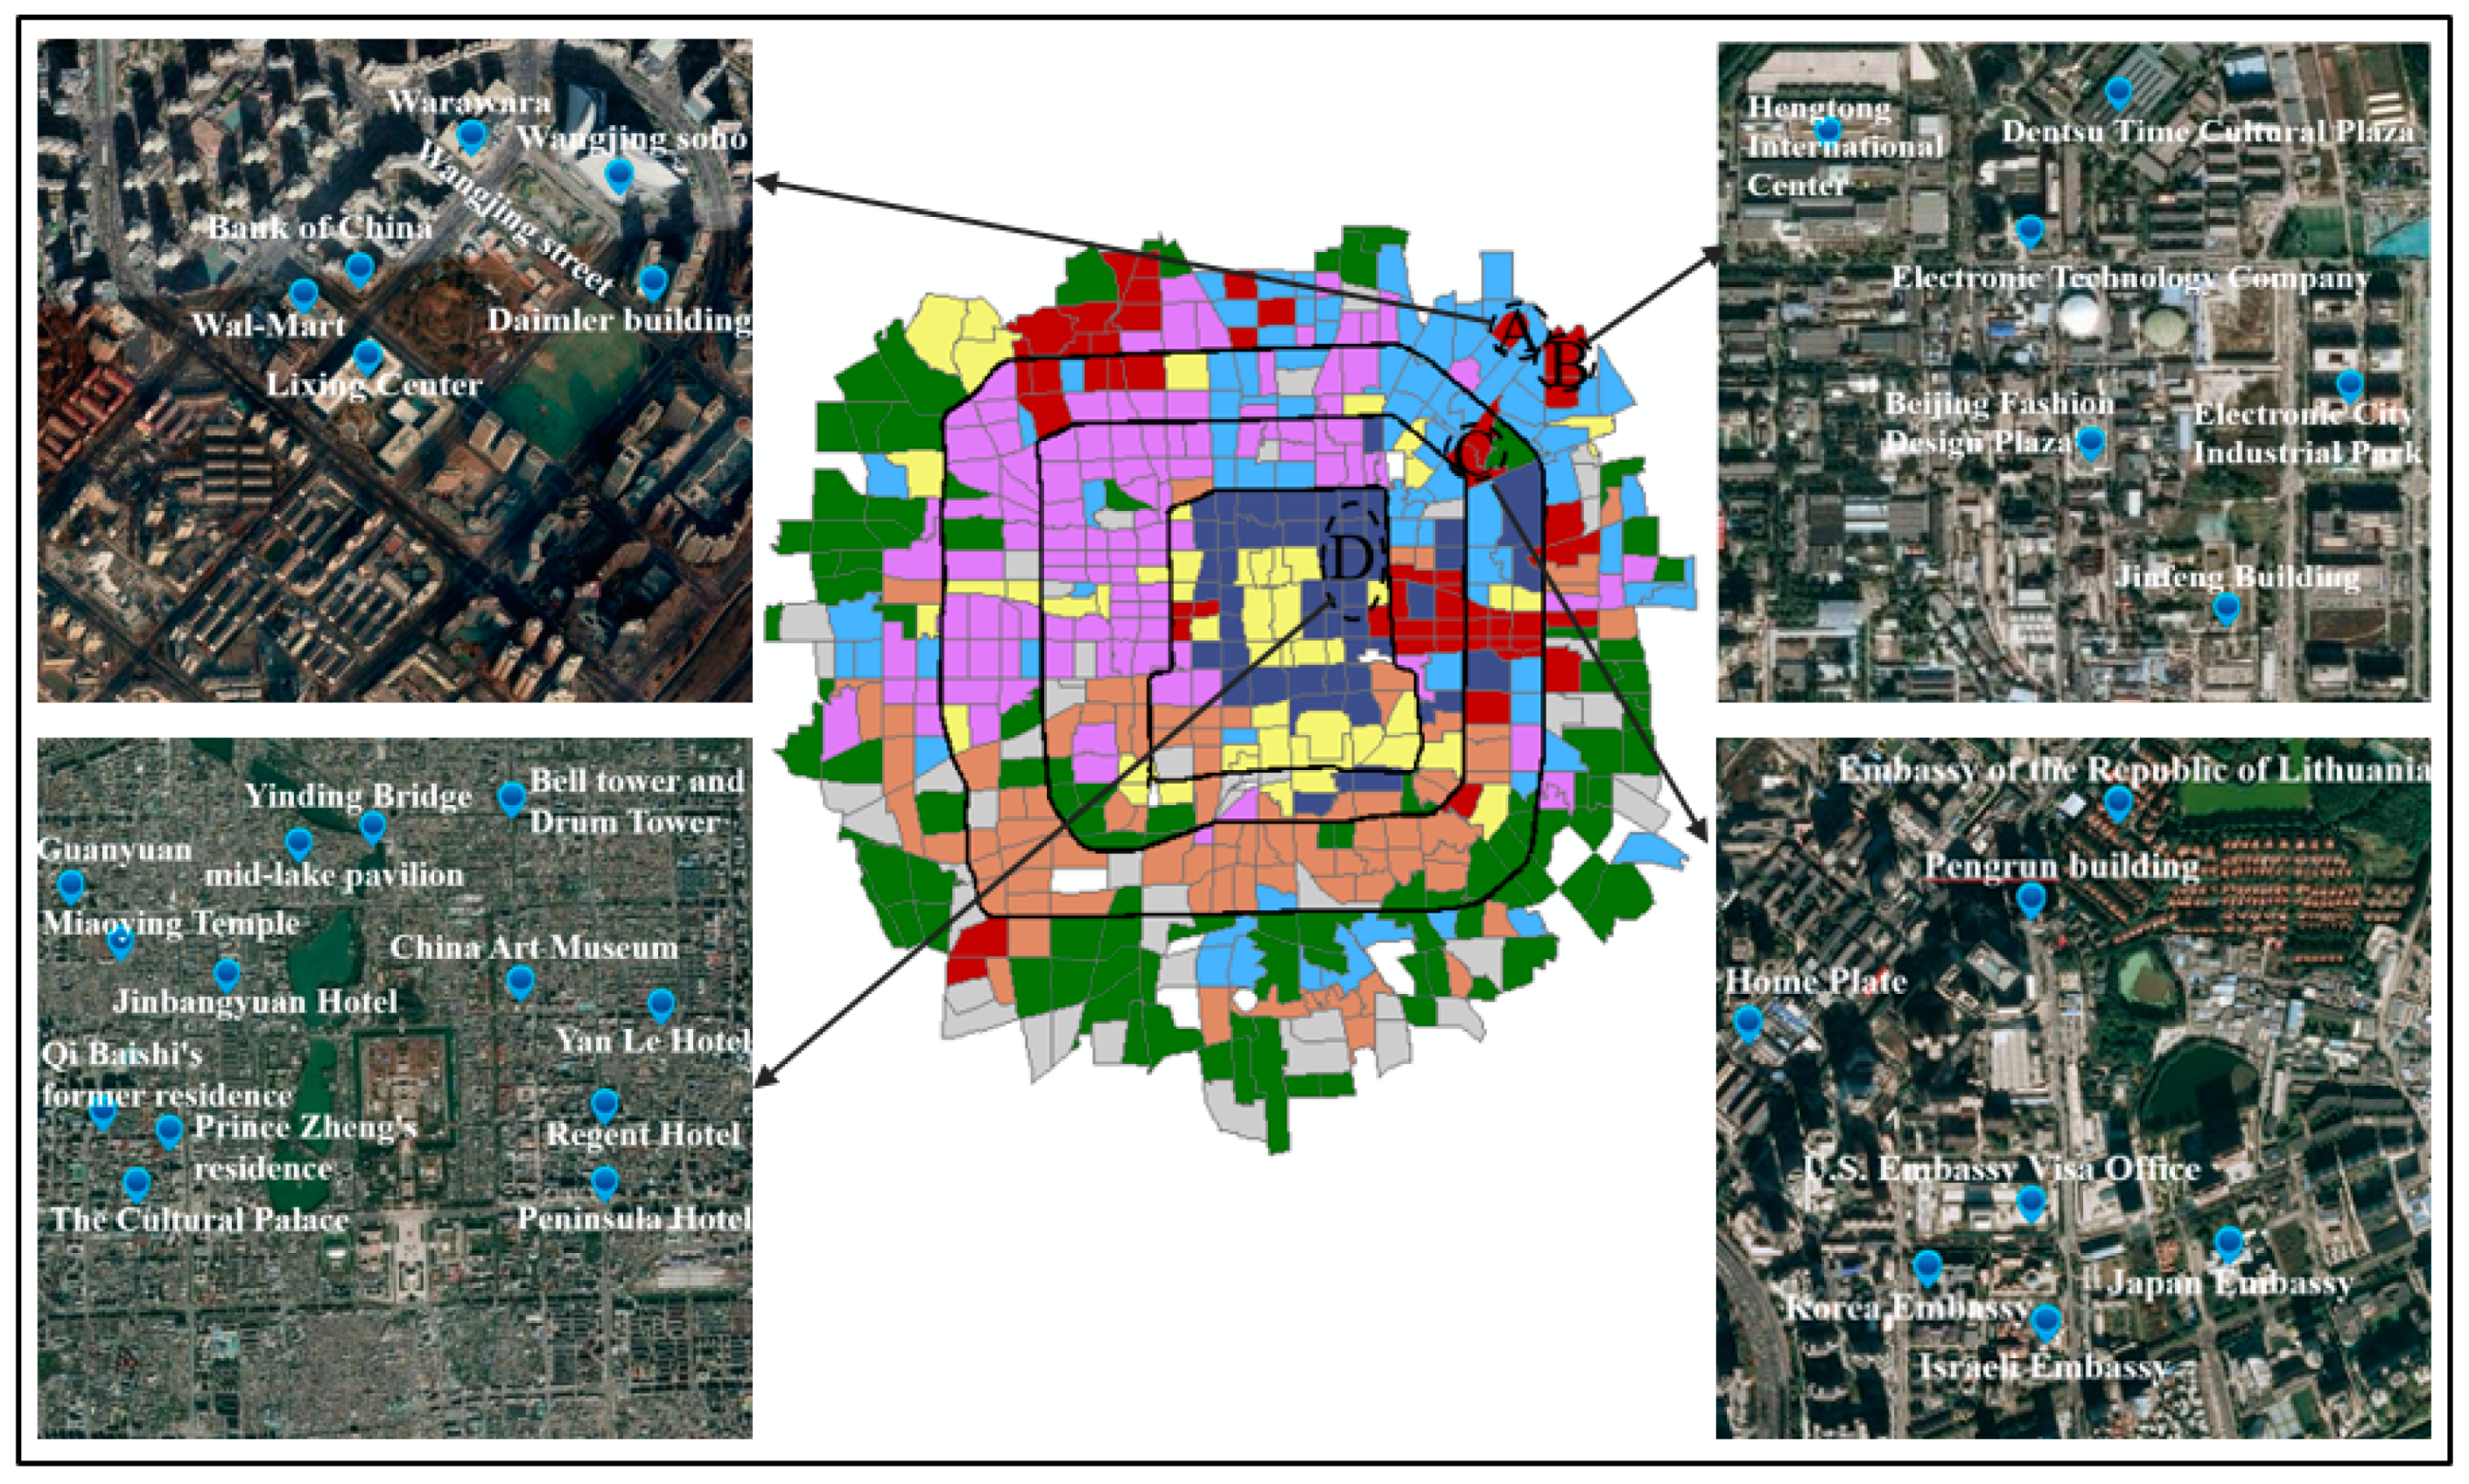
Some calibrations may be presented for urban land use planning. In the governmental land use map, areas A, B, C, and D were labeled as transportation service, industrial, public administration and service, and residential areas, respectively. Areas A, B, and C all developed into commercial areas. As shown in Figure 9, the landmark of area A is Wangjing Street, which is one of the emerging business areas in Beijing. Area B primarily contains the Hengtong International Business Center and some technology companies. Area C is an embassy gathering area that includes the U.S. Embassy, Korean Embassy, Japanese Embassy, and Israeli Embassy. Area D is a mixture of residential, entertainment, and commercial areas. The clusters discovered using the latent multi-view subspace clustering method are useful for identifying land use types from the perspective of human activities, and can make urban planning more human-centered.

5. Conclusions

Inferring urban land use by fusing noisy and high-dimensional multi-source urban mobility data (e.g., smart card transactions and taxi GPS trajectories) is a challenging issue in transport geography. The land use information inferred from a single-source urban mobility dataset is usually biased. In this study, a multi-view learning strategy was used to fuse multi-source urban mobility data to obtain a comprehensive view of urban land use. Features extracted from multi-source urban mobility datasets were fused by using a latent multi-view representation. Therefore, user-specified weights for different types of urban mobility data were avoided, and the effect of noise was handled well. A subspace clustering method was used to infer the land use types by using the latent multi-view representation, which can effectively process the “curse of dimensionality.” Experiments on taxi trajectory data and bus smart card data in Beijing reveal that the latent multi-view subspace clustering method outperforms the method using a single type of urban mobility dataset and the weighted fusion method. Analysis reveals that the latent multi-view subspace clustering method can reveal the social function of land use, and more sophisticated land use types can be identified by fusing multi-source urban mobility data, better revealing the effect of human activities on urban land use. The inferred urban land use can help governments formulate effective policies and regulations for urban planning and provide calibration and reference for urban planning.
Although the latent multi-view subspace clustering method is valuable for detecting urban land use types from the perspective of social function, two issues should be further considered. First, the classification errors may be partly due to method errors. In the future, specific representations between multiple views should be exploited to guarantee the diverse information of multi-view data. Second, the land use information extracted from urban mobility data may be insufficient. In this study, we mainly aimed to identify the social function of land use which cannot be well recognized by existing methods. Indeed, features extracted from remote sensing images can adequately reflect the physical characteristics of ground components, which play an important role in supplementing additional information for urban mobility data. In the future, we will continue our research to fuse urban mobility data and remote sensing images to infer urban land use. The main challenge is to identify complementary information between these two data sources.

Author Contributions

Qiliang Liu and Min Deng conceived and designed the presented idea; Weihua Huan implemented the experiments and analyzed the results; Qiliang Liu and Weihua Huan wrote the manuscript; Xiaolin Zheng and Haotao Yuan collected the research data, reviewed the manuscript, and provided comments. All authors have read and agreed to the published version of the manuscript.

Funding

This research was funded through support from the National Key Research and Development Foundation of China (No. 2017YFB0503601), National Natural Science Foundation of China (NSFC) (No. 41971353 and 41730105), and Natural Science Foundation of Hunan Province (No.2020JJ4695).

Data Availability Statement

The data presented in this study are available on request from the corresponding author. The data are not publicly available due to restrictions of privacy and morality.

Acknowledgments

We would like to thank Tao Pei and Zhou Huang for providing the land use data and traffic analysis zone data in Beijing.

Conflicts of Interest

The authors declare no conflict of interest.

References

  1. Ellis, E. Land-Use and Land-Cover Change. Available online: https://editors.eol.org/eoearth/wiki/Land-use_and_land-cover_change (accessed on 8 March 2021).
  2. Williamson, I.; Enemark, S.; Wallace, J.; Rajabifard, A. Land Administration for Sustainable Development; Emerald Group Publishing Limited: Emerald, UK, 2010; p. 324. [Google Scholar]
  3. Li, S.; Dragicevic, S.; Castro, F.A.; Sester, M.; Winter, M.; Coltekon, A. Geospatial big data handling theory and methods: A review and research challenges. ISPRS J. Photogramm. Remote Sens. 2016, 115, 119–133. [Google Scholar] [CrossRef] [Green Version]
  4. Huang, X.; Zhang, L. An SVM ensemble approach combining spectral, structural, and semantic features for the classification of high-resolution remotely sensed imagery. IEEE Trans. Geosci. Remote Sens. 2013, 51, 257–272. [Google Scholar] [CrossRef]
  5. Blaschke, T.; Hay, G.J.; Kelly, M.; Lang, S.; Hofmann, P.; Addink, E. Geographic object-based image analysis–towards a new paradigm. ISPRS J. Photogramm. Remote Sens. 2014, 87, 180–191. [Google Scholar] [CrossRef] [Green Version]
  6. Zhou, W.; Ming, D.; Lv, X.; Zhou, K.; Bao, H. SO–CNN based urban functional zone fine division with VHR remote sensing image. Remote Sens. Environ. 2019, 236, 111458. [Google Scholar] [CrossRef]
  7. Liu, Y.; Liu, X.; Gao, S.; Gong, L.; Kang, C.; Zhi, Y.; Chi, G.; Shi, L. Social Sensing: A New Approach to Understanding Our Socioeconomic Environments. Ann. Assoc. Am. Geogr. 2015, 105, 512–530. [Google Scholar] [CrossRef]
  8. Yao, Y.; Li, X.; Liu, X.; Liu, P.; Liang, Z.; Zhang, J.; Mai, K. Sensing spatial distribution of urban land use by integrating points-of-interest and Google Word2Vec model. Int. J. Geogr. Inf. Sci. 2017, 31, 825–848. [Google Scholar] [CrossRef]
  9. Pan, G.; Qi, G.; Wu, Z.; Zhang, D.; Li, S. Land-use classification using taxi gps traces. IEEE Trans. Intell. Transp. Syst. 2013, 14, 113–123. [Google Scholar] [CrossRef]
  10. Long, Y.; Shen, Z. Discovering functional zones using bus smart card data and points of interest in Beijing. In Geospatial Analysis to Support Urban Planning in Beijing; Long, Y., Shen, Z., Eds.; Springer: Berlin, Germany, 2015; Volume 116, pp. 193–217. [Google Scholar]
  11. Song, C.; Qu, Z.; Blumm, N.; Barabasi, A. Limits of predictability in urban mobility. Science 2010, 327, 1018–1021. [Google Scholar] [CrossRef] [Green Version]
  12. Sevtsuk, A.; Ratti, C. Does Urban Mobility Have a Daily Routine? Learning from the Aggregate Data of Mobile Networks. J. Urban Technol. 2010, 17, 41–60. [Google Scholar] [CrossRef]
  13. Pei, T.; Sobolevsky, S.; Ratti, C.; Li, T.; Zhou, C. A new insight into land use classification based on aggregated mobile phone data. Int. J. Geogr. Inf. Sci. 2014, 28, 1988–2007. [Google Scholar] [CrossRef] [Green Version]
  14. Ahas, R.; Mark, Ü. Location based services-new challenges for planning and public administration? Futures 2015, 37, 547–561. [Google Scholar] [CrossRef]
  15. Qi, G.; Li, X.; Li, S.; Pan, G.; Wang, Z.; Zhang, D. Measuring social functions of city regions from large-scale taxi behaviors. In Proceedings of the 2011 IEEE International Conference on Pervasive Computing and Communications Workshops, Seattle, WA, USA, 21–25 March 2011; pp. 384–388. [Google Scholar]
  16. Liu, Y.; Wang, F.; Xiao, Y.; Gao, S. Urban land uses and traffic “source-sink areas”: Evidence from GPS-enabled taxi data in Shanghai. Landsc. Urban Plan. 2012, 106, 73–87. [Google Scholar] [CrossRef]
  17. Soto, V.; Frias-Martinez, E. Automated land use identification using cell-phone records. In Proceedings of the 3rd ACM International Workshop on MobiArch, Bethesda, MD, USA, 28 June 2011; pp. 17–22. [Google Scholar]
  18. Toole, J.; Ulm, M.; Bauer, D.; Gonzalez, M. Inferring land use from mobile phone activity. In Proceedings of the ACM SIGKDD International Workshop on Urban Computing, Beijing, China, 12 August 2012; pp. 1–8. [Google Scholar]
  19. Fan, K.; Zhang, D.; Wang, Y.; Zhao, S. Discovering Urban Social Functional Regions Using Taxi Trajectories. In Proceedings of the 2015 IEEE 12th International Conference on Ubiquitous Intelligence and Computing, Beijing, China, 10–14 August 2015; pp. 356–359. [Google Scholar]
  20. Mazimpaka, J.D.; Timpf, S. Exploring the potential of combining taxi GPS and flickr data for discovering functional regions. In Proceedings of the 18th Association-of-Geographic-Information-Laboratories-for-Europe Conference on Geographic Information Science, Lisbon, Portugal, 9–12 June 2015; pp. 3–18. [Google Scholar]
  21. Mou, X.; Cai, F.; Zhang, X.; Chen, J.; Zhu, R.R. Urban Function Identification Based on POI and Taxi Trajectory Data. In Proceedings of the 2019 3rd International Conference on Big Data Research, Paris, France, 20 November 2019; pp. 152–156. [Google Scholar]
  22. Liu, X.; Tian, Y.; Zhang, X.; Wan, Z. Identification of Urban Functional Regions in Chengdu Based on Taxi Trajectory Time Series Data. Int. J. Geo-Inf. 2020, 9, 158. [Google Scholar] [CrossRef] [Green Version]
  23. Yue, M.; Kang, C.; Andris, A.; Qin, K.; Liu, Y.; Meng, Q. Understanding the interplay between bus, metro, and cab ridership dynamics in Shenzhen, China. Trans. GIS 2018, 22, 855–871. [Google Scholar] [CrossRef]
  24. Zhai, W.; Bai, X.; Shi, Y.; Han, Y.; Peng, Z.; Gu, C. Beyond word2vec: An approach for urban functional region extraction and identification by combining place2vec and POIs. Comput. Environ. Urban Syst. 2019, 74, 1–12. [Google Scholar] [CrossRef]
  25. Yuan, J.; Zheng, Y.; Xie, X. Discovering regions of different functions in a city using urban mobility and POIs. In Proceedings of the 18th ACM SIGKDD International Conference on Knowledge Discovery and Data Mining, Beijing, China, 12–16 August 2012; pp. 186–194. [Google Scholar]
  26. Yuan, N.; Zheng, Y.; Xie, X.; Wang, Y.; Zheng, K.; Xiong, H. Discovering Urban Functional Zones Using Latent Activity Trajectories. IEEE Trans. Knowl. Data Eng. 2015, 27, 712–725. [Google Scholar] [CrossRef]
  27. Zhang, X.; Xu, Y.; Tu, W.; Ratti, C. Do different datasets tell the same story about urban mobility—A comparative study of public transit and taxi usage. J. Transp. Geogr. 2018, 70, 78–90. [Google Scholar] [CrossRef]
  28. Tu, W.; Cao, R.; Yue, Y.; Zhou, B.; Li, Q. Spatial variations in urban public ridership derived from GPS trajectories and smart card data. J. Transp. Geogr. 2018, 69, 45–57. [Google Scholar] [CrossRef] [Green Version]
  29. Tu, W.; Zhu, T.; Xia, J.; Zhou, Y.; Lai, Y.; Jiang, J.; Li, Q. Portraying the spatial dynamics of urban vibrancy using multisource urban big data. Comput. Environ. Urban Syst. 2020, 80, 101428. [Google Scholar] [CrossRef]
  30. Miller, H.; Goodchild, M. Data-driven geography. GeoJournal 2015, 80, 449–461. [Google Scholar] [CrossRef]
  31. Liu, J.; Li, J.; Li, W.; Wu, J. Rethinking big data: A review on the data quality and usage issues. ISPRS J. Photogramm. Remote Sens. 2016, 115, 134–142. [Google Scholar] [CrossRef]
  32. Zhang, C.; Fu, H.; Hu, Q.; Cao, X.; Xie, Y.; Tao, D.; Xu, D. Generalized Latent Multi-View Subspace Clustering. IEEE Trans. Pattern Anal. Mach. Intell. 2020, 42, 86–99. [Google Scholar] [CrossRef]
  33. Parsons, L. Subspace clustering for high dimensional data: A review. In ACM SIGKDD Explorations Newsletter; Fayyad, U., Ed.; Association for Computing Machinery: New York, NY, USA, 2004; Volume 6, pp. 90–105. [Google Scholar]
  34. Cheng, J.; Liu, J.; Gao, Y. Analyzing the spatio-temporal characteristics of Beijing′s OD trip volume based on time series clustering method. Int. J. Geo-Inf. 2016, 18, 1227–1239. [Google Scholar]
  35. Zhang, C.; Hu, Q.; Fu, H.; Zhu, P.; Cao, X. Latent Multi-view Subspace Clustering. In Proceedings of the IEEE Conference on Computer Vision and Pattern Recognition, Honolulu, Hawaii, 22–25 July 2017; pp. 79–4287. [Google Scholar]
  36. Liu, G.; Lin, Z.; Yan, S.; Sun, J.; Yu, Y.; Ma, Y. Robust recovery of subspace structures by low-rank representation. IEEE Trans. Pattern Anal. Mach. Intell. 2010, 35, 171–184. [Google Scholar] [CrossRef] [Green Version]
  37. Guo, Y. Convex subspace representation learning from multi-view data. In Proceedings of the AAAI Conference on Artificial Intelligence, Bellevue, WA, USA, 14–18 July 2013; pp. 387–393. [Google Scholar]
  38. Gao, H.; Nie, F.; Li, X.L.; Huang, H. Multi-view Subspace Clustering. In Proceedings of the 2015 IEEE International Conference on Computer Vision, Santiago, Chile, 7–13 December 2015; pp. 4238–4246. [Google Scholar]
  39. Elhamifar, E.; Vidal, R. Sparse Subspace Clustering: Algorithm, Theory, and Applications. IEEE Trans. Pattern Anal. Mach. Intell. 2012, 35, 2765–2781. [Google Scholar] [CrossRef] [Green Version]
  40. Ng, A.; Jordan, M.; Weiss, Y. On spectral clustering: Analysis and an algorithm. In Advances in Neural Information Processing Systems; Tenenbaum, J., Griffiths, T., Eds.; Morgan Kaufmann Publishers: San Francisco, CA, USA, 2001; Volume 14, pp. 849–856. [Google Scholar]
  41. Han, D.; Yuan, X. A note on the alternating direction method of multipliers. J. Optim. Theory Appl. 2012, 155, 227–238. [Google Scholar] [CrossRef]
  42. Rousseeuw, P. Silhouettes: A Graphical Aid to the Interpretation and Validation of Cluster Analysis. J. Comput. Appl. Math. 1987, 20, 53–65. [Google Scholar] [CrossRef] [Green Version]
  43. Liu, X.; He, J.; Yao, Y.; Zhang, J.; Liang, H.; Wang, H.; Hong, Y. Classifying urban land use by integrating remote sensing and social media data. Int. J. Geogr. Inf. Sci. 2017, 31, 1675–1696. [Google Scholar] [CrossRef]
Figure 1. Study area. (a) Division of study area; (b) Beijing land use map (2017).
Ijgi 10 00274 g001
Figure 2. The number of pick-up/set-down points over time. (a) Number of bus pick-up points; (b) number of taxi pick-up points; (c) number of bus set-down points; (d) number of taxi set-down points.
Ijgi 10 00274 g002
Figure 3. Illustration of the latent multi-view representation for subspace clustering.
Ijgi 10 00274 g003
Figure 4. Illustration of multi-view latent representation.
Ijgi 10 00274 g004
Figure 5. Silhouette coefficient values with different cluster numbers.
Ijgi 10 00274 g005
Figure 6. Clustering results by using different methods. (a) Method using taxi GPS trajectory; (b) method using bus smart card data; (c) weighted fusion method; (d) latent multi-view subspace clustering method. (Note: Region A in (ac) is Sanlitun. Region A in (d) is Beijing Central Business District. Region B in (a,b) is Temple of Heaven. Region B in (c) is residential area. Region B in (d) is Xidan. Region C in (ad) is Wangjing. Region D, E, F in (d) are embassy, Temple of Heaven, residential areas respectively.)
Ijgi 10 00274 g006
Figure 7. Transition matrices of the clusters discovered by latent multi-view subspace clustering method. (a) arriving, C3, weekday; (b) leaving, C3, weekday; (c) arriving, C3, weekend; (d) leaving, C3, weekend; (e) arriving, C4, weekday; (f) leaving, C4, weekday; (g) arriving, C4, weekend; (h) leaving, C4,weekend; (i) arriving, C5, weekday; (j) leaving, C5, weekday; (k) arriving, C5, weekend; (l) leaving, C5, weekend; (m) arriving, C6, weekday; (n) leaving, C6,weekday; (o) arriving, C6, weekend; (p) leaving, C6, weekend.
Ijgi 10 00274 g007
Figure 8. Intensity of representative kinds of POIs. (a) C1; (b) C2.
Ijgi 10 00274 g008
Figure 9. Google Earth images. (Note: Region A is Wangjing Street. Region B mainly contains some business buildings. Region C mainly contains some embassies. Region D is a mixture of residential, entertainment, and commercial areas.)
Ijgi 10 00274 g009
Table 1. Abbreviation list.
AbbreviationFull Name
GPSGlobal positioning system
BTSBase transceiver station
POIPoint of interest
FDFrequency density
CRCategory ratio
TAZTraffic analysis zone
CBFCommercial and business facility
RULResidential land
TAWTourist attraction and water
IULIndustrial land
PASPublic administration and service
RTFRoad and transportation facility
AGRAgriculture
OAOverall accuracy
Table 2. Land use classification performance by different features.
FeatureIIIIIIIVVVIVII
OA40.73%36.92%47.83%47.66%41.07%42.81%57.7%
Table 3. FD and CR of each cluster.
POIC1C2C3C4C5C6C7C8
FDCRFDCRFDCRFDCRFDCRFDCRFDCRFDCR
Attraction22.410.87%3.020.09%1.140.05%3.530.17%3.740.15%16.270.56%3.390.28%1.460.17%
Doorplate88.962.77%83.612.85%126.875.08%94.734.06%115.924.17%117.432.93%57.813.57%47.304.16%
Building10.880.58%34.441.05%19.380.49%16.540.73%18.170.79%23.510.59%10.000.42%2.700.32%
Company97.265.21%352.3110.7%113.855.36%133.286.29%156.786.38%164.884.12%88.275.26%48.665.72%
Shopping4.370.23%21.690.66%9.410.38%11.850.72%10.240.82%35.170.88%2.280.19%1.800.21%
Theater1.280.06%3.300.17%1.380.05%1.920.09%1.790.07%3.290.15%0.880.07%0.170.02%
Public toilet32.241.73%31.411.02%23.650.95%21.350.92%22.420.91%37.961.45%14.380.78%13.430.58%
Industry0.550.03%0.630.05%0.700.03%0.230.05%0.090.050.670.02%1.120.10%0.880.07%
Restaurant26.851.43%72.782.22%39.811.59%37.641.80%38.981.57%15.881.56%15.481.60%13.121.54%
Healthcare9.590.32%10.230.48%10.980.49%14.660.59%14.290.58%18.760.47%7.100.58%4.850.57%
Dwelling61.792.31%72.862.22%61.202.93%91.633.07%88.313.17%85.192.13%29.412.42%21.992.19%
Living service105.445.65%112.536.18%125.746.42%164.206.58%161.966.73%220.775.52%76.935.33%48.215.67%
Science/Education5.290.29%8.220.37%19.880.80%11.030.51%22.100.69%11.120.28%3.830.31%2.540.30%
Sport center7.210.39%5.100.62%11.360.45%12.370.59%20.520.50%12.390.51%4.820.40%3.640.43%
Bank6.700.16%15.640.28%7.670.31%8.230.40%10.490.42%11.660.29%3.990.23%1.740.12%
Hospital10.660.17%3.550.11%7.240.24%5.05039%12.950.57%7.660.32%4.020.13%1.480.17%
Courier service6.680.36%14.480.44%9.170.64%15.970.78%11.510.94%12.560.31%9.490.44%8.020.47%
Hotel16.720.90%20.900.64%13.380.78%13.370.64%18.860.86%36.740.82%9.100.75%5.070.60%
Convenient store13.380.75%17.320.83%24.870.98%20.981.01%27.241.11%26.161.15%15.410.72%14.290.86%
Administrative place0.080.00%0.280.00%0.240.00%0.250.01%0.250.01%0.270.00%0.210.01%0.650.03%
Recreation16.850.55%18.570.67%14.180.52%14.280.54%13.450.48%42.721.07%9.210.57%4.070.48%
Tolls 00.00%00.00%00.00%00.00%00.00%00.00%0.260.03%00.00%
Note: The highlighted cells indicate that the corresponding FD and CR are significantly high. Ijgi 10 00274 i001 Low Ijgi 10 00274 i002 Medium Ijgi 10 00274 i003 High.
Table 4. Overall accuracy of different methods.
MethodsSingle-View Method
(Taxi)
Single-View Method
(Bus)
Weighted Fusion MethodThe Adopted
Method
OA36.6%37.6%44.5%57.7%
Publisher’s Note: MDPI stays neutral with regard to jurisdictional claims in published maps and institutional affiliations.

