
IdroGEO: A Collaborative Web Mapping Application Based on REST API Services and Open Data on Landslides and Floods in Italy


 ,
,  ,
, 
Abstract
1. Introduction
2. Materials and Methods
2.1. Data Description and Data Model
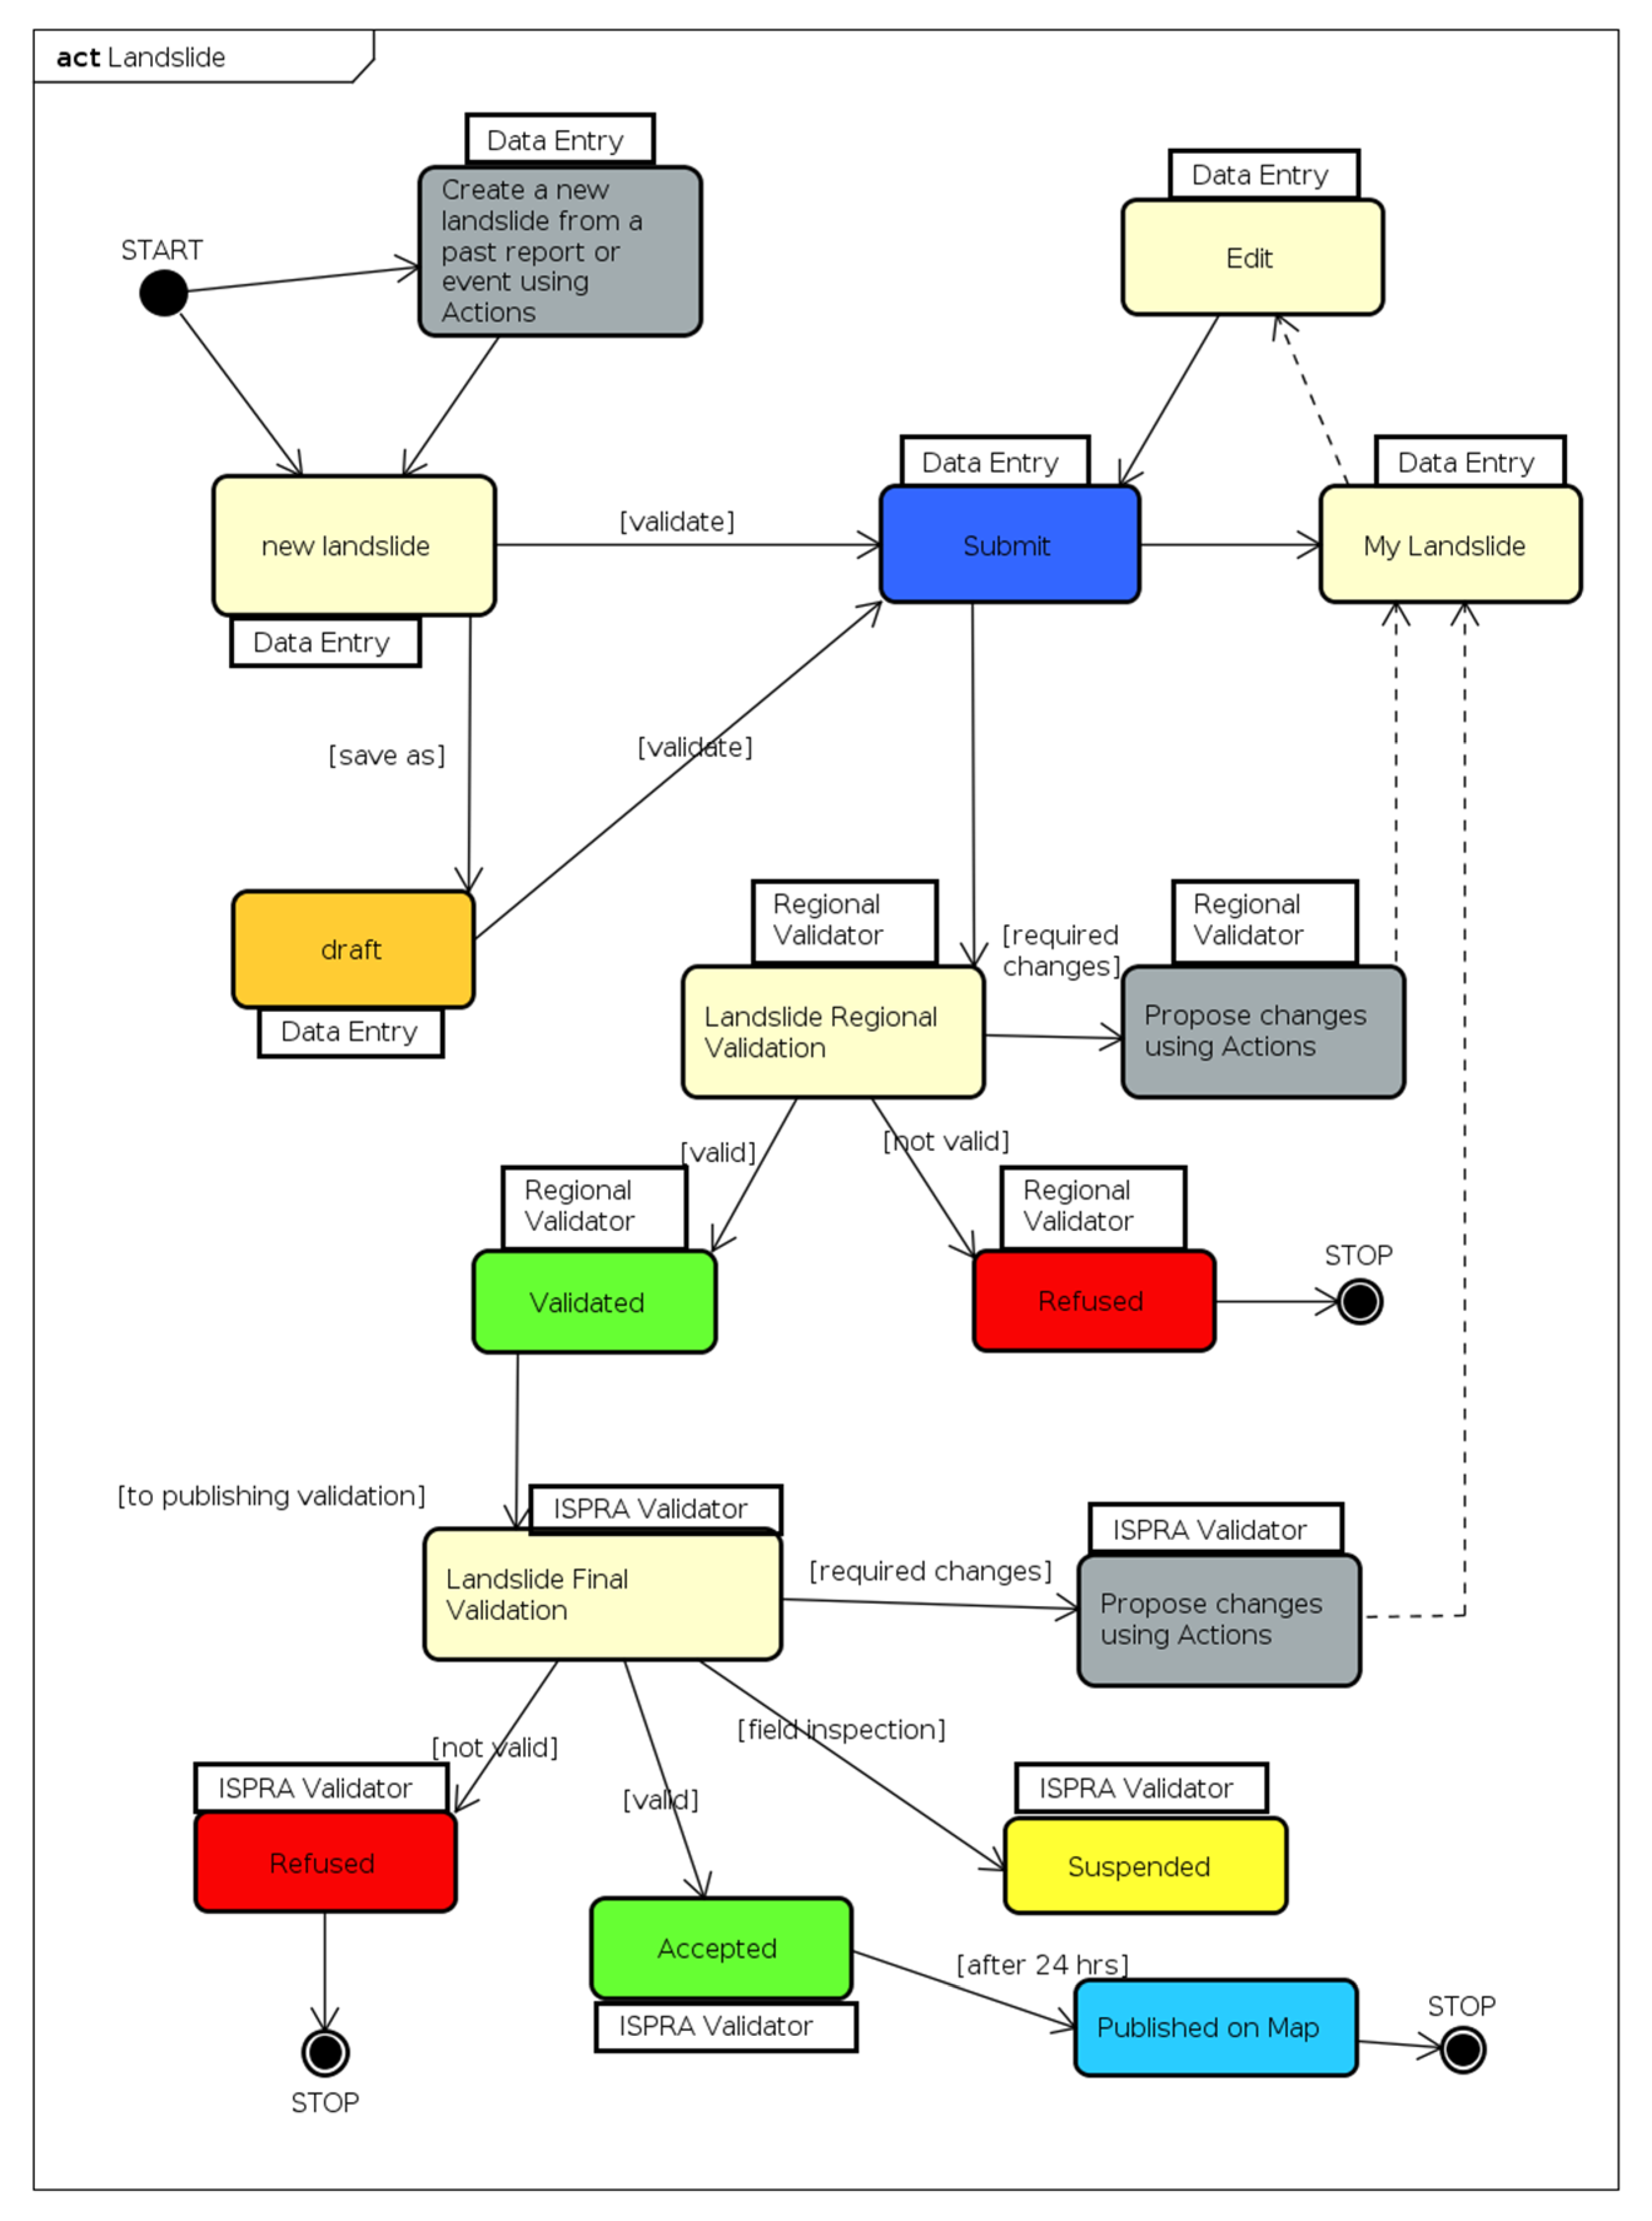
2.1.1. IFFI Data Model and Editing Workflow
- Landslide Reports contain a limited amount of information (e.g., location, damage, date of occurrence) or multimedia content (photos, videos, documents). Reports are entered by public administration officers (e.g., forestry services, municipal technicians) or by professionals (geologists, engineers, etc.), and validated by the IFFI regional technical units.
- Landslide Events have a known date of occurrence and are recorded by filling in the Event online form, which contains a selection of fields from the IFFI Landslide form and fewer mandatory fields. The Event form can be used, especially during emergency activities, to easily register a landslide event, both for a newly formed landslide and for a reactivation of an existing IFFI landslide. Geometry can be represented only with a point or also with a polygon regardless of the landslide size.
- IFFI Landslides are recorded by filling in the complete IFFI Landslide online form. Each Landslide is represented by a point (Landslide Identification Point) located at the landslide crown, by a polygon when the area of the landslide can be mapped at the adopted survey scale or by a line, when the width of the landslide cannot be mapped (e.g., rapid debris flows) [30].
- Landslide ID
- Reporter
- Institution
- Date of report
- Geographical context related data (Region, Province, Municipality, River Basin District Authority)
- Description
- Type of movement
- Date of observation
- State of activity
- Method (used to evaluate the type of movement and state of activity)
- Damage
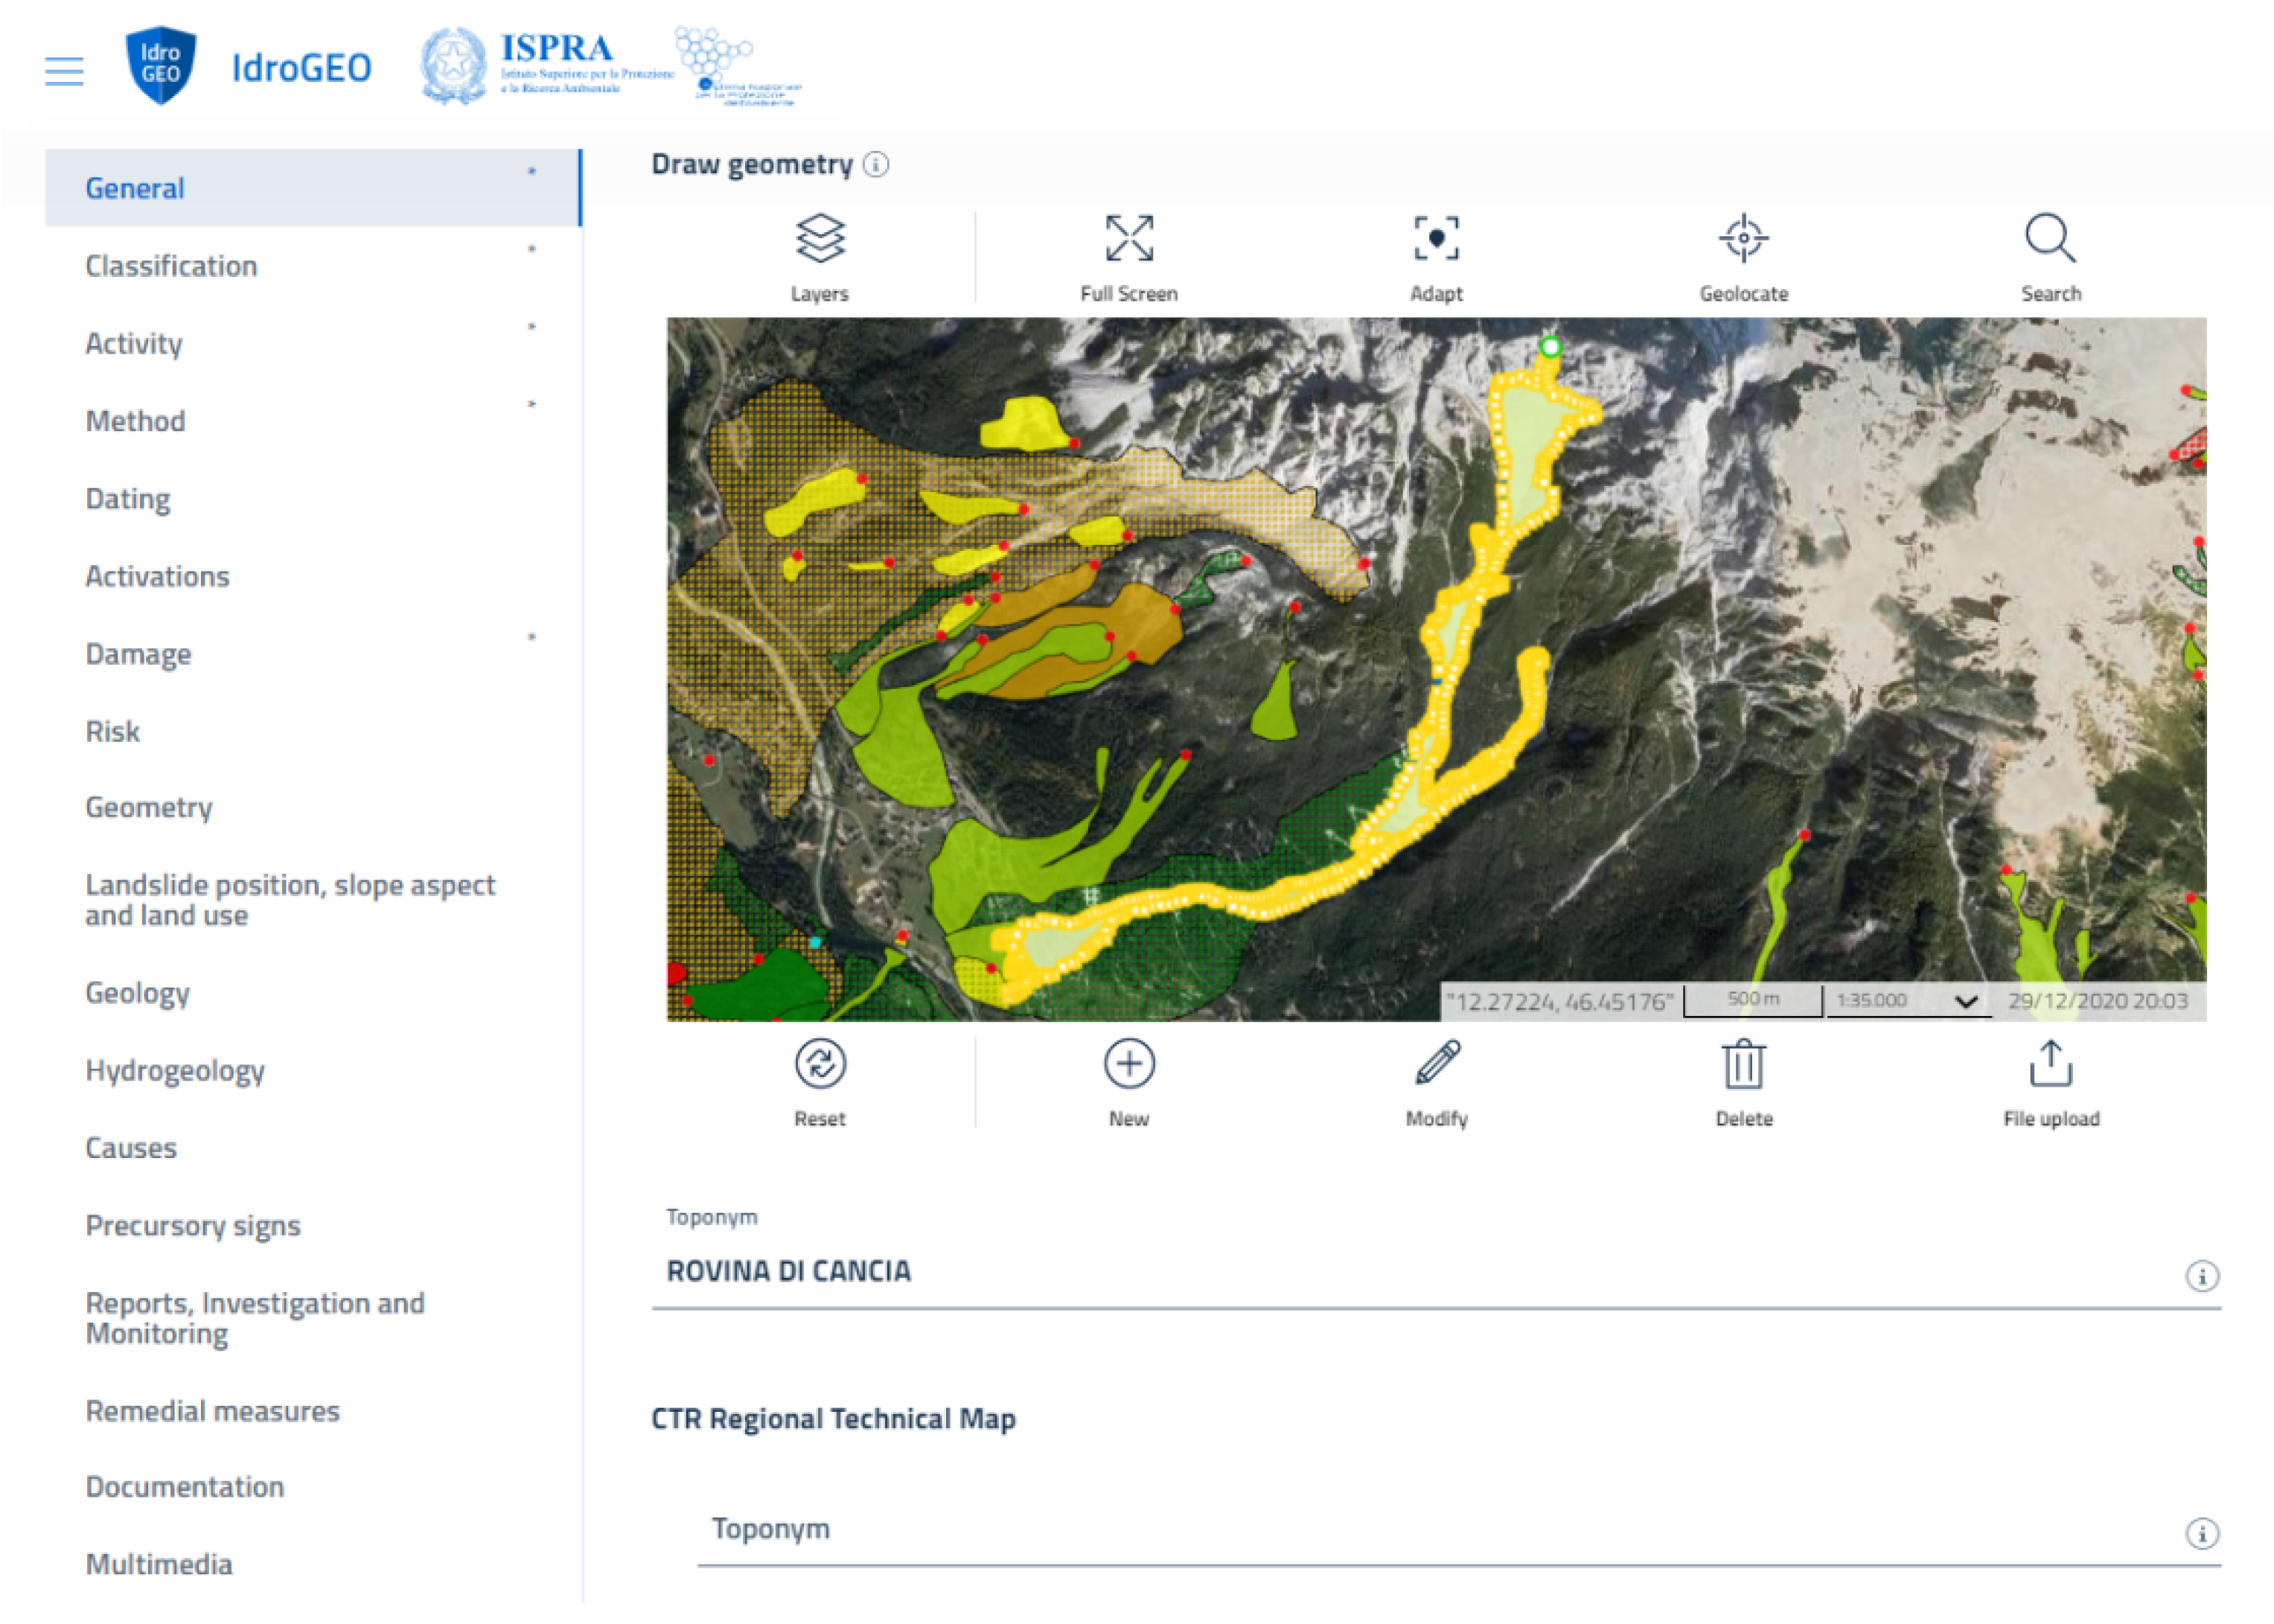
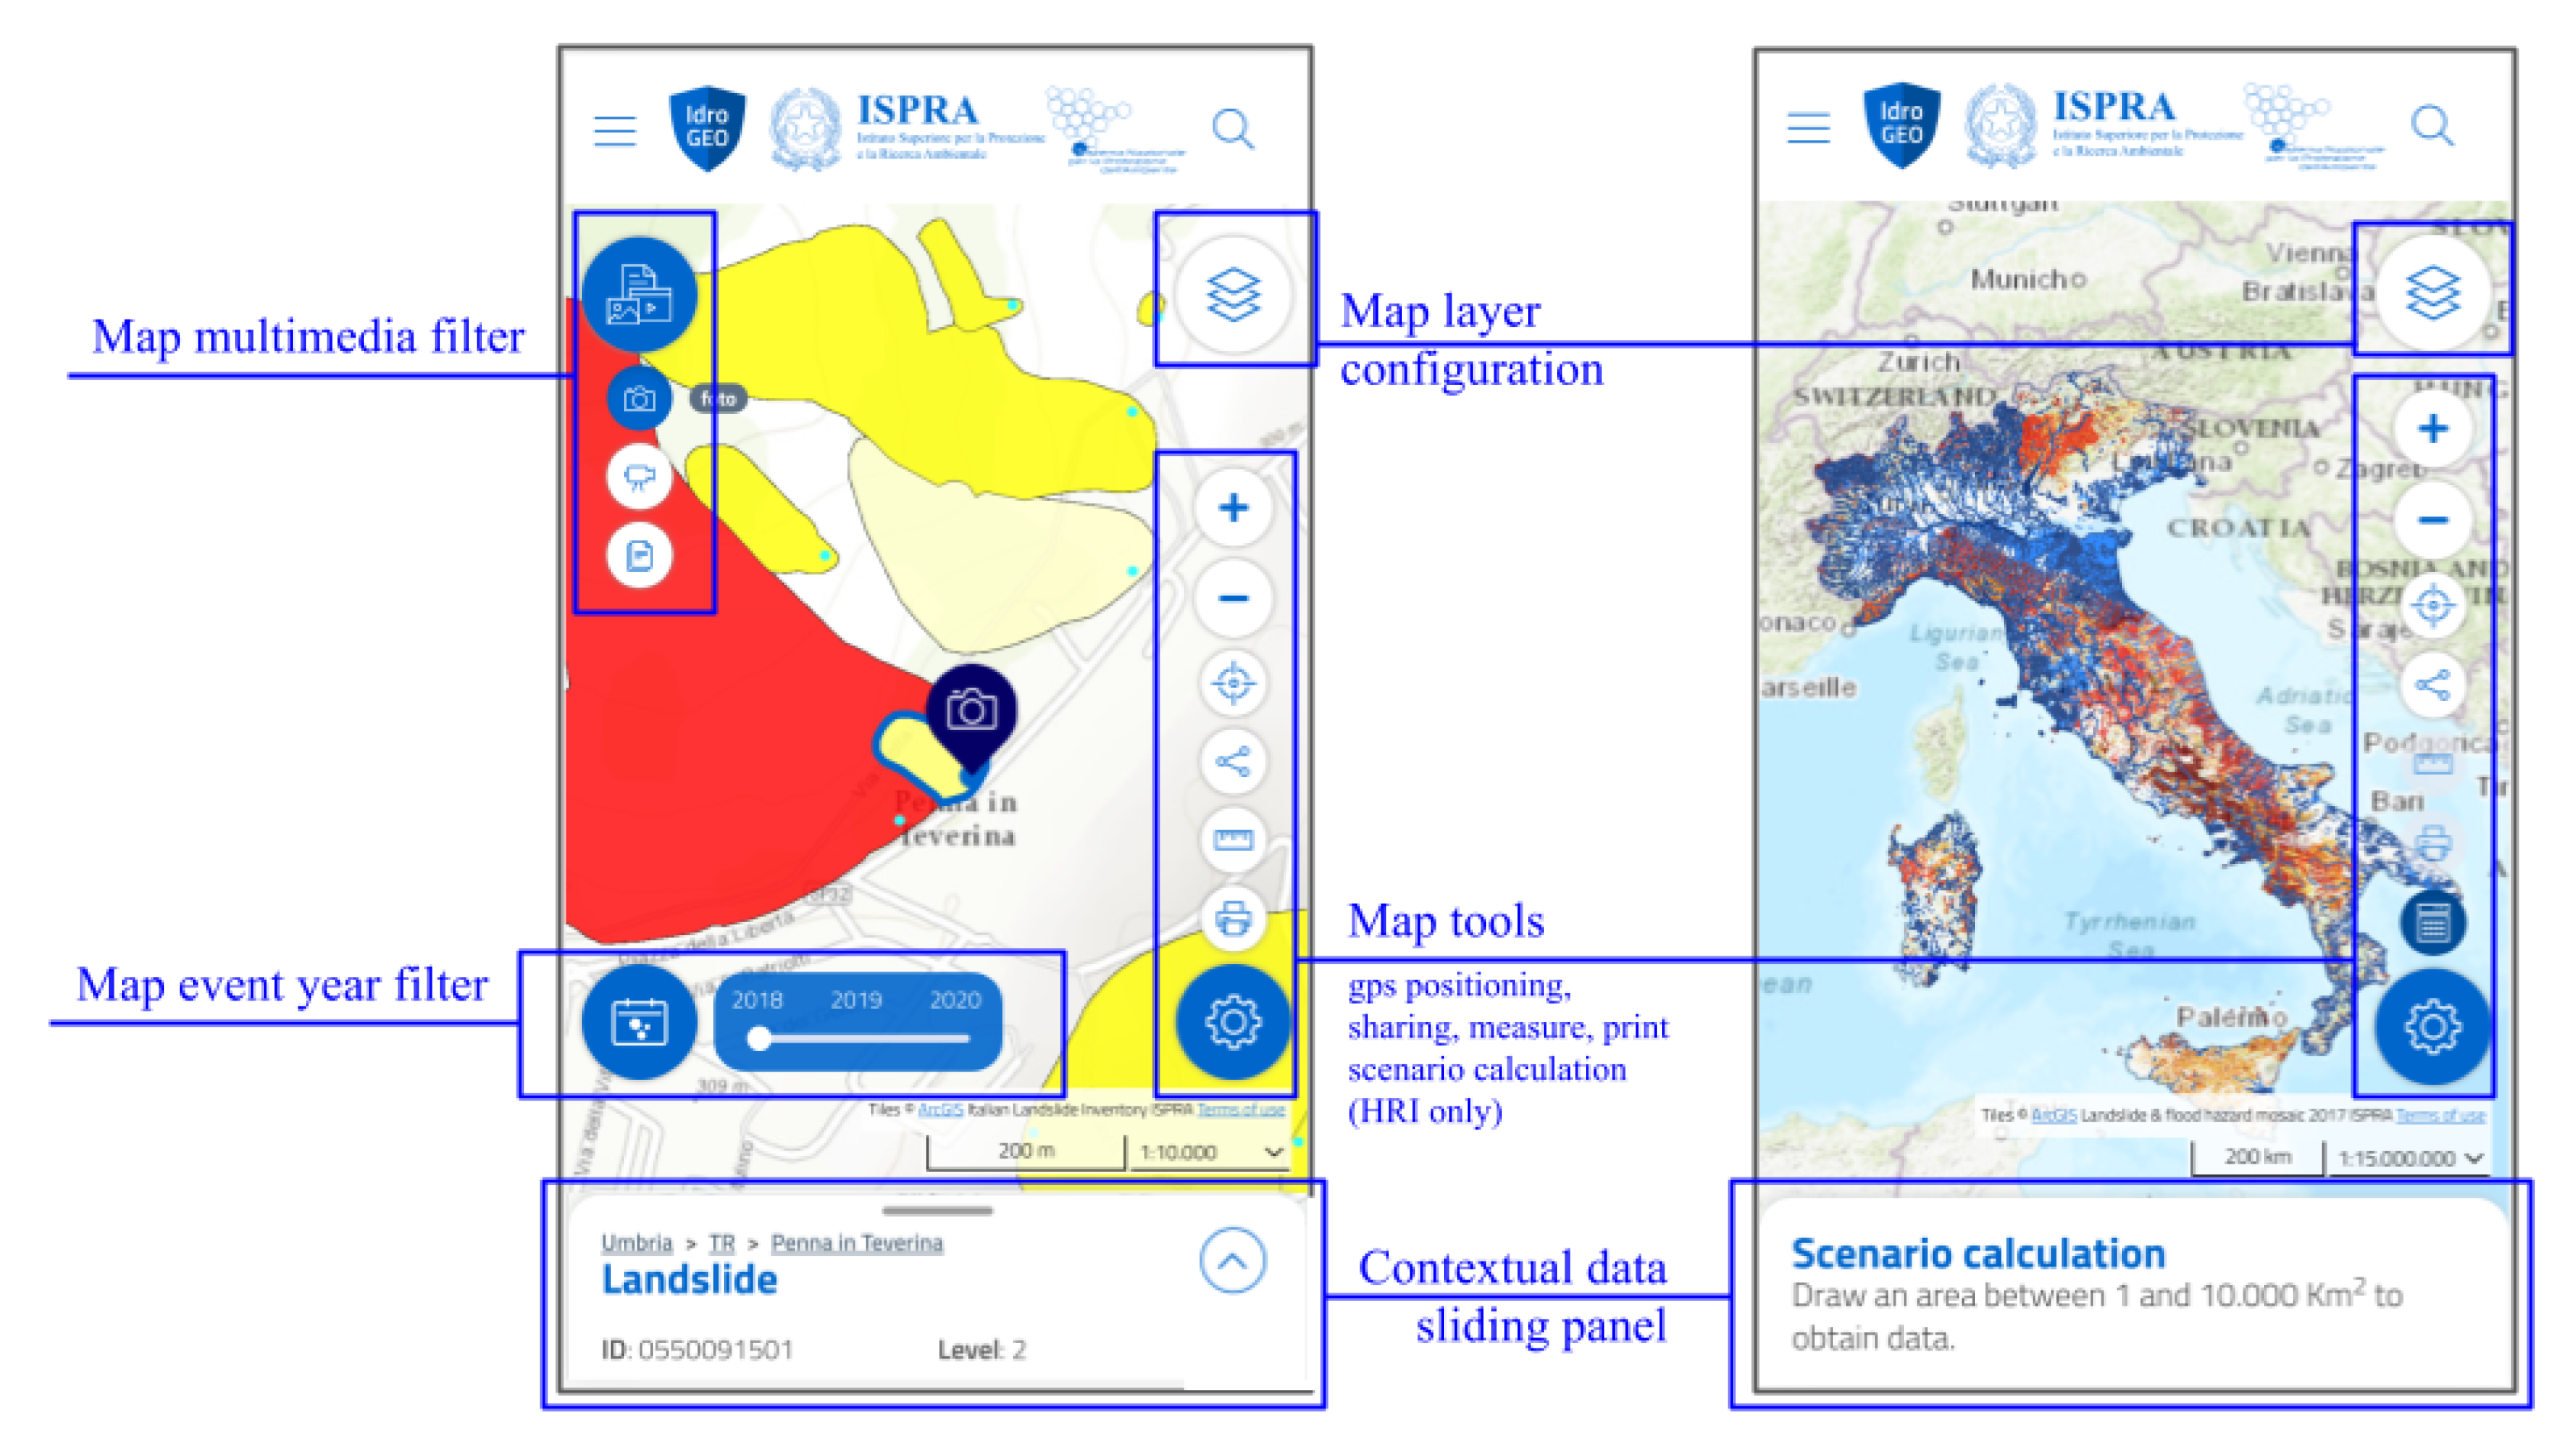
2.2. User Interface
- Print landslide reportThe report contains the excerpt of the map of the selected landslide and all the associated information contained in the IFFI inventory database and structured into sections (General, Classification, Activity, Dating, Damage, etc.).
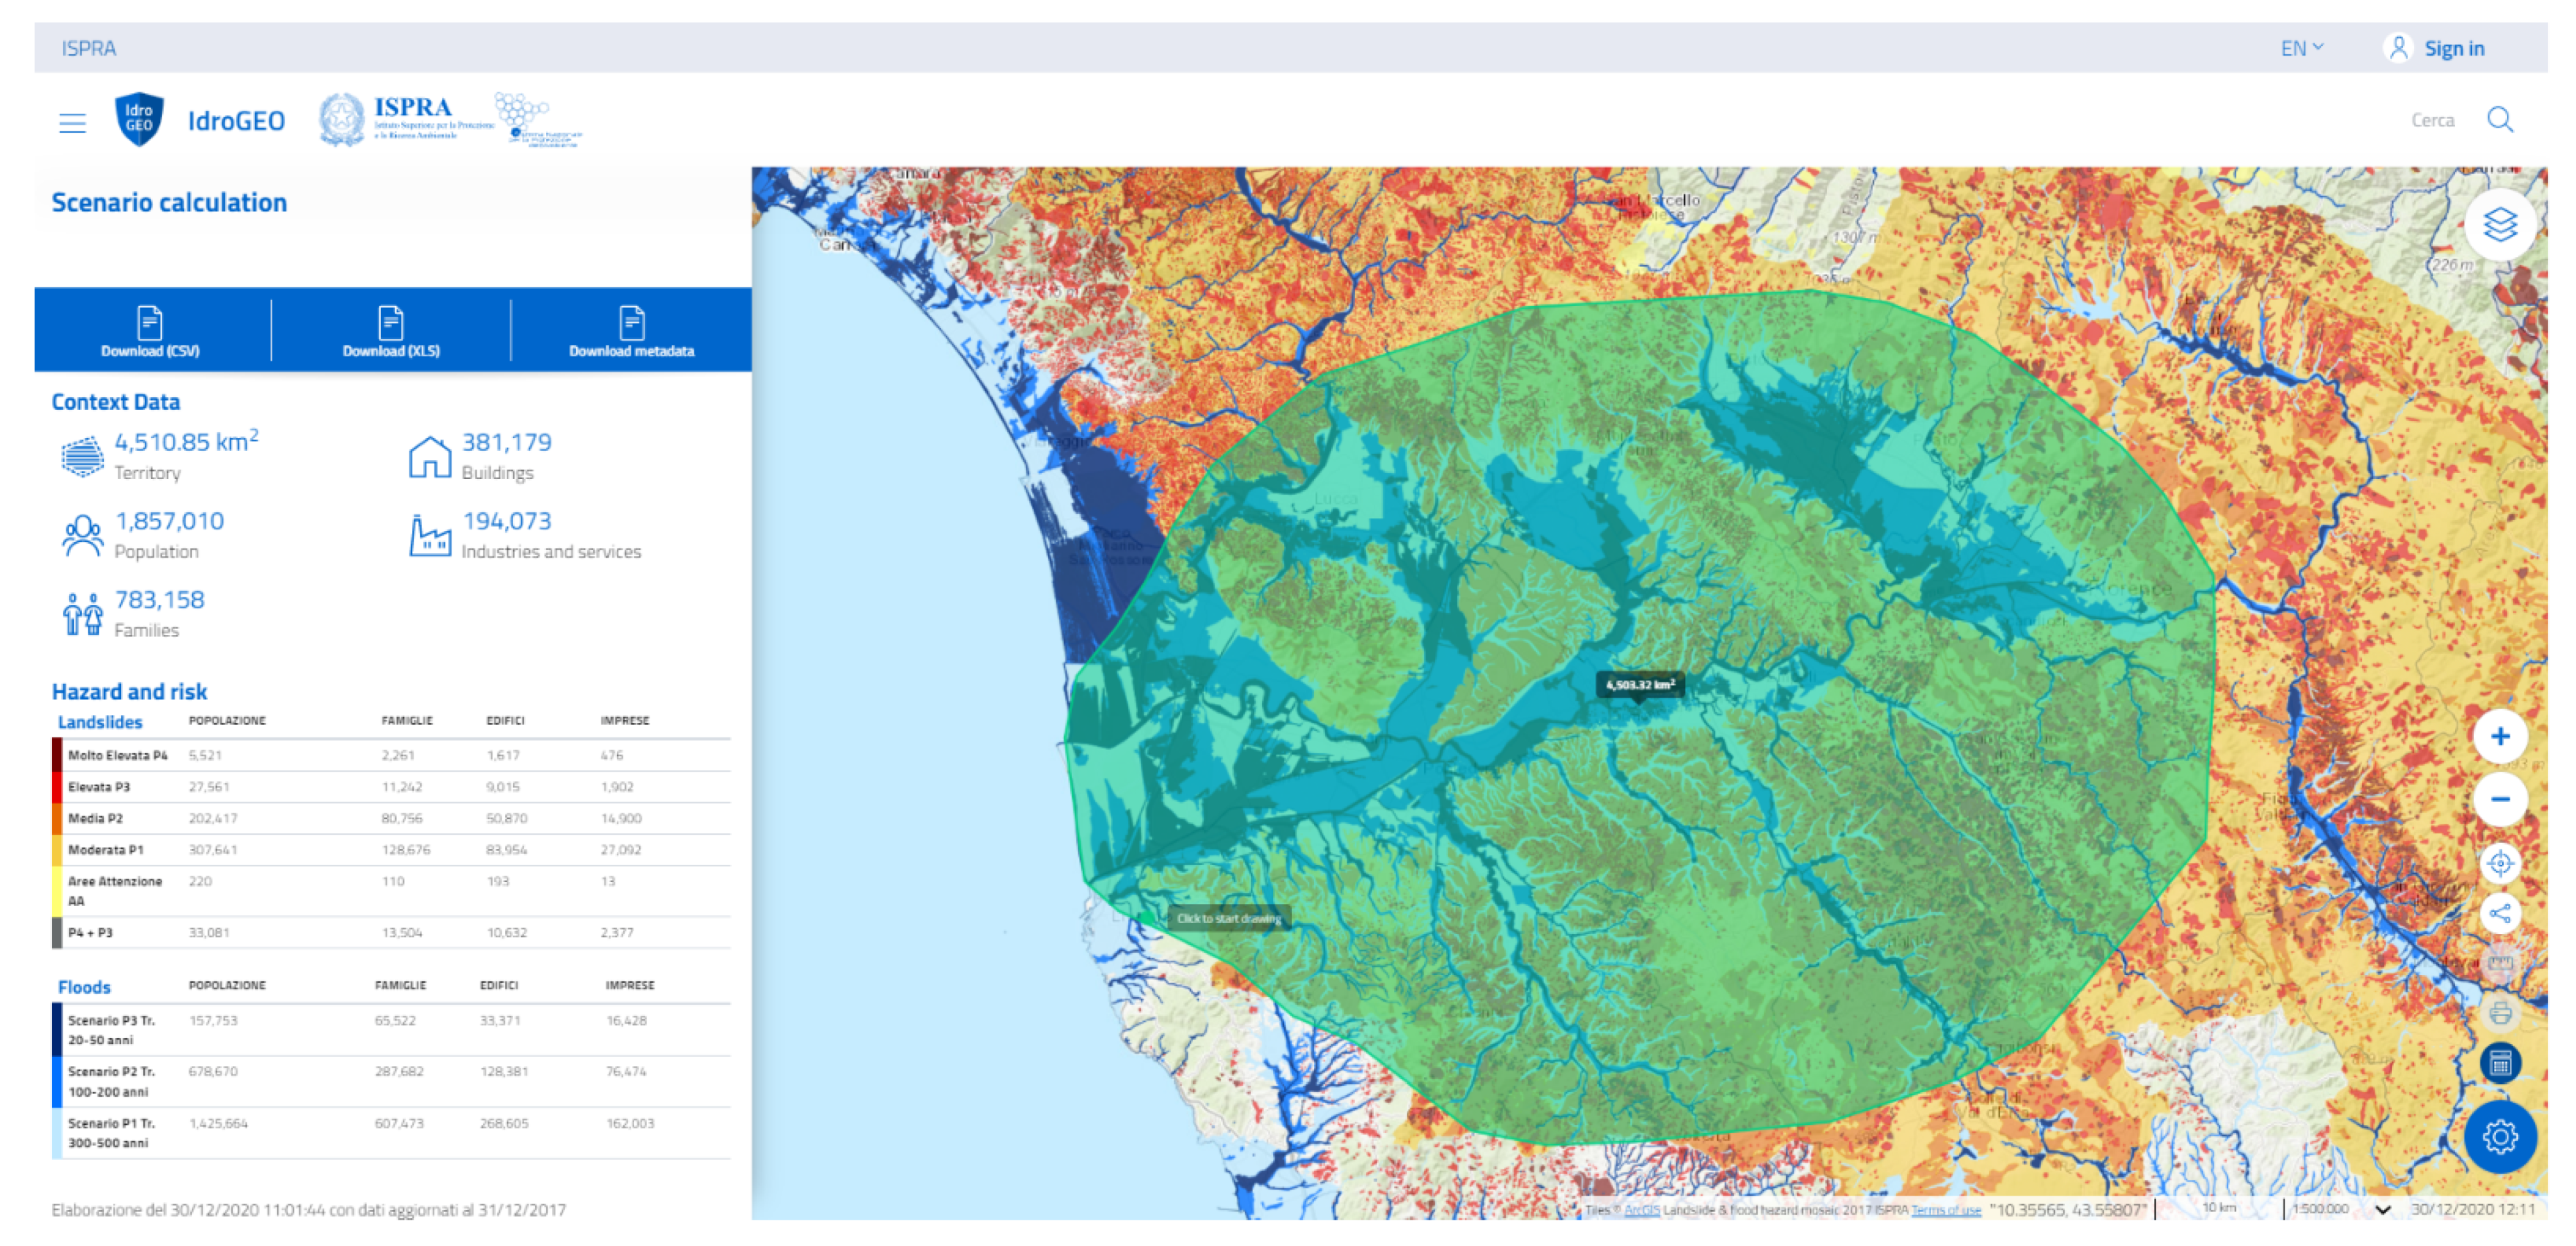
- Print hazard and risk reportThe report contains the map automatically sized as currently displayed on screen, the contextual and hazard data for landslides, floods, and risk related to the population, families, buildings, companies and services, and cultural heritages.
- Scenario calculationThe “Scenario calculation” tool returns the estimate of the elements exposed to landslide and flood risk in a portion of the territory circumscribed as desired through a polygon drawn by the user (Figure 6).
- Landslide reportingThe reporting of a new landslide is carried out by positioning a point on the map, entering the main information, and uploading photos/videos/documents or a web link regarding the landslide.

- National mosaics of landslide and flood hazard.
- Data relating to hazard zones and risk indicators on a national, regional, provincial, and municipal basis (XLS, CSV, JSON format), with the related metadata file (CSV).
- Landslides of the IFFI inventory by Region/Autonomous Province (shapefile format; point, line, and polygon geometries).
- Dictionaries of the IFFI inventory (JSON format).
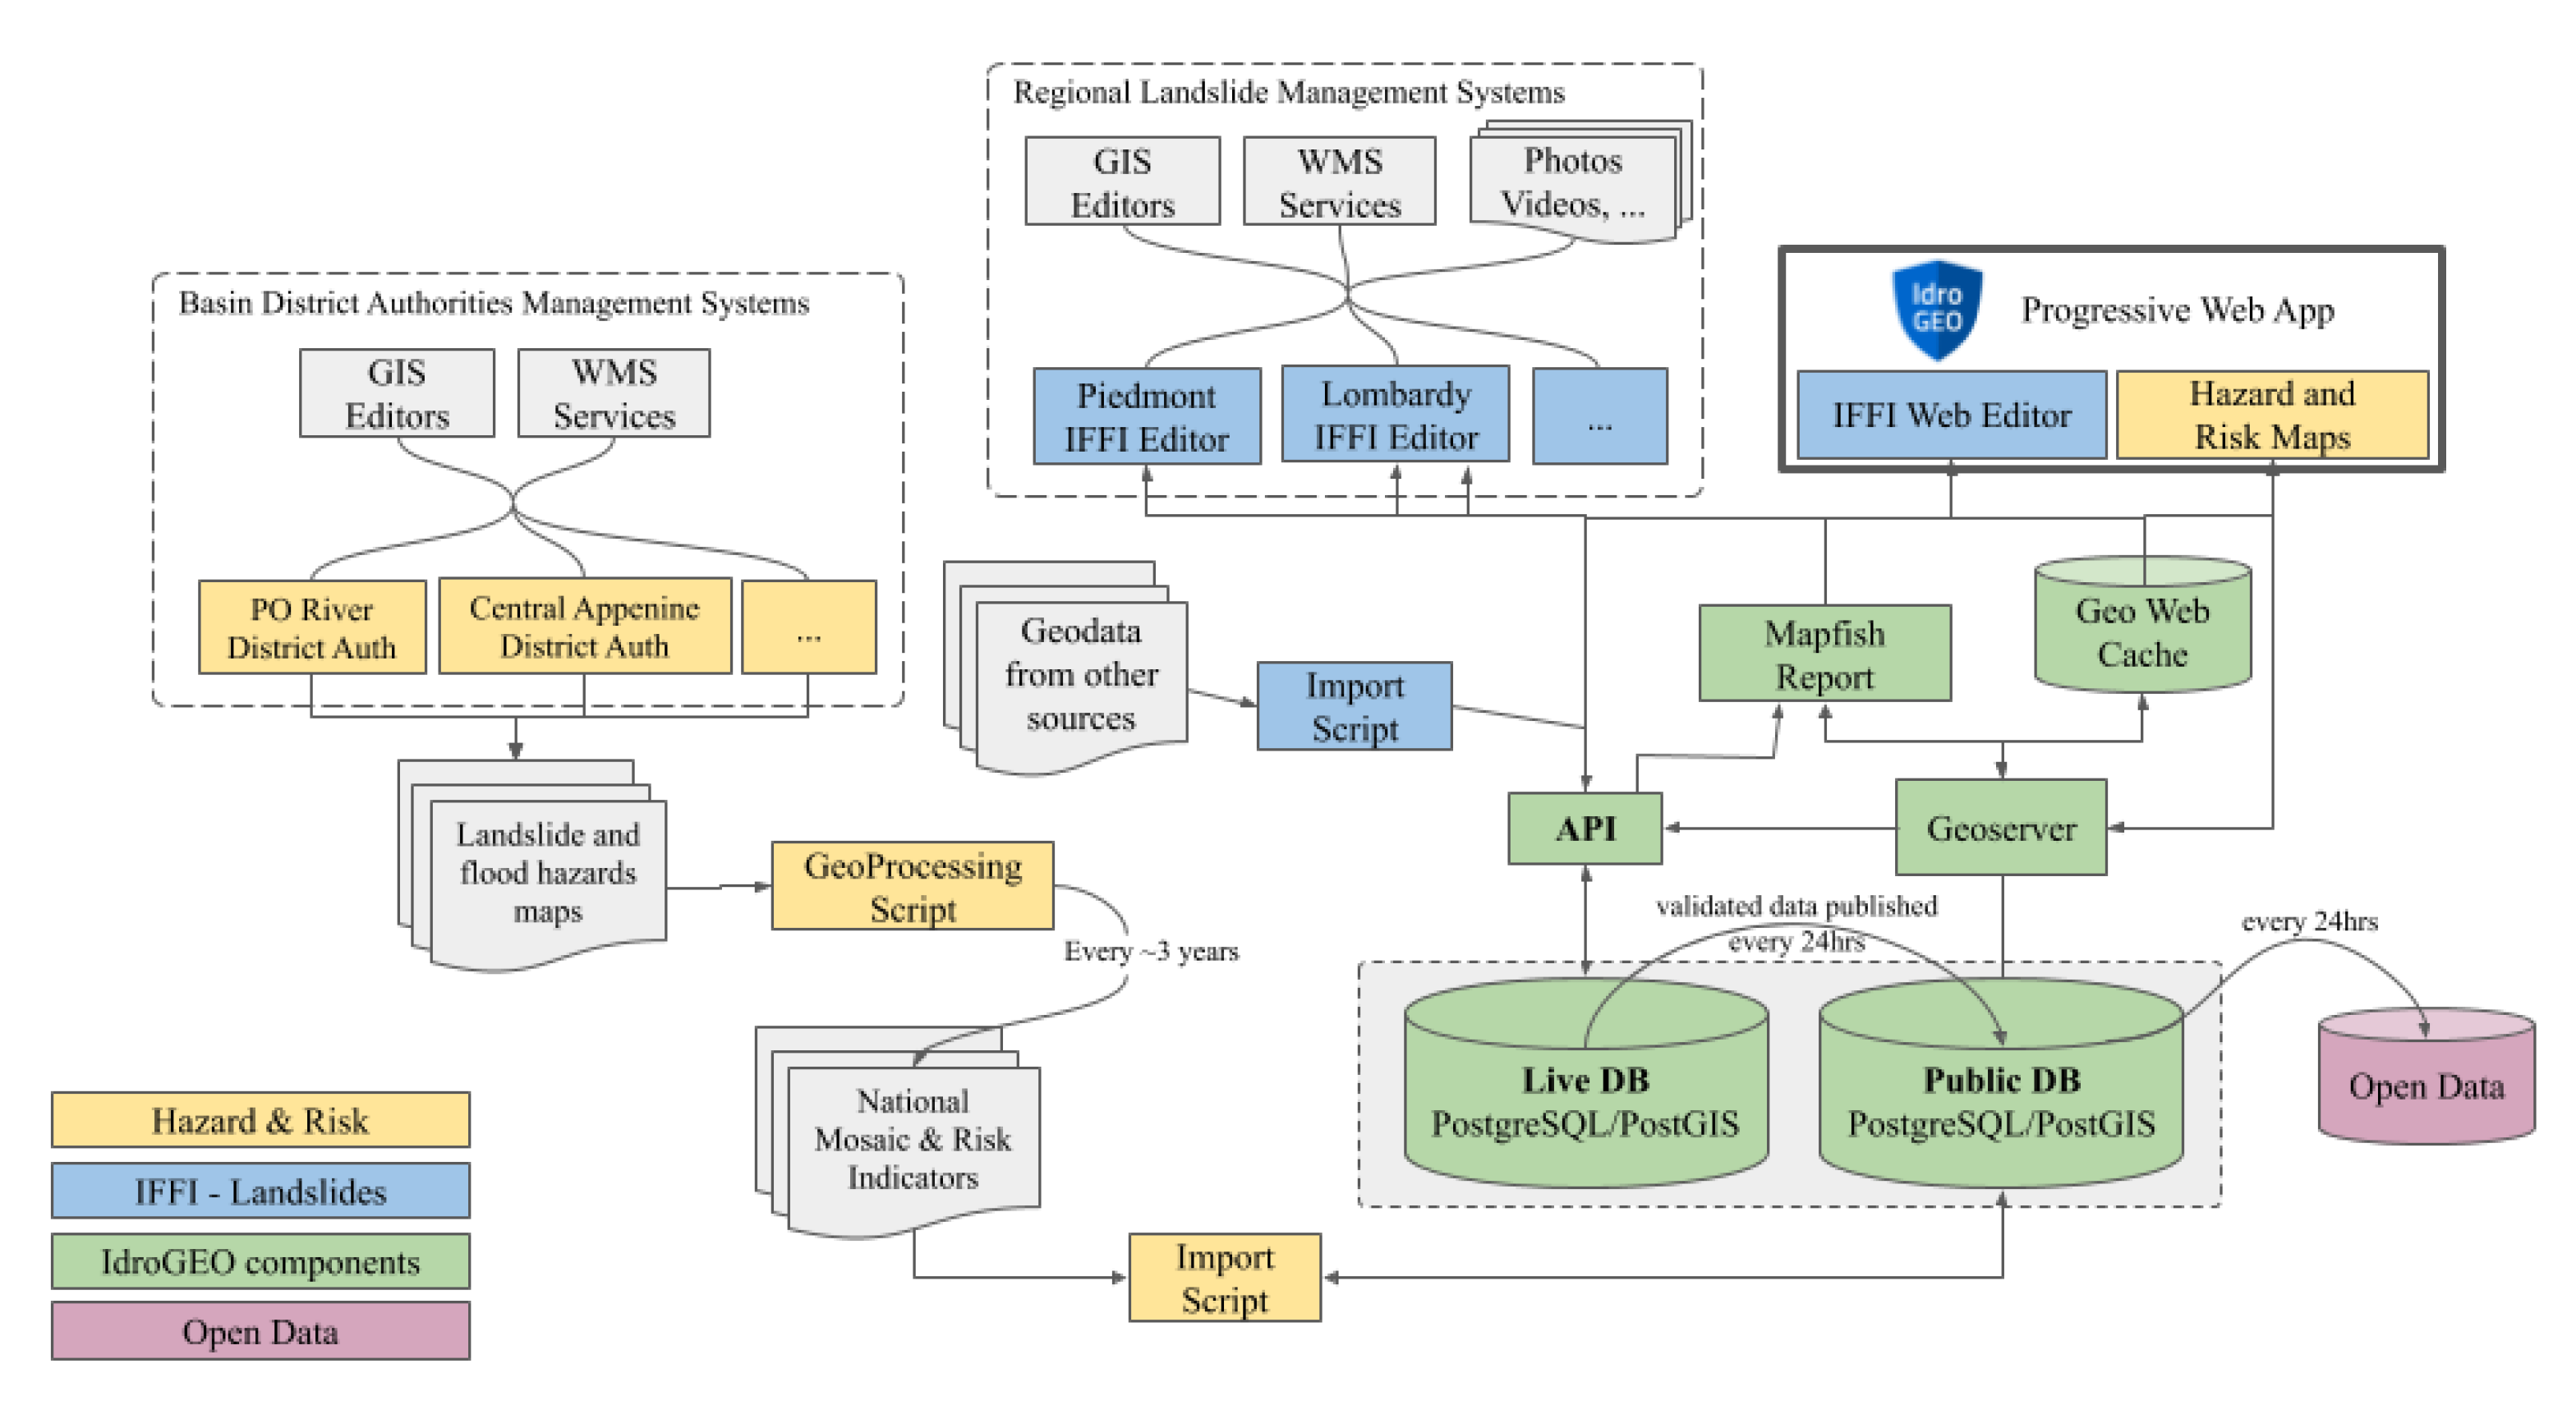
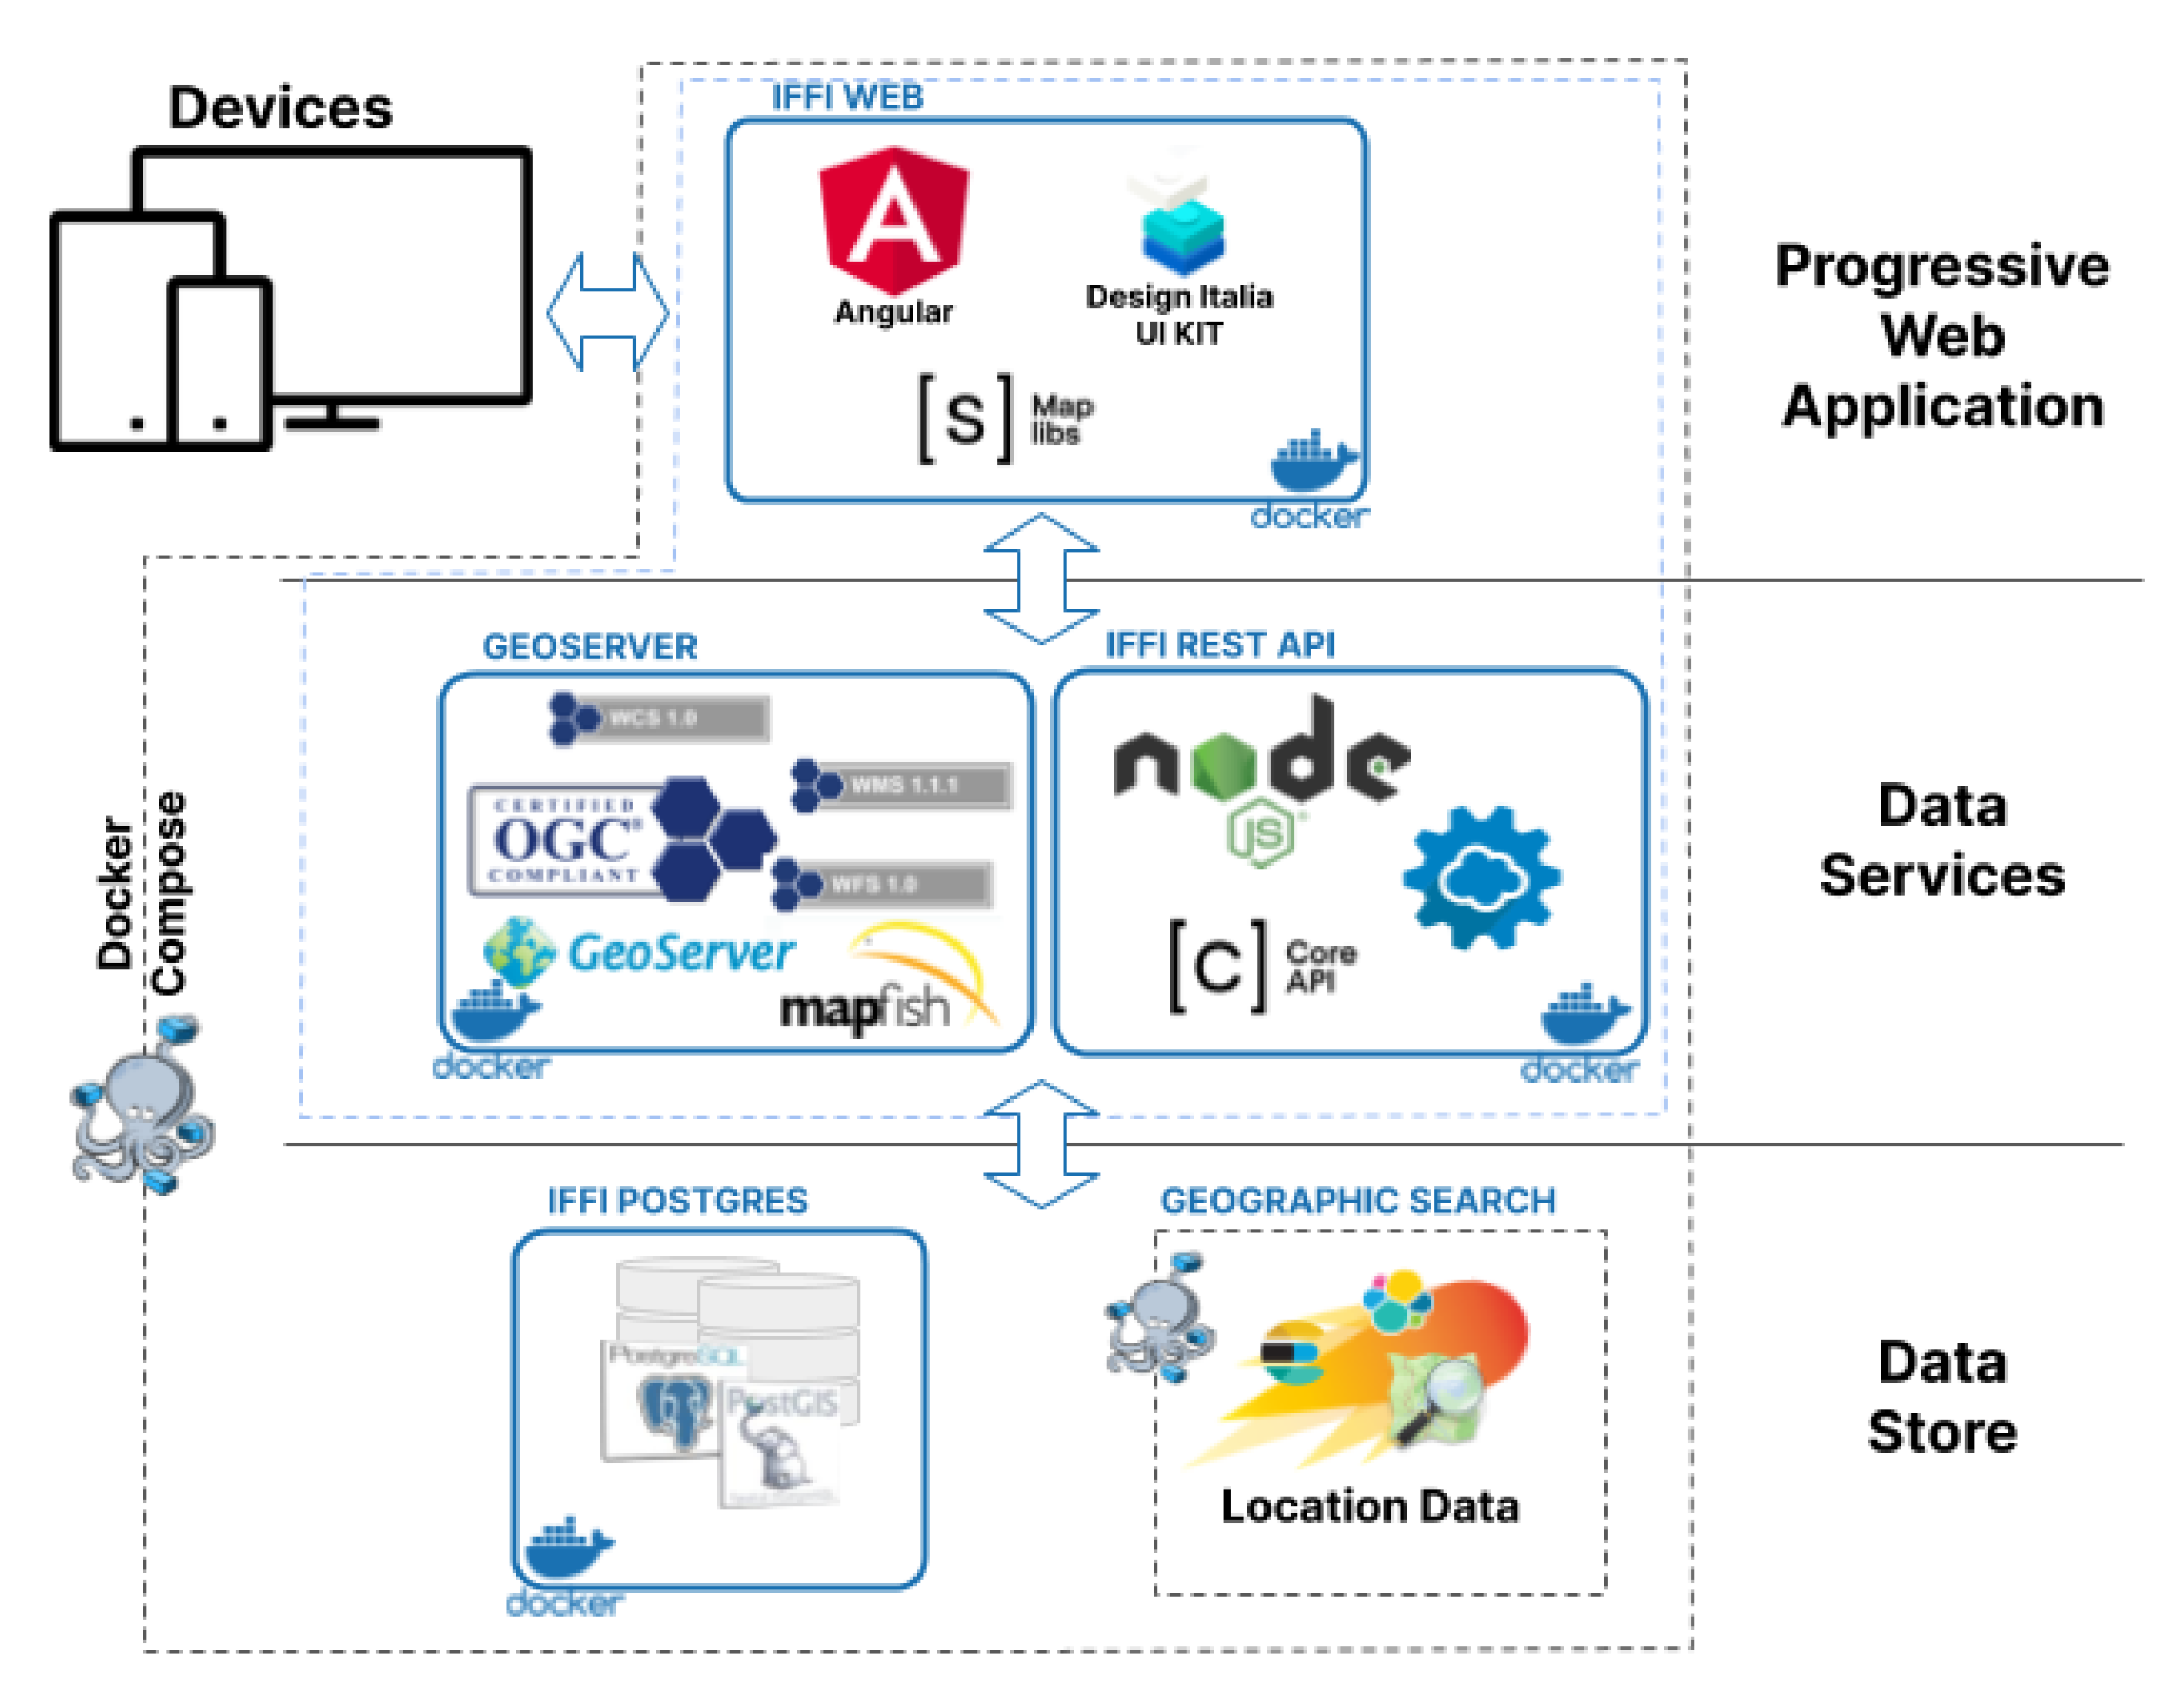
2.3. Architecture of the Platform
2.4. Use and Usability Evaluation of the IdroGEO Platform
3. Results and Discussion
3.1. Results
- The time to publish data updates online has gone from about 1 year to an average of 60 days. Before the development of the IdroGEO platform, data updates were sent via email by the regional administrations once a year and manually loaded into the national database. Using the new platform, and specifically the IFFI web editor or the API services, it is now possible to upload the information via the web and then to proceed with the validation and approval cycle, shortly after the landslide occurs.
- The integration of regional landslide management systems has begun in Lombardy Region, whose data now interoperate through the IdroGEO APIs.
3.2. Discussion
Author Contributions
Funding
Institutional Review Board Statement
Informed Consent Statement
Data Availability Statement
Acknowledgments
Conflicts of Interest
References
- Trigila, A.; Iadanza, C.; Vittori, E. The WebGIS Application of the IFFI Project (Italian Landslide Inventory). In Geophysical Research Abstracts, SRef-ID: 1607-7962/gra/EGU2007-A-09966. © European Geosciences Union. 2007. Available online: https://meetings.copernicus.org/www.cosis.net/abstracts/EGU2007/09966/EGU2007-J-09966.pdf (accessed on 30 December 2020).
- Bignami, D.F.; Dragoni, A.; Menduni, G. Assessing and Improving Flood and Landslide Community Social Awareness and Engagement via a Web Platform: The Case of Italy. Int. J. Disaster Risk Sci. 2018, 9, 530–540. [Google Scholar] [CrossRef]
- The United Nations Office For Disaster Risk Reduction—UNDRR. Sendai Framework for Disaster Risk Reduction 2015–2030; The United Nations Office For Disaster Risk Reduction: Geneva, Switzerland, 2015; Available online: https://www.preventionweb.net/publications/view/43291 (accessed on 30 December 2020).
- UN Sustainable Development Goals. Available online: https://www.un.org/sustainabledevelopment/ (accessed on 30 December 2020).
- IdroGEO Platform. Available online: https://idrogeo.isprambiente.it/ (accessed on 30 December 2020).
- Veenendaal, B.; Brovelli, M.A.; Li, S. Review of Web Mapping: Eras, Trends and Directions. ISPRS Int. J. Geo-Inf. 2017, 6, 317. [Google Scholar] [CrossRef]
- Nivala, A.M.; Brewster, S.; Sarjakoski, T.L. Usability Evaluation of Web Mapping Sites. Issue 2: Use and User Issues in Geographic Information Processing and Dissemination. Cartogr. J. 2008, 45, 129–138. [Google Scholar] [CrossRef]
- Heil, B.; Petzold, I.; Romang, H.; Hess, J. The common information platform for natural hazards in Switzerland. Nat. Hazards 2014, 70, 1673–1687. [Google Scholar] [CrossRef]
- International Organisation for Standardisation. ISO 9241–11:2018 Ergonomics of Human-System Interaction—Part 11 Usability: Definitions and Concepts; International Organisation for Standardisation: Geneva, Switzerland, 2018. [Google Scholar]
- Schörghofer, R.; Lang, S.; Wendt, L.; Riedler, B. CMaP—A Collaborative Mapping Platform for Humanitarian Organizations. J. Geogr. Inf. Sci. 2017, 2017, 207–216. [Google Scholar] [CrossRef][Green Version]
- See, L. A Review of Citizen Science and Crowdsourcing in Applications of Pluvial Flooding. Front. Earth Sci. 2019, 7, 44. [Google Scholar] [CrossRef]
- Juang, C.S.; Stanley, T.A.; Kirschbaum, D.B. Using citizen science to expand the global map of landslides: Introducing the Cooperative Open Online Landslide Repository (COOLR). PLoS ONE 2019, 14, e0218657. [Google Scholar] [CrossRef]
- Biørn-Hansen, A.; Majchrzak, T.A.; Grønli, T.M. Progressive Web Apps for the Unified Development of Mobile Applications. In Web Information Systems and Technologies; WEBIST 2017. Lecture Notes in Business Information, Processing; Majchrzak, T., Traverso, P., Krempels, K.H., Monfort, V., Eds.; Springer: Cham, Switzerland, 2017. [Google Scholar] [CrossRef]
- Progressive Web App—Google Developers. Available online: https://web.dev/progressive-web-apps/ (accessed on 20 January 2021).
- Magomadov, V.S. Exploring the role of progressive web applications in modern web development. J. Phys. Conf. Ser. 2020, 1679, 022043. [Google Scholar] [CrossRef]
- Directive (EU) 2019/1024 of the European Parliament and of the Council of 20 June 2019. Available online: https://eur-lex.europa.eu/legal-content/EN/TXT/?uri=uriserv:OJ.L_.2019.172.01.0056.01.ENG (accessed on 30 December 2020).
- European eGovernment Action Plan 2016–2020. Available online: https://ec.europa.eu/digital-single-market/en/european-egovernment-action-plan-2016-2020 (accessed on 30 December 2020).
- eGovernement Declaration. Available online: https://ec.europa.eu/digital-single-market/en/news/ministerial-declaration-egovernment-tallinn-declaration. (accessed on 22 January 2021).
- European Interoperability Framework—EIF. Available online: https://ec.europa.eu/isa2/eif_en (accessed on 20 January 2021).
- Vaccari, L.; Posada, M.; Boyd, M.; Gattwinkel, D.; Mavridis, D.; Smith, R.S.; Santoro, M.; Nativi, S.; Medjaoui, M.; Reusa, I.; et al. Application Programming Interfaces in Governments: Why, What and How; EUR 30227 EN; Publications Office of the European Union: Luxembourg, 2020; ISBN 978-92-76-18982-4. [Google Scholar] [CrossRef]
- Boyd, M.; Vaccari, L.; Posada, M.; Gattwinkel, D. An Application Programming Interface (API) Framework for Digital Government; EUR 30226 EN; Publications Office of the European Union: Luxembourg, 2020; ISBN 978-92-76-18980-0. [Google Scholar] [CrossRef]
- Williams, M. Digital Government Benchmark, API Study, Final Report; European Commission; DG Joint Research Centre: Ispra, Italy, 2018. [Google Scholar]
- Santoro, M.; Vaccari, L.; Mavridis, D.; Smith, R.S.; Posada, M.; Gattwinkel, D. Web Application Programming Interfaces (APIs): General-Purpose Standards, Terms and European Commission Initiatives; EUR 29984 EN; Publications Office of the European Union: Luxembourg, 2019; ISBN 978-92-76-13183-0. [Google Scholar] [CrossRef]
- Italian Government. Three-Year Plan for Digital Transformation of the Public Administration. Available online: https://pianotriennale-ict.italia.it/en/ (accessed on 19 January 2021).
- Agency for Digital Italy (AgID). Available online: https://www.agid.gov.it/en/ (accessed on 30 December 2020).
- Agency for Digital Italy (AgID). 3 Years of AgID. Challenges, Strategies And Objectives. Available online: https://www.agid.gov.it/sites/default/files/repository_files/agid.pdf (accessed on 20 January 2021).
- International Organization for Standardization. ISO 9241-210:2019 Ergonomics of Human-System Interaction—Part 210 Human-Centred Design for Interactive Systems; International Organisation for Standardisation: Geneva, Switzerland, 2019. [Google Scholar]
- Italian Landslide Inventory—IFFI. Available online: https://www.progettoiffi.isprambiente.it/en/ (accessed on 30 December 2020).
- Iadanza, C.; Trigila, A. Landslides and Floods in Italy: Hazard and Risk Indicators; ISPRA: Roma, Italy, 2018. [Google Scholar]
- Trigila, A.; Iadanza, C.; Spizzichino, D. Quality assessment of the Italian Landslide Inventory using GIS processing. Landslides J. Int. Consort. Landslides 2010, 7, 455–470. [Google Scholar] [CrossRef]
- Varnes, D.J. Landslide Hazard Zonation: A Review of Principles and Practice; Commission on Landslides of the IAEG; UNESCO: Paris, France, 1984; Volume 3. [Google Scholar]
- Trigila, A.; Iadanza, C.; Esposito, C.; Scarascia Mugnozza, G. Comparison of Logistic Regression and Random Forests techniques for shallow landslide susceptibility assessment in Giampilieri (NE Sicily, Italy). Geomorphology 2015, 249, 119–136. [Google Scholar] [CrossRef]
- Hervas, J. (Ed.) Guidelines for Mapping Areas at Risk of Landslides in Europe. In Proceedings of the Experts Meeting, JRC, Ispra, Italy, 23–24 October 2007; JRC Report EUR 23093 EN; Office for Official Publication of the European Communities: Luxembourg, 2007. [Google Scholar]
- Corominas, J.; van Westen, C.; Frattini, P.; Cascini, L.; Malet, J.; Fotopoulou, S.; Catani, F.; Van Den Eeckhaut, M.; Mavrouli, O.; Agliardi, F.; et al. Recommendations for the quantitative analysis of landslide risk. Bull. Eng. Geol. Environ. 2014, 73, 209–263. [Google Scholar] [CrossRef]
- Directive 2007/60/EC of the European Parliament and of the Council of 23 October 2007. Available online: https://eur-lex.europa.eu/legal-content/EN/TXT/?uri=CELEX:32007L0060 (accessed on 30 December 2020).
- Trigila, A.; Iadanza, C.; Munafò, M.; Marinosci, I. Population Exposed to Landslide and Flood Risk in Italy. In Engineering Geology for Society and Territory; Lollino, G., Manconi, A., Guzzetti, F., Culshaw, M., Bobrowsky, P., Luino, F., Eds.; Springer: Berlin/Heidelberg, Germany, 2015; Volume 5, pp. 843–848. [Google Scholar]
- Guzzetti, F. Landslide Hazard and Risk Assessment. Ph.D. Thesis, Mathematisch-Naturwissenschaftlichen Fakultät der Rheinischen Friedrich-Wilhelms-Universität University of Bonn, Bonn, Germany, 2006. [Google Scholar]
- Kang, L.; Wang, Q.; Yan, H.W. Building extraction based on OpenStreetMap tags and very high spatial resolution image in urban area. Int. Arch. Photogramm. Remote Sens. Spatial Inf. Sci. 2018, XLII-3, 715–718. [Google Scholar] [CrossRef]
- De Medeiros, G.F.B.; Degrossi, L.C.; Holanda, M. QualiOSM: Improving Data Quality in the Collaborative Mapping Tool OpenStreetMap. In Proceedings of the XXI Brazilian Symposium on Geoinformatics GEOINFO, São José dos Campos, Brazil, 30 November–3 December 2020; pp. 10–21. [Google Scholar]
- JSONB. Available online: https://www.postgresql.org/docs/9.5/functions-json.html (accessed on 21 January 2021).
- PostGIS Extension to Add Support for Geographic Objects. Available online: https://postgis.net/ (accessed on 19 January 2021).
- PostgreSQL—Open-Source Relational Database Management System. Available online: https://www.postgresql.org/ (accessed on 20 January 2021).
- WKT. Well-Known Text Representation of Coordinate Reference Systems. Available online: https://www.ogc.org/standards/wkt-crs (accessed on 21 January 2021).
- Open Geospatial Consortium—OGC. OpenGIS® Implementation Standard for Geographic Information—Simple Feature Access—Part 1: Common Architecture; Open Geospatial Consortium, Inc.: Wayland, MA, USA, 2011. [Google Scholar]
- Open Geospatial Consortium—OGC. Available online: https://www.ogc.org/ (accessed on 19 January 2021).
- Wagner, A.; Bonduel, M.; Pauwels, P.; Uwe, R. Representing construction-related geometry in a semantic web context: A review of approaches. Autom. Constr. 2020, 115, 103130. [Google Scholar] [CrossRef]
- GeoJSON Format. Available online: https://geojson.org/ (accessed on 20 January 2021).
- OpenLayers—Map Management Library. Available online: https://openlayers.org/ (accessed on 30 December 2020).
- Offutt, J. Quality attributes of Web software applications. IEEE Softw. 2002, 19, 25–32. [Google Scholar] [CrossRef]
- Fernandez, A.; Insfran, E.; Abrahão, S. Usability evaluation methods for the web: A systematic mapping study. Inf. Softw. Technol. 2011, 53, 789–817. [Google Scholar] [CrossRef]
- Tandel, S.S.; Jamadar, A. Impact of Progressive Web Apps on Web App Development. Int. J. Innov. Res. Sci. 2018, 7, 9439–9444. [Google Scholar]
- Designers Italia The Design System for the Italian Public Administration. Available online: https://developers.italia.it/en/designers/#ui-kit (accessed on 20 January 2021).
- Angular—Javascript Framework for the Creation of Dynamic Web Applications. Available online: https://angular.io/ (accessed on 30 December 2020).
- Bootstrap Italia. Available online: https://italia.github.io/bootstrap-italia/ (accessed on 30 December 2020).
- Italian Government Digital Transformation Team. Available online: https://teamdigitale.governo.it/en/ (accessed on 20 January 2021).
- Bootstrap—HTLM/CSS Framework and Components for Responsive Web-Applications. Available online: https://getbootstrap.com/ (accessed on 20 January 2021).
- Nominatim—Open-Source Geocoding with OpenStreetMap Data. Available online: https://nominatim.org/ (accessed on 20 January 2021).
- Fielding, J. Beginning Responsive Web Design with HTML5 and CSS3; Apress: Berkeley, CA, USA, 2014. [Google Scholar] [CrossRef]
- Cardoso, M.; Guimarães, T.; Portela, C.F.; Santos, M.F. Data Extraction and Exploration Tools for Business Intelligence. In Fourth International Congress on Information and Communication Technology; Advances in Intelligent Systems and Computing; Yang, X.S., Sherratt, S., Dey, N., Joshi, A., Eds.; Springer: Singapore, 2020. [Google Scholar] [CrossRef]
- Express—Web Framework for Node.js. Available online: https://expressjs.com/ (accessed on 20 January 2021).
- Node.js— the JavaScript Runtime Environment. Available online: https://nodejs.org/en/ (accessed on 20 January 2021).
- GeoServer—Open Source Server for Sharing Geospatial Data. Available online: http://geoserver.org/ (accessed on 20 January 2021).
- Fielding, R.T. Architectural Styles and the Design of Network-based Software Architectures. Ph.D. Thesis, University of California, Irvine, CA, USA, 2000. Chapter 5 Representational State Transfer (REST). Available online: https://www.ics.uci.edu/~fielding/pubs/dissertation/rest_arch_style.htm (accessed on 20 January 2021).
- Kulkarni, C.M.; Takalikar, M.S. Analysis of REST API Implementation. Int. J. Sci. Res. Comput. Sci. 2018, 3, 2456–3307. [Google Scholar]
- OpenApi/Swagger. Available online: https://swagger.io/ (accessed on 30 December 2020).
- Mapfish Print—Library that Allows Printing Maps as PDFs. Available online: http://www.mapfish.org/doc/print/ (accessed on 20 January 2021).
- Docker. Available online: https://www.docker.com/products/container-runtime (accessed on 20 January 2021).
- Kubernetes. Available online: https://kubernetes.io/ (accessed on 20 January 2021).
- Swarm. Available online: https://docs.docker.com/engine/swarm/ (accessed on 20 January 2021).
- GitLab Continuous Integration & Continuous Delivery Platform. Available online: https://about.gitlab.com/stages-devops-lifecycle/continuous-integration/ (accessed on 20 January 2021).
- Anderson, J.; Sarkar, D.; Palen, L. Corporate Editors in the Evolving Landscape of OpenStreetMap. ISPRS Int. J. Geo-Inf. 2019, 8, 232. [Google Scholar] [CrossRef]
- Ricca, F.; Scanniello, G.; Torchiano, M.; Reggio, G.; Astesiano, E. On the effort of augmenting use cases with screen mockups: Results from a preliminary empirical study. In Proceedings of the International Symposium on Empirical Software Engineering and Measurement, ESEM 2010, Bolzano/Bozen, Italy, 16–17 September 2010. [Google Scholar] [CrossRef]
- Olyazadeh, R.; Sudmeier-Rieux, K.; Jaboyedoff, M.; Derron, M.H.; Devkota, S. An Offline-Online WebGIS Android Application for Fast Data Acquisition of Landslide Hazard and Risk. Nat. Hazards Earth Syst. Sci. Discuss. 2016. [Google Scholar] [CrossRef]
- van Westen, C.J.; van Asch, T.W.J.; Soeters, R. Landslide hazard and risk zonation—why is it still so difficult? Bull. Eng. Geol. Environ. 2006, 65, 167–184. [Google Scholar] [CrossRef]
- Shivakumar, S.K. Modern Web Performance Optimization. Methods, Tools, and Patterns to Speed Up Digital Platforms; Apress: Berkeley, CA, USA, 2020. [Google Scholar]
- Lighthouse. Available online: https://developers.google.com/web/tools/lighthouse/ (accessed on 30 December 2020).
- British Geological Survey—BGS. Report a Landslide. Available online: https://www2.bgs.ac.uk/reportalandslide/reportForm.html (accessed on 5 February 2021).
- Kentucky Geological Survey—KGS. Report a Landslide. Available online: https://kgs.uky.edu/kgsweb/kgsweb/landslide2.asp (accessed on 5 February 2021).
- Maine Geological Survey—MGS. Landslide Questionnaire. Available online: https://mgs-collect.site/mgs-survey/landslide_survey_view.php (accessed on 5 February 2021).
- Aye, Z.C.; Jaboyedoff, M.; Derron, M.H.; van Westen, C.J. Prototype of a Web-based Participative Decision Support Platform in Natural Hazards and Risk Management. ISPRS Int. J. Geo-Inf. 2015, 4, 1201–1224. [Google Scholar] [CrossRef]
- GitLab—IdroGEO. Available online: https://gitlab.com/isprambiente/idrogeo (accessed on 30 December 2020).


| Data Category Name | Description |
|---|---|
| General | Landslide general information and geographical context |
| Classification | Type of movement, velocity, materials, and water content |
| Activity | State of activity, date of observation |
| Method | Methods used for landslide data acquisition |
| Dating | Certain/uncertain date of occurrence and source of information |
| Activations | List of registered events |
| Damage | Damage to people, buildings, infrastructure, etc. |
| Risk | Elements exposed to risk |
| Geometry | Landslide geometry: crown and toe elevation, length, area, volume, depth of surface of rupture, slope angle, etc. |
| Landslide position, slope aspect and land use | Crown and toe position on the slope, slope aspect, and land use |
| Geology | Geologic units, lithology, geotechnical properties, etc. |
| Hydrogeology | Surface water, springs, groundwater |
| Causes | Contributing and triggering factors |
| Precursory signs | List of precursory signs |
| Reports, investigation and monitoring | Studies, investigations, and monitoring systems |
| Remedial measures | Remedial works and mitigation measures |
| Documentation | References, National Legislation or Civil Protection Acts |
| Multimedia | Photo, video, and documentation attachments |
| Revisions | History of all the edit revisions and versioning |
| Service Type | Provider Name | Description |
|---|---|---|
| REST API | ISPRA IdroGEO API | Are the core application services providing authentication and authorization to the application data, controlled vocabularies, functions, and processes |
| REST API | OSM Nominatim | Nominatim is a search engine for OpenStreetMap data and used as a geocoder for common places in Italy |
| REST API | Wordpress CMS | Wordpress REST API v2 is used as a headless CMS for the static content of the IdroGEO platform |
| REST API | gravatar.com | Used to associate the user profile image as configured and stored on the Wordpress Gravatar site |
| MapBox Vector Tiles | ISPRA IdroGEO WebCache | Used to serve the following data to the IdroGEO frontend: 1. IFFI Landslide map geometries and related key public data 2. Landslide Reports 3. Landslide Events 4. ISTAT administrative boundaries (Country, Macro-regions, Regions, Provinces, Municipalities, and Sub-Municipal) |
| OGC WMS Service | ISPRA IdroGEO GeoServer | Used to serve several IdroGEO maps and provide access to the related public data. This includes the following maps: 1. Combined national Mosaic of landslide and flood hazard zones 2. Risk indicators at local administrative units (municipality level) 3. Landslide risk density grids (1 km and 500 m) |
| OGC WMS Service | ISPRA ReNDiS GeoServer | Used to overlay in the map the geospatial location and the details on remedial works of the Italian Repertory of mitigation measures (ReNDiS) |
| OGC WMS Service | MiBACT—ISCR | Used to overlay in the map the geospatial location and data on Cultural Heritage in Italy (VIR) |
| OGC WMTS Service | Department of Civil Protection | 3 h cumulative rainfall (interpolation by the Department of Civil Protection) |
| OGC WMTS Service | Department of Civil Protection | 24 h cumulative rainfall (interpolation by the Department of Civil Protection) |
| Tile Map Services | OSM | OSM Tile Map Services used to render OpenStreetMap base maps |
| Tile Map Services | ESRI | ESRI Tile Map Services used to render the ArcGIS World Topo Map base maps |
| Tile Map Services | Microsoft | Microsoft Tile Map Services used to render Bing satellite base maps |
Publisher’s Note: MDPI stays neutral with regard to jurisdictional claims in published maps and institutional affiliations. |
© 2021 by the authors. Licensee MDPI, Basel, Switzerland. This article is an open access article distributed under the terms and conditions of the Creative Commons Attribution (CC BY) license (http://creativecommons.org/licenses/by/4.0/).
Share and Cite
Iadanza, C.; Trigila, A.; Starace, P.; Dragoni, A.; Biondo, T.; Roccisano, M. IdroGEO: A Collaborative Web Mapping Application Based on REST API Services and Open Data on Landslides and Floods in Italy. ISPRS Int. J. Geo-Inf. 2021, 10, 89. https://doi.org/10.3390/ijgi10020089
Iadanza C, Trigila A, Starace P, Dragoni A, Biondo T, Roccisano M. IdroGEO: A Collaborative Web Mapping Application Based on REST API Services and Open Data on Landslides and Floods in Italy. ISPRS International Journal of Geo-Information. 2021; 10(2):89. https://doi.org/10.3390/ijgi10020089
Chicago/Turabian StyleIadanza, Carla, Alessandro Trigila, Paolo Starace, Alessio Dragoni, Tommaso Biondo, and Marco Roccisano. 2021. "IdroGEO: A Collaborative Web Mapping Application Based on REST API Services and Open Data on Landslides and Floods in Italy" ISPRS International Journal of Geo-Information 10, no. 2: 89. https://doi.org/10.3390/ijgi10020089
APA StyleIadanza, C., Trigila, A., Starace, P., Dragoni, A., Biondo, T., & Roccisano, M. (2021). IdroGEO: A Collaborative Web Mapping Application Based on REST API Services and Open Data on Landslides and Floods in Italy. ISPRS International Journal of Geo-Information, 10(2), 89. https://doi.org/10.3390/ijgi10020089